
The Member Secretary, Odisha State Pollution Control Board ...
10
The Member Secretary, Odisha State Pollution Control Board, A/118, Nilakanthanagar, Unit-VIII, Bhubaneswar – 751 012, Odisha. TSK/Env/C-05/ 84 /2020 Sept 28, 2020. Dear Sir, Sub: Environmental Statement for the Year 2019-20 for 6 MTPA Steel Plant at Kalinganagar Industrial Complex, Tata Steel Limited. We are enclosing the “Environmental Statement” duly filled in Form V, for the year 2019-2020 for 6 MTPA Steel Plant at Kalinganagar Industrial Complex by Tata Steel for your kind considerations. Due to the prevailing COVID 19 situation, we are submitting the Environmental Statement through e-mail and request you to kindly accept the same. We trust that you will find the above in order. Thanking you and assuring you of our best attention. Yours faithfully, For Tata Steel Limited Head, Environment Tata Steel Kalinganagar. Encl: a/a. Copy to: Regional Officer, OSPCB, KNIC
Transcript of The Member Secretary, Odisha State Pollution Control Board ...
The Member Secretary, Odisha State Pollution Control Board, A/118, Nilakanthanagar, Unit-VIII, Bhubaneswar – 751 012, Odisha.
TSK/Env/C-05/ 84 /2020
Sept 28, 2020. Dear Sir, Sub: Environmental Statement for the Year 2019-20 for 6 MTPA Steel Plant
at Kalinganagar Industrial Complex, Tata Steel Limited. We are enclosing the “Environmental Statement” duly filled in Form V, for the year
2019-2020 for 6 MTPA Steel Plant at Kalinganagar Industrial Complex by Tata
Steel for your kind considerations.
Due to the prevailing COVID 19 situation, we are submitting the Environmental
Statement through e-mail and request you to kindly accept the same.
We trust that you will find the above in order.
Thanking you and assuring you of our best attention.
Yours faithfully, For Tata Steel Limited
Head, Environment Tata Steel Kalinganagar. Encl: a/a. Copy to: Regional Officer, OSPCB, KNIC

Page | 1
ENVIRONMENTAL STATEMENT FOR THE YEAR 2019-20
6 MTPA STEEL PLANT OF TATA STEEL AT
KLAINGANAGAR INDUSTRIAL COMPLEX, ODISHA
ENVIRONMENTAL DEPARTMENT TATA STEEL KALINGANAGAR
Kalinga Nagar Industrial Complex, Duburi- 755026, Dist- Jajpur, Odisha
Page | 2
ENVIRONMENTAL STATEMENT FORM-V (See rule 14)
Environmental Statement for the financial year 2019-20 ending with 31st March
Tata Steel Limited 6.0 MTPA Steel Plant at Kalinganagar Industrial Complex, Odisha
PART-A
i) Name and address of the owner/ occupier of the industry, operation or process
: Rajiv Kumar VP, Operations Tata Steel Limited, Block-2, General Admin office Kalinga Nagar Industrial Complex Duburi-755026 Orissa
ii) Industry Category Primary/(STC code) Secondary (STC code)
: Large Metallurgical Industry __
iii) Production Capacity : 6.0 MTPA Crude Steel
iv) Year of Establishment : 2016
v) Date of Last Environmental /Audit Report submitted
: 26.09.2019
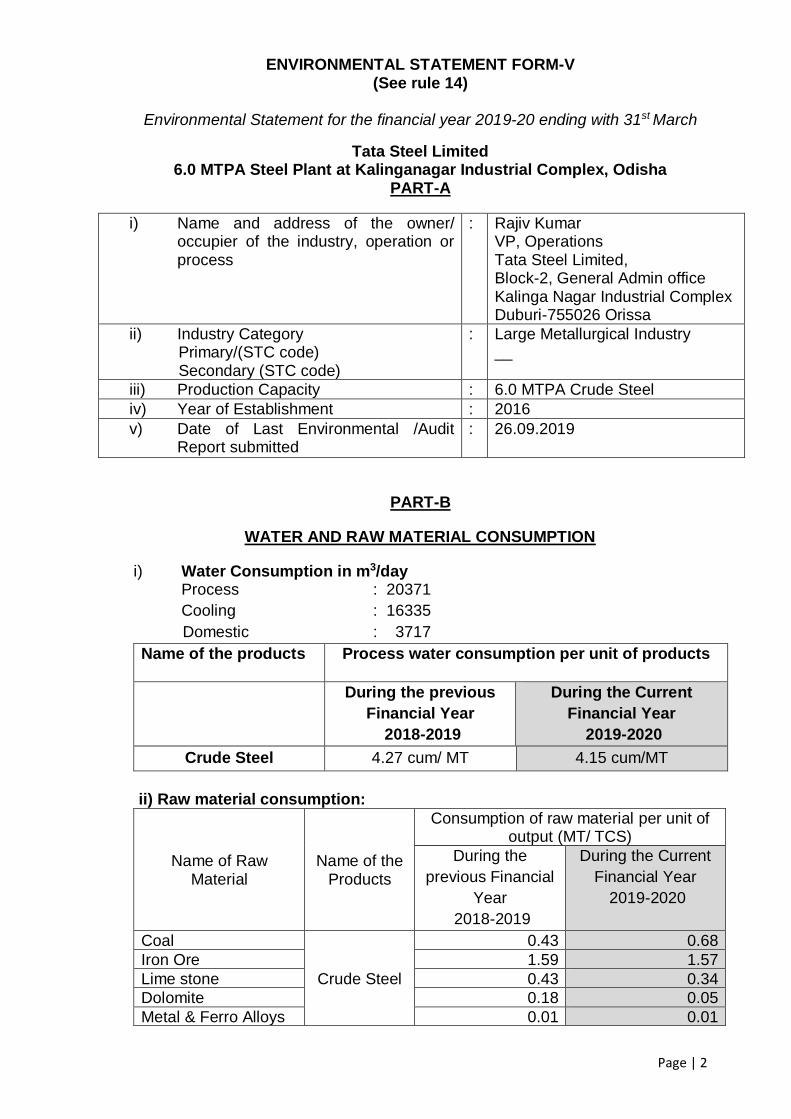
PART-B
WATER AND RAW MATERIAL CONSUMPTION
i) Water Consumption in m3/day Process : 20371
Cooling : 16335
Domestic : 3717
Name of the products Process water consumption per unit of products
During the previous
Financial Year
2018-2019
During the Current
Financial Year
2019-2020
Crude Steel 4.27 cum/ MT 4.15 cum/MT
ii) Raw material consumption:
Name of Raw Material
Name of the Products
Consumption of raw material per unit of output (MT/ TCS)
During the
previous Financial
Year
2018-2019
During the Current
Financial Year
2019-2020
Coal
Crude Steel
0.43 0.68
Iron Ore 1.59 1.57
Lime stone 0.43 0.34
Dolomite 0.18 0.05
Metal & Ferro Alloys 0.01 0.01

Page | 3
PART-C
POLLUTION DISCHARGED TO ENVIRONMENT/ UNIT OF OUTPUT
(PARAMETERS AS SPECIFIED IN THE CONSENT ISSUED)
Pollutants
Quantity of pollutants discharged (mass/day)
Concentrations of pollutants in discharges
(mass/volume)
Percentage of variation from
prescribed standards with
reasons* Kg/day mg/Nm3
a) Water No discharge of Process waste water. CETP is in operation.
b) Air
1 Coke Oven Battery No.1
PM 253.03 34.5 -31.03
2 Coke Oven Battery No. 1 De-dusting Chimney
PM 72.83 10.9 -78.23
3 Coke Oven Battery No. 2
PM 251.77 34.1 -31.83
4 Coke Oven Battery No. 2 De-dusting Chimney
PM 69.28 10.3 -79.32
5 CPP Boiler-1
PM 122.88 8.3 -83.50
SO2 522.5 35.1 -94.15
NOx 584.6 39.3 -86.92
6 CPP Boiler-2
PM 144.10 9.3 -81.40
SO2 710.18 45.8 -92.36
NOx 782.49 50.5 -83.17
7 BF Cast House-1
PM 687.67 35.4 -29.27
8 BF Cast House-2
PM 696.62 36.4 -27.13
9 BF Stock House
PM 546.71 26.5 -47.07
10 Blast Furnace Stove
PM 132.19 7.1 -85.90
11 Lime Calcination Kiln-1
PM 23.14 6.9 -95.42
12 Lime Calcination Kiln-2
PM 27.99 7.6 -94.94
13 Sinter Plant Waste gas Chimney
PM 1855.77 36.4 -27.27
14 Sinter Plant De-dusting
PM 615.24 32.2 -35.62
15 Stack attached to CDQ
PM 134.72 25.5 -49.08
SO2 343.53 64.9 -89.18
NOx 282.68 53.4 -82.19
16 Stack attached to HSM Recuperator 1
PM 56.66 8.7 -91.28
17 Stack attached to HSM Recuperator 2
PM 60.62 9.2 -90.81
18 SMS
PM 1660.68 28.7 -42.63

Page | 4
PART-D
HAZARDOUS WASTES
(AS SPECIFIED UNDER HAZARDOUS WASTES (MANAGEMENT, HANDLING AND TRANS BOUNDARY MOVEMENT RULES, 2016)
Hazardous Wastes
Total Quantity (Kg)
During the previous
Financial Year
2018-2019
During the Current
Financial Year
2019-2020
1. From Process
Sludge and filters Contaminated with Oil (Schedules-I Stream-3.3)
Nil Nil
Used or spent oil (Schedules-I Stream-5.1)
99550 54310
Wastes / Residues containing oil (Schedules-I Stream-5.2)
Nil 48230
Used grease / Greased sludge (Schedules-I Stream-5.2)
68930 41320
Oil soaked jute / cotton (Schedules-I Stream-5.2)
Approx. 8 MT by
volume
~ 10 MT (by
Volume)
Acid from used Batteries (Schedules-I Stream-9.3)
Nil Nil
Acid & Alkaline residues, spent acid and Alkali (Schedules-I Stream-12.1 & 12.2)
Nil Nil
Coal Tar sludge (Schedules-I Stream-13.4)
213000 206000
Tar tank, Storage sludge / residues (Schedules-I Stream-13.5)
Nil Nil
CO gas pipe line waste & residue from CO gas tap (Schedules-I Stream-13.6)
Nil Nil
Cleaning solvent sludge (Schedules-I Stream-20.4)
Nil Nil
Empty containers of hazardous chemical (Schedules-I Stream-33.1)
#787 Nos. # 675 Nos
Exhaust air or gas cleaning residue (Schedules-I Stream-35.1)
Nil Nil
Spent lon exchange resins (Schedules-I Stream-35.2)
Nil Nil
2.From Pollution control facilities
sludge from waste water treatment (Schedules-I Stream-35.3)
316590 176940
Oil and grease skimming residue Schedules-I Stream-35.4
Nil Nil
Waste cartridge from CETP, WWTP Schedules-I Stream-36.2
Nil Nil
Evaporation residue from CETP (Schedules-I Stream-37.3)
Nil Nil
# Containers of oil/ grease - were used for storage of same material and the hazardous wastes (used oil/used grease/ waste oil etc.) were sold to authorised recyclers along with the containers.
Page | 5
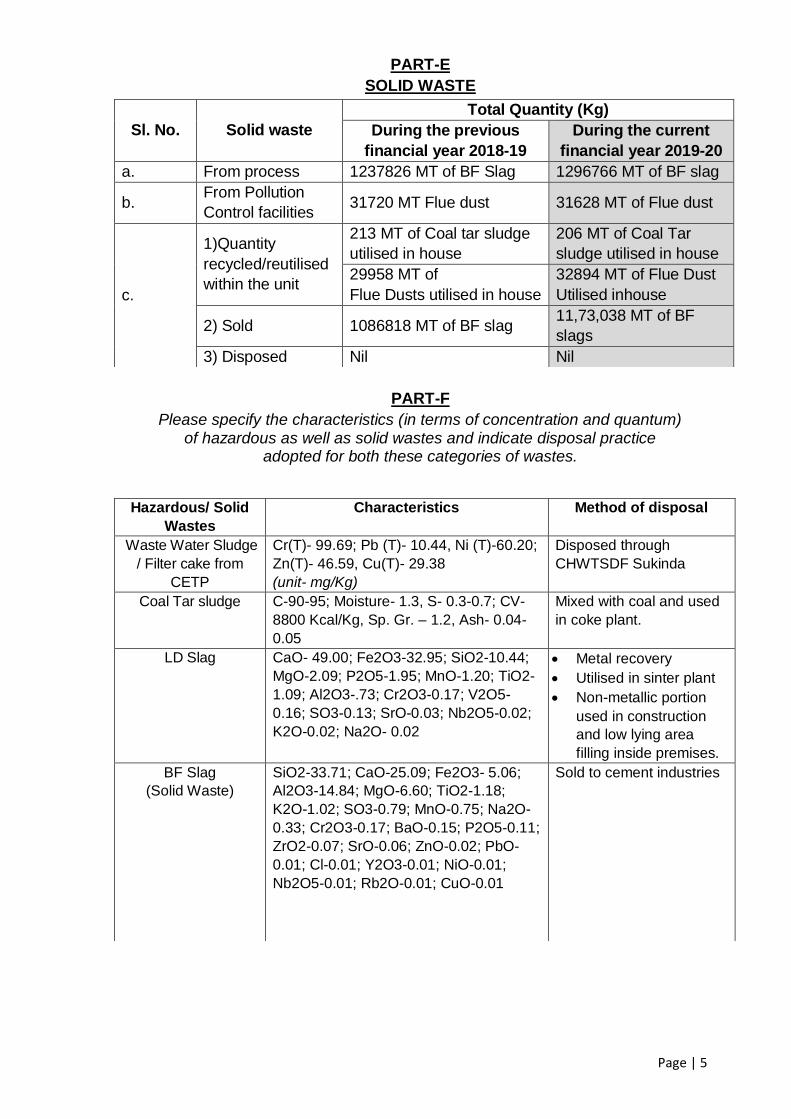
PART-E
SOLID WASTE
PART-F
Please specify the characteristics (in terms of concentration and quantum) of hazardous as well as solid wastes and indicate disposal practice
adopted for both these categories of wastes.
Sl. No. Solid waste
Total Quantity (Kg)
During the previous
financial year 2018-19
During the current
financial year 2019-20
a. From process 1237826 MT of BF Slag 1296766 MT of BF slag
b. From Pollution
Control facilities 31720 MT Flue dust 31628 MT of Flue dust
c.
1)Quantity
recycled/reutilised
within the unit
213 MT of Coal tar sludge
utilised in house
206 MT of Coal Tar
sludge utilised in house
29958 MT of
Flue Dusts utilised in house
32894 MT of Flue Dust
Utilised inhouse
2) Sold 1086818 MT of BF slag 11,73,038 MT of BF
slags
3) Disposed Nil Nil
Hazardous/ Solid
Wastes
Characteristics Method of disposal
Waste Water Sludge
/ Filter cake from
CETP
Cr(T)- 99.69; Pb (T)- 10.44, Ni (T)-60.20;
Zn(T)- 46.59, Cu(T)- 29.38
(unit- mg/Kg)
Disposed through
CHWTSDF Sukinda
Coal Tar sludge C-90-95; Moisture- 1.3, S- 0.3-0.7; CV-
8800 Kcal/Kg, Sp. Gr. – 1.2, Ash- 0.04-
0.05
Mixed with coal and used
in coke plant.
LD Slag CaO- 49.00; Fe2O3-32.95; SiO2-10.44;
MgO-2.09; P2O5-1.95; MnO-1.20; TiO2-
1.09; Al2O3-.73; Cr2O3-0.17; V2O5-
0.16; SO3-0.13; SrO-0.03; Nb2O5-0.02;
K2O-0.02; Na2O- 0.02
• Metal recovery
• Utilised in sinter plant
• Non-metallic portion
used in construction
and low lying area
filling inside premises.
BF Slag
(Solid Waste)
SiO2-33.71; CaO-25.09; Fe2O3- 5.06;
Al2O3-14.84; MgO-6.60; TiO2-1.18;
K2O-1.02; SO3-0.79; MnO-0.75; Na2O-
0.33; Cr2O3-0.17; BaO-0.15; P2O5-0.11;
ZrO2-0.07; SrO-0.06; ZnO-0.02; PbO-
0.01; Cl-0.01; Y2O3-0.01; NiO-0.01;
Nb2O5-0.01; Rb2O-0.01; CuO-0.01
Sold to cement industries

Page | 6
PART-G
Impact of the pollution control measures taken on conservation of natural resources and consequently on the cost of production.
• Pollution control equipment are effective and efficiently operated at all units.
• By-product gases generated in Coke plant, Blast Furnace and Steel melting
shop are recovered and clean gas is used as fuel in power generation and
other units, thus reducing coal consumption.
• For collection of surface runs off during monsoon through different drains and
recovery of water through pumps, a reservoir of 39,000 m3 capacity has been
constructed.
• Centralised effluent treatment Plant (CETP) in operation to maximize reuse
and recovery of treated waste water from different plant units.
• 2 Nos. of Mechanised road sweeping machine are deployed to maintain
housekeeping of plant roads.
• To suppress fugitive dusts on roads and other areas, truck mounted water
tankers are used for water sprinkling.
• Tree plantation is being undertaken in & around site. Till Financial Year 2019-
20, 4.78 Lakh of trees planted in and around the site
• Investment of more than Rs. 2000 Crores has been made for pollution control
equipment and other environmental protection measures
PART-H
Additional measures/investment proposal for environmental protection including abatement of pollution.
• Environmental Laboratory facilities being upgraded.
• Investment for remote calibration system of OCEMS for gaseous pollutants
• Greenery development programme will continue in the year 2020-21.

Page | 7
PART-I
MISCELLANEOUS: Any other particulars in respect of environmental protection and abatement of
pollution.
• Tree plantation is undertaken in and around the site. Details of tree saplings planted: -
FY Plantation (Nos.) FY Plantation (Nos.)
2009-10: 792 2015-16: 78730
2010-11: 1130 2016-17: 77335
2011-12: 4800 2017-18: 100701
2012-13: 12622 2018-19: 33116
2013-14: 29888 2019-20: 103212
2014-15: 35437
Avenue plantation is being taken up at Jajpur town, Kalinganagar and Bhubaneswar
• To maintain housekeeping of plant roads, mechanised road sweeping machines
is operated.
• Regular Environmental Monitoring is carried out. Please refer to Annexure-I.
• Seven Nos. of Online AAQM stations commissioned along with Environmental
Display Board and data linkage provided for continuous display of data.
• 18 nos. of CEMS and 2 nos. of WQMS have been installed and connected to the
server of the OSPC Board.
• Consent to Operate (CTO) for integrated steel plant granted by OSPCB on
27.03.2020, which is valid till 31.03.2021.
• About 33543 Sq. meter of Garden has been developed in FY 20.
• 1.8 Lakh sq. meter of garden landscape are being maintained in & around KLNR
• In FY 2020, 100 Kgs of plastic wastes collected, segregated and disposed through
Co-processing in cement kiln of ACC, Bargarh.
• In FY 2020, Total 1116 Nos. of e- wastes were collected and deposited to
authorised e- waste collection centre of M/s Sani clean Pvt ltd., Bhubaneswar.
• In FY 2020, 15.5 Kgs of Biomedical wastes generated in plant’s First Aid centre
were segregated, collected and disposed through Authorised Biomedical waste
disposal facility of M/s Sani clean Pvt Ltd, Bhubaneswar.
---x---
Page | 8
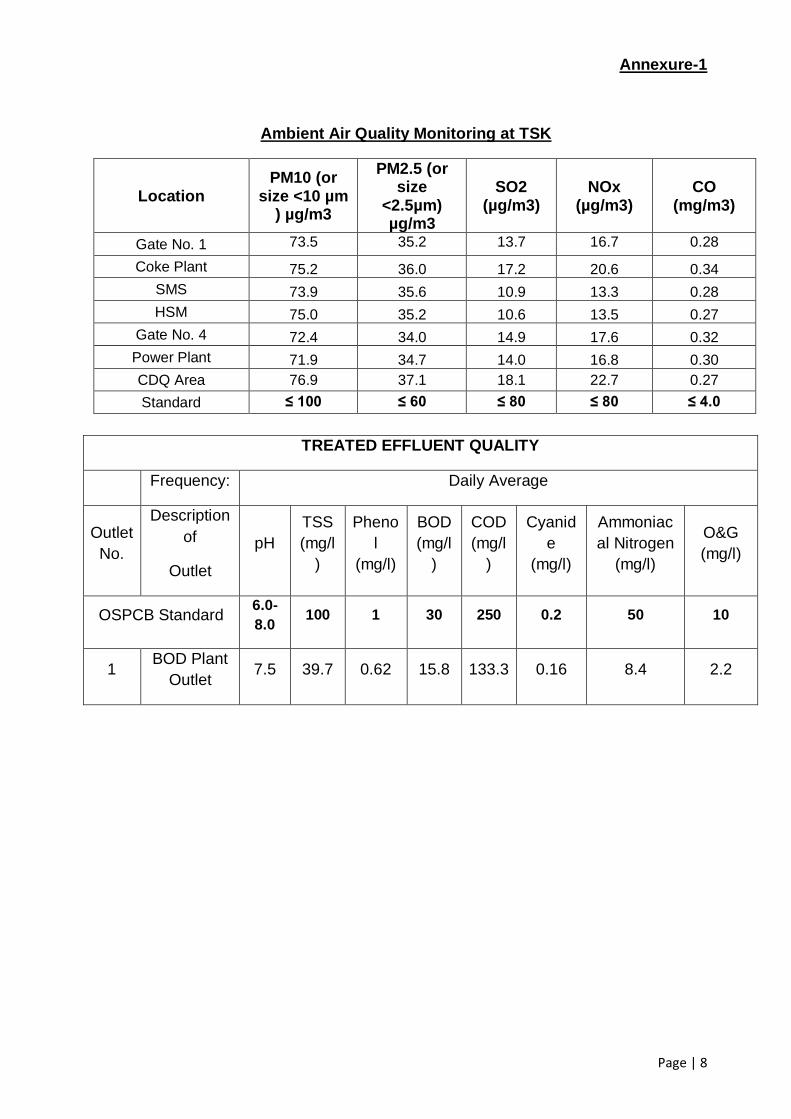
Annexure-1
Ambient Air Quality Monitoring at TSK
Location PM10 (or
size <10 µm ) µg/m3
PM2.5 (or size
<2.5µm) µg/m3
SO2 (µg/m3)
NOx (µg/m3)
CO (mg/m3)
Gate No. 1 73.5 35.2 13.7 16.7 0.28
Coke Plant 75.2 36.0 17.2 20.6 0.34
SMS 73.9 35.6 10.9 13.3 0.28
HSM 75.0 35.2 10.6 13.5 0.27
Gate No. 4 72.4 34.0 14.9 17.6 0.32
Power Plant 71.9 34.7 14.0 16.8 0.30
CDQ Area 76.9 37.1 18.1 22.7 0.27
Standard ≤ 100 ≤ 60 ≤ 80 ≤ 80 ≤ 4.0
TREATED EFFLUENT QUALITY
Frequency: Daily Average
Outlet
No.
Description
of
Outlet
pH
TSS
(mg/l
)
Pheno
l
(mg/l)
BOD
(mg/l
)
COD
(mg/l
)
Cyanid
e
(mg/l)
Ammoniac
al Nitrogen
(mg/l)
O&G
(mg/l)
OSPCB Standard 6.0-
8.0 100 1 30 250 0.2 50 10
1 BOD Plant
Outlet 7.5 39.7 0.62 15.8 133.3 0.16 8.4 2.2

Page | 9
Some Photographs of Tata Steel Kalinganagar
Vertical Garden Development at Plante ntrance Ambient Air Quality Monitoring inside Plant
Water sprinkling through Tankers
Garden development inside plant premises
Mechanised road sweeping machine Hazardous Waste collection by CHWTSDF
--X--


