The Media and Asset Prices - UCLA Anderson Home
43
1 Preliminary and Incomplete The Media and Asset Prices Alexander Dyck* Harvard Business School Luigi Zingales University of Chicago, NBER & CEPR August 1, 2003 Abstract Does media coverage affect asset prices? If so, why? And what are the consequences? In this paper we try to answer these questions by looking at the effect media reporting has on stock market reactions to earnings announcement. We find that stock prices are most reactive to the type of earnings emphasized by the press. This effect is stronger for companies with fewer analysts and when the media outlet is more credible. Interestingly, we find that media spin tends to follow the spin promoted by the company. This is more so the fewer alternative sources of information about a company are available, the more demand for information there is, and the less reputable a newspaper is. The evidence is most consistent with a quid pro quo relation between journalists and their sources, where they receive private information in exchange for a positive spin on companies’ news. * We thank Mark Bradshaw for sharing his data and seminar participants at Harvard Business School and the University of Chicago for helpful comments. We also gratefully acknowledge financial support from the Division of Research, Harvard Business School, the Center for Research on Security Prices and the George Stigler Center at the University of Chicago.
Transcript of The Media and Asset Prices - UCLA Anderson Home

1
Preliminary and Incomplete
The Media and Asset Prices
Alexander Dyck* Harvard Business School
Luigi Zingales
University of Chicago, NBER & CEPR
August 1, 2003
Abstract
Does media coverage affect asset prices? If so, why? And what are the consequences? In this paper we try to answer these questions by looking at the effect media reporting has on stock market reactions to earnings announcement. We find that stock prices are most reactive to the type of earnings emphasized by the press. This effect is stronger for companies with fewer analysts and when the media outlet is more credible. Interestingly, we find that media spin tends to follow the spin promoted by the company. This is more so the fewer alternative sources of information about a company are available, the more demand for information there is, and the less reputable a newspaper is. The evidence is most consistent with a quid pro quo relation between journalists and their sources, where they receive private information in exchange for a positive spin on companies’ news. * We thank Mark Bradshaw for sharing his data and seminar participants at Harvard Business School and the University of Chicago for helpful comments. We also gratefully acknowledge financial support from the Division of Research, Harvard Business School, the Center for Research on Security Prices and the George Stigler Center at the University of Chicago.

2
Nothing but a newspaper can drop the same thought into a thousand minds at the same moment. A newspaper is an adviser that does not require to be sought, but that comes of its own accord and talks to you briefly every day of the common weal, without distracting you from your private affairs.
De Toqueville, Democracy in America, Vol II, Section II, Chapter VI.
I. Introduction
On May 3 1998 on the front page of the Sunday edition of the New York Times
the editors chose to feature a story about the development of new cancer-cure drugs and
mentioned EntreMed, a biotech company with the licensing right to the breakthrough
(Huberman and Regev, 2001). None of the information reported in the article was new. In
fact, Huberman and Regev (2001) document that all information was in the public
domain before the publication of the article. In spite of this lack of news, the stock market
price quadrupled the following day and part of that increase appears to have been
permanent.
Is this an isolated case or does it reflect that media reporting can affect asset
prices? If the latter, why does this occur? And what are the consequences? Should we
expect the media to report in an unbiased way? If not, what is the direction of the bias
and what effect can this have on financial markets?
This paper will attempt to answer all these questions. To do so we focus on the
stock market reactions to earnings announcements. While this is certainly not the most
interesting dimension of news reporting, it is an area where we can more easily quantify
the impact of the way media report news, while controlling for the new information
revealed to the market. It is also an area where we can more easily classify the spin
chosen by the media. Media coverage is different than other information disclosure by
3
the firm in that space is at a premium and coverage is more selective. Newspaper editors
inevitably provide a spin in their coverage, choosing whether to include or exclude a
piece of news, positioning it on the first or last page, or in the first or the last paragraph.
We start by documenting that media reporting is systematically correlated with
stock price responses to earning announcements, even after controlling for the size of the
earnings surprise. To capture in a quantifiable way the spin of media coverage we focus
on whether media choose to focus on GAAP earnings or “street” earnings (alternative
earning estimates released by companies to eliminate the impact on earnings of
“extraordinary” charges, also known as pro forma earnings). We find that if newspapers
report GAAP earnings first, the stock price reaction is more sensitive to GAAP earnings
and less to street earnings, even after controlling for the actual size of the earnings
surprises. The opposite is true when newspapers report street earnings first. The
responsiveness to street earnings is accentuated if newspapers’ articles only report street
earnings, the same is true (although the effect is weaker) if newspapers only report
GAAP earnings.
These results suggest that Huberman and Regev (2001) touched upon the tip of an
iceberg. But how is it possible that newspaper articles impact asset prices? In the most
extreme version of frictionless markets it is sufficient that one trader is aware of a piece
of news for this news to be embedded in stock prices. In an internet world where
investors have at least as fast access to the same raw information as the reporter, media
coverage should not matter.
We identify several reasons why media can have a role. In the presence of limits
to arbitrage, the number (or better the wealth-weighted number) of informed people

4
matters. Even in an internet world where all the information is a ‘click of the mouse’
away, finding information might be time consuming. By including a piece of information
a newspaper editor changes the cost of information collection for thousand of readers.
Since media reporting affects the number of informed people, it can also affect the stock
prices. Even in the internet era De Toqueville’s statement remains true.
Second, media provide credibility. It is different if I read news on a random web
site or if I read it in The New York Times. Last, but not least, media provides common
knowledge. When I read news in the New York Times, not only do I learn about it, but I
learn about the fact that millions of other people learn about it. This common knowledge
may affect the stock price level (Morris and Shin , 2002).
Consistent with these hypotheses, we find that the impact of the media on asset
prices is larger when investors have fewer alternative sources of information to turn to,
which we proxy for using the number of analysts, and when the newspaper providing
coverage is more reputable, which we proxy using Wall Street Journal coverage.
Once we admit that media reporting does matter, then understanding what drives
media spin becomes a question of financial and economic interest. One view of the
media is that they provide a public good, identifying the most relevant, credible
information and presenting that information in a balanced way. In this view, there is no
bias. Another view, which we focus on in the second part of the paper, is that journalists
and newspaper owners have incentives in gathering and diffusing information that can
bias their presentation of information.
We identify three potential explanations why reporters spin may be biased . First,
we focus on what we call a quid pro quo bias. An important asset in a journalist’s

5
professional portfolio is the privileged sources of information she has access to. After all
the Watergate scandal would have never exploded if it were not for a “deep throat”
tipping Woodward and Bernstein in the right direction. As one former journalist
described the situation to us, “When I started I thought the client was the public, but I
soon learned that my client is the source.”1 To maintain access to these sources
journalists establish an implicit quid pro quo. The source repeatedly reveals valuable
information to the journalist in exchange for a positive spin on the news being revealed.
Of course, the reporter (and the newspaper) has a reputation to protect and the value of
her services will decrease with the size of the bias. In equilibrium, however, the size of
the pro-company bias will be positive.
The second explanation for positive spin, closely related to this, is that reporters
are lazy or incompetent, and thus are duped by the information that is provided to them.
This opinion is shared by the CEO of Pearson, the group owning the Financial Times, in
a recent interview to the Royal Society of Arts Journal: “Sometimes I do think that the
business press – and I include the FT in this – has not worked hard enough to ferret out
these stories”.2
The third theory focuses on biases arising from the demand side for news – what
is it that readers want to read? Prominent in the literature on bubbles and panics (e.g.
Kindleburger (1989), Galbraith (1990), Schiller(2000)), is the proposition that readers
like to read positive news about firms they own and that this leads newspapers to tilt their
coverage to putting a positive gloss on news. A version of this argument has recently
1 Jonathan West, interview with author, November 17, 2002. 2 Quoted in “City Scribblers smarting over questions of competence”, The Daily Telegraph, Friday October 11, 2002, p. 18.
6
been formalized by Mullanaithan and Shleifer (2002) in the context of political
reporting. They assume that readers are more inclined to believe articles that confirm
their priors, while they discount others. With such behavior it pays for reporters to
follow the herd.
We test predictions of these theories of media bias in our data on earnings
announcements. All of these theories have a common prediction: the bias should be
stronger during boom periods. The first two explanations also predict that the bias should
be stronger when there are fewer additional sources of information and it should be
weaker for media outlets with higher credibility.
We find that newspapers seem to be influenced by companies spin. If the press
release emphasizes street earnings, newspapers are 45 % more likely to emphasize street
earnings. If the press release reports only street earnings, the probability of a newspaper
article emphasizing street earnings goes up by 34% and the probability of an article
reporting only street earnings goes up by 43%.
This correlation does not necessarily prove the existence of a bias. Companies
might choose to emphasize the earnings measure with the greater informational content
for investors and newspapers might follow the companies’ lead because they realize this.
To test whether the correlation we find reflects some type of bias, as opposed to greater
information content, we use two predictions unique to the bias explanation. The quid-pro-
quo theory, for instance, predicts that in times when the demand for information is
higher, the bias will be more severe. Since the demand for financial information was
higher during the years of the boom, we expect the correlation between companies’ spin

7
and newspapers’ spin to be stronger during those years than afterwards. This is indeed
what we find. In 1998-99 the correlation between companies’ spin and newspapers’ spin
is 0.52, significantly greater than 0.20 we find in the period 2001-2002.
The second prediction is that the bias should be greater for companies for whom
the cost of collecting information is higher. We test this prediction using as a proxy for
the cost of finding information the number of analysts following a company: the larger
the number of analysts, the easier it is to gather alternative information. Consistent with
the quid –pro quo theory, we find that the correlation between companies’ spin and
newspapers’ spin is higher for companies with fewer analysts (0.64 versus 0.49).
While our evidence is preliminary and limited by the high cost of collecting
information on the spin in press releases and news stories, it does portray a consistent
picture. The cost of gathering information biases the media in favor of their information
sources, with this bias being stronger when the value of these sources is greater. Their
bias is not without cost, because – as we show in the first part of the paper—media
reporting affects the responsiveness of stock prices to news.
The rest of the paper proceeds as follows. Section I explains why we focus on
earnings announcements and how we implement our analysis using different measures of
earnings. Section II describes our data. Section III presents our results on the correlation
between media coverage and asset prices. Section IV discusses why media can have an
impact and presents some tests of the different hypotheses. Section V analyzes why
media reporting can be biased and tests the implications of some of the different
hypotheses of the incentives behind the production, revelation, and dissemination of

8
companies’ information, introducing the idea of a supply side bias in media coverage.
Section IV tests for this supply side bias. Conclusions follow.
I. Earnings Measures, Disclosure, and Spin
Why earning announcements?
To explore whether the EntreMed case is an isolated instance or one manifestation
of a broader phenomenon, we would like events that occur repeatedly over time where, as
with EntreMed, the information contained in the news coverage is already available to
the market, or at least we can control for the actual news in a regression.. This requires
that the news should be easily quantifiable. Finally, to explore questions of media bias,
we would like events where the spin media choose is easily quantifiable.
We think that corporate earnings announcements satisfy all these criteria. It is
clearly an event repeated over time. Furthermore, the news associated with this event is
potentially available to investors regardless of media reporting, because companies are
required (see below) to release earnings with a press wire. One unique feature of earning
announcements is that we can easily quantify the news element in it. In fact, not only can
we easily quantify the announcement, but also the unexpected component of that surprise,
by looking at the difference between the announced earnings and expected earnings.
Finally, we can easily quantify the spin, by looking at what type of earnings get
emphasized (i.e., reported first). But this requires us to explain why different types of
earnings get reported.
Earnings Measures

9
When accountants talk about earnings, they generally refer to earnings obtained
following “generally accepted accounting principles”, also known as ‘GAAP earnings’.
This standard earnings measure, however, includes some non recurrent items, which
complicate the job of forecasting future earnings. For this reason, analysts may prefer to
work with a GAAP-based measure of earnings that exclude non-recurrent charges. The
generally accepted accounting principles, limit the arbitrariness of this correction by
providing strict guidelines regarding what items can be labeled “non recurrent”: they
have to be both unusual and infrequent. Hence, even these adjusted GAAP earnings,
which we will use on our analysis, are the most reliable measure of earnings.
Analysts and companies, however, resent the rigidity of GAAP. For this reason
they have promoted alternative measures of earnings, often called ‘pro-forma’ earnings
or ‘street’ earnings. The exact definition of this measure of earnings differs by company
and industry, and importantly excludes additional items beyond the extraordinary items
and discontinued operations, often under the heading other “non-operating expenses.”3
Since GAAP does not provide a definition of these non operating expenses, this
alternative definition provides management with certain discretion, in so far as they can
convince analysts and the tracking services that the modifications are appropriate.4
The use of street earnings can be defended as an approach that is a better source
of information for predicting future firm value as a result of removing transitory items.
3 As Bradshaw and Sloan (2002) report “these exclusions include restructuring charges, write-downs and impairments, research and development expenditures, mandatory stock compensation expense, goodwill amortization and certain results of subsidiaries” but sources of revenue are not excluded. 4 I/B/E/S describes their methodology as follows: “Earning from operations means diluted earnings excluding all extraordinary items… and excluding certain non-recurring or non-operating items (but not extraordinary by accounting definition) that a majority of the contributing analysts want to exclude… There is no ‘right’ answer as to when an extraordinary charge is non-recurring or non-operating and deserves to be excluded from the earnings bases use to value the company’s stock.”

10
Alternatively (and more commonly), this approach has been condemned as a presentation
of the firm’s condition that is biased towards putting a better face on firm performance.
As early as 1973, the SEC expressed concern for such unaudited accounts5, and this view
has been reiterated strongly more recently by SEC chairman Arthur Levitt, and his chief
accountant who called such earnings EBS or Everything but Bad Stuff.6 Amazon, for
example, went so far as to exclude in its pro forma earnings not only these items but also
interest expense on long-term debt. Such concerns about biased presentation of
information led first to information advisories by the SEC: “"pro forma" financial results
aren't prepared using GAAP, and they may not convey a true and accurate picture of a
company's financial well-being. They often highlight only positive information. And
because "pro forma" information doesn't have to follow established accounting rules, it
can be very difficult to compare a company's "pro forma" financial information to prior
periods or to other companies.”7
This view is now reflected in Regulation G (passed March 28, 2003, after our
sample period) that limits the public disclosure of non-GAAP financial information and
requires a quantitative reconciliation with GAAP information in the same document.
Disclosure
Investors, in almost all cases, have access to both earnings measures, regardless of
whether the company is covered by the media. Firms are required to prepare quarterly
5 “If accounting net income computed in conformity with generally accepted accounting principles is not an accurate reflection of economic performance for a company or an industry, it is not an appropriate solution to have each company independently decide what the best measure of its performance should be and present that figure to its shareholders as Truth”.

11
earnings according to GAAP and to file these earnings with the SEC on forms 10-Q and
10-K and investors can search the SEC database for this information. In addition, the
exchanges require that firms disclose earnings information as soon as available through
press releases, a requirement reinforced by the passage and introduction of regulation FD
on October 23, 2000.8 Reportedly, 97% of firms issue a news release to the general
public via a commercial newswire as soon after the close of the quarter that financial
results are available.9
The newswires add no editorial content, merely verifying that the information
comes from the firm. Firms also often combine the press release with a conference call,
web cast, or an 8-K filing with the SEC particularly if there is a gap between the press
release and the 10-Q or 10-K filing.
Spin
In our empirical analysis we focus on whether the stock market response to the
earnings announcement is influenced by media coverage and the measure of earnings that
media choose to emphasize. Consider the following example of the news surrounding the
quarterly earnings release of October 22, 1998 of Baxter International. The company
6 See Levitt, Arthur, “The Numbers Game,” www.sec.gov/news.speeches/spch220.txt, Turner quote in, “IN THE MONEY: A Reason To Look Behind Pro Forma Earnings”By Michael Rapoport 22 November 2000 Dow Jones News Service. 7 SEC, “"Pro Forma" Financial Information: Tips for investors” available at http://www.sec.gov/investor/pubs/proforma12-4.htm 8 Exchange requirements include: Section 202.6(A) of the NYSE Listed Company Manual, NASD Rule 4320(e)(14). Regulation FD was proposed on December 20, 1999, adopted on August 10, 2000 and put into effect on Oct 23, 2000 requires public disclosure of material information and while it does not specify a method it recommends issuing of a press release. 9 Charles H. Morin, PR Newswire Association LLC, December 13, 2002. available at http://www.sec.gov/rules/proposed/s74302/chmorin1.htm#P32_4154

12
press release touts the positives of the company in the title of the press release: “Baxter
Third Quarter Sales Up 10 Percent; Net Income Rises 11 Percent; Company Generates
$160 Million in Operational Cash Flow.” Earnings of 61 cents per share are noted in the
opening paragraph. Only after reading 11 additional paragraphs of text, in an
accompanying data chart, does one discover that earnings according to GAAP produced a
loss of 43 cents per share. The Wall Street Journal has a different take with a headline,
“Baxter Registers Loss for 3rd-Period; Shares Fall 12% on ’99 Outlook.” The loss of 43
cents per share is highlighted first, in the second paragraph, with the 61 cents gain also
mentioned in the same paragraph.
To capture the extent of spin, we identify whether the story highlights the street
number or GAAP number first as well as other features such as whether the information
is presented in the headline, the number of paragraphs between the different earnings
numbers (if the story mentions more than one number). We emphasize the order of
presentation in our empirical analysis because it provides a clean measure of spin - the
reporter (either the press release or the news account) can only present one piece of
information first. When that information presents the earning measure that puts the
company in the most positive light (i.e., the number that is larger), we say that the report
put a positive spin on the companies earnings situation. Alternatively, if the first piece of
information presented puts the company in a less positive light by leading with the
number that is more negative, we say that the report has negative spin. 10
10 Of course, the order of presentation may overstate the spin, as the other numbers might be
presented in the same paragraph or even the same sentence. For this reason we also track whether the alternative earning measure is mentioned in the same paragraph or not, as well as noting whether the other number is included in the report or not.

13
II. Data
To test whether media reporting is systematically correlated with stock price
responses to earning announcements, and to control for the size of the earnings surprise,
we assembled the following data: GAAP and Street earnings, unexpected earnings (actual
earnings - earnings forecasts), stock prices, measures of news coverage,and the ‘spin’ in
the news coverage. We present variable definitions in Table 1 and Descriptive Statistics
in Table 2.
As noted above, our definition of GAAP based earnings is basic GAAP earnings
excluding extraordinary and discontinued operations (Compustat item DATA 19). We
extract this number from Compustat. Our definition of ‘street’ earnings are the earnings
numbers calculated by I/B/E/S, with the principal difference between the two being the
exclusion of“other non-operating items” from street earnings. To concentate on
earnings observations where there was a possibility for spin we required that Street
earnings exceed GAAP-based earnings by at least one cent.11
From the universe of all earnings observations that met these criteria, we
randomly identified 600 observations - 200 observations from 1998-1999, 200
observations from 2001-2002 (through 3rd quarter), and an additional 200 observations
from 1998-1999 identified in Bradshaw and Sloan (2002) and generously provided to us
by the authors who used these criteria in a part of their study of the increasing importance
of street earnings.12 As in Bradshaw and Sloan, the sample is equally distributed over the
11 In the 19,830 earnings observations from 1998-1999, and 2001-2002 (3rd quarter), in 54 percent of the cases the difference in earnings measures was less than one cent, in 28 percent of the cases street exceeded GAAP and in 18 percent of cases GAAP exceeded Street. 12 Utilizing the data assembled by Bradshaw and Sloan also faciliatates comparisons with existing studies of earnings announcements and market returns.

14
quarters in our sample period. To facilitate comparisons between the 1998-1999 sample
and the 2001-2002 sample, the 2001-2002 sample is based on observations from the same
companies in the 1998-1999 sample, and since this did not generate enough observations,
additional companies randomly drawn from the same 3 digit SIC.
After requiring that each earnings announcement have a press release, and that
announcement dates match between the I/B/E/S and Compustat sample, we arrived at our
core sample of 526 observations. As we see in Table 2, the typical street earnings are
vastly greater than the typical GAAP earnings, with a median EPS of -0.15 for GAAP
and 0.10 for Street.
To construct unexpected earnings we follow the accounting literature and base
our earnings surprise measure on the difference between the actual earnings and the
median estimate in the I/B/E/S summary file. I/B/E/S provides only one earnings
forecast which we use for both Street and GAAP earnings.13 To make these surprises
comparable across firm, we divide the difference between actual earnings and earnings
forecast by the market price 5 days before the earnings announcement. Forecasts were
available for 436 observations and prices for 492 observations, leaving us 426
observations with earnings surprises. The median street earnings surprise was 0.0,
exceeding the gaap earnings surprise of –0.02.
13 We only include earnings forecasts if they were made in the 30 days prior to the earnings announcement.

15
We gathered daily price series for these companies from CRSP and constructed
excess returns for the 5 day trading window surrounding the announcement (t-1 to t+3).
In the few instances where announcement dates differed between Compustat and I/B/E/S
we used the company press release to identify the relevant date. The mean excess return
was –0.3 percent, with a median excess return of – 0.5 percent.
For each company earning announcement, we collect company press releases.
To identify news stories, we looked for articles using the Factiva search engine
and we restricted ourselves to news stories in the three day trading window surrounding
the announcement using the company name, company ticker and the search string
‘earnings,’ ‘results,’ or ‘EPS’. Where there was more than one news report on the
earnings announcement, we focused on the news report from the more reputable and
larger newspaper. Specifically we use the article in the Wall Street Journal, if it
publishes a story. If there is no Journal story, we randomly draw a news report from one
of the stories published by the 50 largest American newspapers (according to Factiva). If
we still do not find a story, we searched all remaining stories in American newspapers
and randomly draw one from these.14 As described in Table 2, we identified news stories
for 226 of the 526 earnings announcements, with 95 of these observations from the Wall
Street Journal and 131 from other newspapers.
For each company we identified a measure of spin in the company press release
and spin in the news story, if a news story was available. Specifically, we identify which
14 It was often the case that stories not picked up by the larger newspapers were covered by local newspapers.

16
earnings measure is identified first in the story, what paragraph it is mentioned in, and if
the other measure is also discussed, in what paragraph it is presented.
As detailed in the second section of Table 2, companies emphasize street earnings
mentioning these earnings first in their press releases in 61 percent of our observations,
and in 65 percent of the cases where the company also had a news story. The press
behaves differently, leading with street earnings in only 31 percent of the cases. Looking
at the differences in paragraphs between one number and the other, the differences are
even more stark, with on average 1.45 paragraphs separating the street from the GAAP
number in company press releases, whereas the gap was only 0.85 paragraphs in the news
stories. This difference is even greater if one focuses on stories where street was
presented before GAAP (2 paragraphs versus 0.87 paragraph difference).
III. Impact of media coverage on stock prices
There is a large literature in accounting on the stock price repose to earnings
announcements. We build on this literature to identify what impact media coverage has
on stock prices.
The basic specification, used in many accounting studies, regresses the
cumulative abnormal return on one measure of earning surprises. This is what we do in
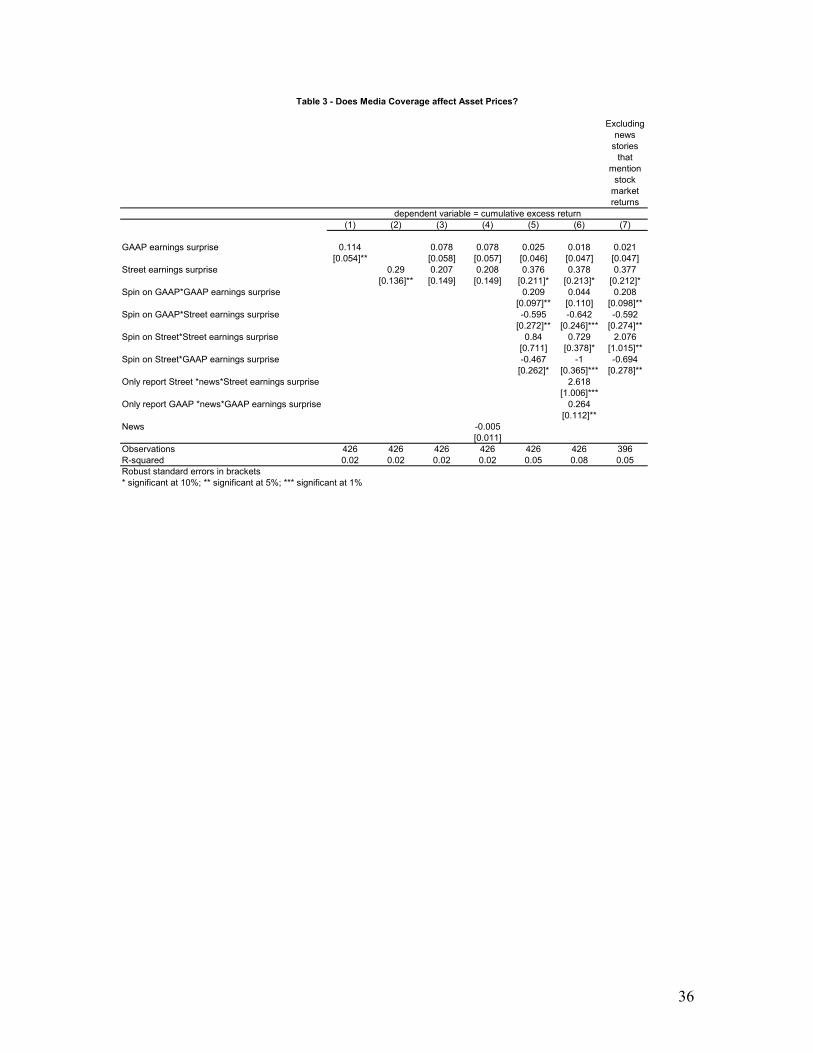
the first two columns of Table 3. As found in all these studies stock prices respond
positively to either measure of earnings surprise, with the coefficient for Street earnings

17
surprises being larger than the coefficient for GAAP’ earnings surprises. Note, however,
that the standard deviation of GAAP earnings surprises is two and a half times the
standard deviation of ‘street” earnings surprises. Thus, the impact of one standard
deviation in Street earnings is a 1.4 percentage point increase in stock prices, while a one
standard deviation increase in GAAP earnings is a comparable but smaller 1.3
percentage point increase in stock prices.
When we insert both measures of earning surprises on the right hand side the two
coefficients drop somewhat, but remain of the same order of magnitude, albeit they lose
statistical significance because of multicollinearity. The ratio of the two coefficients is
similar to the one obtained by Bradshaw and Sloan (2002), but their coefficients are more
highly statistically significant because they have many more observations.
In column 4 we repeat the same regression after inserting an indicator variable for
the companies whose earnings announcement was reported in a newspaper. On average,
this has no impact. This is hardly surprising. It is not the news per se that matters, but its
content.
Hence, in column 5 we break down the media news depending on the type of
earnings measure they emphasize and we interact this with the actual amount of the
earnings surprise, using that type of news. The overall result is that a media emphasis on
GAAP earnings increases the sensitivity of stock prices to GAAP earnings surprises and
decreases their sensitivity to ‘street’ earnings surprises, while media emphasis on street
earnings increases the sensitivity of stock prices to ‘street’ earnings surprises and
decreases their sensitivity to GAAP earnings surprises. When no news is published, one
standard deviation increase in a GAAP earnings surprise translates into only a 0.3

18
percentage point increase in stock prices, and this increase is not statistically significant.
When news is published and it emphasizes the GAAP earnings, this impact rises to 2.8
percentage point and becomes statistically different from zero and from the impact in the
absence of a news. Similarly, when no news is published, one standard deviation
increase in a street earnings surprise translates into only a 1.8 percentage point increase in
stock prices, and this increase is statistically significant. When news is published and it
emphasizes the street earnings, this impact raises to 5.8 percentage point (statistically
different from zero and from the impact in the absence of a new), while if the article
emphasizes GAAP earnings, this impact goes to zero.
To test whether this effect is really associated to the spin chosen by the media, in
column 6 we focus on the most extreme observations, i.e. cases where the media report
only the street earnings measure or only the GAAP one. Consistent with our priors, the
effect becomes even more pronounced. When the media report only the GAAP number,
the impact of a one standard deviation increase in GAAP earnings surprises increases by
another three percentage points, while the impact of a one standard deviation increase in
street earnings surprises when only street earnings are reported is another 15 percentage
points.
One possible concern is that sometimes earnings news are announced at the
beginning of the day or during trading (9am- 4pm for the NYSE). In such cases the
articles appearing in a newspaper on day t+1 benefit from having seen the initial reaction
of the price on day t. For this reason, we repeat our basic specification excluding all the
articles that mention the stock price reaction. As column 7 shows, the results are if

19
anything stronger, so its is unlikely that the direction of causality goes from stock price
reactions to news spin.
IV. Why Do Media Have an Impact?
Having excluded that the direction of causality runs from stock price reaction to
news spin does not establish that the direction of causality runs in the other direction. In
fact, the correlation could be spurious. One possible story, for example, would be that
financial journalists are very accounting savvy and emphasize in their story the measure
of earnings that best represents the actual performance of the company. In this sense, both
the stock market and the journalists respond to unobservable differences in the
informativeness of street vs GAAP earnings.
While our accounting colleagues laughed at this hypothesis, we cannot rule it out
directly. What we do, instead, is to explore in the rest of the paper why media can have a
causal effect on stock prices and test whether the stock price response is consistent with
that interpretation.
Some theoretical considerations
Nobody would dispute that information can affect stock prices. The standard
efficient market assumption, however, is that when a piece of news is released, it gets
immediately incorporated into stock prices. For this to be true, regardless of the process
of diffusion of information, we need that the few informed people are able to take
extremely large positions in any stock. But this assumption is increasingly under attack in
the asset pricing literature (e.g., see Shleifer and Vishny, 1997, and Lamont and Thaler,
2003). If there exist limits to arbitrage activity, then the number (or better the wealth-

20
weighted number) of informed people matters. If that is the case, the way a piece of
information is diffused affects the way it is incorporated into asset prices. In particular,
media play a big role in determining whether news arrive to a large set of investors and
how it is perceived. Hence, they can have an impact on asset prices just for this
information role.
Since a well-followed company is more likely to have lots of well-informed
traders, if the transmission of information was an important factor in explaining our
estimates, we would expect the impact of media reporting to be stronger for poorly
followed companies than well followed one. In our empirical analysis we will use the
number of analysts as a proxy for a company’s following.
Another way in which the media can affect asset prices is because they can help
in certifying information. News reported in an authoritative outlet carries greater
credibility. “It must be true – asserts Dr Strangelove in the anonymous movie – I read it
in the New York Times”. Hence, the market can react more to a measure of earnings if
this is emphasized by an authoritative outlet. In our empirical analysis we will
differentiate between the Wall Street Journal and other journals, with the Wall Street
Journal being more authoritative.
Finally, media can have an impact also because they create common knowledge
among traders. As Morris and Shin (2002) have recently pointed out, prices can be
different if all the traders know about a piece of information, but they do not know that
everyone else knows, or if they are aware this information is common knowledge. Media
reporting, especially in national journals, create this common knowledge.

21
It is not easy to test this hypothesis. If this is the main driving force, though, the
impact of the media should be stronger when traders have the benefit of seeing the media
report before start trading or not. Therefore, we will divide the sample on the basis of
when the information got released. When a company announces its earnings after 4 p.m.,
traders in that company will be able to observe media reports before they start trading. If
media’s role in creating common knowledge is important, we expect news to have more
of an impact for this subset of announcements than for the rest of the rest of the sample.
Empirical results
In the first two columns of Table 4 we divide the sample between companies with
low (below the median) number of analysts and companies with high number of analysts.
As expected, the impact of media reporting is always bigger for companies with low
number of analysts than for companies with high number of analysts. This difference is
particularly pronounced when media emphasize street earnings (which is less frequent).
In such cases, the stock price response to one standard deviation increase in street
earnings sore to 30 percentage points, while it is only 2 percentage points when a stock is
followed by many analysts. As Column 3 shows, this difference is statistically significant
at conventional levels. These results suggest that for stocks that are not well followed
media reporting does influence the set of investors that are aware of a certain news.
Column 4 and 5 split the sample between firms whose news is reported in The
Wall Street Journal and firms whose news is reported in other newspapers. Consistent
with our prior, the impact of media reporting is stronger when the media reporting the
news is The Wall Street Journal. If The Wall Street Journal emphasizes GAAP earnings,
street earnings have no impact on stock prices, while if it emphasizes street earnings one

22
standard deviation increase in street earnings increase stock prices by 50 percentage
points. As Column 6 shows, this difference is statistically significant at conventional
levels. Hence, there is some support for the hypothesis that media matter because they
certify existing information.
Finally, columns 7 and 8 re-estimate our basic specification for companies
announcing their earnings after market closing and before market closing. If anything, the
impact of media reporting is stronger for companies announcing before market closing,
but this difference is not statistically significant. Hence, we find no evidence that media
impact asset prices because they create common knowledge among traders.
The Impact of Press Releases
Another way to test why media have an impact on stock prices is to compare this
impact with the impact of press releases. If the market is simply responding to the
different informativeness of various earnings measures, it should behave in the same way
with respect to the spin chosen by the company in its press release. In equilibrium
companies should choose to emphasize the most informative measure of earnings. Hence,
the market should respond more to the measure emphasized by the press release as well.
In Table 5 we show this not to be true. The spin of the press releases have no significant
impact on the stock price response to earnings surprises.
IV How Do Media Choose Their Spin?
Thus far, we have shown some evidence that media spin affects the stock price
response to earnings. This impact is consistent with some explanations of why media can

23
have an impact. This evidence, however, cannot rule out the possibility that media spin is
chosen optimally, and thus it appears to have an impact only because it conveys some
information about the informativeness of the underlying earnings measures.
One way to shed light on this hypothesis is to probe deeper into the economics of
media reporting and identify when it could be biased. Then we can test whether this bias
shows up in the data as predicted by theory and how it impacts the stock price response.
Media Bias
In a recent paper, Mullanaithan and Shleifer (2002) show why it might pay a
reporter to follow the herd. They assume that readers are more inclined to believe articles
that confirm their priors, while they discount others. With such behavior, it pays a
reporter to herd unless s/he has a very credible alternative story. If this hypothesis is true,
we expect media to be biased in favor of street earnings (which by sample design are
higher than GAAP earnings) during boom periods, and to focus on GAAP during a bear
market.
The possibility of a bias in media reporting, however, does not require any
behavioral assumption. It is sufficient to probe deeper into the economics of media
reporting. How do journalists gather information? Some information is obtained from
public sources, other information (generally the most valuable kind) is from private
sources. In fact, an important asset in a journalist’s professional portfolio is the privileged
sources of information she has access to.
Why do insiders reveal private information? We distinguish two possibilities.
One is that the informed insider has an interest in the diffusion of information per se. For

24
example, in the Watergate case, Richard Nixon’s adversaries had political reasons to leak
information. They did not need to be rewarded: the diffusion of information was their
own reward. This case is more frequent in environments, like the political one, where
there are open conflicting interests. This is relatively rare in the case of corporations, with
the exception of contested takeovers or internal fights to succeed a failing CEO. The
second scenario is a quid pro quo between the source and the journalist. The source
repeatedly reveals valuable information to the journalist in exchange for a positive spin
on the news being revealed. In general, all corporate insiders have a strong vested interest
in a higher stock price and, hence, in leaking only positive news. For companies, thus, the
quid pro quo scenario appears more likely.
The quid pro quo bias applies not only to journalists, but at least as much to
analysts. In fact, this was one motivation for the passage of regulation FD in the United
States. The bias arising from non-public preferential access is clear in the regulation,
“Second, the regulation likely also will provide benefits to those seeking unbiased
analysis. This regulation will place all analysts on equal footing with respect to
competition for access to material information. Thus, it will allow analysts to express
their honest opinions without fear of being denied access to valuable corporate
information being provided to their competitors. Analysts will continue to be able to use
and benefit from superior diligence or acumen, without facing the prospect that other
analysts will have a competitive edge solely because they say more favorable things

25
about issuers.”15 While regulation FD may have limited this kind of bias through new
rules requiring public disclosure of all material information, notably this rule did not
apply to the business press.
We can formalize the idea that the suppliers of information (the companies) want
to be rewarded for their tips with a positive spin by writing a sources’ supply of news as a
function of the bias produced:
sN bγ δ= + .
Demand side bias
It has also been suggested that the demand side can also introduce a bias,
particularly regarding political news. Mullinaithan and …While the suppliers of
information want positive spin, the demanders (readers of newspapers) would like as
accurate a reporting as possible. This is simply to say that people’s demand for news is
negatively correlated with the extent of the bias b, so we can write it as
dN bα β= − .
What will be the equilibrium level of bias? Assuming a competitive market and
treating media reporters as simply brokers who set the level of bias in order to equate
demand and supply we have
b α γβ δ
−=+
.
15 Final Rule:Selective Disclosure and Insider Trading, SECURITIES AND EXCHANGE COMMISSION,17 CFR Parts 240, 243, and 249,Release Nos. 33-7881, 34-43154, IC-24599, File No. S7-31-99.

26
With a lower level of bias, sources would provide fewer stories based on private
information and there would be excess demand for news. With a higher level of bias,
there would be an excess supply of news as sources would divulge much more private
information, but readers would have less demand, knowing that the news was biased.
Cyclicality of media bias
Imagine now a positive shock to the demand of financial news, as might have
been triggered by the explosion in the popularity of stocks and the interest in day trading.
This corresponds to an increase in α , which will automatically lead to an increase in b
since 0dbdα
> . The idea is very simple. An increase in the demand for news increases the
relative power of the sources vis-à-vis the reporters. To capture time with sources, the
reporters will have to cater more to the sources, increasing their spin. This problem is fully
recognized by journalists. “As the number of news outlets grows, -- writes the Program for
Excellence in Journalism --they are chasing a static number of sources. This means sources are
gaining leverage over the journalists who cover them. Sources are setting the terms of interacting
with the press.” 16
Bradshaw and Sloan (2002)) report that the responsiveness of stock prices to
street earnings increased more than three fold during the latest period of euphoria of the
1990s. Similarly, Conrad, Cornell and Landsman (2002) report that the stock price
response to negative earnings surprises increases as the relative level of the market rises.
16 http://www.journalism.org/resources/tools/reporting/watchdog/clear.asp?from=print

27
These results suggest that demand for news is higher during booms. Hence, we should
expect a larger bias during boom than during recessions.17
Cross Sectional Variation in the Extent of Bias
Let’s now compare the equilibrium level of bias across companies where there is
variation in the access reporters have to news aside from that coming from the source.
Companies with more alternative sources of information will have a higher base level of
news (i.e., a higher γ ) shifting the supply of news curve up. Newspapers can satisfy
demand for company news with a lower level of bias, or stated differently since 0dbdγ
< ,
in equilibrium the media will bias less the reporting of companies with more alternative
sources of information. As a proxy for the availability of alternative sources of
information in the empirical analysis we will use the number of analysts following a
stock.
So far we have considered the market equilibrium with competition. It is possible
that news outlets are differentiated, with some outlets more interested in their reputation
and willing to safeguard it by demonstrating less bias and others without a reputation to
protect and being more willing to introduce bias. To test for this in our empirical
analysis, we will compare the correlation between the company spin and the news spin
between The Wall Street Journal, which we identify ex ante as having a larger stake in
maintaining its reputation, and other news outlets.
17 The bubble of the 1990s, perhaps more accurately, shifted out both the demand for news, and the potential supply of news by introducing more firms. All that is necessary for the cyclical bias we describe,

28
Empirical Evidence of Media Bias
According to the quid pro quo theory there should be a relationship between
company spin and media. In Table 6 we test whether such a relationship exists. We
estimate the impact of the company spin on the likelihood the press would choose the
same spin. Notice that the company spin is not correlated with the stock price response,
hence we cannot simply say that the company spin reflects the “right” spin.
As Table 6 shows, the spin pushed by the company significantly increases the
likelihood that the media will put the same spin on the earnings announcement. If the
company press release emphasizes street earnings, newspapers are 45 % more likely to
emphasize street earnings (column 1). Similarly, if the company press release reports
only street earnings, the press is significantly more likely to report only street earnings
(column 2). Finally, if the company press release reports only GAAP earnings, the press
is significantly more likely to report only GAAP earnings (column 3).
That the media might bias their spin in the direction of the company’s spin does
not mean that they completely buy into company’s spin. In fact, as Table 7 shows,
during the 1998-99 period the company emphasized street earnings 58% of the time,
while the media only 36 percent. The difference is even bigger during the 2001-02
period: 71% vs. 16%. This suggests a fluctuation over time of this bias, which is
consistent both with the Mullanaithan and Shleifer (2002) model and with the quid-pro-
quo theory.
and what seems an accurate characterization of this period, is that the demand shock exceed the supply response.

29
In Table 8 we explore other cross sectional implications of the quid pro quo
theory. The first three columns show that the media spin is more highly linked to the
company spin when there are fewer analysts following a company. This is consistent with
our causal empiricism. A financial reporter we interviewed admitted he was not that
comfortable with accounting numbers and that his strategy was to triangulate any
information he received with a few analysts. In this scenario, the fewer the number of
analysts, the more likely it is that he will buy into the company’s spin.
Columns 3 to 6 of Table 8 estimate the effect of media credibility on the relation
between company’s spin and press spin. As predicted, Wall Street Journal reporters are
half as likely to buy into company’s spin as any other reporter. When estimated in the
same regression, this differential effect is statistically different from zero (column 6).
Finally, the last three columns show the cyclicalilty in this bias. After the stock
market bubble burst, the media increased their reporting of GAAP numbers, with the
percentage of stories leading with GAAP numbers rising from 64 to 84 percent. At the
same time, firms are pushing street numbers even more, increasing the percentage of
press releases leading with street numbers from 58 to 71 percent. Consistent with these
descriptive statistics, we find that in 2001 -02 there no longer is a significant link between
the spin in press releases and the spin in news coverage, with the coefficient on company
spin dropping by more than half (column 7).
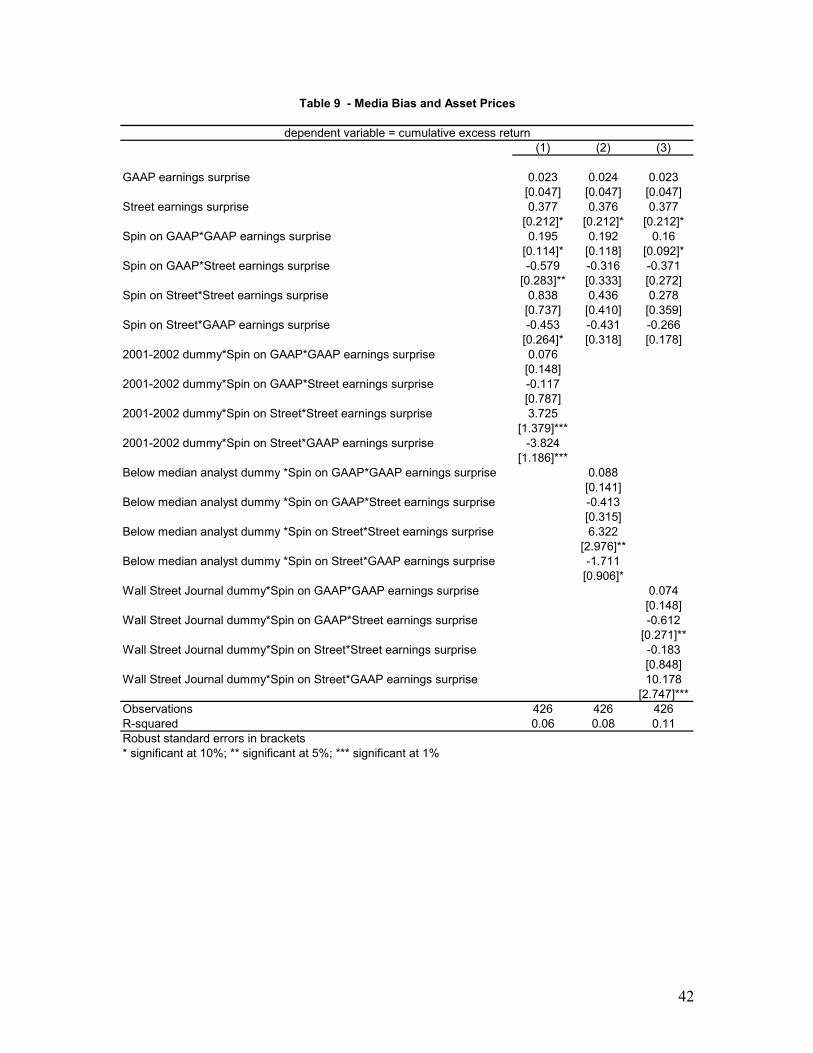
Does the Market Discount Media’s Bias?
In a rational market investors form their expectations factoring in the bias present
in media reporting. If this is the case we should find that stock price respond less to
media spin, when this spin is more likely to be biased. Is this true?

30
It is definitely true when we look at the time series variation (column 1). Media
impact goes up during the second half of the sample. This is the period when, as we
showed in Table 8, media’s spin is less affected by the spin promoted by the company.
It is also true when we look at the credibility of the media outlet. More credible
outlets, such as the Wall Street Journal, are less influenced by the company’s spin and
thus have more impact on stock prices (column 3 of Table 9).
But it is not true when we examine the differences in analysts following a
company. The fewer the number of analysts, the more important is the stock market
reaction to the media spin (column 2 of Table 9). But this is also the time where media
bias was also more severe. Thus, it does not seem that the market is fully able to undo the
bias embedded in media reporting.
IV. Conclusions
We find that media spin affects the stock market response to earning
announcement and that this link is not benign, since media tend to report information
biased in favor of companies.
While our results should be regarded as preliminary, they potentially carry
important policy implications. First, they suggest that more attention should be dedicated
to the study of the economics of the media. Such a study could lead to new rationale for
public disclosure. Public disclosure makes media less capitive to their sources and thus
less biased. Second, from a company point of view it suggests that managing their
relation with the media is important, since it can affect their stock price.

31
References
Bagehot, Walter, Lombard Street: A Description of the Money Market, 1873. Bradshaw, Mark and Richard Sloan, “GAAP versus The Street: An Empirical
Assessment of Two Alternative Definitions of Earnings,” Journal of Accounting Research, Vol. 40, No. 1, pp. 41- 66, March 2002.
Conrad, Jennifer, Bradfrod Cornell, and Wayne Landsman, “When is Bad News Really Bad News?,” Journal of Finance, Vol. 57 (6), 2507-2532, December 2002.
De Long, John Bradford, et al. “Noise Trader Risk in Financial Markets,” Journal of Political Economy. Vol. 98 (4). p 703-38. August 1990.
Dyck, Alexander and Luigi Zingales, “The Corporate Governance Role of the Media,” The Right to Tell: The Role of Media in Development, (New York: Oxford University Press), 2002.
--- “Private Benefits of Control: An International Comparison,” Journal of Finance, forthcoming.
Galbraith, John Kenneth, A Short History of Financial Euphoria, (New York: Viking Press), 1990.
Garber, Peter M., Famous first bubbles : the fundamentals of early manias (Cambridge, Mass. : MIT Press), 2000.
Huberman and Regev (2001) Journal of Finance.
Kindleburger, Charles, Manias, Panics and Crashes: A History of Financial Crises, (New York: Basic Books), 1989.
La Porta, Rafael, Florencio Lopez-de-Silanes, Andrei Shleifer and Robert Vishny, “Legal Determinants of External Finance,” Journal of Finance, July 1997.
Lamont, Owen and Richard Thaler, “Can the Market Add and Subtract? Mispricing in
Tech Stock Carve-Outs,” NBER working paper W8302, 2001.
Lipton, Joshua, “Ethics: Enron's helpers,” Columbia Journalism Review, Vol. 40, Iss. 6; pg. 13 Mar/Apr 2002.
Mullanaithan, Sendhil and Andrei Shleifer, “Media Bias,” Harvard University, mimeograph, 2002.
Rajan, Raghuram G. “Why Bank Credit Policies Fluctuate: A Theory and Some Evidence,” The Quarterly Journal of Economics. Vol. 109 (2), p 399-441, May 1994.
Schrand, C, and B. Walther, “Strategic Benchmarks in Earnings Announcements: The Selective Disclosure of Prior-Period Earnings Components,” The Accounting Review, p. 151-177, April 2000.
Sherman, Scott, “Enron: Uncovering the Uncovered Story,” Columbia Journalism Review, Vol. 40, Iss. 6; pg. 22-29, Mar/Apr 2002.

32
Shiller, Robert, Irrational Exuberance, (New York: Broadway Books), 2000.

33
Table 1 – Description of variables
Cumulative excess returns Cumulative excess return cumulated over [t-1 t+3] window. Index return is constructed from CRSP by using the value-weighted average of the returns on NYSE, AMEX and NASDAQ. CRSP data Item: Value weighted Index Street earnings The eps of the company reported by IBES in the quarterly financial reports. GAAP earnings adjusted by IBES to “exclude discontinued operations, extraordinary charges and other non operating items.” The data item in the I/B/E/S Database: ACTUAL earnings per share GAAP earnings The eps of the company reported in the quarterly results given in COMPUSTAT. The data item: DATA19 (Earnings per share ExcludingExtraordinary charges) Median estimate Median of the eps estimates reported to I/B/E/S dates closest to the announcement date. We exclude the estimates that are more than 3-months away from the announcement date. IBES data item: MEDIAN (in Summary section of IBES) Price price of the company’s stock in $. CRSP data item: PRICE GAAP earnings surprise unexpected earnings= (gaap earnings – median estimates)/stock price 5 days before announcement Street earnings surprise unexpected earnings= (street earnings – median estimates)/stock price 5 days before announcement Number of Analysts Number of analysts issuing earnings forecasts. Source: I/B/E/S News coverage Dummy variable that takes the value 1 if there is a news story in an American newspaper in the three trading days surrounding the earnings announcement. Source: FACTIVA. Press release spin Takes on the value “S” when the first item mentioned in the press release was street earnings (alternative earning estimates released by companies to eliminate the impact on earnings of “extraordinary” charges, also known as pro forma earnings). Alternatively takes on the value “G” if first reported item is GAAP earnings. Source: company press releases from PR Newswire, Business Newswire, as made available through FACTIVA, and company web sites.

34
News spin Takes on the value “S” when the first item mentioned in the news story was street earnings (alternative earning estimates released by companies to eliminate the impact on earnings of “extraordinary” charges, also known as pro forma earnings). Alternatively takes on the value “G” if first reported item is GAAP earnings. Source: Newspaper stories as made available through Factiva. Newspaper tier We searched in the three day trading window surrounding the announcement using the company name and the search string ‘earnings,’ ‘results,’ or ‘EPS’. Where there was more than one news report on the earnings announcement, we focused on the news report from the more reputable and larger newspaper. Specifically we use the article in the Wall Street Journal, if it publishes a story (tier 1). If there is no Journal story, we randomly draw a news report from one of the stories published by the 50 largest American newspapers. If we still do not find a story, we searched all remaining stories in American newspapers and randomly draw one from these (). Source: Newspaper stories as made available through Factiva. News spin Takes on the value “S” when the first item mentioned in the news story was street earnings (alternative earning estimates released by companies to eliminate the impact on earnings of “extraordinary” charges, also known as pro forma earnings). Alternatively takes on the value “G” if first reported item is GAAP earnings. Source: Newspaper stories as made available through Factiva. Newspaper tier We searched in the three day trading window surrounding the announcement using the company name and the search string ‘earnings,’ ‘results,’ or ‘EPS’. Where there was more than one news report on the earnings announcement, we focused on the news report from the more reputable and larger newspaper. Specifically we use the article in the Wall Street Journal, if it publishes a story (tier 1). If there is no Journal story, we randomly draw a news report from one of the stories published by the 50 largest American newspapers. If we still do not find a story, we searched all remaining stories in American newspapers and randomly draw one from these (). Source: Newspaper stories as made available through Factiva.

35
Number of observations mean Median
Standard deviation Minimum Maximum
cumulative excess return(-1 to +3) 500 -0.003 -0.005 0.109 -0.441 0.447GAAP eps 526 -0.34 -0.15 0.85 -5.53 1.66"Street" eps 526 0.10 0.10 0.45 -2.87 2.52Median earnings forecast 436 0.13 0.10 0.44 -2.54 2.28Stock price (t-5) 492 17.65 12.59 17.03 0.31 107.33GAAP earnings surprise 426 -0.055 -0.015 0.118 -1.168 0.217Street earnings surprise 426 -0.004 0.000 0.048 -0.480 0.310Analyst coverage 406 15.05 11.00 13.09 1.00 66.00
Spin in Company Press Release Spin in News StoriesNumber of
observations PercentageNumber of
observations Percentage
GAAP first 205 38Street first 321 61Overall 526 100
GAAP first 77 34 GAAP first 155 68Street first 149 65 Street first 71 31Overall 226 100 Overall 226 100
GAAP first 70 73Street first 25 26
Overall 95 100
GAAP first 85 64Street first 46 35
Overall 131 100
Paragraph Difference in Press Release
GAAP only 84 - 85 -Street only 116 - 56 -
GAAP then Street 121 0.51 70 0.84Street then GAAP 205 2.00 15 0.87
Overall 526 1.45 226 0.85
Full sample
Sample with News Stories
Wall Street
Journal
Other Newspap
ers
Table 2 - Descriptive statistics
observations
mean paragraph difference observations
mean paragraph difference
Paragraph Difference in News Stories
36
Excluding news
stories that
mention stock
market returns
(1) (2) (3) (4) (5) (6) (7)
GAAP earnings surprise 0.114 0.078 0.078 0.025 0.018 0.021[0.054]** [0.058] [0.057] [0.046] [0.047] [0.047]
Street earnings surprise 0.29 0.207 0.208 0.376 0.378 0.377[0.136]** [0.149] [0.149] [0.211]* [0.213]* [0.212]*
Spin on GAAP*GAAP earnings surprise 0.209 0.044 0.208[0.097]** [0.110] [0.098]**
Spin on GAAP*Street earnings surprise -0.595 -0.642 -0.592[0.272]** [0.246]*** [0.274]**
Spin on Street*Street earnings surprise 0.84 0.729 2.076[0.711] [0.378]* [1.015]**
Spin on Street*GAAP earnings surprise -0.467 -1 -0.694[0.262]* [0.365]*** [0.278]**
Only report Street *news*Street earnings surprise 2.618[1.006]***
Only report GAAP *news*GAAP earnings surprise 0.264[0.112]**
News -0.005[0.011]
Observations 426 426 426 426 426 426 396R-squared 0.02 0.02 0.02 0.02 0.05 0.08 0.05Robust standard errors in brackets* significant at 10%; ** significant at 5%; *** significant at 1%
Table 3 - Does Media Coverage affect Asset Prices?
dependent variable = cumulative excess return

37
Role of alternative information sources Role of newspaper reputation
Firms with low
number of analysts
Firms with large
number of analysts
Interaction with low analyst dummy
Firms with news in
Wall Street
Journal or no news
Firms with news in regional paper or no news
Interaction with Wall
Street Journal dummy
Firms reporting after 4pm
Firms reporting before 4pm
Interaction with after
4pm dummy
(1) (2) (3) (4) (5) (6) (7) (8) (9)
GAAP earnings surprise 0.095 -0.007 0.024 0.015 0.035 0.023 0.028 0.005 0.02[0.066] [0.075] [0.047] [0.048] [0.045] [0.047] [0.085] [0.064] [0.047]
Street earnings surprise 0.305 0.336 0.376 0.379 0.373 0.377 0.349 0.415 0.377[0.280] [0.291] [0.212]* [0.213]* [0.209]* [0.212]* [0.107]*** [0.376] [0.213]*
Spin on GAAP*GAAP earnings surprise 0.229 0.217 0.192 0.234 0.167 0.16 0.183 0.237 0.199[0.110]** [0.134] [0.118] [0.135]* [0.091]* [0.092]* [0.175] [0.114]** [0.106]*
Spin on GAAP*Street earnings surprise -0.675 -0.268 -0.316 -0.981 -0.386 -0.371 0.208 -0.687 -0.636[0.332]** [0.389] [0.333] [0.302]*** [0.269] [0.272] [0.440] [0.416] [0.281]**
Spin on Street*Street earnings surprise 6.779 0.502 0.436 10.49 0.239 0.278 0.718 3.323 3.55[2.955]** [0.460] [0.410] [2.760]*** [0.355] [0.359] [0.306]** [2.001]* [1.978]*
Spin on Street*GAAP earnings surprise -2.188 -0.421 -0.431 -0.473 -0.254 -0.266 -0.778 -1.037 -1.125[0.848]** [0.323] [0.318] [0.833] [0.175] [0.178] [0.291]*** [0.594]* [0.590]*
Below median analyst dummy *Spin on GAAP*GAAP earnings surprise 0.088[0.141]
Below median analyst dummy *Spin on GAAP*Street earnings surprise -0.413[0.315]
Below median analyst dummy *Spin on Street*Street earnings surprise 6.322[2.976]**
Below median analyst dummy *Spin on Street*GAAP earnings surprise -1.711[0.906]*
Wall Street Journal dummy*Spin on GAAP*GAAP earnings surprise 0.074[0.148]
Wall Street Journal dummy*Spin on GAAP*Street earnings surprise -0.612[0.271]**
Wall Street Journal dummy*Spin on Street*Street earnings surprise 10.178[2.747]***
Wall Street Journal dummy*Spin on Street*GAAP earnings surprise -0.183[0.848]
After 4pm dummy*Spin on GAAP*GAAP earnings surprise 0.097[0.198]
After 4pm dummy*Spin on GAAP*Street earnings surprise 0.662[0.459]
After 4pm dummy*Spin on Street*Street earnings surprise -3.012[1.979]
After 4pm dummy*Spin on Street*GAAP earnings surprise 0.482[0.656]
Observations 165 261 426 318 337 426 147 279 426R-squared 0.14 0.04 0.08 0.12 0.04 0.11 0.06 0.08 0.07Robust standard errors in brackets* significant at 10%; ** significant at 5%; *** significant at 1%
Table 4 - Why Does Media Coverage Affect Asset Prices?
dependent variable = cumulative excess return
Correlated equilibium

38
Firms with below
median number of analysts
Firms with above
median number of analysts
(1) (2) (3) (4)GAAP earnings surprise 0.081 -0.052 0.018 -0.087
[0.107] [0.089] [0.088] [0.137]Street earnings surprise 0.145 0.424 0.344 0.412
[0.215] [0.266] [0.327] [0.342]Spin on Street in Company press release*GAAP earnings surprise 0.007 0.141 0.207 0.119
[0.108] [0.091] [0.121]* [0.132]Spin on Street in Company press release*Street earnings surprise 0.303 0.217 0.213 0.052
[0.265] [0.374] [0.550] [0.565]Spin on GAAP*GAAP earnings surprise 0.255 0.292 0.265
[0.105]** [0.117]** [0.138]*Spin on GAAP*Street earnings surprise -0.607 -0.689 -0.326
[0.297]** [0.365]* [0.379]Spin on Street*Street earnings surprise 0.565 6.369 0.365
[0.770] [2.883]** [0.667]Spin on Street*GAAP earnings surprise -0.521 -2.265 -0.446
[0.261]** [0.823]*** [0.327]Observations 426 426 165 261R-squared 0.03 0.06 0.15 0.05Robust standard errors in brackets* significant at 10%; ** significant at 5%; *** significant at 1%
Table 5 - Do Company Press Releases affect Asset Prices?
dependent variable = cumulative excess return

39
dependent variable:
media report street first=1
dependent variable:
media report street only
dependent variable:
media report GAAP only
(1) (2) (3)
Company reports street first 1.684[0.393]***
Company reports only street 2.197[0.371]***
Company reports only GAAP 1.753[0.421]***
Observations 226 226 226Robust standard errors in brackets* significant at 10%; ** significant at 5%; *** significant at 1%
Table 6 - Firm Spin and Media Spin
logit

40
Panel A - Spin Company Press Release News StoriesNumber of
observations PercentageNumber of
observations Percentage
GAAP first 168 42 108 64Street first 229 58 62 36Overall 397 100 170 100
GAAP first 37 29 47 84Street first 92 71 9 16Overall 129 100 56 100
Panel B - Paragraph Difference Company Press Release News Stories
GAAP only 77 - 60 -Street only 97 - 50 -
GAAP then Street 91 0.48 48 0.89Street then GAAP 132 1.74 12 1.00
Overall 397 1.23 170 0.92GAAP only 7 25Street only 19 6
GAAP then Street 30 0.60 22 0.73Street then GAAP 73 2.45 3 0.33
Overall 129 1.91 56 0.68
1998-1999
Sample
2001-2002
Sample
Table 7 - Time Series Variation in Spin
Number of observations
mean paragraph difference
Number of observations
mean paragraph difference
1998-1999
Sample
2001-2002
Sample

41
logit
Firms with below
median number of analysts
Firms with above
median number of analysts
Interaction with low analyst dummy
Firms with news in
Wall Street
Journal or no news
Firms with news in regional paper or no news
Interaction with Wall
Street Journal dummy
1998-1999 sample
2001-2002 sample
Interaction with 2001-
2002 dummy
(1) (2) (3) (4) (5) (6) (7) (8) (9)
Company reports street first 2.951 1.257 1.511 0.878 2.269 2.072 0.352 0.214 2.004[0.831]*** [0.452]*** [0.403]*** [0.606] [0.523]*** [0.420]*** [0.066]*** [0.064]*** [0.405]***
Company reports street first* low number of analyst dummy 0.859
[0.422]**Company reports street first * wall street journal dummy -0.877
[0.345]**Company reports street first * 2001/2002 dummy -1.281
[0.424]***
Observations 58 168 226 95 131 226 170 56 226R-squared 0.13 0.06Robust standard errors in brackets* significant at 10%; ** significant at 5%; *** significant at 1%
dependent variable: media report street first=1
logit regression
Table 8 - Cross-Sectional Variation in the Impact of Company Spin on News Spin
42
(1) (2) (3)
GAAP earnings surprise 0.023 0.024 0.023[0.047] [0.047] [0.047]
Street earnings surprise 0.377 0.376 0.377[0.212]* [0.212]* [0.212]*
Spin on GAAP*GAAP earnings surprise 0.195 0.192 0.16[0.114]* [0.118] [0.092]*
Spin on GAAP*Street earnings surprise -0.579 -0.316 -0.371[0.283]** [0.333] [0.272]
Spin on Street*Street earnings surprise 0.838 0.436 0.278[0.737] [0.410] [0.359]
Spin on Street*GAAP earnings surprise -0.453 -0.431 -0.266[0.264]* [0.318] [0.178]
2001-2002 dummy*Spin on GAAP*GAAP earnings surprise 0.076[0.148]
2001-2002 dummy*Spin on GAAP*Street earnings surprise -0.117[0.787]
2001-2002 dummy*Spin on Street*Street earnings surprise 3.725[1.379]***
2001-2002 dummy*Spin on Street*GAAP earnings surprise -3.824[1.186]***
Below median analyst dummy *Spin on GAAP*GAAP earnings surprise 0.088[0.141]
Below median analyst dummy *Spin on GAAP*Street earnings surprise -0.413[0.315]
Below median analyst dummy *Spin on Street*Street earnings surprise 6.322[2.976]**
Below median analyst dummy *Spin on Street*GAAP earnings surprise -1.711[0.906]*
Wall Street Journal dummy*Spin on GAAP*GAAP earnings surprise 0.074[0.148]
Wall Street Journal dummy*Spin on GAAP*Street earnings surprise -0.612[0.271]**
Wall Street Journal dummy*Spin on Street*Street earnings surprise -0.183[0.848]
Wall Street Journal dummy*Spin on Street*GAAP earnings surprise 10.178[2.747]***
Observations 426 426 426R-squared 0.06 0.08 0.11Robust standard errors in brackets* significant at 10%; ** significant at 5%; *** significant at 1%
Table 9 - Media Bias and Asset Prices
dependent variable = cumulative excess return

43