The mechanical response of the midbrain to inden- tation
27
Technische Universiteit Eindhoven Mechanical Engineering Section, Mechanics of Materials Group, Materials Technology Eindhoven, September 27, 2009 The mechanical response of the midbrain to inden- tation Author: Thiam Wai Chua (0666146) Document number: MT 09.29 Supervisors: dr. ir. J. A. W. van Dommelen ir. R. J. H. Cloots
Transcript of The mechanical response of the midbrain to inden- tation

Technische Universiteit Eindhoven
Mechanical EngineeringSection, Mechanics of Materials
Group, Materials TechnologyEindhoven, September 27, 2009
The mechanical responseof the midbrain to inden-tationAuthor: Thiam Wai Chua (0666146)
Document number: MT 09.29
Supervisors:
dr. ir. J. A. W. van Dommelen
ir. R. J. H. Cloots

Abstract
This study was to investigate the mechanical behavior of midbrain tissue undergoingindentation in three directions: anterior-posterior, inferior-superior and lateral-medialdirections. Midbrain tissue sample was prepared from porcine midbrain and its materialparameter values were obtained from the studied of X.G. Ning et al. [4] and derivedfrom M. Hrapko et al. [6]. Indentation is used because the mechanical response ofmidbrain tissue can be considered as homogeneous at the length scale (less than 2 mm)of the indenter. Midbrain tissue samples are indented with different indentation speedsand the force relaxation after a step indent is measured as well. The indentation testsshown that the reaction force level and stiffness of the midbrain is lower in inferior-superior direction than in the other two directions. It may suggest that the axonalfibers cannot sustain compression loading and may buckle. Midbrain was characterizedas an anisotropic hyperelastic incompressible material and a finite element model of theindentation experiment was made using the Holzapfel-Gasser-Ogden model with axonalfibers that were aligned along the inferior-superior direction. Finally, the mechanicalresponse obtained from indentation tests are compared with results from the finite elementmodel of the indentation experiment.
Keywords : midbrain tissue, compression, indentation, anisotropy, hyperelastic, Holzapfel-Gasser-Ogden model, finite element analysis.

Contents
1 Introduction 2
2 Experiment 4
2.1 Midbrain tissue sample preparation . . . . . . . . . . . . . . . . . . . . . 42.2 Experiment setup . . . . . . . . . . . . . . . . . . . . . . . . . . . . . . . 42.3 Indentation procedure . . . . . . . . . . . . . . . . . . . . . . . . . . . . 5
3 Model formulation and finite element models 7
3.1 Transversely isotropic representation of axonal fibers . . . . . . . . . . . 73.2 Anisotropic hyperelastic formulation . . . . . . . . . . . . . . . . . . . . 83.3 Finite element model . . . . . . . . . . . . . . . . . . . . . . . . . . . . . 10
4 Results and discussions 14
5 Conclusions 19
Appendices 21
Bibliography 24
1
Chapter 1
Introduction
In the Netherlands, there were 791 deaths (2007) and 16,750 injuries requiring hospitalisa-tion (2006) due to traffic accidents although the number of the road injuries has droppedby over 10% and the number of road fatalies has decreased by 30% in ten years’ time.These traffic accidents cost the society about 9 billion euros every year [1]. Therefore,extensive scientific researches have to be carried out in order to decrease the number ofdeaths and injuries caused by the traffic accidents in the future.
The human nervous system, especially the brain, can be considered as the utmostimportant part in the human body and traumatic brain injury (TBI) is still a mainfactor for a large number of fatalities. Thus, continuing research and the developmentof brain finite element model for determining its mechanical behavior is indispensable inorder to design and improve the head protective measures.
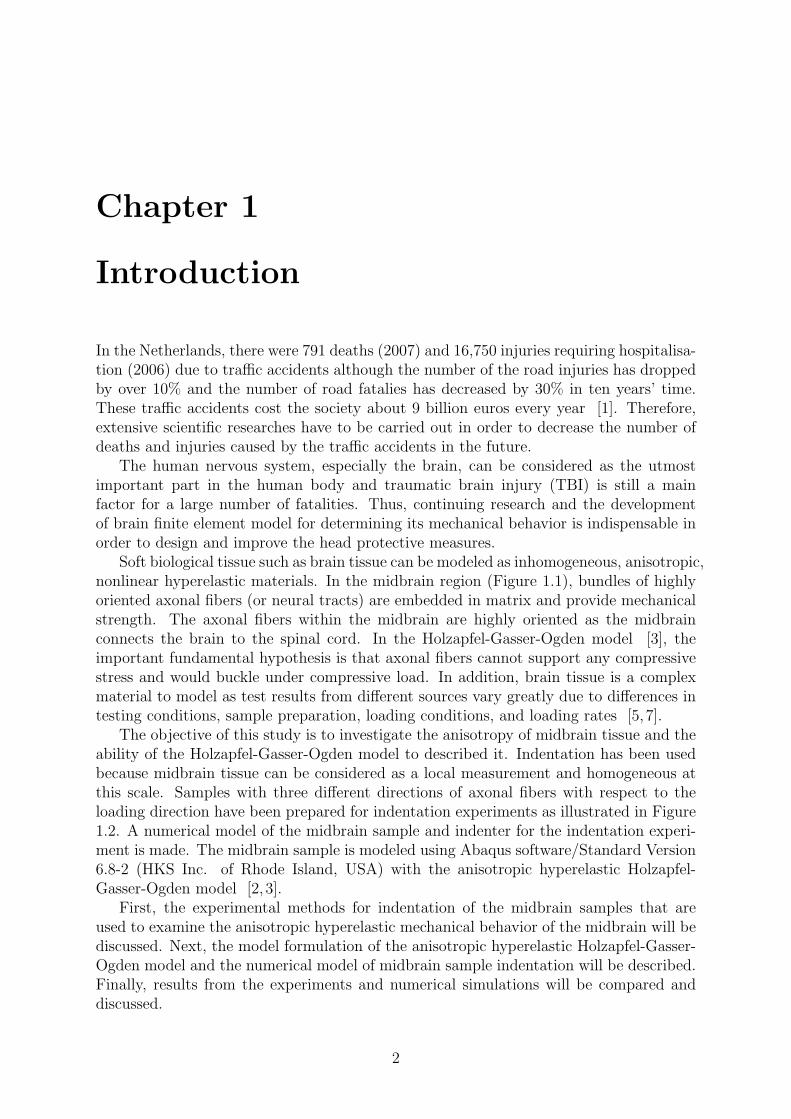
Soft biological tissue such as brain tissue can be modeled as inhomogeneous, anisotropic,nonlinear hyperelastic materials. In the midbrain region (Figure 1.1), bundles of highlyoriented axonal fibers (or neural tracts) are embedded in matrix and provide mechanicalstrength. The axonal fibers within the midbrain are highly oriented as the midbrainconnects the brain to the spinal cord. In the Holzapfel-Gasser-Ogden model [3], theimportant fundamental hypothesis is that axonal fibers cannot support any compressivestress and would buckle under compressive load. In addition, brain tissue is a complexmaterial to model as test results from different sources vary greatly due to differences intesting conditions, sample preparation, loading conditions, and loading rates [5, 7].
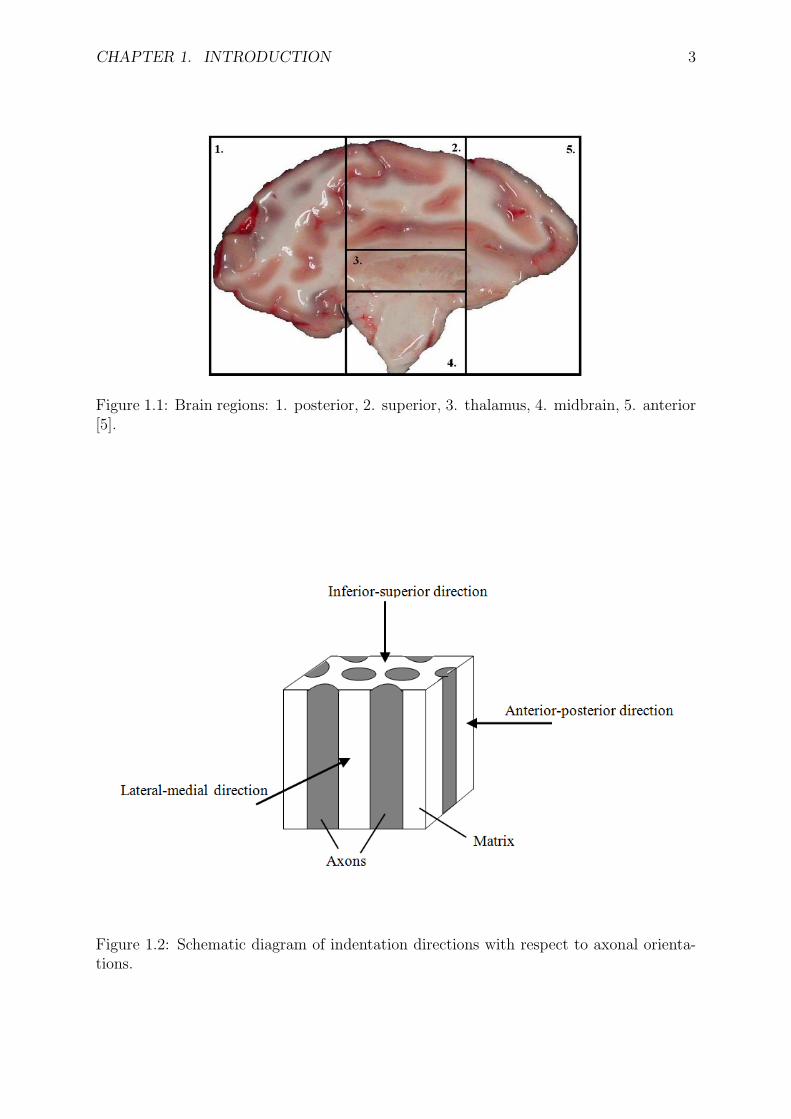
The objective of this study is to investigate the anisotropy of midbrain tissue and theability of the Holzapfel-Gasser-Ogden model to described it. Indentation has been usedbecause midbrain tissue can be considered as a local measurement and homogeneous atthis scale. Samples with three different directions of axonal fibers with respect to theloading direction have been prepared for indentation experiments as illustrated in Figure1.2. A numerical model of the midbrain sample and indenter for the indentation experi-ment is made. The midbrain sample is modeled using Abaqus software/Standard Version6.8-2 (HKS Inc. of Rhode Island, USA) with the anisotropic hyperelastic Holzapfel-Gasser-Ogden model [2, 3].
First, the experimental methods for indentation of the midbrain samples that areused to examine the anisotropic hyperelastic mechanical behavior of the midbrain will bediscussed. Next, the model formulation of the anisotropic hyperelastic Holzapfel-Gasser-Ogden model and the numerical model of midbrain sample indentation will be described.Finally, results from the experiments and numerical simulations will be compared anddiscussed.
2
CHAPTER 1. INTRODUCTION 3
Figure 1.1: Brain regions: 1. posterior, 2. superior, 3. thalamus, 4. midbrain, 5. anterior[5].
Figure 1.2: Schematic diagram of indentation directions with respect to axonal orienta-tions.

Chapter 2
Experiment
An experimental setup for an indentations on midbrain tissue samples is used. Twentyfour midbrain tissue samples were prepared from nine post-mortem porcine midbrainsand all indentations were performed within six hours post-mortem. Two indentationprotocols were used. The first protocol was used to determine the minimum duration forfull recovery of the sample between each indentation. The second protocol was used tocharacterize the mechanical properties of midbrain tissue for further analysis.
2.1 Midbrain tissue sample preparation
Approximately rectangular midbrain samples (approximately, 20 × 20 × 2 mm) wereprepared by using a Leica VT1000S Vibrating blade microtome. The midbrain sampleswere prepared from fresh halves of porcine brains from 6-month-old pigs obtained from alocal slaughterhouse. Considering the factors of availability and for minimization of post-mortem time at testing, porcine brain tissue was chosen as a substitute for human braintissue. Fresh halves of porcine brains were placed in Phosphate Buffered Saline (PBS)solution during transportation and during the samples preparation process, to preventdehydration and swelling as well as to slow-down degradation of the porcine brain tissue.The Dura-mater layer was removed from each porcine brain before the preparation processand all tests were conducted within 6 hours post-mortem, as suggested by Garo et al.
[11].
2.2 Experiment setup
The experimental indentation setup previously used to investigate brain tissue interre-gional mechanical properties variations [5], is used for this experiment as well. Theindentation experimental setup is depicted in Figure 2.1. A spherical indenter with 2 mmdiameter is attached to a leaf spring (depicted as F, leaf spring force) with spring stiffnessof 1320 N/m. The leaf spring is controlled by a motor to move the leaf spring wit a speedof 0.05 µm to 1500 µm vertically (shown as symmetrical line in Figure 2.1). The forcerequired for indentation was measured with a resolution of 15 µN and a sample frequencyof 40 Hz in order to obtain sufficient data points for post-processing purpose. The samplewas placed on dish with a diameter of 40 mm and a height variation of 0.007 mm. Thesurface of the dish and and indenter were covered by a hydrophobic coating (Sigmacoate,Sigma) to prevent the adhesion of midbrain sample to dish surface and indenter surface.
4

CHAPTER 2. EXPERIMENT 5
Figure 2.1: Schematic diagram of indentation experimental setup with F denoting theleaf spring force.
The indentation setup was placed on an air-spring suspension table to reduce force fluc-tuations and all measurements were performed at room temperature at the Laboratoryof Cell and Tissue Engineering of the Eindhoven University of Technology.
2.3 Indentation procedure
Two indentation protocols were used as shown in Figure 2.2. First, the approximateheight of sample (excluding thickness of fluid layer presents on the surface) was deter-mined. An approximate sample height was determined from the transition from tensileforce (due to surface tension when indenter made contact with fluid layer) to a com-pression force. Next, for all subsequent indentations of first and second protocols, anindentation depth of 10% of the sample height (excluding fluid layer thickness) was cho-sen [5].
The first protocol (Figure 2.2(a)) consists of three subsequent indentations at a con-stant speed of 0.1 mm/s. Each indentation starts without a contact between indenterand sample surface. The sample tends to adhere to the indenter and the dish due to afluid layer present on the surface of the sample. Therefore, the indenter was raised suchthat the indenter was fully detached from the sample before each recovery period. Theduration required for full viscoelastic recovery of the sample between each indentation isdetermined such that repeated indentations showed a reproducible result.
The second protocol (Figure 2.2(b)) was used to characterize the mechanical propertiesof midbrain tissue for further analysis. In addition, the indentation procedure of thesecond protocol provides additional information compared with the first protocol and thesample height is determined from the transition from tensile force to compressive forceduring initial indentation at 0.1 mm/s in the second protocol indentation procedure [5].The second protocol consists of five indentations at a speed of 0.1 mm/s, 0.32 mm/s,1.0 mm/s and 0.1 mm/s for the first, second, third and fourth indentation, respectively,

CHAPTER 2. EXPERIMENT 6
Time (s)
Inde
ntor
ver
tical
pos
ition
(m
m)
Protocol 1 − Indentor vertical position versus time
indenter vertical positionarbitrary sample height
(a) protocol 1
Time (s)
Inde
nter
ver
tical
pos
ition
(m
m)
Protocol 2 − Indenter vertical position versus time
indenter vertical positionarbitrary sample height
(b) protocol 2
Figure 2.2: Indentation protocols: (a) protocol 1 and (b) protocol 2. The solid lineindicates the vertical position of indenter and the dashed line indicates the surface ofmidbrain sample.
Table 2.1: Number of midbrain samples and tests in three different directions
Midbrain sample directions Number of samples Number of tests
inferior-superior 7 18lateral-medial 8 18anterior-posterior 9 20
followed by a stress relaxation test. In the stress relaxation test, the sample was indentedat a speed of 1.0 mm/s and held for 25 seconds at an indentation depth of 10% of thesample height.
Midbrain samples with three different directions (inferior-superior, lateral-medial andanterior-posterior directions) with respect to loading axis (shown as symmetrical line inFigure 2.1) from nine porcine brains were prepared and subjected to the second protocol.Indentations were performed on the samples with the axonal fibers aligned perpendicularand parallel to the loading axis. The indentation test sequence was applied to two orthree different locations for each sample. The number of midbrain samples and tests fordifferent directions are tabulated in Table 2.1.

Chapter 3
Model formulation and finite
element models
In soft biological tissue, there is a correlation between its internal microscopic structureand its macroscopic mechanical properties. Therefore, constitutive equations are impor-tant for the numerical analysis of the soft biological tissues. The axonal fibers and matrixare the key ingredients in the structure of midbrain. Experimental results in this report(chapter 4) show that the axonal fibers can be characterized as anisotropy (or transverselyisotropy) material. These axonal fibers form the main connection between the brain andthe spinal cord and they are responsible for transfering the mechanical stimuli (signal)from the brain to the spinal cord and vice versa. As a result, the mechanical propertiesand behavior of the midbrain are highly dependent on the orientation (or dispersion) ofaxonal fibers. Therefore, continuum models that do not account for the dispersion ofaxonal fibers are not able to capture accurately the mechanical behavior of the midbrain[3].
Gasser et al. have developed a hyperelastic arterial layers model which is able torepresent the dispersion of the collagen fiber orientation [3]. Arterial tissue is com-posed of three layers with highly uniaxial collagen fibers. The model incorporates anadditional scalar structure parameter, k, that characterizes the dispersed fiber orienta-tion [3]. Therefore, the structural continuum framework of the Holzapfel-Gasser-Ogdenmodel for arterial tissue is efficient to describe the anisotropic hyperelastic mechanicalbehavior of midbrain tissue and this model is used in the finite element model of theindentation experiment in Abaqus software/Standard Version 6.8-2.
3.1 Transversely isotropic representation of axonal
fibers
A constitutive model with transversely isotropic hyperelastic mechanical behavior of afamily of collagen fibers for arterial wall has been developed by Gasser et al. [3]. There-fore, this model is a good departure point for the anisotropic hyperelastic mechanicalbehavior of midbrain tissue which consists bundles of highly oriented axonal fibers em-bedded in matrix.
The continuum representation of distributed fibers is discussed in more detail in Ap-pendix A. It is assumed that there is only one family of fiber bundles axons and theseaxonal fibers are embedded in an isotropic incompressible matrix. These axonal fibers
7

CHAPTER 3. MODEL FORMULATION AND FINITE ELEMENT MODELS 8
are distributed uniaxially in inferior-superior direction, let ~no be the fiber direction unitvector in the reference configuration.
For the sake of simplification, the preferred fiber direction vector ~no is aligned withthe Cartesian basis vector ~e3, i.e. the orientation density function is independent ofEulerian angle Φ as defined in Figure 1 from Appendix A. Therefore, an orientationdensity function ρ(~M(Θ, Φ)) becomes ρ(~M(Θ)). The coefficients α12, α23 and α13 inEquation (5) from Appendix A is vanish. The remaining coefficients α11, α22 and α33 inEquation (5) from Appendix A, are given by
α11 = α22 = κ, α33 = 1 − 2κ,
κ =1
4
∫ π
0
ρ(~M(Θ))sin3ΘdΘ, (3.1)
where the notation κ has been introduced which represents the fiber distribution anddescribed the degree of anisotropy. Consequently, the generalized second order structuretensor H can be written in compact form
H = κI + (1 − 3κ)~no~no, (3.2)
where I is the identity tensor. Hence, H depends only on single dispersion structuralparameter κ which κ ⊆ [0, 1/3]. κ = 0, describes the full alignment of axonal fibersand κ = 1/3 describes the isotropic distribution of axonal fibers. Gasser et al. [3] haveassumed that the embedded fibers are distributed according to a transversely isotropic andπ-periodic von Mises distribution in order to determine the range of values for κ ⊆ [0, 1/3].
3.2 Anisotropic hyperelastic formulation
The continuum representation of the axonal fiber orientation derived in section 3.1forms the foundation for an anisotropic hyperelastic formulation. In order to derivethe anisotropic hyperelastic strain energy potential W for the midbrain, it is assumedthat it can be separated into an isotropic strain energy potential of the matrix, Wm andan anisotropic strain energy potential of axonal fibers, Wf . Therefore, the anisotropicstrain energy potential function is
W(C,H i) = Wm(C) +N∑
i=1
Wf i(C,H i(~noi , κ)), (3.3)
where the general second order structural tensor H i(~noi , κ) is defined according to equa-tion (3.2), N is the number of fiber families and C is the isochoric part of the rightCauchy-Green strain tensor C.
According to Ning et al. [4], matrix material has been modeled as an incompressibleisotropic neo-Hookean model, i.e.
Wm = C10(I1 − 3) +1
D1
(J − 1)2, (3.4)
where I1 = tr(C) denotes the first invariant of C, J is the volume ratio, C10 and D1
are neo-Hookean coefficients. These neo-Hookean coefficients can be related to the initialshear modulus Go and the bulk modulus Ko as follows

CHAPTER 3. MODEL FORMULATION AND FINITE ELEMENT MODELS 9
C10 =Go
2, D1 =
2
Ko
(3.5)
The additional contribution of the anisotropic strain energy potential for the ithfamily of axonal fibers is
Wf i(C,H i) =k1
2k2
N∑
i=1
(
ek2E2
i − 1)
, (3.6)
Ei = H i : C − 1, (3.7)
H i = κI + (1 − 3κ)~noi~noi , (3.8)
where k1 > 0 is a stress-like parameter to quantify the axonal fibers tensional mechanicalstrength and k2 > 0 is a dimensionless parameter.
The important fundamental hypothesis of the Holzapfel-Gasser-Ogden model is thatthe axonal fibers cannot support any compression stress and would buckle under com-pressive load, i.e. fibers contribute only their mechanical strength during tension [3].In order to represent this important assumption, it is assumed that the anisotropic part(1 − 3κ)~noi~noi contributes to H i and Ei from Equation 3.8 and 3.7, respectively, only ifthe strain in the direction of ~noi is positive, i.e. C:~noi~noi > 1. Therefore, 〈Ei〉 becomes 0when Ei is negative, where 〈·〉 are Macaulay brackets. General form of Ei can be derivedby substituting the Equation 3.8 into Equation 3.7 as introduced by Gasser et al. [3],
Ei = κ(I1 − 3) + (1 − 3κ)(I4i − 1), (3.9)
to show the differences between Equation (3.6) and the anisotropic contribution of thestrain energy function as introduced in Holzapfel & Gasser (2001) and Holzapfel et al.
(2000) and I4i = C:~noi~noi .For completeness, the strain energy potential function of the isotropic matrix and the
contribution from the anisotropic axonal fiber reinforcements is given by
W = C10
(
I1 − 3)
+1
D1
(
J2 − 1
2− lnJ
)
+k1
2k2
N∑
i=1
(
ek2〈Ei 〉2
− 1)
. (3.10)
The corresponding Cauchy stress tensor consisting of hydrostatic (denoted as super-script “h”) and deviatoric (denoted as superscript “d”) parts is expressed as
σ = σh + σ
d. (3.11)
The hydrostatic and deviatoric parts are given by
σh =
(
K
2
)
(
J2 − 1
J
)
I , (3.12)
σd =
2
J
C10Bd + k1
N∑
i=1
ek2〈Ei 〉2
〈Ei〉(
κBd + I4i(1 − 3κ)(~ni~ni)d)
, (3.13)
where Bd is the deviatoric part of the Finger tensor B.

CHAPTER 3. MODEL FORMULATION AND FINITE ELEMENT MODELS 10
3.3 Finite element model
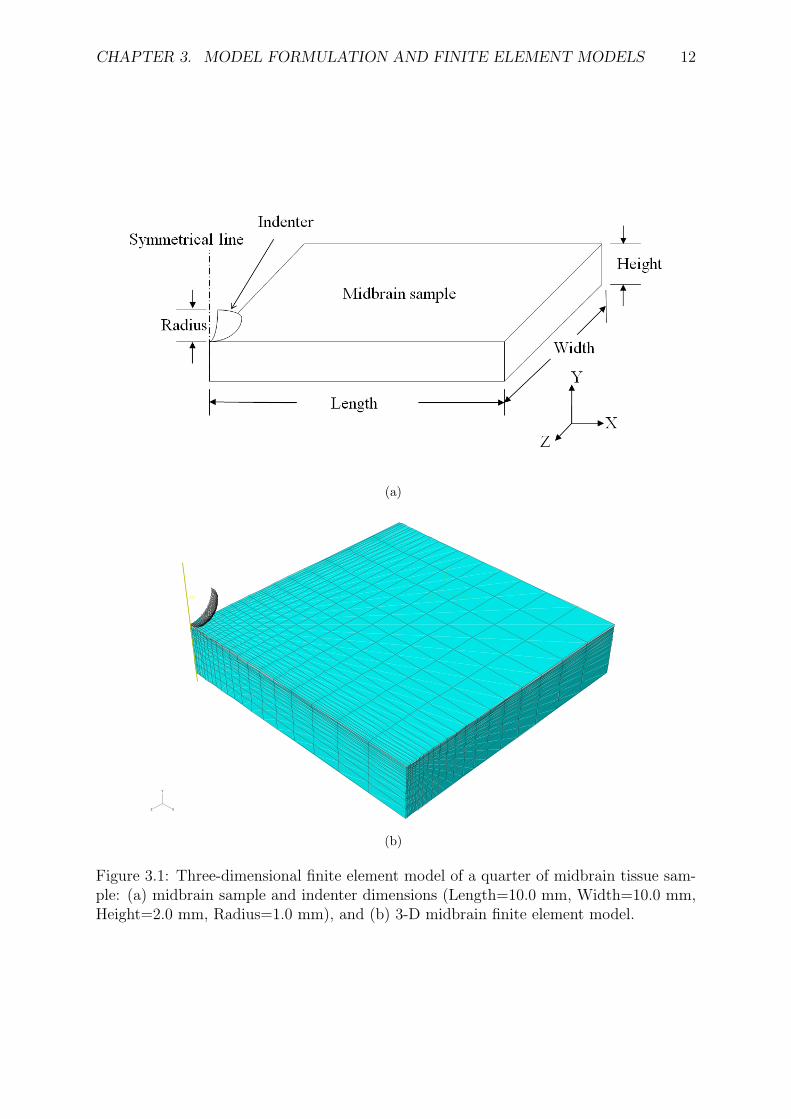
Three-dimensional finite element (FE) models of the indentation experiment were createdusing Abaqus software/Standard Version 6.8-2. Due to symmetry planes of the indenterand the midbrain sample, only a quarter of the indenter and the midbrain sample wasmodeled. The indenter was modeled as a discrete rigid shell in order to reduce thememory space consumed by the central processing unit (compared to discrete rigid solidindenter model). The mesh of the indenter has 1875 discrete rigid elements of type R3D4(4-node 3-D bilinear rigid quadrilateral element) as shown in Figure 3.1(b). The midbrainsample was modeled as a deformable solid body. The mesh of the midbrain sample has20× 20× 15 solid elements in the directions of length × width × height, respectively, oftype C3D8R (8-node linear brick element with reduced integration and hourglass control).The meshing of midbrain sample model is biased in order to obtain fine elements in thearea close to the indenter for accuracy, as depicted in Figure 3.1(b). The dimensions ofmidbrain sample and indenter finite element models are depicted in Figure 3.1(a).
Degrees of freedom for translation in Y-direction at each node of the bottom plane wereconstrained to represent the slip boundary between the midbrain tissue sample and thedish surface. The translation in Z-direction at each node in the XY-plane were constrainedto represent a symmetry boundary condition. Also a symmetry boundary condition wasapplied in the YZ-plane which the transition in X-direction were constrained. All nodeswere allowed to move in every transitional direction on three remaining planes (top plane,outer XY-plane and outer YZ-plane). Initially, the tip of the indenter model (mastersurface) had contact with the top surface of the midbrain model (slave surface) to preventsudden changes in contact conditions, which lead to severe discontinuity iterations [12],and the symmetrical line of indenter model and midbrain sample model were alignedwith each other (Figure 3.1). Next, in order for the indenter to indent into the midbrainsample, the reference point of the indenter model was prescribed a displacement of 0.2mm (10% of the height of the midbrain sample model) in minus Y-direction. The valuesof displacement, force, pressure and stress in the midbrain sample model were recordedin every increment.
The Holzapfel-Gasser-Ogden model as discussed in Section 3.1 and 3.2, [2,3] was usedfor the midbrain sample. Parallel (Y-direction) and perpendicular (X- or Z-direction)directions of axonal fibers with respect to the indenter loading axis (symmetrical line inFigure 3.1(a)) were defined. The mechanical behavior of two different midbrain tissuesample models with different axonal fiber directions were simulated and investigated.Material parameters 1 for midbrain region as tabulated in Table 3.1 were used in theHolzapfel-Gasser-Ogden model.
Material parameters for the brainstem [4] shown in Table 3.1 cannot be used for themidbrain tissue indentation analysis because an error occured due to a large differencein order of magnitude between material parameters. In addition, the shear moduluscalculated by Ning et al. [4] is relatively low compared with the shear modulus calculatedfrom Hrapko et al. [6]. Therefore, the shear modulus G0 and axonal fibers reinforcementstrength k1 for midbrain model indentation analysis have to be increased more than thevalues used in brainstem shearing test [4] (but less than the values in corona radiatashearing test [6]). The mechanical behavior of the midbrain, brainstem and corona
1Units in Table 3.1 have been converted to Newton (N) and millimeter (mm) for finite element analysisin Abaqus software/Standard Version 6.8-2 in order to minimize the difference in order of magnitudebetween material parameters.

CHAPTER 3. MODEL FORMULATION AND FINITE ELEMENT MODELS 11
Table 3.1: The material parameters of the midbrain tissue sample model and brain tissuefrom other resources [4, 6]
Brain regions G0[Pa] C10[Pa] K0[GPa] D1[1/GPa] k1[Pa] k2[−] κ[−]
midbrain 315.75 157.88 2.0 1.0 3013.30 0.00001 0.0brainstem [4] 12.7 6.35 2.0 1.0 121.2 0.0 0.0corona radiata [6] 478.0 239.0 2.5 8.0 - - -
radiata is comparable because these regions consist of bundles of highly uniaxial axonalfibers embedded in matrix material. Two equal three-dimensional finite element models2
(length × width × height dimensions were equal to the midbrain model shown in Figure3.1) for shearing finite element analysis were modeled. Following steps are the procedureto increase the values of shear modulus G0 and axonal fibers reinforcement strength k1
for midbrain model indentation analysis.
1. Model the corona radiata FE model
2. Analyze the corona radiata FE model in simple shear deformation using the materialparameters3 in Table 3.1
3. Extract the results of deviatoric stress σd and Cauchy stress contour from corona
radiata FE model analysis
4. Model the brainstem FE model
5. Analyze the brainstem FE model in simple shear deformation using the materialparameters in Table 3.1
6. Extract the results of deviatoric stress σd and Cauchy stress contour from brainstem
FE model analysis
7. Compare the results of σd and Cauchy stress contour from corona radiata and
brainstem FE models.
8. Increase or decrease the values of G0 and k1 in the ratio of G0/k1 (12.7 / 121.2) andrepeat the step 5 to step 7 if the σ
d and Cauchy stress contour are not identical
9. Utilize the current values of shear modulus G0 and axonal fibers reinforcementstrength k1 for midbrain FE model indentation analysis
2FE models of corona radiata and brainstem are modeled and compared isotropically because thevalue of axonal fibers reinforcement strength k1 for corona radiata is not determined in [6]
3G0=478.0 Pa is not explicitly mentioned in [6], but this value is calculated from [6]
CHAPTER 3. MODEL FORMULATION AND FINITE ELEMENT MODELS 12
(a)
Z
Y
X RP
X
Y
Z
(b)
Figure 3.1: Three-dimensional finite element model of a quarter of midbrain tissue sam-ple: (a) midbrain sample and indenter dimensions (Length=10.0 mm, Width=10.0 mm,Height=2.0 mm, Radius=1.0 mm), and (b) 3-D midbrain finite element model.

CHAPTER 3. MODEL FORMULATION AND FINITE ELEMENT MODELS 13
Figure 3.2: Algorithm of determination of the G0 and k1 values for the midbrain tissueusing the material parameters of brainstem and corona radiata in Table 3.1

Chapter 4
Results and discussions
The mechanical behaviors of 6-month-old porcine midbrain in three different directions(Figure 1.2) were investigated using indentation and compared with a finite element modelusing Abaqus software/Standard Version 6.8-2.
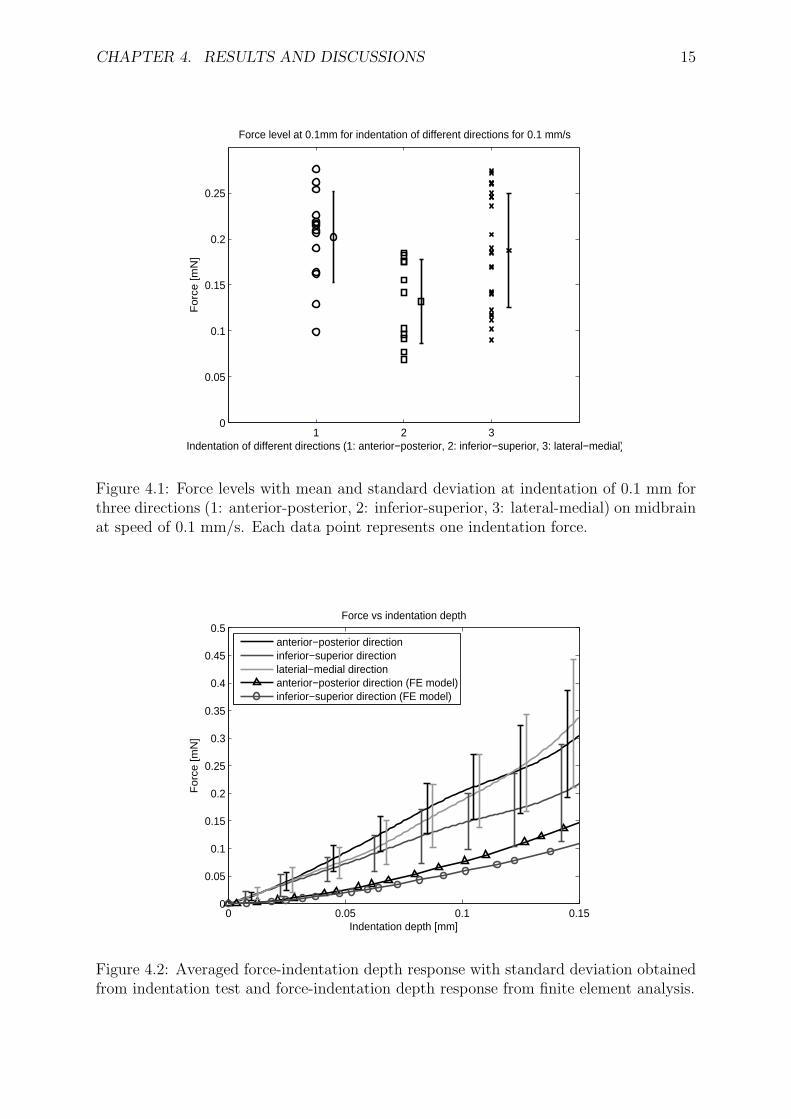
Force levels at an indentation depth of 0.1 mm for each direction with mean andstandard deviation are shown in Figure 4.1. Every data point represents one indentationforce. From Figure 4.1, the mean of force level and standard deviation for the anterior-posterior direction and the lateral-medial direction are comparable may suggest that theaxonal fibers are aligned perpendicular to loading axis in anterior-posterior direction andlateral-medial direction. However, the force level (mean and standard deviation) of axonalfibers aligned parallel to loading axis in inferior-superior direction is lower compared withthe other two directions. It may due to axonal fibers cannot support any compressionand would buckle in compressive load as discussed in Section 3.1 and 3.2. Therefore, theforce response of axonal fibers defined in X- (anterior-posterior) and Z-directions (lateral-medial) in midbrain finite element model are equal. Henceforth, axonal fibers defined inanterior-posterior and lateral-medial directions in midbrain model are equivalent.
Three average force-indentation depth curves of three directions were obtained fortwo or three locations on each sample. The experimental averaged force response withstandard deviation bandwidth for three directions of midbrain obtained from indentationtests and numerical force-indentation depth curve obtained from finite element analysisare given in Figure 4.2. As discussed previously in Chapter 3, assumption of Holzapfel-Gasser-Ogden model, the axonal fibers parallel to loading axis (inferior-superior direction)do not provide mechanical strength and would buckle. In addition, mechanical strength isonly dominated by matrix in this direction. As a result, the average response of midbrainfrom experimental and numerical indentations is considerably stiffer in anterior-posteriorand lateral-medial directions than in inferior-superior direction. In the experiment in-dentation test, the force level ratio at 0.10 mm indentation depth are 0.9270, 1.4189 and1.5306 for lateral-medial/anterior-posterior, lateral-medial/inferior-superior and anterior-posterior/inferior-superior directions, respectively. On the other hand, force level ratio at0.10 mm indentation depth for indentation analysis in anterior-posterior/inferior-superiordirections (or lateral-medial/inferior-superior) is 1.3041 and the force level ratio in lateral-medial/anterior-posterior direction is 1.0000.
The average responses and standard deviations of lateral-medial and anterior-posteriordirections are comparable because the average responses of midbrain in both directionsare considerably contributed by axonal fibers and matrix. Moreover, the average re-sponse in inferior-superior direction is lower than other two directions which indicated
14
CHAPTER 4. RESULTS AND DISCUSSIONS 15
1 2 30
0.05
0.1
0.15
0.2
0.25
Indentation of different directions (1: anterior−posterior, 2: inferior−superior, 3: lateral−medial)
Fo
rce
[m
N]
Force level at 0.1mm for indentation of different directions for 0.1 mm/s
Figure 4.1: Force levels with mean and standard deviation at indentation of 0.1 mm forthree directions (1: anterior-posterior, 2: inferior-superior, 3: lateral-medial) on midbrainat speed of 0.1 mm/s. Each data point represents one indentation force.
0 0.05 0.1 0.150
0.05
0.1
0.15
0.2
0.25
0.3
0.35
0.4
0.45
0.5
Indentation depth [mm]
Fo
rce
[m
N]
Force vs indentation depth
anterior−posterior directioninferior−superior directionlaterial−medial directionanterior−posterior direction (FE model)inferior−superior direction (FE model)
Figure 4.2: Averaged force-indentation depth response with standard deviation obtainedfrom indentation test and force-indentation depth response from finite element analysis.

CHAPTER 4. RESULTS AND DISCUSSIONS 16
the midbrain average response in inferior-superior direction is may only dominated bymatrix, and assumed that the axonal fibers do not contribute mechanical strength inthis direction. The standard deviation bandwidth of the midbrain in three directions inthis studies are relatively large compared to the standard deviation bandwidth of themidbrain in lateral-medial direction from a previous study, [5], which maybe due to un-certainty variation of midbrain microstructure from every porcine brain and experimentalconditions, [5, 7] or the indentations on midbrain samples conducted in this study aretoo close to the midbrain sample edge (approximately 6.0 mm from the midbrain sampleedge to symmetrical line of indenter as shown in Figure 2.1). In addition, from Figure4.2, there are differences of the force level between anterior-posterior/inferior-superior di-rections (or lateral-medial/inferior-superior directions) obtained from indentation exper-iments and the force level (anterior-posterior/inferior-superior direction) obtained frommidbrain sample finite element analysis. These differences of the force level between ex-periments and finite element analysis maybe due to the uncertainty variation of midbrainmicrstructure from every porcine brain and the unknown degree of dispersion of the ax-onal fibers with respected to the anterior-posterior, inferior-superior and lateral-medialdirections in midbrain samples but axonal fibers were defined and aligned parallel toinferior-superior direction in midbrain model.
A two-sample hypothesis t-test of distributions with equal means, unknown and un-equal variances, against the alternative that the means are unequal. And, a two-sampleF -test of equal normal distributions with same variance, against the alternative thatequal normal distributions with different variances. Both two-sample hypothesis testswere performed to examine the results obtained from different indentation directionsfor midbrain tissue samples at the default significance level of 5% [9]. The results ofthese analyses are summarized in Table 4.1. From the t-test table, P -values of 0.0014and 0.0121 were found for anterior-posterior/inferior-superior and lateral-medial/inferior-superior directions, respectively, indicating that a significant difference between meanstiffness of anterior-posterior or lateral-medial with inferior-superior exists. In contrast,there is no significant difference (P -value = 0.4522) of stiffness between anterior-posteriorand lateral-medial directions in the midbrain. In addition, there are no significant differ-ences between the spread of the midbrain in three directions in an F -test (Table 4.1) atthe default significance level of 5% which indicate the variances between three directionsin midbrain are relatively similar.
Table 4.1: Statistical comparison of different indentation directions for midbrain tissuesample: P -values for t-test and F -testt-test anterior-
posteriorinferior-superior
lateral-medial
anterior-posterior
0.0014 0.4522
inferior-superior
0.0121
F -test anterior-posterior
inferior-superior
lateral-medial
anterior-posterior
0.7751 0.4257
inferior-superior
0.3094
The midbrain stiffness (force/indentation depth) at 0.1 mm of indentation depth forthree indentation speeds was determined. Figure 4.3 shows the dependence of midbrainstiffness on speed of indentation. From Figure 4.3, it can be seen that the midbrainstiffness in three directions increases with increasing speed but the slope of stiffnessdecreases with increasing speed of indentation. Figure 4.3 also shows that the midbrain

CHAPTER 4. RESULTS AND DISCUSSIONS 17
stiffness in inferior-superior direction is lower than in the other two directions maybe dueto the mechanical strength only resulted from the matrix in inferior-superior directionas discussed in Section 3.1 and 3.2. In addition, the estimated spread increases withincreasing indentation speed. Figure 4.3 is also comparable to stiffness versus indentationspeed plot in a previous study, [5].
10−1
100
0
0.5
1
1.5
2
2.5
3
3.5
4
4.5
5Stiffness versus indentation speed at 0.1mm indentation
Indentation speed [mm/s]
Stif
fnes
s [N
/m]
Midbrain anterior−posterior directionMIdbrain inferior−superior directionMidbrain lateral−medial direction
Figure 4.3: Midbrain indentation stiffness at 0.1 mm versus three indentation speeds (0.1mm/s, 0.32 mm/s and 1.0 mm/s). The error bars indicate the estimated spread betweenindentation speeds.
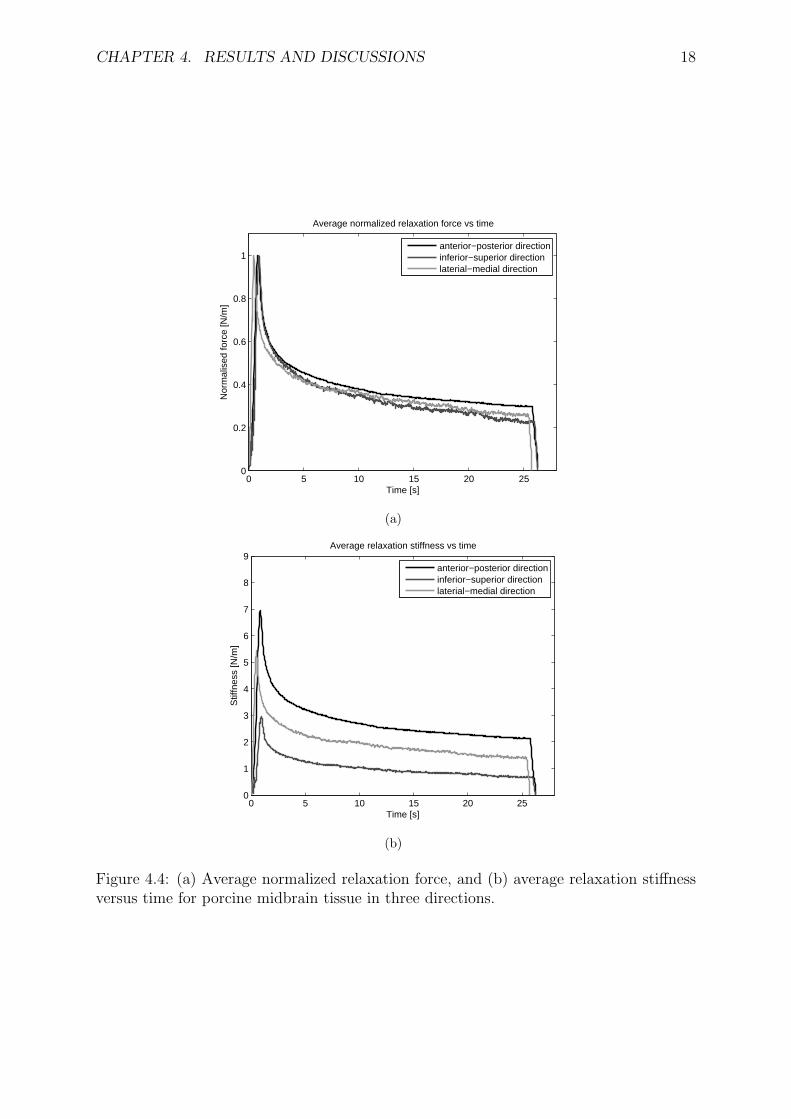
Figure 4.4 shows the average normalized relaxation force (force/maximum force) andrelaxation stiffness (force/maximum indentation depth) versus time for porcine midbraintissue during the relaxation indentation step at the end of protocol 2 in three directions.The mechanical response of brain tissue consists of elastic and viscoelastic parts. Theplateau values of the relaxation curves result from the elastic part, whereas the heightof the peak response and relaxation response during the indentation step applied aredetermined by the elastic and viscoelastic parts.
From Figure 4.4(a), it can be observed that the average normalized force relaxationafter the peak value in anterior-posterior and lateral-medial directions is slower than inthe inferior-superior direction because viscoelastic relaxation in anterior-posterior andlateral-medial directions results from axonal fibers and matrix but viscoelastic relaxationin inferior-superior direction is only influenced by the matrix.
Figure 4.4(b) shows similar conclusion from Figure 4.4(a) because viscoelastic re-laxation stiffness in inferior-superior direction is less stiff than another directions. Theviscoelastic contribution only from the matrix (without axonal fibers) in inferior-superiordirection makes the stiffness less than another two directions (contribution from axonalfibers and matrix). The difference of average relaxation stiffness in anterior-posteriorand lateral-medial directions may be due to variation of average stiffness from variousmidbrain tissue samples.
CHAPTER 4. RESULTS AND DISCUSSIONS 18
0 5 10 15 20 250
0.2
0.4
0.6
0.8
1
Time [s]
Nor
mal
ised
forc
e [N
/m]
Average normalized relaxation force vs time
anterior−posterior directioninferior−superior directionlaterial−medial direction
(a)
0 5 10 15 20 250
1
2
3
4
5
6
7
8
9
Time [s]
Stif
fnes
s [N
/m]
Average relaxation stiffness vs time
anterior−posterior directioninferior−superior directionlaterial−medial direction
(b)
Figure 4.4: (a) Average normalized relaxation force, and (b) average relaxation stiffnessversus time for porcine midbrain tissue in three directions.

Chapter 5
Conclusions
The objective of current research was to investigate the mechanical behavior of mid-brain tissue in three directions (anterior-posterior, lateral-medial and inferior-superiordirections) undergoing indentation deformation. Compression is one of the deformationsassociated with directional loading of brain during collision, which may lead to traumaticbrain injury (TBI).
In the current study, mechanical behavior of a 6-month-old porcine midbrain under-going compression deformation was obtained using the indentation technique becausethe mechanical behavior of midbrain tissue can be considered to be homogeneous at thelength scale of the indenter [5]. Midbrain tissue samples were indented in two proto-cols with three different indentation speeds (0.1 mm/s, 0.32 mm/s and 1.0 mm/s). Themechanical response obtained from indentation experiment test is compared with finiteelement analysis of midbrain tissue sample model.
A quarter of the midbrain tissue sample was modeled as an anisotropic, hyperelasticincompressible material and a quarter of the indenter was modeled as a rigid body.The midbrain tissue sample model is represented as an axonal fiber reinforced materialwhere axonal fibers are aligned along inferior-superior direction. The midbrain tissuesample model was modeled using Holzapfel-Gasser-Ogden model where axonal fibers weredescribed using an anisotropic strain energy potential function and the matrix materialusing a neo-Hookean model. The axonal fibers were modeled with an initial modulus of3013.30 Pa and the initial modulus of that midbrain matrix was 315.75 Pa.
The current study indicates that the midbrain tissue sustained less compressive forcelevel in inferior-superior direction compared with compressive force level in anterior-posterior and lateral-medial levels. This may suggest that the axonal fibers do not con-tribute in compressive stress and would buckle in this direction compare with anothertwo directions. The current experiment result also shows that the stiffness of midbrainin inferior-superior direction is lower than in another directions. The mean responseof midbrain tissue in inferior-superior direction is lower than in anterior-posterior andlateral-medial directions because this may due to only matrix contributes to the mid-brain tissue mechanical strength in inferior-superior direction, i.e. matrix and axonalfibers are contributed to the midbrain tissue mechanical strength in anterior-posteriorand lateral-medial directions. The force-indentation depth curves of the midbrain tissuein anterior-posterior (or lateral-medial) and inferior-superior directions obtained fromindentation experiments are relatively different from the results obtained from finite el-ement analysis may due to uncertainty variation of midbrain structure and an unknowndegree of dispersion axonal fibers from every porcine midbrain tissue sample with respect
19

CHAPTER 5. CONCLUSIONS 20
to anterior-posterior, lateral-medial and inferior-superior directions but the axonal fiberswere defined aligned parallel to inferior-superior direction in the midbrain model.
There was no statically significant difference of mean force level between anterior-posterior and lateral-medial directions based on statistical analysis. However, there wasa significant difference between anterior-posterior (or lateral-medial) and inferior-superiordirections. In addition, the relaxation response of a step indent was measured and showedthat midbrain in inferior-superior direction is less stiff than another two directions.
Microstructurally, many factors that contribute to midbrain compression stiffnessshould be considered such as fiber orientation, fiber bundle buckling stability, sampledimensions, undulation of axonal fibers and fiber-matrix bond strength [4]. In nature,most biological tissues are anisotropic and viscoelastic. Therefore, these factors can betaken into account in midbrain tissue modeling for improving midbrain tissue finite ele-ment analysis results.

Appendices
21

22
A. Continuum representation of distributed fiber ori-
entations
The objective of this appendix is to present the directional data of distributed fibers intoa continuum model, presented by Gasser et al. [3]. An orientation density function ρ(~M)is introduced, which characterizes the distribution of fibers in the reference configurationΩo with respect to the fiber direction vector ~M. The vector ~M is an arbitrary unit vector(|~M| = 1) located in three-dimensional Eulerian space and vector ~M can be representedin terms of two Eulerian angles Θ ⊆ [0, π] and Φ ⊆ [0, 2π]
~M(Θ, Φ) = sinΘcosΦ~e1 + sinΘsinΦ~e2 + cosΘ~e3, (1)
where ~e1,~e2,~e3 denote the axes of a rectangular Cartesian coordinates system as illus-trated in Figure 1.
Figure 1: Arbitrary unit direction vector ~M in terms of Eulerian angles Θ ⊆ [0, π] andΦ ⊆ [0, 2π] in three-dimensional Cartesian coordinate system ~e1,~e2,~e3 [3].
The orientation density function ρ(~M) can be written in terms of two Eulerian angles
(Θ and Φ), ρ(~M(Θ, Φ))sinΘdΘdΦ to represent the number of fibers with orientations in
the range [(Θ, Θ + dΘ), (Φ, Φ + dΦ)]. In addition, it is assumed that ρ(~M) is normalized.
1
4π
∫
Φ
∫
Θ
ρ(~M(Θ, Φ))sinΘdΘdΦ = 1. (2)
Next, the generalized second order structure tensor, H which represents the fiberdistribution, is defined by
H =1
4π
∫
Φ
∫
Θ
ρ(~M(Θ, Φ))~M(Θ, Φ)~M(Θ, Φ)sinΘdΘdΦ (3)
By using Equation (1), the generalized second order structure tensor (3) can be writtenin compact form
H = αij~ei~ej, where i, j = 1, 2 and 3, (4)

23
where the coefficients αij = αji are defined as
α11 =1
4π
∫
Φ
∫
Θ
ρ(~M)sin3Θcos2ΦdΘdΦ
α22 =1
4π
∫
Φ
∫
Θ
ρ(~M)sin3Θsin2ΦdΘdΦ
α33 =1
4π
∫
Φ
∫
Θ
ρ(~M)cos2ΘsinΦdΘdΦ
α12 =1
4π
∫
Φ
∫
Θ
ρ(~M)sin3ΘsinΦcosΦdΘdΦ
α23 =1
4π
∫
Φ
∫
Θ
ρ(~M)sin2ΘcosΦsinΦdΘdΦ
α13 =1
4π
∫
Φ
∫
Θ
ρ(~M)sin3ΘcosΦcosΦdΘdΦ (5)
Therefore, the generalized second order structure tensor H is a measurement of thefiber distribution can be computed once the density distribution function ρ(~M) is given.
Bibliography
[1] Ministerie van Verkeer en Waterstaat, 2009. “Road safety strategic plan 2008-2020,”Ministry of Transport, Public Works and Water Management, The kingdom of the
Netherlands.
[2] Abaqus software/standard version 6.8-2 “Analysis user’s manual, volume III: mate-rials,” developed by HKS Inc. of Rhone Island, USA and marketed under SIMULIA
brand of Dassault Systemes S.A., page 18.5.3-1 - 18.5.3-9.
[3] T.C. Gasser, R.W. Ogden and G.A. Holzapfel, 2005. “Hyperelastic modelling ofarterial layers with distributed collagen fibre orientations,” Journal of The Royal
Society Interface, 3, page 15-35.
[4] X.G. Ning, Q.L. Zhu, Y. Lanir and S.S. Margulies, 2006. “A transversely isotropicviscoelastic constitutive equation for brainstem undergoing finite deformation,”Journal of Biomedical Engineering, 128, page 925-933.
[5] J.A.W. van Dommelen, T.P.J. van der Sande, M. Hrapko and G.W.M. Peters, 2008.“Mechanical properties of brain tissue by indentation: interregional variation,” sub-
mitted.
[6] M. Hrapko, J.A.W. van Dommelen, G.W.M. Peters and J.S.H.M. Wismans, 2008.“Characterisation of the mechanical behaviour of brain tissue in compression andshear,” Biorheology, 45, page 663-676.
[7] M. Hrapko, J.A.W. van Dommelen, G.W.M. Peters and J.S.H.M. Wismans, 2008.“The influence of test conditions on characterization of the mechanical propertiesof brain tissue,” Journal of Biomedical Engineering, 130.
[8] M. Hrapko, J.A.W. van Dommelen, G.W.M. Peters and J.S.H.M. Wismans, 2006.“The mechanical behaviour of brain tissue: large strain response and constitutivemodelling,” Biorheology, 43, page 623-636.
[9] “Statistics toolbox: user’s guide,” The Mathworks, Inc. Natick, MA, USA., 7.0edition, 2009.
[10] G. Karami, N. Grundman, N. Abolfathi, A. Naik and M. Ziejewski, 2009. “A mi-cromechanical hyperelastic modeling of brain white matter under large deforma-tion,” Journal of the Mechanical Behavior of Biomedical Materials, 2, page 243-254.
[11] A. Garo, M. Hrapko, J.A.W. van Dommelen, and G.W.M. Peters, 2007. “Towardsa reliable characterization of the mechanical behaviour of brain tissue: teh effect ofpost-mortem time and sample preparation,” Biorheology, 44, page 51-58.
24

BIBLIOGRAPHY 25
[12] Abaqus software/standard version 6.8-2 “Getting started with abaqus: interactiveedition,” developed by HKS Inc. of Rhone Island, USA and marketed under SIMU-
LIA brand of Dassault Systemes S.A., page 12.1 - 12.91