The measurement of neonatal mortality: How reliable is ......with regards to neonatal mortality rate...
33
1 The measurement of neonatal mortality: How reliable is Demographic and Household Survey Data? Sarah Neal July 2012 ESRC Centre for Population Change Working Paper Number 25 ISSN2042-4116
Transcript of The measurement of neonatal mortality: How reliable is ......with regards to neonatal mortality rate...
1
The measurement of neonatal mortality: How
reliable is Demographic and Household Survey
Data?
Sarah Neal
July 2012
ESRC Centre for Population Change Working Paper
Number 25
ISSN2042-4116
I
ABSTRACT
It is estimated that, on a global scale, neonatal deaths now contribute to nearly 40% of all mortality in children under the age of five. However, as most neonatal deaths occur at home in countries with no vital registration, estimates of mortality are normally based on large national surveys such as the Demographic and Household Surveys (DHS). However, these have major limitations which restrict their accuracy. This study explores the potential contribution of DHS data in improving knowledge of trends in neonatal mortality in developing countries. It analyses the potential causes and extent of both sampling and non-sampling errors using review of existing literature as well as original analysis. The study suggests that one of the greatest limitations for DHS data is the wide confidence intervals. This makes it impossible to use DHS data to detect relatively small changes over time. While analysis suggests that in most countries data on neonatal mortality conform to expected patterns, there is also some evidence of age-heaping and back-dating of deaths. KEYWORDS Neonatal, demographic surveys, mortality measurement, data quality, data reporting, developing countries EDITORIAL NOTE Dr Sarah Neal is currently an ESRC post-doctoral fellow at the Centre for Global Health, Population, Poverty and Policy (GHP3) at the University of Southampton. Corresponding author: Sarah Neal, [email protected]
II
ACKNOWLEDGEMENTS This study was made possible by funding from the Economic and Social Research Council (ESRC). The author would like to acknowledge the help and advice provided by Professor John Micklewright, Professor Zoe Matthews and Professor Jane Falkingham during the development of this paper. Thanks also to Teresa McGowan for her work in editing and preparing the manuscript for publication. Sarah Neal all rights reserved. Short sections of text, not to exceed two
paragraphs, may be quoted without explicit permission provided that full credit, including notice, is given to the source.
The ESRC Centre for Population Change Working Paper Series is edited by Teresa McGowan
ESRC Centre for Population Change The ESRC Centre for Population Change (CPC) is a joint initiative between the Universities of Southampton, St Andrews, Edinburgh, Stirling, Strathclyde, in partnership with the Office for National Statistics (ONS) and the National Records of Scotland (NRS). The Centre is funded by the Economic and Social Research Council (ESRC) grant number RES-625-28-0001.
Website | Email | Twitter | Facebook | Mendeley
III
THE MEASUREMENT OF NEONATAL MORTALITY: HOW RELIABLE IS DEMOGRAPHIC AND HOUSEHOLD SURVEY
DATA? TABLE OF CONTENTS 1. INTRODUCTION .............................................................................................................................. 1 2. THE MEASUREMENT OF NEONATAL MORTALITY IN DEVELOPING COUNTRIES ... 2 3. DEMOGRAPHIC AND HOUSEHOLD SURVEYS (DHS) ........................................................... 3 4. THE DATA AND ANALYSIS ........................................................................................................... 4
4.1. NON-SAMPLING ERROR IN DHS DATA ................................................................................ 4 4.1.1. OMISSIONS OF DEATHS .................................................................................................. 4 4.1.2. DATA HEAPING ................................................................................................................. 5
4.2. INTERNAL CONSISTENCY IN DHS DATA ............................................................................ 8
4.2.1. CORRELATION BETWEEN PROPORTION OF CHILD DEATHS OCCURRING IN THE NEONATAL PERIOD AND OVERALL UNDER FIVE AND INFANT MORTALITY .... 8 4.2.2. THE PROPORTION OF EARLY TO LATE NEONATAL DEATHS .............................. 11 4.2.3. COMPARISON OF RECALL DATA FROM 5-9 YEARS WITH 0-4 YEAR RECALL FROM EARLIER SURVEYS IN CORRESPONDING TIME PERIOD ..................................... 14
4.3. SAMPLING ERROR .................................................................................................................. 16
4.3.1. CONFIDENCE INTERVALS ............................................................................................ 16 4.3.2. SAMPLING BIAS .............................................................................................................. 17
5. CONCLUSION: HOW RELIABLE ARE DHS ESTIMATES FOR NEONATAL MORTALITY? ..................................................................................................................................... 18 APPENDIX 1: BAR GRAPHS OF DISTRIBUTION OF NEONATAL MORTALITY 0-31 DAYS BY DAY OF REPORTED DEATH ............................................................................................................. 20 APPENDIX 2: BAR GRAPHS SHOWING THE DISTRIBUTION OF INFANT MORTALITY BY MONTH OF REPORTED DEATH ....................................................................................................... 23 APPENDIX 3: STANDARD ERRORS FOR NEONATAL MORTALITY ESTIMATES FROM DHS II SURVEYS (5 YEAR RATES) ........................................................................................................... 26 REFERENCES ..................................................................................................................................... 27
1
1. INTRODUCTION While significant progress has been made in reducing mortality in the post-neonatal
and early childhood periods within the last few decades, progress in reducing neonatal
mortality is less marked1. This has resulted in an increasing proportion of deaths in
children under the age of five occurring in the first 28 days of life. It is estimated that,
on a global scale, neonatal deaths now contribute to nearly 40% of all mortality in
children under the age of five (You et. al. 2010).
Despite the very high burden of mortality, the problem of neonatal mortality
has received little attention until relatively recently. There is now a growing
consensus within the international community that increased efforts are needed to
reduce newborn deaths if further progress is to be made in reducing child mortality.
In most countries the Millennium Development Goal to reduce child mortality by
three-quarters by 2015 will not be achieved unless significant progress is made in
reducing deaths within the first month of life.
Part of the reason for this past neglect is that neonatal mortality is largely a
hidden problem: deaths occur mostly at home, and are not documented in any official
records. Ensuring accurate estimates of neonatal mortality can be particularly
problematic. This paper initially outlines some of the problems in measuring neonatal
mortality in developing countries. It then provides a comprehensive analysis of the
quality of Demographic and Household Survey (DHS) data for measuring neonatal
mortality. This starts with an examination of non-sampling error, with a particular
focus on what is already known from existing data on the problem of possible
omissions and age heaping at seven days. It will then present some original analysis
to try to ascertain the degree of heaping at one month. No previous studies have
examined this, and it is an important omission as heaping, either at 28 days or one
month, could indicate under-reporting of neonatal mortality.
1 The neonatal mortality rate (NMR) is the number of deaths occurring in live-born infants before the 28th day of life per 1000 live births. The terms “neonate” and “newborn” are often used interchangeably. Post-neonatal mortality rate (PNMR) is the number of deaths of children between 28 days and one year per thousand live births. DHS calculates this by subtracting NMR from the Infant mortality rate. Infant mortality rate (IMR) is the number of deaths in children before the age of one year per thousand live births. Early childhood mortality rate (ECMR) is the number of deaths in children over 12 months of age but less than five years of age per 1000 children reaching 12 months.

2
The next section will then examine the internal consistency of neonatal
mortality data. While some types of error are difficult to detect, previous studies have
shown that neonatal mortality generally conforms to a number of accepted patterns.
One relationship that has been previously documented is the correlation between the
proportion of child deaths occurring in the neonatal period and the overall under five
and infant mortality rate. Because neonatal deaths tend to be the most persistent, as
overall child mortality rates decrease the proportion of deaths occurring in the
neonatal period increases. The degree to which DHS data conforms to these patterns
may provide some (albeit approximate) indication of quality, which is examined here
using the data on which this study is based. Further analysis is also carried out to see
the ratio of early to late neonatal deaths conforms to expected patterns.
Because DHS collect data on child mortality in five year periods up to 25
years prior to the survey, it offers an opportunity to compare data from different
surveys covering the same time period (i.e. by using differing periods of time prior to
data collections for surveys from the same country but different years) as a further
method for evaluating accuracy. Curtis (1995) carried out this comparison for a
relatively small number of DHS surveys, but this study offers more extensive
opportunities for analysis.
The paper then outlines some of the sampling errors inherent in the DHS data
with regards to neonatal mortality rate (NMR) estimates, before concluding with a
discussion on the extent to which DHS data can be used to analyse trends over time.
2. THE MEASUREMENT OF NEONATAL MORTALITY IN DEVELOPING COUNTRIES The accurate measurement of neonatal mortality in developing countries presents a
number of challenges, and limited data has probably contributed to the lack of focus
given to this area in the past (Lawn et al 2001) . In most developing countries vital
registration is incomplete or non-existent, and since many neonatal deaths occur
within the home without any contact with medical services they are not recorded by
health information systems. Even where institutional delivery is common, varying
policies for classification of neonatal deaths and stillbirths can result in measurement
3
discrepancies (Aleshina and Redmond 2005). There is also some evidence that within
certain health systems there are incentives for staff to misreport neonatal deaths as
stillbirths in order to avoid audit or improve hospital ratings when NMR is used as an
indicator of quality (ibid.).
The development of effective and comprehensive vital registration systems are
unlikely to be achieved in the near future by many countries. There are currently
almost no countries with both child mortality rates of over 25 per 1000 live births and
complete coverage of vital registration (classified as 95% of all deaths recorded)
(Morris et al 2003). The development of ongoing retrospective surveys or sample
registration systems, such as those developed in China and India, are another option.
The Indian Sample Registration Survey (SRS) actually uses dual methods to gather
data: births and deaths are continuously enumerated in a sample of areas by a part-
time worker and six monthly retrospective studies are also carried out. However, it
would appear that even the dual methods used by the SRS produce underestimations
of mortality (Bhatt 2002).
3. DEMOGRAPHIC AND HOUSEHOLD SURVEYS (DHS) The only feasible method of collecting reliable national-level direct estimates on
neonatal death rates in many developing countries is through large surveys such as the
DHS. These are nationally representative surveys with sample sizes of usually about
5,000-20,000 households providing data on a wide range of indicators in the areas of
population, health and nutrition. Full birth histories are collected from women aged
15-49 years in sampled households, and data is comparable both over time and
between countries. The women are asked a series of questions about each birth they
have experienced, including month and year of the infant’s birth, and, if no longer
living, age at death (in days if under a month old). Children who were born or died
during the month prior to the interview are excluded. Mortality estimates are
calculated according to the conventional life table approach. Deaths and exposure in
any calendar period are first tabulated by age intervals in months of 0, 1-2, 3-5, 6-11,
12-23, 24-35, 36-47 and 48-59. Age-interval-specific probabilities of survival are
then calculated, and probabilities for larger age segments are calculated by
4
multiplying the relevant age interval survival probabilities together and subtracting
the result from one (Rutstein 1983).
4. THE DATA AND ANALYSIS The data used for the analyses in this study is taken from 57 DHS carried out between
1990 and 2002. Thirty of these were in Sub-Saharan Africa, eight in South and South
East Asia, six were in North Africa and Western Asia, nine in Latin America and the
Caribbean and four in Central Asia.
4.1. NON-SAMPLING ERROR IN DHS DATA
4.1.1. OMISSIONS OF DEATHS Even a relatively large scale survey of this type may experience a number of potential
problems that compromise the accuracy of the data collected. Probably the greatest
risk from non-sampling errors is omission of child deaths, which is a problem thought
to be most prevalent in the neonatal period (Curtis 1995). Although mothers are
asked to recall all infants born alive who later died, 2 neonatal deaths may be
misclassified as stillbirths, either in genuine error or because of cultural beliefs and
practices. The problem is compounded by very limited DHS data on stillbirths, so it
is not possible to jointly review trends in the two rates in order to provide a more
comprehensive picture. There is some evidence from earlier World Fertility Survey
(WFS) data that these omitted deaths are concentrated amongst the most socially and
economically disadvantaged (Hobcraft et al 1984), which may result in the
introduction of important biases.
While it is difficult to estimate the degree of under-reporting, a study in the
Indian state of Maharashtra (Bang et al 2002) found an NMR nearly 20 points higher
(51.2 deaths per 1000 as opposed to 32 deaths per 1000) than that recorded in the
1998 Indian National Family and Household Survey for this state (NFHS, a DHS
equivalent). However Bang et al (2002) acknowledge that at least some of this
difference may be explained by selection bias in the study population, which
contained a much higher proportion of tribal people than the NFHS survey (ibid.). In 2 The interviewers also use a probe which asks whether the mother had “any baby who cried or showed signs of life but did not survive”, DHS 2003),
5
addition Hill and Choi (2006) suggest that further error could have been introduced by
paying informants to report deaths. They also point out that the ratios of neonatal to
infant deaths are similar in both the study and NFHS data. While this in no way
demonstrates that the NFHS did not under-report neonatal deaths, it does indicate that
NMR is not differentially under-reported when compared to post-neonatal mortality.
4.1.2. DATA HEAPING A further potential problem is that of data “heaping”, i.e. the preference for reporting
deaths at a particular day, week or month. Hill and Choi (2006) carried out some
analysis to establish the degree to which heaping occurs at seven days and found that,
in 40% of the DHS surveys they examined, one half or more of all deaths occurring
between four and nine days were reported at seven days. This could be important as it
means that a number of deaths occurring in the early neonatal period will actually be
recorded as late neonatal deaths, but it is of little relevance in studies that do not seek
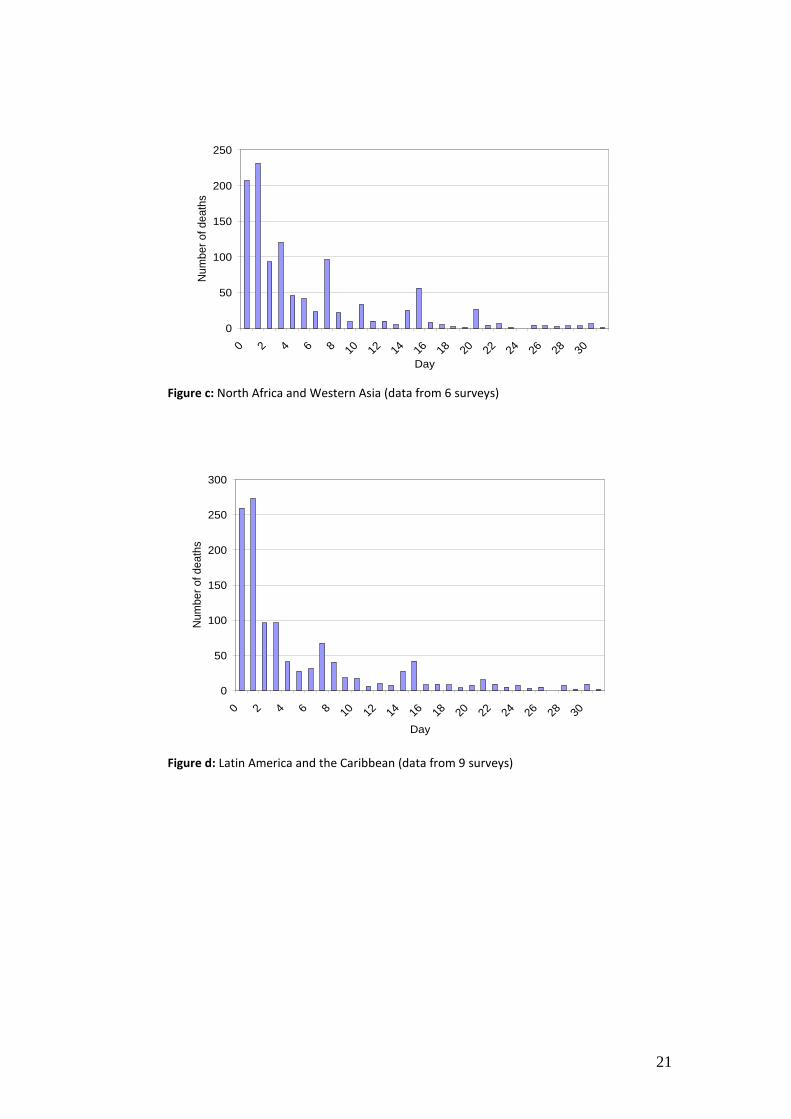
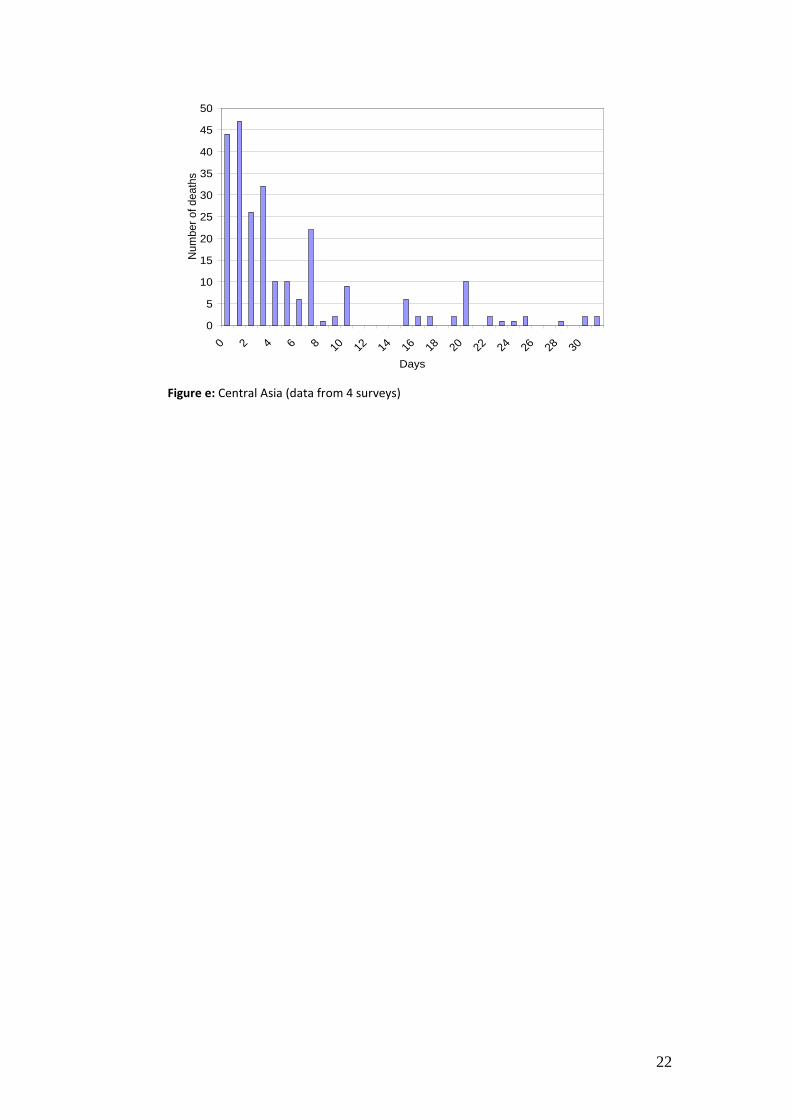
to differentiate between early and late deaths. The possibility of heaping at 28/30
days or one month is of much more importance as this would lead to under-reporting
of neonatal deaths. There appears to be a very small amount of heaping at 30 days in
all regions (and also at 28 and 31 days in some regions) which might lead to slight
underestimations of NMR, but for most regions this would be negligible (see
Appendix 1 for graphs showing reporting of deaths by day for each region).
Unfortunately, it is more difficult to ascertain whether some late neonatal
deaths are being misreported at one month of age as, after 31 days, the age of death is
recorded by month only, and no previous studies have attempted to examine this issue.
It could be hypothesised that if large numbers of neonatal deaths were displaced into
the one month age group it would be expected that this would affect the pattern of
mortality for 1-12 months. This is difficult to verify: while a model has been
established of expected distribution of mortality by month (Bourgeois-Pichat 1952,
cited in Galley and Woods, 1999), more recent work has found the pattern to vary
considerably between time and place, and there is no single fixed relationship (Galley
and Woods 1999). It is therefore not possible to compare DHS infant mortality data
distributed by month of death with a model to ascertain with any certainty whether
deaths at one month appear overrepresented.
6
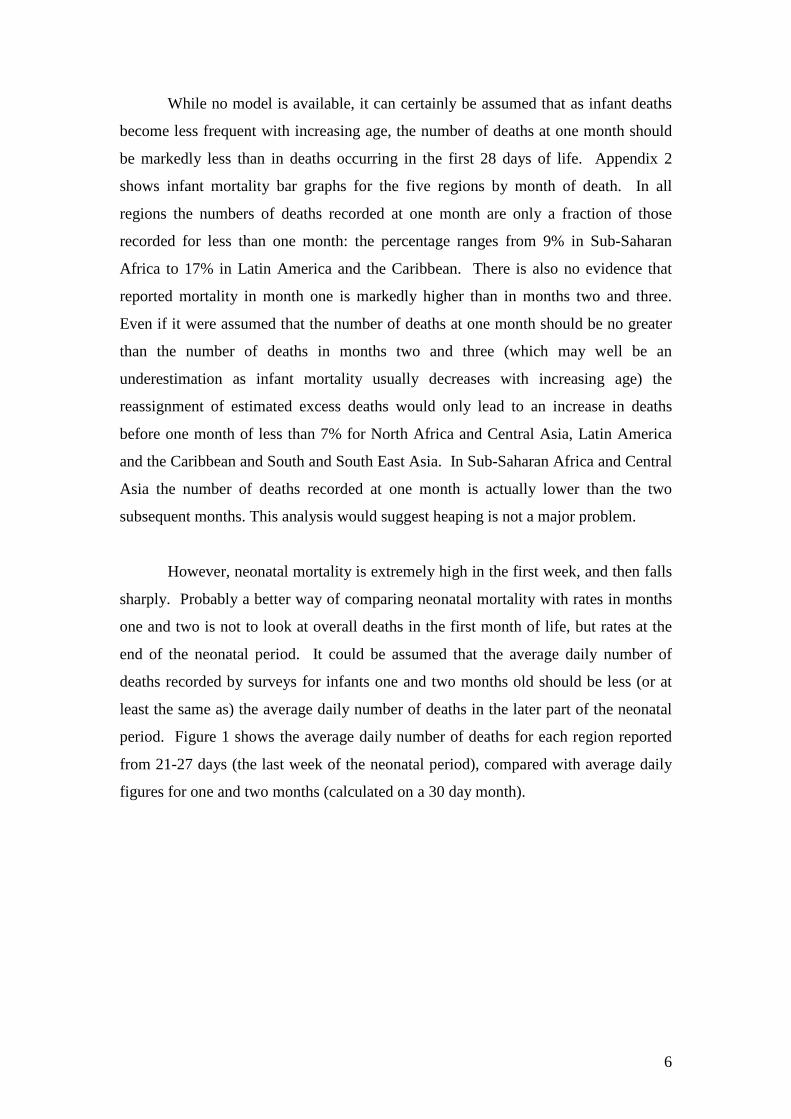
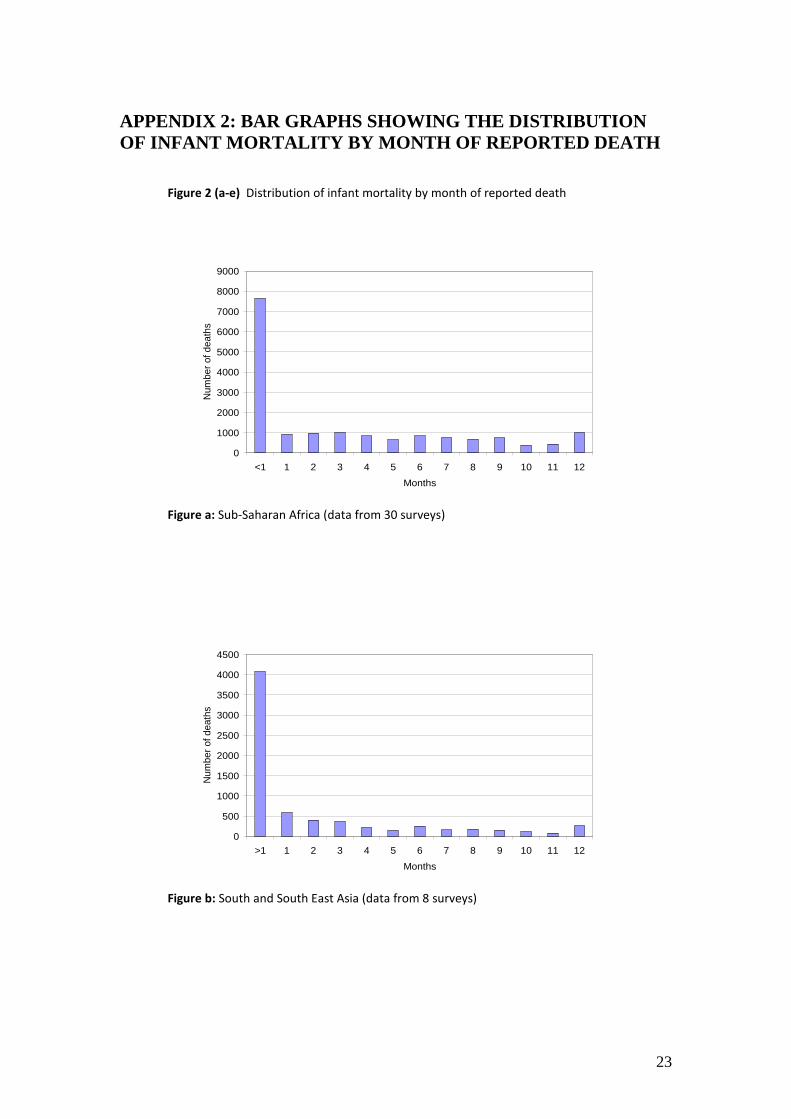
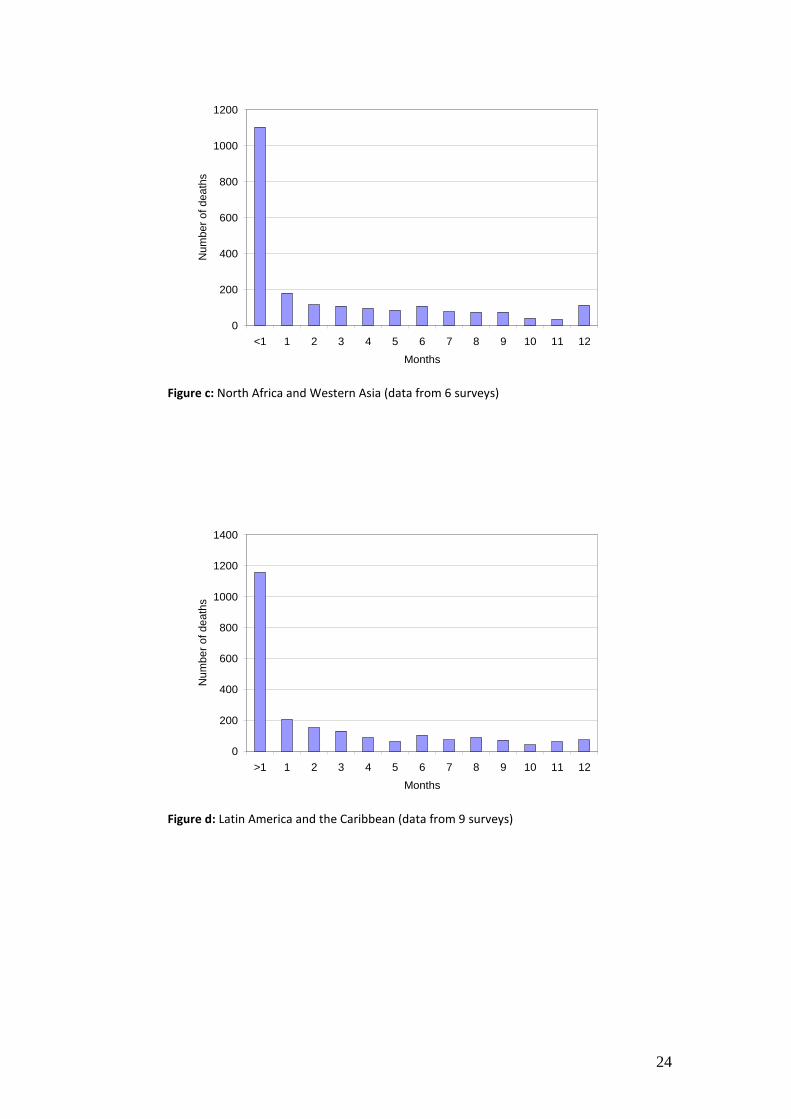
While no model is available, it can certainly be assumed that as infant deaths
become less frequent with increasing age, the number of deaths at one month should
be markedly less than in deaths occurring in the first 28 days of life. Appendix 2
shows infant mortality bar graphs for the five regions by month of death. In all
regions the numbers of deaths recorded at one month are only a fraction of those
recorded for less than one month: the percentage ranges from 9% in Sub-Saharan
Africa to 17% in Latin America and the Caribbean. There is also no evidence that
reported mortality in month one is markedly higher than in months two and three.
Even if it were assumed that the number of deaths at one month should be no greater
than the number of deaths in months two and three (which may well be an
underestimation as infant mortality usually decreases with increasing age) the
reassignment of estimated excess deaths would only lead to an increase in deaths
before one month of less than 7% for North Africa and Central Asia, Latin America
and the Caribbean and South and South East Asia. In Sub-Saharan Africa and Central
Asia the number of deaths recorded at one month is actually lower than the two
subsequent months. This analysis would suggest heaping is not a major problem.
However, neonatal mortality is extremely high in the first week, and then falls
sharply. Probably a better way of comparing neonatal mortality with rates in months
one and two is not to look at overall deaths in the first month of life, but rates at the
end of the neonatal period. It could be assumed that the average daily number of
deaths recorded by surveys for infants one and two months old should be less (or at
least the same as) the average daily number of deaths in the later part of the neonatal
period. Figure 1 shows the average daily number of deaths for each region reported
from 21-27 days (the last week of the neonatal period), compared with average daily
figures for one and two months (calculated on a 30 day month).

7
Figure 1: Average number of daily deaths based on estimates on two different time periods in the first, second and third months of life Source: Data is from DHS surveys 1990-2002.
Daily rates of mortality in the later neonatal period will vary greatly depending
on the period chosen because of heaping of data. Daily average rates have therefore
been calculated for two time periods: the “true” final week of the neonatal period
from 21-27 days, and a longer period (20-31 days), which strictly speaking exceeds
the neonatal period, but includes heaped deaths at 20 days (as well as more modest
heaping at 28 and 30 days). It can be seen that all regions have a lower number of
daily average deaths recorded in the surveys in the last week of the “true” neonatal
period than for one month. The second column shows the daily average calculated
from 20-31 days. Even using this estimate, South and South East Asia and Latin
America and the Caribbean still have a higher recorded number of average daily
deaths at one month (though I do not test to see if these differences are statistically
significant), suggesting that some deaths that should have been recorded as occurring
before one month may have been displaced. It is impossible to draw any firm
conclusions from this very cursory analysis and SEs may be large. However, as the
probable actual daily number of deaths occurring in the later part of the first month of
life probably lies somewhere between these two estimates displacement may be a
0
5
10
15
20
25
30
35
40
45
Latin America / Caribbean
South and South East
Asia Central and
Western Asia North Africa Sub Saharan
Africa Regions
Num
ber o
f dea
ths
repo
rted
Average number of daily deaths based on days 21-27 Average number of daily deaths based on 20-31 days Average number of daily deaths 1 month Average number of daily deaths 2 months
8
problem in some surveys, causing NMR to be under-reported. Further, more detailed
analysis would be worthwhile in order to develop stronger evidence on this issue as
this is obviously a potentially major error in the data.
4.2. INTERNAL CONSISTENCY IN DHS DATA
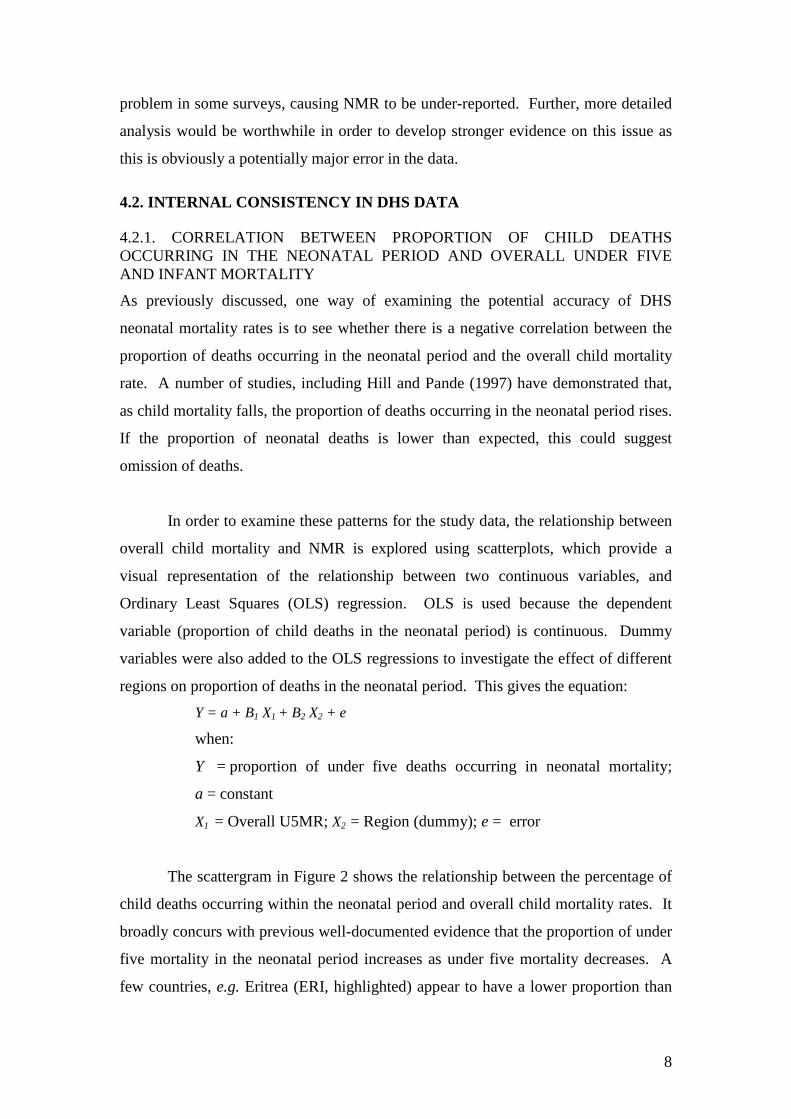
4.2.1. CORRELATION BETWEEN PROPORTION OF CHILD DEATHS OCCURRING IN THE NEONATAL PERIOD AND OVERALL UNDER FIVE AND INFANT MORTALITY
As previously discussed, one way of examining the potential accuracy of DHS
neonatal mortality rates is to see whether there is a negative correlation between the
proportion of deaths occurring in the neonatal period and the overall child mortality
rate. A number of studies, including Hill and Pande (1997) have demonstrated that,
as child mortality falls, the proportion of deaths occurring in the neonatal period rises.
If the proportion of neonatal deaths is lower than expected, this could suggest
omission of deaths.
In order to examine these patterns for the study data, the relationship between
overall child mortality and NMR is explored using scatterplots, which provide a
visual representation of the relationship between two continuous variables, and
Ordinary Least Squares (OLS) regression. OLS is used because the dependent
variable (proportion of child deaths in the neonatal period) is continuous. Dummy
variables were also added to the OLS regressions to investigate the effect of different
regions on proportion of deaths in the neonatal period. This gives the equation: Y = a + B1 X1 + B2 X2 + e
when:
Y = proportion of under five deaths occurring in neonatal mortality;
a = constant
X1 = Overall U5MR; X2 = Region (dummy); e = error
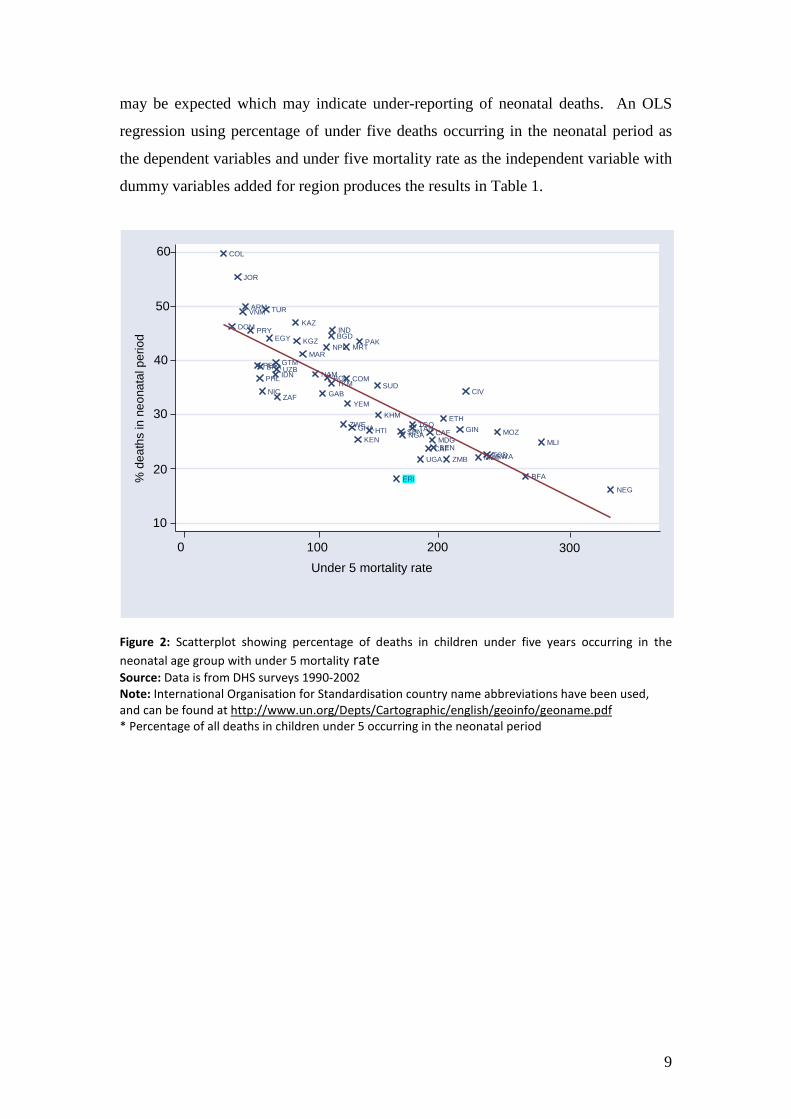
The scattergram in Figure 2 shows the relationship between the percentage of
child deaths occurring within the neonatal period and overall child mortality rates. It
broadly concurs with previous well-documented evidence that the proportion of under
five mortality in the neonatal period increases as under five mortality decreases. A
few countries, e.g. Eritrea (ERI, highlighted) appear to have a lower proportion than
9
may be expected which may indicate under-reporting of neonatal deaths. An OLS
regression using percentage of under five deaths occurring in the neonatal period as
the dependent variables and under five mortality rate as the independent variable with
dummy variables added for region produces the results in Table 1.
Figure 2: Scatterplot showing percentage of deaths in children under five years occurring in the neonatal age group with under 5 mortality rate Source: Data is from DHS surveys 1990-2002 Note: International Organisation for Standardisation country name abbreviations have been used, and can be found at http://www.un.org/Depts/Cartographic/english/geoinfo/geoname.pdf * Percentage of all deaths in children under 5 occurring in the neonatal period
ARM
JOR
KAZ KGZ
MAR
TUR
TKM UZB
YEM
EGY BGD IND
IDN
NPL
PHL
VNM
KHM
ERI
CAF BEN
BFA
CAF TCD
CIV
ETH
GAB
GHA GIN KEN MDG
MWI MLI
MRT
MOZ
NAM
NEG
NGA
RWA
SEN
ZAF
TAN TGO
UGA ZMB
ZWE
BOL
COL
DOM
GTM
HTI
NIC
PER
PRY
BRA
PAK
COM SUD
10
20
30
40
50
60
0 100 200 300 Under 5 mortality rate
% d
eath
s in
neo
nata
l per
iod

10
Unstandardised coefficients
B Std. Error
(Constant) 49.8 2.41 Under 5 mortality rate -0.11** 0.019 North Africa/Western Asia 2.08 2.76 Central Asia 0.01 2.89 Latin America/Caribbean -2.8 2.61
Sub-Saharan Africa -6.25** 2.43 Table 1: Results of OLS regression using U5MR and region as independent variables and % of under 5 deaths occurring in the neonatal period as dependent variable Note: *significant at 5% level ** significant at 1% level 57 observations. Adjusted r2 = 0.71 Reference category is South and South East Asia.
The results in Table 1 imply that Sub-Saharan Africa has a percentage of child
deaths occurring in the neonatal period approximately six percentage points lower
than South and South East Asia (the reference category) when adjusted for under five
mortality rate (though the confidence interval is quite wide). Other regions do not
vary significantly from the reference category. If the natural log of both the NMR and
under 5 mortality rate (U5MR) are used, the adjusted r2 is increases to 0.82 as the data
is non-linear.
There is also a strong correlation between infant and neonatal mortality rates
(r2 = 0.80) and this association increases further if the natural log of both IMR and
NMR is used (r2 = 0.86). An OLS regression using the natural log of NMR as the
dependent variable and natural log of IMR and dummy variables for region as the
independent variables produce the results found in Table 2:
Unstandardised coefficients
B Std. Error (Constant) 0.41 0.24 Log of IMR 0.75** 0.06 North Africa/Western Asia -0.04 0.07 Central Asia 0.09 0.07 Latin America/Caribbean -0.14* 0.06 Sub-Saharan Africa -0.08 0.07
Table 2: Results of OLS regression using natural log of IMR and region as independent variables and natural log NMR as dependent variable Note: *significant at 5% level ** significant at 1% level 57 observations. Adjusted r2 = 0.86 Reference category is South and South East Asia.
11
This implies that for every 10% decrease in IMR, NMR will on average
decrease by about 7.5%. Latin America and the Caribbean have a significantly lower
rate of NMR to IMR from the reference category (South and South East Asia).
4.2.2. THE PROPORTION OF EARLY TO LATE NEONATAL DEATHS
Boerma (1988, cited in Curtis 1995) suggested that at an NMR of 20 per 1000 or
more, approximately 70% of neonatal deaths occur in the first six days, and an
unexpected low proportion of early neonatal deaths could be a result of under-
reporting deaths in this age group. This would be expected as deaths in the later
neonatal period tend to decline earlier than those in the first week of life (Curtis 1995).
Hill and Choi (2006) plotted the ratio of early to late NMR in 108 DHS against IMR
and compared them with a reference line developed using data from England and
Wales 1905-19973. They found that data points for Asia, North Africa and Latin
America and the Caribbean were broadly scattered around the historic reference line.
In Sub-Saharan African countries there was a higher rate of early than late neonatal
deaths than within the model, and there was no apparent relationship with IMR
changes. Hill and Choi concluded from this that there is no evidence for substantial
omission of early neonatal deaths, but the lack of pattern in some parts of Sub-
Saharan Africa may be explained by a high degree of random error in the reporting of
age of death in days.
3 It is worth noting that Hill and Choi smoothed their data to account for the high levels of heaping at seven days before carrying out their analysis.
12
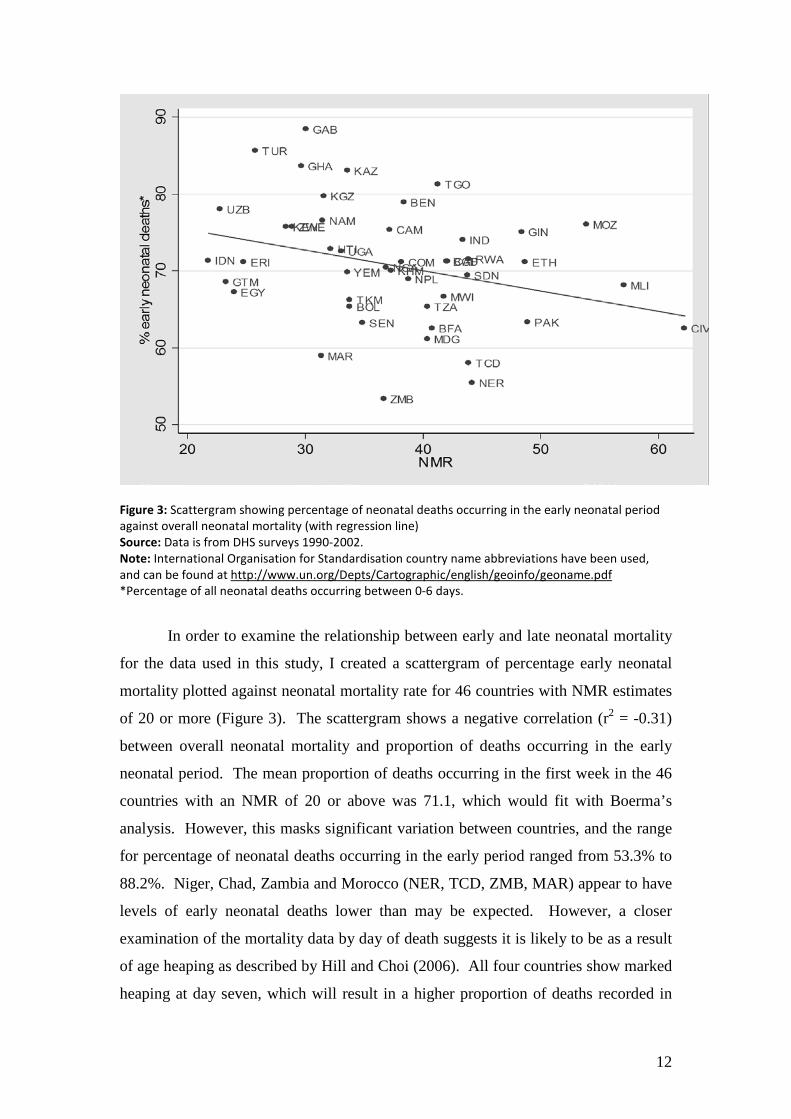
Figure 3: Scattergram showing percentage of neonatal deaths occurring in the early neonatal period against overall neonatal mortality (with regression line) Source: Data is from DHS surveys 1990-2002. Note: International Organisation for Standardisation country name abbreviations have been used, and can be found at http://www.un.org/Depts/Cartographic/english/geoinfo/geoname.pdf *Percentage of all neonatal deaths occurring between 0-6 days.
In order to examine the relationship between early and late neonatal mortality
for the data used in this study, I created a scattergram of percentage early neonatal
mortality plotted against neonatal mortality rate for 46 countries with NMR estimates
of 20 or more (Figure 3). The scattergram shows a negative correlation (r2 = -0.31)
between overall neonatal mortality and proportion of deaths occurring in the early
neonatal period. The mean proportion of deaths occurring in the first week in the 46
countries with an NMR of 20 or above was 71.1, which would fit with Boerma’s
analysis. However, this masks significant variation between countries, and the range
for percentage of neonatal deaths occurring in the early period ranged from 53.3% to
88.2%. Niger, Chad, Zambia and Morocco (NER, TCD, ZMB, MAR) appear to have
levels of early neonatal deaths lower than may be expected. However, a closer
examination of the mortality data by day of death suggests it is likely to be as a result
of age heaping as described by Hill and Choi (2006). All four countries show marked
heaping at day seven, which will result in a higher proportion of deaths recorded in
13
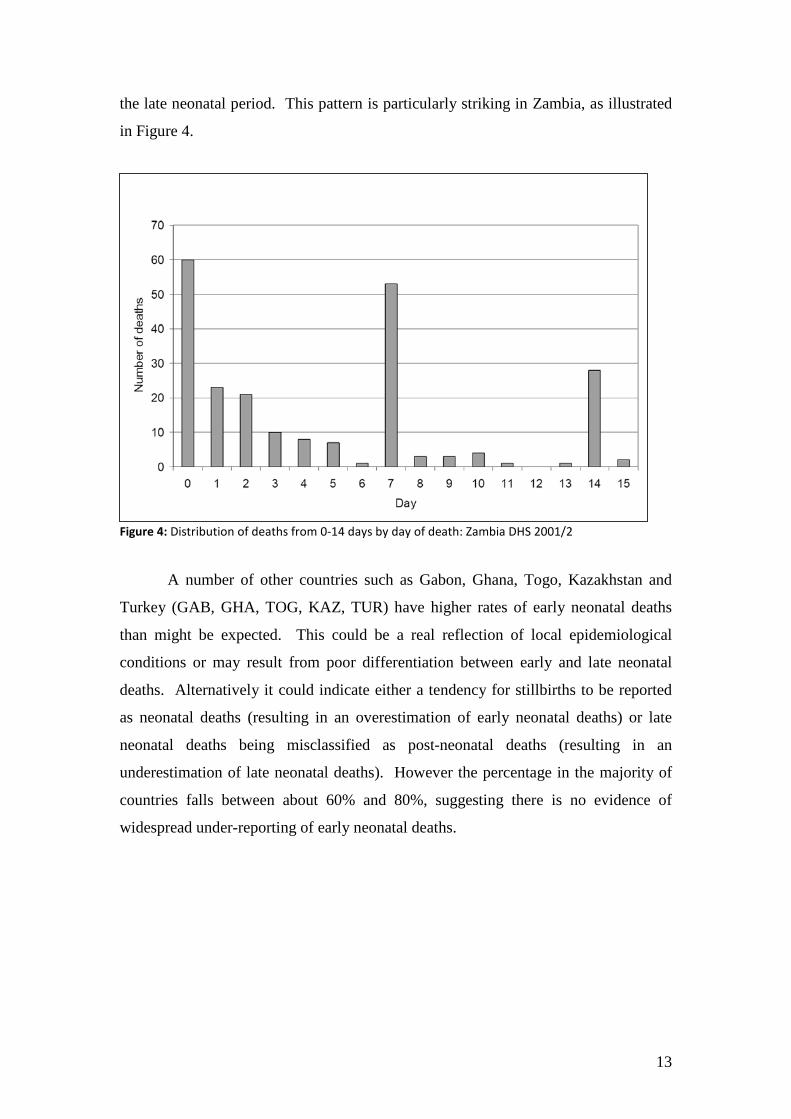
the late neonatal period. This pattern is particularly striking in Zambia, as illustrated
in Figure 4.
Figure 4: Distribution of deaths from 0-14 days by day of death: Zambia DHS 2001/2
A number of other countries such as Gabon, Ghana, Togo, Kazakhstan and
Turkey (GAB, GHA, TOG, KAZ, TUR) have higher rates of early neonatal deaths
than might be expected. This could be a real reflection of local epidemiological
conditions or may result from poor differentiation between early and late neonatal
deaths. Alternatively it could indicate either a tendency for stillbirths to be reported
as neonatal deaths (resulting in an overestimation of early neonatal deaths) or late
neonatal deaths being misclassified as post-neonatal deaths (resulting in an
underestimation of late neonatal deaths). However the percentage in the majority of
countries falls between about 60% and 80%, suggesting there is no evidence of
widespread under-reporting of early neonatal deaths.

14
4.2.3. COMPARISON OF RECALL DATA FROM 5-9 YEARS WITH 0-4 YEAR RECALL FROM EARLIER SURVEYS IN CORRESPONDING TIME PERIOD
Opportunities for external validation of the DHS data are extremely limited as few
other comparable direct estimates of national neonatal mortality exist. However, as
each survey records data on deaths up to 25 years before the date of the survey
divided into five-year time periods, data can be compared from different surveys
covering the same time period.
Table 4 shows 5-9 year recall data from the most recent surveys (1990-2002)
from 18 countries, along with 0-4 year recall data from preceding surveys undertaken
exactly five years previously, and therefore covering a corresponding period. The
difference between the two rates is also given.
Country Year of
first survey
Year of second survey
Recall data from 5-9 years prior to second survey
Data from 0-4 years from earlier survey in correspond-ing time period
Actual difference in rates (0-4 year recall estimate minus 5-9 year recall estimate)
% difference in rates (actual difference as % of 0-4 year recall estimates)
Morocco 1987 1992 36.5 41.5 5.0 12.0 Egypt 1995 2000 34.0 30.4 -3.6 -11.8 Turkey 1993 1998 30.1 29.2 -0.9 -3.1 Yemen 1991/2 1997 47.8 40.9 -6.9 -17.0 Nepal 1996 2001 56.5 49.9 -6.6 -13.2 Philippines 1993 1998 20.7 17.7 -3.0 -16.9 Colombia 1995 2000 17.8 18.7 0.9 4.8 Haiti 1994/5 2000 39.9 31.2 -8.7 -27.9 Benin 1996 2001 44.7 38.2 -6.5 -17.0 Cote d’Ivoire 1994 1998/9 48.7 42 -6.7 -16.0 Ghana 1993 1998 35.1 40.9 5.8 14.2 Kenya 1993 1998 25.5 25.7 0.2 0.7 Madagascar 1992 1997 40.7 39.2 -1.5 -3.8 Mali 1995/6 2001 79.3 60.4 -18.9 -31.3 Senegal 1992/3 1997 38.5 34.9 -3.6 -10.3 Uganda 1995 2000/1 37.1 27 -10.1 -37.4 Zambia 1996 2001/2 29.4 35.4 6.0 16.9 Zimbabwe 1994 1999 23.3 24.4 1.1 4.5
Table 4: Comparison of recall data from 5-9 years prior to most recent national studies and data from 0-4 years recall from earlier surveys in corresponding time period
15
The relatively large standard errors in NMR make comparisons somewhat
difficult: assuming the standard errors are similar for DHS data series across time,
sampling error could probably not be ruled out as an explanation of differences in any
of the countries. However, particular observed patterns suggest that this is not the full
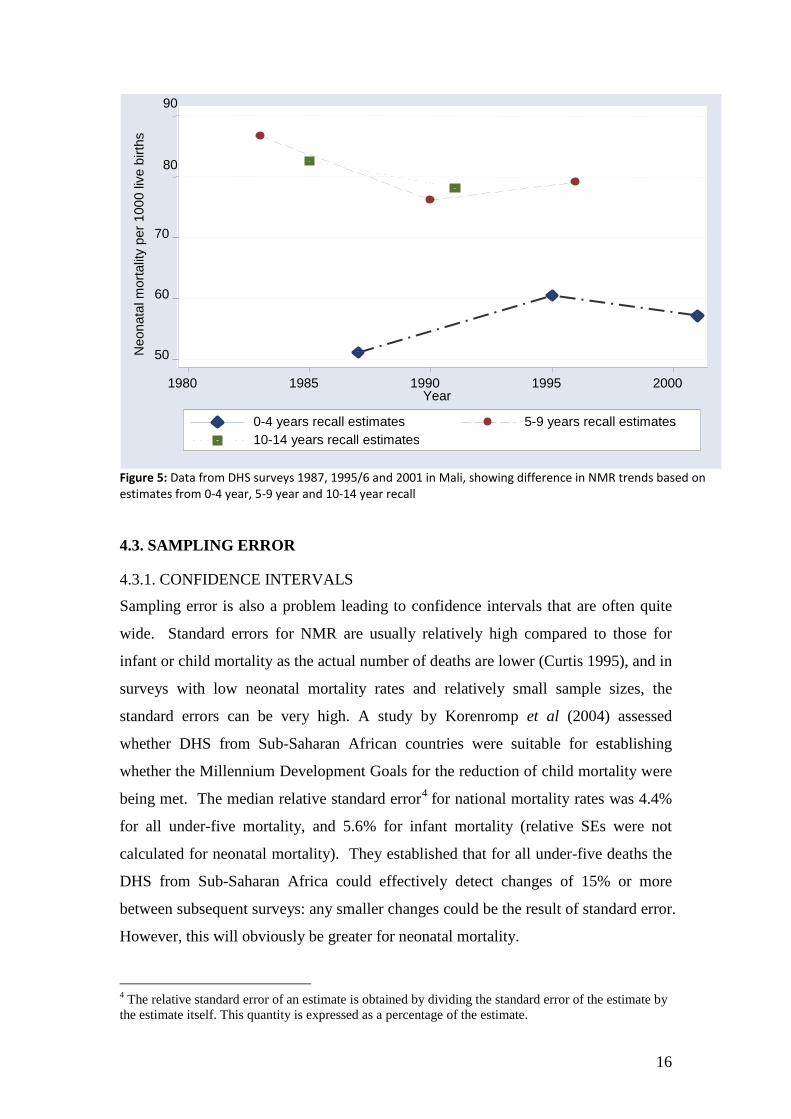
explanation for some of the larger differences. The rates recorded in the 5-9 year
recall period are higher than those from the 0-4 year period of the earlier study for 12
out of 18 countries (see Figure 5 for the difference in trends based on 0-4, 5-9 and 10-
14 year recall data in Mali). This pattern is particularly marked for countries with
marked differences in rate: only one of the eight countries with a difference in rates
over 15% has a larger estimate from 0-4 year than 5-9 year recall data. The opposite
may have been expected, as it has been suggested that event omission is more
common when the deaths occurred further back in time, which would lead to lower
estimates for the 5-9 year recall period (Curtis 1995). A probable explanation for the
observed pattern of higher estimates for 5-9 year recall is the phenomenon of
displacing births in time in order for interviewers to avoid asking the extensive series
of questions required for children born within five years of the survey. Arnold and
Blanc (1990) found strong evidence of this occurrence in Sub-Saharan Africa, which
could lead to underestimation of mortality rates. This is very concerning as it
suggests that rates of neonatal mortality in these countries may be even higher than
current estimates. It also raises doubts about the reliability of using recall data from
different periods to establish trends when more than one survey is not available.
16
Figure 5: Data from DHS surveys 1987, 1995/6 and 2001 in Mali, showing difference in NMR trends based on estimates from 0-4 year, 5-9 year and 10-14 year recall
4.3. SAMPLING ERROR
4.3.1. CONFIDENCE INTERVALS
Sampling error is also a problem leading to confidence intervals that are often quite
wide. Standard errors for NMR are usually relatively high compared to those for
infant or child mortality as the actual number of deaths are lower (Curtis 1995), and in
surveys with low neonatal mortality rates and relatively small sample sizes, the
standard errors can be very high. A study by Korenromp et al (2004) assessed
whether DHS from Sub-Saharan African countries were suitable for establishing
whether the Millennium Development Goals for the reduction of child mortality were
being met. The median relative standard error4 for national mortality rates was 4.4%
for all under-five mortality, and 5.6% for infant mortality (relative SEs were not
calculated for neonatal mortality). They established that for all under-five deaths the
DHS from Sub-Saharan Africa could effectively detect changes of 15% or more
between subsequent surveys: any smaller changes could be the result of standard error.
However, this will obviously be greater for neonatal mortality.
4 The relative standard error of an estimate is obtained by dividing the standard error of the estimate by the estimate itself. This quantity is expressed as a percentage of the estimate.
50
60
70
80
90
Neo
nata
l mor
talit
y pe
r 100
0 liv
e bi
rths
1980 1985 1990 1995 2000 Year
0-4 years recall estimates 5-9 years recall estimates 10-14 years recall estimates
17
Appendix 3 shows the NMR and estimations of standard error for 17 DHS II
Surveys as reported by Curtis (1995). The relative standard errors are particularly
large for some of the countries in Latin America, where NMR and numbers of births
recorded by the survey are relatively low. For example, the 95% confidence intervals
for the Dominican Republic (estimated NMR 23.7 per 1000 live births) from 16.3-
31.2. In some cases, the relative standard errors for neonatal mortality are more than
twice that found for the U5MR: For Burkina Faso and Zambia the relative standard
errors for under five mortality rates are 0.033 and 0.036, whereas for NMR they are
0.081 and 0.068 respectively (Curtis 1995). This raises real issues about the accuracy
of estimating rates of change or comparisons between countries from DHS data, and
relatively small observed changes over time could actually be the result of sampling
error rather than real progress.
In addition sampling error makes comparisons of NMR between sub-samples
extremely difficult as standard errors will be further increased within the subgroups
and only very large differences will be statistically significant.
4.3.2. SAMPLING BIAS
Sampling bias will be an issue if certain sectors of the population are under-
represented in the survey. A potential cause of bias is that DHS use women of
reproductive age as the basic sampling unit, so children without living mothers are
excluded from the survey. Studies in resource-poor countries suggest that death of the
mother commonly results in death of the child, and this risk is particularly strong for
the newborn. A study of maternal mortality in the Jamalpur district of Bangladesh
found that of the 21 babies live-born to women who subsequently died, all were dead
by 28 days (Khan et al 1986). Another larger study also in Bangladesh (Matlab
district) showed less dramatic results, but still found that only 65% of infants born
alive to mothers who died survived until one month, compared with 94.4% who
survived in the control group of infants with living mothers (Koenig et al 1988)5. This
link may lead to an under-reporting of newborn deaths, particularly in countries where
maternal mortality is high. A study by Artzrouni and Zaba (2003 cited in Mahy
2003a) which examined the bias produced by AIDS when using direct estimation
5 The differences in these studies may at least be partly due to variation in overall NMR between the two study areas.
18
techniques for child mortality suggests that while there is likelihood of under-
reporting, it is only of a magnitude of 5-7% at most. However, further work would be
useful to ascertain if there is any specific bias in NMR data caused by maternal death,
and particularly whether estimates in countries that have extremely high all-cause
maternal mortality may be more severely affected.
5. CONCLUSION: HOW RELIABLE ARE DHS ESTIMATES FOR NEONATAL MORTALITY? While DHS estimates of neonatal mortality are subject to a number of both sampling
and non-sampling errors, they are, for many countries, the only viable source of direct
estimation of NMR. There is little evidence that inaccuracies are widespread or
severe enough to render the data of no value, though sampling and non-sampling
errors suggest they are most appropriate for identifying general trends rather than
detailed information on specific countries, or family-level analysis of determinants.
Accuracy of estimated neonatal mortality rates from the DHS, particularly in
the absence of other national level surveys to provide external validation, are difficult
to determine with any certainty. Probably one of the greatest limitations of the DHS
data is the wide confidence intervals. This makes it difficult to use DHS data to
detect relatively small changes over time, and means that any estimation of rate of
change or comparison between countries needs to be interpreted with caution. One
possible way of reducing confidence intervals for DHS would be to increase the
sample size, and in recent years surveys from the more recent series have markedly
larger samples. However, this would have serious financial and practical
considerations, and increasing sample size to a degree which would significantly
reduce standard errors is probably unlikely. Korenromp et al (2004) suggest that one
possible solution would be to have an additional shortened survey identifying child
mortality, which could be administered to a greater number of clusters.
There is some evidence that a proportion of neonatal deaths may be omitted in
some countries. Probably the two most concerning non-sampling errors identified are
possible back-dating of deaths which lead to underestimation of deaths, and possible
age heaping at one month (though further analysis of this potential problem is
19
required). Both of these problems could at least partially be reduced by improved
training and supervision of survey staff. In recent years interviewers have been
trained to probe for the child’s exact age at death if the death occurs at one year to
avoid heaping at this age (Mahy 2003), and a similar approach could be used to
reduce heaping of deaths reported at seven days or one month.
Analysis of change in the proportion of deaths occurring at one day produced
ambiguous results. In general countries that had experienced a marked fall in
mortality did experience the expected increase in proportion of mortality on day one.
However, the findings for Sub-Saharan Africa were more conflicting. This may be
because the changes in rate were too small to be reflected in corresponding changes in
proportion, or reflect data inaccuracies. However, it must be remembered that the
causes underlying the increases in mortality in many countries within this region are
not fully explained, and patterns may not be conforming to what is expected: i.e. a
higher proportion of the excess deaths could be occurring in the very early neonatal
period. More analysis should be carried out on this before it is used as a tool for
verifying change.
In the medium term it may also be necessary to rely on process indicators for
monitoring short-term changes brought about through national programmes.
Calculations of these rates from survey data have much greater levels of precision
than relatively “rare” events such as child deaths. A number of indicators have been
identified, including antenatal attendance, skilled attendance at delivery, tetanus
toxoid vaccination, postnatal care and breastfeeding rates. While all these
interventions or packages of intervention have strong evidence of impact on neonatal
mortality, further research is needed to quantify the level of potential impact of some
of these in practice, and how this will vary in different settings and scenarios.
20
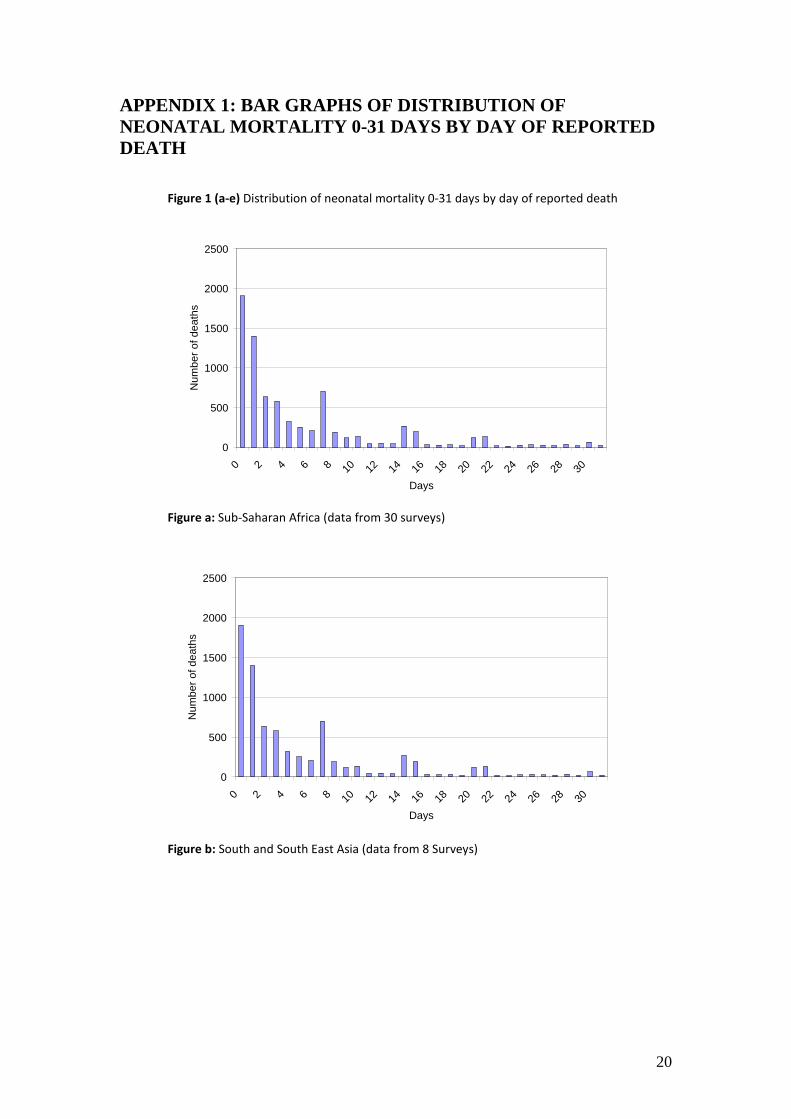
APPENDIX 1: BAR GRAPHS OF DISTRIBUTION OF NEONATAL MORTALITY 0-31 DAYS BY DAY OF REPORTED DEATH
Figure 1 (a-e) Distribution of neonatal mortality 0-31 days by day of reported death
Figure a: Sub-Saharan Africa (data from 30 surveys)
Figure b: South and South East Asia (data from 8 Surveys)
0
500
1000
1500
2000
2500
0 2 4 6 8 10 12 14 16 18 20 22 24 26 28 30
Days
Num
ber o
f dea
ths
0
500
1000
1500
2000
2500
0 2 4 6 8 10 12 14 16 18 20 22 24 26 28 30
Days
Num
ber o
f dea
ths
21
Figure c: North Africa and Western Asia (data from 6 surveys)
Figure d: Latin America and the Caribbean (data from 9 surveys)
0
50
100
150
200
250
0 2 4 6 8 10 12 14 16 18 20 22 24 26 28 30Day
Num
ber o
f dea
ths
0
50
100
150
200
250
300
0 2 4 6 8 10 12 14 16 18 20 22 24 26 28 30
Day
Num
ber o
f dea
ths
22
Figure e: Central Asia (data from 4 surveys)
0
5
10
15
20
25
30
35
40
45
50
0 2 4 6 8 10 12 14 16 18 20 22 24 26 28 30
Days
Num
ber o
f dea
ths
23
APPENDIX 2: BAR GRAPHS SHOWING THE DISTRIBUTION OF INFANT MORTALITY BY MONTH OF REPORTED DEATH
Figure 2 (a-e) Distribution of infant mortality by month of reported death
Figure a: Sub-Saharan Africa (data from 30 surveys)
Figure b: South and South East Asia (data from 8 surveys)
0
1000
2000
3000
4000
5000
6000
7000
8000
9000
<1 1 2 3 4 5 6 7 8 9 10 11 12Months
Num
ber o
f dea
ths
0
500
1000
1500
2000
2500
3000
3500
4000
4500
>1 1 2 3 4 5 6 7 8 9 10 11 12Months
Num
ber o
f dea
ths
24
Figure c: North Africa and Western Asia (data from 6 surveys)
Figure d: Latin America and the Caribbean (data from 9 surveys)
0
200
400
600
800
1000
1200
<1 1 2 3 4 5 6 7 8 9 10 11 12Months
Num
ber o
f dea
ths
0
200
400
600
800
1000
1200
1400
>1 1 2 3 4 5 6 7 8 9 10 11 12Months
Num
ber o
f dea
ths
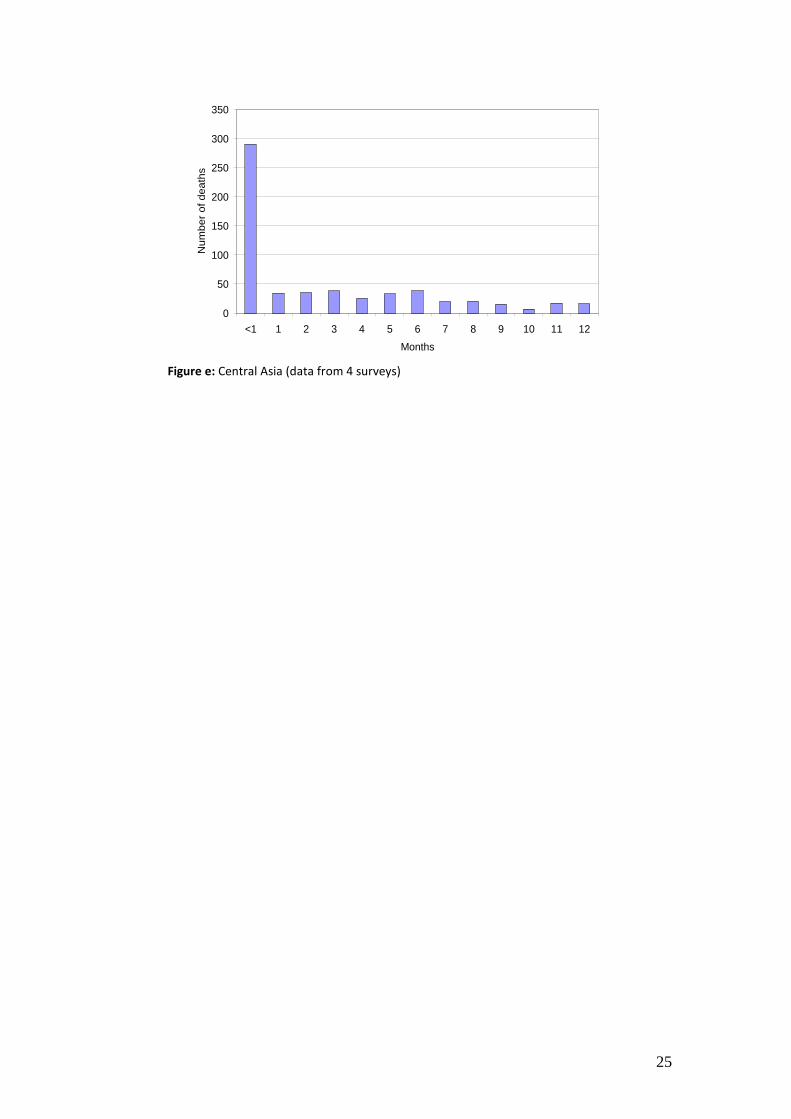
25
Figure e: Central Asia (data from 4 surveys)
0
50
100
150
200
250
300
350
<1 1 2 3 4 5 6 7 8 9 10 11 12Months
Num
ber o
f dea
ths
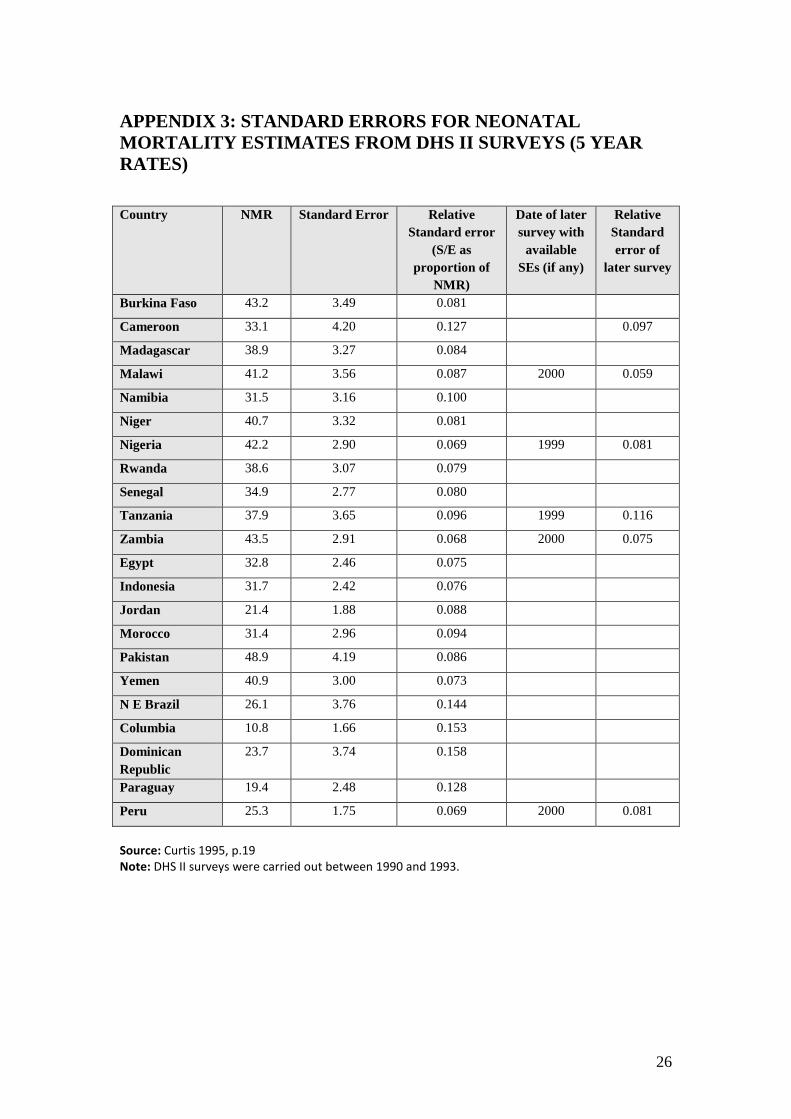
26
APPENDIX 3: STANDARD ERRORS FOR NEONATAL MORTALITY ESTIMATES FROM DHS II SURVEYS (5 YEAR RATES) Country NMR Standard Error Relative
Standard error (S/E as
proportion of NMR)
Date of later survey with
available SEs (if any)
Relative Standard error of
later survey
Burkina Faso 43.2 3.49 0.081
Cameroon 33.1 4.20 0.127 0.097
Madagascar 38.9 3.27 0.084
Malawi 41.2 3.56 0.087 2000 0.059
Namibia 31.5 3.16 0.100
Niger 40.7 3.32 0.081
Nigeria 42.2 2.90 0.069 1999 0.081
Rwanda 38.6 3.07 0.079
Senegal 34.9 2.77 0.080
Tanzania 37.9 3.65 0.096 1999 0.116
Zambia 43.5 2.91 0.068 2000 0.075
Egypt 32.8 2.46 0.075
Indonesia 31.7 2.42 0.076
Jordan 21.4 1.88 0.088
Morocco 31.4 2.96 0.094
Pakistan 48.9 4.19 0.086
Yemen 40.9 3.00 0.073
N E Brazil 26.1 3.76 0.144
Columbia 10.8 1.66 0.153
Dominican Republic
23.7 3.74 0.158
Paraguay 19.4 2.48 0.128
Peru 25.3 1.75 0.069 2000 0.081
Source: Curtis 1995, p.19 Note: DHS II surveys were carried out between 1990 and 1993.
27
REFERENCES Aleshina, N. and Redmond, G. (2005) How high is infant mortality in Central and Eastern
Europe and the Commonwealth of Independent States? Population Studies; 59, pp. 39-54.
Arnold, F. and Blanc, A. (1990) Fertility Levels and Trends. DHS Comparative Studies 2, Institute for Resource Development/Macro.
Artzrouni, M. and Zaba, B. (2003) HIV included bias in the estimation of child mortality using birth history reports. Presented at the Technical Meeting on HIV and Child Mortality, London March, 2003.
Bang, A. Reddy, M. and Deshmukh, M. (2002) Comparative review of official statistics on child mortality rates in Maharashtra, India Economic and Political Weekly, Dec 7, 2002.
Bang, A. Bang, R. Baitule, S. Deshmukh, M. and Reddy, M. (2001) Burden of morbidities and the unmet need for health care in rural neonates — a prospective observational study in Gadchiroli, India. Indian Pediatrics; 38: pp. 952−964.
Bhatt, P. (2002) Completeness of India's sample registration system: an assessment using the general growth balance method. Population Studies; 56:119-34.
Boerma, T. (1998) Monitoring and Evaluation of Health Interventions: Age- and Cause- specific Mortality and Morbidity in Childhood. In Research and Intervention Issues Concerning Infant and Child Mortality and Health: Proceeding of the East Africa Workshop, International Development Research Centre, Manuscript Report 200e, Ottawa, Canada.
Bourgeois-Pichat, J. (1952) An analysis of infant mortality. Population Bulletin of the United Nations, 1952, 2, pp. 1-14.
Curtis, S. (1995) An Assessment of the quality of data used for direct estimation of infant and child mortality in DHS II surveys. Demographic and Health Surveys Occasional Paper No 3, Macro International Inc.
Galley, C. and Woods, R. (1999) On the Distribution of Deaths during the First Year of Life. Population., 11, 35-59.
Hill, K. and Amouzou, A. (2006) Trends in Child Mortality, 1960-2000. In Jamison T., Ros E., Feachem R., Malegapuru M. (eds). Disease and Mortality in Sub-Saharan Africa. World Bank Publications
Hill, K. and Choi, Y. (2006) Neonatal Mortality in the Developing World. Demographic Research, 14 (18).
Hill, K. and Pande, K. (1997) The Recent Evolution of Child Mortality in the Developing World. Child Survival Paper/BASICS series. http://www.basics.org/publications/abs/abs_papers_hill.html
Korenromp, E. Arnold, F. Williams, B. Nahlen, B. and Snow, R. (2004) Monitoring Trends in under-5 mortality rates through national birth history surveys. International Journal of Epidemiology, 33 (6), pp. 1293-1301.
Mahy, M. (2003) Measuring Child Mortality in AIDS-Affected Countries, A Report of Workshop on HIV/AIDS and Adult Mortality in Developing Countries, Population Division, United Nations Secretariat http://www.un.org/esa/population/publications/adultmort/UNICEF_Paper15.pdf
Morris, S. Black, R. and Tomaskovic L. (2003) Predicting the distribution of under-five deaths by cause in countries without adequate vital registration. International Journal of Epidemiology; 32, pp 1041–51
Rutstein, S. (1983) Infant and Child Mortality: Levels and Trends and Demographic Differentials. World Fertility Survey Comparative Studies, no 2. Voorburg: International Statistical Institute.

28
You, D. Jones, G. et al. (2010). Levels & trends in child mortality: estimated developed by the UN Inter-agency Group for Child Mortality Estimation. New York, UNICEF.

ESRC Centre for Population ChangeBuilding 58, Room 2001Faculty of Social and Human SciencesUniversity of SouthamptonSO17 1BJ
T: +44 (0)2380 592579E: [email protected]
To subscribe to the CPC newsletter and keep up-to-date with research activity, news and events, please register online: www.cpc.ac.uk/newsletter
You can also follow CPC on Twitter, Facebook and Mendeley for our latest research and updates:
The ESRC Centre for Population Change (CPC) is a joint initiative between the University of Southampton and a consortium of Scottish universities including St Andrews, Edinburgh, Stirling and Strathclyde, in partnership with the Office for National Statistics and National Records of Scotland.
Facebook “f ” Logo CMYK / .eps Facebook “f ” Logo CMYK / .eps
www.facebook.com/CPCpopulation
www.twitter.com/CPCpopulation
www.mendeley.com/groups/3241781/centre-for-population-change