David Wootton, University of York Innovation and Replication -- Memes, Mimesis and Measurement.
Upload
dionysus-daleCategory
view
33download
0description

The measurement of Innovation
• An historical perspective
• The “Frascati Manual” and the “Oslo Manual”
• S&T indicators
• Innovation indicators
• Some evidence from innovation surveys
• Concluding remarks

Period 1960's-1970's 1980's-early1990's
1990's - nextmillennium
Model Linear model Chain-linkedmodel
Systemsapproaches
Conception Simple Complex Extremelycomplex
Number ofindicators
Few(R&D, patents,TBP)
Many(R&D, patents,bibliometrics,innovation, hightech products,humanresources)
Too many(combinationsof existing andpossibly newindicators,quantitative/qualitative)
Development of indicators

The linear model
• Research-based
• Sequential
• Tecnocratic

“The Chain Link Model”
Chain Linked Model of Innovation
Potential Markets
Invention/analytical design
Detailed design & Test
Re-design & Production
Distribution & market
Knowledge
Research
Kline & Rosenberg
Technology platforms
BUS
“Communities of practice”

The exponential growth of S&T indicators at the international level
Decades 50s and 60s 70s 80s 90s
Main indicators used Re&D Re&D Re&D Re&DPatents Patents PatentsTechnological balance Technological balance Technological balanceof payments of payments of payments
High-tech products High-tech productsand sectors and sectorsBibliometrics BibliometricsHuman resources Human resources
Innovation surveys Innovation surveysInnovations mentioned intechnical literatureSurveys of productiontechnologiesGovernment support toindustrial technologyIntangible investmentIndicators of informationand communication technologiesInput-Output matrixes *Productivity *Venture capital *Mergers and acquisitions *
* Indicators mutuated from economic analysis.


Definition of research and development (Frascati Manual)
• R&D is defined as creative work undertaken on a systematic basis in order to increase the stock of knowledge including knowledge of man, culture and society, and the use of this stock of knowledge to devise new applications.
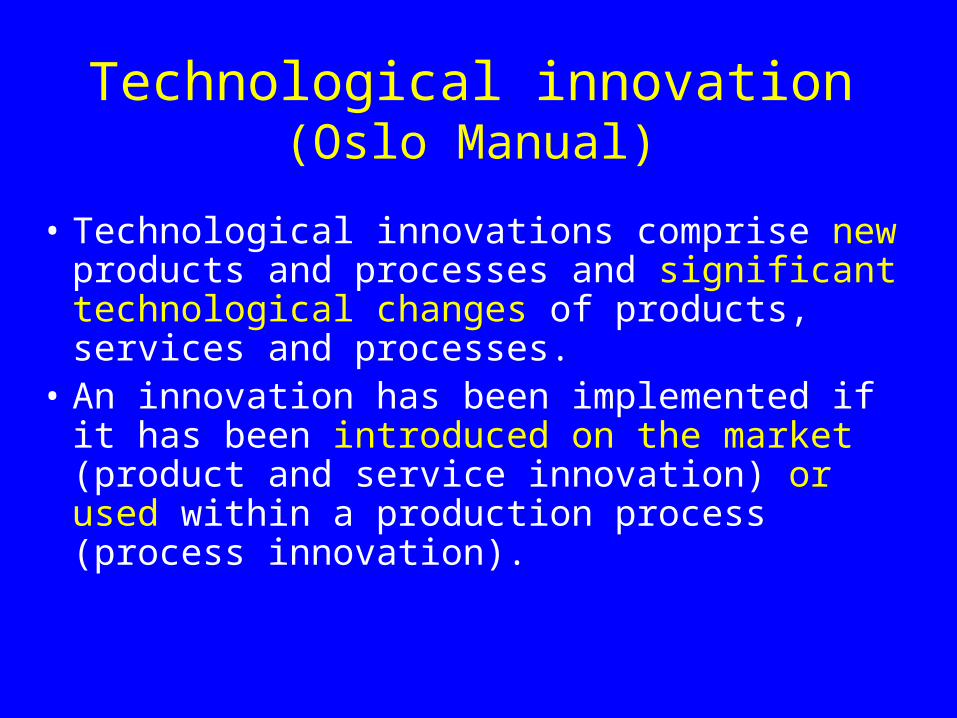
Technological innovation(Oslo Manual)
• Technological innovations comprise new products and processes and significant technological changes of products, services and processes.
• An innovation has been implemented if it has been introduced on the market (product and service innovation) or used within a production process (process innovation).

Technological innovation(Oslo Manual)
• Innovations involve a series of scientific, technological, organisational, financial and commercial activities.
• The product or process should be new (or rignificantly improved) to the firm (it does not necessarily have to be new to the relevant market)
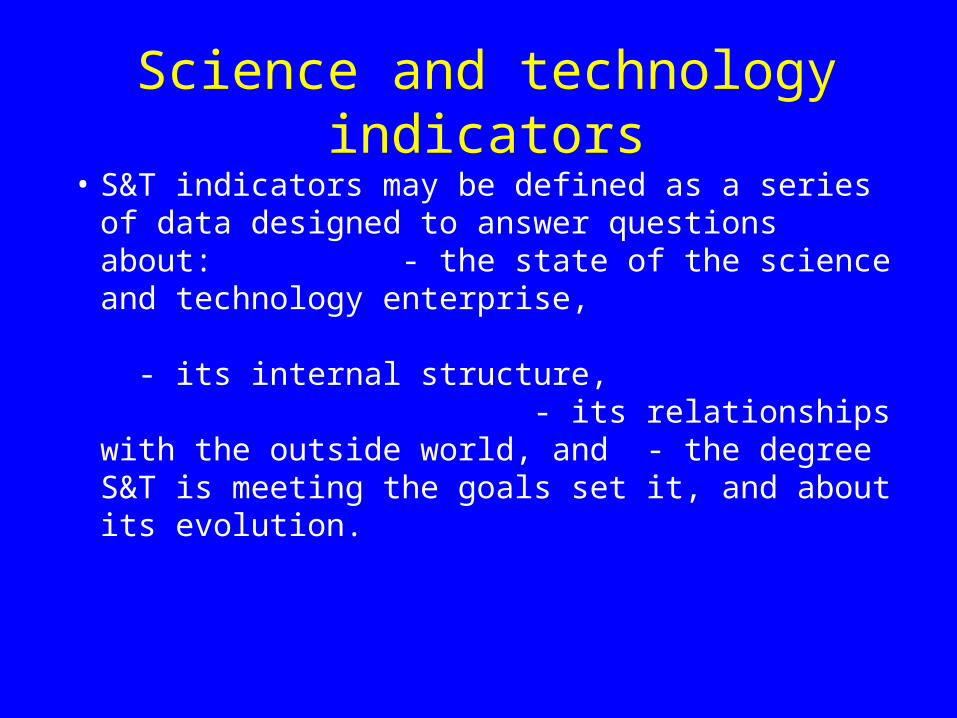
Science and technology indicators
• S&T indicators may be defined as a series of data designed to answer questions about: - the state of the science and technology enterprise, - its internal structure, - its relationships with the outside world, and - the degree S&T is meeting the goals set it, and about its evolution.

Science and technology indicators
• Statistical data are the basic elements (atoms) with which indicators (molecules) are constructed.
• The questions indicators have to answer concern aspects which can be tacked using quantitavive techniques.

Science and technology indicators
• R&D
• Patents
• Bibliometrics
• Technological balance of payments
• Human resources for S&T
• Trade in high-tech products

Resources: Scale vs Intensity
R&D Expenditure (OECD)
Sweden
Finland Japan
France
Germanythe Netherlands
Denmark
UK
US
Belgium
Austria
Ireland
Italy
SpainPortugal
Greece
0
0,005
0,01
0,015
0,02
0,025
0,03
0,035
0,04
100 1000 10000 100000 1000000
Scale- Total Expenditure in R&D ($PPP; logarithmic scale)
Inte
nsi
ty-
Sh
are
of
GD
P s
pen
t o
n R
&D
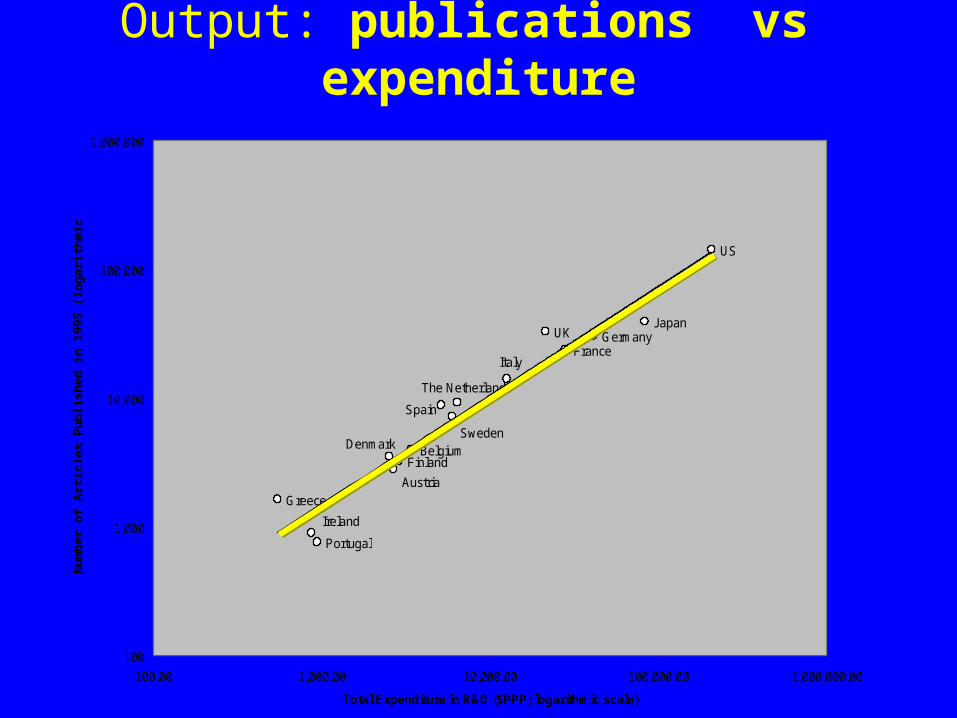
Output: publications vs expenditure
US
JapanGermany
France
UK
Italy
Spain
The Netherlands
SwedenBelgium
Finland
Denmark
Austria
Ireland
Portugal
Greece
100
1,000
10,000
100,000
1,000,000
100.00 1,000.00 10,000.00 100,000.00 1,000,000.00
Total Expenditure in R&D ($PPP; logarithmic scale)
Num
ber
of A
rtic
les
Pub
lishe
d in
199
5 (lo
gari
thm
ic s
cale
)

Scientific and technological Scientific and technological capacities in OECDcapacities in OECD
0.00 0.10 0.20 0.30 0.40 0.50 0.60Patents/R&D spending by com panies (m illion PPS, 1987 prices)
0
2
4
6
8
10
12
Pu
blic
atio
ns/
no
n-B
ER
D(m
illio
n S
PP
, 198
7 p
rice
s)
GR
PT
ES
FR IT
BE
SE
UK DK
EU
ADE
FI USNL
JP
IRL
Fonte: Caracostas & Muldur (1998)

Main indicators from innovation surveys
• Number of innovating firms– by sector– by firm size
• Cost of innovation
• Percentage of sales due to new products

The Community Innovation Survey (CIS)The harmonised EU/OECD questionnaire
• General information about the firm
• Type of innovation (product, process)
• Sources of information for innovation
• Objectives of innovation
• Factors hampering innovation
• Cost of innovation
• Impact of innovation

Innovation in EUsource: Community Innovation Survey, OCT-PT
IrelandAustria
Germany
Netherlands
UK
Sweden
Norway
France
Luxembourg
Finland
Belgium
Portugal
0%
20%
40%
60%
80%
100%
0% 20% 40% 60% 80% 100%
Share of Innovative Firms in Manufacturing
Sh
are
of
Inn
ova
tive
Fir
ms
in S
ervi
ces
The Community Innovation Survey (CIS)The harmonised EU/OECD questionnaire
• R&D
• Cooperation in innovation
• User sector of innovation
• Public policies for innovation
• Impact of innovation on employment, the environment, firm’s organisation

Innovative firms in manufacturing and services in Italy (1990-92)
25,9
65,1
79
40,8
48
58,5
31,0
38,6
43,4
50,9
25,9
84,3
33,1
74
0 20 40 60 80 100
20-44
50-99
100-199
200-499
500-999
1,000 over
Total
Services Manufacturing
Institute for Studies on Scientific Research and Documentation National Research Council of Italy
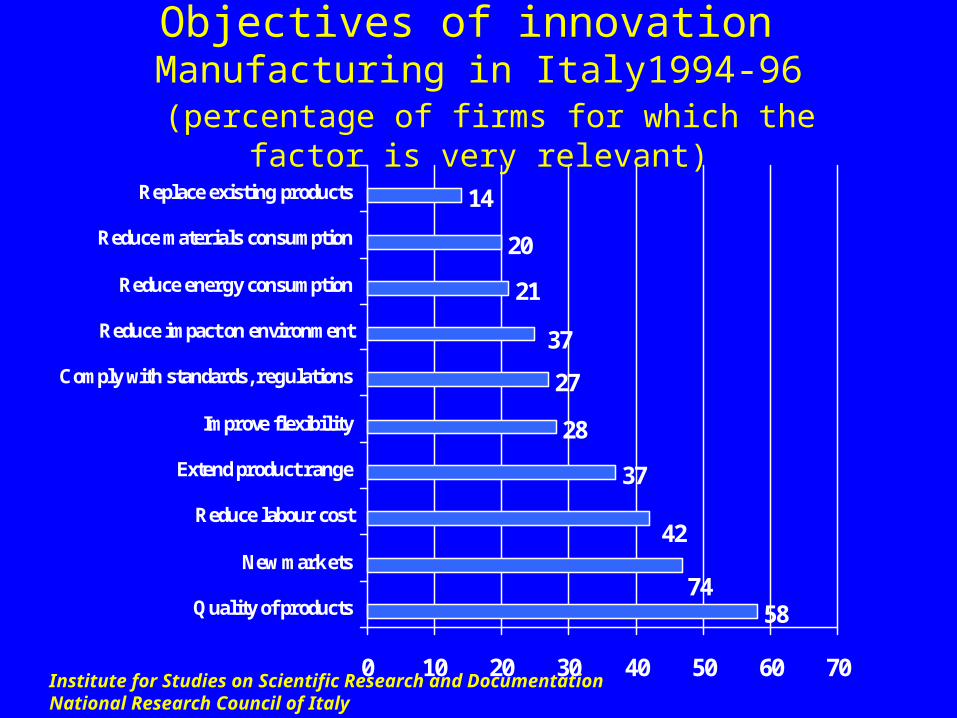
58
28
27
21
20
14
37
74
42
37
0 10 20 30 40 50 60 70
Quality of products
New markets
Reduce labour cost
Extend product range
Improve flexibility
Comply with standards, regulations
Reduce impact on environment
Reduce energy consumption
Reduce materials consumption
Replace existing products
Objectives of innovation Manufacturing in Italy1994-96
(percentage of firms for which the factor is very relevant)
Institute for Studies on Scientific Research and Documentation National Research Council of Italy

55
28
28
13
13
11
14
39
29
0 10 20 30 40 50 60
Cost too high
Risk too high
Lack of financing
Standards, regulations
Lack of qualified personnel
Comply with standards, regulations
Lack of interest from customers
Lack of information on markets
Lack of information on technologies
Organisational rigidity of the firm
Obstacles to innovation Manufacturing in Italy1994-96
(percentage of firms for which the factor is relevant)
42
Institute for Studies on Scientific Research and Documentation National Research Council of Italy
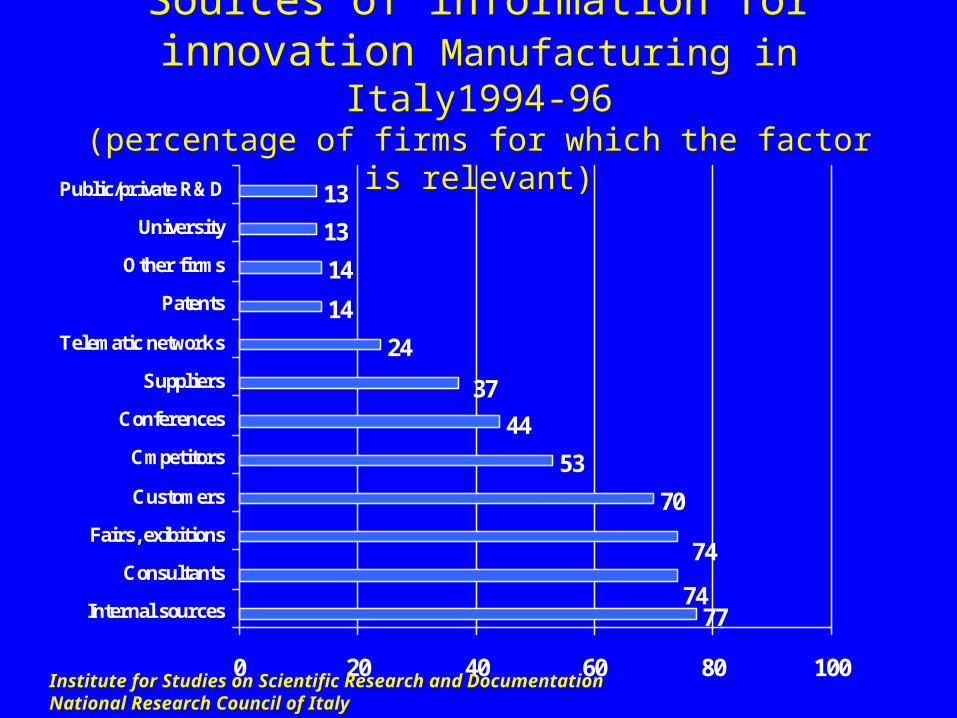
77
53
44
24
14
14
13
13
37
74
74
70
0 20 40 60 80 100
Internal sources
Consultants
Fairs, exibitions
Customers
Cmpetitors
Conferences
Suppliers
Telematic networks
Patents
Other firms
University
Public/private R&D
Sources of information for innovation Manufacturing in Italy1994-96
(percentage of firms for which the factor is relevant)
Institute for Studies on Scientific Research and Documentation National Research Council of Italy

29
50
57
63
68
62
33
39
48
0 10 20 30 40 50 60 70 80
Leather, footware
Apparel
Textiles
Printing, publishing
Average manufacturing
Electrical engineering
Chemicals
Mechanical engineering
Office machinery
Innovating firms in manufacturing in Italy (1994-96)
Institute for Studies on Scientific Research and Documentation National Research Council of Italy

Cost of innovation (percentage) - Italy (1990-92)
Computers Chemicals Textiles Clothing
R&D 65 43 12 16
Design engineering 22 9 18 38
Production investment 12 44 68 27
Marketing 1 4 2 19
Total 100 100 100 100
Institute for Studies on Scientific Research and Documentation National Research Council of Italy
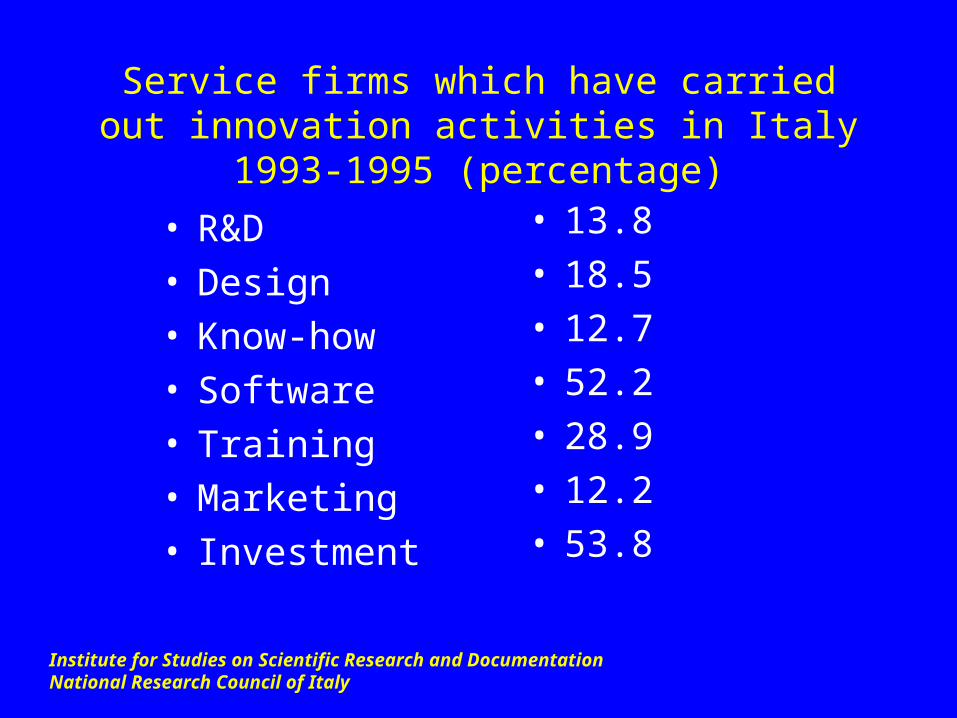
Service firms which have carried out innovation activities in Italy 1993-1995 (percentage)
• R&D• Design• Know-how• Software• Training• Marketing• Investment
• 13.8• 18.5• 12.7• 52.2• 28.9• 12.2• 53.8
Institute for Studies on Scientific Research and Documentation National Research Council of Italy
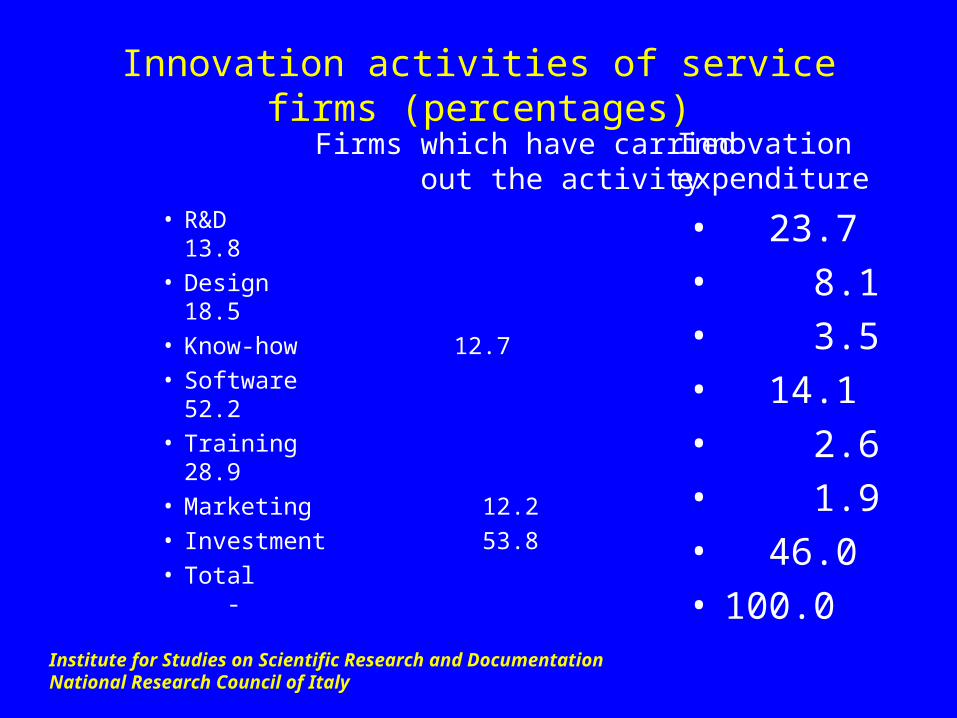
Innovation activities of service firms (percentages)
• R&D 13.8• Design 18.5• Know-how 12.7• Software 52.2• Training 28.9• Marketing 12.2• Investment 53.8• Total -
• 23.7• 8.1• 3.5• 14.1• 2.6• 1.9• 46.0• 100.0
Firms which have carried out the activity
Innovationexpenditure
Institute for Studies on Scientific Research and Documentation National Research Council of Italy
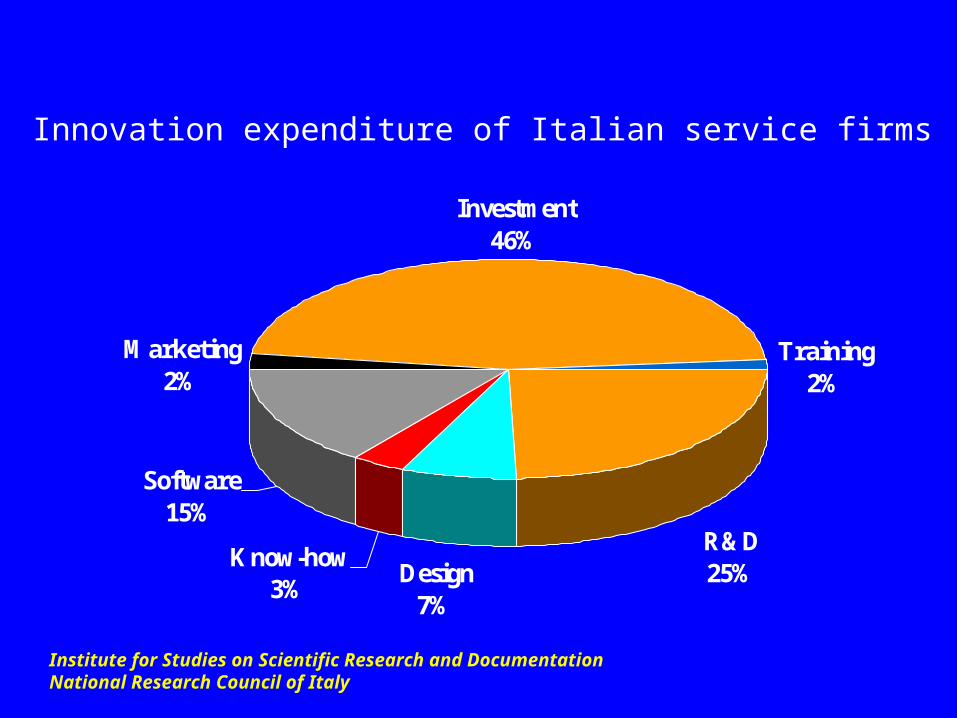
R&D25%Design
7%
Know-how3%
Software15%
Marketing2%
Investment46%
Training2%
Innovation expenditure of Italian service firms
Institute for Studies on Scientific Research and Documentation National Research Council of Italy

Innovation expenditure (percentages)
• R&D 23.7• Design 8.1• Know-how 3.5• Software 14.1• Training 2.6• Tooling-up, patents -• Marketing 1.9• Investment 46.0• Total 100.0
• 35.8• 7.4• -• -• -• 8.1• 1.5• 47.2• 100.0
Service firms (1993-95)
Manufacturingfirms (1990-92)
Institute for Studies on Scientific Research and Documentation National Research Council of Italy

Lessons from the CIS survey (1994-1996) Percentage of innovating firms
• Germany 83
• Austria 81
• Ireland 79
• Finland 69
• Spain 53
• Italy 50 Poland 34
• Turkey 33
• 82• 64• 62• 46• -• 31• -• -
Manufacturing firms Service firms
Institute for Studies on Scientific Research and Documentation National Research Council of Italy

Concluding remarks
• Innovation can be measured
• We have learnt a lot from innovation surveys and other indicators
• Still many challenges ahead of us

Lessons learned
• Technological innovation is quite a diffused phenomenon
• There are wide differences across sectors and size of firm
• Firms rely on a wide range of innovation sources: investment, R&D and software are the major components of firms' innovation expenditure

Lessons learned
• Major obstacles for introducing technological innovation are of an economic nature - i.e. cost and risk too high
• Technological information is drawn mainly from outside suppliers of equipment, materials and components as well as from in-house technical departments
• Internal sources of information are much more important than public research institutions
Some challenges
• Software
• Services
• Organisation
• Information and communication technologies
• Biotechnologies
• Employment
• Environmental sustainability
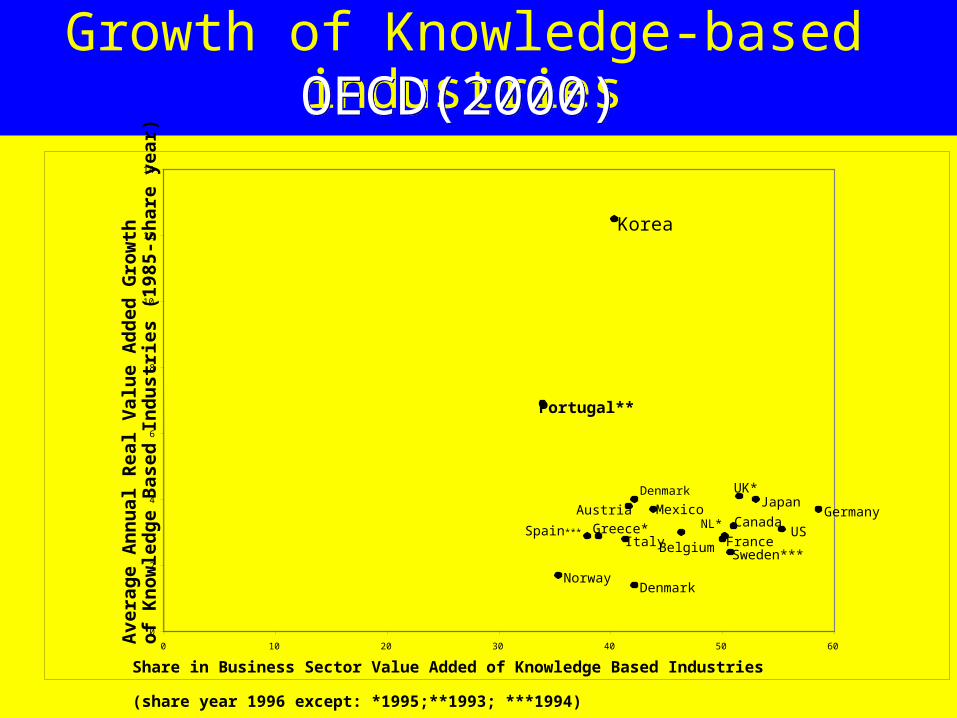
Growth of Knowledge-based industriesOECD(2000)OECD(2000)
UK*
Belgium
Portugal**
Greece*
Sweden***
NL*Austria
Japan
Norway
Canada
Denmark
Spain***
Denmark
Mexico
ItalyUS
France
Korea
Germany
0
2
4
6
8
10
12
14
0 10 20 30 40 50 60
Share in Business Sector Value Added of Knowledge Based Industries (share year 1996 except: *1995;**1993; ***1994)
Ave
rag
e A
nn
ual
Rea
l V
alu
e A
dd
ed G
row
th
of
Kn
ow
led
ge
Bas
ed I
nd
ust
ries
(19
85-s
har
e ye
ar)

Incentives to BERD
1990-1998
-0.2 -0.15 -0.1 -0.05 0 0.05 0.1 0.15 0.2
Australia
US
Korea
Denmark
Switzerland
France
Belgium
Iceland
UK
Canada
Germany
Finland
Sweden
Italy
Norway
Mexico
Austria
Ireland
Spain
Netherlands
JapanPortugal
Change in the Amount of Tax Subsidies for 1 US Dollar of R&D
SOURCE: OCDE (1999).

Some challenges
• Further development of theories in the knowledge-based economy
• Innovation surveys allow to take into account complexity
• Linkage with other industrial data
• Risk of too much information
• The advantage of international comparability (“Big science”)