The Mazin EnCompass Early Warning Systemwvde.state.wv.us/schoolimprovement/documents/PPT_...
19
Early Warning Addressing the Dropout Challenge Dr. Kristal Ayres
Transcript of The Mazin EnCompass Early Warning Systemwvde.state.wv.us/schoolimprovement/documents/PPT_...
Early Warning
Addressing the Dropout Challenge
Dr. Kristal Ayres

Welcome & Introduction
DR. KRISTAL AYRESSenior Professional
Learning [email protected]
WelcomeThis is an interactive session to share the
components of BrightBytes’ Early Warning System
using predictive analytics to identify students that are
showing signs of dropping out of school as early as
the 1st grade.
Introduction• 26+ years in the field of education & research
• Doctorate in Educational Administrative
Leadership
• Educator: elementary, middle, high & university
• District Administrative Positions
• College Board Consultant and National Trainer
• BrightBytes Senior Professional Learning Leader

Who is BrightBytes?
• Mission-Driven Organization
• Former Educators
• Technology Experts
• Educative, Engaging, and
Actionable
• Tens of Thousands of Schools
Nationwide
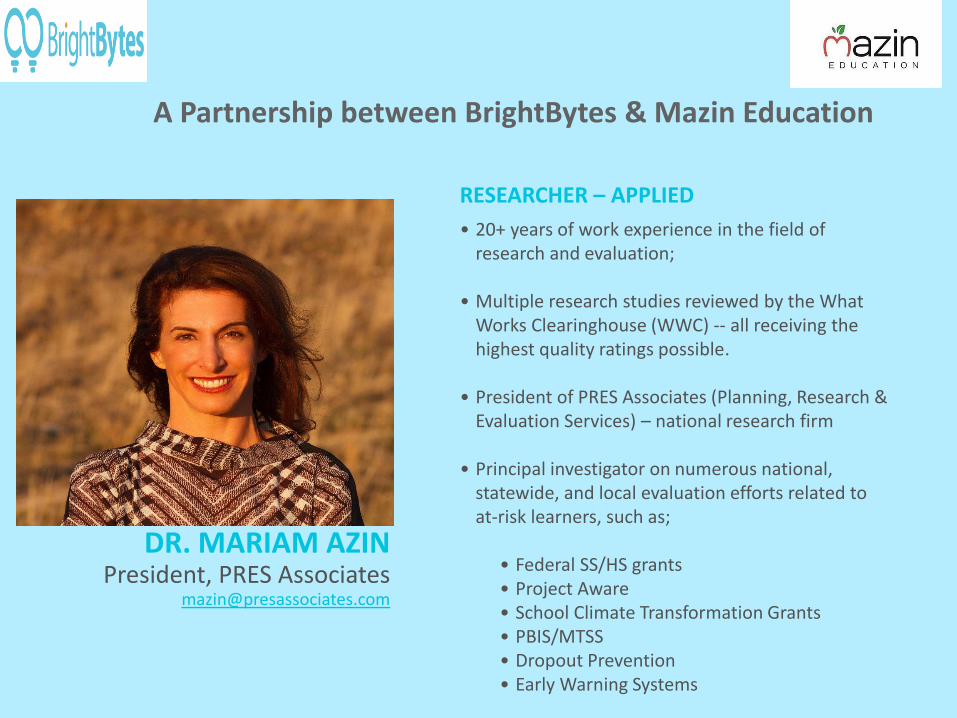
DR. MARIAM AZINPresident, PRES Associates
RESEARCHER – APPLIED
• 20+ years of work experience in the field of research and evaluation;
• Multiple research studies reviewed by the What Works Clearinghouse (WWC) -- all receiving the highest quality ratings possible.
• President of PRES Associates (Planning, Research & Evaluation Services) – national research firm
• Principal investigator on numerous national, statewide, and local evaluation efforts related to at-risk learners, such as;
• Federal SS/HS grants • Project Aware• School Climate Transformation Grants• PBIS/MTSS• Dropout Prevention• Early Warning Systems
A Partnership between BrightBytes & Mazin Education

Early Warning Checklist Approach*
* Everyone Graduates
Center – Johns Hopkins
University: Based on
numerous research
studies across a number
of different states and
districts, a consistent set
of triggers have been
identified.

Predictive Analytics
Early Warning System 2.0 ~ Second Generation Predictive Analytics
Accuracy• Accuracy of Checklist Model is around 48%
• Accuracy of BrightBytes Predictive Analytics is over 85%
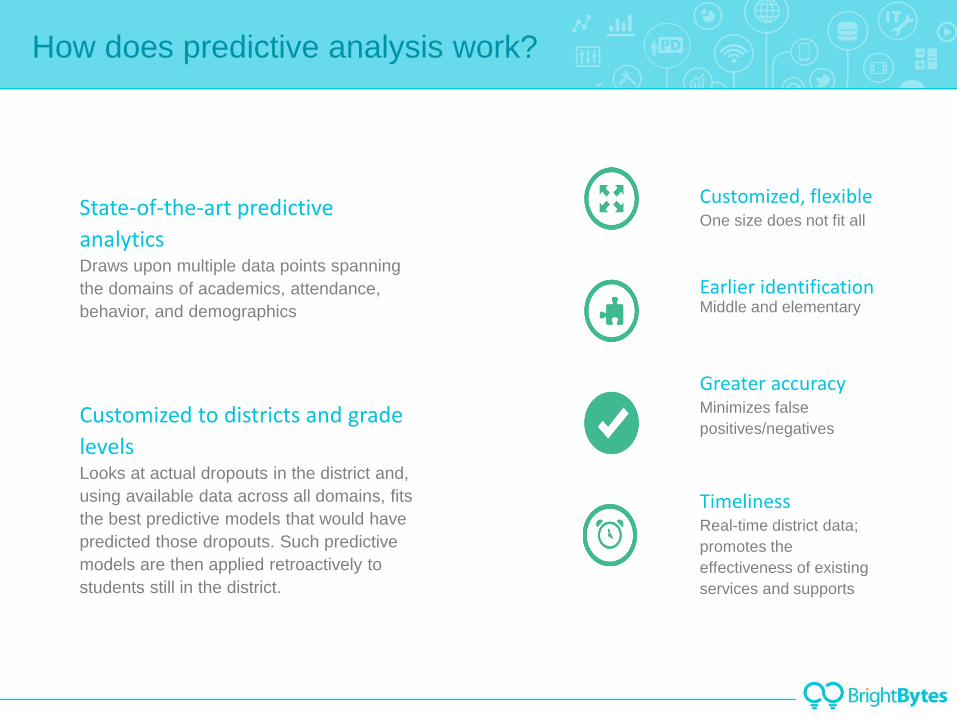
Customized, flexibleOne size does not fit all
Earlier identificationMiddle and elementary
Greater accuracyMinimizes false
positives/negatives
TimelinessReal-time district data;
promotes the
effectiveness of existing
services and supports
State-of-the-art predictive
analyticsDraws upon multiple data points spanning
the domains of academics, attendance,
behavior, and demographics
Customized to districts and grade
levels Looks at actual dropouts in the district and,
using available data across all domains, fits
the best predictive models that would have
predicted those dropouts. Such predictive
models are then applied retroactively to
students still in the district.
How does predictive analysis work?

Analysis of the factors contributing to dropout risk
• Assessments – District
• Assessments – State
• Credits Earned Annually
• Academic Indicator – All Courses
• Academic Indicator – Core Academic Courses
• Grade Retention
• Pass Rate – All Courses
• Remedial Courses
• Attendance – First 30 days
• Attendance – Total
• Tardies
• Behaviors – Major
• Behaviors – Minor
• Disciplinary Referrals
• Expulsions
• Suspensions
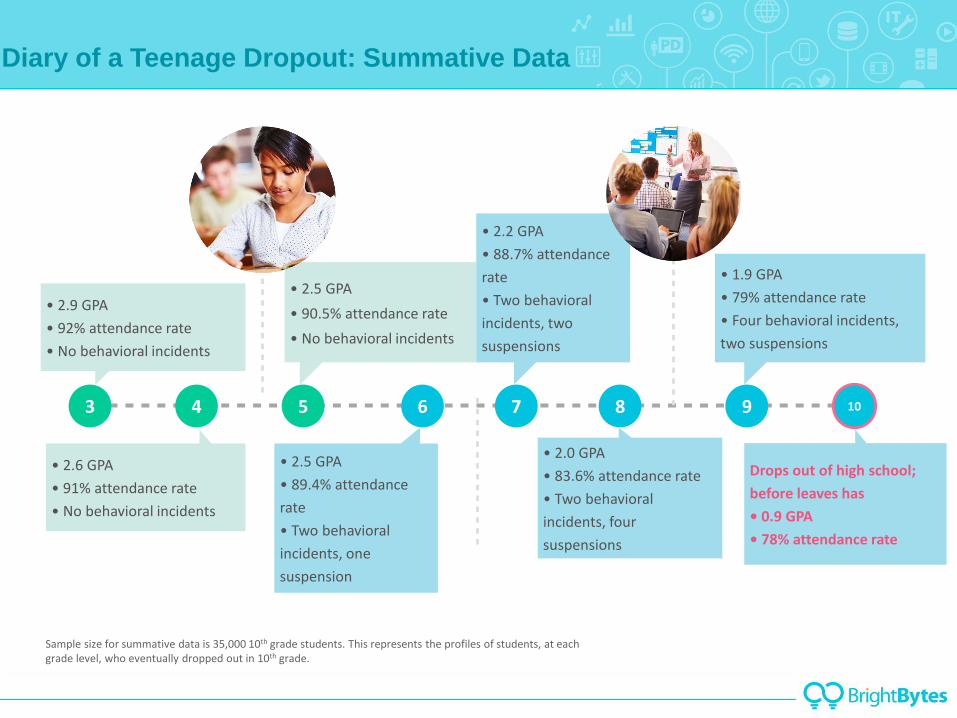
Diary of a Teenage Dropout: Summative Data
• 2.9 GPA
• 92% attendance rate
• No behavioral incidents
• 2.6 GPA
• 91% attendance rate
• No behavioral incidents
• 2.5 GPA
• 90.5% attendance rate
• No behavioral incidents
• 2.5 GPA
• 89.4% attendance
rate
• Two behavioral
incidents, one
suspension
• 2.2 GPA
• 88.7% attendance
rate
• Two behavioral
incidents, two
suspensions
• 1.9 GPA
• 79% attendance rate
• Four behavioral incidents,
two suspensions
Drops out of high school;
before leaves has
• 0.9 GPA
• 78% attendance rate
3 4 5 6 7 8 9 10
• 2.0 GPA
• 83.6% attendance rate
• Two behavioral
incidents, four
suspensions
Sample size for summative data is 35,000 10th grade students. This represents the profiles of students, at each grade level, who eventually dropped out in 10th grade.

What it is and What it isn’t
It is:
Based on historical patterns and current data for earlier and more accurateidentification of students showing
signs of risk
Efficient targeting of school and program resources to where they
are needed most
Actionable supports to connect students to research-based
interventions
It isn’t:
A data repository or reports center
An average of colors for overall risk level assignment
The same weight for indicators across all grade levels
Surprising Data
What you see will surprise you
Predictive Analytics identifies students that may not be on your radar because the algorithm analyzes hundreds of data points simultaneously to provide greater accuracy for student risk predictions

Scenario: Low/Moderate Risk Across
Domains

Scenario: Low Assessment Scores

Scenario: Underlying Demographic Risk
Factors

9th Grader Profile
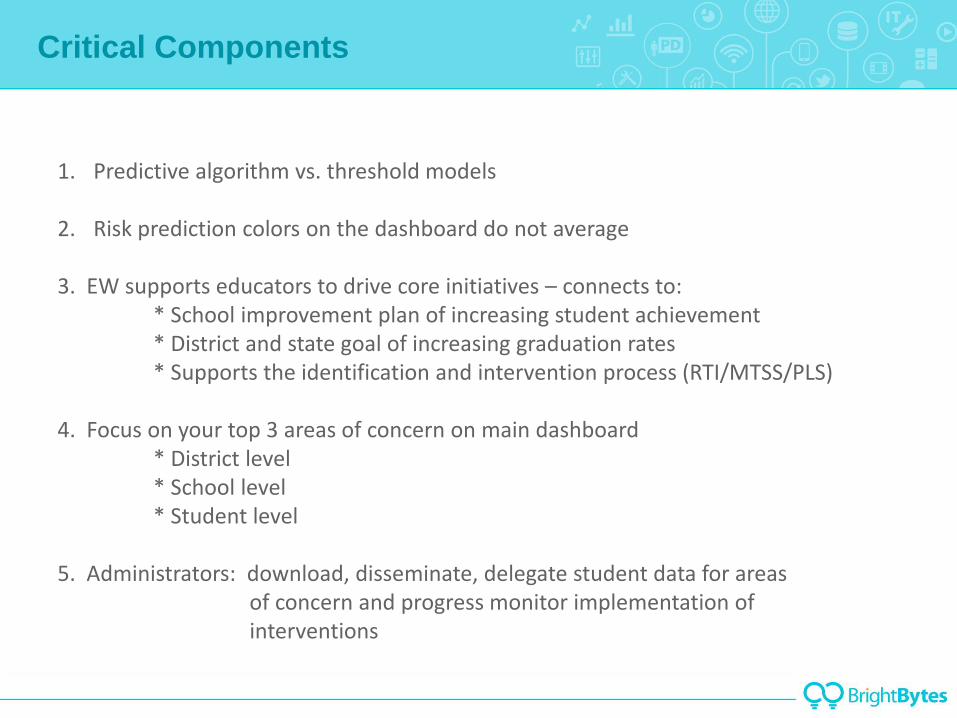
Critical Components
1. Predictive algorithm vs. threshold models
2. Risk prediction colors on the dashboard do not average
3. EW supports educators to drive core initiatives – connects to:* School improvement plan of increasing student achievement* District and state goal of increasing graduation rates* Supports the identification and intervention process (RTI/MTSS/PLS)
4. Focus on your top 3 areas of concern on main dashboard* District level* School level* Student level
5. Administrators: download, disseminate, delegate student data for areasof concern and progress monitor implementation ofinterventions

A General Tour
Here’s what
DATASo what
REPORTSNow what
INSIGHTS
Early Warning
Walkthrough
For additional information:
Dr. Kristal Ayres
239-398-1770
Thank you!
QUESTIONS???