The Massachusetts Minimum Wage: Past, Present and Future
16
The Massachusetts Minimum Wage: Past, Present and Future Massachusetts Budget and Policy Center 15 Court Square, Suite 700, Boston, MA 02108 617.426.1228 www.massbudget.org
Transcript of The Massachusetts Minimum Wage: Past, Present and Future

The Massachusetts Minimum Wage:
Past, Present and Future
Massachusetts Budget and Policy Center
15 Court Square, Suite 700, Boston, MA 02108
617.426.1228
www.massbudget.org

In 1912 Massachusetts Passed the First
Minimum Wage Law in the U.S.
March 1912: Workers in Lawrence, MA go on strike and win higher
wages.
June, 1912: Chapter 706 of the Acts of 1912 requires new wage
boards in Massachusetts to set wage rates sufficient “to supply the
necessary cost of living and to maintain the workers in health.”
1938: President Roosevelt signs the Fair Labor Standards Act
establishing a national minimum wage and guaranteeing basic rights
to workers.
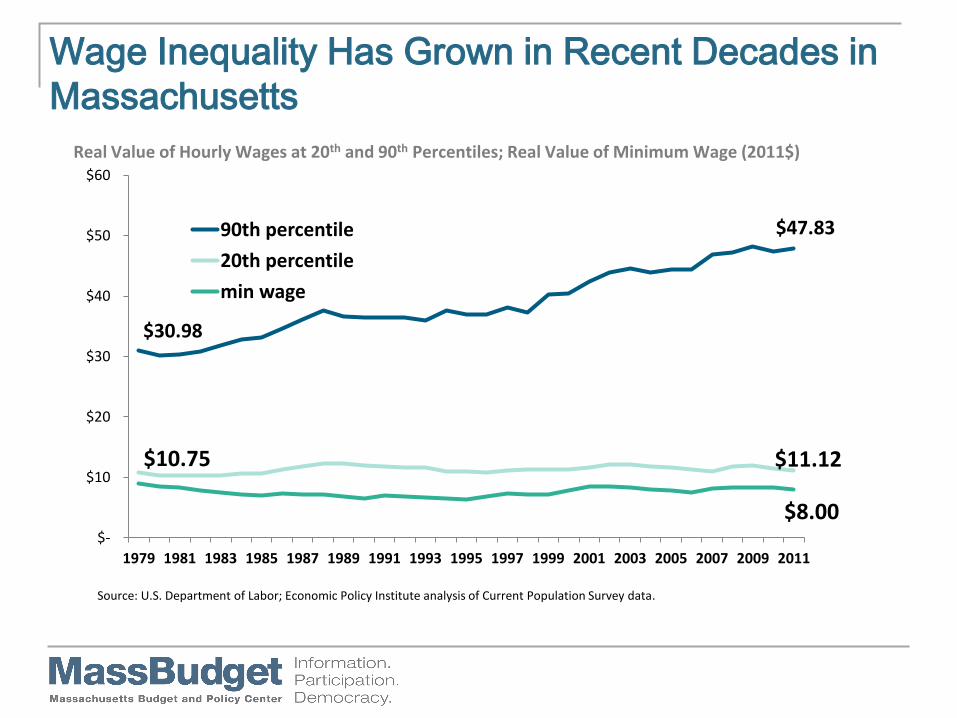
Wage Inequality Has Grown in Recent Decades in
Massachusetts
$30.98
$47.83
$10.75 $11.12
$8.00 $-
$10
$20
$30
$40
$50
$60
1979 1981 1983 1985 1987 1989 1991 1993 1995 1997 1999 2001 2003 2005 2007 2009 2011
90th percentile
20th percentile
min wage
Source: U.S. Department of Labor; Economic Policy Institute analysis of Current Population Survey data.
Real Value of Hourly Wages at 20th and 90th Percentiles; Real Value of Minimum Wage (2011$)

The Real Value of the Minimum Wage Has
Dropped 24 Percent Since 1968
6.38
8.72
$0
$2
$4
$6
$8
$10
$12
1968 1972 1976 1980 1984 1988 1992 1996 2000 2004 2008 2012 2016 2020
Projected
Source: U.S. Department of Labor; Bureau of Labor Statistics. Real value calculated using the Consumer Price Index for all Urban Consumers (CPI-U); 2012-2020 values based on Congressional Budget Office projections for the CPI-U.
Real Value of the MA Minimum Wage (Actual 1968-2011; Projected 2012-2020); 2012 $
$10.52
$6.84
$8.00

A Full-Time Minimum Wage Worker Earns $5,000
Less Today Compared to 1968
$21,046
$16,000
-
5,000
10,000
15,000
20,000
25,000
1968 2012
Real Value of Minimum Wage for a Full-Time Worker (2000 Hours per Year), 2012 $
Poverty Threshold for a 3-Person Family
Source: U.S. Department of Labor; U.S. Census Bureau

Minimum Wage Today if it Had Grown
at the Same Rate as…
$8.00 $10.52
$13.87 $16.02
$0
$4
$8
$12
$16
$20
$24
$28
Current MA Min Wage
Inflation since 1968 Wages of the top 10% since 1979
Worker productivity since
1979
CEO compensation since 1978
$62.36
Projected 2012 Minimum Wage Using Selected Indices
Source: Bureau of Labor Statistics; Economic Policy Institute analysis of Current Population Survey and BLS data.

Raising the Minimum Wage to $10 Per Hour
Would Help Restore its Value
$5.00
$6.00
$7.00
$8.00
$9.00
$10.00
$11.00
1968 1972 1976 1980 1984 1988 1992 1996 2000 2004 2008 2012 2016 2020
Increase to $10 & Index
Current Law
Increase to $10, No Index
Source: U.S. Department of Labor; MassBudget calculations for 2012-2020 based on Congressional Budget Office projections for
Real Value of the Massachusetts Minimum Wage (actual 1968-2011; projected 2012-2020)

Minimum Wage Increases Have Two Effects
Direct Effect: Workers who earn below the new minimum wage
will receive and automatic raise when the increase
takes effect.
Indirect Effect: Workers who earn slightly above the new minimum
wage will receive pay increases as the wage floor
adjusts upward.

Increasing the Minimum Wage to $10 Will Affect One
in Five MA Workers
325,000 Directly Affected
$2,078 Average Increase
256,000 Indirectly Affected
$580 Average Increase
Source: Economic Policy Institute projections based on 2010 Current Population Survey data

More than Half the Workers Affected by a
Minimum Wage Increase Are Women
Directly Affected by Increase to $10:
186,000 women
$2,021 average per year
Indirectly Affected by Increase to $10:
141,000 women
$527 average per year
Source: Economic Policy Institute analysis of Current Population Survey

One in Four Workers Who Will Receive a Pay
Increase Has Children
About 277,000 children have a parent who
will be affected by a minimum wage increase.
About 46,000 children affected by a minimum
wage increase live in households below the
poverty threshold.
Source: Economic Policy Institute analysis of Current Population Survey

Size of Wage Increase Did Not Determine Job
Loss in Recent Recession
-6%
-5%
-4%
-3%
-2%
-1%
0%
1%
RI $0
CT $0.35
ME $0.50
MA $0.50
VT $0.53
NH $2.10
Change in non-farm employment December, 2007-June, 2009, ranked by size of minimum wage increase
Source: EPI analysis of Bureau of Labor Statistics data; Department of Labor data on minimum wage levels; increase in state minimum wage between January, 2007 and January, 2009.
Increase:

Low Wage Jobs Have Grown Faster than High-
Wage Jobs
80
85
90
95
100
105
110
115
120
Jan-95 Jan-97 Jan-99 Jan-01 Jan-03 Jan-05 Jan-07 Jan-09 Jan-11
Low Concentration of MW earners
High Concentration of MW earners
Source: Economic Policy Institute Analysis of Current Employment Statistics survey data. High concentration industries include Retail Trade, Leisure and Hospitality and Other Services; Low concentration industries include Manufacturing, Construction, Transportation & Utilities, Information, Financial Activities, Professional & Business
Index of change in employment level by industry type as of each January, 1995-2012 (January 1995 = 100); shaded areas denote recession
Min Wage Increase
Min Wage Increase

Economic Policy Institute Model Projects Stimulus
Effect
581,000 workers earn higher wages
Result: ~4,500 new jobs in Massachusetts
Source: “A Massachusetts minimum-wage increase would help working families and generate jobs” (Economic Policy Institute, August, 2012)
Additional spending
=
More demand for local
goods and services
More demand leads =
New hiring

Big Businesses Employ the Majority of Low-
Wage Workers
Two-thirds of low wage workers in the U.S. work
for a corporation with over 100 employees.
In Massachusetts only 17 percent of workers at
all wage levels are employed in a business with
20 or fewer employees.
Compensation for executives at 50 largest low-
wage employers in the U.S. averaged $9.4
million last year.
Source: National Employment Law Project; MassBudget analysis of Census data

"At Costco, we know good wages are good business.
We keep our overhead low while still paying a starting
wage of $11 an hour. Our employees are a big reason
why our sales per square foot is almost double that of
our nearest competitor. Instead of minimizing wages,
we know it's a lot more profitable for the long term to
minimize employee turnover and maximize employee
productivity and commitment, product value, customer
service and company reputation.”
-Costco Senior Vice President Jeff Long
Statement Urging Passage of New York Minimum Wage Increase, May 24, 2012 http://www.businessforsharedprosperity.org/content/costco-greater-ny-chamber-eileen-fisher-hopstop-small-business-owners-urge-minimum-wage-incr