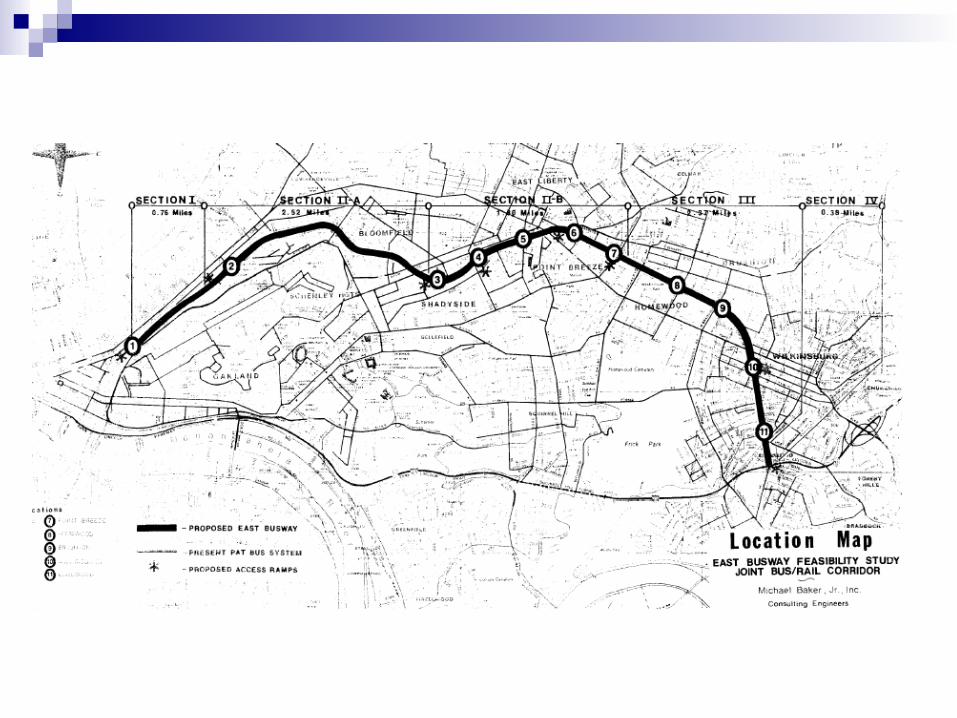
The Martin Luther King Jr. East Busway
46
The Martin Luther The Martin Luther King Jr. East Busway King Jr. East Busway A Cost-Benefit A Cost-Benefit Analysis Analysis
-
Upload
lewis-glass -
Category
Documents
-
view
38 -
download
3
description
The Martin Luther King Jr. East Busway. A Cost-Benefit Analysis. Overview. Pre-1978 History Port Authority’s CBA (1978) Revising Port Authority’s CBA Actual Results. The busway was part of the Early Action Plan (EAP) EAP consisted of 3 other projects. - PowerPoint PPT Presentation
Transcript of The Martin Luther King Jr. East Busway

The Martin Luther King Jr. The Martin Luther King Jr. East BuswayEast Busway
A Cost-Benefit AnalysisA Cost-Benefit Analysis

Overview
Pre-1978 History Port Authority’s CBA (1978) Revising Port Authority’s CBA Actual Results
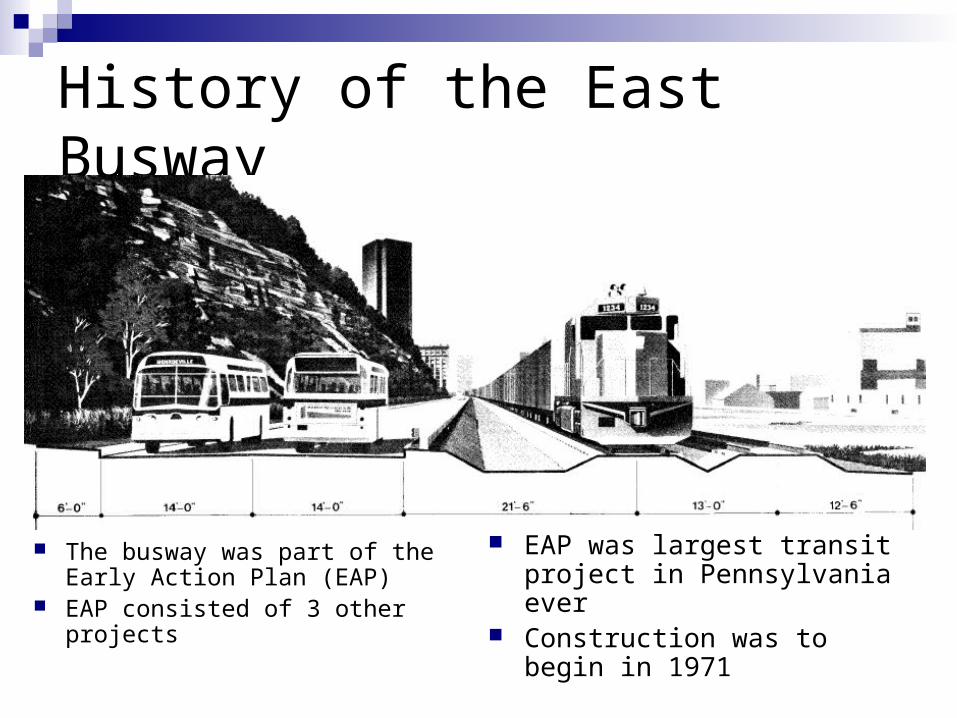
History of the East Busway
The busway was part of the Early Action Plan (EAP)
EAP consisted of 3 other projects
EAP was largest transit project in Pennsylvania ever
Construction was to begin in 1971
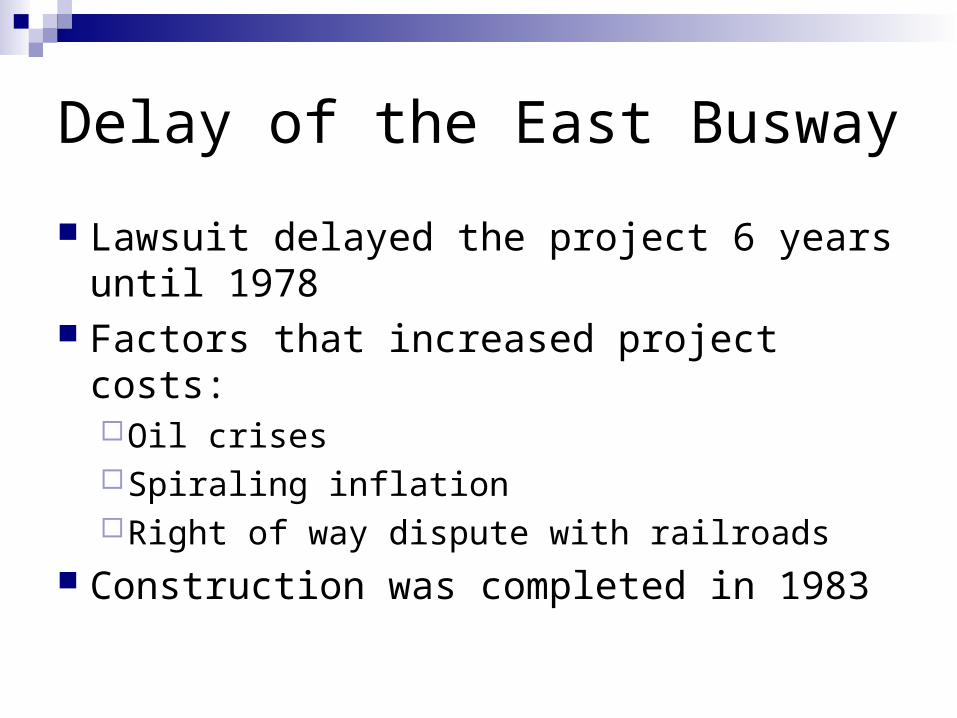
Delay of the East Busway
Lawsuit delayed the project 6 years until 1978
Factors that increased project costs:Oil crisesSpiraling inflationRight of way dispute with railroads
Construction was completed in 1983

Port Authority’s ’78 CBA
Capital Costs Operating Costs Benefits Benefit Cost Ratio
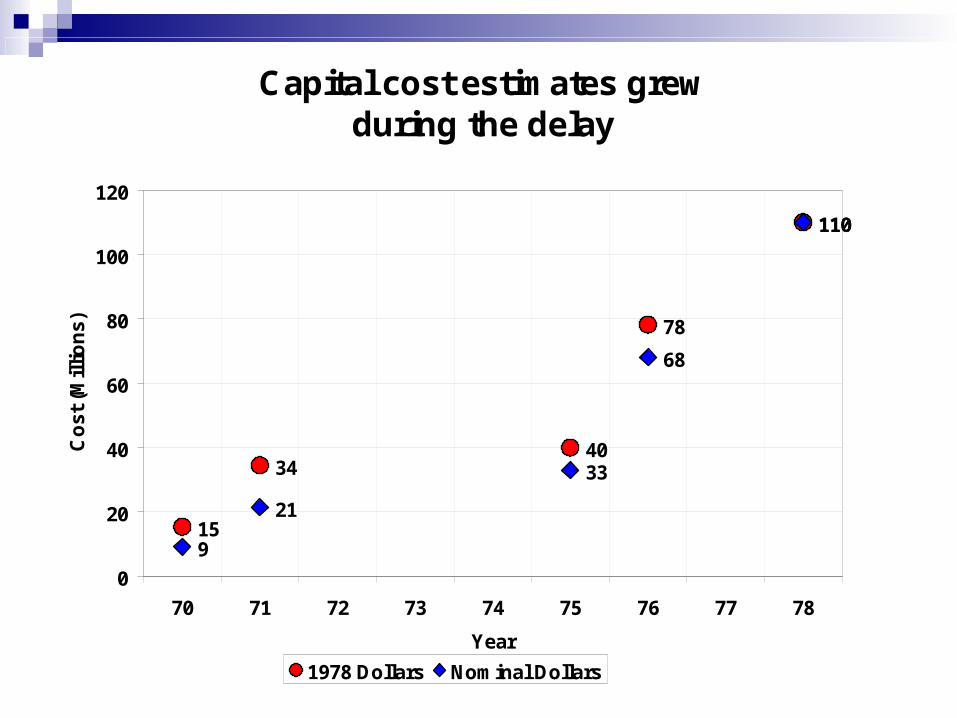
Capital cost estimates grew during the delay
15
3440
78
110
9
21
33
68
110
0
20
40
60
80
100
120
70 71 72 73 74 75 76 77 78
Year
Co
st (
Mil
lio
ns)
1978 Dollars Nominal Dollars

Port Authority’s Capital Costs
Project Costs
Original Project $20,000,000
Cost of Delay (from inflation) $20,000,000
Additional Cost of Property Over Estimate $6,800,000
Costs for Adjustments to Conrail
Cost to Accommodate Conrail $36,900,000
Vertical Separation $6,000,000
Improvement Costs
Neville Ramp Addition $10,600,000
East Liberty Station Improvements $3,200,000
Additional Changes $6,500,000
Capital Costs Total $110,000,000

Port Authority’s Operating Costs
Per Year
Maintenance Costs $700,000
Total Operating Costs $700,000
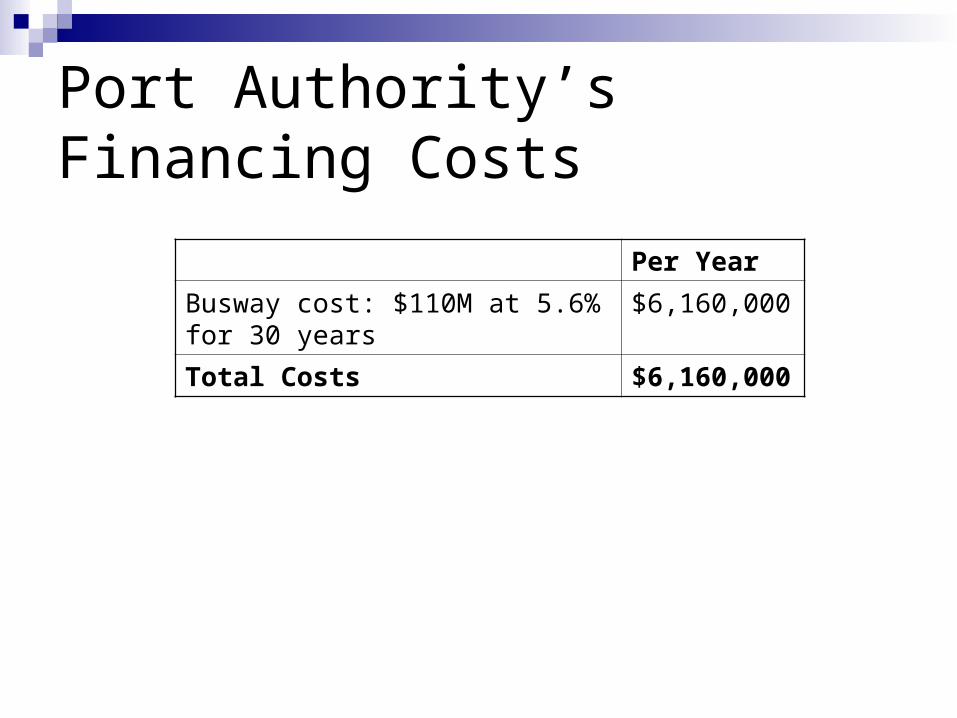
Port Authority’s Financing Costs
Per Year
Busway cost: $110M at 5.6% for 30 years
$6,160,000
Total Costs $6,160,000
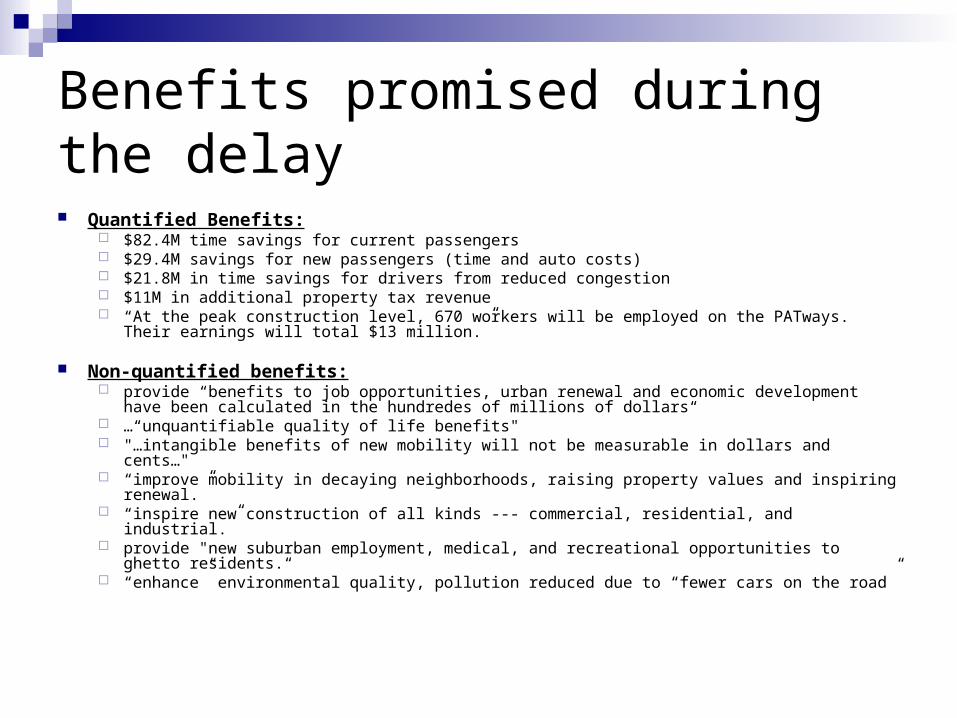
Benefits promised during the delay
Quantified Benefits: $82.4M time savings for current passengers $29.4M savings for new passengers (time and auto costs) $21.8M in time savings for drivers from reduced congestion $11M in additional property tax revenue “At the peak construction level, 670 workers will be employed on the PATways. Their
earnings will total $13 million.”
Non-quantified benefits: provide “benefits to job opportunities, urban renewal and economic development have been
calculated in the hundredes of millions of dollars“ …“unquantifiable quality of life benefits" "…intangible benefits of new mobility will not be measurable in dollars and cents…" “improve mobility in decaying neighborhoods, raising property values and inspiring renewal.” “inspire new construction of all kinds --- commercial, residential, and industrial.” provide "new suburban employment, medical, and recreational opportunities to ghetto
residents.“ “enhance” environmental quality, pollution reduced due to “fewer cars on the road”
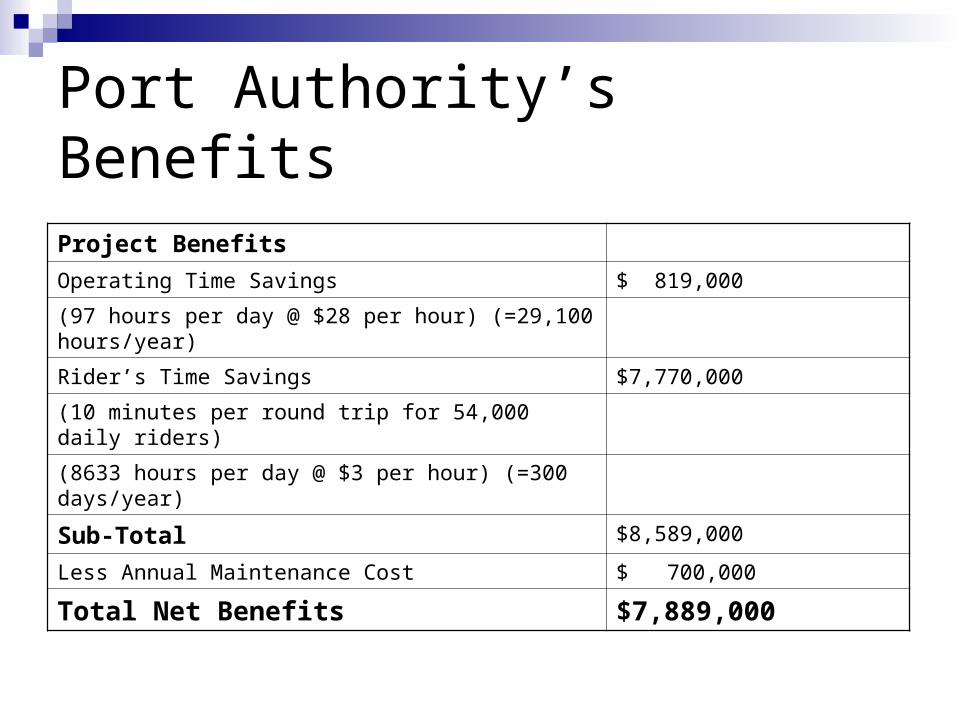
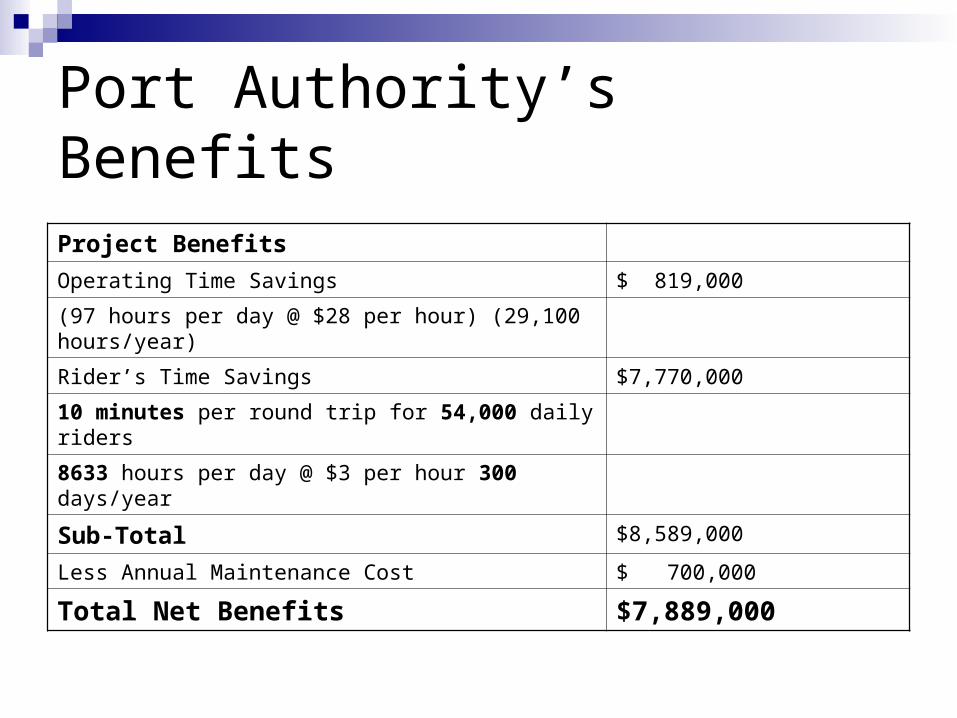
Port Authority’s Benefits
Project Benefits
Operating Time Savings $ 819,000
(97 hours per day @ $28 per hour) (=29,100 hours/year)
Rider’s Time Savings $7,770,000
(10 minutes per round trip for 54,000 daily riders)
(8633 hours per day @ $3 per hour) (=300 days/year)
Sub-Total $8,589,000
Less Annual Maintenance Cost $ 700,000
Total Net Benefits $7,889,000
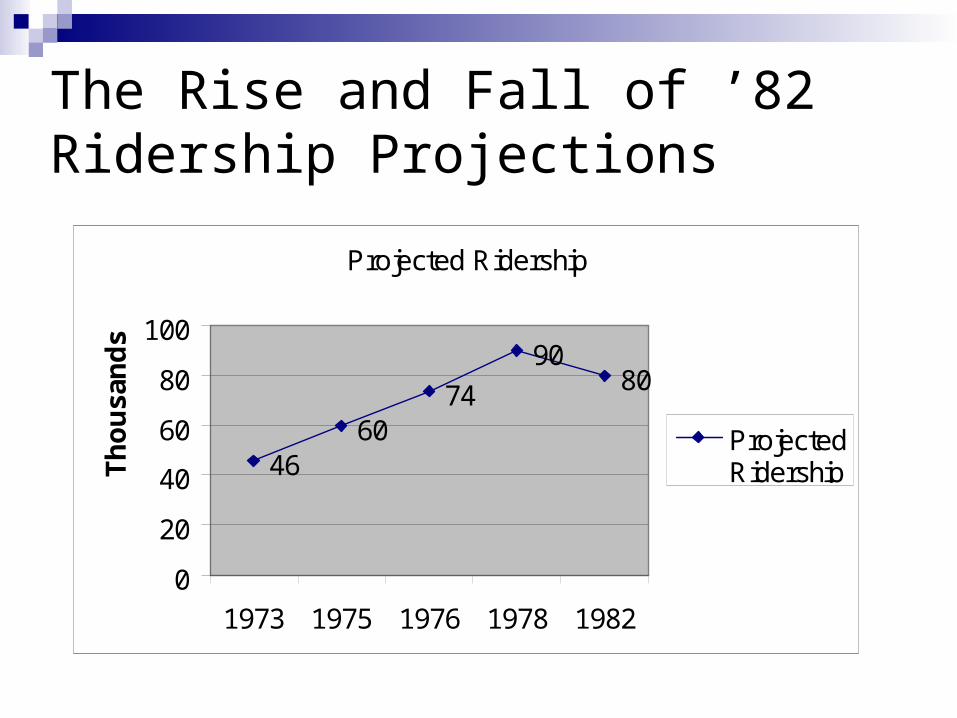
The Rise and Fall of ’82 Ridership Projections
Projected Ridership
4660
74
9080
0
20
40
60
80
100
1973 1975 1976 1978 1982
Th
ou
san
ds
ProjectedRidership

Port Authority’s “CBA”

What’s missing from Port Authority’s analysis?
Missing benefits No loan principal No NPV No discount rate The benefit-cost ratio
may be inflated

Port Authority’s Benefit Problems
’78 analysis indicates many potential benefits without any attempt at measurement: Vehicle Emissions Safety
’78 analysis points to future benefits ($10 million/yr) for future riders without analyzing associated costs: Service Expansion Unidentified Improvements
Previously mentioned benefits gone!
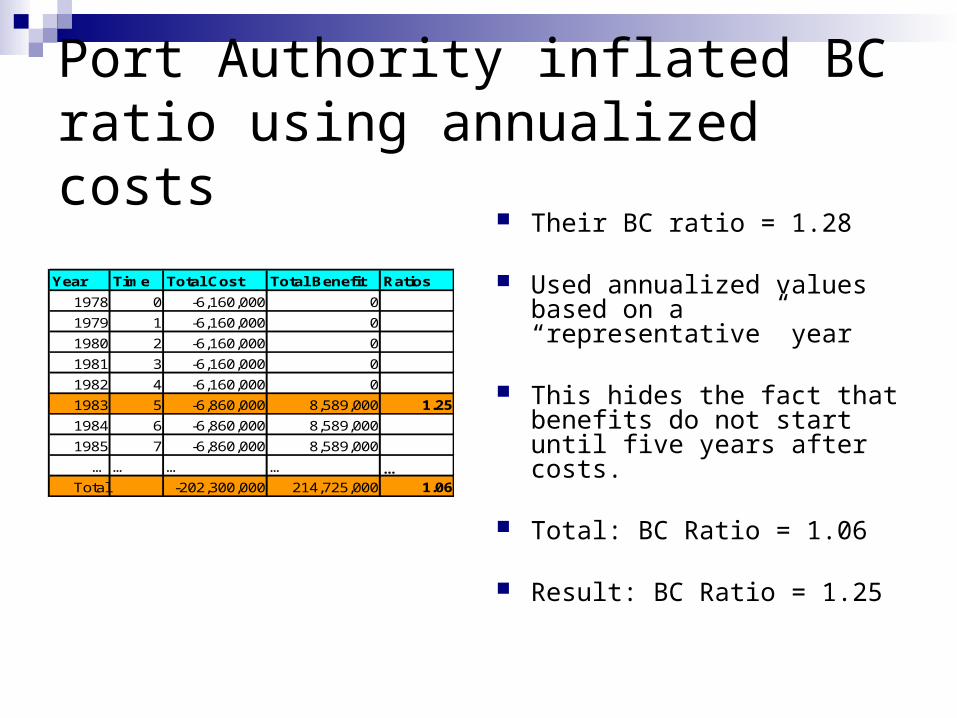
Port Authority inflated BC ratio using annualized costs
Their BC ratio = 1.28
Used annualized values based on a “representative” year
This hides the fact that benefits do not start until five years after costs.
Total: BC Ratio = 1.06
Result: BC Ratio = 1.25
Year Time Total Cost Total Benefit Ratios
1978 0 -6,160,000 0
1979 1 -6,160,000 0
1980 2 -6,160,000 0
1981 3 -6,160,000 0
1982 4 -6,160,000 0
1983 5 -6,860,000 8,589,000 1.25
1984 6 -6,860,000 8,589,000
1985 7 -6,860,000 8,589,000
… … … … …Total -202,300,000 214,725,000 1.06

Their Way
Time Savings 7,770,000
Operating Savings 819,000
Maintenance Cost -700,000
Annualized Benefits 7,889,000
Finance Cost -6,160,000
Annualized Costs -6,160,000
Annualized BC Ratio 1.28
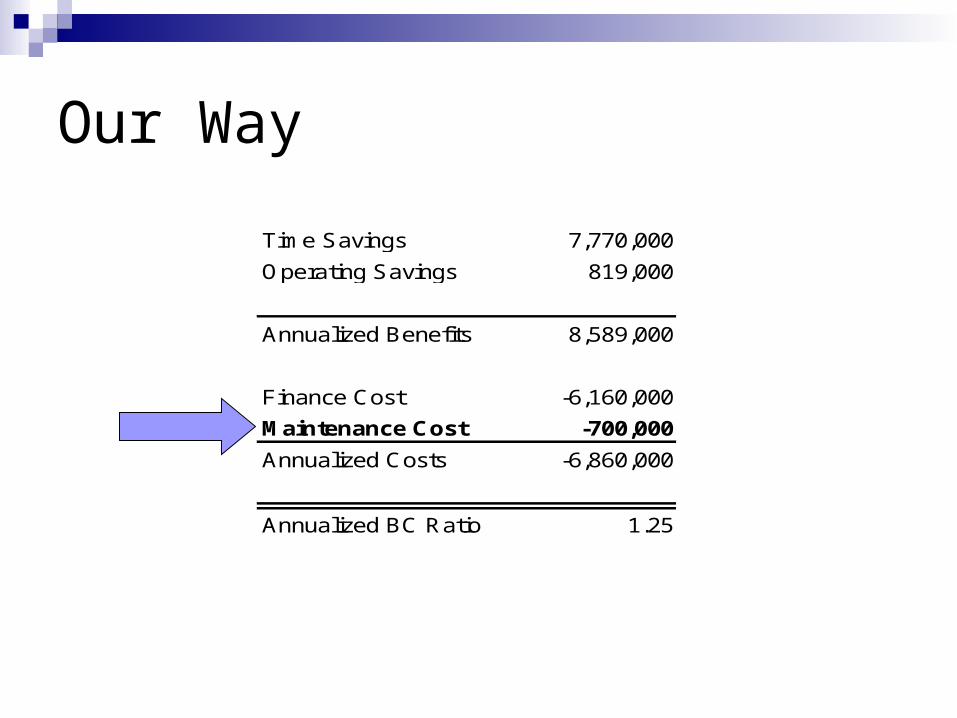
Our Way
Time Savings 7,770,000
Operating Savings 819,000
Annualized Benefits 8,589,000
Finance Cost -6,160,000
Maintenance Cost -700,000
Annualized Costs -6,860,000
Annualized BC Ratio 1.25

Adding the loan principal makes a difference
No principal payments:
NPV = 12,425,000
With principal payments:
NPV = -32,346,343
Assumes 0% discount rate over 30 years. Thus NPV = net benefits

Estimating a discount rate for 1978
Nominal yields on corporate AAA bonds 8% Nominal T-bill rates 7.57% Inflation 7.6% Corporate tax est.40% Individual tax est. 20%
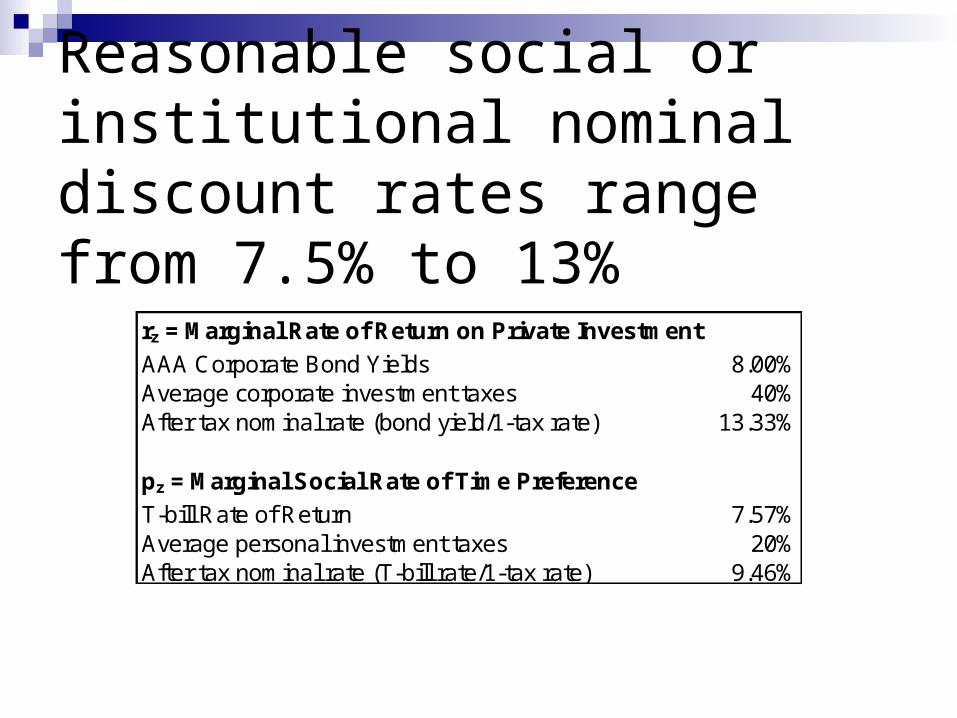
Reasonable social or institutional nominal discount rates range from 7.5% to 13%
rz = Marginal Rate of Return on Private Investment
AAA Corporate Bond Yields 8.00%Average corporate investment taxes 40%After tax nominal rate (bond yield/1-tax rate) 13.33%
pz = Marginal Social Rate of Time Preference
T-bill Rate of Return 7.57%Average personal investment taxes 20%After tax nominal rate (T-bill rate/1-tax rate) 9.46%

Discounting actually improves NPV
Rate NPV
Undiscounted 0% -32,346,344
Untaxed Rz 7.57% -31,284,651
Aftertax Rz 8.00% -31,141,424
Untaxed Pz 9.46% -30,635,167
Aftertax Pz 13.33% -29,230,007
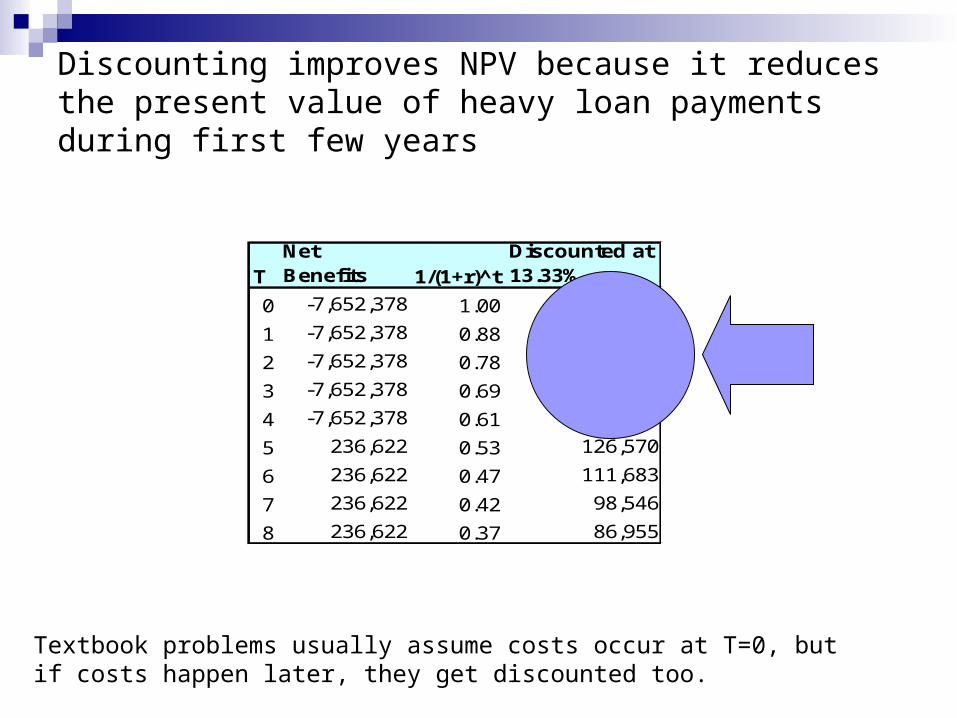
Discounting improves NPV because it reduces the present value of heavy loan payments during first few years
TNet Benefits 1/(1+r)^t
Discounted at 13.33%
0 -7,652,378 1.00 -7,652,378
1 -7,652,378 0.88 -6,752,297
2 -7,652,378 0.78 -5,958,084
3 -7,652,378 0.69 -5,257,288
4 -7,652,378 0.61 -4,638,920
5 236,622 0.53 126,570
6 236,622 0.47 111,683
7 236,622 0.42 98,546
8 236,622 0.37 86,955
Textbook problems usually assume costs occur at T=0, but if costs happen later, they get discounted too.

Additional problems with Port Authority’s analysis Funding too aggregated Economic impact of taxes ignored Time savings understated Option value ignored Accounting for future inflation ignored No recognition of uncertainty

Funding was more complicated than a single bond issue
$88M federal grants
$11M in state contributions
$11M local funding
10%
10%
80%
Federal
State
Local
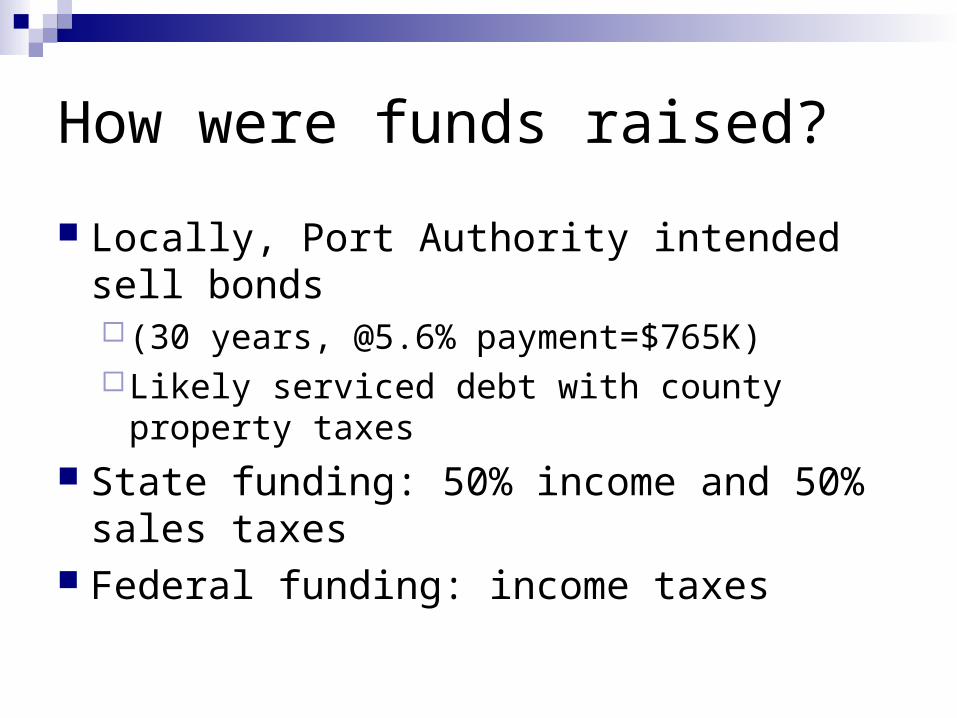
How were funds raised?
Locally, Port Authority intended sell bonds (30 years, @5.6% payment=$765K)Likely serviced debt with county property
taxes State funding: 50% income and 50% sales
taxes Federal funding: income taxes

When were the funds raised?
State and federal funding to be appropriated each year over the construction project (4-5yrs)
Local funding serviced over 30 years
Distribution of Funding
18%21% 22% 21%
18%
0%
5%
10%
15%
20%
25%
Y1 Y2 Y3 Y4 Y5
Construction Year

How much did they cost to raise?
Amount Rate METB
Local property taxes 22,957,134 17.0% 3,902,713
State income taxes 5,500,000 25.0% 1,375,000
State sales taxes 5,500,000 43.5% 2,392,500
Federal income taxes 88,000,000 43.5% 38,280,000
Total 45,950,213

With METB and more realistic funding assumptions NPV gets worse, except for undiscounted case
Rate NPV
Undiscounted 0% -32,346,344
Untaxed Rz 7.57% -31,284,651
Aftertax Rz 8.00% -31,141,424
Untaxed Pz 9.46% -30,635,167
Aftertax Pz 13.33% -29,230,007
Rate NPV
Undiscounted 0% 29,317,653
Untaxed Rz 7.57% -68,520,605
Aftertax Rz 8.00% -70,579,163
Untaxed Pz 9.46% -76,261,658
Aftertax Pz 13.33% -84,552,731
Previous Assumptions With realistic funding and METB
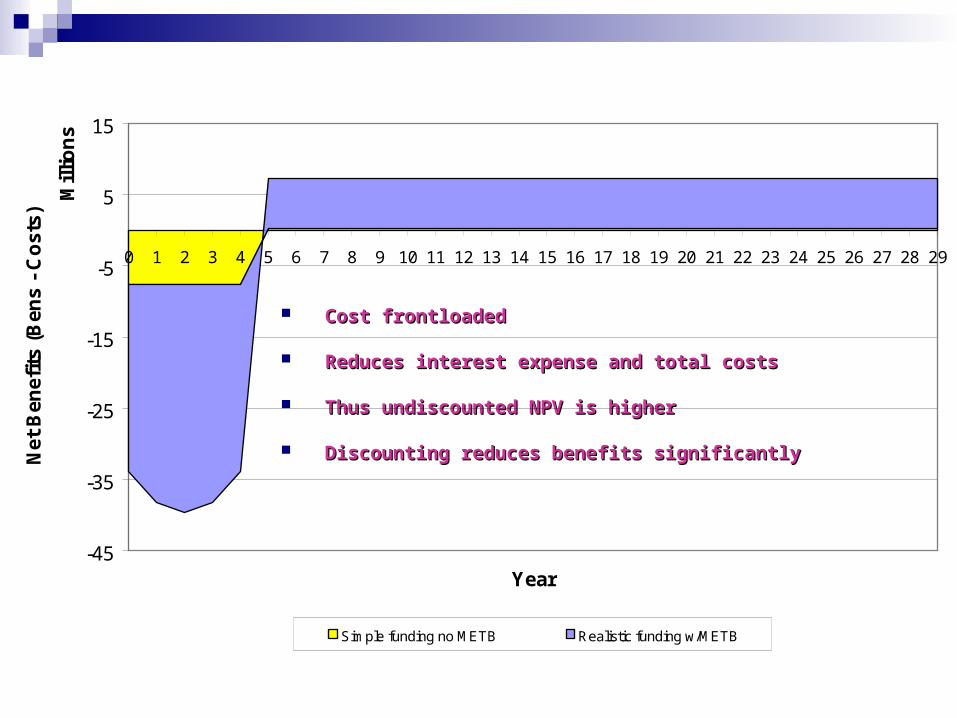
Cost frontloadedCost frontloaded
Reduces interest expense and total costsReduces interest expense and total costs
Thus undiscounted NPV is higherThus undiscounted NPV is higher
Discounting reduces benefits significantlyDiscounting reduces benefits significantly
-45
-35
-25
-15
-5
5
15
0 1 2 3 4 5 6 7 8 9 10 11 12 13 14 15 16 17 18 19 20 21 22 23 24 25 26 27 28 29
Mil
lio
ns
Year
Net
Ben
efit
s (B
ens
- C
ost
s)
Simple funding no METB Realistic funding w/METB

Port Authority’s benefits could have been higherProject Benefits
Operating Time Savings $ 819,000
(97 hours per day @ $28.00 / hour) (29,100 hours/year)
Rider’s Time Savings $8,100,000
18.5 minutes per round trip for 34,300 daily riders
10,617 hours per day @ $3 per hour, 256 days/year
Sub-Total $8,919,000
Option Value
(Assumes Bus Commuters to Car Commuters 1:1)
(6 trips per driver a year @ $0.57/trip) $ 184,700
Total Measurable Benefits $9,103,700
Port Authority’s Benefits
Project Benefits
Operating Time Savings $ 819,000
(97 hours per day @ $28 per hour) (29,100 hours/year)
Rider’s Time Savings $7,770,000
10 minutes per round trip for 54,000 daily riders
8633 hours per day @ $3 per hour 300 days/year
Sub-Total $8,589,000
Less Annual Maintenance Cost $ 700,000
Total Net Benefits $7,889,000
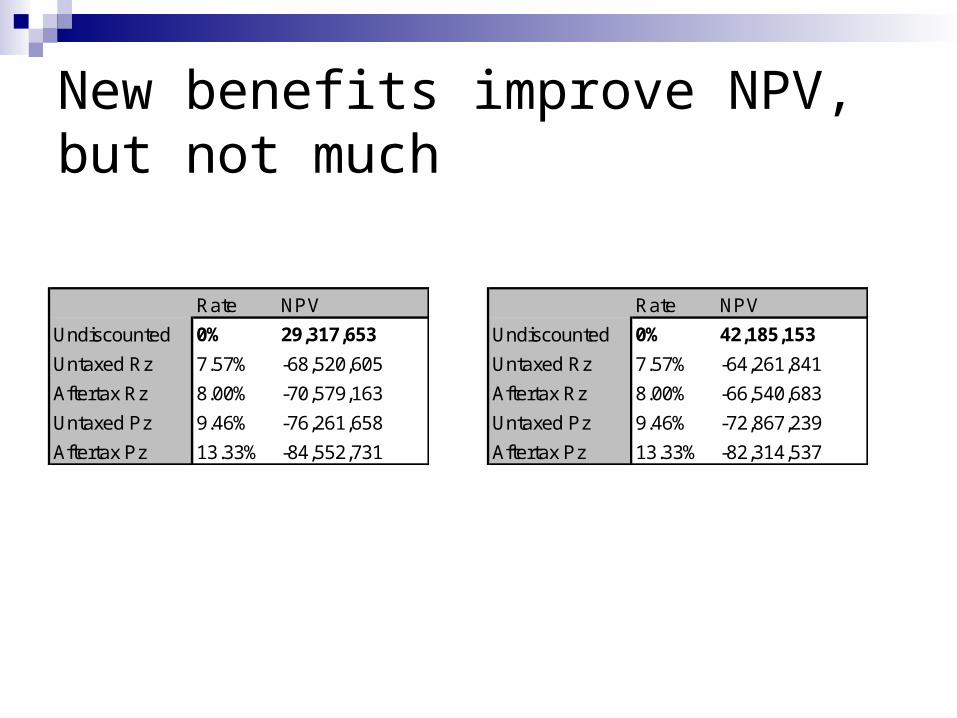
New benefits improve NPV, but not much
Rate NPV
Undiscounted 0% 29,317,653
Untaxed Rz 7.57% -68,520,605
Aftertax Rz 8.00% -70,579,163
Untaxed Pz 9.46% -76,261,658
Aftertax Pz 13.33% -84,552,731
Rate NPV
Undiscounted 0% 42,185,153
Untaxed Rz 7.57% -64,261,841
Aftertax Rz 8.00% -66,540,683
Untaxed Pz 9.46% -72,867,239
Aftertax Pz 13.33% -82,314,537

Inflation/Uncertainty
-64 -82M NPV? Why bother!
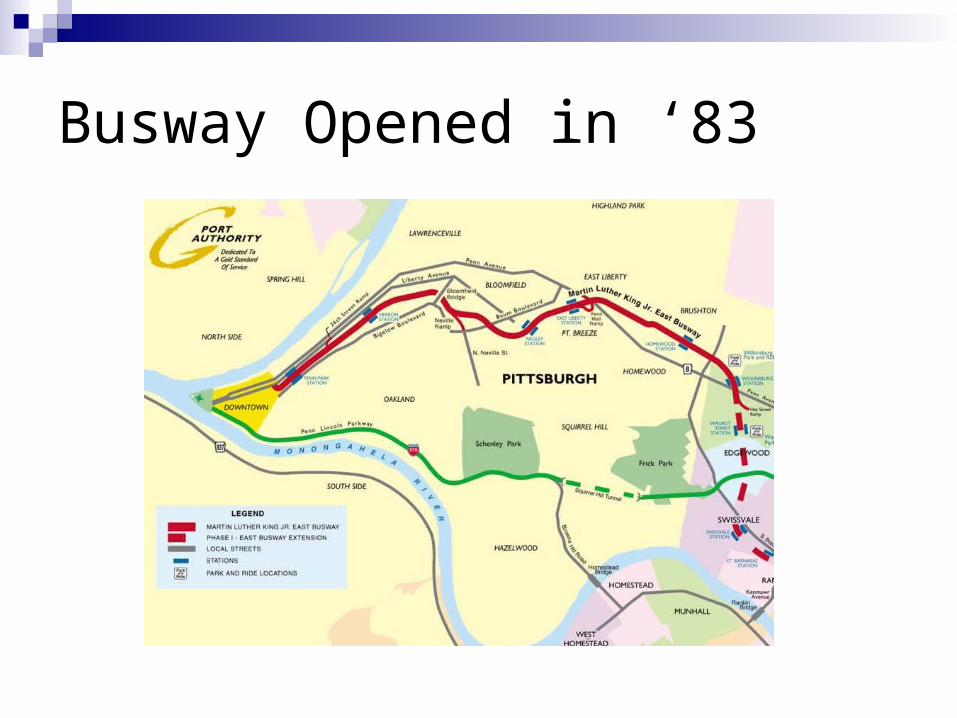
Busway Opened in ‘83
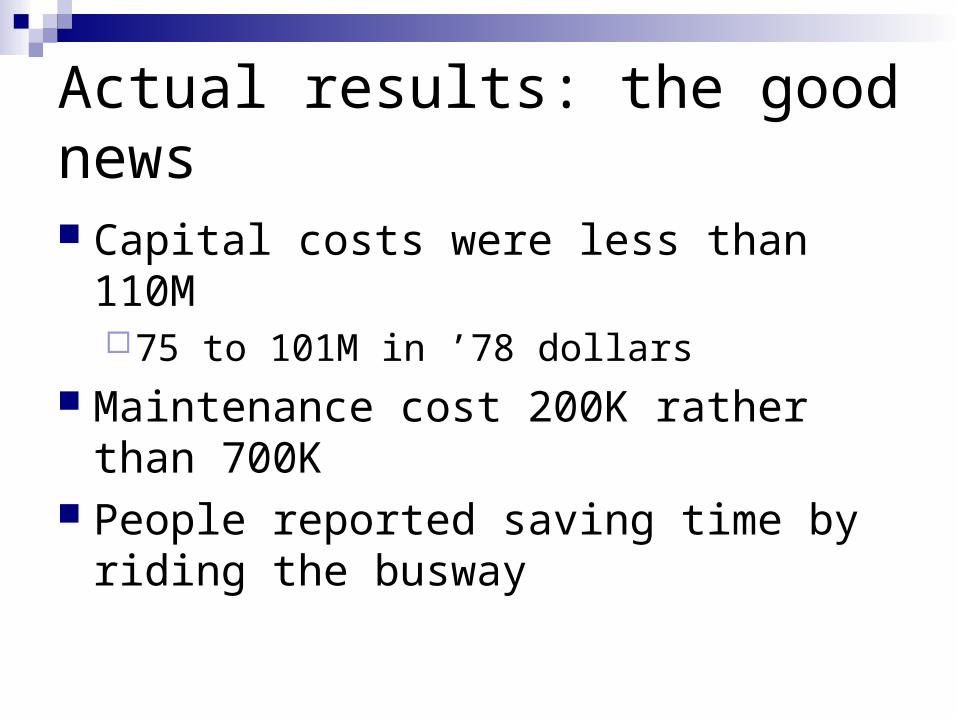
Actual results: the good news
Capital costs were less than 110M75 to 101M in ’78 dollars
Maintenance cost 200K rather than 700K People reported saving time by riding the
busway
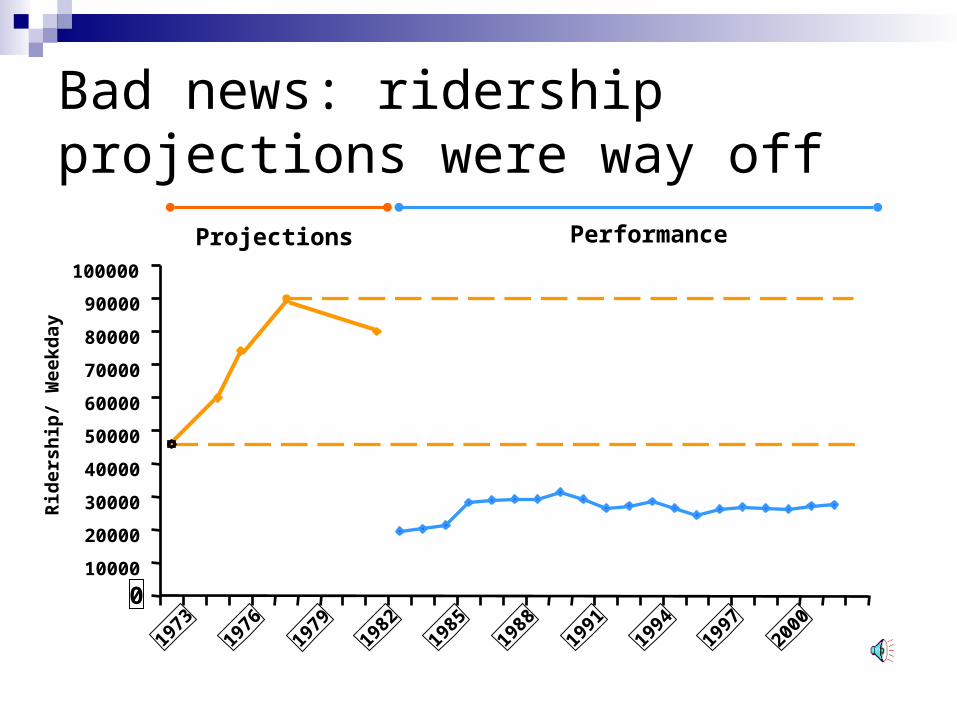
Projections Performance
010000
20000
30000
40000
50000
60000
70000
80000
90000
100000
1973
1976
1979
1982
1985
1988
1991
1994
1997
2000
Rid
ersh
ip/
Wee
kday
Bad news: ridership projections were way off

Thus ridership benefits were overstated by about 3.6M a year Assuming Port Authority’s assumptions
about time savings were true except for ridership, having 30,000/week rather than 54,000 per week cuts time savings in half!
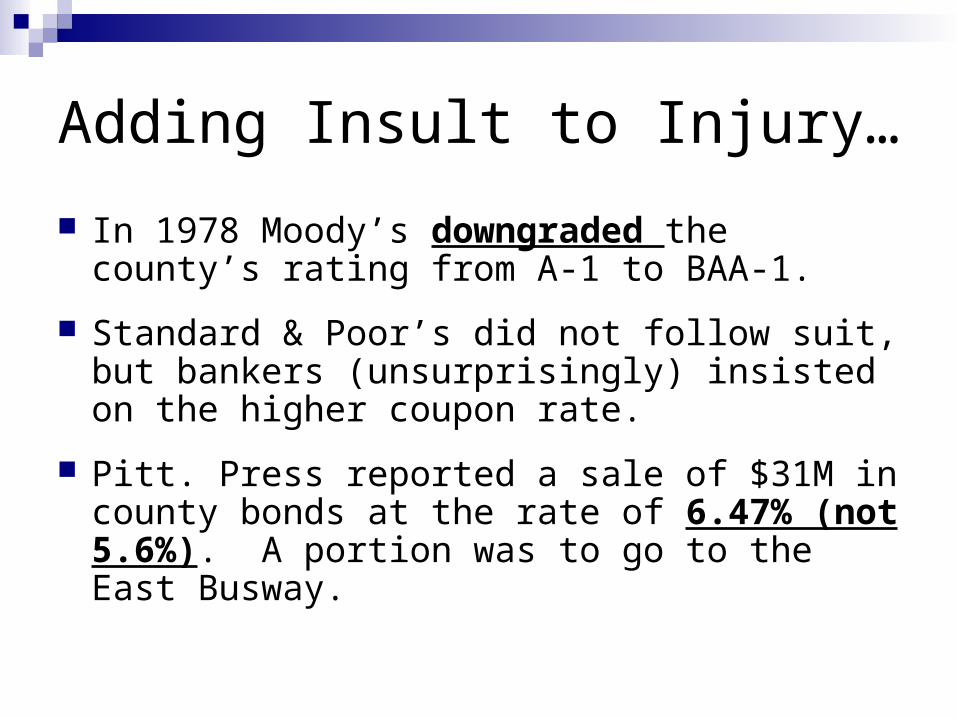
Adding Insult to Injury…
In 1978 Moody’s downgraded the county’s rating from A-1 to BAA-1.
Standard & Poor’s did not follow suit, but bankers (unsurprisingly) insisted on the higher coupon rate.
Pitt. Press reported a sale of $31M in county bonds at the rate of 6.47% (not 5.6%). A portion was to go to the East Busway.

Conclusions
Promises change when you ask for money Port Authority CBA wholly inadequate Even w/ other benefits, hard to say the
busway was worth it In ’78 inertia won again Still going however
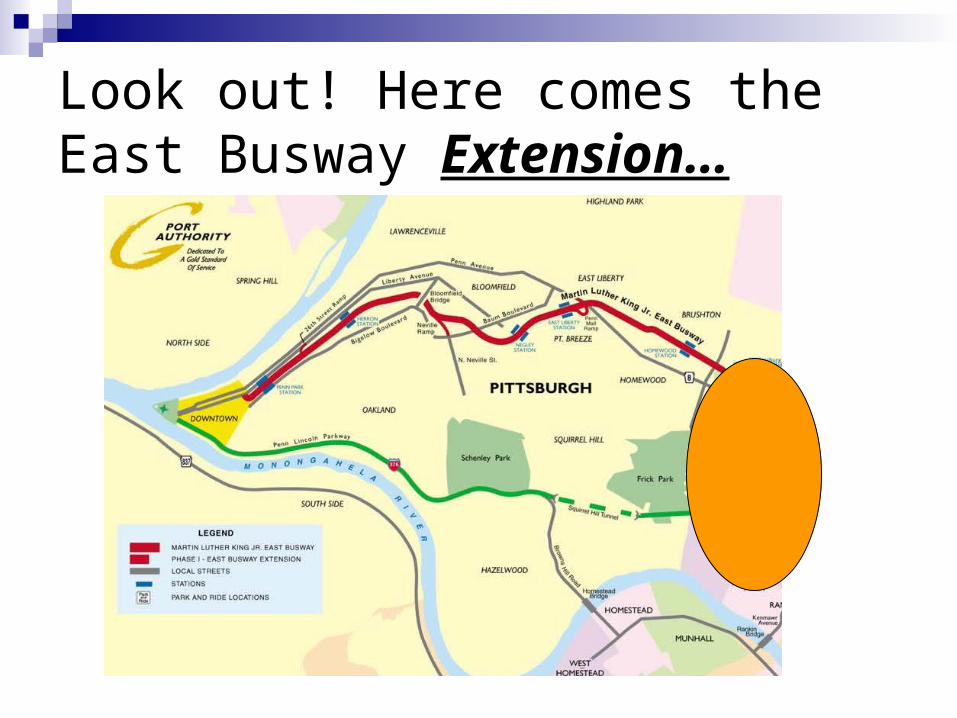
Look out! Here comes the East Busway Extension…

Look at these great benefits!
“The extension will attract new customers to the system”
13,000 riders (4,000 new) “Environmental benefits” “Decreases travel times” “Eases traffic congestion”
“Adds a decorative green space along most of the Busway corridor”
“Construction… is rehabilitating desolate and deserted areas.”
“Provides, at no cost to community residents, various neighborhood enhancements, such as the rehabilitation of the historic Edgewood Train Station…among many other improvements.”
Cost:$62M

Thank You!Thank You!
The busway did save time for those who rode it: Routes diverted to the busway routes saved 8 minutes travel time
during the morning, 3.5 minutes during the evening.
EBA Passengers (main new route) reduced travel time by 21-24 minutes.
On board survey showed that both new and diverted route passengers perceive large travel times savings since they started using the busway.
Transferring perceived to be easier, bus service deemed more reliable
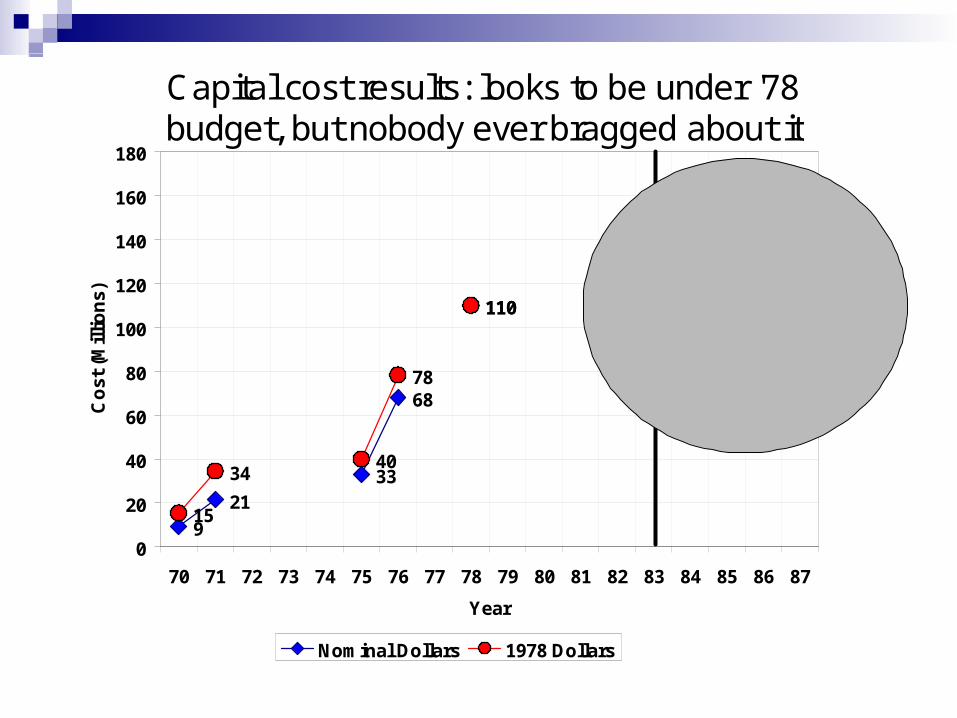
Capital cost results: looks to be under '78 budget, but nobody ever bragged about it
9
2133
68
110115
156
15
3440
78
110
75
101
0
20
40
60
80
100
120
140
160
180
70 71 72 73 74 75 76 77 78 79 80 81 82 83 84 85 86 87
Year
Co
st (
Mil
lio
ns)
Nominal Dollars 1978 Dollars