The Marketing Tourism Growth Strategy - live.southafrica.net
112
Transcript of The Marketing Tourism Growth Strategy - live.southafrica.net

������������� ������� ����������� ��� ���������������� ��� ��������
����� ����
��������

������������������ ����������� ������ �� ��� � ��������� �
��������������������� ������� ����������������������� ������� ��
���� �� ���������������� !�"���� �##���������������� ! �$
• � ����
• �����
• ������ ��� �
• ��� � �
• ���� ����
• !������������• !������������
• ������ ��
• " �#�$�����
%��& � '���!�( �������)#��! %*
• %����� ����&����� '(• %����� ����&����� '(
• � �����&����� )*
• +�������� ����� ,)
• -$��� *�
+��,�-��� �����$$�.�$$/ �$$+��,�-��� �����$$�.�$$/ �$$
/������#���� �$/
� � ����������� ���������

The Strategy Development Process
The information and strategic plans contained in this document are based on extensive research and consultation conducted by SA Tourism over the past five years. The process of developing the strategy was guided by a set of core principles to which we believe we have remained true.believe we have remained true.The insights we have gained and used to inform our strategic choices were generated through two parallel, but integrated, processes:1. The Tourism Growth Strategy started in 2001 and is a market-facing process that involves 1. The Tourism Growth Strategy started in 2001 and is a market-facing process that involves on-going research and analysis to support critical choices around which markets and consumer segments to focus on, and specifically how to activate growth through marketing, brand positioning and channel fulfillment in the chosen focus areas while at the same time monitoring and evaluating our work. 2. The Global Competitiveness project was done in two phases in 2003/4 as a joint project with the Department of Environmental Affairs and Tourism and the Department of Trade and Industry. It studied how competitive the South African tourism sector is and has initiated a set of actions to adjust the competitive platforms and micro-economic context of the industry to fill of actions to adjust the competitive platforms and micro-economic context of the industry to fill key product gaps and upgrade the overall performance and rate of innovation in South Africa’s tourism industry. This document details the Tourism Marketing Strategy of South Africa which forms part of the broader Tourism Growth Strategy. More information is our website
Copyright © 2008 South African TourismThe Marketing Tourism Growth Strategy 2008 – 2010, May 2008 3
broader Tourism Growth Strategy. More information is our website www.southafrica.net/research

Guiding principles of the Tourism Growth Strategy (TGS)
FocusedFocused
We have limited human and financial resources so must be focused in all our activities so we make choices and explicit trade-offs which have a long-term strategic impact on South African tourism. This is not about doing everything on offer but making choices based on ROI and business objectives, and making clear
The TGS was developed according to a set of consistent principles
Data Driven and Data Driven and customer focusedcustomer focused
The strategic decisions that drive the TGS are based on sound data and analysis, and not anecdote. It is about understanding consumers who are attractive for South Africa in terms of our objectives and the immediate focus is on people who are
offer but making choices based on ROI and business objectives, and making clear decisions on what you do and do not do
customer focusedcustomer focused Africa in terms of our objectives and the immediate focus is on people who are interested in traveling to South Africa.
Consultative to buildConsultative to buildsector ‘cosector ‘co--opetitionopetition11’ ’
The TGS process is consultative, incorporating input from as many stakeholders as possible. The principle is to build “co-opetition” in the sector so that we co-operate on building volume and compete on service and move away from the current sector ‘cosector ‘co--opetitionopetition11’ ’ on building volume and compete on service and move away from the current destructive competition
Goals are GDP, jobsGoals are GDP, jobsChoices are made in relation to our mandate and the national tourism goals in the Tourism Act: to promote GDP growth and job creation and the transformation of our Goals are GDP, jobsGoals are GDP, jobs
and transformationand transformationTourism Act: to promote GDP growth and job creation and the transformation of our economy through six key objectives (growing volume, spend, length of stay and provincial distribution while reducing seasonality and promoting transformation)
TransparentTransparentThe choice-making processes and source of data is transparent to build consensus on building tourism against the broader nation’s goals while informing business-level
4 Copyright © 2008 South African TourismThe Marketing Tourism Growth Strategy 2008 – 2010, May 2008
TransparentTransparent on building tourism against the broader nation’s goals while informing business-level decision making within a broader context.
1 The concept of “Co-opetition” is used here with the same meaning as that described by Adam Brandenburger and Barry Nalebuff in their book of the same title

Mandate and Key Strategic Objectives for Tourism
Sustainable GDP Growth
Sustainable GDP Growth
Sustainable job creation
Sustainable job creation
Redistribution and transformation
Redistribution and transformation
The Tourism Act’s mandate to SA Tourism GrowthGrowth creationcreation transformationtransformationto SA Tourism
is ...
. . . through six key
Increase in tourist volume
Increase in tourist volume
Increase in tourist spend
Increase in tourist spend
Increase length of stay
Increase length of stay
objectives . . . Improve geographic spread
Improve geographic spread
Improve seasonality patterns
Improve seasonality patterns
Promote transformation
Promote transformation
5 Copyright © 2008 South African TourismThe Marketing Tourism Growth Strategy 2008 – 2010, May 2008
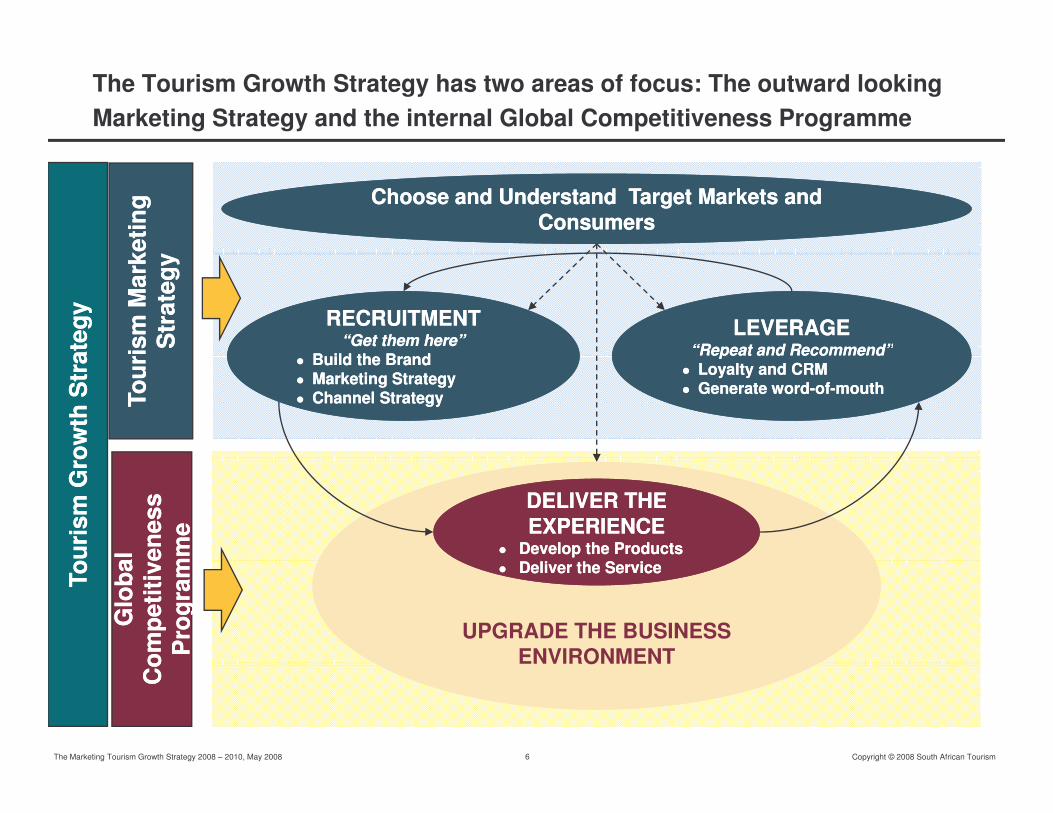
The Tourism Growth Strategy has two areas of focus: The outward looking Marketing Strategy and the internal Global Competitiveness Programme
Choose and Understand Target Markets and Choose and Understand Target Markets and ConsumersConsumers
Choose and Understand Target Markets and Choose and Understand Target Markets and ConsumersConsumers
Tour
ism
Mar
ketin
g To
uris
m M
arke
ting
Str
ateg
yS
trat
egy
RECRUITMENTRECRUITMENT“Get them here”“Get them here”
Build the Brand Build the Brand
RECRUITMENTRECRUITMENT“Get them here”“Get them here”
Build the Brand Build the Brand
LEVERAGELEVERAGE“Repeat and Recommend”“Repeat and Recommend”
LEVERAGELEVERAGE“Repeat and Recommend”“Repeat and Recommend”
Tour
ism
Mar
ketin
g To
uris
m M
arke
ting
Str
ateg
yS
trat
egy
Tour
ism
Gro
wth
Str
ateg
yTo
uris
m G
row
th S
trat
egy
�� Build the Brand Build the Brand �� Marketing StrategyMarketing Strategy�� Channel StrategyChannel Strategy
�� Build the Brand Build the Brand �� Marketing StrategyMarketing Strategy�� Channel StrategyChannel Strategy
“Repeat and Recommend”“Repeat and Recommend”�� Loyalty and CRMLoyalty and CRM�� Generate wordGenerate word--ofof--mouthmouth
“Repeat and Recommend”“Repeat and Recommend”�� Loyalty and CRMLoyalty and CRM�� Generate wordGenerate word--ofof--mouthmouthTo
uris
m M
arke
ting
Tour
ism
Mar
ketin
g
Tour
ism
Gro
wth
Str
ateg
yTo
uris
m G
row
th S
trat
egy
DELIVER THE DELIVER THE EXPERIENCEEXPERIENCE
�� Develop the ProductsDevelop the ProductsDeliver the ServiceDeliver the Service
DELIVER THE DELIVER THE EXPERIENCEEXPERIENCE
�� Develop the ProductsDevelop the ProductsDeliver the ServiceDeliver the Service
Glo
bal
Glo
bal
Com
petit
iven
ess
Com
petit
iven
ess
Pro
gram
me
Pro
gram
me
Tour
ism
Gro
wth
Str
ateg
yTo
uris
m G
row
th S
trat
egy
UPGRADE THE BUSINESS ENVIRONMENT
UPGRADE THE BUSINESS ENVIRONMENT
�� Deliver the ServiceDeliver the Service�� Deliver the ServiceDeliver the Service
Glo
bal
Glo
bal
Com
petit
iven
ess
Com
petit
iven
ess
Pro
gram
me
Pro
gram
me
Tour
ism
Gro
wth
Str
ateg
yTo
uris
m G
row
th S
trat
egy
6 Copyright © 2008 South African TourismThe Marketing Tourism Growth Strategy 2008 – 2010, May 2008
ENVIRONMENTENVIRONMENT
Com
petit
iven
ess
Com
petit
iven
ess

The success of delivering the mandate of tourism lies in different areas –together they form the Tourism Growth Strategy
Transformation
Skills & Service Levels
Product and
Safety Transformation
Tourism Growth Strategy
Product and
SMME
StrategyTransport
Marketing &
Branding
Quality
assurance
Branding
Incentives
and Investment
7 Copyright © 2008 South African TourismThe Marketing Tourism Growth Strategy 2008 – 2010, May 2008

This is dependent on the co-ordinated delivery of different organisations on their mandates as most of them sit outside tourism
8. Safety and Security, Department of Health, Department of TransportTransformation
7. TECSA and DEAT
Skills & Service Levels
Product and
Safety Department of TransportTransformation
Tourism Growth Strategy
Product and
SMME 1. Tourism Enterprise Programme with DEAT6. Theta and DEAT
StrategyTransport
Marketing &
Branding5. Department of
Quality
assurance
Branding
Incentives
and Investment
2. South African Tourism5. Department of Transport (land and air)
8 Copyright © 2008 South African TourismThe Marketing Tourism Growth Strategy 2008 – 2010, May 2008
3. Tourism Grading Council, Register of Guides (DEAT and provinces)
4. The dti

Government Policy
Co-ordination is even more challenging because tourism industry cluster consists of a large number of players
Government Policy� National (SAT, DEAT, DTI & Others)� Regional (Regional Tourism Authorities & Provincial Government)� Local (Local Tourism Authorities & Local Government
Promotion
Food and Beverage (20,000)� Restaurant
Soft Infrastructure(97)
Channel Hard
Attractions� Beaches (73)� Game Parks &
National Reserves (481)
� Cultural (47)Accommodation
Hotels (1,233)� Restaurant� Catering � Bars &
clubs
� Hotel Management Schools
� THETA � Management
Training
Consumers1
Channel� Outbound Tour
Operator � Inbound Tour
Operator & Ground Handler (>800)
(5,000-10,000)
Hard Infrastructure� Roads� Airports� Telecom� Rail
� Cultural (47)� Arts & Crafts (87)� Museums (611)� Sport (16)� Adventure (624)� Conference
� Hotels (1,233)� Game & Hunting
Lodges (1,000-5,000)
� Bed and Breakfasts Training
Programs(>800) � Travel Agents
(>800)
Transportation� Airlines� Car Rental
(>10)� Railways� Buses
� Rail� Security� IT Services
Facilities � Ecotourism (687)� Water attractions
(424)� Shopping Facilities � Theme Parks
� Guest Houses� Backpackers
(163)� Self Catering
(2,415)� Timeshare (170)
Supporting Industries– Banking– Laundry
Promotion
� Buses� Taxis
Supporting Industries– Legal– Medical
� Theme Parks � Casinos (35)
� Timeshare (170)
Supporting Industries– Catering– Supplies to
9 Copyright © 2008 South African TourismThe Marketing Tourism Growth Strategy 2008 – 2010, May 2008
– Laundry– Outfitting– Insurance
Note: International and Domestic ConsumersSource: JICA, ABSA, AA Travel, Babasa, Portfolio Collection, SAT, Interviews, Monitor Research
– Medical– Real Estate– Construction
– Supplies to accommodation sector
– Security services

The Marketing Tourism Growth Strategy
Choose and Understand Target Markets and Choose and Understand Target Markets and ConsumersConsumers
Choose and Understand Target Markets and Choose and Understand Target Markets and ConsumersConsumers
Tour
ism
Mar
ketin
g To
uris
m M
arke
ting
Str
ateg
yS
trat
egy
RECRUITMENTRECRUITMENT“Get them here”“Get them here”
Build the Brand Build the Brand
RECRUITMENTRECRUITMENT“Get them here”“Get them here”
Build the Brand Build the Brand
LEVERAGELEVERAGE“Repeat and Recommend”“Repeat and Recommend”
LEVERAGELEVERAGE“Repeat and Recommend”“Repeat and Recommend”
Tour
ism
Mar
ketin
g To
uris
m M
arke
ting
Str
ateg
yS
trat
egy
Tour
ism
Gro
wth
Str
ateg
yTo
uris
m G
row
th S
trat
egy
�� Build the Brand Build the Brand �� Marketing StrategyMarketing Strategy�� Channel StrategyChannel Strategy
�� Build the Brand Build the Brand �� Marketing StrategyMarketing Strategy�� Channel StrategyChannel Strategy
“Repeat and Recommend”“Repeat and Recommend”�� Loyalty and CRMLoyalty and CRM�� Generate wordGenerate word--ofof--mouthmouth
“Repeat and Recommend”“Repeat and Recommend”�� Loyalty and CRMLoyalty and CRM�� Generate wordGenerate word--ofof--mouthmouthTo
uris
m M
arke
ting
Tour
ism
Mar
ketin
g
Tour
ism
Gro
wth
Str
ateg
yTo
uris
m G
row
th S
trat
egy
DELIVER THE DELIVER THE EXPERIENCEEXPERIENCE
�� Develop the ProductsDevelop the ProductsDeliver the ServiceDeliver the Service
DELIVER THE DELIVER THE EXPERIENCEEXPERIENCE
�� Develop the ProductsDevelop the ProductsDeliver the ServiceDeliver the Service
Glo
bal
Glo
bal
Com
petit
iven
ess
Com
petit
iven
ess
Pro
gram
me
Pro
gram
me
Tour
ism
Gro
wth
Str
ateg
yTo
uris
m G
row
th S
trat
egy
UPGRADE THE BUSINESS ENVIRONMENT
UPGRADE THE BUSINESS ENVIRONMENT
�� Deliver the ServiceDeliver the Service�� Deliver the ServiceDeliver the Service
Glo
bal
Glo
bal
Com
petit
iven
ess
Com
petit
iven
ess
Pro
gram
me
Pro
gram
me
Tour
ism
Gro
wth
Str
ateg
yTo
uris
m G
row
th S
trat
egy
10 Copyright © 2008 South African TourismThe Marketing Tourism Growth Strategy 2008 – 2010, May 2008
ENVIRONMENTENVIRONMENT
Com
petit
iven
ess
Com
petit
iven
ess

������������������ ������������������ �� ��� � ��������� �
���������������������� ��������������� ������������������������ ��������������� ��
���� �� ���������������� !�"���� �##���������������� ! �$
• � ����
• �����
• ������ ��� �
• ��� � �
• ���� ����
• !������������• !������������
• ������ ��
• " �#�$�����
%��& � '���!�( �������)#��! %*
• %����� ����&����� '(• %����� ����&����� '(
• � �����&����� )*
• +�������� ����� ,)
• -$��� *�
+��,�-��� �����$$�.�$$/ �$$+��,�-��� �����$$�.�$$/ �$$
/������#���� �$/
� � ����������� ���������

The core business of South African Tourism is the international marketing of South Africa
- Who?
ConsumersWho do we
organise against to win, and how?
- Where?
- What?
- When? Marketing
- How?
Copyright © 2008 South African TourismThe Marketing Tourism Growth Strategy 2008-2010, May 2008 12

… which forms part of a broader international tourism strategy…
Investment
International Tourism StrategyInternational Tourism Strategy
Investment
ProductDevelopment
Products
Who do we organise against
- Who?
- Where?
- What? Marketing Consumersorganise against to win, and how?
- What?
- When?
- How?
Marketing
Access- Visas
- FlightsChannels
Copyright © 2008 South African TourismThe Marketing Tourism Growth Strategy 2008-2010, May 2008 13
- Flights- Channels

… in combination with South Africa’s overall strategy for tourism: The Tourism Growth Strategy (TGS)
Investment
Domestic Tourism International Tourism StrategyInternational Tourism Strategy
Investment
ProductDevelopment
Products
-load
Dom
estic
Tou
rism
Bas
e-
Who do we organise against
- Who?
- Where?
- What? Marketing Consumers
Dom
estic
Tou
rism
Bas
e
organise against to win, and how?
- What?
- When?
- How?
Marketing
Dom
estic
Tou
rism
Bas
e
Access- Visas
- FlightsChannels
Copyright © 2008 South African TourismThe Marketing Tourism Growth Strategy 2008-2010, May 2008 14
- Flights- Channels

Critical questions in developing the Tourism Growth Strategy
What are our What are our goals and goals and
aspirations?aspirations?aspirations?aspirations?
Where willWhere willwe play?we play?
How will we How will we win in chosen win in chosen
markets?markets?
� What are the broader goals of tourism?
What What capabilities capabilities must be in must be in
place to win?place to win?
tourism?
� What role does SAT play in the tourism value chain?
� What countries should SAT focus on?
� What are the segments within
What What management management systems are systems are
required?required?
place to win?place to win?segments within these countries that SAT needs to target for growth?
� What are the segments that SAT needs to
� What are the marketing, facilitation, product and channel levers that must be addressed for � What implications
Copyright © 2008 South African TourismThe Marketing Tourism Growth Strategy 2008 – 2010, May 2008 15
required?required?SAT needs to defend its share in?
addressed for growth to take place?
� How we will build our brand?
� What implications does this have for SAT’s capability set?

Mandate and Key Strategic Objectives is the Vision for Tourism
Sustainable GDP Growth
Sustainable GDP Growth
Sustainable job creation
Sustainable job creation
Redistribution and transformation
Redistribution and transformation
The Tourism Act’s mandate to SA Tourism to SA Tourism
is ...
. . . through six key
objectives . . .
Increase in tourist volume
Increase in tourist volume
Increase in tourist spend
Increase in tourist spend
Increase length of stay
Increase length of stay
Improve geographic Improve geographic Improve seasonality Improve seasonality Promote Promote objectives . . . Improve geographic spread
Improve geographic spread
Improve seasonality patterns
Improve seasonality patterns
Promote transformation
Promote transformation
. . . by acting in a focused
Understand the market
Understand the market
Choose the attractive segments
Choose the attractive segments
Market the DestinationMarket the Destination
Monitor and learn Monitor and learn
Copyright © 2008 South African TourismThe Marketing Tourism Growth Strategy 2008 – 2010, May 2008 16
in a focused way to . . . Facilitate the
removal of obstaclesFacilitate the
removal of obstacles
Monitor and learn from tourist experience
Monitor and learn from tourist experience
Facilitate the product platform
Facilitate the product platform

In developing an integrated growth strategy for South African Tourism, trade-offs needed to be made across three key dimensions
TimeTimeTimeTime
� Demands for rapid� Demands for rapid– economic growth– social improvement– poverty alleviation– profitability
ScopeScopeResourcesResources
� Political capital� Legislative attention� Financial capital
– investment– operations
� Range of objectives� Range of markets and
customers� Range of products� Range of channels
Copyright © 2008 South African TourismThe Marketing Tourism Growth Strategy 2008 – 2010, May 2008 17
– operations� Leadership
� Range of channels� Breadth of participation

Therefore South African Tourism sees its role in the tourism sector in terms of what it actually does as an organisation and what it facilitates
Understand who is out there
DO the research to inform the choices about which market spaces we will ‘play’ inFACILITATE industry insights on customer product and there
Choose those who we can & want to get here
FACILITATE industry insights on customer product and service needs
DO the choice-making for SAT’s focus markets and segments and tourism brand developmentLEAD the choice-making process for other marketscan & want to get here
Get them here
LEAD the choice-making process for other markets
DO and LEAD marketing in focus markets and tourism brand developmentFACILITATE the unblocking of barriers (eg flights, visas)
Get them to the product
Get them here FACILITATE the unblocking of barriers (eg flights, visas)FACILITATE packaging for core markets
FACILITATE the tourist-product connect
Ensure they have a good experience
product FACILITATE appropriate product development
MONITOR tourist satisfaction and experienceLEARN from feedback
Copyright © 2008 South African TourismThe Marketing Tourism Growth Strategy 2008 – 2010, May 2008 18
good experience LEARN from feedbackFACILITATE learning by industry

������������������ ������������������ �� ��� � ��������� �
���������������������� ��������������� ������������������������ ��������������� ��
���� �� ���������������� !�"���� �##���������������� ! �$
• � ����
• �����
• ������ ��� �
• ��� � �
• ���� ����
• !������������• !������������
• ������ ��
• " �#�$�����
%��& � '���!�( �������)#��! %*
• %����� ����&����� '(• %����� ����&����� '(
• � �����&����� )*
• +�������� ����� ,)
• -$��� *�
+��,�-��� �����$$�.�$$/ �$$+��,�-��� �����$$�.�$$/ �$$
/������#���� �$/
� � ����������� ���������

A vision for tourism: the key challenges for tourism
The Tourism Act sets out clearly the mandate for SA Tourism and it is against that mandate that we make the strategic choices in the organisation. The mandate is delivered through the six key objectives that are levers for tourism growth. What is important to remember is that no one tourist can deliver all six objectives and that the strategy must look across the that no one tourist can deliver all six objectives and that the strategy must look across the globe for consumer segments and markets that can help us realise our goals.Since the transition to democracy in 1994, South Africans have become aware of the potential for tourism to play a meaningful role in contributing to the economic development of our country and our people. Government has prioritised tourism as one of five economic of our country and our people. Government has prioritised tourism as one of five economic growth sectors on which to focus its efforts to support investment and facilitate growth. The period of strong growth since 1990 has fundamentally changed the face of the tourism industry in South Africa. With a small domestic market and less than 1 million annual foreign arrivals in the two decades before 1990, we have grown to a destination that welcomed arrivals in the two decades before 1990, we have grown to a destination that welcomed more than 7 million visitors by 2005. The early stages of the TGS process involved wide-ranging interviews across the industry and a data-rich assessment of what key challenges needed to be addressed. In that process, the facts around past performance and the experience of the industry was that process, the facts around past performance and the experience of the industry was that whatever strategy emerged, it could only deliver against the mandate if it set an action programme that would successfully address eight key strategic challenges on an on-going basis. These eight challenges were identified as follows:
Copyright © 2008 South African TourismThe Marketing Tourism Growth Strategy 2008 – 2010, May 2008 20

CHALLENGE: Volume
Tourism arrivals have grown eight-fold since 1990, but further growth is essential if tourism is to make a meaningful impact on job creation and GDP growth. With the size of our population and unemployment levels, South Africa cannot be a high-end, low impact destination (ie niche) for a few wealthy foreigners. Tourists today lack the time and money destination (ie niche) for a few wealthy foreigners. Tourists today lack the time and money to travel for long holidays so we need focus on growing the volume. This does not deny the importance of the high value parts of the market. Instead, it implies the need to reach into and beyond the exclusive five- and four-star markets into the middle (three- and two-star) markets in order to achieve the volumes necessary to create jobs (three- and two-star) markets in order to achieve the volumes necessary to create jobs across the country. The TGS’s focus is on growing the cake not re-dividing it.Two of the associated challenges are therefore to make the country:1. More affordable, and 2. Open it to younger travellers in whom we could make a lifetime investment as potential repeat travellers to South Africa at different stages in their life.Against this background, South Africa has had to understand that volume growth needs to be pursued deliberately and systematically and that the ‘goodwill’ impact of the end of be pursued deliberately and systematically and that the ‘goodwill’ impact of the end of apartheid on tourism from 1990 had largely played out by 1998.Furthermore most of our arrivals come by land from our neighbouring states (where we have an outbound market share of 69% to 99%) so we need to look beyond the region for new growth. Volume is therefore a critical part of the portfolio review as we look at the high-
Copyright © 2008 South African TourismThe Marketing Tourism Growth Strategy 2008 – 2010, May 2008 21
new growth. Volume is therefore a critical part of the portfolio review as we look at the high-volume travel markets of the world (and in particular, the big long-haul markets) for overseas arrivals.

Evolution of international tourism to South Africa
7
8
9Foreign Tourist Arrivals to South Africa, 1965-2006
First Democratic
8,4m arrivals in 2006CAGR:
1998 – 2001: 0.3%
4
5
6
7
Arr
ival
s, m
illio
ns
First Democratic Elections
Nelson Mandela
Sanctions against South Africa lifted
1998 – 2005: 3.7%
1998 – 2006: 4.8%
2001 – 2005: 6.2%
2001 – 2006: 7.5%
1
2
3
State of Emergency
Arr
ival
s, m
illio
ns
Nelson Mandela released
Sanctions Era
01965 1967 1969 1971 1973 1975 1977 1979 1981 1983 1985 1987 1989 1991 1993 1995 1997 1999 2001 2003 2005
1970s and 80s – Stagnation� Stagnation drove low investment, focus on narrow white
domestic market and costs
1990-1998 – Growth� Initial period of short-term
profit-taking followed by period of investment growth and entry of foreign players
1998 onwards – Cyclicality� Global events, currency volatility
drive uncertainty and short-term strategy by firms
� Investment rates remain weak overall
Copyright © 2008 South African TourismThe Marketing Tourism Growth Strategy 2008 – 2010, May 2008 22
*based on opinion of participants interviewed, anecdotal evidenceSource: StatsSA, GCP Skills Review Interviews, 2004, WTTC (The 2003 T&T Economic Research): 2003, 2004 are estimates of employment
foreign players� Start of new focus on
skills and training
overall
� Skills development slow

Top outbound and long-haul outbound markets in the world – based on 2005 outbound numbers (excluding Sub-Saharan Africa)
83
66 64
5060708090
Top 40 outbound markets in the world – 2005
2005
38
33
22 22 22 21 19 18 17 16 16 14 14 12 10 10 8 8 8 8 7 7 7 7 7 7 6 6 6 5 5 5 5 4 4 4 4
01020304050
Ger
man
y
UK
US
A
Chi
na
Mal
aysi
a
Japa
n
Rus
sia
Italy
Hon
g K
ong
Can
ada
Fran
ce
Net
herla
nds
Sin
gapo
re
Ukr
aine
Mex
ico
Sw
eden
Sw
itzer
land
Rep
Kor
ea
Bel
gium
Turk
eyTa
iwan
Hun
gary
Aus
tria
Pol
and
Egy
pt
Bel
arus
Den
mar
k
Rom
ania
Rep
ublic
Indi
a
Finl
and
Nor
way
Irela
nd Iran
Spa
in
Indo
nesi
a
Bul
garia
Aus
tralia
Sau
diA
rabi
aLi
thua
nia
Mill
ion
Ger
man
y
UK
US
A
Chi
na
Mal
aysi
a
Japa
n
Rus
sia
Italy
Hon
g K
ong
Can
ada
Fran
ce
Net
herla
nds
Sin
gapo
re
Ukr
aine
Mex
ico
Sw
eden
Sw
itzer
land
Rep
Kor
ea
Bel
gium
Turk
eyTa
iwan
Hun
gary
Aus
tria
Pol
and
Egy
pt
Bel
arus
Den
mar
k
Rom
ania
Cze
chR
epub
licIn
dia
Finl
and
Nor
way
Irela
nd Iran
Spa
in
Indo
nesi
a
Bul
garia
Aus
tralia
Sau
diA
rabi
aLi
thua
nia
Top 20 Long Haul Outbound Markets - 2005Top 20 Long Haul Outbound Markets - 2005
Mill
ion
14.8
12.4
41
15202530354045
2005
Mill
ion
14.8
12.4
5.1
4.7
4.3
3.9
3.8
3.4
3.2
3.0
2.9
2.9
2.1
2.1
2.0
1.7
1.4
1.3
1.1
05
1015
USA
UK
Japa
n
Sw
eden
Mal
aysi
a
Can
ada
Chi
na
Ger
man
y
Aus
tralia
Fran
ce
Sin
gapo
re
Indi
a
Indo
nesi
a
Rep
Kor
ea Italy
Egy
pt
Rus
sia
Bra
zil
Isra
el
UAE
Long Haul
Copyright © 2008 South African TourismThe Marketing Tourism Growth Strategy 2008 – 2010, May 2008 23
Note: Long haul outbound data was calculated using the proportions estimated from WTO data source and applying it to the Euromonitor data. It is the closest approximation as this data is not available. Data for the USA was sourced from U.S. Department of Commerce, ITA, Office of Travel and Tourism Industries, September 2006 as 2005 WTO data was incomplete and skewed the results.Source: Euromonitor IMIS, WTO Yearbook of Tourism Statistics 2006
Ger
man
y
Sin
gapo
re
Indo
nesi
a
64% 22% 56% 36% 14% 22% 10% 5% 83% 17% 19% 47% 60% 21% 10% 27% 8% 55% 34% 38%
Long Haul as a % of
total outbound

Short-haul dominates foreign tourism while VFR is the biggest generator of domestic trips
While we have grown the size of total arrivals, the proportion of long-haul travellers to short-haul has decreased from 31% in 2004 to 27% in 2005.
Most of our foreign tourist arrivals come by land from neighbouring countries where the we currently have
International arrivals to SA – Long-haul vs. Short-haul
Regional share of arrivals to South Africa, 2005
Breakdown of short haul arrivals to South Africa, 2005 neighbouring countries where the we currently have
high market share and the challenge is to get these tourists to come more often or travel to South Africa to do different activities.
The growth potential in the long-haul market (ie flying time of more than five hour) is bigger as our market
Short-Haul5,343,849
(73%)Long-Haul2,024,893
(27%) 40%
50%
60%
70%
80%
90%
100%
Neighbouring States(92.7%)
Other S/H (7.3%)
Africa, 2005 South Africa, 2005
time of more than five hour) is bigger as our market share is low.
(27%)
0%
10%
20%
30%
40%
Total arrivals 2005 - 7,368,742
25.0
30Number of Domestic Trips by Trip Purpose: 2005
The main purpose of travel in South Africa is to visit
Source: StatsSA, SA Tourism analysis
25.0
15
20
25
Trips (MM)
The main purpose of travel in South Africa is to visit friends and relatives (VFR) 25 million trips. The
second largest is holiday (4,5 million trips). The third largest reason for travel is for religious reasons.
But holiday travel is the biggest generator of revenue so is the focus of the strategy to grow domestic
4.53.7
2.30.7
0
5
10
VFR Holiday Religious Business Medical
Copyright © 2008 South African TourismThe Marketing Tourism Growth Strategy 2008 – 2010, May 2008 24
so is the focus of the strategy to grow domestic travel in our country.
2%6%10%12%69%Share of Total Trips 2%6%10%12%69%Share of Total Trips
Source: SA Tourism Domestic Tourism Surveys for February 2005 until January 2006

Extending beyond the high-end game
South Africa’s positioning in overseas markets has historically been predominantly aimed at South Africa’s positioning in overseas markets has historically been predominantly aimed at the high-value, low impact market making our country an expensive destination that few tourists could afford
Where we are Where we want to be
Opening up the appeal of the destination DOES NOT mean that we 10
12High
10
12High
Where we are Where we want to be
NOT mean that we will no longer serve the high value end of the market, rather it implies that clusters of tourism products
8
Value
8
Valueof tourism products will reconfigure themselves to successfully serve a range of segments from the high-end
4
6
4
6
from the high-end segment to three-and two-star tourists
0
2
Low0
2
Low
Where we DON’T
want to be
Copyright © 2008 South African TourismThe Marketing Tourism Growth Strategy 2008 – 2010, May 2008 25
00 2 4 6 8 10 12
Volume
Low High0
0 2 4 6 8 10 12Volume
Low High

CHALLENGE: Value
Tourism is often called the “new gold” of the International arrivals to SA – Long-haul vs. Short-haul
Regional share of arrivals to South Africa, 2005
Breakdown of short haul arrivals to South Africa, 2005
Tourism is often called the “new gold” of the South African economy as the total foreign direct spend of tourists has overtaken gold foreign exchange earnings[1]. Two of the key challenges around increasing value from
Short-Haul5,343,849
(73%)Long-Haul2,024,893
(27%)30%
40%
50%
60%
70%
80%
90%
100%
Neighbouring States(92.7%)
Other S/H (7.3%)challenges around increasing value from tourism are to:1. Maximise the spend of our current travellers to increase revenues, and
0%
10%
20%
30%
Total arrivals 2005 - 7,368,742
Source: StatsSA, SA Tourism analysis
to increase revenues, and 2. Maximise the relationship between volume and value in our choice of markets such that we maximise the return on the marketing effort. Source: StatsSA, SA Tourism analysiseffort.While the contribution of tourism to South Africa’s GDP is round R120 billion[2] and has outperformed all other sectors in terms of both GDP and job creation[3], there remain
3,226
4,326
4,000
5,000Monthly Spending by Domestic Tourists: 2005
Total 2005 Spend: R21.2 BillionTotal 2005 Spend: R21.2 Billion
GDP and job creation[3], there remain opportunities to extract further value. Compared with our global competitors for example, we appear to be under-performing our potential. 503
2,264
1,266 1,165
496
2,596
1,179
1,8031,525
8101,000
2,000
3,000Rand (MM)
Copyright © 2008 South African TourismThe Marketing Tourism Growth Strategy 2008 – 2010, May 2008 26
our potential.1] Standard Bank quoted in Business Day 12 October 2004
[2] WTTC & Accenture – South Africa Travel and Tourism Climbing to New Heights, 2006
[3] Gearing up to be Globally Competitive: DEAT, the DTI and SAT Global Competitive Study (2003/4) www.southafrica.net\research
0Jan Feb Mar Apr May Jun Jul Aug Sep Oct Nov Dec
20%7% 4%2% 12% 6%6% 6% 9%11%2%15%% of Total Spend 20%7% 4%2% 12% 6%6% 6% 9%11%2%15%% of Total Spend
Source: SA Tourism Domestic Tourism Surveys for February 2005 until January 2006

South Africa needs more arrivals than its competitors to create a job
Number of Foreign Arrivals per Direct Tourism Employee1 , 1998-2002
Num
ber o
f Arr
ival
s pe
r Dire
ct T
ouris
m E
mpl
oyee
12
14
Australia
Num
ber o
f Arr
ival
s pe
r Dire
ct T
ouris
m E
mpl
oyee
8
10
12
Brazil
Kenya
Num
ber o
f Arr
ival
s pe
r Dire
ct T
ouris
m E
mpl
oyee
4
6 SA
Thailand
Num
ber o
f Arr
ival
s pe
r Dire
ct T
ouris
m E
mpl
oyee
0
2
1998 1999 2000 2001 2002
US
The ratio for the well established tourism destinations of Australia, Thailand and the US may suggest the optimal ratio for serving visitors. Is SA trading off ‘effectiveness’ for
‘efficiency’?
Copyright © 2008 South African TourismThe Marketing Tourism Growth Strategy 2008 – 2010, May 2008 27
1 Only employees directly employed in the tourism sector were used to do this calculationSource: WTTC (The 2003 T&T Economic Research) , BTR, ITA Office of Travel and Tourism Industries, Tourism Authority of Thailand, Embassy of Brazil in London, SAT
‘efficiency’?

Australia creates more jobs and value than South Africa
The Global Competitiveness study benchmarked South Africa tourism’s performance externally against our biggest global competitors (Australia, Brazil, Kenya and Thailand) while also internally against other sectors of the economy*.Whereas Australia creates one job for every eight foreign arrivals, South Africa creates a job Whereas Australia creates one job for every eight foreign arrivals, South Africa creates a job for every 12 arrivals. According to the World Travel and Tourism Council, the global standard is that every eight foreign arrivals should create one direct job in the host country. Value-capture per employee is also an important benchmark. For every direct employee in the tourism sector, Australia earns US$ 12,232 in receipts compared with South Africa the tourism sector, Australia earns US$ 12,232 in receipts compared with South Africa which earns US$ 7,002 per employee per year. These results can be explained by the very different market demographics of the two destinations. South African tourism is dominated by a domestic market that has limited resources, and a foreign market drawn largely from neighbouring states which are less resources, and a foreign market drawn largely from neighbouring states which are less developed than our own.Research into the travel patterns of tourists from neighbouring states (and many overseas business travellers) reveals significant missed opportunities. These range from the lack of availability of desired products in our experience (particularly cultural tourism) through to availability of desired products in our experience (particularly cultural tourism) through to limited night activities as many tourists stay in their hotels for fear of their safety.Thus, growth, jobs and transformation need to be underpinned by a deliberate strategy to increase the value of tourism arrivals through either/or encouraging more frequent travel,
Copyright © 2008 South African TourismThe Marketing Tourism Growth Strategy 2008 – 2010, May 2008 28
increasing the length of stay, as well as increasing the average spend per day during a trip.
* Tourism outperforms all priority sectors of the SA economy in terms of job creation and contribution to GDP, Global Competitive Study 2003

Australia outperforms the competition in value capture per employee
20,000
Australia
Total Foreign Direct Spend in Country per Employee, 1998 – 2002 CAGR
Tota
l Dire
ct S
pend
in C
ount
ry p
er E
mpl
oyee
(US
$) 4.7% (99-02)
Average Tourist Receipts US$
12,232 (02)
12,000
16,000Thailand
Brazil
Tota
l Dire
ct S
pend
in C
ount
ry p
er E
mpl
oyee
(US
$)
7.5% (99-02) 5,448(02)
4.5% (98-02) 1,419(02)
8,000Kenya
US
Tota
l Dire
ct S
pend
in C
ount
ry p
er E
mpl
oyee
(US
$)
-1.4% (98-02) 10,233(02)
-17.4% (98-99 Y-O-Y)
1,261(99)
0
4,000
US
South AfricaTota
l Dire
ct S
pend
in C
ount
ry p
er E
mpl
oyee
(US
$)
-1.4% (98-02) 10,233(02)
8.2% (98-02) 7,664(02)
01998 1999 2000 2001 2002
South Africa’s value extraction is reasonable, but the larger questions are how to grow employment (to Australian levels per tourist) and increase value capture
Copyright © 2008 South African TourismThe Marketing Tourism Growth Strategy 2008 – 2010, May 2008 29
employment (to Australian levels per tourist) and increase value capture
Source: WTTC; BTR, Tourism Authority of Thailand, Embassy of Brazil in London, ITA Office of Travel and Tourism Industries

Another way to increase value to increase length of stay but the global trend is towards more short (rather than few long) holidays
South Africa’s average length of stay is significantly affected by the high proportion of land
Length of Stay, 900
Distribution of South African Arrivals by Length of Stay, 2002
South Africa’s average length of stay is significantly affected by the high proportion of land travellers who typically stay for 2 days but the average of 10 days is line with global trends
Length of Stay, South Africa Vital Statistics:
700
800 Air Arrivals
Land Arrivals
Total Arrivals
� Average length of Stay1:
– All tourists: 10 days
– Land arrivals: 7.7 days
400
500
600Total Arrivals
Arr
ival
s, 0
00s
– Land arrivals: 7.7 days
– Air arrivals: 14.5 days
� Most common length of stay2:
– All tourists: 2 days
200
300
400
Arr
ival
s, 0
00s
– All tourists: 2 days
– Land arrivals: 2 days
– Air arrivals: 7 days
0
100
1 2 3 4 5 6 7 8 9 10 11 12 13 14 15 16 17 18 19 20 21 22 23 24 25 26 27 28 29 30
30 Copyright © 2008 South African TourismThe Marketing Tourism Growth Strategy 2008 – 2010, May 2008
1 2 3 4 5 6 7 8 9 10 11 12 13 14 15 16 17 18 19 20 21 22 23 24 25 26 27 28 29 30
1 Average length of stay calculated as a weighted average (weighted by relative proportion of source countries)2 Most common length of stay is the statistical mode Source: SAT Departure Survey, 2002
Length of Stay, #nights in SA

Internally, the tourism sector is the only priority1 sector showing positive growth in employment and GDP, however transformation levels are poor
2%
Growth in Employment vs. Growth in GDP Contribution (1998-2002)Positive
growth
0%
1%
Employment
Clothing
TourismOn an Internal Basis� Tourism is performing well
relative to the other priority
-1%
0%Employment (CAGR:98-02)
Machinery
Chemicals
Automotivesrelative to the other priority sectors and is creating jobs and value
� However, transformation
-3%
-2%Agro Processing
Metals
Negative growth
However, transformation of the tourism levels in the industry are poor
-5% 0% 5% 10%
Contribution to GDP (CAGR: 98-02)
growth
Positive growth
Negative growth
The Marketing Tourism Growth Strategy 2008 – 2010, May 2008 31 Copyright © 2008 South African Tourism
Note: 1 Priority sectors as identified by Cabinet, CAGR applied to each sector for period 1998-2002, Tourism GDP values are estimatesSource: DTI; Quantec, 2004; SAT; Monitor Analysis, GCP Phase 1 2004

CHALLENGE: Transformation
Aligned to the goal of tourism value reaching an ever-widening circle of our nation is the important challenge of ensuring the direct participation by the previously disadvantaged majority in the industry. Tourism is still predominantly white–owned and white-managed.The imperative to transform goes beyond the desire to extend economic participation alone. The imperative to transform goes beyond the desire to extend economic participation alone. Transformation is in many ways a key opportunity and requirement for future growth. Apart from the fact that unless transformation occurs there won’t be enough managers or businesses to meet the demand for new capacity. There exist clear signals in the market that transformation will be the key to unlocking new opportunities for growth.that transformation will be the key to unlocking new opportunities for growth.Consumer research has revealed that foreign tourists are exposed to fewer and less authentic cultural experiences than they expect or desire. The uniqueness of our diverse cultures, both in their historical and modern forms, represent a significant opportunity for South Africa’s competitiveness globally – exactly because this speaks directly to one of the South Africa’s competitiveness globally – exactly because this speaks directly to one of the key drivers of outbound Western markets: the desire to experience another culture. In the domestic market, the challenges of growing tourism in emerging tourism segments is in many respects dependent on new offerings becoming available. Despite conventional wisdom, emerging tourism segments want many of the same things as the foreign market –and they want it delivered by an industry that represents the totality of South African society. The mandate of the TGS process is to develop an approach that not only supports the transformation agenda, but which also specifically seeks out sources of growth through
Copyright © 2008 South African TourismThe Marketing Tourism Growth Strategy 2008 – 2010, May 2008 32
transformation agenda, but which also specifically seeks out sources of growth through transformation.

CHALLENGE: Distribution
If tourism is to impact significantly on poverty and unemployment, then tourism must develop in areas beyond the traditional tourism routes and nodes currently used. Provincial-level data
11.2
9.09
12All TripsHoliday Trips
Number of Annual Trips FROM Each Province: 2005
nodes currently used. Provincial-level data reveals that Gauteng and the Western Cape enjoy the bulk of tourism receipts as these are the two areas visited by most foreign tourists. In the domestic market, KwaZulu Natal has the
3.9
3.12.6 2.4 2.1
1.30.6
1.5
3
6Trips (MM)
the domestic market, KwaZulu Natal has the highest visitors but most of them are from the province. The challenge for the TGS process was to seek opportunities to extend the access to market for
0.60.30.2
0.70.40.30.20.40.6
0KZN Gauteng N. West Limpopo E. Cape W. Cape Free State Mpum. N. Cape
Source: SAT Domestic Surveys for 2005
13%
31%
34%
25%
8%
11%
5%
9%
6%
7%
9%
7%
15%
6%
5%
4%
6%
2%
% of Holiday Trips
% of Total Trips
13%
31%
34%
25%
8%
11%
5%
9%
6%
7%
9%
7%
15%
6%
5%
4%
6%
2%
% of Holiday Trips
% of Total Trips
opportunities to extend the access to market for less-developed provinces. In part, this would include developing products to encourage international tourists to increase the average number of provinces visited on a trip (or to return
The second aspect involves choosing consumer segments in markets who are interested in exploring the country.While UK and USA tourists tend to visit one number of provinces visited on a trip (or to return
to visit new and different places), and to encourage new and existing domestic travellers to explore destinations outside their traditional patterns. For this to be successful new products
While UK and USA tourists tend to visit one to two provinces, there are segments in France, Germany and the Netherlands who go off well-known tourist routes and explore less visited places. The latter two markets
Copyright © 2008 South African TourismThe Marketing Tourism Growth Strategy 2008 – 2010, May 2008 33
patterns. For this to be successful new products must meet the desired experience of these consumers (ie not ‘build it, and they will come’).
less visited places. The latter two markets also have high repeater rates to our country.

CHALLENGE: Tourism value from long-haul travel was being captured mainly by three provinces — adding up to 76% of the tourism receipts
8.9
Average Length of Stay per Province by Long-Haul Tourists to South Africa — Departure Surveys (2005)
LowMedium
7.15.2
3.8
MediumHigh
9.95.6
3.8
Share of Nights Spent by
KZN15.7%
Other 23.8%
9.9
6.2
5.6Share of Nights Spent by
Province (2005)
Gauteng20.6%
Western Cape 39.9%
15.7%
7.8
11.9

CHALLENGE: Seasonality
Like many other destinations, South Africa faces the challenge of seasonality in domestic and foreign arrivals. Domestic travel patterns follow the patterns around school, religious and traditional holidays, with strong peaks at year-end and Easter.The seasonality of foreign arrivals varies by region (driven by market-specific and traditional The seasonality of foreign arrivals varies by region (driven by market-specific and traditional holiday patterns). Overseas arrivals, dominated by significant numbers of VFR arrivals and the tradition of the “big trip” being in the European winter, result in a strong peak starting in October and ending in February. June is traditionally South Africa’s lowest month and for some key overseas markets represents almost half of the arrivals for the year-end peak.some key overseas markets represents almost half of the arrivals for the year-end peak.These seasonal patterns present a significant challenge for product owners and transport operators as business profitability and job sustainability is a function of activity throughout the year. Both costs and investment must therefore be made in line with expected total annual revenues.annual revenues.To invest ahead of growth in an environment where new demand will be further concentrated at one particular time of the year doesn’t make business sense. For this reason we experience the perennial issue of limited seat availability on airlines in the peak. reason we experience the perennial issue of limited seat availability on airlines in the peak. At the same time, the impact of employment is also sub-optimal as jobs increasingly become seasonal and temporary in nature. Against this background, the TGS and Portfolio Review looks for opportunities to address this challenge – particularly through finding new market segments (domestic and
Copyright © 2008 South African TourismThe Marketing Tourism Growth Strategy 2008 – 2010, May 2008 35
this challenge – particularly through finding new market segments (domestic and international) whose travel patterns may be more flexible so we can extend the season and/and reduce the level of the gap between high and low months.

Seasonality patterns vary by region but are a m
ajor constraint on capacity for grow
th
The deep seasonal pattern of arrivals created significant challenges for investing in
20
The deep seasonal pattern of arrivals created significant challenges for investing in capacity to serve increased dem
and as well as sustainability of jobs and current product
Europe (02-05)
Asia (02-05)
20 40 60 80
100
120
140
160
0 5 10 15 20
Arrivals to S
outh Africa (2002-2005)
8000
Jan-02
Apr-02
Jul-02
Oct-02
Jan-03
Apr-03
Jul-03
Oct-03
Jan-04
Apr-04
Jul-04
Oct-04
Jan-05
Apr-05
Jul-05
Oct-05
0
Jan-07
Apr-07
Jul-07
Oct-07
Jan-07
Apr-07
Jul-07
Oct-07
Jan-07
Apr-07
Jul-07
Oct-07
Jan-07
Apr-07
Jul-07
Oct-07
Arrivals (000’s)
400
500
600
700
30
Arrivals (000’s)
100
200
300
400
North A
merica (02-05)
Africa (02-05)
500
600
0 5 10 15 20 250
Jan-02Apr-02Jul-02
Oct-02Jan-03Apr-03Jul-03
Oct-03Jan-04Apr-04Jul-04
Oct-04Jan-05Apr-05Jul-05
Oct-05
0
100
200
300
400
500
Jan-02
Jul-02
Oct-02
Jan-03
Jul-03
Oct-03
Jan-04
Jul-04
Oct-04
Jan-05
Jul-05
Oct-05
0
Jan-02
Apr-02
Jul-02
Oct-02
Jan-03
Apr-03
Jul-03
Oct-03
Jan-04
Apr-04
Jul-04
Oct-04
Jan-05
Apr-05
Jul-05
Oct-05
Source: S
tatsSA
Jan-02
Apr-02
Jul-02
Oct-02
Jan-03
Apr-03
Jul-03
Oct-03
Jan-04
Apr-04
Jul-04
Oct-04
Jan-05
Apr-05
Jul-05
Oct-05

Over-exposure to Europe and Africa raised the need to spread the risk globally and invest in Asia and the Americas
EuropeEurope
� 1,308,634 arrivalsNorth AmericaNorth America
� 274,281 arrivals� 3.7% of total
� 1,308,634 arrivals� 17.8% of total
Middle East
� 33,551 arrivals0.5% of total
AsiaAsia
� 179,142 arrivals� 2.4% of total
� 0.5% of total
Central & South America
� 47,818 arrivals� 0.7% of total
� 2.4% of total
AustralasiaAustralasia
� 95,818 arrivals1.3% of total
AFRICAAFRICA
� 4,642,071 arrivals (Total Africa)� 72.9% of total
� 1.3% of total
Other
� 0.8% of total� 5,356,512 arrivals from mainland
Africa� 72.7% of total
� 0.8% of total
Source: StatsSA

CHALLENGE: Risk Management
Tourism industries, particularly those which are heavily dependent on foreign source markets, are vulnerable to unpredictable events outside of their spheres of direct influence. The last two decades have seen national tourism industries buffeted by a series of events from the Asian economic crisis, the events of 9/11, and the Asian SARS virus to the from the Asian economic crisis, the events of 9/11, and the Asian SARS virus to the Tsunami of December 2004.Destinations like Australia, South Africa and Brazil have in addition faced challenges around global exchange rate fluctuations which have made price consistency management and competitiveness challenging. competitiveness challenging. Some of the cyclicality in South Africa’s growth performance can be attributed in part to an over-dependence on a narrow set of source markets – mainly neighbouring states and Europe. The TGS process was therefore mandated to find an approach that ensured that limited marketing resources were deployed in a fashion that achieved an appropriate balance between the need to focus as well as reducing the level of dependence on a set of markets in one or two economic regions.in one or two economic regions.
Copyright © 2008 South African TourismThe Marketing Tourism Growth Strategy 2008 – 2010, May 2008 38

CHALLENGE: Sustainability
The recognition that South Africa’s competitive strategy needed a fundamental review was accompanied by a clear desire that future growth must be sustainable in the long run.While the patterns of growth in recent years suggest that there will always be periods of growth and followed by periods of consolidation, these should not become patterns of boom growth and followed by periods of consolidation, these should not become patterns of boom and bust driven by short-term tactical approaches to market opportunities. Instead, growth in our industry must become about sustained investment behind clear choices around how to differentiate ourselves in important target markets for the future development of our destination.destination.Thus the mandate to the TGS process was that the choices made about which markets to target, how to re-position the brand, and how we compete in the channel and the market, needed to be choices about the long term.These choices would have to enable South Africa to differentiate itself from the world in a These choices would have to enable South Africa to differentiate itself from the world in a way that is compelling to consumers, internally consistent, practical to implement, inspiring of confidence in investors and the industry, and clear and action-oriented in its message about what needs to be done.
Copyright © 2008 South African TourismThe Marketing Tourism Growth Strategy 2008 – 2010, May 2008 39

The core challenges identified are symptomatic of powerful patterns of change in the global tourism markets
More Complex Consumer More Complex Consumer SegmentationSegmentation Intensifying Competition
Consolidation and Consolidation and Specialisation in the Specialisation in the
ChannelChannel
Fragmentation within Fragmentation within Local Tourism ClustersLocal Tourism ClustersSegmentationSegmentation ChannelChannel Local Tourism ClustersLocal Tourism Clusters
“COMMODITISATION”
Category “trap” (Eg Sun Category “trap” (Eg Sun & Beach, Resort)& Beach, Resort)
Undifferentiated competitive positioning
Increasing value capture Increasing value capture within the channelwithin the channel
Destructive internal Destructive internal rivalryrivalry
Declining Growth Internal convergence in product offerings
Copyright © 2008 South African TourismThe Marketing Tourism Growth Strategy 2008 – 2010, May 2008 40
� Declining Growth
� Declining Yields
� Internal convergence in product offerings
� Limited Innovation and Competitive Upgrading

With product offerings that overlap so much, it’s easy to offer a diversity of offerings - and become commoditized in the process
‘CULTURE’‘ADVENTURE’
‘EXOTIC’
‘CUISINE’‘SPORT’
The combined product offerings of
‘ANY
‘CUISINE’‘SPORT’
‘ANY
COUNTRY’
‘NATURAL BEAUTY’
‘SUN AND SAND’‘DISCOVERY’
‘NATURAL BEAUTY’
‘CITIES’
Copyright © 2008 South African TourismThe Marketing Tourism Growth Strategy 2008 – 2010, May 2008 41Source: Composite of offerings/pictures from the countries studied
‘MOUNTAINS’‘WILDLIFE’

CHALLENGE: Competitiveness
All of the challenges described before ultimately come back to a single key proposition: South Africa, in order to achieve sustained growth, must to be able to differentiate itself from its competitors now and for future growth.In a dynamic world market, differentiation requires constant innovation and renewal because In a dynamic world market, differentiation requires constant innovation and renewal because tourism is rife with the practice of replicating good ideas and not so good at creating new ones. So flavour of the month soon becomes yesterday’s news.An industry that is innovative is one that is characterised by businesses, institutions and organisations that are informed, sophisticated in their outlook and constantly investing to upgrade their performance against their consumer’s every changing needs and choices.While there is evidence of many new and interesting things happening all the time – in terms of offerings, products, and experiences – in the mind of consumers globally, South Africa of offerings, products, and experiences – in the mind of consumers globally, South Africa remains, on the whole, much the same as what it was 10 to 15 years ago. South Africa is still perceived mainly as an adventurous wildlife destination with striking natural beauty. Most consumers globally have low levels of travel awareness about South Africa and regard our country as generally unsafe and often unstable as well. Our cultural assets are largely our country as generally unsafe and often unstable as well. Our cultural assets are largely unclear in the consumer’s mind, and undifferentiated from the rest of the continent.
Copyright © 2008 South African TourismThe Marketing Tourism Growth Strategy 2008 – 2010, May 2008 42

Challenges that remain going forward
Internally, our tourism industry remains fragmented, and often inter-company, inter-provincial and inter-city competitive behaviour is destructive. Firms at different parts of the value chain often struggle to find opportunities for co-operation and collaboration, leaving the space open for stronger players higher up the value chain to exert considerable influence over pricing, packaging and the shape of the value proposition.Tourism value-chains are still under-developed, and linkages across the industry are still generally fragmented and shallow. Supporting institutions and organisations, whether public generally fragmented and shallow. Supporting institutions and organisations, whether public or private, are relatively new and face periodic crises of confidence and legitimacy as they struggle to find adequate skills and resources.Thus the mandate for the TGS process was extended in 2003 to move beyond the challenges of competitive go-to-market strategies in target markets. The next stage had to challenges of competitive go-to-market strategies in target markets. The next stage had to extend into identifying what needed to be done in order to upgrade the micro-economic context within which tourism firms operate (i.e. the business environment) and where new platforms to support competitiveness need to be established.All of the eight challenges described above have to be addressed in ways that recognise the All of the eight challenges described above have to be addressed in ways that recognise the realities of a dynamic and difficult global market. Whatever the TGS process came up with, it had to be bold in its ambitions, and at the same time realistic about what constraints are imposed by the realities of global markets.
Copyright © 2008 South African TourismThe Marketing Tourism Growth Strategy 2008 – 2010, May 2008 43

The global context continues to challenge us to make tough choices
� Despite increases in overall funding of the marketing campaign, the total budget is small in global terms, and as the currency weakens, is getting smaller. SA Tourism needs to focus its efforts and resources on those countries and customer segments which are most valuable
Focus effort and Focus effort and resourcesresources
on those countries and customer segments which are most valuable to South Africa.
� Arrivals to South Africa are still too dependent on a few large markets. The mix of arrivals needs to lessen dependence on volatile markets and at the same time increase our share in high-value ReRe--balance the balance the markets and at the same time increase our share in high-value markets.
ReRe--balance the balance the portfolioportfolio
� Generic ‘spray and pray’ marketing, and increased commoditisation of the offering by channels, results in averaging and low returns. SA’s of the offering by channels, results in averaging and low returns. SA’s marketing has to focus on specific sets of consumers (and the specific channels that serve them), and speak directly to their specific holiday buying criteria. We need to move from pushing what we like about SA to delivering to consumers what they want and in line with
Marketing to be Marketing to be based on a view based on a view
of customersof customersabout SA to delivering to consumers what they want and in line with our tourism brand.
� Behind the strategy the tourism industry needs to redefine and upgrade products and services to deliver against the promise offered by the marketing message.
Create alignment Create alignment within the within the
The Marketing Tourism Growth Strategy 2008 – 2010, May 2008 44 Copyright © 2008 South African Tourism
offered by the marketing message.within the within the
tourism sectortourism sector

Defending share while pursuing new growth opportunities
SA Tourism needs to mount a defense of share in our areas of strength while at the same SA Tourism needs to mount a defense of share in our areas of strength while at the same time aggressively pursuing growth in volume, value and reducing seasonality.
Travel Categories
Growth Growth
Travel Categories
Our targeted growth areas are:-
� Leisure travel (domestic and international)Growth
in volume
Growth in
Revenue
Defend the Current Position
international)
� Business Tourism (conferences, meetings and incentive travel)
� Opportunistic marketing (these Position � Opportunistic marketing (these are large one-off marketing opportunities leveraged off other events eg the 2003 Cricket World Cup, the 2010 Soccer World Cup,
Reducing Seasonal Variations
Cup, the 2010 Soccer World Cup, the World Summit on Sustainable Development in 2003, the North Sea Jazz in Cape Town, Fashion Week
Copyright © 2008 South African TourismThe Marketing Tourism Growth Strategy 2008 – 2010, May 2008 45
Week

������������������ ������������������ �� ��� � ��������� �
���������������������� ��������������� ������������������������ ��������������� ��
���� �� ���������������� !�"���� �##���������������� ! �$
• � ����
• �����
• ������ ��� �
• ��� � �
• ���� ����
• !������������• !������������
• ������ ��
• " �#�$�����
%��& � '���!�( �������)#��! %*
• %����� ����&����� '(• %����� ����&����� '(
• � �����&����� )*
• +�������� ����� ,)
• -$��� *�
+��,�-��� �����$$�.�$$/ �$$+��,�-��� �����$$�.�$$/ �$$
/������#���� �$/
� � ����������� ���������

Our Focus: Where to play?
The strategy for growth defines how limited marketing resources will be employed to drive growth from selected high-potential target categories, markets and consumer segments when measured against our objectives. Those choices are guided by a core principle: we defend our current position while we look Those choices are guided by a core principle: we defend our current position while we look for, and pursue, opportunities for growth in both leisure and business tourism. The core of SAT’s business is marketing in the leisure and the business tourism markets. Leisure (which combines holiday travel and visiting friends and relatives (VFR) as well as domestic and international travel) and business tourism (as opposed to business travel) domestic and international travel) and business tourism (as opposed to business travel) are areas of focus because they are forms of travel that involve active choices that can be influenced through marketing. Business travel is driven by the interests of a particular business and is therefore difficult to influence. Here the opportunities is to get the business traveller to extend his/her trip by a influence. Here the opportunities is to get the business traveller to extend his/her trip by a few days for leisure, or return later for leisure. In both cases the ROI is difficult to measure.Event marketing is driven by leveraging off major events that are not part of our core business. There are two major aspects to this activity that support our key objectives – (1) business. There are two major aspects to this activity that support our key objectives – (1) getting more people to attend the event and thereby growing volume and value, and (2) using the event to position the country by building awareness of the destination.
SAT is organised internally around four regional geographies:
Copyright © 2008 South African TourismThe Marketing Tourism Growth Strategy 2008 – 2010, May 2008 47
SAT is organised internally around four regional geographies:(1). Africa and Middle East (including domestic and regional land travel) (2.) The Americas and
the UK (3) Asia and Australasia (4) Europe

To obtain growth and defend the current shares, the strategy needed to integrate the approach through focusing the five key drivers
Different countries and /or segments drive growth in different waysDifferent countries and /or segments drive growth in different ways
1.1. Retain usesRetain uses by by existing consumersexisting consumers
1. Maintain current purchasing pattern by 1. Maintain current purchasing pattern by existing travellers and segmentsexisting travellers and segments
Existing Existing ConsumersConsumers
2.2. Stimulate current Stimulate current usesuses with existing with existing
existing consumersexisting consumers
2. Stimulate current consumers to come 2. Stimulate current consumers to come here more often and for longerhere more often and for longer
existing travellers and segmentsexisting travellers and segments
ConsumersConsumers
3.3. Generate new Generate new usesuses by existing by existing
usesuses with existing with existing consumersconsumers
3. Stimulate current consumers to come 3. Stimulate current consumers to come here for new purposes, experiences and here for new purposes, experiences and
here more often and for longerhere more often and for longer
usesuses by existing by existing consumersconsumers
4.4. AttractAttract newnew--toto--youyou
here for new purposes, experiences and here for new purposes, experiences and offeringsofferings
4. Convert consumers and segments from 4. Convert consumers and segments from
New New ConsumersConsumers
5. Attract 5. Attract newnew--to to
4.4. AttractAttract newnew--toto--youyouconsumersconsumers
5. Convert low5. Convert low--frequency or nonfrequency or non--travellers travellers into frequent travellers, or shortinto frequent travellers, or short--haul haul
4. Convert consumers and segments from 4. Convert consumers and segments from the competitor to South Africathe competitor to South Africa
Copyright © 2008 South African TourismThe Marketing Tourism Growth Strategy 2008 – 2010, May 2008 48
5. Attract 5. Attract newnew--to to categorycategory consumersconsumers
into frequent travellers, or shortinto frequent travellers, or short--haul haul travellers to longtravellers to long--haul travellershaul travellers

60% of South Africa’s arrivals are from our 5 neighbouring states
Given the high market share already in SADC and the absence of any true competition, the Given the high market share already in SADC and the absence of any true competition, the strategy for SADC shifts to one of ‘defend’ and the extraction of additional value. Outside of neighbouring SADC however, there is scope to attract smaller high-end leisure volumes which in the long term may provide growth in markets in East and West Africa
1.1. Retain usesRetain uses by by existing consumersexisting consumers
Existing Existing ConsumersConsumers
(SADC)(SADC)
2.2. Stimulate current Stimulate current usesuses with existing with existing consumersconsumers(SADC)(SADC)
3.3. Generate new Generate new usesuses by existing by existing consumersconsumers
New ConsumersNew Consumers
(East and West (East and West
4.4. AttractAttract newnew--toto--youyouconsumersconsumers
Copyright © 2008 South African TourismThe Marketing Tourism Growth Strategy 2008 – 2010, May 2008 49
(East and West (East and West Africa)Africa) 5. Attract 5. Attract newnew--to to
categorycategory consumersconsumers

For countries outside of Africa, the focus for South Africa was to leverage all the growth drivers in the overseas (non-continental Africa) markets
The real growth for South Africa is to focus the portfolio on countries and markets that are attractive from a volume and value perspective and from which South Africa can get the greatest yield in the short- to medium-term. Clearly some markets are more seasonal than others. Category conversion (ie from short-haul to long-haul travel) would be the most others. Category conversion (ie from short-haul to long-haul travel) would be the most difficult to do
1.1. Retain usesRetain uses by by existing consumersexisting consumers
Existing Existing ConsumersConsumers 2.2. Stimulate current Stimulate current
usesuses with existing with existing consumersconsumers
3.3. Generate new Generate new usesuses by existing by existing consumersconsumers
New New ConsumersConsumers
4.4. Attract newAttract new--toto--you you consumersconsumers
Copyright © 2008 South African TourismThe Marketing Tourism Growth Strategy 2008 – 2010, May 2008 50
ConsumersConsumers5. Attract new5. Attract new--to category to category
consumersconsumers

Business Tourism cuts across several countries
The real value of Business Tourism lies in the ability to leverage resources to attract large numbers of delegates at low cost
Existing Existing 2.2. Stimulate current Stimulate current
1.1. Retain usesRetain uses by by existing consumersexisting consumers
Existing Existing ConsumersConsumers
3.3. Generate new Generate new
2.2. Stimulate current Stimulate current usesuses with existing with existing consumersconsumers
3.3. Generate new Generate new usesuses by existing by existing consumersconsumers
4.4. Attract newAttract new--toto--you you
New New ConsumersConsumers
5. Attract 5. Attract newnew--to to categorycategory consumersconsumers
4.4. Attract newAttract new--toto--you you consumersconsumers
Copyright © 2008 South African TourismThe Marketing Tourism Growth Strategy 2008 – 2010, May 2008 51
categorycategory consumersconsumers

������������������ ������������������ �� ��� � ��������� �
���������������������� ��������������� ������������������������ ��������������� ��
���� �� ���������������� !�"���� �##���������������� ! �$
• � ����
• �����
• ������ ��� �
• ��� � �
• ���� ����
• !������������• !������������
• ������ ��
• " �#�$�����
%��& � '���!�( �������)#��! %*
• %����� ����&����� '(• %����� ����&����� '(
• � �����&����� )*
• +�������� ����� ,)
• -$��� *�
+��,�-��� �����$$�.�$$/ �$$+��,�-��� �����$$�.�$$/ �$$
/������#���� �$/
� � ����������� ���������

1. Choosing the focus of international leisure marketing
The decisions about where to focus in leisure travel is a tri-annual review process of all the countries of the world (excluding the domestic market) being put through a series of filters. The application of these filters are designed to optimise against (1) maximising yield from marketing investments, and (2) balancing the portfolio to limit over-exposure to one or two marketing investments, and (2) balancing the portfolio to limit over-exposure to one or two regions. As above, review seeks to deliver against:� Identifying where current positions must be defended� Seeking opportunities for growth in volume
Seeking opportunities for growth in revenue� Seeking opportunities for growth in revenue� Seeking opportunities to reducing seasonal variations.Thus our choices about where to focus in the four regions include:-� Markets that are currently important to us – markets where we are strong and whose � Markets that are currently important to us – markets where we are strong and whose
continued presence in our portfolio is critical to meeting our long-term objectives� Markets that are attractive to us – those markets that are major sources of growth.
These markets, where competition is stiff, also represent significant growth opportunity because of the sheer size of consumer segments in a relatively concentrated because of the sheer size of consumer segments in a relatively concentrated geographic space scale can be achieved
� Markets, that are attractive and which represent opportunities to spread our risk outside of Europe and Africa, and whose outbound travel patterns are counter-cyclical.
Copyright © 2008 South African TourismThe Marketing Tourism Growth Strategy 2008 – 2010, May 2008 53
The results of the analysis are then organised into categories in each regional portfolio which informs the nature of the marketing approach to be adopted in each case.

The review adopts a “fresh eyes” approach by considering all countries in the world filtered on a set of attractiveness criteria
Approach to reviewing the portfolio
1st filter
CONSIDERATION SET
Attractiveness Criteria2nd Filter
SALIENT SET
Attractive marketsCOST-BENEFIT EVALUATION &
UNDERSTANDING OF
CORE, TACTICAL, INVESTMENT &
UNDERSTANDING OF MARKETING ISSUES
INVESTMENT & WATCHLIST MARKETS
Copyright © 2008 South African TourismThe Marketing Tourism Growth Strategy 2008 – 2010, May 2008 54
Qualitative process involving a panel discussion

Portfolio Review 2008-2010
The most recent portfolio review was conducted in 2007, and produced the following portfolio for the period 2008 to 2010: Given that 60% of all arrivals to South Africa come from five neighbouring states, and that we enjoy dominant share in these markets, the strategy for SADC is principally a ‘defend we enjoy dominant share in these markets, the strategy for SADC is principally a ‘defend strategy’ (i.e. retain existing tourists and extract additional value from them). Outside of SADC, however, there is scope to attract smaller high-end leisure volumes which in the long term provide opportunities for growth, especially from East and West Africa.For countries outside of Africa, the focus for South Africa is to leverage all the growth drivers – defend current share and aggressively pursue new growth opportunities. The overseas portfolio is focused on countries and markets that are the most attractive from a volume and value perspective, and from which South Africa can get the greatest yield in the short-to medium-term. In these markets our core challenge is to build awareness and short-to medium-term. In these markets our core challenge is to build awareness and positive perceptions of South Africa as a leisure destination, and to ensure that our information and sales strategies are able to follow through by ‘closing the deal’ and that the consumer travels to South Africa.It is against the different nature of the growth challenges in each of these domains that SA Tourism has invested in-depth market research in order to ensure that our marketing efforts are focused on the highest-yield consumer segments (who are interested and positive about our country), and against the drivers of growth that are appropriate in each chosen market.
Copyright © 2008 South African TourismThe Marketing Tourism Growth Strategy 2008 – 2010, May 2008 55
our country), and against the drivers of growth that are appropriate in each chosen market. To date, SA Tourism has segmented most focus markets.

Key Steps of the Portfolio Review Process
Exclude markets of less Exclude markets of less than 3 million people or than 3 million people or GDP per capita is less GDP per capita is less
than US$2,000than US$2,000
Exclude subExclude sub--Saharan Saharan AfricaAfrica
Top 50 markets in terms of outbound volume and
value
2nd filter1st filter
than US$2,000than US$2,000 value
Exclude markets with
Exclude Africa land markets*
Exclude markets with less than 4 million
people living in urban areas
Top sub-Saharan Africa markets PLUS Africa
land markets*
Unattractive markets Salient set
How attractive are these markets in the short term
Core, tactical, investment and watch-
Application of cost-benefit evaluation
3rd filter4th filter
Copyright © 2008 South African TourismThe Marketing Tourism Growth Strategy 2008 – 2010, May 2008 56
markets in the short term and the long term?
investment and watch-list markets
benefit evaluation
*Africa land markets are markets where more than 60% of arrivals to SA arrive by land.

The results of the evaluation will illustrate the suggested core, tactical and watch-list markets within each region.
Core markets are those which present the greatest opportunity. Tactical markets are those which should
LESS ATTRACTIVE BUT EASIER ATTRACTIVE & EASIER
Core markets are those which present the greatest opportunity. Tactical markets are those which should be considered for specific, tactical opportunities. Watch-list markets need to be watched for value segments.
TACTICAL MARKETS� Markets where there are particular
opportunities, i.e. “low hanging fruit”
CORE MARKETS• Markets that deliver the “bread & butter” • 60% of organisation’s effort deployed against
� 15% of organisation’s effort deployed against these markets
• 60% of organisation’s effort deployed against these markets
• Best capabilities allocated to these markets
LESS ATTRACTIVE & DIFFICULT ATTRACTIVE BUT DIFFICULTLESS ATTRACTIVE & DIFFICULT
WATCH-LIST MARKETS� Markets that are on the radar
ATTRACTIVE BUT DIFFICULT
INVESTMENT MARKETS� Invest in these markets ahead of return, i.e.
invest for the future� Activity in these markets will only occur if
there is spare capacity in the organisation� 5% of organisation’s effort deployed against
these markets
invest for the future� 20% of organisation’s effort deployed against
these markets
Copyright © 2008 South African TourismThe Marketing Tourism Growth Strategy 2008 – 2010, May 2008 57

Markets that fall into the Watch-list box need to be rationalised to understand the relative attractiveness of each market in this set
An evaluation of the effort vs gain of investing in the watch-list markets was conducted. This resulted in a
LESS ATTRACTIVE BUT EASIER
TACTICAL MARKETSATTRACTIVE & EASIER
CORE MARKETS
An evaluation of the effort vs gain of investing in the watch-list markets was conducted. This resulted in a ranking of watch-list markets.
� Markets where there are particular opportunities, i.e. “low hanging fruit”
� 15% of organisation’s effort deployed against these markets
• Markets that deliver the “bread & butter” • 60% of organisation’s effort deployed
against these markets• Best capabilities allocated to these
markets
LESS ATTRACTIVE & DIFFICULT
WATCH-LIST ATTRACTIVE BUT DIFFICULT
INVESTMENT MARKETSWATCH-LIST MARKETS
� Markets that are on the radar� Activity in these markets will only occur if
there is spare capacity in the organisation� 5% of organisation’s effort deployed
INVESTMENT MARKETS� Invest in these markets ahead of return,
i.e. invest for the future� 20% of organisation’s effort deployed
against these markets
� 5% of organisation’s effort deployed against these markets
Less attractive but easier
Attractive & easierWatch-list marketseasier
Less attractive & difficult
Attractive but difficult
Watch-list markets
Markets to drop off the list
Copyright © 2008 South African TourismThe Marketing Tourism Growth Strategy 2008 – 2010, May 2008 58
Note: Core, tactical and strategic markets were excluded from the original effort vs gain evaluation to give the scores for just the watch-list markets.*This depends on the air lift and air capacity in the market as well as national imperatives.
Markets that have possible strategic value*

SA Tourism portfolio 2008 – 2010: The domestic market is a coremarket that forms the base on which the tourism growth is built
AFRICA AMERICAS & the UK ASIA & AUSTRALASIA EUROPE
CORE MARKETS
BotswanaDomestic
USAUK
AustraliaIndia
FranceGermany
Cou
ntry
Man
ager
Responsibility
KenyaNigeria
Netherlands
INVESTMENT MARKETS
AngolaDRC
Mozambique
Canada China (incl. Hong Kong)Japan
Italy SwedenC
ount
ry M
anag
er
Por
tfolio
Man
ager
MozambiqueZimbabwe
TACTICAL MARKETS
GhanaLesotho
Swaziland
Ireland Singapore SwitzerlandPor
tfolio
Man
ager
SwazilandTanzania
WATCH-LIST MARKETS
EgyptNamibia
UAE
Brazil MalaysiaNew ZealandRep of Korea
AustriaBelgiumDenmark
Sta
keho
lder
M
anag
er UAE Rep of Korea DenmarkNorwaySpain
STRATEGIC IMPORTANCE
Bahrain, Oman, Qatar, Saudi Arabia
Sta
keho
lder
M
anag
erG
loba
l C
hann
el
Man
ager
Copyright © 2008 South African TourismThe Marketing Tourism Growth Strategy 2008 – 2010, May 2008 59
STRATEGIC LINKS/HUBS
Ethiopia, Zambia, Senegal
Argentina Thailand GreeceGlo
bal
Cha
nnel
M
anag
er

The 9 core air markets account for 55% of air arrivals and 61% of foreign direct spend (excluding Africa land) respectively
% of total air arrivals % of total foreign direct spend from air markets
Core markets
55%
Other markets
45%Core
markets61%
Other markets
39%
61%
Copyright © 2008 South African TourismThe Marketing Tourism Growth Strategy 2008 – 2010, May 2008 60

Having a chosen set of countries or markets is not sufficient. We need to understand consumers on a segment level
There are three key reasons why SAT chose to do segmentation (or a variation thereof):There are three key reasons why SAT chose to do segmentation (or a variation thereof):
1. To understand how the market is 1. To understand how the market is structured at a consumer level structured at a consumer level
Action Segmentation™
<50K 50K+
Casual
18-29 30-44 45 and Older
MaleMale Female Female <50K 50K+
AA EE
2. To understand the relative size and 2. To understand the relative size and value in the market as well and value in the market as well and
LightHiking
Back -packing /Mountain-
eering
CC
D
IB
F
H
G
L
JJ K
� Collapsed becauseindividual segmentswere too small
Do not target
objectively show the relative objectively show the relative contribution of the segmentscontribution of the segments
3. Allows one to identify the levers in 3. Allows one to identify the levers in the market that need to pulled to the market that need to pulled to activate the segmentactivate the segment
Copyright © 2008 South African TourismThe Marketing Tourism Growth Strategy 2008 – 2010, May 2008 61
activate the segmentactivate the segment

The action segmentation model generates deep consumer insightsinto chosen markets as the basis for developing marketing plans
We use both qualitative and quantitative methodologies to test and size markets
Buying Process (consumers)
We use both qualitative and quantitative methodologies to test and size markets
Channel
Action Segmentation™ Customer Portraits® Activation Strategy
� Middle to upper income households� Kitchen is important part of her home and her life
– Where she plays a large part of her role asprovider and caregiver for her family
– Entertaining often occurs in or includes the kitchen� Remodeling to build her dream kitchen is a very
exciting project– Redoing the cabinets and countertops is the most
exciting part as they have the greatest impact onthe look / feel of the kitchen
– Not as excited about the new appliances� Shops at several nearby stores
– Husband may go along to endorse selection– Each store has a reasonably wide selection of
� Wants to build her dream kitchen in this house– This may be their home for a long time– Wants to feel good in her kitchen and have others
complement her� More than someone who is replacing a broken unit, wants her
dishwasher to also look attractive and to complement orenhance the look of her kitchen
– Shouldn’t stick out in kitchen– Usually wants a more energy-efficient dishwasher than
she currently has– Her husband wants one that makes less noise– Price, within a broad range, is not a big factor
� Must be able to physically see and touch it before buying it– Wants to imagine the dishwasher in her beautiful, new
� Dishwasher is an important part of theattractiveness of the kitchen
� Has a sense of some brands being acceptableand others being too “cheap” and unreliable
– Believes that some brands are better atmaking some appliances than others
� May have a view (based on prior experience)that a particular store will give her a better priceor will have more helpful staff
� Price is usually within the range she expects� The best value is a style that is right for her and
her husband and a brand they think is good� Dishwashers that “stick out” destroy the “look” of
the kitchen
DesiredExperience
DesiredExperience
Product / ServiceBeliefs and
Associations
Product / ServiceBeliefs and
Associations
Purchaseand Usage
Environment
Purchaseand Usage
EnvironmentFor 30-40 year old professional workmen
<Target Audience>
Client Brand is the rugged, durable, no-nonsense brand<Positioning>
which– is safe to wear in any work setting– will last a long time (get your money’s worth)
For 30-40 year old professional workmen<Target Audience>
Client Brand is the rugged, durable, no-nonsense brand<Positioning>
which– is safe to wear in any work setting– will last a long time (get your money’s worth)
communicates masculinity and being serious about your job
<50K 50K+
Casual
18-29 30-44 45 and Older
MaleMale Female Female <50K 50K+
AA EE
Channel(value chain and selling
process)
ConsldsI.T.AI.T.A
T.A’s
AirlineHotels
GO’s
– Each store has a reasonably wide selection ofbrands and price ranges
– Cabinet depth product is displayed alongsideregular product with no explanation of benefits tojustify price
– Dishwashers look quite similar across brands
– Wants to imagine the dishwasher in her beautiful, newkitchen
� Wants to feel she is getting a good deal on whatever sheselects (though all things considered, price is not thatimportant)
the kitchen� Believes that client’s brand is ‘old-fashioned’� Believes that most major manufacturers offer
similar quality
Purchase andUsage BehaviorPurchase and
Usage Behavior
� Female head of household is primary shopper because appliance has tolook good based on her tastes
� Rejects brands that she is unfamiliar with� Talks to friends and family, browses stores and reads shelter magazines
to learn about what is available and figure out style options� When shopping for her dishwasher, she tries to imagine how it will look
in her kitchen, how it will blend-in, how it will enhance it
� Visits several stores to find the dishwasher that best fits her desired style– May price shop once she has identified a specific SKU
� Asks her husband to endorse her choice — he may have input on price anddurability
� Shows off kitchen to friends and family once remodeling is complete and newappliance is in place
Note: Hypothesis in italics
– communicates masculinity and being serious about your job
<Consumer Benefits>
because– it has all the features necessary for industrial work (e.g. steel toe)– it is available in serious work outlets (e.g. Work n Gear)– it is made of the “best” materials and has good craftsmanship
<Reason to Believe>
LightHiking
Back -packing /Mountain-
eering
CC
D
IB
F
H
G
L
JJ K
� Collapsed becauseindividual segmentswere too small
Do not target
Competition(who are we up against and how differentiated)
T.O’sT.O’sT.A’sHotels
CRS
and how differentiated)
Understanding and Anticipating Competitors
Step 2: Create Current Competitor Profiles
Goals Assumptions
Capabilities
� What are theirtourism goals?
– financial– non-financial
� What are their goalswith respect to thecustomer?
� What do they have attheir disposal?
– Tourism offerings– Channel alliances– Reputation
� What don’t theyhave?
� What are theirassumptions about...
– the market?– themselves?– South Africa?– other
competitors?
CurrentStrategy
• What choices havethey made / howare they behavi ng?
• How might they tryto evolve? Why?
Future Strategy
CompetitorCompetitorActionsActions
MarketMarketEventsEvents
CustomerCustomerChangesChanges
CurrentCompetitor
Strategy Next StepsImplications
1 2 3A
B
C
CompetitorAnalysis
Step 1: Identifying Key Competitors
Perceived Offerings of
South Africa and Competitors
FeasibleDestinations
What Long-Haul Customers Want
Step 3: Implications and Next Steps
Copyright © 2008 South African TourismThe Marketing Tourism Growth Strategy 2008 – 2010, May 2008 62
3
Generate hypotheses used to build questions for the consumer and channel
research
Generate hypotheses used to build questions for the
competitor research
Analyze research results and generate takeaways to
be tested via follow-up research

Growth and Activation Strategies have been developed
For each chosen segment, an activation strategy has been created. This includes an
Place Product
For each chosen segment, an activation strategy has been created. This includes an overall value proposition and depending on the segment’s drivers and barriers specific changes to product, price, positioning, place, or promotion
Place Product
Value Proposition
Choosing the way to serve target
Does theDoes theproduct or product lineproduct or product line
need to be modifiedneed to be modified
What is the What is the optimal channel optimal channel mix and channel mix and channel Choosing the way to serve target
customers that creates meaningful and compelling experiences
different from competitors at which the organization will excel
need to be modifiedneed to be modifiedto enhance customer’sto enhance customer’s
desired experience?desired experience?
mix and channel mix and channel activities to activities to
maximize brand maximize brand opportunity?opportunity?
Promotion PricePositioning
The part of the value proposition The part of the value proposition to be actively communicated to to be actively communicated to
target customerstarget customers
What promotionalWhat promotionalactivities mostactivities most
effectively activateeffectively activatethe customerthe customerto purchase?to purchase?
What is the best What is the best price position price position
and strategy to and strategy to support the value support the value
proposition?proposition?
Copyright © 2008 South African TourismThe Marketing Tourism Growth Strategy 2008 – 2010, May 2008 63

Shifting from Product-driven to Consumer Focused Strategy
SA’s tourism SA’s tourism Understand Understand
Product DrivenCustomer-Focused
In-depth consumer research in portfolio markets is consistent with the decision taken in the first phase of the TGS: to focus on consumers and not products. In the past SA was marketed in terms of what products were on offer with little SA’s tourism
productsSA’s tourism
products
Understand the consumer/
channel
Understand the consumer/
channelterms of what products were on offer with little reference to the desired experience of the consumer or a brand positioning for the country. The second major value of consumer research
Decide where to sell the
products
Decide where to sell the
productsDevelop the
productsDevelop the
products
TO
The second major value of consumer research is the ability to accurately measure the real opportunity for growth. Historically SAT worked with national totals and averages –ie total population, average spend and total outbound productsproducts population, average spend and total outbound travel. This is inappropriate because in most source markets, the majority of the population travels short-haul if they travel (at all) beyond their own borders.
Sell to the consumer /
channel
Sell to the consumer /
channel
Execute on marketingExecute on marketing
their own borders.SA, being a long-haul market for all major tourism source markets, has to focus on people who are worldly, well travelled and are interested in other cultures. They are also the
Copyright © 2008 South African TourismThe Marketing Tourism Growth Strategy 2008 – 2010, May 2008 64
interested in other cultures. They are also the most positive about our country and interested in travelling here.

These segments are in our focus markets across the world
� Wanderlusters (USA)� Upscale Wanderlusters (USA)
Wanderlusters (UK)
‘Cocooned’/Low Adventure� Family Explorers (USA)
Hyper Wealthy (With Kids)
WanderlustersWanderlusters NSSAsNSSAs Family TravellersFamily Travellers
Adventurous, explorative (Grown-Up Wanderlusters)
Relaxation & luxury with some discovery
� Wanderlusters (UK)� Upscale Wanderlusters (UK)� Wanderlusters (De)� Wandlerlusters (Fr)� Wanderlusters (In)� Wanderlusters (Ne)
Emerging Wanderlusters (Aust.)
� Hyper Wealthy (With Kids) (Ni)
� Ex-Pat Low Adventure Family Travellers (Ni, Ke)
� Young Families (in)Explorers/Adventurous
NSSA ExplorersNSSA Explorers Pampered NSSAsPampered NSSAs
� US Adventure/Culture NSSA’s
� US Relaxer NSSA’sHigh End Package (Ne)� Emerging Wanderlusters (Aust.)
� Wanderlusters (Aust)� Expat Wanderlusters (Ni, K)� Organized Wanderlusters (Ch)� Experienced Wanderlusters
(Ch)Organized Wanderlusters (Jp)
Explorers/Adventurous� Family Explorers (De)� French Family Explorers� Expat Family Explorers (Ni,
Ke)� New Family Explorers (in)
NSSA’s� UK NSSA’s (UK)� German NSSA’s (De)� French NSSA’s (Fr)� Dutch NSSA’s (Ne)� Expat NSSAs (Ni, Ke)
NSSA’s (Ke)
� High End Package (Ne)� Luxury Elderly Break (Ne)� High Spend Package (A)� Hyper Wealthy (Without Kids)
(Ni)� Expat Pampered NSSA’s (Ni,
Ke)� Organized Wanderlusters (Jp)� Experienced Wanderlusters (Jp)� Wanderlusters (Jp)
� Experienced Family Explorers (In)
� NSSA’s (Ke)� NSSA’s (Japan)� NSSAs (Aust)
Ke)
Positive ConvertiblesPositive Convertibles Senior ExplorersSenior Explorers Purpose TravellersPurpose Travellers
� Convertible Short Haul (Ne)� Positive Convertibles (USA)
Positive ConvertiblesPositive Convertibles
� Senior Explorers (De)� Senior Explorers (Fr)
Senior ExplorersSenior Explorers
� Independent Business People (Ni)� Traders/Importers (Ni)� Purpose Travelers (China)
Purpose TravellersPurpose Travellers
Copyright © 2008 South African TourismThe Marketing Tourism Growth Strategy 2008 – 2010, May 2008 65
� Positive Convertible Couples (UK)� Positive Convertibles (Japan)
� Senior Explorers (Japan)� Empty Nesters (In)� Senior Explorers (Aust).
� Business Professionals (SADC)� Private Traders (SADC)� Taxi Traders (SADC)� Trading Truckers (SADC)

But there are Two Core Segments in our international leisure focus
Marketing in international markets is focused principally on worldly, well-travelled segments of travellers who are seeking new experiences. The brand and marketing strategies are focused on two priority segments who the form the heart of our global marketing campaigns:
The ‘Next Stop South Africa’ (NSSA) segmentThe NSSA segment represents our traditional market. They are wealthier experienced international travellers, usually between the ages of 40 and 60 whose children (if any) have left home. They typically look for natural beauty and authentic children (if any) have left home. They typically look for natural beauty and authentic cultural experiences. They prefer independent or small group travel, and look for luxury and comfort as part of their experience. Safety is a key consideration when choosing a new destination. Safari is a big draw-card when travelling to Africa.
The ‘Wanderluster’ SegmentThe ‘Wanderluster’ SegmentThe “Wanderluster” segment is made up of younger singles or couples between the ages of 25 and 40 and generally do not have children. They are young urban professionals earning
higher incomes, and they already have considerable travel experience. Their desired experience centres on nature, culture and adventure with a strong liking for “urban vibe”. experience centres on nature, culture and adventure with a strong liking for “urban vibe”.
While also concerned with issues of safety and comfort, these consumers are driven more by the emotional appeal of a destination compared to the more practical NSSAs. They are
generally more positive about South Africa in every market than any other segment but they also want to travel the world.
Copyright © 2008 South African TourismThe Marketing Tourism Growth Strategy 2008 – 2010, May 2008 66
The other segment categories are pursued on a tactical or opportunistic basis only.

While we have made progress un growing the markets in our portfolio, there is still significant opportunity in 11 core markets
For markets where SAT has conducted detailed research, there is still massive potential
Size of Target Market in the 11 markets
76,540,000 Consumers
For markets where SAT has conducted detailed research, there is still massive potential
76,540,000 Consumers
Size of Target Segments in the 11 markets
28,071,300 Consumers28,071,300 Consumers
Arrivals from 11 key Markets (2006)
1,5 million Arrivals
67 Copyright © 2008 South African TourismThe Marketing Tourism Growth Strategy 2008 – 2010, May 2008
1,5 million Arrivals
Source: SAT Market Segmentations Studies for US, UK, Germany, France, Netherlands, Kenya, Nigeria, India, China, Japan and Australia

������������������ ������������������ �� ��� � ��������� �
���������������������� ��������������� ������������������������ ��������������� ��
���� �� ���������������� !�"���� �##���������������� ! �$
• � ����
• �����
• ������ ��� �
• ��� � �
• ���� ����
• !������������• !������������
• ������ ��
• " �#�$�����
%��& � '���!�( �������)#��! %*
• %����� ����&����� '(• %����� ����&����� '(
• � �����&����� )*
• +�������� ����� ,)
• -$��� *�
+��,�-��� �����$$�.�$$/ �$$+��,�-��� �����$$�.�$$/ �$$
/������#���� �$/
� � ����������� ���������

2. Domestic Tourism Strategy
Domestic travel is a new area of focus in the Tourism Growth Strategy. The domestic strategy is based on research done in 2003 and was launched at Indaba 2004 in Durban. It is a logical growth as domestic travel serves a number of functions in most travel markets:1.It is bedrock of the tourism sector in South Africa and contributes significantly to the 1.It is bedrock of the tourism sector in South Africa and contributes significantly to the
business with more than 36 million trips recorded in 20052.It has untapped potential and presents an opportunity for growth given that holiday travel
accounted for 32% of total value captured in 20053.The domestic market provided the base-load of tourism volumes and value, particularly to
the majority of the provinces that are off the well-trodden path of international tourism4.In competitive theory terms, vibrant domestic markets support innovation and will
therefore in the long-term aid international marketing efforts.therefore in the long-term aid international marketing efforts.We have identified seven segments with varying current and strategic value. These segments were broadly clustered into the following three categories based on their current travel patterns: Established, Emerging and Untapped.In the domestic market, SA Tourism focuses on three “emerging” segments made up of In the domestic market, SA Tourism focuses on three “emerging” segments made up of consumers who have travelled, but for whom lack of knowledge about travel opportunities is a key barrier to travelling more often. Currently the vast majority of domestic travel is still driven by visiting friends and family, but holiday travel contributes the largest share of value in the domestic market. The ‘Sho’t Left’ campaign, is targeting the emerging segments to
Copyright © 2008 South African TourismThe Marketing Tourism Growth Strategy 2008 – 2010, May 2008 69
in the domestic market. The ‘Sho’t Left’ campaign, is targeting the emerging segments to inspire them to overcome the barriers that currently stand in the way of leisure travel.

The Domestic Market is important - and will become more so in future
� 52.8% of South Africans travel each year� On average, domestic travelers take 2.5 trips per year
Half the Half the population population
� On average, domestic travelers take 2.5 trips per yearpopulation population travels …travels …
Domestic travelers generated a total of 36.2 million trips in 2005, … generating … generating � Domestic travelers generated a total of 36.2 million trips in 2005, compared to 6.7 million foreign arrivals
… generating … generating huge volumes …huge volumes …
� In 2005, domestic tourists spent R 21.1 billion, compared to a total direct spend by foreign tourists of R 47.8 billion (2004)1
… generating … generating significant value significant value
……
Copyright © 2008 South African TourismThe Marketing Tourism Growth Strategy 2008 – 2010, May 2008 70
BUT, the market is still emerging …
Note: 1International market data not yet available for 2005

The Domestic Market is still emerging
� 69% of trips are for visiting friends and relatives� 62% of trips are taken within the home province
Holiday travel starts once personal incomes exceed R 3,000 per The market is The market is “immature”…“immature”… � Holiday travel starts once personal incomes exceed R 3,000 per
month, and is established above R 10,000 per month“immature”…“immature”…
� The domestic market is highly seasonal and closely tied to …highly seasonal …highly seasonal � The domestic market is highly seasonal and closely tied to traditional and school holidays around Easter, July and December
…highly seasonal …highly seasonal ……
� 63% of domestic tourism value is captured by KZN, Gauteng and … geographically … geographically � 63% of domestic tourism value is captured by KZN, Gauteng and the Western Cape
� 58% of domestic volume goes to KZN, the Western Cape and Gauteng
… geographically … geographically concentrated, concentrated,
and …and …
� Domestic tourists generally display fundamentally different behaviours to international tourist
� Domestic spend is primarily on transport, food and accommodation
… plays a limited … plays a limited role in driving role in driving
sector sector
Copyright © 2008 South African TourismThe Marketing Tourism Growth Strategy 2008 – 2010, May 2008 71
� “Social” activities dominate domestic travel behaviour, with wildlife, culture, and natural attractions taking up 2% or less of what domestic tourists do
sector sector developmentdevelopment

The Market
� 56% of all trips originate in KZN and Gauteng� The holiday market is concentrated (62% in KZN, Gauteng and the
Free State), BUTWhere the Where the Free State), BUT� The highest rates of holiday travel incidence are to be found in the
Free State (30% of adults), and the N. Cape (23% of adults)
Where the Where the Volume isVolume is
� 40% of domestic tourism spend comes from Gauteng, BUT� The highest spenders per trip are in the Free State, Gauteng and
the Northern Cape
Where the Value Where the Value isis the Northern Cape
� Holidays made up only 4.5 million trips in 2005 (12%), BUT� Holidays made up only 4.5 million trips in 2005 (12%), BUT� Contribute 32% of total domestic tourism spend (an average of
R 1,525 per trip compared to R 339 for VFR)..� Have the highest average length-of-stay (5.9 nights)…� And have the highest incidence amongst younger adults (18 – 39
Holiday travel is Holiday travel is the futurethe future
Copyright © 2008 South African TourismThe Marketing Tourism Growth Strategy 2008 – 2010, May 2008 72
� And have the highest incidence amongst younger adults (18 – 39 years), the same demographic whose incomes are rising the fastest

The Scorecard
� KZN and Gauteng see by far the biggest volume and value� The Western Cape sees a large net inflow of trips and spend and is The WinnersThe Winners The Western Cape sees a large net inflow of trips and spend and is
a key destination for holiday travelersThe WinnersThe Winners
The Free State, Mpumalanga and the Northern Cape are seeing less The Development The Development � The Free State, Mpumalanga and the Northern Cape are seeing less value from domestic tourism than they should
The Development The Development ProjectProject
� KZN, Limpopo, Eastern Cape, Western Cape, Mpumalanga and the There is an There is an
� KZN, Limpopo, Eastern Cape, Western Cape, Mpumalanga and the Northern Cape all receive more volume and value than their own residents contribute to the market
� Residents of Gauteng, the North West and the Free State contribute greater value and volume to the total market than those provinces receive in total
There is an There is an interesting interesting provincial provincial
“balance of “balance of tourism trade”tourism trade”
73 Copyright © 2008 South African TourismThe Marketing Tourism Growth Strategy 2008 – 2010, May 2008
receive in total tourism trade”tourism trade”

There are many segments in the domestic market but SA Tourism focuses on the emerging young market in order to develop a culture of travel
Consumer segments are categorised based on their current holiday travel status and differentiating between established, emerging and untapped markets
CategoryCategory DefinitionDefinition SegmentsSegments ApproachApproach
Established � High average spend� Majority of the segment
travel for holiday purposes� Little room for growth
� Independent young couples and families
� Golden active couples
� Defend and extract value
Emerging � Medium average spend� Only small proportions of
the segment travel for
� Well-off homely couples� Young and up-coming
� Grow and defend
the segment travel for holiday purposes
� Non-travellers represent opportunities to grow these segments
� Striving families
Untapped � Low average spend� Few if any of these
segments travel for holiday purposes
� Opportunity for growth
� Home based low income couples
� Basic needs older families
� Develop
74 Copyright © 2008 South African TourismThe Marketing Tourism Growth Strategy 2008 – 2010, May 2008
� Opportunity for growth exists however a dedicated education process will be required

������������������ ������������������ �� ��� � ��������� �
���������������������� ��������������� ������������������������ ��������������� ��
���� �� ���������������� !�"���� �##���������������� ! �$
• � ����
• �����
• ������ ��� �
• ��� � �
• ���� ����
• !������������• !������������
• ������ ��
• " �#�$�����
%��& � '���!�( �������)#��! %*
• %����� ����&����� '(• %����� ����&����� '(
• � �����&����� )*
• +�������� ����� ,)
• -$��� *�
+��,�-��� �����$$�.�$$/ �$$+��,�-��� �����$$�.�$$/ �$$
/������#���� �$/
� � ����������� ���������

3. Business Tourism
South African Tourism has for many years been working the Meetings, Incentives, Conferences and Exhibitions (MICE) market- largely in support of industry efforts. At Indaba 2005, SAT launched its business tourism marketing strategy, ‘Business Unusual’.As part of the first phase of the TGS, SA Tourism studied the MICE market and in 2006 As part of the first phase of the TGS, SA Tourism studied the MICE market and in 2006 developed a target lead strategy. Associations are the primary focus while corporate meetings and incentive travel are secondary. The exhibitions market was not seen as globally attractive given our geography and the relative strength that Europe has in this market. While business tourism was not as attractive as the leisure market in terms of the volume, it does business tourism was not as attractive as the leisure market in terms of the volume, it does provide a key opportunity for growth in spend (in incentive travel) and reducing seasonality.Like the leisure strategy, the business tourism strategy will focus its marketing efforts on these segments in specific geographies: Europe: UK, France, Belgium, Netherlands, Switzerland, Austria and Denmark, and Sweden and Italy (Incentives)Asia: Australia and Japan and India (both incentives only) Americas: Canada and the USAAmericas: Canada and the USAAfrica: Business travel and tourism is a core part of the current market strategy to develop the leisure market, and will be address as such. Business Tourism opportunities are in East and West Africa as well as SADC.There will also be a strategic link to the domestic business tourism market, focusing on
Copyright © 2008 South African TourismThe Marketing Tourism Growth Strategy 2008 – 2010, May 2008 76
There will also be a strategic link to the domestic business tourism market, focusing on driving growth through inspiring ‘breakaways at home’ but this is driven by the cities and the provinces.

SA Tourism focuses on international business tourism market
There is a large and very lucrative domestic market which is the responsibility of the regional There is a large and very lucrative domestic market which is the responsibility of the regional and local tourism authorities to target and develop
Business Tourism(A trip which is undertaken with the purpose of attending a conference, meeting, (A trip which is undertaken with the purpose of attending a conference, meeting,
exhibition, event or as part of an incentive)
Domestic Business Tourism Global Business TourismGlobal Business Tourism� Conferences, meetings, exhibitions, events or
incentives with a purely domestic audience
– Exhibitions with a purely domestic audience
– Local government meetings
– South African Associations meetings
� Conferences, meetings, exhibitions, events or incentives with an international audience– Regional / global exhibitions– Inter-governmental meetings at regional or global
level– Regional/global association meetings– South African Associations meetings
– Local corporate meetings / off sites
� A large and lucrative market that should not be neglected
– Regional/global association meetings– Corporate meetings involving participants from
more than one country– Incentive trips for employees from outside South
Africa� Highly competitive global industry
Responsibility of provincial and local tourism authorities to target and develop
� Highly competitive global industry
Within the scope of SAT’s Business Tourism Unit
77 Copyright © 2008 South African TourismThe Marketing Tourism Growth Strategy 2008 – 2010, May 2008
authorities to target and develop
Not the focus for SA Tourism
Unit
Focus of this project

Business Tourism meets many of these high-level goals of SAT
� Business tourism is not a large market in comparison to the leisure market
� However, there is strong growth in the market in South AfricaVolume ����
� Business tourists are not attractive on a total spend basis when compared to other categories of travellers, but on a spend per day level they perform well
� In absolute terms, spend by business tourists has shown significant fluctuation in the last few years
Spend X/����in the last few years
� The length of stay of business tourists is in general shorter than for other visitor types
� However there is an opportunity to increase length of stay by encouraging pre-and post-tours to extend length of stay
Length of Stay X
� Business tourists are less likely than leisure travellers to move around the country
� However, a coordinating body could ensure more equitable spread of events, especially with facilities opening in Bloemfontein and elsewhere
Distribution by Province
X/����
���� � The meetings market in particular is attractive from a seasonal distribution perspective, since there is an opportunity to influence time of arrival by targeting meetings that are scheduled for off-peak periods
� Business Tourism Associations are actively promoting transformation
Distribution by Season
����
78 Copyright © 2008 South African TourismThe Marketing Tourism Growth Strategy 2008 – 2010, May 2008
� Business Tourism Associations are actively promoting transformationprinciples and encouraging members to meet regulations
� The business tourism sector provides an excellent opportunity for previously disadvantaged enterprises to play a role in the provision of services to them across the value chain
����Transformation

Globally, the business tourism markets are large and attractive
Global Tourism Outbound 2005 Global Tourism Market Size 2005
4Incentives
Exhibitions
58.9Incentives
Exhibitions
(9.8)
N/A N/A
7Association / Government
Meetings94.9
Association / Government
Meetings(15.8)
105
25
Long-HaulLeisure
Corporate Meetings
863
452.1
Long-HaulLeisure
Corporate Meetings
(144)
(75.0)
105
0 50 100 150
Travellers (Millions)
Leisure 863
0 200 400 600 800 1000
Market SizeR Bn
(US$ Bn)
Leisure (144)
79 Copyright © 2008 South African TourismThe Marketing Tourism Growth Strategy 2008 – 2010, May 2008
Note: See Appendix for methodology, Corporate meetings, average 127 participants, 197,000 meetings annuallySource: South African Departure Survey 2005, WTO, EIS Study, Convention Industry Council, ICCA , UIA, Vienna Convention Bureau, Sydney Convention and
Visitor Bureau, Tourism Vancouver, European Travel Commission, Monitor analysis
(US$ Bn)

But business tourism arrivals are relatively small to South Africa
80
South Africa Tourism Arrivals (2002–2005)
CAGR 02–05Total
Short-Haul Long-Haul
360
289
290
363
404
370
1153
2002
2002
2005
Traders
Business Tourists
31.7%31.9%
3.0%-0.1%12.8%
Total ArrivalsShort-Haul/landLong-Haul
6,3574,7071,650
7,1365,4121,725
2002 2005
945
569
826
948
579
829210
3
2002
2005
2005
Personal Shoppers
Traders
17.9%18.4%-31.6%
31.9%-8.7%
258
279
267
288
310
9
2002
2005Medical Tourists
-2.5%-2.5%-2.2%
2,513
2,349
3,760
3,5271,179
1,247
0 1,000 2,000 3,000 4,000
2002
2005
Leisure Tourists
2.2%2.3%1.9%
3.9%Total
80 Copyright © 2008 South African TourismThe Marketing Tourism Growth Strategy 2008 – 2010, May 2008
0 1,000 2,000 3,000 4,000 3.9%4.8%1.5%Travellers (1,000)
Source: South African Tourism Departure Surveys 2002–2005

Meetings are the most attractive segment within the business tourism market
Exhibitions
Global South Africa*
2002 2005 2002 2005
Travellers N/A N/A N/A N/A
Global South Africa*
2002 2005 2002 2005
Travellers 12 20 N/A 0.24
Global South Africa*
2002 2005 2002 2005
Travellers 3 4 0.04 0.04
Incentives Meetings
� A large market with over 70 exhibitions in South Africa every year
(mn) N/A N/A N/A N/A
Rands Bn N/A N/A N/A N/A
US$ Bn N/A N/A N/A N/A
� Large market � Contributes to SAT’s goals,
(mn) 12 20 N/A 0.24
Rands Bn 297 317 N/A 1.7
US$ Bn 28.6 53 N/A 0.3
� High spend per trip � Contributes to SAT’s goals
(mn) 3 4 0.04 0.04
Rands Bn 86 59 N/A 0.3
US$ Bn 8.3 9.8 N/A 0.05
exhibitions in South Africa every year and over 1.5 million attendees
� However, they tend to be mostly for a domestic audience
� Moreover, there is a limited impact on many of SAT’s goals
� Better data on foreign visitors to
� Contributes to SAT’s goals, particularly improving seasonality
� South Africa is well positioned to serve this market with world class facilities
� Although recently slipping down ICCA rankings, South Africa has a
� Contributes to SAT’s goals� However, strong overlap with leisure
tourism and with meetings� Smallest market of the Business
Tourism constituents� Better data on visitor numbers is
needed before SAT should invest � Better data on foreign visitors to exhibitions is needed before SAT should invest in this market
ICCA rankings, South Africa has a strong competitive position, and on a number of delegates hosted basis, its ranking is actually improving
needed before SAT should invest heavily in this market
Do not appear attractive at present Do not appear attractive at present – need more information from Meet SAT’s goals, large and Not a priority on their own —
form part of the corporate
81 Copyright © 2008 South African TourismThe Marketing Tourism Growth Strategy 2008 – 2010, May 2008
* Estimates based on SAT departure surveys and Monitor analysisSource: South African Departure Survey 2005, Monitor Analysis
focus for SATindustry before they become a
focus for SATattractive marketform part of the corporate
meetings strategy

The meetings market can be divided into three organisational types
Inter-GovernmentalMeetings
� Meetings of representatives of governments and government institutions� Usually within multi-lateral or regional organisations / institutions, to
negotiate relationships, set regional policy on key issues or set regional investment agendasMeetings investment agendas
� IGO meetings can be segmented into regional, international and large international meetings
� Business-related meetings of private companies, sometimes including
Corporate MeetingsCorporate Meetings
� Business-related meetings of private companies, sometimes including customers, suppliers and other external role-players
� Sometimes include other corporate events such as exhibitions and product launches
Association / NGO
� Meetings of professional associations, industry associations, non-governmental organisations and academic groups
Association / NGO and Academic
Meetings
� Exchange information, network with other professionals� Learn and develop their subject areas � Association meetings can be separated into Small, Medium and Large
categories
82 Copyright © 2008 South African TourismThe Marketing Tourism Growth Strategy 2008 – 2010, May 2008

Inter-Governmental meetings appear attractive but may have risks
Regional and Regional and Continental InterContinental Inter--
� Regional and Continental meetings with synergies in areas of local expertise and policy focus could boost South Africa’s profile as a leader in SADC and Africa
� Continental policy leadership– Trade negotiations
� Leading in SADC policy areas– Food, Agriculture and Natural Resources (FANR)Continental InterContinental Inter--
Governmental Governmental MeetingsMeetings
– Trade negotiations– African development– Poverty alleviation– International relations
– Food, Agriculture and Natural Resources (FANR)– Trade, Industry, Finance and Investment (TIFI)– Infrastructure and Services (I&S)– Social and Human Development and Special
Programmes / SHD&SP)– HIV and AIDS Programme
International InterInternational Inter--Governmental Governmental
� The large number of international organisations to which South Africa belongs (over 50 IGOs and 17 environmental treaties) gives plenty of opportunity to attract international meetings– These meetings are attractive as in general, they have to
rotate between member countries and delegates usually pay Governmental Governmental
Fora Fora rotate between member countries and delegates usually pay for themselves
– Moreover, they behave like Association Meetings with clear synergies in targeting and promotion
Large inter-governmental summit meetings with Head-of-State
Large InterLarge Inter--Governmental Governmental
Summit Meetings Summit Meetings
� Large inter-governmental summit meetings with Head-of-State involvement (such as WSSD) have the potential to generate significant positive benefits for South Africa– Significant foreign earnings and job creation– Positive press coverage
83 Copyright © 2008 South African TourismThe Marketing Tourism Growth Strategy 2008 – 2010, May 2008
Summit Meetings Summit Meetings – Positive press coverage� However, this must be managed against some of the negative
aspects– Potentially damaging negative publicity or problems with brand

Corporate meetings are small, volatile in demand and short lead times
Contribution to Tourism’s Goals
Volume� Corporate meetings represent
over 95% of meetings in South Africa, bringing in an estimated
����
Drawbacks
� The average global size of a Corporate meeting is 127 participants compared to 650 for an association meeting
Corporate Association Incentive
Spend
Africa, bringing in an estimated 150,000 arrivals per year
Global spend per delegate
����
meeting– This makes corporate meetings more expensive
to acquire per-delegate
Association Meetings Small Medium Large
Average # of participants 133 463 2,588
$3,001 $2,150 $2,510
R18,031 R12,918 R15,081
Spend
Length of
� Spend per delegate is high
� The length of stay for Corporate meetings is shorter than for other X
� Corporate meetings are highly subject to economic conditions — one of the first things to be cut during economic down-
Cost to acquire per delegate $102 $29 $5
Cost to acquire per delegate R612 R175 R31
Stay
Distribution
meetings is shorter than for other meetings and offers less opportunity for pre- and post-tours
� Owing to the small size of Corporate meeting, corporate ����
X things to be cut during economic down-turn is corporate travel budgets
� Lead times for Corporate meetings (6–8 months) are typically much shorter than for association meetings (3–5 years), causing uncertainty in the meeting pipeline and posing challenges to meeting organisersDistribution
by Province
Distribution
Corporate meeting, corporate meetings are not confined to large cities or conference centres
� Corporate meetings occur year
����pipeline and posing challenges to meeting organisers
312923
40
25
502005
2006
Average lead time for a Corporate meeting (weeks)1
84 Copyright © 2008 South African TourismThe Marketing Tourism Growth Strategy 2008 – 2010, May 2008
Distribution by Season
� Corporate meetings occur year round and school holidays make off-peak months more attractive
����
1 MPI — Future watch 2006— “A comparative outlook on the global business of meetings “, Monitor Analysis, SAT, ICCA
0Meeting Space Hotels / Support
2006

Association meetings have advantages over both
� Rotation policies for many associations make them an easier target to attract to South Africa– Potential for repeat business– Potential for repeat business
� High potential for repeat leisure travel
� Stable business– Most associations are required to have meetings under their constitutions – Meetings tend to be organised 3–5 years in advance, giving a clear view of – Meetings tend to be organised 3–5 years in advance, giving a clear view of
the pipeline of up and coming meetings to conference organisers and event venues
� Pre- and Post- tours are more likely to be purchased by association meeting participants than by corporate or government meeting participants– It is not uncommon for association participants to bring a travel partner
85 Copyright © 2008 South African TourismThe Marketing Tourism Growth Strategy 2008 – 2010, May 2008
– It is not uncommon for association participants to bring a travel partner

Each has cost / benefits, with associations the most favourable
Inter-governmental meetings are typically expensive to host, but they have potential spin-off
3Comparison of Meeting Segments by Cost and Benefit
Inter-governmental meetings are typically expensive to host, but they have potential spin-off benefits due to their high profile and the public status of their delegates
High 3HighAssociation meetings
2Benefits
Inter-Governmental
� Volume� Geographic spread� Spend� Seasonality
Corporate meetings
1
Inter-Governmental meetings
� Length of stay� Cost to acquire� Growth
0
Bubble size represents market
size in terms of number of delegates
� Cost to city / country of hosting event:
Costs
Low
86 Copyright © 2008 South African TourismThe Marketing Tourism Growth Strategy 2008 – 2010, May 2008
0123
Cost to SA of Hosting
– Security costs– Management– Co-ordination– Delegate expenses
LowHigh
Source: Monitor Conference Survey 2001, Supplier Interviews, PCO Interviews, ICCA,UIA, Monitor Analysis
Size of bubble equates to 5 Million delegates per annum

We have developed databases to target attractive associationsOpportunities in the “High Priority” and “Low Hanging Fruit” segments for associations Opportunities in the “High Priority” and “Low Hanging Fruit” segments for associations should be pursued aggressively through local reps and head offices
Medium-Long Term Investment High PriorityHigh Priority
Most Attractive
Medium-Long Term InvestmentCharacteristics� Large, greater than 2 days duration and typically happen in
arrivals troughs� However, may have been to SA recently or there is no SA
representative of the association
High PriorityHigh PriorityCharacteristics� Large, greater than 2 days duration and typically happen in
arrivals troughs� South African membership and SAT presence in host
country� South Africa possible option in short to medium term
Actions� Build and maintain relationships with SA representatives
to keep South Africa on the radar screen� Provide support to SA representatives to be active
members of the association (“ambassador program”)� Continue to develop local associations database to “fill in
blanks”
� South Africa possible option in short to medium term
Actions� Aggressively pursue opportunities
– Contact local representative and suggest hosting – Contact headquarters– Liaise with CVBs / ICCs to begin bid process
blanks”
Low PriorityLow PriorityCharacteristics� Small, short meetings in peak arrivals months
Low Hanging FruitCharacteristics� Small, short meetings in peak arrivals monthsSmall, short meetings in peak arrivals months
� No SA representatives of the association and no SAT presence in host country
Actions� Do not invest resources in trying to attract these meetings� However, track developments to see if they move into other
quadrants (increased meeting size, appointment of South
� Small, short meetings in peak arrivals months� However, South African Representation and SAT presence
in host country� South Africa possible option in short to medium term
Actions� Pursue opportunities
– Contact local representative and suggest hosting
87 Copyright © 2008 South African TourismThe Marketing Tourism Growth Strategy 2008 – 2010, May 2008
quadrants (increased meeting size, appointment of South African representatives etc.)
� Continue to develop local associations database to “fill in blanks”
– Contact local representative and suggest hosting – Contact headquarters– Liaise with CVBs / ICCs to begin bid process

Executive Summary:A clear set of choices has been made to meet these objectives
How will we win in How will we win in chosen markets?chosen markets?
What are our goals What are our goals and aspirations?and aspirations?
What capabilities What capabilities must be in place to must be in place to
win?win?Where will we play?Where will we play?
� To help meet the 6 key goals of SAT– Increase in tourist volume– Increase in tourist spend
� Use and develop existing consumer understanding– Share this information with
trade
� Concentrate on the association and IGO meetings markets
– Medium and Large
� Greater co-operation between government and industry– Consider industry advisory – Increase in tourist spend
– Increase length of stay– Improve geographic spread– Improve seasonality patterns– Promote transformation
� To be amongst the top ten global conference
trade� Regularly conduct competitor
research to revise choices and develop differentiated messaging
� Use prioritisation matrices to target most promising
– Medium and Large Association Meetings
– Medium and Large IGO’s– Aim to host one large
International head-of-state meeting every three years
– We have identified actual
– Consider industry advisory board for SAT
� Ambassador programs to raise the profile of South African in target associations
� Bid support fund to cover costs of local organising global conference
destinations by 2010to target most promising leads in the association and IGO markets
� Use the World Cup as a lever to raise South Africa’s world ranking– However, be careful to
– We have identified actual targets
� Use regional tourism offices to target corporations based in their areas
� De-prioritise exhibitionsuntil more data is available
costs of local organising committees
� Definition of standards and establishment of accreditation scheme through trade associationsClearly defined metrics and – However, be careful to
manage capacity around 2010 to prevent a major fall-off in the following years
until more data is available� Use incentives as a way to
draw in corporate meetings
� Clearly defined metrics and implementation plans
88 Copyright © 2008 South African TourismThe Marketing Tourism Growth Strategy 2008 – 2010, May 2008
Contributing to Tourism’s 6 key objectives is certainly achievableHowever, attaining Top 10 conference destination status by 2010 will be a significant challenge

Integrated SA Tourism portfolio 2008 – 2010: Underscored are leisure and business tourism markets (* = associations and # = incentives and corporate meetings)
AFRICA AMERICAS & the UK ASIA & AUSTRALASIA EUROPE
CORE MARKETS
BotswanaDomestic
USA*#UK*#
Australia*India #
France*#Germany*#
Cou
ntry
Man
ager
Responsibility
KenyaNigeria
Netherlands*#
INVESTMENT MARKETS
AngolaDRC
Mozambique
Canada*# China (incl. Hong Kong)Japan #
Italy #Sweden #C
ount
ry M
anag
er
Por
tfolio
Man
ager
MozambiqueZimbabwe
TACTICAL MARKETS
GhanaLesotho
Swaziland
Ireland Singapore Switzerland*#Por
tfolio
Man
ager
SwazilandTanzania
WATCH-LIST MARKETS
EgyptNamibia
UAE
Brazil MalaysiaNew ZealandRep of Korea
Austria*#Belgium*#Denmark*#
Sta
keho
lder
M
anag
er UAE Rep of Korea Denmark*#NorwaySpain
STRATEGIC IMPORTANCE
Bahrain, Oman, Qatar, Saudi Arabia
Sta
keho
lder
M
anag
erG
loba
l C
hann
el
Man
ager
89 Copyright © 2008 South African TourismThe Marketing Tourism Growth Strategy 2008 – 2010, May 2008
STRATEGIC LINKS/HUBS
Ethiopia, Zambia, Senegal
Argentina Thailand GreeceGlo
bal
Cha
nnel
M
anag
er

������������������ ������������������ �� ��� � ��������� �
���������������������� ��������������� ������������������������ ��������������� ��
���� �� ���������������� !�"���� �##���������������� ! �$
• � ����
• �����
• ������ ��� �
• ��� � �
• ���� ����
• !������������• !������������
• ������ ��
• " �#�$�����
%��& � '���!�( �������)#��! %*
• %����� ����&����� '(• %����� ����&����� '(
• � �����&����� )*
• +�������� ����� ,)
-$��� *�
+��,�-��� �����$$�.�$$/ �$$+��,�-��� �����$$�.�$$/ �$$
/������#���� �$/
� � ����������� ���������

4. Events: The 2010 Soccer World Cup opens up new area of marketing
To take this opportunity forward SA Tourism has established an events unit to target and help the relevant organisations to big for major global events to raise the profile of South Africa
In its bid to host the Soccer World Cup in 2010, South Africa highlighted the key objectives for the event as:key objectives for the event as:
� Hosting a world-class African World CupCup
� Ensuring a lasting social legacy through the event
� Leveraging the event to spread economic and social benefits economic and social benefits beyond the borders of South AfricaMay 15, 2004 - South Africa wins bid for
2010 World Cup
Copyright © 2008 South African TourismThe Marketing Tourism Growth Strategy 2008 – 2010, May 2008 91

Events such as 2010 are in line with the broader objectives for tourism
Contribute towards hosting a successful
Key Objectives of the Tourism Organising Plan
Contribute towards hosting a successful FIFA* World CupTM in 2010
Maximise tourism value from the eventMaximise value
Maximise tourism value from the event
Enable other African countries to benefit from the event
Maximise value during the event
from the event
Maximise the opportunity to brand South Africa Maximise the opportunity to brand South Africa as a tourism destination
Have a positive impact on social legacy through advancing the tourism competitiveness agenda to
Maximise value after the event
Copyright © 2008 South African TourismThe Marketing Tourism Growth Strategy 2008 – 2010, May 2008 92
advancing the tourism competitiveness agenda to support objectives of creating jobs, growth and equity
* FIFA – Fédération Internationale de Football Association

Strategic Interventions of what SA Tourism does and what it facilitates
Non-Core CoreInterventions:
Strategic Focus on Strategic Focus on
Event criteria & selection Event criteria & selection
Awareness of support offered Awareness of support offered Graded Accom.Graded Accom.
Support Tourism Grading CouncilSupport Tourism Grading Council
Support Fedhasa/NAA/TBCSASupport Fedhasa/NAA/TBCSA
Non-Core Interventions: WHAT
SAT FACILITATES
Interventions:WHAT SAT DOES
Focus on Events
Focus on Events
Awareness of support offered Awareness of support offered
Leverage opportunities Leverage opportunities
Info Info Strategic Research Strategic Research
Calendar of Events Calendar of Events
Accom.Accom. Support Fedhasa/NAA/TBCSASupport Fedhasa/NAA/TBCSA
Facilitate Interactions Facilitate Interactions
Improve TransportImprove
Transport
Support SATSA / ASATA/ TBCSASupport SATSA / ASATA/ TBCSA
Support implementation of PlanSupport implementation of PlanInfo
ManageInfo
Manage Calendar of Events Calendar of Events
Communication PlatformsCommunication Platforms
MarketingMarketingMedia Leverage Media Leverage
TransportSafety
TransportSafety
Support implementation of PlanSupport implementation of Plan
Facilitate InteractionsFacilitate Interactions
Skills & Skills & Support ThetaSupport Theta
MarketingBrandingMarketingBranding Brand LeverageBrand Leverage
PR / Communication CampaignsPR / Communication Campaigns
Skills & Service Levels
Skills & Service Levels
Support ThetaSupport Theta
Support Events IndustrySupport Events Industry
Facilitate InteractionsFacilitate Interactions
93 Copyright © 2008 South African TourismThe Marketing Tourism Growth Strategy 2008 – 2010, May 2008

It is also a huge opportunity for positioning SA on global TV platformsThe number of TV viewers in 2010 will probably be higher than in 2002 since South Africa is
40Total number of TV viewers** per FIFA World Cup, 1986-2002
The number of TV viewers in 2010 will probably be higher than in 2002 since South Africa is in the same time zone as most soccer loving countries
26.7
32.133.4
28.830
35
Num
ber o
f vie
wer
s (b
illio
n)**
� TV coverage in more than
Japan / Korea - 2002
20
25
Num
ber o
f vie
wer
s (b
illio
n)**
� TV coverage in more than 210 countries
� 1.1 billion people watched the final in Korea
13.5
10
15
Num
ber o
f vie
wer
s (b
illio
n)**
� More women (mainly in Asia) watched the matches than in previous world cups
0
5
Mexico - 1986 Italy - 1990 USA - 1994 France - Japan/Korea -
� Out of home viewing and big screen viewing increased significantly
Copyright © 2008 South African TourismThe Marketing Tourism Growth Strategy 2008 – 2010, May 2008 94
Mexico - 1986 Italy - 1990 USA - 1994 France -1998*
Japan/Korea -2002
* According to FIFA, viewership for France 98 was over weighted because of the auditing methods used in China, where viewership figures were based on rankings in Shanghai which were then multiplied by a factor to estimate the audience for the entire country** The number of viewers is cumulative as it counts the number of viewers over the number of days the event was hosted. There is therefore double-countingSource: www.fifa.com

As well as increase SA’s market share in core markets and open new ones
Core Markets Tactical Markets
� Tanzania
Investment Markets
Watch-List Markets
� Ghana
Strategic Hubs
� Egypt
Other Countries
Countries SAT Focuses On
� Kenya � Angola � Ghana � Argentina
� India
� Botswana
� Lesotho
� Senegal
� Brazil
� Malaysia
� UAE� Nigeria
� USA
� UK
� Mauritius
� Canada
� China
� Senegal
� Brazil
� Malaysia
� Czech
Republic
� Mexico
� Spain� Swaziland � New
Zealand
� Singapore
� Australia
� France
� Germany
� Japan
� Mozambique
� Zambia
� New
Zealand
� Singapore
� Spain
� Portugal
� Turkey
� Denmark
� Belgium
� Ireland
� Italy
Sweden
� Netherlands � Zimbabwe � Belgium
� Ireland
� Italy
Sweden
� Poland
� Iran
� Costa Rica
� Greece� Sweden
� Switzerland
� Sweden
� Switzerland
� Greece
� Ivory Coast
� Togo
� Tunisia
Copyright © 2008 South African TourismThe Marketing Tourism Growth Strategy 2008 – 2010, May 2008 95
Source: SAT Tourism Portfolio 2005-2009, fifa.com as of 30.09.05
Likely to participate in the 2010 WC

To achieve the 2010 tourism objectives we need to capitalise on opportunities presented by the World Cup and address key tourism challenges
� World class African World Cup� Lasting social legacy
� Spread benefit to
� Sustainable GDP growth� Sustainable job creation� Redistribution and
Broader objectives of 2010 Event Mandate for Tourism
Position South Africa to
Achieve its Spread benefit to continent
Redistribution and TransformationAchieve its
Tourism mandate and broader 2010 Objectives…
Objectives of the 2010 Tourism Plan� Contribute to a successful event� Maximise tourism value from event
� Brand SA as a tourism destination� Advance the tourism competitiveness
Capitalising on 2010 Capitalising on 2010 Addressing Key Tourism Addressing Key Tourism
Maximise tourism value from event� Enable other African countries to benefit
Advance the tourism competitiveness agenda
Capitalising on 2010 Capitalising on 2010 Arrivals and ExposureArrivals and Exposure
Addressing Key Tourism Addressing Key Tourism Challenges To Deliver the Challenges To Deliver the
ExperienceExperience… by…
Information and Transactional Fulfilment
Tourism-friendly
Marketing and Branding Accommodation…through coordinated interventions within each
Copyright © 2008 South African TourismThe Marketing Tourism Growth Strategy 2008 – 2010, May 2008 96
Tourism-friendly Transport and Tourist
Safety & Security
Skills and Service Levels Events and Attractions
within each functional area.

Executive summary of Events Project on 2010
The 2010 Opportunity
The 2010 Opportunity
Key challenges for tourism around
2010
Key challenges for tourism around
2010
Key tourism-related initiatives
Key tourism-related initiatives Making it happenMaking it happen
� Poor access to channels and tourism information
� Insufficient accommodation
� Initiatives have been grouped into specific functional areas to facilitate the implementation process:
� The event presents a platform to help South Africa achieve its tourism mandate and objectives
� Obtain buy-in and sign-off of the plan from the Minister
� A tourism 2010 unit is to accommodation
� Insufficient compelling attractions & activities
� Inadequate service levels and skills shortage
implementation process:
– Information
– Marketing and Branding
� By taking advantage of opportunities to:
– Maximise value during the event
� A tourism 2010 unit is to be set-up within SAT, reporting to the CEO, for:
– Planning, Management & Monitoring
� Inadequate public transport
� Insufficient focus on tourist safety & security
– Tourism-friendly transport and tourist safety & security
– Accommodation
– Events and
– Maximise valueafter the event
� About R11 billion in tourism revenue could be generated during the
Monitoring
– Co-ordination of Initiatives
– Stakeholder Management
� Limited institutional capacity
� Managing expectations
� Demand management
– Events and attractions
– Skills and service levels
generated during the event
Management
� Inter-governmental coordination in respect of tourism through DEAT and the TCC
Copyright © 2008 South African TourismThe Marketing Tourism Growth Strategy 2008 – 2010, May 2008 97
� Demand management
� Displacement of general tourists around the event

Action Plans for the Events Marketing strategy
2010 Action Plan
� Research & Info Management� Leverage media opportunities from
Event Action Plan
� Event Criteria & Selection Process� Research & Info Management� Leverage media opportunities from
2010 related events� Positive messaging opportunities
from key national & international
� Research & Info Management� Media Leverage� Brand leverage opportunities� Communication platformsfrom key national & international
events� Brand leverage opportunities� Provide visitors with a great
experience
� Communication platforms� Provide visitors with a great
experience� Institutional coordination
experience� Institutional coordination
98 Copyright © 2008 South African TourismThe Marketing Tourism Growth Strategy 2008 – 2010, May 2008

������������������ ������������������ �� ��� � ��������� �
���������������������� ��������������� ������������������������ ��������������� ��
���� �� ���������������� !�"���� �##���������������� ! �$
• � ����
• �����
• ������ ��� �
• ��� � �
• ���� ����
• !������������• !������������
• ������ ��
• " �#�$�����
%��& � '���!�( �������)#��! %*
• %����� ����&����� '(• %����� ����&����� '(
• � �����&����� )*
• +�������� ����� ,)
• -$��� *�
+��,�-��� �����$$�.�$$/ �$$+��,�-��� �����$$�.�$$/ �$$
/������#���� �$/
� � ����������� ���������

Review: 2002-2005/6
Part of the development of the TGS was a set of predictions on what the possible outcome would be of a successful implementation of the strategy.The re-balancing of the portfolio has achieved important success with a better spread of volume across markets than in 2001. The process of re-balancing is subject to all the fluctuations of global tourism and is 2001. The process of re-balancing is subject to all the fluctuations of global tourism and is hard to predict and hold on course.But the critical knowledge we have now is which markets we can indeed growth (i.e. recruitfirst time visitors) and where we need to defend and get repeat visitors to come more oftenfor find new reasons for them to visit. Furthermore we understand which markets we needfor find new reasons for them to visit. Furthermore we understand which markets we needto look if one regional market goes into decline or collapses.Arrivals and revenue growth were weak in 2001 when the TGS process started. At the endof the first year, we modelled what scenario we were looking at if we carried on marketingthe country the same way (i.e. no focus and putting money across the globe in regionalthe country the same way (i.e. no focus and putting money across the globe in regionalhubs) and what the potential growth rates could be achieved up to 2005 if we became morefocused and differentiated in our marketing efforts.It is important to note that this modelling was done before the dramatic events of tourism inthe past four years and was largely based on mathematical regressions. Therefore the hugethe past four years and was largely based on mathematical regressions. Therefore the hugeevents of 9/11, the Gulf War, the Iraq War, SARS and the South East Asian tsunami of 2004were not factored in. All these factors have led to a decline in the volume of global travelfrom some markets since 2001 and which only started to rebound in 2004.
Copyright © 2008 South African TourismThe Marketing Tourism Growth Strategy 2008 – 2010, May 2008 100

We have achieved the volume and value growth
Potential growth in arrivals and revenue was modelled in 2001 using the best available data
Actual Performance vs. 2001 view of Potential PerformanceActual Performance vs. 2001 view of Potential PerformanceCAGRCAGR
“Do nothing Differently Scenario”Projected CAGR growth 2001-2005
Potential growth in arrivals and revenue was modelled in 2001 using the best available data at the time. Good advances have been made towards the targeted growth rates.
15.00%
Revenue Growth
1.2%
Projected Revenue
Actual* 15.00%
13.2%
Arrivals
1.2%Growth
(CAGR 2001-2005)
Actual*(’02-’05)
Potential(’01-’05)
6.20%
7.50%
Arrivals Growth
0.8%
Projected Arrivals Growth
Actual(’01-’06)
Actual 6.20%
5.9%
0.8%(CAGR 2001-
2005)Potential(’01-’05)
Potential 2005 Arrivals : 7,273,900
Actual(’01-’05)
Copyright © 2008 South African TourismThe Marketing Tourism Growth Strategy 2008 – 2010, May 2008 101
0.0% 5.0% 10.0% 15.0%
% Volume Growth (CAGR)
* At time of going to press, full 2006 stats had not yet been released. Source: Foreign Visitor Departure Surveys, 2000 & 2001, SAT Annual Reports 2002-2005
0.0% 1.0% 2.0% 3.0%
% Growth

Review of Phase One: 2002-2004
At the end of 2004 the data suggests that we had made important strides towards realizing our growth potential.The arrivals growth has been closer to the
Increased Spread in the Arrivals Portfolio from 2001 - 2005
11.00% 11.81% 11.52% 12.30%
100%Comparison of Current SA Portfolio and Predicted Portfolio, 2001-2005
OtherThe arrivals growth has been closer to the target than value as the years 2003 and 2004 saw a decline of revenue from some markets as the Rand continued to strengthen against the US dollar. Like 7.8%
6.5% 5.3%
6.2%7.0% 6.8%
9.1%
3.5%4.0% 3.7%
4.3%
3.5%3.3% 3.4%
2.8%
2.9%2.9% 3.1%
9.3%
10.3% 11.6% 11.1% 10.4%
11.00% 11.81% 11.52% 12.30%
60%
70%
80%
90%
Sha
re o
f Arr
ival
s to
SA
(%
)
GermanyNamibia
Netherlands, France, Zambia, Malawi, Australia, Belgium, Italy, Switzerland, Canada, Angola, India
USA
Other
strengthen against the US dollar. Like many of our competitors, foreign tourists continued to arrive but they just spent less on their visit.An evaluation of the sources of growth
12.9%12.3%
12.7%
10.2%
11.1%12.2%
12.0%
10.7%
8.6%8.7%
8.3%
6.9%
7.8%6.5% 5.3%
6.5%
9.1%
20%
30%
40%
50%
Sha
re o
f Arr
ival
s to
SA
(%
)
Swaziland
Botswana
Zimbabwe
Mozambique
UK
An evaluation of the sources of growth since 2001 has confirmed both the wisdom of the portfolio choices, and the impact of targeted marketing action.The first portfolio was a larger set of Copyright © 2005 South African TourismTourism Growth Strategy October 2005 63
22.2% 19.8% 22.0%17.6%
0%
10%
20%
2001 2003 2004 2005
Note: The 2005 portfolio was obtained using the assumptions outlined on the previous slideSource: Statistics South Africa, Foreign Visitor Departure Survey, Monitor Analysis
Lesotho
The first portfolio was a larger set of countries and represented the first phase of SAT moving from an organisation that marketed to the world to a more focused marketing organisation aware of where the
Copyright © 2005 South African TourismTourism Growth Strategy October 2005 63
Most of the growth that we have seen since 2001 has been in the core portfolio, which suggests that we are getting the returns on our increasingly
Copyright © 2008 South African TourismThe Marketing Tourism Growth Strategy 2008 – 2010, May 2008 102
marketing organisation aware of where the bigger and best opportunities sat.
that we are getting the returns on our increasingly focused efforts:

Most of the Volume Growth between 2002-2004 came from the Portfolio markets
SAT Portfolio of Markets 2002-2004
SAT Portfolio: Core and Tactical Markets
Markets with over 1 million
long-haul
� Australia
� Canada
� France
� Italy
� Netherlands
� UK
� Japan
� Sweden
� China (Incl.
Watchlist
(Countries to keep our eye on)
� Argentina� Belgium� Cote d’Ivoire
Contribution to 2001/2002 Growth by Portfolio MarketsContribution to Total Arrivals by Portfolio Markets 2002
700,000
2001/2 Growth : 642,215 arrivals2002 Arrivals : 6,429,583
Our core and tactical markets were the major drivers of volume growth in 2002
Portfolio Markets were the Foundation of the Volume and of 2002 Growth
Rel
ativ
e A
ttra
ctiv
enes
s
long-haul outbound
departures
Others with Identified Potential
� France
� Germany
� UK
� United States
� China (Incl. Hong Kong)
� Mozambique
� Namibia
� Swaziland
� Switzerland
� Angola
� Belgium
� Botswana
� India
� Austria
� Brazil
� Ireland
� Kenya
� Malaysia
� Saudi Arabia
� Singapore
� South Korea
� Spain
� Taiwan
� Cote d’Ivoire� Denmark� Finland� Ghana� Greece� Indonesia� Israel� Mali� Mexico� Mauritius� Norway
These countries account for 18% of arrivals, but 40% of revenue
Core Markets
84%
300,000
400,000
500,000
600,000
700,000
Copyright © 2005 South African TourismTourism Growth Strategy October 2005 64
Top 20 markets delivering 90% of arrivals
Relative Importance to SA
Others
� Zambia
� Zimbabwe
� Lesotho
� Malawi
� New Zealand
� Nigeria
� Tanzania
� Thailand
� UAE
Core Markets
Tactical Markets
� Norway� Philippines� Poland� Portugal� Russia� Senegal� Uganda
Copyright © 2005 South African TourismTourism Growth Strategy October 2005 65
Tactical Markets
5%
Other
11%
0
100,000
200,000
CoreMarkets
TacticalMarkets
Other Total
Contribution to 2003 Growth by Portfolio Markets
Portfolio Markets were the Foundation of the Volume and of 2003 Growth
Contribution to Total Arrivals by Portfolio Markets 2003
80,000
2003 Growth : 75,307 arrivals2003 Arrivals : 6,504,890
For the second year, our core and tactical markets were the major drivers of volume growth
Contribution to 2004 Growth by Portfolio Markets
Portfolio Markets were the Foundation of the 2004 Volume Growth
Contribution to Total Arrivals by Portfolio Markets 2004
250,000
2004 Growth : 172,954 arrivals2004 Arrivals : 6,677,839
In 2004, our core markets were the major drivers of volume growth
Core Markets
86%
30,000
40,000
50,000
60,000
70,000
80,000
Core Markets
86%
0
50,000
100,000
150,000
200,000
250,000
Copyright © 2008 South African TourismThe Marketing Tourism Growth Strategy 2008 – 2010, May 2008 103Copyright © 2005 South African TourismTourism Growth Strategy October 2005 66
Tactical Markets
7%
Other
7%
0
10,000
20,000
CoreMarkets
TacticalMarkets
Other Total
Copyright © 2005 South African TourismTourism Growth Strategy October 2005 67
Tactical Markets
5%
Other
9%
-150,000
-100,000
-50,000
0
CoreMarkets
TacticalMarkets
Other Total

Most of the Volume Growth between 2004-2005 also came from the Portfolio markets
Contribution to 2004 Growth by Portfolio Markets
Portfolio Markets were the foundation of the 2004 volume growth
Contribution to Total Arrivals by Portfolio Markets 2004
400,000
2004 Growth : 172,954 arrivals2004 Arrivals : 6,677,839
In 2004, our core markets were the major drivers of volume growth
-102%
Core Markets
19%
Tactical Markets
39%
Other
17%
100,000
150,000
200,000
250,000
300,000
350,000
400,000
152%
Investment Markets
25%
-102%
SA Tourism Portfolio 2005 – 2007:
FranceGermany
Netherlands
EUROPE
AustraliaUSAUK
KenyaNigeria
Domestic
CORE MARKETS
ASIA & AUSTRALASIA
UK and AMERICAS
AFRICA & MIDDLE EAST
Copyright © 2005 South African TourismTourism Growth Strategy May 2005 7
-150,000
-100,000
-50,000
0
50,000
Cor
e M
arke
ts
Tact
ical
Mar
kets
Inve
stm
ent
Mar
kets
Oth
er
Tota
l
-54%
4%
China (including Hong Kong)Japan
CanadaAngolaMauritius
MozambiqueZambia
INVESTMENT MARKETS
IndiaTanzaniaBotswanaLesotho
Swaziland
TACTICAL MARKETS
Contribution to 2005 Growth by Portfolio Markets
Portfolio Markets were the foundation of the 2005 volume growth
Contribution to Total Arrivals by Portfolio Markets 2005
800,000
2005 Growth : 690,898 arrivals2005 Arrivals : 7,368,742
In 2005, our core markets were the major drivers of volume growth
47%
BelgiumIreland
ItalySweden
Switzerland
MalaysiaNew Zealand
Singapore
BrazilGhanaSenegal
WATCH-LIST MARKETS
MalaysiaSingapore
EgyptSenegal
STRATEGIC HUBS
ZambiaZimbabwe
Core Markets
18%
Tactical Markets
39%
Investment Markets
23%
100,000
200,000
300,000
400,000
500,000
600,000
700,000
6%
10%
37%
Other
20%
47%
Copyright © 2005 South African TourismTourism Growth Strategy May 2005 6
SingaporeSenegalUAE
Copyright © 2008 South African TourismThe Marketing Tourism Growth Strategy 2008 – 2010, May 2008 104
Copyright © 2005 South African TourismTourism Growth Strategy May 2005 8
0
Cor
e M
arke
ts
Tact
ical
Mar
kets
Inve
stm
ent
Mar
kets
Oth
er
Tota
l
6%

������������������ ������������������ �� ��� � ��������� �
���������������������� ��������������� ������������������������ ��������������� ��
���� �� ���������������� !�"���� �##���������������� ! �$
• � ����
• �����
• ������ ��� �
• ��� � �
• ���� ����
• !������������• !������������
• ������ ��
• " �#�$�����
%��& � '���!�( �������)#��! %*
• %����� ����&����� '(• %����� ����&����� '(
• � �����&����� )*
• +�������� ����� ,)
• -$��� *�
+��,�-��� �����$$�.�$$/ �$$+��,�-��� �����$$�.�$$/ �$$
/������#���� �$/
� � ����������� ���������

Conclusion
The Tourism Growth Strategy is the result of sustained investment and learning over theperiod 2001 to 2005. Through the process an accurate picture of the opportunities andchallenges has been brought into stark relief. The size of the potential prize in our focusmarkets is so compellingly large (and larger than in anywhere else), that the logic speaks formarkets is so compellingly large (and larger than in anywhere else), that the logic speaks foritself.The following figure provides a graphic illustration of the measurable opportunity available toSouth Africa in target market segments in eleven key markets where we have developeddetailed consumer segmentations.detailed consumer segmentations.SAT hopes that industry will be inspired to align its own strategies with these choices.There’s money to be made in these focus areas, and the returns on our collectiveinvestment will multiply as we align our resources against a common vision for growth oftourism, employment and our country.tourism, employment and our country.We encourage stakeholders to engage with the detail of both the detailed country-levelmarketing strategies as well as the Global Competitiveness programme. Effective marketingcreates the demand, but we need to also deliver on the promise. The GCP guides ourcreates the demand, but we need to also deliver on the promise. The GCP guides ouractions and investments behind the brand and the growing demand for South Africa.
Copyright © 2008 South African TourismThe Marketing Tourism Growth Strategy 2008 – 2010, May 2008 106

But marketing alone cannot deliver results — key constraints and barriers on delivery need to be removed
� SAT cannot afford representation in all markets which are important, but SA needs to maintain some marketing presence through other players
Maintain our Maintain our presence in nonpresence in non-- SA needs to maintain some marketing presence through other players
(for example foreign missions)presence in nonpresence in non--
core marketscore markets
� The new strategy requires that in our product and services we begin to do Align tourism Align tourism � The new strategy requires that in our product and services we begin to do things differently from the past - and keep ahead of the competition
� Focus on tourism safety and quality strategies
Align tourism Align tourism product and product and
servicesservices
� In certain key markets - particularly Africa and Asia - our immigration and visa procedures represent a major constraint
Make it easier to Make it easier to get access to get access to South AfricaSouth Africa
� At certain times of the year, and in certain markets, the availability of airline seats is lower than would support growing demand. This combined with channel economic issues drives up the cost of holidays to SA
Enable adequate Enable adequate and competitive and competitive
airliftairlift
Copyright © 2008 South African TourismThe Marketing Tourism Growth Strategy 2008 – 2010, May 2008 107
with channel economic issues drives up the cost of holidays to SA compared to our competitorsairliftairlift

The Theory of Travel Evolution: Markets are at different stages of development and therefore need specific strategies to activate
Tourism Industry Life Cycleintroduction growth maturity
USA
Germany, Netherlands,
France, UK, Japan
% of population
traveling for leisure
Tourism Industry Life Cycle
Italy
KenyaNigeria
USA France, UK, Japanleisure
SADCChina, IndiaSouth Africa
Australia
Consumer � Uninformed, Price insensitive, multi-purpose
� Seek information & opportunity; discover leisure
� Very informed, price sensitive, focus on leisure
Time*This phase may be very longBotswana
Product
Competitor
� Very individualized
� Status oriented
� few
� One-stop-shops
� Emergence of packages (seeking scale effects)
� Emerging specialization / focus
� Specialized packages
� High competition
� Clear focus
MarketSymptoms
Marketing
Channel � Unsophisticated, isolated, experience based
� Combine with trade initiatives
� Integrate products; information/choice provider
� “shout”: get as many as you can
� Specialization; Information provider
� Adapt trade and market to select segmentsTourism
Authority
Copyright © 2008 South African TourismThe Marketing Tourism Growth Strategy 2008 – 2010, May 2008 108
Overall strategy � Develop positioning � Facilitate scale effects (e.g., packages)
� Understand segments & select
AuthorityActions
* The duration of the four phases of the life cycle may vary significantly; their graphical representation with equal distances may thus be misleading. Note: Framework based on Michael Porter: Competitive Strategy, 1980, Chapter 8 (Industry Evolution)

The tourism industry in South Africa appears to be in a rapid growth phase
The doubling of tour operator numbers in the past five years, expansion in hotel rooms and The doubling of tour operator numbers in the past five years, expansion in hotel rooms and rapid expansion in non-hotel accommodation as well as product proliferation generally are indicative of the current growth phase of the tourism industry
Profile of a high growth industry:
� Rapid entry by new players
introduction growth maturity decline% of total
international travel market
Tourism Product Life Cycle
and over capitalisation / excess capacity
� Emergence of consolidating forces in order to control pricing and capacitypricing and capacity
� More ‘competition’ than ‘co-opetition’ and weak relationships within the industry
Lack of industry-specific /
Source Market
This phase may
Time
� Lack of industry-specific / institutionalised information
This phase may be very long
= SA current
Copyright © 2008 South African TourismThe Marketing Tourism Growth Strategy 2008 – 2010, May 2008 109
* The duration of the four phases of the life cycle may vary significantly; their graphical representation with equal distances may thus be misleading. Note: Framework based on Michael Porter: Competitive Strategy, 1980, Chapter 8 (Industry Evolution)
= SA current position

Strategic alignment in the sector is one of the biggest challenges ahead and one of the biggest barriers to growth
Sustainable competitiveness is not an accident - it is created through the deliberate
Global Competitors
Sustainable competitiveness is not an accident - it is created through the deliberate development of the context within which firms both compete and co-operate
Global Competitors
GlobalDemand
Local Demand
Customer Goals
National GoalsSupporting Supporting IndustriesIndustries
Customer Goals
Strategic ContextStrategic Context
Copyright © 2008 South African TourismThe Marketing Tourism Growth Strategy 2008 – 2010, May 2008 110
Competing Competing OperatorsOperators
Competing Product Competing Product OwnersOwners

SA Tourism is responsible for branding and creating awareness - tourism service providers are responsible for the experience delivery
Awareness created by SAT marketing
Awareness and desire1. THESE ARE GOVERNMENT
LEVEL CHOICES
SAT Portfolio: Core and Tactical Markets
SAT marketing campaigns
Delivery and Experience
� Australia
� Canada
� France
� Germany
� Italy
� Netherlands
� UK
� United States
� Japan
� Sweden
� China (Incl. Hong Kong)
� Austria
These countries account for 18% of arrivals, but 40% of revenue
Channels: Tour operators, Internet, etc
The South African Tourism Product Offering� Mozambique
� Namibia
� Swaziland
� Switzerland
� Zambia
� Zimbabwe
� Angola
� Belgium
� Botswana
� India
� Lesotho
� Malawi
� Brazil
� Ireland
� Kenya
� Malaysia
� New Zealand
� Nigeria
Transport:Airline, rail, car, ship
Tourism Product Offering
Awareness created by marketing campaigns of
The Marketing Tourism Growth Strategy 2008 – 2010, May 2008 111 Copyright © 2008 South African Tourism
industry 2. THESE ARE COMPANY- LEVEL CHOICES
Source: Monitor Group

. ��� ����� ��� ��� ���/
� ����������� ����� ����������� ����
0�$���+���1�����
���2 �
3 ������ ���
��4)
���/�5�,����*'�(������/�5�,����*'�(���
-���/���������6 � �������7��
���7� �������7��
� � ����������� ���������