The Marketing Research Process · 2018-04-22 · chapter 8 Marketing Research and Sales Forecasting...
18
244 part 3 Target Market Selection The Marketing Research Process As discussed earlier, business executives rely on marketing research to provide the information they need to make effective decisions regarding their firm’s current and future activities. The chances of making good decisions improve when the right information is provided at the right time dur- ing decision making. To achieve this goal, marketing researchers often follow the six-step process shown in Figure 8.1. In the initial stages, researchers define the problem, conduct exploratory research, and formulate a hypothesis to be tested. Next, they create a design for the research study and collect needed data. Finally, researchers interpret and present the research information. The following sections take a closer look at each step of the marketing research process. Define the Problem A popular anecdote advises that well-defined problems are half solved. A well-defined problem permits the researcher to focus on securing the exact information needed for the solution. Clearly defining the question that the researcher needs to answer increases the speed and accuracy of the research process. Researchers must carefully avoid confusing symptoms of a problem with the prob- lem itself. A symptom merely alerts marketers that a problem exists. For example, suppose that a maker of frozen pizzas sees its market share drop from 8 to 5 percent in six months. The loss of market share is a symptom of a prob- lem the company must solve. To define the problem, the firm must look for the underlying causes of its market share loss. A logical starting point in iden- tifying the problem might be to evaluate the firm’s target market and marketing mix elements. Suppose, for example, a firm has recently changed its promotional strategies. Research might then seek to answer the ques- tion, “What must we do to improve the effectiveness of our marketing mix?” The firm’s marketers might also look at possible environmental changes. Perhaps a new competitor entered the firm’s market. Decision makers will need information to help answer the question, “What must we do to distinguish our company from the new competitor?” Target recently saw a sales increase of more than $4.5 million from the addition of its new P-Fresh concept, assessment check 1. Identify the different classifications of marketing research suppliers, and explain how they differ from one another. 2. What research methods can be used to measure customer satisfaction? 2 Explain the steps in the marketing research process. Feedback on Research and Marketing Decision Effectiveness Perceived Information Need Marketing Decision Based on Information Collected Conducting Exploratory Research Formulating a Hypothesis Creating a Research Design Collecting Data a. Primary Data b. Secondary Data Interpreting and Presenting the Research Information Defining the Problem figure 8.1 The Marketing Research Process Copyright 2010 Cengage Learning. All Rights Reserved. May not be copied, scanned, or duplicated, in whole or in part. Due to electronic rights, some third party content may be suppressed from the eBook and/or eChapter(s). Editorial review has deemed that any suppressed content does not materially affect the overall learning experience. Cengage Learning reserves the right to remove additional content at any time if subsequent rights restrictions require it.
Transcript of The Marketing Research Process · 2018-04-22 · chapter 8 Marketing Research and Sales Forecasting...

244 part 3 Target Market Selection
The Marketing Research ProcessAs discussed earlier, business executives rely on marketing research to provide the information they need to make effective decisions regarding their firm’s current and future activities. The chances of making good decisions improve when the right information is provided at the right time dur-ing decision making. To achieve this goal, marketing researchers often follow the six-step process shown in Figure 8.1. In the initial stages, researchers define the problem, conduct exploratory research, and formulate a hypothesis to be tested. Next, they create a design for the research study and collect needed data. Finally, researchers interpret and present the research information. The following sections take a closer look at each step of the marketing research process.
Define the ProblemA popular anecdote advises that well-defined problems are half solved. A well-defined problem permits the researcher to focus on securing the exact information needed for the solution. Clearly defining the question that the researcher needs to answer increases the speed and accuracy of the research process.
Researchers must carefully avoid confusing symptoms of a problem with the prob-lem itself. A symptom merely alerts marketers that a problem exists. For example, suppose
that a maker of frozen pizzas sees its market share drop from 8 to 5 percent in six months. The loss of market share is a symptom of a prob-lem the company must solve. To define the problem, the firm must look for the underlying causes of its market share loss.
A logical starting point in iden-tifying the problem might be to evaluate the firm’s target market and marketing mix elements. Suppose, for example, a firm has recently changed its promotional strategies. Research might then seek to answer the ques-tion, “What must we do to improve the effectiveness of our marketing mix?” The firm’s marketers might also look at possible environmental changes. Perhaps a new competitor entered the firm’s market. Decision makers will need information to help answer the question, “What must we do to distinguish our company from the new competitor?”
Target recently saw a sales increase of more than $4.5 million from the addition of its new P-Fresh concept,
assessment check1. Identify the different classifications of marketing research suppliers, and explain how they differ
from one another.
2. What research methods can be used to measure customer satisfaction?
2 Explain the steps in the marketing research process.
Feedback onResearch and
MarketingDecision
Effectiveness
PerceivedInformation
Need
MarketingDecision Based on
InformationCollected
ConductingExploratoryResearch
Formulating aHypothesis
Creating aResearch Design
Collecting Data a. Primary Data b. Secondary Data
Interpreting andPresenting theResearch Information
Defining theProblem
figure 8.1The Marketing Research Process
21782_08_ch08_p237-273.indd 24421782_08_ch08_p237-273.indd 244 30/09/10 10:38 PM30/09/10 10:38 PM
Copyright 2010 Cengage Learning. All Rights Reserved. May not be copied, scanned, or duplicated, in whole or in part. Due to electronic rights, some third party content may be suppressed from the eBook and/or eChapter(s).Editorial review has deemed that any suppressed content does not materially affect the overall learning experience. Cengage Learning reserves the right to remove additional content at any time if subsequent rights restrictions require it.

chapter 8 Marketing Research and Sales Forecasting 245
introducing grocery departments to 108 reformatted stores around the United States. These stores were an expansion of the chain’s first two-year test of the concept at two locations. Their success has encouraged the chain to invest $1 billion in additional remodels of 350 more stores in “high-priority markets.” The goal is to broaden the chain’s product categories and reduce its reliance on purchase of discretionary items.8
Conduct Exploratory ResearchOnce a firm has defined the question it wants to answer, researchers can begin exploratory research. Exploratory research seeks to discover the cause of a specific problem by discussing the problem with informed sources both within and outside the firm and by examining data from other informa-tion sources. Marketers at Romano’s Macaroni Grill, part of Dallas-based Brinker International, might talk with their customers, suppliers, and retailers. Executives at Brinker might also ask for input from the sales force or look for overall market clues. In addition, exploratory research can include evaluation of company records, such as sales and profit analyses, and available competitive data. Marketing researchers often refer to internal data collection as situation analysis. The term infor-mal investigation is often used for exploratory interviews with informed people outside the research-ers’ firms.
USING INTERNAL DATAMarketers can find valuable data in their firm’s own internal records. Typical sources of internal data are sales records, financial statements, and marketing cost analyses. Marketers analyze sales perfor-mance records to gain an overall view of company efficiency and to find clues to potential problems. Prepared from company invoices or a computer database system, this sales analysis can provide important details to management. The study typically compares actual and expected sales based on a detailed sales forecast by territory, product, customer, and salesperson.
Once the sales quota—the level of expected sales to which actual results are compared—has been established, it is a simple process to compare actual results with expected performance. SuperPharm Limited, a chain of retail pharmacy superstores operating in Trinidad and Tobago, recently installed a new centralized software system to track and analyze sales trends for the 15,000 items it stocks and the 10,000 customer transactions it logs every day. Reports trigger restocking and inventory decisions as well as provide information for financial statements and reporting, and a backup system provides for uninterrupted operations in case of Internet access problems in individual stores.9
Other possible breakdowns for sales analysis separate transactions by customer type, product, sales method (Internet, mail, telephone, or personal contact), type of order (cash or credit), and order size. Sales analysis is one of the least expensive and most important sources of marketing information available to a firm.
Accounting data, as summarized in the firm’s financial statements, can be another good tool for identifying financial issues that influence marketing. Using ratio analysis, researchers can compare performance in current and previous years against industry benchmarks. These exercises may hint at possible problems, but only more detailed analysis would reveal specific causes of indicated variations.
A third source of internal information is marketing cost analysis—evaluation of expenses for tasks such as selling, warehousing, advertising, and delivery to determine the profitability of particular cus-tomers, territories, or product lines. Firms often examine the allocation of costs to products, custom-ers, and territories. Marketing decision makers then evaluate the profitability of particular customers and territories on the basis of the sales produced and the costs incurred in generating those sales. Sometimes internal data can produce remarkably detailed customer profiles.
Like sales analysis and financial research, marketing cost analysis is most useful when it provides information linked to other forms of marketing research. A later section of this chapter will address how computer technologies can accomplish these linkages and move information among a firm’s units.
Formulate a HypothesisAfter defining the problem and conducting an exploratory investigation, the marketer needs to for-mulate a hypothesis—a tentative explanation for some specific event. A hypothesis is a statement
exploratory research Process of discussing a marketing problem with informed sources both within and outside the firm and examining information from secondary sources.
sales analysis In-depth evaluation of a firm’s sales.
hypothesis Tentative explanation for a specific event.
briefly
speak ing
“Getting the facts is the key to good decision making. Every mistake that I made—and we all make mistakes—came because I didn’t take the time. I didn’t drive hard enough. I wasn’t smart enough to get the facts.”
—Charles F. Knight(b. 1936)
Chairman emeritus, Emerson Electric
21782_08_ch08_p237-273.indd 24521782_08_ch08_p237-273.indd 245 30/09/10 10:38 PM30/09/10 10:38 PM
Copyright 2010 Cengage Learning. All Rights Reserved. May not be copied, scanned, or duplicated, in whole or in part. Due to electronic rights, some third party content may be suppressed from the eBook and/or eChapter(s).Editorial review has deemed that any suppressed content does not materially affect the overall learning experience. Cengage Learning reserves the right to remove additional content at any time if subsequent rights restrictions require it.

246 part 3 Target Market Selection
about the relationship among variables that carries clear implications for testing this relationship. It sets the stage for more in-depth research by further clarifying what researchers need to test. For example, Olive Garden restaurants might want to see whether good customer service is related to its increased sales, so its marketers would conduct a survey of customers to test this hypothesis.
Not all studies test specific hypotheses, however, a carefully designed study can benefit from the rigor introduced by developing a hypothesis before beginning data collection and analysis.
Create a Research DesignTo test hypotheses and find solutions to marketing problems, a marketer creates a research design, a master plan or model for conducting marketing research. In planning a research project, marketers must be sure the study will measure what they intend to measure. A second important research design consideration is the selection of respondents. Marketing researchers use sampling techniques (dis-cussed later in the chapter) to determine which consumers to include in their studies.
Test kitchens and willing palates are indispensable in the fast-food business. At McDonald’s test kitchen, “We guesstimate 1,800 new ideas a year we’re exposed to,” says the company’s director of culinary innovation. After input from the business research and marketing teams about where the firm is looking to pick up business, the company’s four chefs and suppliers’ chefs get together for brainstorming. “When we’re in that environment,” says the culinary director, “I say, ‘Look, we close the door, there are no bad ideas in this kitchen.’ ” About 30 ideas each year get a closer look, and about half of those are presented to the fast-food chain’s management team. Between three and five are actually launched in a given year.10
Collect DataMarketing researchers gather two kinds of data: secondary data and primary data. Secondary dataare information from previously published or compiled sources. Census data is an example. Primary data refers to information collected for the first time specifically for a marketing research study. An example of primary data is statistics collected from a survey that asks current customers about their preferences for product improvements. Global research firm Synovate collects primary data in the Americas, Asia, Europe, and the Middle East for its clients. The company has no physical headquar-ters and operates in 60 countries around the world, conducts thousands of projects and focus groups and millions of interviews, and employs nearly 6,000 people with “one thing in common: boundless curiosity.”11
Secondary data offer two important advantages: (1) such data are almost always less expensive to gather than primary data, and (2) researchers usually spend less time to locate and use secondary data. A research study that requires primary data may take three to four months to complete, while a researcher often can gather secondary data in a matter of days.
Secondary data have limitations that primary data do not. First, published information can quickly become obsolete. A marketer analyzing the population of various areas may discover that even the most recent census figures already are out of date because of rapid growth and changing demographics. Second, published data collected for an unrelated purpose may not be completely relevant to the marketer’s specific needs. For example, census data do not reveal the brand preferences of consumers.
Although research to gather primary data can cost more and take longer, the results can pro-vide richer, more detailed information than secondary data offer. The choice between secondary and primary data is tied to cost, applicability, and effectiveness. Many marketing research projects com-bine secondary and primary data to fully answer marketing questions. This chapter examines specific methods for collecting both secondary and primary data in later sections.
Interpret and Present Research DataThe final step in the marketing research process is to interpret the findings and present them to deci-sion makers in a format that allows managers to make effective judgments. Possible differences in interpretations of research results may occur between marketing researchers and their audiences due
research design Master plan for conducting market research.
secondary data Previously published information.
primary data Information collected for a specific investigation.
3 Distinguish between primary and secondary data, and identify the sources of each type.
briefly
speak ing
“The great tragedy of science is the slaying of a beautiful hypothesis by an ugly fact.”
—Thomas H. Huxley(1825–1895)
British biologist and educator
21782_08_ch08_p237-273.indd 24621782_08_ch08_p237-273.indd 246 30/09/10 10:38 PM30/09/10 10:38 PM
Copyright 2010 Cengage Learning. All Rights Reserved. May not be copied, scanned, or duplicated, in whole or in part. Due to electronic rights, some third party content may be suppressed from the eBook and/or eChapter(s).Editorial review has deemed that any suppressed content does not materially affect the overall learning experience. Cengage Learning reserves the right to remove additional content at any time if subsequent rights restrictions require it.

chapter 8 Marketing Research and Sales Forecasting 247
to differing backgrounds, levels of knowledge, and experience. Both oral and written reports should be presented in a manner designed to minimize such misinterpretations.
Marketing researchers and research users must cooperate at every stage in the research process. Too many studies go unused because management fears that the results are of little use, once they hear lengthy discussions of research limitations or unfamiliar terminology. Marketing researchers must remember to direct their reports toward management and not to other researchers. They should spell out their conclusions in clear and concise terms that can be put into action. Reports should confine technical details of the research methods to an appendix, if they are included at all. By pre-senting research results to all key executives at a single sitting, researchers can ensure that everyone will understand the findings. Decision makers can then quickly reach consensus on what the results mean and what actions need to be taken.
Marketing Research MethodsClearly, data collection is an integral part of the marketing research process. One of the most time-consuming parts of collecting data is determining what method the marketer should use to obtain the data. This section discusses the most commonly used methods by which marketing researchers find both secondary and primary data.
Secondary Data CollectionSecondary data come from many sources. The overwhelming quantity of secondary data available at little or no cost challenges researchers to select only data relevant to the problem or issue studied.
Secondary data consist of two types: internal and external data. Internal data, as discussed earlier, include sales records, product performance reviews, sales force activity reports, and mar-keting cost reports. External data come from a variety of sources, including government records, syndicated research services, and industry publications. Computerized databases provide access to vast amounts of data from both inside and outside an organization. The following sections on gov-ernment data, private data, and online sources focus on databases and other external data sources available to marketing researchers.
GOVERNMENT DATAThe federal government is the nation’s most important source of marketing data. Census data pro-vide the most frequently used government statistics. A census of population is conducted every ten years and is made available at no charge in local libraries, on computer disks, and via the Internet. Because of problems implementing a computerized system, the U.S. Census Bureau recently aban-doned plans to go high-tech with handheld computers for data collection. Instead, it will count the country’s more than 300 million residents by training workers to collect data with pen and paper from those who don’t respond to its mailed survey.12 The Census Bureau also conducts a periodic census of housing, population, business, manufacturers, agriculture, minerals, and governments.
THE 2010 U.S. CENSUSThe U.S. Census of Population contains a wealth of valuable information for marketers. It breaks down the U.S. population of more than 300 million people by very small geographic areas, making it possible to determine population traits by city block or census tract in large cities. It also divides the populations
assessment check1. What are the six steps in the marketing research process?
2. What is the goal of exploratory research?
brieflyspeak ing
“When you are drown-ing in numbers, you need a system to separate the wheat from the chaff.”
—Anthony Adams(b. 1940)
Fortune 500 marketing consultant
21782_08_ch08_p237-273.indd 24721782_08_ch08_p237-273.indd 247 30/09/10 10:38 PM30/09/10 10:38 PM
Copyright 2010 Cengage Learning. All Rights Reserved. May not be copied, scanned, or duplicated, in whole or in part. Due to electronic rights, some third party content may be suppressed from the eBook and/or eChapter(s).Editorial review has deemed that any suppressed content does not materially affect the overall learning experience. Cengage Learning reserves the right to remove additional content at any time if subsequent rights restrictions require it.
248 part 3 Target Market Selection
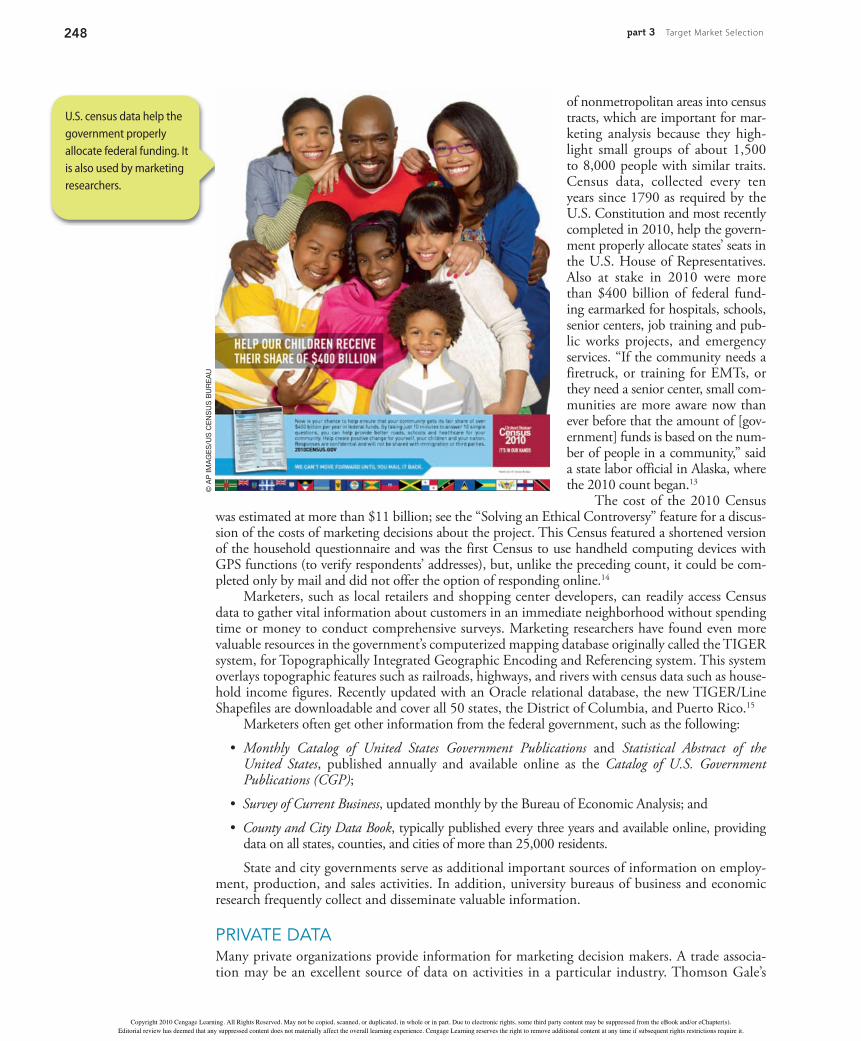
of nonmetropolitan areas into census tracts, which are important for mar-keting analysis because they high-light small groups of about 1,500 to 8,000 people with similar traits. Census data, collected every ten years since 1790 as required by the U.S. Constitution and most recently completed in 2010, help the govern-ment properly allocate states’ seats in the U.S. House of Representatives. Also at stake in 2010 were more than $400 billion of federal fund-ing earmarked for hospitals, schools, senior centers, job training and pub-lic works projects, and emergency services. “If the community needs a firetruck, or training for EMTs, or they need a senior center, small com-munities are more aware now than ever before that the amount of [gov-ernment] funds is based on the num-ber of people in a community,” said a state labor official in Alaska, where the 2010 count began.13
The cost of the 2010 Census was estimated at more than $11 billion; see the “Solving an Ethical Controversy” feature for a discus-sion of the costs of marketing decisions about the project. This Census featured a shortened version of the household questionnaire and was the first Census to use handheld computing devices with GPS functions (to verify respondents’ addresses), but, unlike the preceding count, it could be com-pleted only by mail and did not offer the option of responding online.14
Marketers, such as local retailers and shopping center developers, can readily access Census data to gather vital information about customers in an immediate neighborhood without spending time or money to conduct comprehensive surveys. Marketing researchers have found even more valuable resources in the government’s computerized mapping database originally called the TIGER system, for Topographically Integrated Geographic Encoding and Referencing system. This system overlays topographic features such as railroads, highways, and rivers with census data such as house-hold income figures. Recently updated with an Oracle relational database, the new TIGER/Line Shapefiles are downloadable and cover all 50 states, the District of Columbia, and Puerto Rico.15
Marketers often get other information from the federal government, such as the following:• Monthly Catalog of United States Government Publications and Statistical Abstract of the
United States, published annually and available online as the Catalog of U.S. Government Publications (CGP);
• Survey of Current Business, updated monthly by the Bureau of Economic Analysis; and• County and City Data Book, typically published every three years and available online, providing
data on all states, counties, and cities of more than 25,000 residents.State and city governments serve as additional important sources of information on employ-
ment, production, and sales activities. In addition, university bureaus of business and economic research frequently collect and disseminate valuable information.
PRIVATE DATAMany private organizations provide information for marketing decision makers. A trade associa-tion may be an excellent source of data on activities in a particular industry. Thomson Gale’s
U.S. census data help the government properly allocate federal funding. It is also used by marketing researchers.
© A
P IM
AG
ES/U
S C
ENS
US
BU
REA
U
21782_08_ch08_p237-273.indd 24821782_08_ch08_p237-273.indd 248 30/09/10 10:38 PM30/09/10 10:38 PM
Copyright 2010 Cengage Learning. All Rights Reserved. May not be copied, scanned, or duplicated, in whole or in part. Due to electronic rights, some third party content may be suppressed from the eBook and/or eChapter(s).Editorial review has deemed that any suppressed content does not materially affect the overall learning experience. Cengage Learning reserves the right to remove additional content at any time if subsequent rights restrictions require it.

chapter 8 Marketing Research and Sales Forecasting 249
Encyclopedia of Associations, available in many libraries, can help marketers track down trade asso-ciations that may have pertinent data. Also, the advertising industry continuously collects data on audiences reached by various media.
Business and trade magazines also publish a wide range of valuable data. Ulrich’s Guide to International Periodicals, another common library reference, can point researchers in the direction of trade publications that conduct and publish industry-specific research. General business magazines can also be good sources. Sales & Marketing Management, for instance, publishes an annual Survey of Media Markets that combines statistics for population, effective buying income (EBI), and retail sales into buying power indexes that indicate each geographic market’s ability to buy.
Because few libraries carry specialized trade journals, the best way to gather data from them is either directly from the publishers or through online periodical databases such as ProQuest Direct’s ABI/Inform, available at many libraries. Increasingly, trade publications maintain Web home pages that allow archival searches. Larger libraries can often provide directories and other publications that
Officials of the 2010 U.S. Census balanced their Constitutional mandate to reach the country’s 308 mil-lion residents against record levels of government debt.
Before it even began, the Census, which is used to allocate seats in the House of Representatives and distribute billions of federal aid dollars, was criticized for wasteful spending, including $4.5 million to train 10,000 employees who either worked for a single day or quit or were let go before performing any work. A SuperBowl spot costing $2.5 million was also scorned.
Should the government buy expensive advertising?
PRO 1. Awareness-raising is critical to completing an accurate count.
“We have a very limited window of opportunity to achieve our goals,” said the Census Bureau, “and therefore need pro-gramming that delivers high ratings. We did not choose the SuperBowl at the expense of some other programming. We went where the audience was.”
2. Its SuperBowl deal with CBS gave the Census Bureau “added value” in the form of extra 30-second spots before and during the game and several on-air mentions during the pregame show. “We think this is a pretty good deal for taxpayers,” said the Bureau’s associate communications director.
CON 1. Senator John McCain commented on the SuperBowl ad,
seen by nearly 100 million people, calling it “symptomatic of the spending practices of the federal government and the Congress in a way that is completely out of touch with what’s going on out there in the real world.”
2. A federal audit warned that Census costs could continue to rise unless spending controls were tightened.
SummaryCensus promotions included television, radio, print, Web advertise-ments, and videos on Facebook, MySpace, Twitter, and YouTube. Census director Robert Groves predicted that such efforts, by moti-vating residents to respond on time, would avoid costly in-person follow-up and help the department return millions of dollars to the federal government.
Sources: “Census Bureau Wasted Millions on 2010 Headcount Preparations, Audit Finds,” Fox News.com, www.foxnews.com, February 16, 2010; Hope Yen, “Gov’t Buys $2.5M in Super Bowl Ads to Boost Census,” Yahoo! News, http://news.yahoo.com, February 5, 2010; Ed O’Keefe, “Census’s Super Bowl Ad Draws a Flag from McCain,” The Washington Post, http://voices.washingtonpost.com, February 4, 2010; Aaron Smith, “Census Bureau Counts on Super Bowl Ad,” CNNMoney.com, http://money.cnn.com, January 26, 2010.
L ooking into Census Bureau Spending on Advertising
21782_08_ch08_p237-273.indd 24921782_08_ch08_p237-273.indd 249 30/09/10 10:38 PM30/09/10 10:38 PM
Copyright 2010 Cengage Learning. All Rights Reserved. May not be copied, scanned, or duplicated, in whole or in part. Due to electronic rights, some third party content may be suppressed from the eBook and/or eChapter(s).Editorial review has deemed that any suppressed content does not materially affect the overall learning experience. Cengage Learning reserves the right to remove additional content at any time if subsequent rights restrictions require it.

250 part 3 Target Market Selection
can help researchers find second-ary data. For instance, Guideline’s FindEx: The Directory of Market Research Reports, Studies, and Surveyslists a tremendous variety of com-pleted research studies available for purchase.
Several national firms offer information to businesses by sub-scription. RoperASW is a global database service; its Roper Reports Worldwide provides continuing data on consumer attitudes, life stages, lifestyle, and buying behavior for more than 30 developed and devel-
oping countries. Wright Investors produces research reports and quality ratings on more than 31,000 companies from 55 countries.
Electronic systems that scan UPC (Universal Product Code) bar codes speed purchase trans-actions and provide data used for inventory control, ordering, and delivery. Scanning technology is widely used by grocers and other retailers, and marketing research companies such as ACNielsen and Information Resources store this data in commercially available databases. These scanner-based information services track consumer purchases of a wide variety of UPC-coded products. Retailers can use this information to target customers with the right merchandise at the right time.
Newer techniques that rely on radio-frequency identification (RFID) technology are in grow-ing use. American Apparel, a rapidly growing chain of U.S.-made clothing with more than 200 retail stores in 18 countries, tested RFID tags for stocking and inventory replenishment in its New York City store. The company found the tags improved stock keeping and thus helped customers find more items in the right size and color in the right place on the selling floor, thus increasing sales and freeing salespeople from restocking chores so they could spend more time assisting shop-pers. In addition, inventory counts that used to occupy several salespeople for an entire day were done by two people in a couple of hours, and more accurately. The company has already decided to roll the RFID technology out across all its U.S. store locations.16
ACNielsen SalesNet uses the Internet to deliver scanner data quickly to clients. Data are processed as soon as they are received from supermarkets and are then forwarded to marketing researchers so they can perform more in-depth analysis. At the same time, Nielsen representatives summarize the data in both graphic and spreadsheet form and post the data on the Internet for immediate access by clients.
ONLINE SOURCES OF SECONDARY DATAThe tools of cyberspace sometimes simplify the hunt for secondary data. Hundreds of databases and other sources of information are available online. A well-designed, Internet-based marketing research project can cost less yet yield faster results than offline research.
The Internet has spurred the growth of research aggregators—companies that acquire, catalog, reformat, segment, and then resell premium research reports that have already been published. Aggregators put valuable data within reach of marketers who lack the time or the budget to commission custom research. Because Web technology makes their databases easy to search, aggregators such as Datamonitor and eMarketer can compile detailed, specialized reports quickly and cost-effectively.17 Social networking sites also yield valuable marketing information. Social networks may also provide secondary private data. Google Analytics is a business tool for measuring online sales, tracking e-mail and ad campaigns, and benchmarking key measures against competitors. Marketers are beginning to use it to collect information from sites men-tioned on Twitter, while Facebook has partnered with Nielsen Co. to poll users about their reac-tions to ads on the site in an effort to demonstrate the ads’ effectiveness.18 YouTube now offers a service called YouTube Insight that gives its video-uploading account holders an array of statis-tics, graphs, and maps about the audiences they attract, far more specific than just the number of views it used to collect.19
Scanning technology is widely used by gro-cers and other retailers. Marketing research com-panies, such as ACNielsen and Information Resources, store these data in commercially available databases.
sampling Process of selecting survey respondents or research participants.
population (universe) Total group that researchers want to study.
© V
OZN
IKEV
ICH
KO
NS
TAN
TIN
/SH
UTT
ERS
TOC
K.C
OM
21782_08_ch08_p237-273.indd 25021782_08_ch08_p237-273.indd 250 30/09/10 10:38 PM30/09/10 10:38 PM
Copyright 2010 Cengage Learning. All Rights Reserved. May not be copied, scanned, or duplicated, in whole or in part. Due to electronic rights, some third party content may be suppressed from the eBook and/or eChapter(s).Editorial review has deemed that any suppressed content does not materially affect the overall learning experience. Cengage Learning reserves the right to remove additional content at any time if subsequent rights restrictions require it.

chapter 8 Marketing Research and Sales Forecasting 251
Researchers must, however, carefully evaluate the validity of information they find on the Internet. People without in-depth knowledge of the subject matter may post information in a news-group. Similarly, Web pages might contain information gathered using questionable research meth-ods. The phrase caveat emptor (“let the buyer beware”) should guide evaluation of secondary data on the Internet.
assessment check1. Distinguish between primary and secondary data.
2. What are the major methods of collecting secondary data?
3. What are the major methods of collecting primary data?
4 Explain the different sam-pling techniques used by marketing researchers.
Sampling TechniquesBefore undertaking a study to gather primary data, researchers must first identify which participants to include in the study. Sampling is the process of selecting survey respondents or research partici-pants. Sampling is important because, if a study fails to involve consumers who accurately reflect the target market, the research is likely to yield misleading conclusions.
The total group of people the researcher wants to study is called the population or universe. For a political campaign study, the population would be all eligible voters. For research about a new lipstick line, it might be all women in a certain age bracket. The sample is a representative group chosen from this population. Researchers rarely gather information from a study’s total population, resulting in a census. Unless the total population is small, the costs of a census are simply too high. Sometimes limitations can reduce the size of the sample. Online surveys, for instance, often draw large but self-selected, rather than random, groups of respondents who don’t usually represent the total population. Vague questions and surveys that are too long further reduce the number of respon-dents and can skew the results even further. 20
Samples can be classified as either probability samples or nonprobability samples. A probability sample is one that gives every member of the population a chance of being selected. Types of prob-ability samples include simple random samples, stratified samples, and cluster samples.
In a simple random sample, every member of the relevant universe has an equal opportunity of selection. The draft lottery of the Vietnam era is an example. The days of the year were drawn and set into an array. The placement of a person’s birthday in this list determined his likelihood of being called for service. In a stratified sample, randomly selected subsamples of different groups are represented in the total sample. Stratified samples provide efficient, representative groups that are relatively homogeneous for a certain characteristic for such studies as opinion polls in which groups of individuals share various divergent viewpoints. In a cluster sample, researchers select a sample of subgroups (or clusters) from which they draw respondents. Each cluster reflects the diversity of the whole population being sampled. This cost-efficient type of probability sample is widely used when the entire population cannot be listed or enumerated.
In contrast, a nonprobability sample relies on personal judgment somewhere in the selection process. In other words, researchers decide which particular groups to study. Types of nonprobability samples are convenience samples and quota samples. A convenience sample is a nonprobability sam-ple selected from among readily available respondents; this sample often is called an accidental sample because those included just happen to be in the place where the study is being conducted. Mall intercept surveys and TV call-in opinion polls are good examples. Marketing researchers sometimes use convenience samples in exploratory research but not in definitive studies. A quota sample is a nonprobability sample divided to maintain the proportion of certain characteristics among different segments or groups seen in the population as a whole. In other words, each field worker is assigned a quota that specifies the number and characteristics of the people to contact. It differs from a strati-fied sample in which researchers select subsamples by some random process; in a quota sample, they handpick participants.
probability sample Sample that gives every member of the population a chance of being selected.
simple random sample Basic type of probability sample in which every individual in the relevant universe has an equal opportunity of being selected.
stratified sample Probability sample con-structed to represent ran-domly selected subsamples of different groups within the total sample; each subgroup is relatively homogeneous for a certain characteristic.
cluster sample Probability sample in which researchers select a sample of subgroups (or clusters) from which they draw respondents; each cluster reflects the diversity of the whole population sampled.
nonprobability sample Sample that involves personal judgment somewhere in the selection process.
convenience sample Nonprobability sample selected from among readily available respondents.
quota sample Nonprob-ability sample divided to main-tain the proportion of certain characteristics among different segments or groups seen in the population as a whole.
21782_08_ch08_p237-273.indd 25121782_08_ch08_p237-273.indd 251 30/09/10 10:38 PM30/09/10 10:38 PM
Copyright 2010 Cengage Learning. All Rights Reserved. May not be copied, scanned, or duplicated, in whole or in part. Due to electronic rights, some third party content may be suppressed from the eBook and/or eChapter(s).Editorial review has deemed that any suppressed content does not materially affect the overall learning experience. Cengage Learning reserves the right to remove additional content at any time if subsequent rights restrictions require it.

252 part 3 Target Market Selection
Primary Research MethodsMarketers use a variety of methods for conducting primary research, as Figure 8.2 shows. The prin-cipal methods for collecting primary data are observation, surveys, and controlled experiments. The choice among these methods depends on the issues under study and the decisions that marketers need to make. In some cases, researchers may decide to combine techniques during the research process.
OBSERVATION METHODIn observational studies, researchers view the overt actions of subjects being studied. Marketers try-ing to understand how consumers behave in certain situations find observation a useful technique. Observation tactics may be as simple as counting the number of cars passing by a potential site for a fast-food restaurant or checking the license plates at a shopping center near a state line to determine where shoppers live.
Technological advances provide increasingly sophisticated ways for observing consumer behav-ior. The television industry relies on data from people meters, electronic remote-control devices that record the TV viewing habits of individual household members to measure the popularity of TV shows. Traditional people meters require each viewer to press a button each time he or she turns on the TV, changes channels, or leaves the room.
Some observers expect that communications technology will also change the way consumers respond to advertising. Internet users are more willing than ever to use real money for purchases that arise during their social gaming and social networking sessions, for instance, including on Facebook. “It surprised a lot of people,” said Adweek’s digital editor. “It’s an activity that showed up first in Asia and many people thought, ‘Oh well, people will never do that here.’ ”21 Technology is also yielding new ways to observe people. Read the “Marketing Success” feature to learn about the marketing implications of software that maps consumers’ movements around cities.
assessment check1. What is sampling?
2. Explain the different types of probability samples.
3. Identify the types of nonprobability samples.
5 Identify the methods by which marketing researchers collect primary data.
Mapping the Market
Background. Just as Internet marketers can track the number of visitors to their Web sites, so do marketers in the physical world want to be able to understand where con-sumers go, when, how often, and who else is there. Discovering what similarly located people have in common can help them tar-get advertising with pinpoint accuracy.
The Challenge. Collecting highly detailed mapping information is easier than
ever thanks to Wi-Fi and smartphones like the iPhone and BlackBerry, used by millions of consumers. Hundreds of applications for these mobile devices already tap the user’s physical location to offer walking or driving directions, locate friends, and recommend nearby stores and restaurants. “The phone in your hand is the bridge between the virtual and real worlds,” said a Web executive at Nokia. Remaining marketing challenges are
overcoming consumers’ resistance to unso-licited ads on their cell phones and working out privacy issues inherent in the highly specific mapping capabilities that now are possible.
The Strategy. A New York City startup called Sense Networks is developing soft-ware that pinpoints real-time consumer activity around different city neighbor-hoods. After shying away from selling
21782_08_ch08_p237-273.indd 25221782_08_ch08_p237-273.indd 252 30/09/10 10:38 PM30/09/10 10:38 PM
Copyright 2010 Cengage Learning. All Rights Reserved. May not be copied, scanned, or duplicated, in whole or in part. Due to electronic rights, some third party content may be suppressed from the eBook and/or eChapter(s).Editorial review has deemed that any suppressed content does not materially affect the overall learning experience. Cengage Learning reserves the right to remove additional content at any time if subsequent rights restrictions require it.

chapter 8 Marketing Research and Sales Forecasting 253
Videotaping consumers in action is also gaining acceptance as a research technique. Cookware manufacturers may videotape consumers cooking in their own kitchens to evaluate how they use their pots and pans. A toothbrush manufacturer asked marketing research firm E-Lab to videotape con-sumers brushing their teeth and using mouthwash in its quest to develop products that would leave behind the sensation of cleanliness and freshness.
In an effort to understand what makes younger consumers tick, a trend-forecasting firm called Teenage Research Unlimited has auditioned and hired a panel of more than 300 “diverse, trend-setting, savvy teens” to participate in focus groups and research queries for its Trendwatch Panel. The company has also inter-viewed more than 2 million teens and “twenty-somethings” in 20 countries around the world for its annual TRU Study report.22
PrimaryResearchMethods
Surveys
ControlledExperiments
ObservationExamples:• traffic counts• Nielsen television ratings• taping shopping habits
Examples:• focus group interviews• telephone surveys• online surveys
Example:• test market
services directly to these spotlighted consumers because of privacy concerns, the firm started looking into ways to allow marketers to make use of its mapping data, organized by “tribes” or people with similar behavior. While Sense could col-lect personal data too, “It’s not worth the risk,” says the firm, “and we don’t need that information.”
The Outcome. Some say the new car-tography heralds the arrival of the “Next Net,” and Sense recently raised $6 million in new venture capital. While its pure marketing possibilities are still being explored, map-ping software like Sense Networks’ also has the potential to improve transit systems and traffic patterns, ease workers’ commutes, pinpoint the occurrence and spread of crime,
slow the transmission of disease, and even guide some investment decisions.
Sources: Company Web site, Sense Networks Inc., www.sensenetworks.com, accessed March 2, 2010; Matt Marshall, “Sense Networks Gets $6M in Hotly Contested Deal for ‘Tribe’ Advertising,” DigitalBeat, http://digital.venturebeat.com, June 26, 2009; Kate Greene, “Mapping a City’s Rhythm,” Technology Review, www.technologyreview.com, March 13, 2009; Stephen Baker, “The Next Net,” BusinessWeek, March 9, 2009, pp. 42–45.
Observation methods may be as simple as counting the number of cars passing by a potential site for a fast-food restaurant.
s
figure 8.2Types of Primary Research
© T
ERR
I MIL
LER
/E-V
ISU
AL
CO
MM
UN
ICAT
ION
S, I
NC
.
21782_08_ch08_p237-273.indd 25321782_08_ch08_p237-273.indd 253 30/09/10 10:38 PM30/09/10 10:38 PM
Copyright 2010 Cengage Learning. All Rights Reserved. May not be copied, scanned, or duplicated, in whole or in part. Due to electronic rights, some third party content may be suppressed from the eBook and/or eChapter(s).Editorial review has deemed that any suppressed content does not materially affect the overall learning experience. Cengage Learning reserves the right to remove additional content at any time if subsequent rights restrictions require it.
254 part 3 Target Market Selection
INTERPRETATIVE RESEARCHAnother type of primary research is interpretative research, a method in which a researcher observes a customer or group of customers in their natural setting and interprets their behavior based on an understanding of the social and cultural characteristics of that setting. We discuss interpretative research in more detail later.
Survey MethodsObservation alone cannot supply all of the desired information. Researchers must ask questions to get information on attitudes, motives, and opinions. It is also difficult to get exact demographic information, such as income levels, from observation. To discover this information, researchers can use either interviews or questionnaires. Philadelphia-based Dorland Healthcare Information provides marketing research for the health care and managed care market and relies heavily on mail, phone, and fax surveys as well as interviews with knowledgeable sources.23
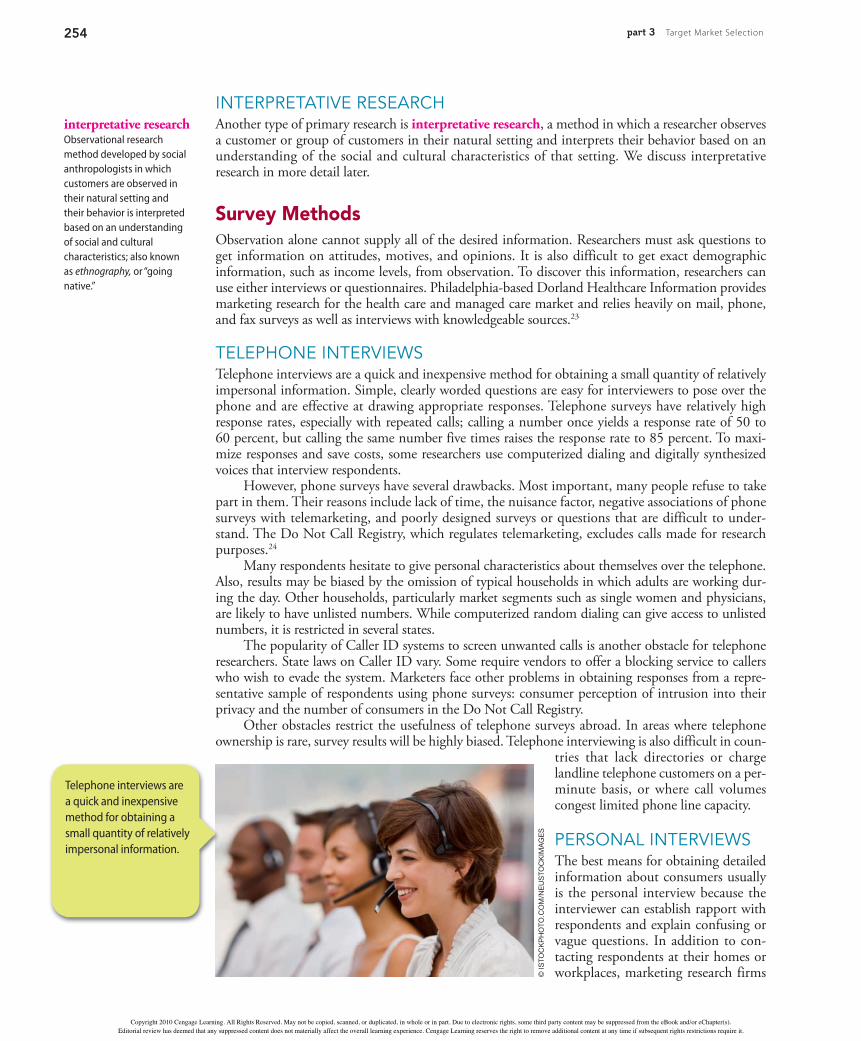
TELEPHONE INTERVIEWSTelephone interviews are a quick and inexpensive method for obtaining a small quantity of relatively impersonal information. Simple, clearly worded questions are easy for interviewers to pose over the phone and are effective at drawing appropriate responses. Telephone surveys have relatively high response rates, especially with repeated calls; calling a number once yields a response rate of 50 to 60 percent, but calling the same number five times raises the response rate to 85 percent. To maxi-mize responses and save costs, some researchers use computerized dialing and digitally synthesized voices that interview respondents.
However, phone surveys have several drawbacks. Most important, many people refuse to take part in them. Their reasons include lack of time, the nuisance factor, negative associations of phone surveys with telemarketing, and poorly designed surveys or questions that are difficult to under-stand. The Do Not Call Registry, which regulates telemarketing, excludes calls made for research purposes.24
Many respondents hesitate to give personal characteristics about themselves over the telephone. Also, results may be biased by the omission of typical households in which adults are working dur-ing the day. Other households, particularly market segments such as single women and physicians, are likely to have unlisted numbers. While computerized random dialing can give access to unlisted numbers, it is restricted in several states.
The popularity of Caller ID systems to screen unwanted calls is another obstacle for telephone researchers. State laws on Caller ID vary. Some require vendors to offer a blocking service to callers who wish to evade the system. Marketers face other problems in obtaining responses from a repre-sentative sample of respondents using phone surveys: consumer perception of intrusion into their privacy and the number of consumers in the Do Not Call Registry.
Other obstacles restrict the usefulness of telephone surveys abroad. In areas where telephone ownership is rare, survey results will be highly biased. Telephone interviewing is also difficult in coun-
tries that lack directories or charge landline telephone customers on a per-minute basis, or where call volumes congest limited phone line capacity.
PERSONAL INTERVIEWSThe best means for obtaining detailed information about consumers usually is the personal interview because the interviewer can establish rapport with respondents and explain confusing or vague questions. In addition to con-tacting respondents at their homes or workplaces, marketing research firms
interpretative research Observational research method developed by social anthropologists in which customers are observed in their natural setting and their behavior is interpreted based on an understanding of social and cultural characteristics; also known as ethnography, or “going native.”
Telephone interviews are a quick and inexpensive method for obtaining a small quantity of relatively impersonal information.
© IS
TOC
KP
HO
TO.C
OM
/NEU
STO
CK
IMA
GES
21782_08_ch08_p237-273.indd 25421782_08_ch08_p237-273.indd 254 30/09/10 10:38 PM30/09/10 10:38 PM
Copyright 2010 Cengage Learning. All Rights Reserved. May not be copied, scanned, or duplicated, in whole or in part. Due to electronic rights, some third party content may be suppressed from the eBook and/or eChapter(s).Editorial review has deemed that any suppressed content does not materially affect the overall learning experience. Cengage Learning reserves the right to remove additional content at any time if subsequent rights restrictions require it.

chapter 8 Marketing Research and Sales Forecasting 255
can conduct interviews in rented space in shopping centers where they gain wide access to potential buyers of the merchandise they are studying. These locations sometimes feature private interviewing space, videotape equipment, and food preparation facilities for taste tests. As mentioned earlier, inter-views conducted in shopping centers typically are called mall intercepts. Downtown retail districts and airports provide other valuable locations for marketing researchers.
FOCUS GROUPSMarketers also gather research information through the popular technique of focus group interviews. A focus group brings together 8 to 12 individuals in one location to discuss a subject of interest. Unlike other interview techniques that elicit information through a question-and-answer format, focus groups usually encourage a general discussion of a predetermined topic. Focus groups can pro-vide quick and relatively inexpensive insight into consumer attitudes and motivations.
In a focus group, the leader, or moderator, typically begins by explaining the purpose of the meeting and suggesting an opening topic. The moderator’s main purpose, however, is to stimulate interaction among group members to encourage their discussion of numerous points. The moderator may occasionally interject questions as catalysts to direct the group’s discussion. The moderator’s job is difficult, requiring preparation and group facilitation skills.
Focus group sessions often last one or two hours. Researchers usually record the discussion on tape, and observers frequently watch through a one-way mirror. Some research firms also allow cli-ents to view focus groups in action through videoconferencing systems.
Focus groups are a particularly valuable tool for exploratory research, developing new-product ideas, and preliminary testing of alternative marketing strategies. They can also aid in the develop-ment of well-structured questionnaires for larger-scale research.
Focus groups have a few drawbacks. For instance, one argumentative participant can intimidate everyone else in the group, just as one person who won’t open up in the discussion can hold others back. In addition, some group members may say what they think researchers want to hear, offer ideas and opinions for which they have no supporting evidence or experience, or assume everyone feels the same way they do.25
Researchers are finding ways to re-create the focus group environment over the Internet. With experienced moderators who have the technical skills to function fluently online, it is pos-sible to gain valuable qualitative information at a fraction of the cost of running a traditional focus group session. Online focus groups can be both cost and time efficient, with immediate results in the form of chat transcripts. The convenience of online conversations tends to improve attendance as well, particularly among those who are otherwise difficult to include, such as professionals and people who travel frequently, and the problem of peer pressure is virtually eliminated. Some draw-backs include the lack of ability to see body language and nonverbal cues, the difficulty of testing any products in which taste or smell is relevant, and the potential for samples to be nonrepresen-tative because they are limited to those who have Internet access and a certain comfort level with technology.
MAIL SURVEYSAlthough personal interviews can provide very detailed information, cost considerations usually pre-vent an organization from using personal interviews in a large-scale study. A mail survey can be a cost-effective alternative. Mail surveys can provide anonymity that may encourage respondents to give candid answers. They can also help marketers track consumer attitudes through ongoing research and sometimes provide demographic data that may be helpful in market segmentation.
Mail questionnaires do, however, have several limitations. First, response rates are typically much lower than for personal interviews. Second, because researchers must wait for respondents to complete and return questionnaires, mail surveys usually take a considerably longer time to conduct. A third limitation is that questionnaires cannot answer unanticipated questions that occur to respon-dents as they complete the forms. In addition, complex questions may not be suitable for a mail questionnaire. Finally, unless they gather additional information from nonrespondents through other means, researchers must worry about possible bias in the results stemming from differences between respondents and nonrespondents.
mall intercepts Interviews conducted inside retail shopping centers.
focus group Simultaneous personal interview of a small group of individuals that relies on group discussion about a certain topic.
briefly
speak ing
“The more the data banks record about each one of us, the less we exist.”
—Marshall McLuhan(1911–1980)
Canadian communications theorist
21782_08_ch08_p237-273.indd 25521782_08_ch08_p237-273.indd 255 30/09/10 10:38 PM30/09/10 10:38 PM
Copyright 2010 Cengage Learning. All Rights Reserved. May not be copied, scanned, or duplicated, in whole or in part. Due to electronic rights, some third party content may be suppressed from the eBook and/or eChapter(s).Editorial review has deemed that any suppressed content does not materially affect the overall learning experience. Cengage Learning reserves the right to remove additional content at any time if subsequent rights restrictions require it.

256 part 3 Target Market Selection
Researchers try to minimize these limitations by carefully developing and pretesting ques-tionnaires. Researchers can boost response rates by keeping questionnaires short and by offering incentives—typically, discount coupons or a dollar bill.
FAX SURVEYSThe low response rates and long follow-up times associated with mail surveys have spurred interest in the alternative of faxing survey documents. In some cases, faxes may supplement mail surveys; in others, they may be the primary method for contacting respondents. Because millions of households do not have fax machines, securing a representative sample of respondents is a difficult undertaking in fax surveys of final consumers. As a result, most of these surveys focus on business-related research studies.
The federal junk fax law prohibits the sending by fax of “any material advertising the com-mercial availability or quality of any property, goods, or services which is transmitted to any person without that person’s prior express invitation or permission, in writing or otherwise.” The first page of any fax solicitation must now include information for the recipient about how to opt out of similar messages in the future.26
ONLINE SURVEYS AND OTHER INTERNET-BASED METHODSThe growing population of Internet users has spurred researchers to conduct online surveys. Using the Web, they are able to speed the survey process, increase sample sizes, ignore geographic boundar-ies, and dramatically reduce costs. While a standard research project can take up to eight weeks to complete, a thorough online project may take two weeks or less. Less intrusive than telephone sur-veys, online research allows participants to respond at their leisure. The novelty and ease of answering online may even encourage higher response rates. For some tips on creating online surveys, see the “Career Readiness” feature.
Businesses and other organizations are increasingly including questionnaires on their Web pages to solicit information about consumer demographics, attitudes, and comments and sug-
gestions for improving goods and services or improving marketing messages. Online polling is also increasingly popular. Social networking sites, on which consumers around the world now spend an average of five and a half hours a month (up from just three hours a year ago), show no sign of slowing down. Facebook has the highest on-site time (nearly six hours a month), and the largest number of unique users—nearly 210 million worldwide.27 While companies have struggled for ways to measure the impact of social media, more tools than ever exist for tracking which ones drive traffic to any particu-lar site or sites and thus which would be the best sites on which to post polls or questionnaires.
The Georgia Aquarium took a more direct approach to measuring the Internet’s effect on ticket sales, offering deep discounts off admis-sion prices to those who either followed it on Twitter or became Aquarium fans on MySpace or Facebook. Using a separate URL with which to track the promotion, the Aquarium found it reaped an additional $42,000 in ticket sales (or 2,500 admissions) during the four-month promotion. Though officials weren’t able to determine how many of those tickets were due to the discount and how many people would
A YouTube video called “Dancing Otters” provided indirect online marketing for the Georgia Aquarium.
© D
M G
OR
DO
N/S
HU
TTER
STO
CK
.CO
M
21782_08_ch08_p237-273.indd 25621782_08_ch08_p237-273.indd 256 30/09/10 10:38 PM30/09/10 10:38 PM
Copyright 2010 Cengage Learning. All Rights Reserved. May not be copied, scanned, or duplicated, in whole or in part. Due to electronic rights, some third party content may be suppressed from the eBook and/or eChapter(s).Editorial review has deemed that any suppressed content does not materially affect the overall learning experience. Cengage Learning reserves the right to remove additional content at any time if subsequent rights restrictions require it.

chapter 8 Marketing Research and Sales Forecasting 257
have come anyway, they are optimistic. “We had zero sales through social media last year,” said the Aquarium’s marketing vice president, “so it’s infinite growth.” Aquarium officials were even able to make an indirect online measure of the Aquarium’s appeal thanks to a YouTube video called “Dancing Otters,” shot and posted by an Aquarium visitor. It doesn’t mention the Georgia Aquarium’s name, but it drew nearly 1 million YouTube visitors. What the Aquarium staff would still like to be able to do is figure out how online videos and chat about the Aquarium translate into actual ticket sales. “I’ve been a big proponent of being able to measure and using measure-ments to drive decisions,” says the Aquarium’s vice president for information technology. “And we’re making progress.”28
At present, no industrywide standards define techniques for measuring Web use. Some sites ask users to register before accessing the pages; others merely keep track of the number of “hits,” or number of times a visitor accesses a page. Marketers have tried to place a value on a site’s “stickiness”— longer-lasting site visits—as a means of measuring effectiveness. Others use “cookies,” which, as Chapter 4 explained, are electronic identifiers deposited on viewers’ computers, to track click-through behavior—the paths users take as they move through the site. However, because some consumers change their Internet service providers frequently and special software is available to detect and remove them, cookies have lost some of their effectiveness.
online surveys are significantly less expensive than paper questionnaires and telephone interviews. They offer respondents anonymity, which helps most people speak
more freely, and the chance to answer questions at their own pace. They do require a bit of planning, however, to make sure that you get the results you want and don’t waste respondents’ time. Here are some tips for creating successful online surveys.
• Find out what you want to know. List items you want customers to tell you, and prioritize them. Then create and rank a list of your own questions about your business, its goals, or its products. Write a third list of recent customer complaints or suggestions. Compare the lists. Issues appearing on two or more lists are those you’ll want to ask about.
• Decide how to organize the results. This will help you determine whether to ask about category breakdowns like age, sex, income bracket, geographic location, and educational attainment.
• Determine how much eff ort you want to spend analyzing write-in comments, as opposed to easy-to-tabulate multiple-choice and yes/no responses.
• Recognize that people won’t spend a long time answering questions. Keep the survey and its instructions short and to the point.
• Word questions carefully. Avoid complex constructions like double negatives, keep questions neutral (don’t lead respondents to the answer), and weed out acronyms and abbreviations.
• Make sure the survey is professional looking, and have at least two people proofread it carefully.
• Test the survey on people in diff erent departments of your fi rm. You may get valuable insights from their diff erent points of view.
• Tabulate the test surveys to make sure there won’t be any technical glitches in the live survey.
• Edit once more to make sure each question will provide you with information that’s really useful to your business.
• Motivate your sample to respond by explaining the purpose of your survey and how the information you gather can benefi t them. Consider e-mail reminders, or even an incentive like a gift certifi cate or raffl e, to boost your response rate.
Sources: “Guidelines for Conducting an Online Survey,” Survey-Hosting.com, www.survey-hosting.com, accessed March 31, 2010; Sharon Long, “5 Survey Tips to Decrease Survey Abandonment and Non-Response,” Survey.Cvent.com, http://survey.cvent.com, February 4, 2010; “How to Conduct an Online Survey and Engage Customers in a Dialogue,” SurveyPro, www.surveyspro.com, accessed May 5, 2009; “How to Conduct an Online Customer Survey,” EHow, www.ehow.com, accessed May 5, 2009.
P lanning Effective Online Surveys
21782_08_ch08_p237-273.indd 25721782_08_ch08_p237-273.indd 257 30/09/10 10:38 PM30/09/10 10:38 PM
Copyright 2010 Cengage Learning. All Rights Reserved. May not be copied, scanned, or duplicated, in whole or in part. Due to electronic rights, some third party content may be suppressed from the eBook and/or eChapter(s).Editorial review has deemed that any suppressed content does not materially affect the overall learning experience. Cengage Learning reserves the right to remove additional content at any time if subsequent rights restrictions require it.

258 part 3 Target Market Selection
Research suggests that about 50 percent of marketing executives are unsure of the return they are getting for their online marketing efforts. Meanwhile some observers believe the traditional measure of ROI, or return on investment, must evolve into one or more other results that are easier for online marketers to actually measure, such as the sales success rate, the ability to build self-moderating cus-tomer service programs within social networks, or the creation of brand advocates, perhaps tracked with click-through sales or promotional codes. Others look to turn the often intangible effects of social media into new measures like user time spent interacting with others, degree of user involve-ment, and level of user attention.29
Certainly observing consumers online, where users spend more time than with any other medium including TV, offers marketers the opportunity to monitor the buying decision process, understand what turns a browser into a buyer, see how shoppers compare product features, and grasp the relative impacts on purchase decisions of marketing and price. Details like these help advertisers grow increasingly accurate about where they place their messages.
EXPERIMENTAL METHODThe third—and least-used—method for collecting primary data is the controlled experiment. A marketing research experiment is a scientific investigation in which a researcher controls or manip-ulates a test group (or groups) and compares the results with those of a control group that did not receive the experimental controls or manipulations.
The most common use of this method by marketers is test marketing, or introducing a new product in a specific area and then observing its degree of success. Up to this point, a product devel-opment team may have gathered feedback from focus groups. Other information may have come from shoppers’ evaluations of competing products. Test marketing is the first stage at which the prod-uct performs in a real-life environment.
The Coca-Cola Company and Procter & Gamble have used streaming ads in a section of MySpace to invite users to try free samples of new products or incentives. (The soft-drink giant offered a free music download.)30 Some firms omit test marketing and move directly from product development to full-scale production. These companies cite three problems with test marketing: 1. Test marketing is expensive. A firm can spend more than $1 million depending on the size of
the test market city and the cost of buying media to advertise the product. 2. Competitors quickly learn about the new product. By studying the test market, competitors can
develop alternative strategies. 3. Some products are not well suited to test marketing. Few firms test market long-lived, durable
goods such as cars because of the major financial investments required for their development, the need to establish networks of dealers to distribute the products, and requirements for parts and servicing.
Companies that decide to skip the test-marketing process can choose several other options. A firm may simulate a test-marketing campaign through computer-modeling software. By plugging in data on similar products, it can develop a sales projection for a new product. Another firm may offer an item in just one region of the United States or in another country, adjusting promotions and advertising based on local results before going to other geographic regions. Another option may be to limit a product’s introduction to only one retail chain to carefully control and evaluate promotions and results.
controlled experiment Scientific investigation in which a researcher manipulates a test group (or groups) and compares the results with those of a control group that did not receive the experimental controls or manipulations.
test marketing Marketing research technique that involves introducing a new product in a specific area and then measuring its degree of success.
assessment check1. What are the principal methods for collecting primary data?
2. Identify the different types of survey methods.
21782_08_ch08_p237-273.indd 25821782_08_ch08_p237-273.indd 258 30/09/10 10:38 PM30/09/10 10:38 PM
Copyright 2010 Cengage Learning. All Rights Reserved. May not be copied, scanned, or duplicated, in whole or in part. Due to electronic rights, some third party content may be suppressed from the eBook and/or eChapter(s).Editorial review has deemed that any suppressed content does not materially affect the overall learning experience. Cengage Learning reserves the right to remove additional content at any time if subsequent rights restrictions require it.

260 part 3 Target Market Selection
Interpretive ResearchAs mentioned earlier, interpretative research is a method that observes a customer or group of cus-tomers in their natural settings and then interprets their behavior based on an understanding of social and cultural characteristics of that setting.
Interpretative research has attracted considerable interest in recent years. Developed by social anthropologists as a method for explaining behavior that operates below the level of conscious thought, interpretative research can provide insights into consumer behavior and the ways in which consumers interact with brands.
Ethnographic StudiesIn interpretive research, the researcher first spends an extensive amount of time studying the culture, and for that reason, the studies often are called ethnographic studies. The word ethnographic means that a researcher takes a cultural perspective of the population being studied. For that reason, interpre-tative research often is used to interpret consumer behavior within a foreign culture where language, ideals, values, and expectations are subject to different cultural influences. After experiencing a num-ber of product failures in low-income markets in Latin America, Procter & Gamble (P&G) began an “immersion research” program called “Living It,” in which P&G managers and executives spent time with low-income families around the world living in their homes to develop a better understanding of their needs and desires. P&G’s subsequent sales suggest that the effort was worthwhile. Among the mistakes the firm corrected was a low sudsing detergent it introduced in Mexico, unaware that most of its customers there were manual laborers who associated suds with cleaning power.33
Interpretative research focuses on understanding the meaning of a product or the consump-tion experience in a consumer’s life. Its methods capture consumers interacting with products in their environment—in other words, capturing what they actually do, not what they say they do. Typically, subjects are filmed in specific situations, such as socializing with friends in a bar for research into beverage consumption, or for extended periods of time for paid participants. Paid participants may be followed by a videographer who records their day-to-day movements and inter-actions, or they may film themselves. Some companies even pay consumers to wear mini video cameras attached to visors and linked to a sound recorder. These systems record consumer behavior
while participants are shopping or doing chores.
An iPhone application devel-oped by Everyday Lives, a British research agency, allows ethno-graphic researchers to take pho-tos, notes, and audio and video clips of subjects while conducting their studies. Users can organize the material by theme and send it to their e-mail account to review it later. A BlackBerry version of the app is under development. “We expect word of mouth to play a hugely important part in promot-ing the app,” said Everyday Lives’ founder.34
assessment check1. How is interpretative research typically conducted?
2. When should ethnographic research be employed?
An iPhone application developed by Everyday Lives allows ethnographic researchers to take pho-tos, notes, and audio and video clips of subjects while conducting their studies.
© E
VER
YD
AY L
IVES
21782_08_ch08_p237-273.indd 26021782_08_ch08_p237-273.indd 260 30/09/10 10:38 PM30/09/10 10:38 PM
Copyright 2010 Cengage Learning. All Rights Reserved. May not be copied, scanned, or duplicated, in whole or in part. Due to electronic rights, some third party content may be suppressed from the eBook and/or eChapter(s).Editorial review has deemed that any suppressed content does not materially affect the overall learning experience. Cengage Learning reserves the right to remove additional content at any time if subsequent rights restrictions require it.
chapter 8 Marketing Research and Sales Forecasting 261
Computer Technology in Marketing ResearchThe ability to quickly gather and analyze business intelligence can create a substantial strate-gic advantage. Computer databases provide a wealth of data for marketing research, whether they are outside the company or designed specifically to gather important facts about its customers. Chapter 10 explores how companies use internal databases and customer relationship management technology. This section addresses important uses of computer technology related to marketing research: marketing information systems (MISs), marketing decision support systems (MDSSs), data mining, business intelligence, and competitive intelligence.
Marketing Information Systems (MISs)In the past, many marketing managers complained that their information problems resulted from too much rather than too little information. Reams of data were difficult to use and not always relevant. At times, information was almost impossible to find. Modern technological advances have made constraints like these obsolete.
A marketing information system (MIS) is a planned, computer-based system designed to pro-vide decision makers with a continuous flow of information relevant to their areas of responsibility. A component of the organization’s overall management information system, a marketing information system deals specifically with marketing data and issues.
A well-constructed MIS serves as a company’s nerve center, continually monitoring the market environment—both inside and outside the organization—and providing instantaneous information. Marketers can store data for later use, classify and analyze that data, and retrieve it easily when needed.
Marketing Decision Support Systems (MDSSs)A marketing decision support system (MDSS) consists of software that helps users quickly obtain and apply information in a way that supports marketing decisions. Taking MIS a step fur-ther, it allows managers to explore and connect such varying information as the state of the market, consumer behavior, sales forecasts, competitors’ actions, and environmental changes. MDSSs con-sist of four main characteristics: they are interactive, investigative, flexible, and accessible. An MDSS can create simulations or models to illustrate the likely results of changes in marketing strategies or market conditions.
While an MIS provides raw data, an MDSS develops this data into information useful for deci-sion making. For example, an MIS might provide a list of product sales from the previous day. A man-ager could use an MDSS to transform this raw data into graphs illustrating sales trends or reports estimating the impact of specific decisions, such as raising prices or expanding into new regions.
Data MiningData mining is the process of searching through computerized data files to detect patterns. It focuses on identifying relationships not obvious to marketers—in a sense, answering questions that market-ing researchers may not even have thought to ask. The data is stored in a huge database called a data warehouse. Software for the marketing decision support system often is associated with the data ware-house and is used to mine data. Once marketers identify patterns and connections, they use this intelligence to check the effectiveness of different strategy options.
Data mining is an efficient way to sort through huge amounts of data and to make sense of that data. It helps marketers create customer profiles, pinpoint reasons for customer loyalty or the lack thereof, analyze potential returns on changes in pricing or promotion, and forecast sales. Data mining offers considerable advantages in retailing, the hotel industry, banking, utilities, and many other areas and holds the promise of providing answers to many specific strategic questions.
San Diego research firm Strategic Vision conducted a data-mining study of car sales to link moti-vation to purchase. It found that all vehicle segments, including luxury buyers, were affected by a carmaker’s longstanding reputation for the reliability and durability of its vehicles, leading other
marketing information system (MIS) Planned, computer-based system designed to provide managers with a continuous flow of information relevant to their specific decisions and areas of responsibility.
marketing decision support system (MDSS) Marketing information system component that links a decision maker with relevant databases and analysis tools.
data mining Process of searching through customer databases to detect patterns that guide marketing decision making.
7 Outline the most impor-tant uses of computer technology in marketing research.
21782_08_ch08_p237-273.indd 26121782_08_ch08_p237-273.indd 261 30/09/10 10:38 PM30/09/10 10:38 PM
Copyright 2010 Cengage Learning. All Rights Reserved. May not be copied, scanned, or duplicated, in whole or in part. Due to electronic rights, some third party content may be suppressed from the eBook and/or eChapter(s).Editorial review has deemed that any suppressed content does not materially affect the overall learning experience. Cengage Learning reserves the right to remove additional content at any time if subsequent rights restrictions require it.
262 part 3 Target Market Selection
firms to work harder to catch up. “Durability alone and simply satisfying customers is not enough for buyers who demand both immediate and long-term value,” said Strategic Vision’s president.35
Business IntelligenceBusiness intelligence is the process of gathering information and analyzing it to improve business strategy, tactics, and daily operations. Using advanced software tools, marketers gather information from within and outside the organization. Business intelligence can thus tell the firm how its own sales operation is doing or what its top competitors are up to.
The key is not only gathering the information but also getting it into a form that employees can make sense of and use for decision making and strategizing. Software can help users collect, aggregate, and create reports with outside information available on the Web from such databases as, say, Dun & Bradstreet. SmartOrg, based in Menlo Park, California, is one firm that specializes in helping firms like Boeing and Hewlett-Packard identify and manage information. “SmartOrg systems and processes give us the ability to evaluate uncertainty and gives the project teams the freedom to drive towards the upside,” says Hewlett-Packard’s director of new business creation.36
Competitive IntelligenceCompetitive intelligence is a form of business intelligence that focuses on finding information about competitors using published sources, interviews, observations by salespeople and suppliers in the industry, government agencies, public filings such as patent applications, and other second-ary sources, including the Internet. Its aim is to uncover the specific advantages a competitor has, such as new-product launches, new features in existing goods or services, or new marketing or promotional strategies. Even a competitor’s advertising can provide clues. Marketers use competi-tive intelligence to make better decisions that strengthen their own competitive strategy in turn.
table 8.1 A Sampling of Sales Forecasting Software Programs
Forecast Pro• Input historical data and then the software analyzes the data, selects the appropriate forecasting technique, and makes its statistical calculations.• Adjust the information and save the new changes.• The software creates reports and graphs for presenting results.• There are three editions available: Forecast Pro Unlimited, Forecast Pro TRAC, and Forecast Pro XE.
Right90• Includes a four-step forecasting process: Capture, Vet, Analyze, Drive.• Integrates with existing company IT applications.• Available forecasting applications include: Right90 Sales Forecast Capture, Right90 Statistical Forecasting, Right90 Change Analytics, Right90 Trust
Analytics.
SAS• SAS/ETS Time Series Forecasting uses the following techniques: time series and econometric.• SAS Forecast Server creates several forecasts quickly to allow a company to plan their future.
assessment check1. Distinguish between an MIS and an MDSS.
2. What is data mining?
3. Describe the process of collecting business and competitive intelligence.
21782_08_ch08_p237-273.indd 26221782_08_ch08_p237-273.indd 262 30/09/10 10:38 PM30/09/10 10:38 PM
Copyright 2010 Cengage Learning. All Rights Reserved. May not be copied, scanned, or duplicated, in whole or in part. Due to electronic rights, some third party content may be suppressed from the eBook and/or eChapter(s).Editorial review has deemed that any suppressed content does not materially affect the overall learning experience. Cengage Learning reserves the right to remove additional content at any time if subsequent rights restrictions require it.