Thriving in the Mobile App Economy: Mobility Market Overview & Strategy

THE MARKET OVERVIEW AND STRATEGY DEVELOPMENT FOR SELECTED
COMPONENTS OF A MARKETING PLAN FOR A CELLULAR PROVIDER
BY
FRANK HAROLD JONES
Submitted in partial fulfillment of the requirements for the degree of
Magister in Business Administration
at the Port Elizabeth Technikon
PROMOTOR: Doctor J. M. Burger DATE: January 2005
brought to you by COREView metadata, citation and similar papers at core.ac.uk
provided by South East Academic Libraries System (SEALS)

DECLARATIONS
“I, Frank Harold Jones, hereby declare that:
- the work in this paper is my own original work;
- all sources used or referred to has been documented and recognised;
and
- this paper has not been previously submitted in full or partial fulfillment
of the requirements for an equivalent or higher qualifications at any
other recognised educational institution.”
________________ 17 January 2004
Frank Harold Jones Date

The successful completion of this study would have been impossible without the
support, advice, assistance and encouragement of others.
I would like to record my sincere thanks and appreciation to the following:
• To Jesus Christ, my Lord and Saviour, who gave me the opportunity and
ability to complete this study. Without His grace and mercy, this study
would have been fruitless
• ALL PRAISE AND HONOUR TO GOD
• To my wife, Lorraine, for her encouragement, sacrifice and patience.
Without her support and love, this study would not have been possible
• To my children, Rudi, Pearl and Kyle, thanks for all your support and
understanding
• Dr. John Burger for his coaching, encouragement, advisement and
motivation.

SUMMARY
The research problem addressed in this study was to develop a
marketing plan consisting of selected elements that would give a cellular
company like Vodacom a competitive advantage over competitors and to
capture a significant market share when marketing mobile data services
like 3G.
To achieve this object, a literature study to determine the key
components of a marketing plan was undertaken and a theoretical model
was selected to develop a marketing plan of selected components
In addition to the literature study, an empirical study was conducted to
identify core concepts critical to the development of a selected element
marketing plan to market 3G and re-launch mobile data services.
The results of the literature study were combined with the empirical study
and a marketing plan based on McDonald was developed. Michael
Porter’s five forces model was used as a reference to discuss the
competitor analysis, a marketing strategy was compiled with specific
referencing to the four P’s of marketing and marketing controls formed
the basis of this research.
This study concludes with recommendations applicable for the
implementation of the marketing plan and options for further research.

- i -
CONTENTS
Page TABLE OF CONTENTS ii
LIST OF FIGURES vi
LIST OF TABLES vii
LIST OF ANNEXURES vii

- ii -
TABLE OF CONTENTS
Page
CHAPTER ONE
INTRODUCTION, PROBLEM STATEMENT, DEFINITION OF KEY TERMS AND RESEARCH DESIGN
1.1 INTRODUCTION 1
1.2 MAIN PROBLEM 3
1.2.1 Sub-Problems 4
1.3 DELIMITATION 4
1.3.1 Demarcation of organisations to be researched 4
1.3.2 Geographic Demarcation. 4
1.4 DEFINITION OF KEY CONCEPTS. 5
1.4.1 Data Services 5
1.4.2 Marketing and Marketing Management 5
1.4.3 Planning 5
1.4.4 Marketing Planning 6
1.4.5 Marketing Plan 6
1.4.6 Competitive Advantage 7
1.4.7 Market Environment 7
1.4.8 First-Mover Advantage 8
1.4.9 Focus Groups 8
1.5 THE SIGNIFICANCE OF THE RESEARCH 9
1.6 SIGNIFICANT PRIOR RESEARCH 10
1.7 RESEARCH METHODOLOGY 11
1.7.1 Literature Survey 11
1.7.2 Empirical Study 11
1.7.3 The development of a marketing plan 12
1.8 KEY ASSUMPTIONS 12
1.9 LIST OF INTENDED CHAPTERS 12
1.10 SUMMARY 13
- iii -
CHAPTER TWO
THE COMPONENTS OF A MARKETING PLAN
2.1 INTRODUCTION 14
2.2 COMPARISON OF ELEMENTS OF A MARKETING PLAN 14
2.3 SITUATIONAL ANALYSIS 16
2.3.1 Environmental Analysis 16
2.3.2 SWOT Analysis 17
2.3.3 Competitor Analysis 20
2.4 MARKETING OBJECTIVES 24
2.4.1 Setting marketing objectives 25
2.5 MARKETING STRATEGIES 30
2.5.1 Types of strategy 30
2.5.2 Competitive Strategies 31
2.5.3 Marketing Mix 32
2.6. FINANCIALS 34
2.6.1 Projected sales income 34
2.6.2 Selling expenses budget 34
2.6.3 Marginal costing 35
2.6.4. Break-even analysis 35
2.6.5. Payback analysis 36
2.7. CONTROLS 37
2.7.1 The value of control 37
2.7.2 Implementation 38
2.8 RECOMMENDED MARKETING PLAN STRUCTURE 39
2.9. SUMMARY 41

- iv -
CHAPTER THREE
REVIEW OF GLOBAL MOBILE NETWORK OPERATORS
3.1 INTRODUCTION 42
3.2 VODAFONE 42
3.2.1 Marketing Strategies 44
3.2.2 Vodafone Live 45
3.3 T - MOBILE 48
3.3.1 Customer Relationship Management 48
3.3.2 Marketing Strategy 50
3.4 MMO2 50
3.4.1 Customer Relationship Marketing 51
3.4.2 Marketing Strategy 51
3.5 3 53
3.5.1 Marketing Strategy 55
3.6 ORANGE 57
3.6.1 Global Brand Strength 59
3.6.2 Marketing Strategy 61
3.7 NTT DOCOMO 61
3.7.1 Marketing Strategy 62
3.7.2 The i-mode value chain 63
3.8 SK TELECOM 65
3.8.1 Marketing Strategies 66
3.9 CONCLUSIONS 69
3.10 SUMMARY 70

- v -
CHAPTER FOUR
SELECTED ELEMENTS OF A PROPOSED MARKETING PLAN FOR VODACOM
4.1 INTRODUCTION 71
4.2 COMPETITOR ANALYSIS 71
4.2.1 Industry competitors 72
4.2.2 Threat of new entrants 76
4.2.3 Threat of Substitutes 86
4.2.4 Bargaining power of Buyers 90
4.2.5 Bargaining power of Sellers 90
4.3 SURVEYS 91
4.3.1 Focus Groups 91
4.3.2 Customer Survey 97
4.4 MARKETING STRATEGY 98
4.5 STRATEGY FORMULATION: MARKETING MIX 98
4.5.1 Product 98
4.5.2 Price 99
4.5.3 Promotion 100
4.5.4 Place 101
4.6 Controls 102
4.7 SUMMARY 103
CHAPTER FIVE
SUMMARY AND RECOMMENDATIONS
5.1 INTRODUCTION 104
5.2 SUMMARY 104
5.3 RECOMMENDATIONS 105
5.4 FURTHER RESEARCH 108
REFERENCE LIST: 109

- vi -
LIST OF FIGURES Figure 2. 1 The macro- and micro-environment for marketing 17
Figure 2. 2 The SWOT Analysis grid 18
Figure 2. 3 Five forces determining market/ segment attractiveness 21
Figure 2. 4 Barriers and profitability 22
Figure 2. 5 Product life-cycle curve 26
Figure 2. 6 The Boston Matrix 27
Figure 2. 7 Ansoff Matrix 29
Figure 2. 8 Marketing and the three C’s 31
Figure 2. 9: Break-even analysis 36
Figure 2. 10: The planning cycle 38
Figure 3. 1 Vodafone Subsidiary Companies - Proportionate customers and
percentage ownership 43
Figure 3. 2 Vodafone associate companies - Proportionate subscribers and
percentage ownership 43
Figure 3. 3 The Vodafone Mobile Connect Data Card 45
Figure 3. 4 Vodafone Live subscribers per country as at March 2004. 46
Figure 3. 5 Percentage Mobile Data Revenue generated in the UK per
operator : Q1 2003 to Q1 2004. 52
Figure 3. 6 First Microsoft Windows-powered telephone 58
Figure 3. 7 Microsoft Windows-powered SPV smartphone. 60
Figure 3. 8 I-mode Collaboration/Value Chain concept. 64
Figure 4. 1 iBurst laptop card 78
Figure 4. 2 Comparison of wireless Internet access technologies 87
Figure 4. 3 Do you personally feel that 3G applications can enhance your
business? 93
Figure 4. 4 What sort of work your company’s employees do whilst they are
away from their desk or out of the office? 93
Figure 4. 5 In what locations are your mobile company’s employees using
wireless (if any)? 94
Figure 4. 6 What are the problems that can arise (if any) when your mobile
company’s employees work away from their desk or are out of the
office? 94
- vii -
Figure 4. 7 If you had a 3G Mobile Data card, how and when would you use
your laptop, as opposed to your PDA/ handheld or other mobile
phone devie? 95
Figure 4. 8 What are the advantages / disadvantages /trade offs you have
between mobile devices? 95
Figure 4. 9 What are you particularly looking forward to about your company
using the 3G devices? 96
Figure 4. 10 What are your main concerns about using 3G devices? 96
Figure 4. 11 BlackBerry 6210 Wireless Handheld 99
LIST OF TABLES Table 2. 1 Comparison of marketing plan elements 15
Table 2. 2: Types of marketing control 39
Table 2. 3: The elements of a marketing plan 40
Table 3. 1 Orange UMTS licenses per country 58
Table 3. 2 The countries that the mobile companies operate in 68
Table 4. 1 Comparison of GPRS service 74
LIST OF ANNEXURES Annexure A Results of the first round of 3G Focus Groups 115

- 1 -
CHAPTER ONE
INTRODUCTION, PROBLEM STATEMENT, DEFINITION OF KEY TERMS AND RESEARCH DESIGN
1.1 INTRODUCTION
In the cellular technology field, Vodacom is competing with MTN and Cell
C in the South African market. The market share of Vodacom declined,
from 57 per cent in 2003 to 54 per cent in 2004 (Vodacom Group Annual
Results, 2004). Vodacom’s biggest competitor, MTN has 36 per cent and
Cell C have the remaining ten per cent of the market (MTN Group Annual
Results, 2004). The margins for cellular companies are diminishing. It is
reported that the South African average margin is 31 per cent compared
to the 37 per cent in Emerging Europe (Masango, 2003.). The average
revenue per user (ARPU) for Vodacom is R177.00 (Vodacom Group
Annual Results, 2004) and MTN is at R203.00 per month (MTN Group
Annual Results: 2004).
MTN launched two types of data services ahead of Vodacom, High
Speed Circuit Switched Data (HSCSD) in October 2000 and General
Packet Radio Service (GPRS) in July 2002. They acquired 30 000 active
GPRS customers by March 2003 (Finnie, Lewis, Lonergan,
Mendler&Northfield, 2003:130). Vodacom launched GPRS services in
October 2002, three months after MTN using the “My Life” brand.
Subscribers received internet access, photo messaging and text
messages of unlimited length base on a tiered subscription model. In
March 2003 Vodacom had 7 756 active GPRS subscribers (Finnie et al,
2003:146). Vodacom’s chief operating officer, Pieter Uys, promised to
have Third Generation (3G), the latest type of data service, by December
2004 (Business Day, 13 September 2004). MTN responded to this
announcement by saying it will conduct continued trials with its
customers to understand the relevance of 3G services before it can
launch commercial services (South African Wireless Communications,
July/August 2004:12). This sequence of events will give Vodacom a first-
mover advantage over its competitors.

- 2 -
Data services have been identified as the one area where big potential
growth can occur. The revenue from data services is currently R1 billion
or 4.4 per cent of total revenue. This income is mainly due to short
message service (SMS) traffic (Vodacom Group Annual Results, 2004).
MTN achieved five per cent for the same period, namely R67 million.
This income is derived from 96 per cent SMS services (MTN Group
Annual Results: 2004). Mobile data services constitute up 12 to 14 per
cent of mobile network revenue in Europe and 20 per cent in Japan. The
local operators want to drive it up to 20 per cent over five years (Alberts
and Ashford, 2003).
The competitors in the digital cellular market try to retain or increase
market shares by reducing prices, developing new products and bundling
different services (The Journal of Policy, Regulation and Strategy for
Telecommunications information and media: 2000,70).
Today's business must survive in a turbulent environment. In today's
rapidly changing business world, past results are no guarantees of future
successes. The large shakedown of companies which took place in the
recession of the late 1970’s and early 1980’s, has left the remaining
companies, for the most part, leaner, fitter and more aggressive. Add to
this the pace of developments in new technology, the growth in the
number of business start-ups and the threat of foreign competition. A
situation exist where companies can no longer be inward looking, but
must be aware of their external macro environment situation to survive
and grow (McKeran, 1990: 77)
Handy (1997: 24) believes that a proactive approach is needed when he
mentions that: “the way you make sense of the future, in organisations
and in societies … is by taking charge of the future and not by
responding to it”.
Prahalad (1997: 67) states that “it’s not enough to imagine the future -
you also have to build it. You need a blue print for building future
businesses. … It tells you what you should be doing now, which new

- 3 -
competencies you should be building, what new customer groups you
should be trying to understand, which new distribution channels you
should be exploring, in order to create a winning position for yourself in a
new opportunity arena”.
When a business fails, often a marketing plan or lack thereof is to blame.
This is because without a marketing plan, the management of a company
can end up struggling to focus on the market that is best suited for their
products. Consequently they develop a hazy definition of the competition
and are uncertain of how the customers should be pursued (Winchester
& Manning, 1997: 72). Management will have no concrete measurement
for the success or failure of their goals. Royal (1995: 120) maintains that
the majority of companies will write a sales or advertising plan and
believe they do not need a marketing plan. Without a written marketing
plan such essential elements as distribution, advertising and strategies to
achieve a competitive advantage may be overlooked.
Pophal (2000: 22) holds that attempting to sell a product or service
without a plan is like planning a vacation without a map. A person may
eventually get where he/she wants to go, but it would take longer and
cost more than it should.
It is believed that it costs five times as much to attract a new customer as
it does to retain an existing one (Furlong, 1993:2).
Given the above scenario, Vodacom needs to capitalise on their existing
customers. Vodacom have decided to use their position of dominance
and will launch new data services to increase their operating profit. The
main problem will now be discussed.
1.2 MAIN PROBLEM
When the information in the introductory preamble is distilled a clear
problem arises, which is the focus of this research.

- 4 -
The main problem statement is thus: What is the role of a market overview in gaining a competitive advantage and developing an effective marketing strategy, as parts of a marketing plan, for a cellular company such as Vodacom when selling data services?
1.2.1 Sub-Problems
• What will the literature reveal relating to the components of a market
overview and selected elements of a marketing plan?
• What are the current environmental conditions for data services in South
Africa?
• What caveats can be obtained from global companies to increase data
service usage?
• How can the results obtained from the resolution of sub problems 1.2.1
above be used to compile an effective marketing plan focussed on the
following elements, market overview, strategy development and
marketing mix?
1.3 DELIMITATION
Delimiting the research serves the purpose of making the research topic
manageable. Although this research will be limited to Vodacom’s South
African marketing of data services, it does not imply that research on the
same topic in other Vodacom operating companies is not needed. Only a
marketing plan with selected elements for data services will be
developed.
1.3.1 Demarcation of organisations to be researched
The scope of this research is limited to Vodacom (Pty) Ltd operating in
South Africa.
1.3.2 Geographic Demarcation.
No geographic demarcation was used.

- 5 -
1.4 DEFINITION OF KEY CONCEPTS.
Before entering into the body of research, key concepts need to be
defined.
1.4.1 Data Services
This is the ability to access services such as email, faxes and SMS
messages using the wireless phone or communicator (www.telecoms-
world.co.uk/jargon.shtml).
1.4.2 Marketing and Marketing Management
Christopher, Payne and Ballentyne (1991:7) describe marketing as a
process of perceiving and understanding the needs of selected target
markets. These needs are stimulated and satisfied by directing the
resources of the organisation in a way that meets these needs. Kotler
(2000:3) describes marketing management as the task of creating,
promoting and delivering goods and services to consumers and
businesses. Marketing managers are responsible for demand
management. It is their task to influence the level, timing and
composition of demand, to achieve the objectives of the organisation.
1.4.3 Planning
The scope of the research is limited to selected components of a
marketing plan only and excludes all other forms of corporate planning.
Corporate planning embodies in the summation of all planning that takes
place in an organisation. This includes strategic planning, which is
concerned with the total organisation planning over the long term and
operational planning, which is concerned with each of the business
functions separately over a shorter period of time. The marketing plan
represents a subsection of operational planning (Greenley, 1987: 84).

- 6 -
1.4.4 Marketing Planning
Marketing planning involves designing activities relating to marketing
objectives and the changing marketing environment. Marketing planning
is the basis for all marketing strategies and decisions. Issues such as
product lines, distribution channels, marketing communications, and
pricing are all delineated in the marketing plan (Lamb, Hair & McDaniel,
1998: 24).
Marketing planning is a logical sequence of activities leading to the
setting of marketing objectives and the formulation of plans for achieving
them. Conceptually the process is simple, calling for a situation review,
the formulation of some basic assumptions, setting objectives for what is
being sold and to who, deciding on how the objectives are to be
achieved, and scheduling and costing out the actions necessary for
implementation (McDonald & Tideman, 1993: 12).
1.4.5 Marketing Plan
The research conducted in this project will result in the formulation of
selected elements of a marketing plan for a mobile cellular company.
This will assist Vodacom in penetrating the existing data service market
and enable them to enhance competitiveness and subsequently gain a
significant market share. Set out below is a summation of the term
“marketing plan”, as defined in the literature.
McDonald & Tideman (1993: 261) refer to a marketing plan as a
business proposition containing proposed courses of action, which in turn
have resource implications. A marketing plan is the outcome of the
marketing planning process and helps to make things happen. Lamb et
al (1998: 25) feel that a market plan should allow the management of a
company to examine the marketing environment in conjunction with the
inner workings of the business. Once a marketing plan is finalised, it
serves as a reference point for the success of future activities.
Winchester et al (1997: 72) state that a marketing plan is an all-purpose
document that outlines everything a company needs to know about its

- 7 -
business. It defines how and why the company is in business, what
markets are good targets for its products, and how customers should be
pursued. It is an indication that shows management when they have
succeeded, when they have fallen short of their goals, and when it is time
to redefine a direction to take advantage of new markets or fight against
dogged competitors. According to Royal (1995: 120), a marketing plan
should accomplish three tasks:
• It must establish the marketing issues that will determine a company’s
long-term success
• It must focus the company’s management team on those goals
• It must track the company's success in finding customers.
1.4.6 Competitive Advantage
Kotler and Armstrong (1996: 256) define competitive advantage as an
advantage over competitors, gained by offering consumers greater value,
either through lower prices or by providing more benefits that justify
higher prices. Porter (1990: 19) adds that competitive advantage is
created and sustained through differences in structures, values, culture,
institutions, and histories that have significant impact on competitive
success.
1.4.7 Market Environment
The market environment consists of external variables such as
economics, technology, politics, legislation, demographics and the social
aspect. An understanding of environmental dynamics is a requisite to
sound market planning. Correct identification and analysis of the relevant
factors in the external environment will lead to a correct assessment of
the marketing opportunities in a marketing plan (Kelley, 1972: 38).
Johnson and Scholes (2002: 102) refer to such an analysis as a
“PESTEL” analysis, referring to the political, economic, social-cultural,
technological, environmental and legal influences on the organisation.
This analysis can be used as a guideline by management to identifying
the different influences of each external variable.

- 8 -
1.4.8 First-Mover Advantage
Hill (2003:157) describes first-mover advantage as the economic and
strategic advantages that accrue to early entrants into an industry. Hill
goes on to describe three first-mover advantages (Hill, 2003:476).
• The ability to pre-empt rivals and capture demand
• The ability to build sales volume in that country and ride down the
experience curve ahead of its rivals. This gives the early entrant a
cost advantage
• The ability to create switching costs that tie customers into their
product or services.
1.4.9 Focus Groups
Focus groups provide qualitative data and are extremely valuable when
vivid and rich descriptions are needed. Focus groups are a popular way
to learn about opinions and attitudes. Focus groups are not polls but in-
depth, qualitative interviews with a small number of carefully selected
people brought together to discuss a host of topics ranging from pizza to
safe sex. Unlike the one-way flow of information in a one-on-one
interview, focus groups generate data through the give and take of group
discussion. Listening as people share and compare their different points
of view provides a wealth of information, not just about what they think,
but why they think the way they do. The composition of a focus group is
usually based on the homogeneity or similarity of the group members.
Bringing people with common interests or experiences together makes it
easier for them to carry on a productive discussion. Often a research
project will use different groups to get differing views. Demographic
characteristics are another way to determine focus group composition:
While surveys provide quantitative information, focus groups can provide
qualitative data that penetrates more deeply. Focus groups are
conducted by trained moderators, who are skilled in maintaining good
group dynamics and the given topic. The moderator’s basic job is to keep
the group focused and by asking open-ended questions. The ideal size
of a focus group is between six and 12 people. Participation in a focus

- 9 -
group is voluntary and confidential. Capturing of data by focus groups is
by video recording, audio recording, manual notetaking or a combination
of the three capturing methods (American Statistical Association online at
www.amstat.org/sections/srms/brochures/focusgroups.pdf accessed 3 -
01 2004).
Focus groups are further defined as:
A number of respondents gathered to generate ideas through the
discussion of and reaction to specific stimuli. Under the steerage of a
moderator, focus groups are often used in exploratory work or when the
subject matter involves social activities, habits and status.
(www.globalreps.com/research/glossary.html online accessed 3-01-
2004).
A qualitative market research technique where eight to 12 market
participants are gathered in one room for a discussion under the
leadership of a trained moderator. Discussion focuses on a consumer
problem, product or potential solution to a problem. The results of these
discussions are not projectable to the general market.
(www.shapetomorrow.com/resources/f.html online accessed 3-01-2004).
1.5 THE SIGNIFICANCE OF THE RESEARCH
Vodacom has 54 per cent of all cellular users in South Africa, which is
the biggest market share. Vodacom need to target their post-paid
customers to use data services. This target market is what can increase
the data services revenue to the required 20 per cent over five years.
The increase usage of data services to 20 per cent is one of the strategic
targets for the next five years.
Some of the data services network is already available and others will be
introduced into Vodacom’s network, starting with a test phase in
December 2004 (Business Day: 13 September 2004). This service is
always available and it will not deteriorate the quality of Vodacom’s voice

- 10 -
traffic service. Vodacom must advertise and market its data services and
develop a marketing plan to bring this to fruition. This investigation will
evaluate the marketing of other global networks of data services. The
results will be presented to management and to the director of
operations.
By means of a literature study and empirical data, this research will
attempt to discover applications that could contribute to finding solutions
to the problems discussed above.
1.6 SIGNIFICANT PRIOR RESEARCH
With voice calls, Mobile Network Operators (MNO’s) have previously
relied on two methods to segment the market - airtime tariffs and
technology. However, with wireless data, the need to look at the issue
from a wider perspective is crucial. Three key elements are vital in
marketing data services: segmentation, bundling of services and targeted
service delivery. Various methods of segmenting the mobile market
already exist and operators have spent large sums of money compiling
detailed analysis of the youth, adult and business user market sectors.
Bundling is a concept that operators are beginning to take a firmer
handle on while mobile subscribers can now enjoy a broad range of
airtime and SMS packages, tailored to suit their individual needs. The
mobile network, Orange's 'Your Plan' is a good example of this kind of
tailored tariffing and Vodafone has taken small but demonstrable steps in
the right direction with Vodafone 'Live' (Hooper: 2003).
In various presentations to the GSM Association’s GPRS workshop in
Cannes France 2001, John Hoffman, Senior Director Technology
Evolution GSM Association, addressed the findings of GPRS workshops,
that there should be different views of positioning, pricing, market
segmentation and applications. Hoffman added that technology should
not be marketed rather the services associated with it.

- 11 -
In synopsis, the role of marketing can be described in the words of
McDaniel (1998) as: “Effective marketing should not be limited to a
marketing department. Everyone in the organisation, whether they are
selling toothpaste or building highways, must realise that they are
involved in marketing.”
1.7 RESEARCH METHODOLOGY
The methodology used in this study consists of a literature survey, an
empirical investigation and a development of selected elements of a
marketing plan.
1.7.1 Literature Survey
A study of the marketing literature in general and specifically information
dealing with positioning, pricing, market segmentation and marketing
strategies will be embarked upon. This will assist the researcher in
understanding the concept of marketing data services, its key principles
and its importance. This literature investigation will enable the researcher
to isolate the options available that can be applied to Vodacom.
The literature study will also assist the researcher to identifying factors
that could contribute or impede the interaction between Vodacom and its
data services customers. The literature study will enhance the
comparison between Vodacom’s marketing strategies and future
activities and will help in exploring many different options that can be
followed. The literature study will further assist the researcher in
designing a suitable research methodology for use in the empirical study.
1.7.2 Empirical Study
The empirical study will consist of the following elements:
An investigation will be carried out to identify the key issues critical to the
development of a marketing plan for mobile data services in Vodacom.
The methodology used, based on the key components gained from the
literature study, will consist of an in-depth scan of the macro-environment

- 12 -
and a thorough investigation of the target industry, utilising the Internet,
the World Wide Web, print media and personal interviews.
1.7.3 The development of a marketing plan
The results of the literature study will be combined with the results of the
empirical study to develop selective components of a marketing plan for
Vodacom data services.
1.8 KEY ASSUMPTIONS
According to Leedy and Ormrod (2001: 62), assumptions are so basic,
that without them the problem itself could not exist. For the purpose of
this study, it is assumed that the American and British literature used is
applicable to the South African context. Vodacom will not change its
strategic objective to increase operating profit using data services. The
subscribers that will subscribe to and use the various types of services,
need to be educated in terms of data service usage.
1.9 LIST OF INTENDED CHAPTERS
The study will be divided into the following chapters:
Chapter 1: Introduction and planning of the study: This chapter
introduces the study, and identifies the main problems, sub-
problems and key concepts. The area that will be
researched is delimited, the importance of the research
highlighted as well as outlining the structure of the research
methodology.
Chapter 2: The identification of the components of a marketing plan: In
this chapter a literature review of market planning and the
development of a theoretical marketing plan will be
developed.
Chapter 3: The marketing plan of a successful network operator: A
review of other network operator strategies will be

- 13 -
conducted to determine the requirements for a successful
marketing plan.
Chapter 4: Recommended selected elements of a marketing plan: The
aim of this chapter will be to present the selected elements
of a marketing plan using the theoretical foundations and
the findings of the empirical review of marketing plans of
other networks.
Chapter 5: Conclusions and recommendations: This final chapter
provides conclusions and recommendations to the
questions posed by the main and sub problems through the
integration of the theoretical and empirical aspects of the
study. Recommendations for further research will also be
presented.
1.10 SUMMARY
The dynamic and competitive business environment cannot be ignored.
Quick market response and adaptability to the environment will
differentiate winners from the losers. This chapter has emphasised that
failure to respond and adapt to market conditions is often because of a
lack of a marketing plan. The marketing plan is one of the most important
outputs of the marketing process and is essential for success (Kotler,
2000:88). Vodacom are presented the opportunity to develop the market
in terms of data services without being exposed to the accompanying
competitor pressure. Vodacom can now launch a host of innovative new
services to neutralise the current and new entrants into the mobile
cellular world. To succeed under these conditions, an effective marketing
plan is required. The theoretical elements of a marketing plan will be
covered in the next chapter.

- 14 -
CHAPTER TWO
THE COMPONENTS OF A MARKETING PLAN
2.1 INTRODUCTION
In this chapter, the components of a marketing plan will be identified and
described. The aim is to extract selected marketing plan elements
recommended by a variety of authors and use them as a theoretical base
to create a marketing plan with those elements for mobile data services.
This process will commence with a comparison of components of
marketing plans by leading authors, from where the commonest
elements will be highlighted and described.
2.2 COMPARISON OF ELEMENTS OF A MARKETING PLAN
Table 2.1 shows a comparison of various author’s views of the elements
a marketing plan should consist of. From the table the following can be
deduced as being paramount components of a marketing plan.
• A situational analysis
• Marketing goals and objectives
• A marketing strategy
• Financial budgets and plans
• Marketing controls.

- 15 -
Table 2. 1 Comparison of marketing plan elements Author Executive
summary
Situational
analysis
Marketing
overview
SWOT
analysis
Marketing
objectives
Marketing
strategy
Forecasts
and
budgets
Implement
and
controls
McDonald,
2002:56 ! ! ! ! ! ! !
Westwood,
1996:198 ! ! ! ! ! ! ! !
Hatton,
2000:34-46
! ! ! ! ! !
Wood,
2003:7
! ! ! ! ! !
Kotler,
2000:89 ! ! ! ! ! ! ! !
Gerson,
1991:42 ! ! ! ! ! !

- 16 -
The listed components of the marketing plan will now be described in
detail.
2.3 SITUATIONAL ANALYSIS 2.3.1 Environmental Analysis
To develop an effective marketing plan, key factors in the macro- and
micro-environment need to be monitored and kept abreast with. The
macro-environment is defined as uncontrollable elements outside the
organisation that can potentially influence its ability to reach set goals
and objectives. Key factors are (Wood, 2003:21):
• Demographic
• Economic
• Ecological
• Technological
• Political-legal
• Social-cultural forces.
Wood (2003:21) describes the micro-environment as specific groups that
have a direct effect on the organisation’s ability to reach its objectives
and goals. Specific groups are:
• Customers
• Competitors
• Channel members
• Partners
• Suppliers and
• Employees.
Figure 2.1 depicts the macro- and micro-environment described above.
By using environment scanning and analysis, marketers collect data
about these aspects of the environment. The findings are then analysed
to determine the company’s strengths, weaknesses, opportunities and
threats(Wood, 2003:21).
• Strengths and weaknesses are internal capabilities to help or
prevent the firm from achieving its goals and objectives.

- 17 -
• Opportunities and threats are external circumstances that the firm can
exploit for higher performance or which could potentially hurt the firm.
Figure 2. 1 The macro- and micro-environment for marketing
Source: Wood, 2003:21
McDonald (2002:42) refers to the situational analysis as a marketing
audit. He maintains that its purpose should be to answer three questions.
1. Where is the company now?
2. Where does the company want to go?
3. How should the company organise its resources to get there?
This marketing audit consists of two variables. The first variable is the
external audit, which focuses on uncontrollable variables. The other
variable is the internal audit and is concerned with the controllable
variables (McDonald, 2002:43).
2.3.2 SWOT Analysis
This is the most common implemented analysis and consists of the
strength, weakness, opportunity and threat (SWOT) analysis. The SWOT

- 18 -
analysis is used to match the internal strengths and weaknesses with the
market opportunities. The understanding and use of the SWOT analysis
is extensive. Marketers can use it without formal training or extensive
databases. Anyone with a modicum of company and marketing
knowledge can develop a simple SWOT. Because conducting a SWOT
analysis is relatively simple, hurried and relatively meaningless analysis
can result. The analysis could then contain vague and ambiguous issues
like product performance, modern facilities and prices. Users may also
overlook being objective and rely on outdated and unreliable information
(Dibb & Simkin ,1996:48). Figure 2.2 illustrates the SWOT grid.
Figure 2. 2 The SWOT Analysis grid Strengths
Weaknesses
Internal issues which are directly relevant to the customers under consideration.
These issues must be narrow in focus
Opportunities
Threats
External issues relating to a range of environment areas such as
Legal, political, regulatory, societal, economic, technological and economic.
Actions
• Rank (list) points in order of importance.
• Only rank key points/issues.
• Have evidence to support these points.
• Strengths and weaknesses should be relative to main competitors.
• Strengths and weaknesses are internal issues.
• Opportunities and threats are external, marketing environment issues.
What are the core implications from these issues?
Source: Based on Dibb and Simkin, 1996

- 19 -
Wood (2003:29) provides a checklist to make sure the areas of focus
within the external environment are covered. Each set of questions must
fulfill the answer to how the trends will affect the organisation and its
market plans.
a. Demographic trends
• What is the size and the changes of the consumer population in
the selected markets?
• What is the composition of the consumer population in terms of
age, gender, ethnic and religious makeup, education, occupation,
household size, and income?
• What changes in specific consumer characteristics are directly
related to product purchase or use?
• What is the size and change in the number of businesses, the
number of locations, the number of employees, sales volume, and
the capacity for the selected business markets?
• What are the trends in new business formation for the targeted
industry or market?
• Which cities and geographic areas host the most new start-ups?
b. Economic Trends
• What is the state and direction of the local, regional, national, and
global economy?
• What are the current and expected trends in the target market's
buying power, as evidenced by income, debt, credit usage, and
other indicators?
c. Ecological Trends
• What are the trends in the availability of raw materials and
energy?
• How do pollution problems affect the organisation?

- 20 -
• What is the effect of environmental issues that attract government
regulation or influence social attitudes?
d. Technological Trends
• How are innovations affecting customers, suppliers, distributors,
marketing, and processes?
• How are technologies affected by or affecting standards and
regulations?
• How much is being invested in research and development by the
industry and by competitors?
e. Political-legal Trends
• What legal and regulatory mandates (or proposals) apply to the
company's business and marketing practices?
• What do political developments signal for changes in legal and
regulatory priorities?
f. Social-cultural Trends
• What is the makeup of specific geographic markets in terms of
nationality, religion, language, and other details?
• What is the effect of popular culture?
• What is the effect of core beliefs and values?
2.3.3 Competitor Analysis
In the micro-environment, one of the key groups the researcher wants to
examine is the role competition plays and how companies position
themselves relative to competitors.

- 21 -
Michael Porter identified five forces that determine the essential profit
attractiveness of a market. These are industry competitors, potential
entrants, substitutes, buyers, and suppliers. Porter’s model is shown in
Figure 2.3 (Kotler, 2000:218).
Figure 2. 3 Five forces determining market/ segment attractiveness
Source: Kotler, 2000:218.
Kotler (2000:218-219) lists the threats these forces pose as follows:
a. Threat of intense segment rivalry
A market is unattractive if it already contains numerous strong, or
aggressive competitors. It is even more unattractive if the market is
stable or declining, if plant capacity additions are done in large
increments, if fixed costs are high, if exit barriers are high, or if
competitors have high stakes in staying in the market. These conditions
will lead to frequent price wars, advertising battles, new-product
introductions and will make it expensive to compete.

- 22 -
b. Threat of new entrants
A market's attractiveness varies with the height of its entry and exit
barriers. The most attractive market is one in which entry barriers are
high and exit barriers are low (Figure 2.4). Few new firms can enter the
industry, and poor-performing firms can easily exit. When both entry and
exit barriers are high, profit potential is high, but firms face more risk
because poorer-performing firms stay in and fight it out. When entry and
exit barriers are both low, firms easily enter and leave the industry, and
the returns are stable and low. The worst case is when entry barriers are
low and exit barriers are high: Here firms enter during good times but find
it hard to leave during bad times. The result is chronic overcapacity and
depressed earnings for firms.
Figure 2. 4 Barriers and profitability
Source:Kotler, 2000:219
c. Threat of substitute products:
A market is unattractive when there are actual or potential substitutes for
the product. Substitutes place a limit on prices and on the profits that a
market can earn. The company has to monitor the price trends in the
substitutes closely. If technology advances or competition increases in
these substitute industries, prices and profits in the segment are likely to
fall.

- 23 -
d. Threat of buyers' growing bargaining power:
A segment is unattractive if the buyers possess strong or growing
bargaining power. Buyers will try to force prices down, demand more
quality or services, and set competitors against each other, all at the
expense of seller profitability. The bargaining power of buyers grows
when they become more concentrated or organised, when the product
represents a significant fraction of the buyers' costs, when the product is
undifferentiated, when the buyers' switching costs are low, when buyers
are price sensitive because of low profits, or when buyers can integrate
upstream. To protect themselves, sellers might select buyers who have
the least power to negotiate or switch suppliers. A better defence
consists of developing superior offers that strong buyers cannot refuse.
e. Threat of suppliers' growing bargaining power:
A segment is unattractive if the company's suppliers are able to raise
prices or reduce the quantity supplied. Suppliers tend to be powerful
when they are concentrated or organised, when there are few
substitutes, when the supplied product is an important input, when the
costs of switching suppliers are high, and when the suppliers can
integrate downstream. The best defences are to build win-win relations
with suppliers or use multiple supply sources.
Wood (2003:29) also provides a checklist to make sure the competitive
analysis as a component of the marketing plan is carried out completely.
• Who are current and possible future competitors?
• What are the trends in market share among competitors?
• What are the barriers to entry and exit in the industry?
• What are each rival's unique competitive advantages, and are
they sustainable?
• What are the strengths, weaknesses, opportunities, and threats of
each rival?
• How are pressures such as the balance of power between
suppliers and buyers affecting competition within the industry?
- 24 -
• Do competitors have the resources to exploit opportunities and
strengths?
• What substitutes or new products are likely to affect the
competitive situation?
• How have competitors mounted challenges in the past-and with
what results?
• What other competitive issues are critical in your industry or markets?
2.4 MARKETING OBJECTIVES
McDonald (2002:539) guides the marketer into understanding that
marketing objectives are about products and markets only. This relates
to which products need to be sold to which markets. The means to
achieve these objectives, using price, product, promotion and
distribution, are marketing strategies (Westwood, 1996:98). Marketing
objectives flow from the SWOT analysis and should be compatible with
the key issues identified in that analysis. Objectives need to be
articulated, recorded, be quantifiable and measurable. They serve as the
benchmarks against which marketing performance and commitment is
gauged (McDonald, 2002:540).
Hutton (2000:136) argues that the objectives should be specific,
measurable, achievable, relevant and timed (SMART). Hutton goes on to
say that the objectives should be ambitious in situations where
competition is limited, in growing markets, when growth is through
acquisition, in buoyant economic conditions or when resources are
available for expansion. On the other hand it should be conservative in
mature markets, when facing increasing competition, when growth is
evolutionary, in depressed economic conditions or when resources are
limited.

- 25 -
2.4.1 Setting marketing objectives
a. Product life-cycle.
Authors differ in their approach to setting the marketing objectives.
Westwood (1996:100), argues that because objectives are about
products and markets it is important to understand the company’s
present position with regard to products and markets before setting the
objectives of the marketing plan. Westwood suggests further analysis of
the products in the firm’s portfolio. The growth and decline of all products
follows a life-cycle curve that is presented in figure 2.5.
Kotler (2000:303), assert four things concerning product life cycles, they
are:
1. Products have a limited life.
2. Product sales passes through different stages, each posing different
challenges, opportunities and problems to the seller.
3. Profits rise and fall at different stages of the product life-cycle.
4. Products require different marketing, financial, manufacturing,
purchasing, and human resource strategies in each stage of their life-
cycle.

- 26 -
Figure 2. 5 Product life-cycle curve
Source: Westwood, 1996:101
Westwood maintains that at different stages in a product’s life-cycle the
company should adjust its advertising, pricing and distribution strategies
accordingly. At introduction growth is slow. Here advertising should be
focused on product awareness. When it reaches establishment status,
repeat buying occurs and sales increase. A period of rapid growth then
takes place. Competitors enter the market and their sales promotion
increases market awareness of the product and this expands the market
further. At this stage, the advertising focus should shift to product
advantages over the competitors. When the product reaches its
maximum potential, sales start to slow down. The product’s life can be
extended by introducing improved versions of the product, expanding the
range or by developing new markets for the product. The next stage is
the mature stage where the product sale starts to plateau. When more
competitors enter the market, the market is no longer growing and sales
reach its saturation stage. Sales of the product will start to decline and
the rate will depend on the product superiority between the company and
the competitor’s. Ultimately the product will be superceded by a new
product and will be dropped. Companies should have a portfolio of

- 27 -
products, each at its individual life-cycle. This minimises the risk factor
and provides a balanced growth. This product portfolio should be
reviewed at regular intervals (Westwood, 1996:101-102).
b. Boston Matrix
Another method to consider a company’s product portfolio is by means of
cash flow. A company’s ability to generate cash will be dependant on the
degree of market dominance over its competitors. The Boston Consulting
Group developed a matrix for classifying a portfolio of products according
to their cash absorption or cash generation on relative market shares and
relative market growth rates. Products are described as Stars, Cash
Cows, Question Marks and Dogs. This matrix is shown in Figure 2.6 and
shows an ideal product development sequence.
Figure 2. 6 The Boston Matrix
Source: Westwood, 1996:105
Question Marks are newly launched products or products declining that
need to be evaluated as to their long-term viability. Dogs have low
market share and are unprofitable. They should be dropped. Stars have
Market growth rate
Relative market sharehigh low
low
high STARS
QUESTION MARKS
DOGS CASH COWS
drop

- 28 -
a high cost but contribute considerable to profits. Cash Cows are mature
products with a high market share but low market growth. They generate
high profits and require small amounts of spending to maintain their level
of profitability (Westwood, 1996:105).
c. The Ansoff Matrix
McDonald (2002:260) explains that the logical approach to setting
marketing objectives is to proceed from the broad to the specific.
McDonald suggests three steps and starts of by the mission statement
from where the broad company objectives would flow. This is then
translated into key result areas, which are those areas where success is
vital to the company. Thereafter the creation of the sub-objectives
necessary to accomplish the broad objectives are needed. Examples are
product sales volume goals, geographical expansion and product line
extension. McDonald states that the Ansoff Matrix should be used for
setting marketing objectives. A firm’s competitive situation should be
reflected in its marketing objectives, in that they both cover two similar
dimensions, namely products and markets. Ansoff’s framework is about
what is sold(product) and who it is sold to (market). This framework
identifies four possible courses of action for the company (McDonald,
2003:262).
• Selling existing products to existing markets
• Extending existing products to new markets
• Developing new products for existing markets
• Developing new products for new markets.
The matrix in Figure 2.7 depicts these concepts.
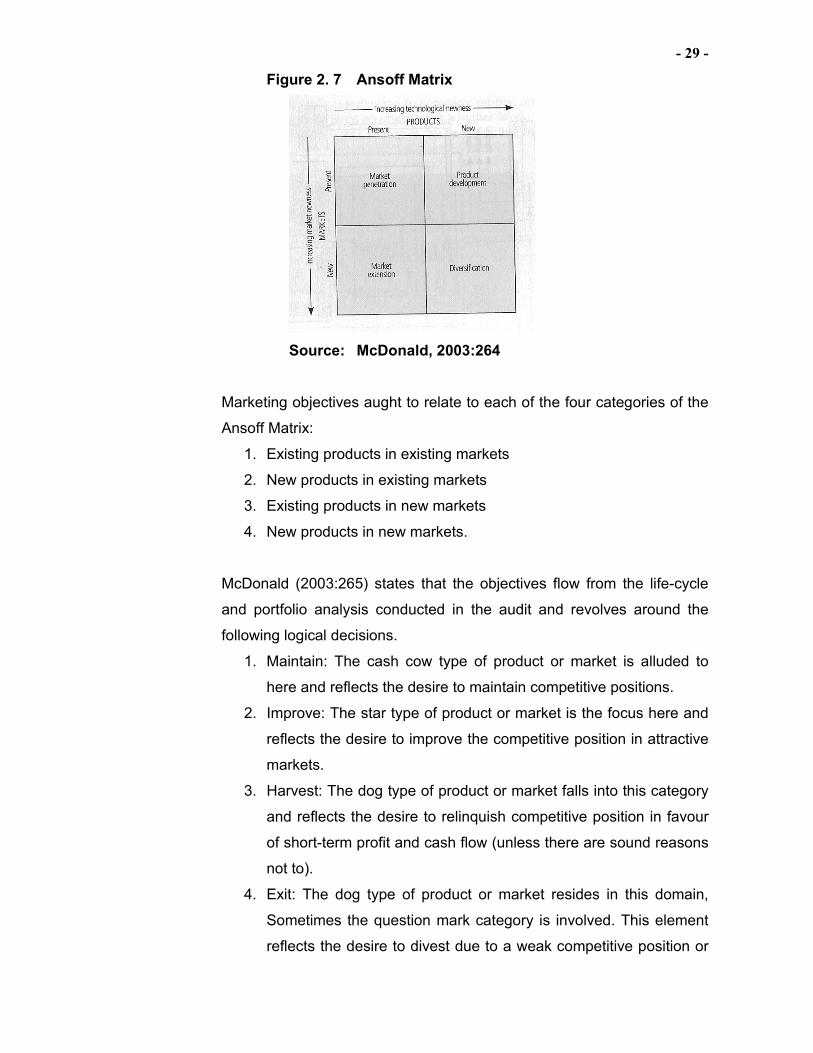
- 29 -
Figure 2. 7 Ansoff Matrix
Source: McDonald, 2003:264
Marketing objectives aught to relate to each of the four categories of the
Ansoff Matrix:
1. Existing products in existing markets
2. New products in existing markets
3. Existing products in new markets
4. New products in new markets.
McDonald (2003:265) states that the objectives flow from the life-cycle
and portfolio analysis conducted in the audit and revolves around the
following logical decisions.
1. Maintain: The cash cow type of product or market is alluded to
here and reflects the desire to maintain competitive positions.
2. Improve: The star type of product or market is the focus here and
reflects the desire to improve the competitive position in attractive
markets.
3. Harvest: The dog type of product or market falls into this category
and reflects the desire to relinquish competitive position in favour
of short-term profit and cash flow (unless there are sound reasons
not to).
4. Exit: The dog type of product or market resides in this domain,
Sometimes the question mark category is involved. This element
reflects the desire to divest due to a weak competitive position or

- 30 -
because the cost of remaining is prohibitive and the risk
associated with improving its position is too high.
5. Enter: This refers to a new business area.
2.5 MARKETING STRATEGIES
2.5.1 Types of strategy
One way of considering strategies is to consider whether they are
defensive, developing or attacking. All strategies embody either one or a
combination of the above (Westwood, 1996:121).
a. Defensive strategy This strategy is designed to prevent the loss of existing customers.
Typical defensive strategies would be (Westwood, 1996:121):
• Improve company image
• Improve quality/ reliability of product/service
• Improve reliability of delivery promises
• Restyle/repackage products/services
• Improve performance of the product
• Improve durability of the product
• Overcome product faults.
b. Developing strategies
This strategy is designed to offer existing customers a wider range of
products or services. These strategies are based on modifying products
or introducing new products to existing customers in existing markets.
The introduction of such offers can produce the simplest and least risky
strategy to increase turnover. Typical developing strategies would be
(Westwood, 1996:122):
• Increase the range of sizes/colours/materials offered
• Increase the range of services offered
• Increase the range of extra features/options
• Find different uses for the product
• Develop new products

- 31 -
• Make the product more environmentally friendly.
c. Attacking strategies This strategy is designed to generate business through new customers.
This strategy involves finding new customers in existing markets or new
customers in new markets. Typical attacking strategies would be to
(Westwood, 1996:122):
• Change the pricing policy
• Use new sales channels
• Find new distribution outlets
• Enter new geographical markets
• Enter new industry sectors.
2.5.2 Competitive Strategies
One of the principle purposes of a marketing strategy is to choose the
customers and the markets the company wishes to deal with. The main
components of strategy are the company, its customers, products/
services and the competitors. Figure 2.8 illustrates this. If a company is
to succeed, they need to develop a sustainable competitive advantage
(McDonald, 2003:266).
Figure 2. 8 Marketing and the three C’s
Source: McDonald &Christopher, 2003:90
Competition Company
Customer
Strategies

- 32 -
2.5.3 Marketing Mix
McDonald indicates that a similarity exists between strategy in business
and strategic military developments. The strategist looks at the enemy,
terrain, resources available and decides where and how to attack. The
policy and mix, the direction and criteria to measure success, all fall
under the heading of strategy. The action steps are tactics. The following
points indicate the general content of strategy statements in the area of
marketing (McDonald, 2003:282).
• Policies and procedures relating to the products offered, number,
quality, design, branding, packaging, positioning and labelling are
examples
• Pricing levels to be adopted margins and discount policies
• Advertising, sales promotions, direct mail, call centres and the
internet. The mix of these, the creative approach, the type of media,
the type of displays and the amount spend
• The emphasis is placed on personal selling, the sales approach,
sales training and so on
• The relative importance of distributive channels
• Service levels in relation to different segments.
a. Elements of the marketing mix
Marketing strategies are the means by which marketing objectives will be
achieved and are concerned with the four mayor elements of the
marketing mix. These four elements are sometimes referred to as the
four P’s. According to McDonald (2003:282) these are:
• Product: The policies for areas such as product branding,
positioning, deletions, modifications, additions, design and
packaging
• Price: The pricing policies to be followed for product groups in
market segments
• Place: The policies for channels and customer service levels
• Promotion: The policies for communicating with customers under
the relevant headings, such as advertising, sales force, sales

- 33 -
promotion, public relations, exhibitions, direct mail, call centres
and the internet.
b. Strategy options
The following lists of marketing strategies covers the majority of options
open under the headings of the four P’s.
i. Product
• Expand the line
• Change performance, quality or features
• Consolidate the line
• Standardise design
• Positioning
• Change the mix
• Branding.
ii. Price
• Change price, terms or conditions
• Skimming policies
• Penetration policies.
iii. Promotion
• Change advertising or promotion
• Change the mix between direct mail, call centres, the internet
• Change selling.
iv. Place
• Change delivery or distribution
• Change service
• Change channels
• Change the degree of forward or backward integration.

- 34 -
2.6. FINANCIALS
The ultimate aim of a marketing plan is to increase company’s profits. To
attain this, the plan must be cost-effective. The planner need to budget
for the extra costs of the marketing plan and to confirm that the return in
increased contribution and profit justifies the expenditure involved. In
developing the marketing plan, the sales budget is prepared, which
consist of the projected sales income and the selling expenses budget. In
the preparation of marketing plans for individual products or markets,
consideration should be given to the additional turnover and contribution
generated by the plan and the costs associated with its implementation.
A partial profit and loss budget should be prepared. Marginal costing
techniques should be used to evaluate the viability of new products at
different levels of sales and payback analysis to determine the payback
period on new products (Westwood, 1996:197).
2.6.1 Projected sales income
The forecast sales volume is based on:
• The size of the market
• Forecast growth
• Selling price of the products
• The impact of the competition.
The projected sales income value is estimated earlier in the development
of the marketing plan. It is one of the key objectives of the marketing
plan. The forecast of order intake needs to be converted to forecasts of
unit sales and invoiced sales (Westwood, 1996:186).
2.6.2 Selling expenses budget
The selling expenses budget would include all operating expenses
incurred by the sales and marketing departments in executing the
marketing plan. These would be grouped under headings such as:
• Salaries
• Recruitment costs
• Travel and entertaining expenses

- 35 -
• Car costs
• Advertising
• Exhibitions
• Literature
• Free issue equipment
• New product launch expenses
• Training costs
• Administration costs.
The sales expenses budget would now be included in the company’s
total operating budget and from this the profit and loss budget would be
prepared. (Westwood, 1996:188).
2.6.3 Marginal costing
Westwood (1996:192) defines marginal costing as the approach to
costing in which only the variable costs are charged to cost units. The
fixed costs are met out of the total contribution generated. This technique
is used in marketing plans as it allows for the use of cost-volume-profit
analysis and to decide at what price marginal additional business is
worth having. Marginal costing deals with the relationships between five
factors:
• Variable cost per unit
• Total fixed cost
• Level of output or volume
• Price of products sold
• Mix of products sold.
2.6.4. Break-even analysis
A firm use break-even analysis to determine the level of operations
necessary to cover all operating costs for a particular product and to
evaluate the profitability associated with various levels of sales. A firm’s
break-even point is the level of sales necessary to cover all costs related
to the product. At that point, earnings before interest and tax (EBIT)
equal zero rand. At this point, the firm has no profit and no loss. A firm’s

- 36 -
breakeven point is sensitive to a number of variables. Examples include:
fixed cost (FC), the sale price per unit (P), and the variable cost per unit
(VC). An increase in cost (FC or VC) increases the break-even point,
whereas an increase in sale price per unit (P) decreases the break-even
point. The break-even point can be determined algebraically by the
formula:
Q = FC / (P – VC) where Q is the break-even point. This can be shown
graphically as in Figure 2.9 (Gitman, 2003:509).
Figure 2. 9: Break-even analysis
Source: Based on Gitman, 2003:511
2.6.5. Payback analysis
Payback periods are used to evaluate proposed investments and
indicate the amount of time required for the firm to recover its initial
investment in a project. This is calculated from cash inflows. For an
annuity, the payback period can be calculated by dividing the initial
investment by the annual cash inflow. The payback period can also be
used to make accept or reject decisions when there is a maximum
acceptable payback period involved. The payback period does not take
into account the time value of money or cash flows after the payback
Sales units
Cost / Revenues (R 000)
Break-even point
Total cost
Sales revenue
EBIT/Profit loss
Fixed cost

- 37 -
period (Gitman, 2003:398). Payback analysis is a useful method for
calculating how quickly a project will pay for itself when the investment is
a mixture of capital and revenue expenses. This is common with the
costing of new product launches (Westwood, 1996:196).
2.7. CONTROLS
Hutton (2000:244) maintain that controls are not an option but an integral
part of the planning process. Controls exist to close the planning loop,
providing feedback on progress, effectiveness and informing next year’s
plans. Controls are necessary because forecasts and the actual events
are not the same. Contingency planning and scenario plans prepare the
business and the manager for the unexpected. Rapid feedback and early
warning systems from the external environment are critical if the planner
is to have the opportunity to implement contingency planning and
scenario plans. The controlling plan plays the role of a benchmark
against which to measure the performance and adapt strategy as needed
to achieve the desired goal. Hutton remarks that plans should never be
written in stone. Plans and systems that support them need to be flexible
and responsive. Deviations from forecast performance levels must be
responded to. It is the outcome of a plan that is important and not the
plan per se.
2.7.1 The value of control
Planning is a cycle and the control elements close the loop, providing
information valuable to the next round of planning. Figure 2.10 shows the
planning cycle. Controls contribute to planning activities in three ways. In
the viewpoint of Hutton (2000:245), they provide:
• the warnings when actual performance is deviating from the
forecast
• input information into next year’s planning activity
• information that allows for evaluation of planning competencies
and a learning from planning experience.

- 38 -
Figure 2. 10: The planning cycle
Source: Hutton, 2000:246
2.7.2 Implementation
Kotler (2000:695) defines marketing implementation as the process that
turns marketing plans into action assignments and ensures that such
assignments are executed in a manner that accomplishes the plan’s
stated objectives. Brilliant strategic marketing plans account for little if
they are not implemented properly. Four sets of skills for implementing
marketing programs are needed. They are: diagnostic skills, identification
of company level, implementation skills and evaluation skills. Table 2.2
lists and explain the four type of marketing controls that are needed by
companies to implement the marketing plan. They are: annual-plan
control, profitability control, efficiency control and strategic control.

- 39 -
Table 2. 2: Types of marketing control Type of control Prime
responsibility
Purpose of control Approaches
1. Annual-plan
control
Top management Middle management
To examine whether the
planned results are being
achieved
• Sales analysis
• Market-share analysis
• Financial analysis
• Market-based
scorecard analysis
2. Profitability
control
Marketing
controller
To examine where the
company is making and
losing money
Profitability by:
• Product
• Territory
• Customer
• Segment
• Trade channel
• Order size
3. Efficiency
control
Line and staff
management
Marketing
controller
To evaluate and improve
the spending efficiency
and impact of marketing
expenditures
Efficiency of:
• Sales force
• Advertising
• Sales promotion
• Distribution
4. Strategic
control
Top management
Marketing auditor
To examine whether the
company is pursuing its
best opportunities in
markets, products and
channels
Review of:
• Marketing-
effectiveness
• Marketing audit
• Marketing excellence
• Company ethical and
social responsibility
Source: Kotler, 2000:698
2.8 RECOMMENDED MARKETING PLAN STRUCTURE
The proposed elements of a marketing plan as suggested by a spectrum
of authors have been addressed in this chapter. Premised on this
assessment the marketing plan structure modeled on Malcolm McDonald
has been selected as the template to use for the research endeavour.
Table 2.3 provides an holistic summary of what appears in a marketing
plan and a list of the principle marketing tools, techniques, structures and
frameworks that apply to each step.

- 40 -
Table 2. 3: The elements of a marketing plan
Source: McDonald, 2002:568

- 41 -
2.9. SUMMARY
In this chapter the main components of a marketing plan were discussed
from the perspective of a variety of authors. It is evident that an effective
and efficient marketing plan can be compiled following the framework
discussed in this chapter. Even though some of the elements in the
framework may not be applicable to all marketing plans, adhering to the
elements best suited to each organisation will ensure a plan that will
meet its requirements. Only selected elements of the marketing plan will
be discussed in the context of this research study. In the context of
McDonald’s model, the selected elements will be competitor analysis as
a component of the market overview, marketing strategies and controls
as an element of resource allocation and monitoring.

- 42 -
CHAPTER THREE
REVIEW OF GLOBAL MOBILE NETWORK OPERATORS
3.1 INTRODUCTION
In line with McDonald’s template for a marketing plan, the phase two,
situation review will now be conducted. Market structure, trends,
segments and strategies will be explored (McDonald,2002:568).This
chapter covers an overview of global mobile network operators that have
successfully launched data services. Various global network operator
companies were selected for this research. The object was to extract
marketing strategies that were successful for these companies and
including it in the development of a marketing plan for Vodacom to
market data services. Firstly the companies operating in Europe will be
discussed. They are Vodafone, T-Mobile, mmO2, 3 (previously
Hutchison 3G) and Orange. Thereafter Japan with NTT DoCoMo and
lastly South Korea with SK Telecom will be discussed. The reason for
these companies is that they are the leaders in the mobile data field.
Because the listed companies operate across different cultures, their
selection will validate this report. The chapter will conclude with core
concepts that have been distilled from these strategies.
3.2 VODAFONE
Vodafone is currently (2004) the worlds largest GSM mobile
telecommunications company (Mzolo, 2004). They have a significant
presence in Europe, UK, US, Middle East, Africa and the Asia Pacific
region. Their subsidiary, joint venture and associated undertakings are
shown in figure 3.1 and 3.2 respectively.

- 43 -
Figure 3. 1 Vodafone Subsidiary Companies – Proportionate customers and percentage ownership
Source (www.vodafone.com )
Figure 3. 2 Vodafone associate companies – Proportionate subscribers and percentage ownership
Source (www.vodafone.com )

- 44 -
3.2.1 Marketing Strategies
According to Pienaar (2004:7), Vodafone realigned their strategies in
2000 by:
• Creating revenue growth through increased marketing focus on
Vodafone’s established high quality customer base
• No longer expanding into new geographic markets but using
Vodafone’s established scale and scope to extend the financial and
commercial benefits of operational leadership
• Extending Vodafone’s service differentiation by investing in, and
delivering, a Vodafone branded, easy to use, customer service
proposition
• Deploying 350 interactive kiosks, this simulated the Vodafone Live
phone experience. These kiosks proved to be an invaluable sales
tool, giving customers the opportunity to research products and
having sales staff demonstrating the capabilities of the service
• Joining ranks with mmO2 and T-Mobile in a content partnership.
These partnerships have boosted data revenues for operators and
provide a new channel for media giants such as Warner, Universal
and Disney
• In preparation for 3G, Vodafone appointed a global marketing team.
Pienaar (2004:7) discuss further how improved marketing efforts to
Vodafone’s customer base are now a key business driver. Vodafone’s
entire organisational approach is focused on customers and the
applications they want to use. Vodafone has conducted extensive
research to determine what services customers require and how they
want them delivered. As a result, Vodafone has created fully branded,
easy to use, customer service propositions. Two examples of service
prepositions are Vodafone live and Mobile Connect 3G data-card.
Vodafone’s approach means that customers can now access services
through easy to use Vodafone branded menus. To achieve this,
Vodafone have worked much closer with its suppliers and partners to
implement what customers want. Microsoft and Siemens, are examples
of suppliers and partners. Vodafone have built global technology

- 45 -
platforms, which seamlessly deliver services to its customers, and has
created a global brand, which Vodafone believes will foster trust,
customer loyalty and a significant service differentiation in the market.
Figure 3.3 illustrates the Mobile connect data card.
Figure 3. 3 The Vodafone Mobile Connect Data Card
Source: www.vodafone.com
3.2.2 Vodafone Live
Vodafone launched Vodafone Live in 2002. The launch of Vodafone Live
was successful due to the following:
• The use of technologically advanced handsets.
• The use of the Vodafone Live data card.
• The range of services offered.
• The marketing campaign featuring David Beckham and Michael
Schumacher, a famous footballer and Ferrari racing driver
respectively.
The launch of Vodacom Live enabled Vodafone to increase its data
service revenues by 8.5 per cent. From 14.6 per cent to 16.1 per cent
(Pienaar, 2004: 9).
Figure 3.4 shows the Vodafone Live subscribers per country. It should be
noted that in the diagram the “Other” category includes France, Spain,

- 46 -
Ireland, Netherlands, Sweden, Portugal, Greece and Hungary. Vodafone
has over 6.8 million Vodafone live customers in controlled mobile
business and over 0,7 million in associates as at 31 March 2004, plus an
additional 13,0 million Vodafone live customers in Japan following the
rebranding of the J-Sky service to Vodafone live on 1 October 2003. As
the handsets in Japan do not yet incorporate the full Vodafone live
experience, Japan has been excluded from the table below.
Figure 3. 4 Vodafone Live subscribers per country as at March 2004.
Source: Vodafone Group Preliminary Results – March 2004
Vodafone is looking to impress its customers, by extending what its
products features, to what it can increasingly do. This involves
communication of products and benefits, not the creation of brand
awareness. Vodafone appeals to new customers and aim to keep its
existing ones by emphasising the uniqueness of the brand. Vodafone's
aim is to grow its revenue and improve its profit margin by adding value
to its products and services by earning more from each product sold.
Vodafone’s marketing mix is described below (Pienaar, 2004: 11).
a. Product
A product, with different features, provides customers with opportunities
to chat, play games, send and receive pictures, change ring tones,
receive information about travel and sporting events, obtain billing

- 47 -
information - and soon view video clips and send video messages.
Vodafone live provides on-the-move information services.
b. Place
Vodafone UK operates over 300 of its own retail stores. It also sells
through independent retailers like the Carphone Warehouse. At these
outlets customers are able to see and handle products they consider
buying. Support staff in the retail stores ensures customer’s needs are
matched with the right product, and the different options available are
explained.
c. Price
Vodafone wants to make its services accessible to as many sectors as
possible. Sectors such as the youth, apprentices, high-powered business
executives and the more mature users are targeted. Vodafone started to
offer various pricing structures to suit different customer groups.
d. Promotion
Vodafone works with icons such as David Beckham and Michael
Schumacher to communicate its brand values. Advertising on TV, on
billboards, in magazines and in other media outlets reaches large
audiences, and spreads the brand image and the message very
effectively. Retail stores have special offers, promotions and point of sale
posters to attract people and to encourage purchases. Vodafone actively
develops good public relations by distributing press releases to national
newspapers and magazines to explain new products and ideas.
Vodafone UK produces various publications for customers and staff:
• Vodafone Essentials which outlines the product range
• Vodafone Explore that helps customers to maximise their use of
their purchases
• Direct mail stimulates customers and potential customers to find
out more about Vodafone and its products

- 48 -
• Vodafone life magazine for employees which details products,
people and sponsorship deals
3.3 T – MOBILE
Over the years, T-Mobile had different marketing structures and are now
bringing them all together as the company matures. T-Mobile UK has
restructured its marketing department, creating a senior marketing role
responsible for all elements of its consumer business.
The revamp has been initiated as part of a shift in marketing strategy to
focus on its customers with the services, rather than the technology
behind them. T-Mobile launched this new approach in the last quarter of
2004. The structure of the marketing department has been reorganised
into four teams (Pienaar,2004:14):
• marketing communications
• consumer business
• business
• customer insight.
T-Mobile is well positioned to take advantage of 2.5G and 3G services. It
launched tzones, its answer to the gaming and picture-messaging centric
Vodafone Live service, and have signed major deals with entertainment
companies Sony, Disney, MTV and Universal that will ensure T-Mobile
has superior content when demand for 3G services take off (www.t-
mobile.com).
3.3.1 Customer Relationship Management
T-Mobile has one of the lowest customer churn figure in the industry.
Churn is when companies gain new customers only to lose many of
them. Churn is sometimes referred to as the customer defection rate
(Kotler,2000:47). T-Mobile’s annualised rate of churn is 21 per cent
compared to mmO2 with 28 per cent. T-Mobile achieved this churn rate
by focussing on customer relationship marketing. Direct marketing was
used in the UK because mobile data use is higher than in any other T-
Mobile country. Rather than marketing to the entire customer base,

- 49 -
T-Mobile have targeted only their customers with mobile data phones
(Pienaar,2004:15)
At the 2003 CustomerThink Executive Summit, a two-day conference
held during November 2003 in California, USA, Andras Kondor, the Vice
President of Consumer CRM with T-Mobile International shared his
insights regarding T-Mobile’s shift from a product oriented company to a
customer-centric organisation. First, he noted that long-term revenue
growth was going to have to come from existing customers. T-Mobile
have begun to differentiate itself from its competitors, by initiating
customer-centric processes designed to make the company the
industry's most highly regarded service company (www.crmguru.com).
According to Kondor, it all starts with:
• his team communicating a customer-centric vision
• direction and strategy to each of T-Mobile’s European markets
• making the executives at each of the countries responsible for
developing and implementing action plans in support of this
overall vision and strategy
• applications have been put in place so that each country or market
can measure and monitor the success that their action plans are
having towards driving their operations to greater levels of
customer-centricity.
T-Mobile is using sophisticated customer segmentation techniques
based on customer needs, attitudes, demographics and usage history to
better align its service levels and costs with customer value. T-Mobile
manages customer relationships beyond a typical life-cycle, currently 30-
50 months, using strategies, tactics and action plans that focus on
retaining customers throughout their life-stages, youth, maturity and
retirement (Berkowitz, 2003 online available from www.crmmastery.com
accessed 7-10-2004).
According to Kondor in Berkowitz, 2003, part of T-Mobile’s customer
loyalty strategy was to make the customer feel monetary pain (switching

- 50 -
costs are high) if they were to leave T-Mobile for another provider. Some
other pointers mentioned at the 2-day summit were:
• focus on being different; and that, differentiation must focus on
customer service
• selling must shift from a product and technology focus to a
consultative and solution focus by retaining current strengths while
building customer relevance
• give customers a vision of the value of working with the company
• measurement is key, companies must be able to gauge their
success towards becoming a more customer focused organisation
• focus CRM initiatives on a measurable pain or problem and then
go where the greatest ROI is, and
• if executive buy-in and sponsorship is wanted, show them the
earnings that can be achieved.
3.3.2 Marketing Strategy
T-mobile data service access strategies have been to create one
multispeed, multimedia network by integrating all the available
technology like GPRS, WiFi and UMTS into a single bundle. T-Mobile
uses a flat-rate bill approach as a market entry strategy to gain a
competitive advantage. T-Mobile have been first to market a number of
new services on the flat-rate basis T-Mobile have been the most
aggressive operator in adopting Wi-Fi technology as a complement to
3G, claiming that "3G is vital but not enough" for the provisioning of
mobile data. T-Mobile has 4,000 hot spots available in the U.S. and 700
in Europe (as at March 2004). Thereby claiming about 42 per cent of
global Wi-Fi hot-spot installations, and plans to raise the total to 10,000
by year-end 2004, with 4,000 in Europe and 6,000 in the U.S. T-Mobile
are far ahead of other mobile network operators in terms of the number
of hotspots. T-Mobile seems to be the innovators and Wi-Fi is clearly a
differentiator for T-Mobile (Billing Plus, 5 April 2004 online available from
www.telecoms.com accessed 2-07-2004).

- 51 -
3.4 MMO2
mmO2 was the first company in the world to rollout GPRS. This first-
mover advantage made sure that their business in the UK and Ireland
showed a record of revenue and growth. In the above-mentioned
countries mmO2 have a strong presence in high value markets and in
the provision of mobile data and internet services. mmO2 are one of the
few mobile companies that have succeeded with wireless application
protocol (WAP) services (Pienaar,2004:17).
3.4.1 Customer Relationship Marketing
mmO2 has a loyalty programme that has 1.8 million members , which
constitutes 8.3 per cent of its total subscriber base. This loyalty
programme was devised by mmO2’s marketing agency called Tullo
Marshall Warren(TMW). This loyalty programme is named mmO2 First.
In this loyalty group, the average churn is half that of its other customers.
Every one per cent saving on churn is believed to deliver £5 million in
profit. Customer satisfaction in this loyalty group is reported to be six to
ten per cent higher than mmO2’s other customers. TMW uses
sophisticated data analysis software to create quarterly personalised
communications, giving advice to customers on the most suitable tariff.
This scheme has won gold at the 2002 Direct Marketing Association
Awards. mmO2 have used its customer data to drive ideas and creativity.
These ideas and creativity provide a competitive advantage. mmO2 does
not have the debt of 3G license as they were demerged from British
Telecom. By being a small company, mmO2 can focus on the UK and
anticipate the needs of the British consumers (Pienaar,2004:17)
3.4.2 Marketing Strategy
In February of 2002 the company began restructuring its UK and
Germany operations, with the aim of improving their financial
performance. In the UK this involved reducing the workforce by 27%, and
closing 133 of its existing 320 retail outlets. In Germany, staff was
reduced by just under a quarter (www.btplc.com). During this period, the

- 52 -
company launched Revolution, an interactive mobile service giving users
access to entertainment, travel, games, reference, business and health
news and information. mmO2 have seen improvement in their operating
matrix for the last six quarters as a result of a very successful re-
branding from Cellnet to mmO2 and some very good marketing in the
data segments of the mobile market. mmO2 is now the U.K. market
leader in revenue generated from mobile data (Pienaar,2004:18) . In the
following graph, Figure 3.5, mmO2 is compared with Vodafone and
Orange mobile networks.
Figure 3. 5 Percentage Mobile Data Revenue generated in the UK per operator : Q1 2003 to Q1 2004.
Source: 3G Mobile, 9 June 2004
mmO2 have been successful in developing data revenues in terms of
monthly revenue coming from data, which is about US8.08 (R54.14) per
subscriber. mmO2’s strategy has focused on three key areas:
• improved operating performance
• managing their businesses cohesively
• leading in mobile data services.
Pienaar(2004:19) states that mmO2 recognised that their strategy must
evolve to reflect the changing nature of the marketplace. When mobile

- 53 -
systems started there was one killer application, mobile voice traffic and
customers were perceived as having similar needs. Now that both voice
and data services are what customer needs, the options available for
satisfying those needs must be more diverse. By having a clear
understanding of their customer’s different needs, mmO2 believe they
will be able to provide customers with a better overall experience of the
company.
To achieve the satisfying of customers, mmO2 are developing a new
segmentation framework to understand the priorities of their customers.
mmO2 will deliver a range of service packages to different types of
customers. mmO2 are enhancing their IT systems, to improve their
capability in customer relationship management, and to help them
transform their retail presence. mmO2 are building their skills and
capabilities in customer service, marketing, brand building and service
packaging. They are motivating their staff to live the brand values and to
keep the customer experience at the center of their vision. mmO2 believe
by doing the above they will improve their ability to attract and retain
higher value customers, helping to increase ARPU, reduce churn and
improve operational performance.
Data will continue to be a core element in their drive to build a strong
brand, based on delivering an excellent end-to-end service experience.
mmO2 does not necessarily want to be the first to market with each new
data product, but they want to provide products and services that are
relevant to their customer’s lifestyles, easy to use, reliable, good value
and backed up by excellent customer support (Pienaar,2004:19).
The UK and the German markets are approaching saturation point in
terms of mobile phone usage, and mobile operators are poised to alter
their approaches to focus more on customer support and retention,
rather than the aggressive marketing of new customers
(www.mmo2.com).

- 54 -
3.5 3
3 is a mobile multimedia company focused solely on the provision of 3G
mobile communication services in the UK. The company's products are
marketed under the 3 brand name. 3 were one of five companies
awarded licenses by the UK Government in May 2000 to run third
generation (3G ) mobile services. Most of 2002 saw 3 awarding contracts
to content providers. In 2003 the company signed a number of
distribution agreements with high street retailers in the UK. 3 also sealed
more agreements with content providers and began to take online
customer pre-orders of its products and services. One of the company’s
strengths is their experienced and successful management team. 3’s
management team, including managing director Dr. Colin Tucker and
strategy and marketing director Lisa Gernon, includes many of the
people who built Orange into a key player. Their experience from building
Orange, which itself was a new entrant, into the largest UK mobile
operator should prove invaluable to 3. 3 want Europe‘s mobile operators
to be impressed by their product, the Hutchison-Whampoa. This product
is on course to achieving critical subscriber mass 2004 (Mobile
Communications -November 2003 online available from www.
mobilecomms .com accessed 2-07-2004).
In July 2003, 3 appointed a new marketing team with responsibilities as
listed below. All the directors below report to Gareth Jones, chief
operating officer, 3 UK.
• Gordon Webber as director of commercial activities. He will be
evaluating 3's commercial opportunities and agreements in the
UK. He will also be responsible for reviewing the performance of
current products, price plans and propositions. Webber, has over
14 years of experience in the mobile telecommunication industry
and joins from Orange where he was head of their global
distribution department.
• Ian Munro as customer director. He will have responsibility for
leading and managing all the dynamics of the customer
experience, including the contact centre teams in Glasgow and

- 55 -
Mumbai. Munro has over twenty years experience in developing,
implementing and managing contact centres. He has worked with
a number of high profile organisations in successfully developing
and implementing enhanced customer experience.
• Graeme Oxby as marketing director. Oxby has led the
implementation and refining of the marketing proposition and his
role encompasses product development, marketing, pricing and
communications.
The roles of Webber and Munro are new and they reflect 3’s focus on the
customers and the operational side of the business (www.three.co.uk).
3.5.1 Marketing Strategy
3 is a pure-play provider of the 3G mobile communications services that
are expected to heavily impact on the business model for 2G services
over the next few years. This is significant because most other mobile
companies still derive a substantial percentage of its revenue from its 2G
offerings. 3 may choose to expand and offer its 3G services in other
countries in Europe and thus present an even bigger threat to mobile
companies (Pienaar, 2004:18).
Pienaar (2004:20) lists the main responsibility of the marketing team
mentioned above, as developing multimedia services that will engage
customers, including:
• Understanding who the potential customers are and how to target
them
• Developing multimedia services
• Developing customer focused marketing propositions that will
appeal to consumers and business customers
• Managing brand communications, advertising and media relations.
3 have gained important insights from its first few months offering the
UK’s first commercial 3G service. While it has had setbacks, poor
network functionality and unappealing handsets, 3's new strategy
presents an unprecedented danger to its rivals. Attractively bundled
packages would let customers gain crucial experience of multimedia

- 56 -
services. This would leave 3 with the lesser challenge of keeping them
loyal. 3 have planned new pricing and accessory options for 2004 and
should help the operator offset the negative impact of poor battery life,
variable network quality and unappealing handsets. Product and price
improvements, coupled with 3's strong financial position, extensive
distribution channels and ‘no-nonsense’ packages, make the operator a
much larger threat to its competitors than is readily acknowledged. And 3
can move up the learning curve before the other mobile network
operators get their own 3G services up and running (Pienaar,2004:21).
Vital clues about where the company is heading, is broken down into six
key areas (Baskerville,November 2003 online available from www.
Baskerville.telecoms.com accessed 2-07-2004).
They are:
• network rollout
• handsets
• tariffs
• marketing/branding
• content
• distribution.
3 have a sales strategy and developed a sales team that consists of four
teams (Pienaar, 2004:21). They are:
• The business sales team which focuses on corporate business
customers
• The consumer sales team that target customers both through its
own retail outlets, and multiple and specialist retailers
• The logistics and sales support team focusing on order
management
• The channel marketing team that develops, implements, coaches
and manages marketing strategies in partnership with the
channels mentioned above.
3 also have a technology strategy team that works closely with the
marketing team to:

- 57 -
• Define, develop and deliver new applications
• Deliver enhancements to the established network
• Research future technologies and trends.
No detailed information is available on the above key areas.
3 have a clear and well thought out strategy for reaching their customers.
Their own stores give customers the chance to be immersed in their
brand and to see what the company can do for them. They are able to
reach customers through their partnerships with existing distribution
channels. The Whampoa purchase of Superdrug has given them access
to a huge existing retail network, that they can use very effectively in
putting 3 where customers perhaps don’t expect to see them.
Agreements with experienced and established retail operations like
Carphone Warehouse, Dixons and Phones4U will make sure 3 keeps on
building a strong profile (Pienaar, 2004:22).
In May 2004, 3 announced it would be selling ThreePay, its pay-as-you-
go offering, vouchers in 60,000 outlets in the UK. In just two months, 3
have achieved a rapid rollout with distribution agreements in place with
the four leading top-up providers. They are e-pay, PayPoint, Omega
Logic/EPOSS and Alphyra. ThreePay is the first pay-as-you-go tariff from
a UK mobile operator to offer customers the same great value as
contract, under the headline “if you top-up more than once a month you'd
be better off with ThreePay”. 3 continue to expand successfully and are
in negotiations with other retailers to further extend its ThreePay
distribution network. In addition to the 60,000 outlets selling ThreePay
vouchers, customers are able to top-up online or via their video mobile
handset using a credit or debit card (www.three.co.uk).
3.6 ORANGE
Orange has operations and minority interests in 26 countries, but its
principal controlled operations are located in France, UK, Netherlands,
Switzerland and Belgium. Orange group companies have been awarded
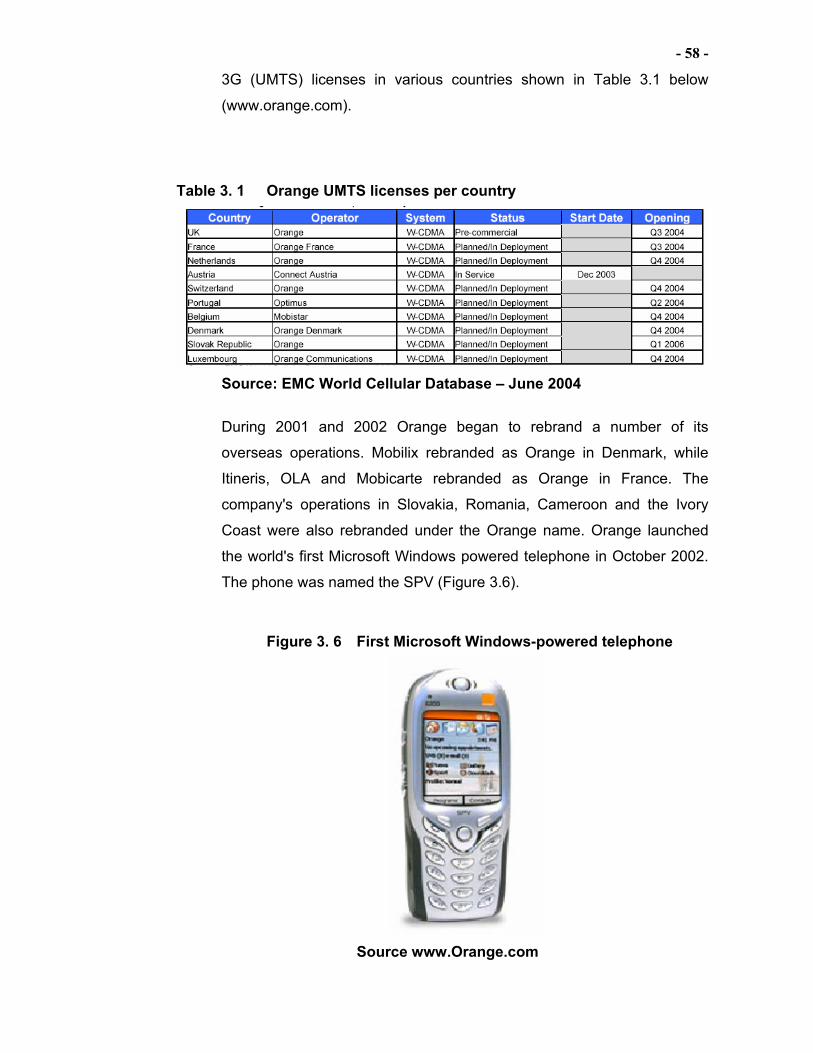
- 58 -
3G (UMTS) licenses in various countries shown in Table 3.1 below
(www.orange.com).
Table 3. 1 Orange UMTS licenses per country
Source: EMC World Cellular Database – June 2004
During 2001 and 2002 Orange began to rebrand a number of its
overseas operations. Mobilix rebranded as Orange in Denmark, while
Itineris, OLA and Mobicarte rebranded as Orange in France. The
company's operations in Slovakia, Romania, Cameroon and the Ivory
Coast were also rebranded under the Orange name. Orange launched
the world's first Microsoft Windows powered telephone in October 2002.
The phone was named the SPV (Figure 3.6).
Figure 3. 6 First Microsoft Windows-powered telephone
Source www.Orange.com

- 59 -
In October 2003 Orange launch OrangeWorld which is a suite of
personalised services and a range of handsets that the company hoped
would replicate the success of Vodafone's Vodafone Live product. In
March 2004 four of Europe's largest mobile phone companies
announced the creation of an alliance called FreeMove. The companies
are T-Mobile, Orange, Telefonica Moviles and Telecom Italia Mobile.
They originally started talks on cooperation during 2003. FreeMove was
created to offer a seamless service across all of its member's networks
and to achieve economies of scale in a number of areas, such as the
purchase of handsets (www.orange.com).
3.6.1 Global Brand Strength
Orange has created Europe's strongest telecoms brand based on
lifestyle rather than technology. This brand recognition enables Orange
to embark on high-profile marketing campaigns, and gives Orange the
ability to offer global services which companies operating in individual
markets would find difficult to do on their own. This therefore gives
Orange an important competitive edge in local markets. OrangeWorld
allows customers to access a range of services personalised to their
tastes through a single icon on their phone This access by single icon
makes the service easy to setup and use. Many of the services in
Orange World are available on existing handsets in the UK and France,
but Orange is also launching a new batch of phones to complement its
existing Microsoft Windows-powered SPV smartphone (Figure 3.7
below). By the end of 2003, Orange had eight such smartphones in
shops, including one from Nokia, all sporting the Orange brand and the
Orange World icon (Pienaar,2004:24).

- 60 -
Figure 3. 7 Microsoft Windows-powered SPV smartphone.
Source www.orange.com
Orange is hoping 15 per cent of new customers will be using one of
these Signature phones by the end of 2004. The company wants
customers to spend more time calling, texting and downloading
information. Orange has already persuaded more than 500,000 UK
customers, 3,6 per cent of total subscriber base, with handsets that can
use WAP to use OrangeWorld's predecessor, Your Page, to personalise
their information services. These customers spend an average of three to
four times more of their day browsing news and information than normal
Orange customers do (Pienaar,2004:24).

- 61 -
3.6.2 Marketing Strategy
In February 2004, Orange introduced a new strategy in the UK aimed at
persuading British users who are sceptical about mobile data to try it.
Although they may not currently use services, such as mobile email and
picture messaging, Orange is sure that users would like data services if
they tried them. Orange kicked off the strategy with the launch if its
“TRY” campaign at the start of February 2004. The strategy follows
studies conducted by the operator that showed that less than 10 per cent
of UK citizens would proactively invest in a new technology but that the
mainstream, 90 per cent would be far more liable to buy new services
and products if they were able to test-drive them first (Pienaar,2004:24).
The above approach allows users from both corporate and consumer
sectors to trial services and products that they have never previously
used, free. The untried products are available for a month's trial period,
by which time Orange hopes the recipients will have been sufficiently
enticed to want to buy them. The “TRY” strategy centers around data and
messaging products, which are offered in bundled deals. According to
Orange, this new strategy change the way they offer services to all of
their customers and Orange hopes that this drive will be successful.
Orange's challenge is to encourage more of the UK population to behave
like the 'early-adopter' segment of the market and the scheme should
certainly help to address this (Pienaar,2004:25).
3.7 NTT DOCOMO
Japan have three major mobile operators, and the overall numbers of
subscribers for the three mobile operators are for Vodafone K.K. 14.9
million, for NTT DoCoMo 45.4 million and for KDDI 16.2 million, as of
January 2004. NTT DoCoMo is the largest mobile operator in Japan,
more than twice the size of its two competitors. The main reason for this
is the success of i-mode (Henten,Olesen,Saugstrup &Tan,2004:201).
NTT DoCoMo is Japan’s leading mobile communications operator. The
company’s operating revenue for the year ending 31 March 2004 was

- 62 -
five trillion yen. NTT DoCoMo has over 49 million subscribers as of July
2004 and accounts for more than half on Japan’s cellular phone market
and one of the largest subscriber bases of any mobile phone company in
the world. NTT DoCoMo offers a wide range of mobile
telecommunications services. These are cellular telephones, Personal
Handyphone Systems (PHS), paging, satellite mobile communications
and maritime. The world’s first 3G product, Freedom of Multimedia
Access (FOMA) and i-mode are positioned prominently in the above mix
(www.nttdocomo.com).
3.7.1 Marketing Strategy
DoCoMo launched i-mode in February 1999. DoCoMo has a proprietary
on i-mode which is a 2G/3G mobile-internet platform. This technology
reinvented the cellular industry and most major mobile companies copied
this technique. In Japan DoCoMo have 42 million users as at October
2004. Three million users of i-mode services are available over GSM
networks in nine other countries and regions (www.nttdocomo.com).
In October 2001, NTT DoCoMo launched its 3G wireless service FOMA
as the first 3G service in the world. DoCoMo’s FOMA network permitted
the transmission of voice, data, and video. Well ahead of potential 3G
rivals in Europe and the United States, the company committed to being
one of the early leaders in Asia. Since the launch of the service,
coverage has been extended to almost 100% of the Japanese
population, and the release of new terminals with higher-level
functionality continues to attract ever more subscribers. i-mode service
has become more advanced with the use of FOMA 3G technologies.
FOMA's high-speed packet transmission with reception speeds of up to
384Kbps makes i-mode service significantly faster and able to handle
greater volumes of data: e-mail messages of up to 10,000 characters,
the ability to attach files of melodies and still images. The latest terminal
also features an increased data capacity of up to 200KB for saving even
more i-appli content. The i-mode service has always been incredibly

- 63 -
convenient, but FOMA's new capabilities realise entirely new potential
(www.nttdocomo.com).
DoCoMo pronounced that i-mode was successful because it offers a win-
win situation to developers and subscribers. Content providers are free to
concentrate on the provision of information while NTT DoCoMo takes
care of all billing on their behalf, while more and more subscribers are
attracted by the constantly updated wealth of exciting and convenient
content. One of the key strengths of i-mode is the fact that it remains
connected to the Internet at all times. This means there is no need to dial
up to access more than 4,400 Japanese and English-language web sites
via the i-Menu and an infinite number of independent sites. i-mode also
offers "Web to", "Phone to", and "Mail to" functions which add even
greater convenience. i-mode is based on a foundation of technological
advances. By embracing packet transmissions, the service offers
continuous access. Additionally the use of a subset of HTML makes
content creation simple and allows existing sites to be converted with
ease. The i-mode business model of NTT DoCoMo is ingenuis. It
involves the synchronisation of every aspect of the value chain to ensure
wireless technologies, content quality, and the user experience evolves
at the same optimal pace. Even the billing system is made more efficient
too, with NTT DoCoMo collecting information access fees on behalf of i-
Menu-listed content providers by presenting subscribers with a single,
consolidated bill (www.nttdocomo.com). NTT DoCoMo receives three
revenue streams from the i-mode business model: monthly charges from
subscribers, 9 percent commission from content providers, and charges
from packet transmission (Henten et al,2004:202).
3.7.2 The i-mode value chain
The i-mode collaboration model contains four main entities: NTT
DoCoMo, platform vendors, handset vendors and content providers. The
collaboration model or value chain is made up of a mobile ecosystem of
partners, where the mobile operator plays a central role in coordinating
most activities. NTT DoCoMo in the center coordinates and synchronises

- 64 -
the activities in order to continuously improve the service for the
subscribers. One of the main reasons for the huge i-mode success is
rooted in this constellation among the different entities in the value chain.
Looking at the advantages, the most obvious one is that all entities in the
value chain are working towards the same goal of satisfying the end-
user, as their own success depends on this. All partners have aligned on
a common interest, serving the end-user and, thereby, maximising their
own and other entities’ value within this value chain. This objective is
achieved by exchanging information throughout the value chain, thus
also providing beneficiary feedback to one another and sharing
responsibility and development costs. The main task of getting the
customers and marketing the services or applications is assigned to the
operator in the center, NTT DoCoMo, whereas the other partners in the
value chain can focus on their core competences (Henten et al,
2004:202). Figure 3.8 highlights this collaboration concept.
Figure 3. 8 I-mode Collaboration/Value Chain concept.
Source www.nttdocomo.com

- 65 -
3.8 SK TELECOM
South Korea has the fastest-growing mobile penetration rates in the
Asia-Pacific region and has the largest penetration of mobile Internet
users in the world. South Korea has around 12.5 percent of the world’s
wireless Internet users (www.eurotechnology.com/imode/faq-wap.html,
accessed 29 September 2004).
South Korea has achieved this number of subscribers without having to
offer any forms of subsidy because of the ban on subsidies by the South
Korean government. Compared to Japan where terminals have been
heavily subsidised. Mobile operators in South Korea have emphasised
their commitment to bring popular and useful services to mobile users
(Henten et al, 2004:203). One of the major influencing factors for the high
rate of mobile usage in South Korea is the government’s strong
involvement in the country’s development of next-generation core
technologies, which include both wired and wireless communication
(www.mic.go.kr/index.jsp, White Paper 2002 on informatization
,accessed 29 September 2004).
SK Telecom is Korea’s biggest mobile telecommunications company. SK
Telecom provides services to over 11 million mobile and Internet
communication service subscribers, accounting for 43 percent of the
Korean market. The firm’s cellular services reach 79 cities and towns and
195 rural communities, covering at least 98 percent of the Korean
population.
Although SK Telecom dominates Korea’s telecommunication market, the
company faces a bigger challenge from competition on a global scale.
Telecommunications company mergers around the world are putting
pressure on individual players such as SK Telecom to stay ahead in the
increasingly global battle for the provision of information and
communications services (www.microsoft.com /asia/crp/ search2.asp?
CaseID=3).

- 66 -
3.8.1 Marketing Strategies
To be able to effectively deliver on this strategy and provide customers
top-notch services, SK Telecom emphasises the importance of having a
strong IT infrastructure, specifically in billing, customer management, and
basic operations in the telecommunications business. SK Telecom
decided to implement a system that would allow employees to better plan
business strategies, provide solutions and establish infrastructure in IT
services, as well as provide customer authentication and customer
management. In July 1999, SK Telecom enlisted the aid of local
Microsoft solution partner NETS Co. Ltd, which suggested implementing
the IT services infrastructure on a Windows NT-based platform, setting
up virtual private networks; hosting Internet, intranet and commerce-
enabled Web sites; and deploying communication services including
mail, news and conferencing. SK Telecom projects that data
communications services will contribute 600-plus per cent revenue
growth over the next five years, with the number of users increasing from
50,000 to one million in 2004 alone. Also, the Windows NT platform and
migration path to Windows 2000 allows SK Telecom to work toward its
goal of achieving 60 percent market share in wireless data
communications since the system can scale to handle over 10 million
online transactions per day (www. microsoft.com/ asia/crp/search2.asp?
CaseID=3).
SK Telecom decided to use the consulting firm Ovum to develop a cost
model for future termination charges that reflects the true business costs.
In South Korea, regulators have been busy with the key issue of
termination charges. SK Telecom had to contend with the lowest
termination charge among its competition, and a much lower charge than
that set for other regulated markets in Western Europe. With a further
change to the regulatory framework mooted for 2004, the company had
to be in the best possible position to protect a key income stream. This is
where Ovum‘s services was successfully utilised
(www.ovum.com/consultancy/default.asp?doc=sk_case/default.htm)

- 67 -
SK Telecom, work closely together with content providers to come up
with applications that users are likely to want to see on their mobile
terminals. SK Telecom collaborated with content providers to upgrade
data-intensive content such as game applications, so that users would
have a better experience with these applications. The priority is to attract
new users to mobile Internet services and the way to do this is to
introduce popular content that is in line with common daily activities such
as access to news and location-based services. These services have
been identified as the ones that are more likely to be attractive to users,
both existing and new (Henten et al, 2004:203).
SK Telecom has provided a wide variety of services to users on the
mobile Internet platform. Services have been introduced that allow
mobile users to subscribe to, and to customise, services to their liking
and to access the Internet whenever they desire. These services are
accessible not only through mobile terminals but also through other
devices such as personal digital assistant’s (PDA) and personal
computer (PC) management. In December 2003, SK Telecom launched
the 3G (W-CDMA) version of the “MONETA” chip, which acts like a
mobile credit card and allows users to pay for goods through infrared
financial messaging or through physical terminals using a radio
frequency (Henten et al, 2004:203).
Table 3.2 below lists the countries that the mobile network companies,
described earlier in this chapter, operate in and the number of
subscribers.
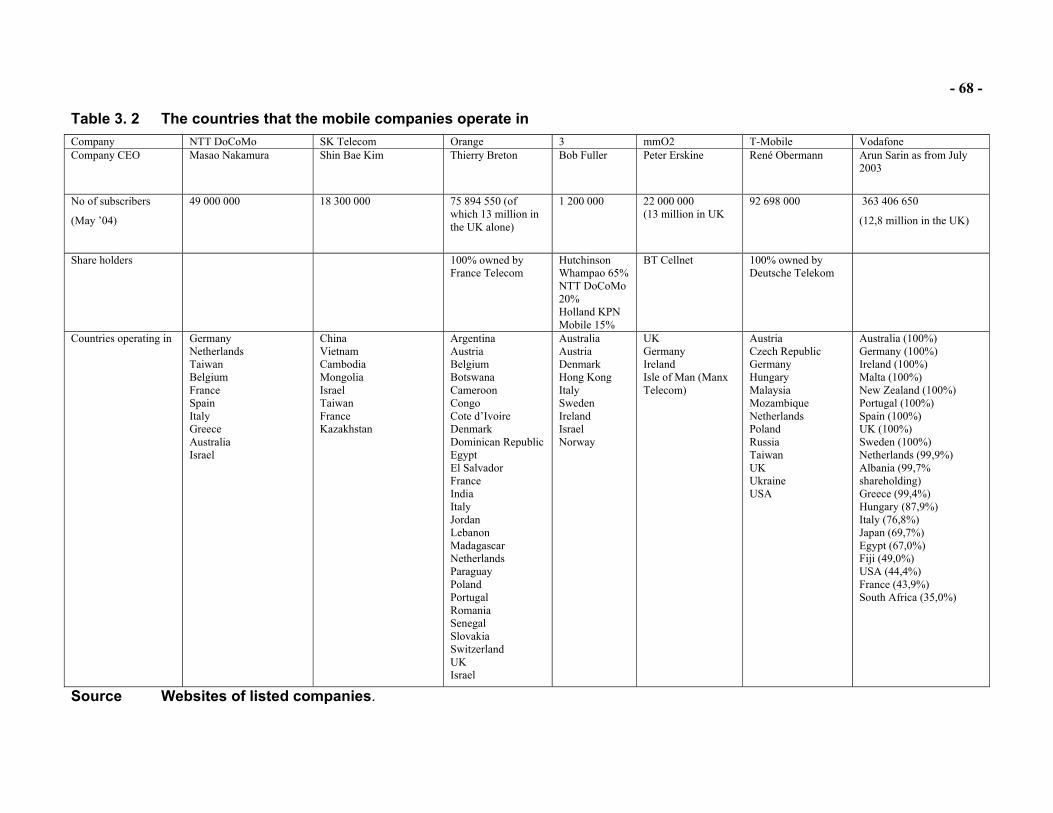
- 68 -
Table 3. 2 The countries that the mobile companies operate in Company NTT DoCoMo SK Telecom Orange 3 mmO2 T-Mobile Vodafone Company CEO
Masao Nakamura Shin Bae Kim Thierry Breton
Bob Fuller Peter Erskine
René Obermann
Arun Sarin as from July 2003
No of subscribers
(May ’04)
49 000 000 18 300 000 75 894 550 (of which 13 million in the UK alone)
1 200 000 22 000 000 (13 million in UK
92 698 000
363 406 650
(12,8 million in the UK)
Share holders 100% owned by France Telecom
Hutchinson Whampao 65% NTT DoCoMo 20% Holland KPN Mobile 15%
BT Cellnet 100% owned by Deutsche Telekom
Countries operating in
Germany Netherlands Taiwan Belgium France Spain Italy Greece Australia Israel
China Vietnam Cambodia Mongolia Israel Taiwan France Kazakhstan
Argentina Austria Belgium Botswana Cameroon Congo Cote d’Ivoire Denmark Dominican Republic Egypt El Salvador France India Italy Jordan Lebanon Madagascar Netherlands Paraguay Poland Portugal Romania Senegal Slovakia Switzerland UK Israel
Australia Austria Denmark Hong Kong Italy Sweden Ireland Israel Norway
UK Germany Ireland Isle of Man (Manx Telecom)
Austria Czech Republic Germany Hungary Malaysia Mozambique Netherlands Poland Russia Taiwan UK Ukraine USA
Australia (100%) Germany (100%) Ireland (100%) Malta (100%) New Zealand (100%) Portugal (100%) Spain (100%) UK (100%) Sweden (100%) Netherlands (99,9%) Albania (99,7% shareholding) Greece (99,4%) Hungary (87,9%) Italy (76,8%) Japan (69,7%) Egypt (67,0%) Fiji (49,0%) USA (44,4%) France (43,9%) South Africa (35,0%)
Source Websites of listed companies.

- 69 -
3.9 Conclusions The following core factors can be extracted from the above market
overview:
• Mobile network operators are making use of extensive research to
improve their marketing efforts to customers and provide them with
the products and services they want.
• Communication to existing and potential customers needs to be
effective. Emphasis needs to be placed on the benefits of a product
or service, as people buy benefits not products.
• New data services like 3G should be marketed to consumers as an
extension of existing service offerings and not as something new.
There must be a seamless integration between GPRS, Wi-Fi and
UMTS.
• A well-integrated customer relationship marketing strategy is very
important as the churn rate among loyal customers is half that of
other customers. It is contended that every extra five percent churn
per year causes a two percent drop in earnings before interest, tax,
depreciation and ammortisation (EBITDA).
• Customer segmentation is of utmost importance to ensure that the
most suitable products and services are offered to the right target
market, Proper segmentation results in retaining higher value
customers, increasing ARPU, reducing churn and ultimately
improving operational performance.
• Having an experienced and successful marketing team is critical for
the success of any marketing strategy. The mobile network operators
covered in this overview embarked on major recruitment drives for top
marketing and strategic positions.
• It would appear that one of the best ways to get customers to buy
new products or services, is to let them “try” it first. Orange
implemented this strategy after conducting research in the UK, which
showed that people are more likely to buy products if they were able
to “test-drive” them first.

- 70 -
• Mobile operators are sure of success when thy form partnerships to
create a value chain or collaboration model to provide an end-to-end
service and product.
3.10 SUMMARY
This chapter described seven global network operators. These operators
were chosen by the researcher because they all have data service
offerings and they have 3G licenses. The network operators are
established companies and have refined their marketing strategies.
Relevant aspects of the above conclusions will be adapted when
proposing selected elements of a marketing plan for Vodacom to adapt
when marketing 3G and re-launching data services. These issues are
addressed in the following chapter.

- 71 -
CHAPTER FOUR
SELECTED ELEMENTS OF A PROPOSED MARKETING PLAN FOR VODACOM
4.1 INTRODUCTION
In this chapter selected elements of the marketing plan as they relate to
Vodacom are discussed in detail. The detailed elements that will be
discussed are competitor-analysis, a marketing strategy and controls.
These elements refer to McDonalds model described in chapter two.
Competitor analysis forms part of phase two, the situational analysis.
Marketing strategies as part of phase three, strategy formulation.
Controls forms part of phase four, resource allocation and monitoring.
Since competitor analysis is central in the significance of potential
marketing success, this section has been given more weight than the
strategy and control elements contextually. Premised on research in this
document and irrespective of any marketing strategy or documents used
by Vodacom, the following plan is proposed.
4.2 COMPETITOR ANALYSIS
Vodacom’s data service sector is in the early growth stage. Vodacom
launched GPRS in October 2002 and have 256972 registered
subscribers as at 09/12/2004 (Personal communication Y.De Beer, 9-12-
2004). This equates to 2.6 per cent of their customer base. The other
type of data, 3G, is being rolled out in December 2004 to main metro
areas. 3G will be extended the same way GSM was introduced and
expanded over several years (Le Roux, 2004). Vodacom spent R400m to
upgrade 470 sites for 3G (Business Day, 11/11/2004). A competitor
analysis will now be conducted by using Porter’s five forces model as a
reference.

- 72 -
4.2.1 Industry competitors
Industry competitors are also referred to as segment rivalry or
competitive rivalry.
a. MTN SA
MTN SA is Vodacom’s biggest competitor. MTN have decided to roll out
enhanced data rates for global evolution (EDGE). EDGE will provide a
higher user base and wider coverage for the next four to five years. This
will increase the rate of uptake and ensure MTN’s broadband is viable
from the start. EGDE works on the existing network but operates more
efficiently. EDGE technology offers many of the services that 3G offer,
but at a slightly reduced speed and quality. MTN believes that once
EDGE have been established and are widely used, the switch to 3G
applications and cellphones will be fairly seamless. MTN will have
covered 20 per cent of their network with EDGE technology by January
2005 (Lünsche, 2004).
MTN spent R20m on testing 3G and is spending R500m to upgrade their
GSM network to EDGE technology (Business Day, 11/11/2004). When
comparing Vodacom and MTN annual results 2004, it seems as if MTN is
more efficient and their ARPU is higher. MTN have engaged Vodacom in
various type of media battles to the point where MTN’s Chief Technology
Officer, Karel Pienaar, said that he will “eat his hat” if pervasive 3G
services are rolled out by Vodacom by the end of the year 2004. MTN
has a marketing strategy in place that they will adapt if the need arise.
MTN will upgrade their current infrastructure and then gradually phase in
3G. They plan to make broadband wireless and 3G available to the
South African market and then to the rest of Africa. Pienaar lists the
challenges to 3G as the reason for MTN’s delayed roll out of 3G, in 2006
(Whitford, 24 June 2004). The reasons Pienaar lists are:
• Handsets: The variety of 3G-enabled phones is to small and the
cost of these handsets to high. This will inhibit the acceptance of
3G technology by the mass market.

- 73 -
• Telkom monopoly: A competitor is needed for Telkom to drive the
prices of service to the cellular networks down. Bigger pipes from
base stations to cellular switches are needed to carry an
increased load of data and the current price of those links are to
high.
• EDGE versus 3G: Pienaar wants to play a wait and see game. He
says more EDGE-enabled phones compared to 3G-enabled
phones are entering the market.
Pienaar expects pervasive 3G services to be available in five years time
(Whitford, 24 June 2004).
b. Cell C
Cell C is the third competitor in the SA cellular industry. They entered the
mobile cellular market in 2001(www.cellc.co.za). Since its launch, Cell-C
has achieved a good level of success, and it now has approximately a 14
per cent share of the South African market. It secured 32 percent of net
additions during the twelve months to March 2003 and in the six months
since this proportion has increased to over 40 percent. This growth has
been fuelled by enhancements to its media advertising campaigns and
an increase in its distribution channels. With these growth rates, Cell-C is
well positioned to achieve a market share of around 20 percent by 2007.
This is a strong performance as it has been in commercial operation for
only two years. Compared with many other wireless markets, a 14 per
cent share after two years is a strong performance. However, Cell-C did
enter the market at a time when mobile service penetration was relatively
low (21 per cent), and new customers were being added very quickly. It
should also be stressed that Cell-C does carry a significant number of
inactive customers in its reported customer base numbers. Mobile data
services are currently generating approximately 5 percent of Cell-C’s
total revenues. The vast majority of this is SMS. With its focus on the
prepaid consumer market, it is not expected that Cell-C’s mobile data
service portfolio will match that of its competitors for the near future
(Finnie et al, 2003:128).

- 74 -
Cell C launched its own GPRS offering in June 2004. This service was
named smartdata and is available to their contract subscribers only.
Smartdata is competitively priced at cheaper rates than the other two
mobile cellular competitors, MTN and Vodacom. Cell C introduced three
tariff packages. They are the standard, personal and professional tariff
packages. The smartdata standard tariff package that has no
subscription charge and users are charged R25 per megabyte. The
personal package has a subscription fee of R15, with data charged at
R17 per megabyte. The professional package has a subscription fee of
R60 and data is charged at R12.50 per megabyte (Whitford, 4 June
2004). To promote the product, Cell C has offered one free megabyte of
data to all subscribers activating their smartdata until 31 January 2005.
Table 4.1 depicts the service and price comparison across the three
mobile networks for GPRS as at June 2004.
Table 4. 1 Comparison of GPRS service Cell C MTN Vodacom
Package Smartdata
Standard
Basic MyMeg 0
Monthly fee None None none
Cost /MB R25 R50 R45
Package Smartdata
Personal
2MB package MyMeg 1
Monthly fee R15 R50 R35
Cost /MB R17 R25 R35
Inclusive MB 2 MB 1MB
Package Smartdata
Professional
15MB package MyMeg 10
Monthly fee R60 R263 R200
Cost /MB R12.50 R17.50 R20
Inclusive MB 15 MB 10 MB
Source: Whitford, 4 June 2004

- 75 -
Czernowalow (2004) reports that on the 07-12-2004,Cell C unveiled a
bold strategy for future growth, that it would rollout 3G technology and
turn cash positive by the third quarter of 2005. Chairperson and CEO
Talaat Laham stressed that Cell C would remain focused on
competitiveness and that a more aggressive overall market to position
itself favourably against Vodacom and MTN would be pursued.
Laham in Czernowalow (2004) lists the following challenges that Cell C
will focus on:
• The potential SA mobile market is 8.5 million subscribers this is
according to the latest All Media and Products survey. This is what
Cell C will pursue to achieve the estimated revenue of R726
million a month.
• The big development poised to shake up the mobile industry in SA
is the introduction of mobile number portability (MNP). MNP will
allow subscribers to retain their numbers when changing mobile
service providers. Thereby giving customers increased choice in
terms of price, quality and service offering. MNP will also remove
a strong barrier to churn.
• Cell C is in the planning stage of 3G and will launch 3G in the
second half of 2005.
• Cell C is expecting to benefit from the introduction of the second
national operator (SNO) in 2005. Cell C have met with the major
SNO players about cooperation.
• Cell C five-year plan includes consolidating its base Cell C will
also focus on growing its post-paid base and improving the post-
paid mix.
• Cell C plans to acquire quality pre-paid subscribers. Cell C will
introduce stricter commissionable criteria, reduce channel
incentives and introduce a stricter churn policy.
Laham is not worried by being the last entrant into the SA mobile market
and with Cell C’s 12 per cent of market share. Laham argues that
international experience shows that the last entrants to a market are the

- 76 -
biggest beneficiaries and that more entrants to a market are a
prerequisite for a competitive market (Czernowalow, 2004).
4.2.2 Threat of new entrants
The issue of new mobile phone licenses and a change in
telecommunications policies will change the threat of new entrants into
the mobile data fields a reality. On 2 September 2004, the Minister of
Communications made a policy announcement which will come into
effect on 1 February 2005 and included the following:
• Value Added Network Service (VANS) providers will be able to
carry voice traffic using any protocol, including Voice over Internet
Protocol (VoIP)
• Mobile operators will be able to obtain their own fixed lines from
any licensed Public Switched Telecommunications Service
(PSTS) operator
• Any person may apply for a license to provide public pay phone
services in any area of South Africa.The major players will be
described here.
a. Sentech
Sentech, the state-owned broadcasting and telecom company, is set to
become SA’s fourth cellphone provider when it begins switching voice
traffic across its 3G cellular network from 1 February 2005. Sentech
offers always-on Internet access to consumers with its MyWireless
network. Sentech’s MyWireless network has been designed to carry
voice traffic. Sentech’s CEO, Sebiletso Mokone-Matabane says that
telecom prices in SA are obscene and that Sentech will undercut the
prices charged by other cellphone operators. If Sentech is able to launch
on 1 February 2005, it could be the first operator in SA to launch a
commercial 3G based voice network. In September 2004 MTN and
Vodacom were still testing the technology (McLeod, 10 September
2004).

- 77 -
b. Wireless Business Solutions
Wireless Business Solutions (WBS) is a black-owned South African
company established to provide mobile data network services to meet
corporate, government and domestic requirements. WBS has gained
vast knowledge and success by being the backbone network behind the
National Lottery, providing nationwide wireless data services covering 95
per cent of the population. WBS is now rolling out a commercial wireless
broadband data network using iBurst technology which can offer data
speeds of up to 1 megabit a second, roughly double the maximum speed
offered by Telkom and Sentech. Like cellular networks, iBurst will allow
the user to move from one cell of coverage to another without
interruption. This would allow WBS to act as a fourth cellular company
when restrictions on voice-over-internet services are lifted. In turn, MTN
and Vodacom are building high-speed data networks that will eventually
offer high-speed internet access with the cell phone. To date iBurst has
been deployed only in Australia. WBS has promised to cover 80 percent
of the population within three years of launch, a target it says is easily
achievable (De Wet, 2 August 2004).
WBS’s goal is to cover SA's commercial centres and commuter belts so
people traveling by car or by train can work without losing their
connection. Both WBS and Sentech aim to put up sufficient base stations
so people can connect wirelessly to the internet from a park, a shopping
mall or the street. As from February 2005, WBS will sell handsets that
users can plug into a laptop or desktop to call anywhere in the world over
the wireless network. The WBS service will be charged at a flat-rate of
R699 a month with a 24-month contract, including the laptop and desktop
connectivity sets. Users not wanting a contract can buy an iBurst laptop
card for R2100 or the desktop version for R2800, and pay R599 a month
for unlimited access (Anderson, 30 July 2004 ). Figure 4.1 depicts the
laptop card.

- 78 -
Figure 4. 1 iBurst laptop card
Source www.wbs.co.za
WBS claims it will liberate data communications in the same way the
mobile phone liberated voice telephony. WBS is a wholesale provider of
iBurst connectivity, concentrating on its strengths of establishing and
managing the infrastructure. It will rely on its channel partners to
disseminate the service to the community (www.wbs.co.za).
WBS partners are:
• ArrayComm, Inc. They are the world leader in smart antenna
technology. ArrayComm's patented IntelliCell™ technology,
based on fully adaptive smart antennas, creates dedicated
personal cells of voice or data for wireless subscribers.
ArrayComm licenses IntelliCell technology to manufacturers and
improves the cost, coverage and capacity of any personal
communications system. IntelliCell technology is installed in more
than 150 000 IntelliCell-equipped base stations worldwide, serving
more than 10 million people. IntelliCell technology is also the key
ingredient of ArrayComm's innovative iBurst™ Personal
Broadband System - the only wireless Internet access system that
offers the freedom of mobility with the high speed of DSL at
consumer pricing (www.wbs.co.za).

- 79 -
• Utstarcom. Founded in 1991 and headquartered in Alameda,
California, Utstarcom is a leading global provider of wireless and
wireline access and IP switching solutions. The company designs,
manufactures, sells, and installs an integrated suite of future-
ready access network and next-generation switching solutions.
Utstarcom's products provide a seamless migration from wireline
to wireless, from narrowband to broadband, and from circuit- to
packet-based networks by employing "Next Generation Network
Technology. Now." The company's customers include public
telecommunications service providers that operate wireless and
wireline voice and data networks in rapidly growing
communications markets around the world. Utstarcom is providing
WBS with its industry-leading Packet Data Serving Node (PDSN),
which serves as a gateway into the operator's IP network for
mobile subscribers (www.wbs.co.za).
• The Kyocera Group. This group is a leading supplier of solar
energy systems, telecommunications equipment, semiconductor
packages, electronic components, cameras, laser printers, copiers
and industrial ceramics. Kyocera has been co-developing next-
generation base stations with ArrayComm since 1998 and is one
of WBS's suppliers of iBurst base stations and user terminals
(www.wbs.co.za).
• Uunet. Uunet owns and operates a global IP backbone providing
connectivity in more than 125 countries, over 2,800 cities, on six
continents via more than 4,500 Pops. It is a mission-critical
communications provider for tens of thousands of businesses.
Uunet offers customers the fastest speeds available over IP today
has five global network operations centers around the world to
monitor network performance 24 hours a day, 365 days a year
(www.wbs.co.za).

- 80 -
c. Storm
Storm is a self-proclaimed leader in the development of communication
technology such as Voice over Internet protocol (VoIP). Storm products
and solutions include (www.storm.co.za) :
• least cost routing - international and cellular
• high speed Internet access - on demand & always on
• backup
• hosting - server & web
• managed networks
• additional services - sms mail; fax; domain name services.
According to Storm’s managing director Tim Wyatt-Gunning, the minister
of communication’s announcement opened new business avenues for
the company, which was built on the back of call-back telephony and
being an Internet service provider (ISP). Wyatt-Gunning adds that the
announcement allows Storm to continue to do so, at last unimpeded by
regulatory restraint with the eradication of any lingering doubt of illegality
once and for all. Storm can extend their range of services from
international and cell calls to include low-cost national calls and very low-
cost inter-branch calls for companies with several offices. Storm expects
to be able to offer those companies with permanent connectivity to Storm
using Diginet, Wireless and ADSL. This will result in savings of up to 70
per cent on international calls and 30 per cent on national calls. With
reduction in cost, Storm expects to see an increase in minute volumes.
Storm hosted a number of free seminars in Cape Town, Johannesburg
and Durban in November 2004 to assist their partners and customers to
learn about the potential impact of VOIP on communications costs and
general productivity levels (www.storm.co.za).
d. DataPro
DataPro is a niche telecommunications company and a Premier
Business Internet Service Provider and are therefore well positioned for
the future convergence of voice and data The company is currently rated

- 81 -
among the top four South African ISP's, it has a substantial client base,
one of the most advanced networks in the world and provides a basket of
voice and data communication products and services. The company is
structured across four operating divisions: Connectivity, Voice,
iCommerce, and Outsourced networking. The ISP division forms the
core, providing the platform to leverage off the convergence of voice and
data by accessing the Internet (www.datapro.co.za).
DataPro has been preparing itself for the convergence of voice and data
technologies. It has established VoxTelecom as the least-cost routing
and voice division of the DataPro Group. DataPro believes they are
perfectly positioned toward maximising the opportunities brought about
by the legalisation of VoIP. DataPro will take advantage of these
changes, and as they are focused in delivering innovative and cost-
effective solutions they have the ability to provide solutions that
incorporate both voice and data services. DataPro has listed on the AltX
Stock Exchange during October 2004 (www.datapro.co.za).
e. Tiscali /MWEB
In response to the announcements around the legalisation of VoIP,
Tiscali has commented that this development could not have come at a
better time. The company believes the news is exciting, and more so in
relation to Africa's growing economic development and the potential to
open its doors to the rest of the world, something previously only
hindered by legislative constraints (www.tiscali.co.za).
Tiscali entered into an agreement with MWEB, a South African ISP and a
subsidiary of MWEB Holdings (Pty), for the disposal of its South African
subsidiary Tiscali Pty Limited. The agreed consideration does not include
the cellular business, which will be the object of a separate transaction
expected to take place before year-end 2004. The price for the disposal
of the cellular business was expected to be over EUR 5 million (ITWeb,
24 August 2004). Tiscali South Africa sold its cellular business to
Vodacom Service Provider Company Pty Ltd. Further to earlier

- 82 -
announcements of the agreed sale of Tiscali SA, the cellular division has
been sold as a separate business. Tiscaly believes that Vodacom
Service Provider Company is a logical home for its cellular business, and
one that will ensure continued delivery of a high level of service and
support to the existing cellular customer base (ITWeb, 20 October 2004
online at www.itweb.co.za accessed 12-12-2004).
The announcement by the minister also ties in closely with Tiscali's value
proposition of being a voice and data service provider for mobile and
fixed-line access, with the market potential for voice services now
significantly expanded. Users will have more choice in terms of voice
providers and won't see Tiscali exclusively as a data service provider.
Tiscali has been actively following trends in the European market,
devoting much of its Research and Development spend to the
development of products and services to meet the VoIP eventuality when
it becomes official next year (www.tiscali.co.za).
f. Internet Solutions (IS)
IS claims they are focused on anticipating the needs of their customers
and that it is has an inventive spirit as part of its organisational culture.
Examples of its inventiveness are: When the Internet began to reveal
exciting new opportunities, IS were quick to identify them and introduce
solutions and services designed to help their customers seize them. IS
were first to market with security and hosting solutions. Realising the
substantial benefits to be gained by sharing secure infrastructures, IS
introduced the SA’s first switched Virtual Private Network (VPN) through
OmniLink in 1997. Their Virtual Remote Access service (VRAS) was yet
another IS breakthrough, as was the launch of the country’s first Multi-
Protocol Label Switching (MPLS) VPN in 2000. More recently, IS have
been at the forefront of bringing Web-based application services and
mobile solutions to market (www.is.co.za).
IS have partnerships with global technology providers. IS seek out and
build strong relationships with the world’s best vendors and carriers.

- 83 -
Companies like Microsoft, Cisco, Dell, HP, BT, Cable & Wireless and
AT&T as examples of their partners. IS’s view is to harness the power of
their partners’s market-leading products and infrastructure to construct
customised best-of-breed solutions for IS customers. To provide flexible
solutions that can be scaled to customers constantly changing
requirements. IS is expanding its services to the rest of Africa. IS states
that mobile communications and satellite technology have alleviated the
shortcomings of telecommunication and connectivity infrastructures
outside of South Africa.. They are at the forefront, harnessing these
wireless technologies as well as fibre optic solutions to make reliable
infrastructure and bandwidth readily available to enterprises with African
networks. Customers operating in countries on the west coast of Africa
can link up with the SAT-3 fibre optic cable. Customers in other countries
can connect via IS satellite service, offered in partnership with Transtel.
IS offers satellite-based VPN services with the same 24 hour monitoring
and support as their fixed line VPN services. IS’s mobile solutions are
capable of providing secure, reliable access to the corporate network
from remote areas of the continent (www.is.co.za).
g. MTN Network Solutions (MTN NS)
MTN Network Solutions (MTN NS) was formed by MTN Holdings and
Johnnic Communications to create a commercial Virtual Private Network
(VPN) offering and manage the integration, consolidation and
convergence of its IP networking interests. The company was launched
in 2001 after the purchase and enhancement of a first tier ISP (Internet
Service Provider). This acquisition allowed MTN NS to rapidly deploy an
MPLS VPN network with full Internet access. MTN Network Solutions is
positioned to harness the synergies between the Telecoms, Networking,
Media and Entertainment interests of its two shareholders bringing
together the IP networking and GSM worlds. MTN NS will be able to
facilitate the convergence of traditional networking, cellular networks and
the Internet. MTN Network Solutions operates and manages its own
national backbone network as well as its own international links.

- 84 -
MTN Network Solutions hosted a free VoIP seminar titled “VoIP - what
does this hold for corporates?”), on 19 October 2004 at the Sandton
Convention Centre, to discuss the implications and opportunities of VoIP
for the SA corporate market (ITWeb, 22 September 2004). The main
objectives of the seminar were to look at the:
• practical requirements for the implementation of this technology in
the corporate office.
• issue of IP phones, connecting the existing PABX, inter-branch
VOIP, least-cost routing, local break-out and international call
routing
• commercial aspects of VOIP and cover the regulatory issues,
surrounding these changes.
h. BIDVest Network Solutions
BIDVest Network Solutions (formerly I-Fusion), owns and operates its
own wide area voice and data network, which is built on the most current
Cisco platforms, using MPLS technology. The company provides a total
outsourced infrastructure solution with the main component being an
outsourced wide area network, complemented by the provision of
Internet, e-mail, server hosting, LAN management, desktop support,
monitoring, backup, archiving, recovery and call centre services.
BIDVest Network Solutions has been providing Voice-Over-Data services
for the past four years. The firm are one of the first VANS operators
deploying voice over data services to its customers who are mainly
corporates. It already provides full network solutions to many companies
in the BIDVest stable, including Rennies Travel, FedEx franchisee
myExpressCo and Safcor Panalpina, as well as companies outside the
BIDVest stable, such as the Value Group. It hosts and supports in
excess of 10 000 users with nodes in all major centres. There is a
BidVest presence in every airport and in most shopping centres in South
Africa. BidVest have a potential 500 wireless hotspots without the need
to negotiate a lease or establish telecommunication links. This large
footprint could extend BidVest Network Solutions existing infrastructure

- 85 -
to many millions of wireless Internet users. The provisioning of bandwidth
within their network is another opportunity which will reduce costs
(www.bidvest.co.za).
i. WaveStream
WaveStream, a wireless internet service provider (Wisp) owned by Clint
J Armstrong (an Internet Café owner 10 years ago), originated in
Bedfordview and is currently situated in Edenvale and Cape Town. The
company provides Internet access to schools and is involved in adult
education projects. WaveStream will be opening branches all over South
Africa (www.wavestream.co.za).
WaveStream says it will install a national WiMax network using licensed
frequency spectrum. Until now, WaveStream has used unlicensed
spectrum in the commercial industrial-scientific-medical (ISM) bands and
offered access to consumers using relatively short-range Wi-Fi
technology. Once it has deployed WiMax, WaveStream will stop using
Wi-Fi in its network. It has 19 Wi-Fi base stations, most of which service
Johannesburg. WaveStream will also use its new network to offer voice
telephony. It promises to offer its clients free in-province VoIP calls,
provided the calls terminate on its IP network (or potentially on any IP
network if interconnection agreements still to be concluded with other
VoIP operators allows this). National calls between VoIP clients on
WaveStream's network are expected to cost 25c/minute (compared with
Telkom's 99c/minute). Calls to the US will cost R1,30/minute (Telkom
charges R3,33/minute) (McLeod, 17 September 2004).
WaveStream provide the following services:
• wireless LAN (indoor)is a wireless LAN's within a building or office
complex
• wireless WAN (outdoor) is used to connect offices less than 50km
• outdoor bridging is used to connect offices more than 50 km apart.
WaveStream will provide the above options with hassle free networking
and voice telephony (www.wavestream.co.za).

- 86 -
j. Internet Company of South Africa (ICOZA)
ICOZA is well positioned, as a private sector tier one empowered ISP
initiative, to provide essential value added services. As a value-added
network service provider, ICOZA may carry voice using any protocol; and
may also provide services by means of telecommunications facilities
other than those provided by Telkom and the second national operator or
any of them. ICOZA has a joint venture with IS and the J & J group. The
J & J group is a strategic investment and management company with
interests in IT, financial services and diversified industrials
(www.icoza.co.za).
ICOZA welcomes the direct benefits envisaged by the minister
(www.icoza.co.za) which include:
• a more competitive ICT environment
• improved access to ICT infrastructure and services
• affordable telecommunications services
• a variety of choice in services being provided by the ICT sector to
meet both economic social needs of our society.
4.2.3 Threat of Substitutes
One of the biggest threats to Vodacom would be new technology
offerings that customers might perceive to be of a higher benefit or of
more value.
a. Wireless LAN
Wireless LAN (WLAN) is an example of such technologies. WLAN
access is only one of a number of 802.11 applications. WLAN access
will deliver mobile high-speed data access ahead of 3G. Several
technologies offer mobile access to data applications, either in
conjunction with mobile voice services like CDMA, GPRS, GSM, TDMA
and UMTS/3G or as a standalone data channel ,Ricochet (wireless
modems), Blackberry (two-way pagers) and Bluetooth. Figure 4.2 below

- 87 -
shows the transmission rate of each of these technologies and the types
of environment in which they can be used (Pienaar, Loureiro& Pretorius,
2002:4).
Figure 4. 2 Comparison of wireless Internet access technologies
Source: Public Wireless LAN Access: A Threat to Mobile Operators, Analysis Research, 2001
b. Wi-Fi
Wi-Fi is a wireless networking technology for PC’s and PDA’s enabling
multiple devices to share a single high-speed Internet connection over
about 100 m. Earlier in 2004, some SA companies began running Wi-Fi
networks in their offices, or, like Mugg & Bean, establishing hotspots in
public places (Vegter,2004).
Harris (July/August 2004:25 ) reports that at the beginning of 2004 the
number of Wi-Fi hotspots were:
• 13 000 in US
• 3 500 in UK

- 88 -
• 1 200 in Japan
• 2 300 in Germany
• 100 in SA.
At the time of Harris’s report the main obstacle was the fact that South
African companies and service providers had to use Telkom’s services
for backhaul connectivity. This fact explains the meagre 100 hotspots in
SA. Telkom rolled out ADSL and capped it to 3Gbytes. The minister’s
announcement on 2 September 2004 levels the playing field and more
Wi-Fi hotspots will emerge. Internet Solutions, MWEB and Airports
Company South Africa (ACSA) have announced a joined venture. This
venture will ensure that the companies, IS, MWEB and ACSA, develop
Wi-Fi hotspots at major, high-traffic retail and hospitality venues
throughout South Africa (Harris, July/August 2004:26).
Wi-Fi’s data rate is substantially higher than the fastest Mobile data, 3G
rate. Wi-Fi offers 11MBps whilst 3G only offers 384Kbps (Lehr and
McKnight, 2002).
c. WiMAX
Worldwide Interoperability for Microwave Access (WiMAX) offers higher
data rates than Wi-Fi, about 75 Mbps. Mobile networks offer full mobility,
nation-wide coverage voice support and moderate data rates. Public
WLAN,is limited in coverage and mobility capabilities. WiMAX circumvent
these limitations and offers broadband connectivity in larger areas, called
hotzones. WiMAX is used for long- range outdoor connections (Alcatel
Strategy White Paper available from www.alcatel.com. ).
A suite of industry players wants to make fixed-line data communications
wireless. These industry players have formulated WiMAX to achieve
fixed-line data communications for wireless and will also be able to do
voice communications through VoIP. This would result in WiMAX and
mobile data technologies competing for the same pool of users (Cellular-
news.com).
Intel, the world's largest chipmaker, and French telecommunications
equipment manufacturer Alcatel have agreed to jointly develop and

- 89 -
promote products for WiMAX. The alliance will deliver products by the
second half of 2005, the companies said in a statement. WiMAX offers
high-speed access to the Internet where wired connections are not
feasible (ITWeb,26 March 2004).
Intel President Paul Otellini said the company was on the brink of a
WiMax era. He continues to say that WiMax will be to DSL and cable
modems what cellular was to land-line phones. Knowing that, phone and
cellular companies have joined the 140-company WiMax Forum in hopes
of using the technology to fend off threats from others. “WiMax can be
used to either attack or defend someone's traditional turf in broadband
communications”, said Scott Richardson, general manager of Intel's
broadband wireless group. For example, an Internet service provider
could set up its own unlicensed WiMax service in a city and offer both
Internet and phone service through its network. Since the ISP would not
have paid high fees to license spectrum as the cell phone companies did,
the ISP might offer the service at lower rates. Similarly, cell phone
companies could set up WiMax service to compete with DSL or cable.
WiMax has been in the works for about three years, the product of
engineers who set out to develop standards for wireless broadband. Intel
began promoting WiMax as a way to solve the problem of the “last mile”,
the expensive gap between a home or office building and the broadband
network's central offices (Diaz & Takahashi, 4 October 2004).
Telkom announced a pilot of WiMAX. This was between Durban and
Pretoria. WiMAX will initially be designed not for mobility but for fixed
wireless access. It is likely to be priced like ADSL. It offers more flexible
bandwidth, and has a bigger range than competing technologies, up to
50 km from base stations (Vegter,2004)..
d. Stratelite
Sanswire Networks, a Atlanta Georgia company plans to launch the first
airship satellite (stratelite). Like satellites this airship will be able to
provide wireless broadband coverage akin to WiMAX. A single stratelite

- 90 -
could provide coverage over an area of about 800 000 square
kilometres, or about the size of Texas. It would thus be possible to create
hotzones of coverage encapsulating entire cities and their surrounding
countryside. Stratelites would be beneficial in countries with little or no
network infrastructure (www.economist.com, 2 December 2004).
4.2.4 Bargaining power of Buyers
Weidemann (9 November 2004) interviewed Tomi Ahonen, a 3G strategy
consultant on the topic of mobile data services and 3G. Ahonen listed the
target markets that will be addressed by mobile data services. They are
the high-end business sector, which requires rapid access to data and
the young, hip crowd that demands quality entertainment. Ahonen
suggests that operators should target the 20-something, employed,
technologically aware crowd. The target group are the people who will
probably have an advanced phone and will potentially want to own a
second one, which will likely be a 3G handset.
These target groups have a high bargaining power as they know what
they want and the different options of getting it. These buyers have the
power to make life a misery for companies if poor service or high costs
should be encountered. Examples of such behaviour are the Hello Peter
website (www.hellopeter.co.za) that acts as a vent for disgruntled
customers and the website aimed at Telkom for poor service and
complaints, Helkom (www.helkom.co.za).
High-end business users meet at various business gatherings and can
have a high bargaining power.
4.2.5 Bargaining power of Sellers
The majority of Vodacom’s network architecture is procured from Alcatel,
Motorola and Siemens. These are global companies with strong financial
and technological backing. Vodacom has chosen Siemens to supply their
3G network after a tender process. This way Vodacom chose the
strongest company and could negotiate prices and support. Vodacom
can replace a suppliers architecture if need be. According to R.

- 91 -
Skorbinsky (personal communication, 3 December 2004) Vodacom
replaced the Motorola network in Cape Town with Alcatel equipment
after a problem was encountered with Motorola equipment that was
substandard. The upgraded Motorola version was going to take to long to
be incorporated into the Vodacom network.
The bargaining power of suppliers for network architecture is not strong
because of the following:
• suppliers cannot raise their prices indiscriminately, prices are
set and a allowed increase is build into the contract
• suppliers cannot reduce quantities to be supplied, Vodacom
has a project management team in every region to monitor
and rebuke offenders
• there are a lot of substitutes
• the switching cost would be high, but in the long-term
suppliers would be hurt by this.
Vodacom has built strong relations with each of its suppliers and
have created a win-win condition.
4.3 SURVEYS
From the global network operator studies in chapter three, a crucial
point was the one of customer’s research. This research is
necessary to find out what products and services customers want.
From these results Vodacom can then improve and focus their
marketing efforts. Two types of surveys are conducted here and
from the results marketing strategies are developed. The two types
of surveys are focus groups and customer surveys. Knowledge
Based Systems (KBS), a division in Vodacom that does research
on various topics, conducted the focus group.
4.3.1 Focus Groups
Vodacom has started, on 10 August 2004, to conduct focus groups
with four of their corporate customers in order to gain a better
understanding of how corporate customers may find uses for 3G

- 92 -
and 3G-enabled products. The confidential report will be
disseminated to the 3G project manager from the Sales, Products
and Services Division (SPS). The SPS division requested the
conducting of this focus group so that they can have a mandate to
develop strategies to address the findings. Due to unforeseen
circumstances only two of the four focus groups took place.
Vodacom will continue the focus groups with the remaining two
corporate customers when the 3G network is operational.
The focus group process was in order of occurrence:
• welcome and brief introduction on what 3G is about
• demonstration of 3G capability, with 3G phone and Vodafone
data card
• group discussion
• topic one- current offering and use of data services
• topic two – 3G technology and applications
• topic three - changing the way you do business
• topic four – billing and packaging of 3G technology
• answer the quantitative questionnaire.
a. Findings of the focus group
The Vodacom corporate client’s responses to the quantitative
questionnaire are presented below. This section is a brief overview.
Refer to the Annexure A for the complete KBS report titled “Results of
the first round of 3G groups”. A brief overview of the findings is presented
in a sequential order and is extracted from the KBS report (10-08-2004).
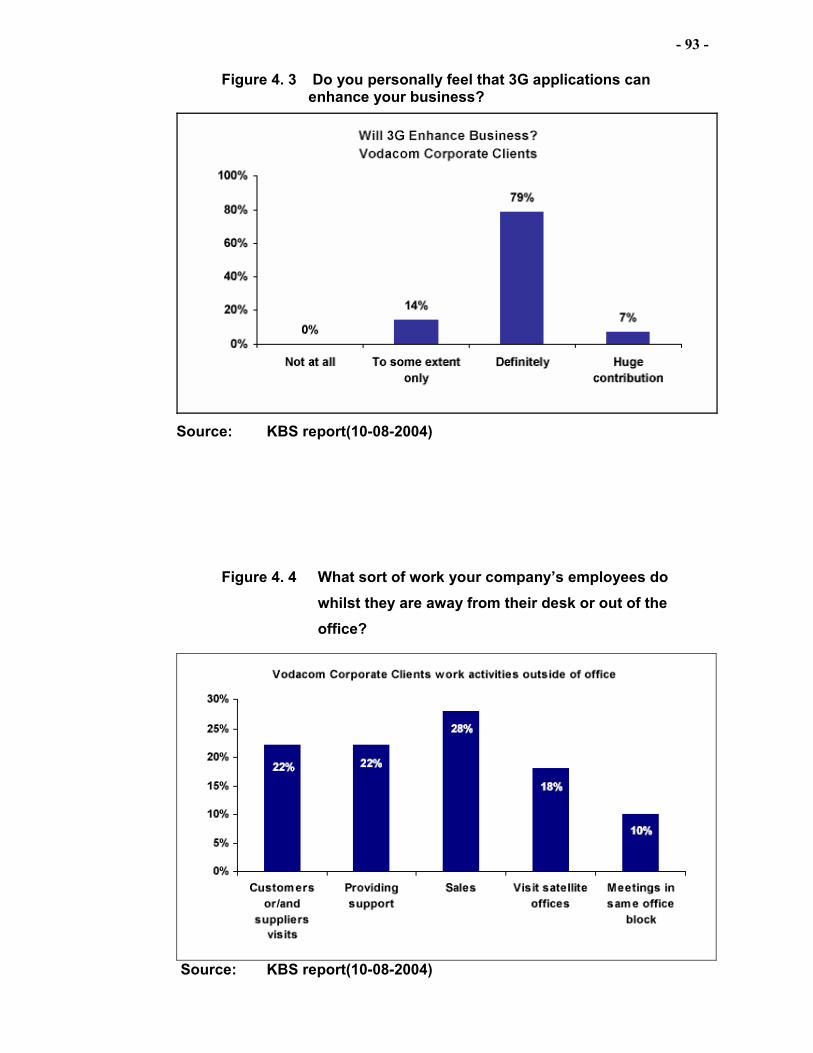
- 93 -
Figure 4. 3 Do you personally feel that 3G applications can enhance your business?
Source: KBS report(10-08-2004)
Figure 4. 4 What sort of work your company’s employees do whilst they are away from their desk or out of the office?
Source: KBS report(10-08-2004)

- 94 -
Figure 4. 5 In what locations are your mobile company’s employees using wireless (if any)?
Source: KBS report(10-08-2004)
Figure 4. 6 What are the problems that can arise (if any) when your mobile company’s employees work away from their desk or are out of the office?
Source: KBS report(10-08-2004)

- 95 -
Figure 4. 7 If you had a 3G Mobile Data card, how and when would you use your laptop, as opposed to your PDA/ handheld or other mobile phone devie?
Source: KBS report(10-08-2004)
Figure 4. 8 What are the advantages / disadvantages /trade offs you have between mobile devices?
Source: KBS report(10-08-2004)

- 96 -
Figure 4. 9 What are you particularly looking forward to about your company using the 3G devices?
Source: KBS report(10-08-2004)
Figure 4. 10 What are your main concerns about using 3G devices?
Source: KBS report(10-08-2004)

- 97 -
In synopsis Vodacom corporate clients responded as follows and in each
response the items are listed in order of importance:
• Feel that 3G will definitely enhance their business
• When away from their offices, they do sales, provide support and do
customers and suppliers visits
• The locations wireless are being used is, in hotels while in transit
• The problems encountered while away from office are they can not
run applications, unable to get important info and cant access email
• They would carry the 3G devices with their notebooks
• The trade offs between mobile devices are the applications available
and processing power
• They are looking forward to speed of data transfer and new work
styles
• Their main concerns are the cost impact, stability of connection and
application and coverage.
4.3.2 Customer Survey
Customer surveys are key marketing research instruments used to
understand what customers want. To make the company’s offerings
attractive, Vodacom will need to understand the importance and
significance of the preferences of their target consumers.
Companies around the world were asked what they thought a
mobile data product should offer. Their responses were (McGrath &
Axford: 2003):
• The need to connect their workers from anywhere, to the
Internet, to the office, for emails or anything needed
• It should be simple: They want an intuitive interface with no
technical complexity, quick to set up, easy to use and easy to
manage
• Security is paramount. Companies have strict corporate
security guidelines that cannot be broken
• The need for speed: A combination of performance and
reliability. Time is money. Dead time is lost forever

- 98 -
• They want support: Support is very important to companies.
It should be fast, reliable, responsive and wherever possible,
human
• Leverage existing investments and making it scaleable to
reduce cost and rollout times.
4.4 MARKETING STRATEGY
Of the three different strategy types described in chapter two,
Vodacom need to follow a strategy of development for its mobile
data service. Because Vodacom wants to introduce a new product,
3G, to existing customers in existing markets. A concentrated effort
will be used for the core target segments, with the goal of
maximising possible market share for each segment. The segments
are the high-end business users and the young, hip groups. GPRS
uptake in Vodacom was slow due to high pricing and poor support
for the product. This was alluded to in previous chapters. Vodacom
must make sure that the marketing mix for 3G is enhanced when
compared to GPRS. The key findings from the review of global
mobile operators in chapter three will be applied in a South African
context to Vodacom for mobile data service marketing.
4.5 Strategy Formulation: Marketing Mix
The components of a marketing mix, with reference to the
McDonald model summarised in table 2.3, which are product, price,
promotion and place will be described now. These four elements
constitutes the marketing strategy
4.5.1 Product
The new South African mobile data product must have different
features that provide customers with opportunities to chat, play
games, send and receive pictures, change ring tones, receive
information about travel and sporting events, obtain billing
information, view video clips and make video calls. These products

- 99 -
will be rolled out using Vodafone’s research and development
groups. The products must be adapted to suit the South African
culture. The content of these services must be changed to appeal to
South Africans. Different customers segments will want to use
different product services.
Alan Knott-Craig, chief executive for Vodacom, says that the
reception of mobile data could be an even bigger part of South
African’s lives than voice communication. Vodacom and its 35 per
cent shareholder, Vodafone, have joint forces to bring mobile data
to SA (Klein: 7 November 2004).
Vodacom must differentiate its data service with top of the range
products like the Blackberry. The Blackberry is a unique cellphone
combining easy access to e-mail, calendar and contacts, in an
innovative and stylish format (www.news24.com, 8 November
2004). Figure 4.3 illustrates the Blackberry device.
Figure 4. 11 BlackBerry 6210 Wireless Handheld
Source: RIM
4.5.2 Price
Ahonen (2002: 207) notes that tariffing has a bigger impact than
network dimensioning, sales provisions, handset subsidies or any
other decisions made relating to mobile services. Ahonen continues

- 100 -
by stating that the underlying premise for tariffing and segmentation
is that some customers are willing to spend more money for a
similar, sometimes identical service than others. This investigation
venture denotes that:
• Vodacom must ensure that its data services are accessible
and affordable to as many sectors as possible
• Vodacom must offer various tariffing structures to suit
different customer groups. The Vodacom data network
should be marketed for different users
• A service provider, like Vodacom must have the ability to
identify which customers are willing to pay more
• Vodacom must develop service categories, bundles, tariffs
and other means to enable charging more for some
customers, as this is a key to profitability
• Customers that are willing to pay more should be guaranteed
an exceptional quality service
• Vodacom must create various flexible means to maximise its
traffic and utilisation
• Vodacom must ensure that customers paying less do not
crowd out those willing to pay more.
Tariffing is crucial to profitability. A mixture of market research, tariff
modelling and adaptation will determine the right price (Ahonen,
2002: 214).
4.5.3 Promotion
Vodacom has proved its trustworthiness and good corporate
governance with the Nigerian debacle (Klein: 7 November 2004). In
Nigeria, Vodacom decided to terminate a multibillion rand
investment because of a bribe issue or “brokerage fees”. Vodacom
must use this good public image to its advantage when targeting
sectors and advertising mobile data services. This study propose
that:

- 101 -
• Vodacom must develop good public relations by distributing
press releases to national newspapers and magazines to
explain mobile data services
• A line like: “When we say we do, its forever”, would be
excellent. It would conjure up all the images of a church,
marriage, commitment and partnership. These images would
be all the elements Vodacom want associated with its mobile
data services
• Vodacom needs a public icon to communicate its brand
values. A world famous icon like Nelson Mandela would do
wonders for the mobile data services product
• The person introducing mobile data services must be famous
and liked
• The option of using one of the athletes that achieved gold in
the recent Olympics would be another option
• South Africa is a sport-loving country with different sport
types being followed by different groups. The seasonal sport
needs to be targeted as the medium to spread the brand
image and the message effectively
• Vodacom sponsors a local soap opera in South Africa. This
soap opera, Isigingo, can be used to show the functionality of
mobile data services. Vodacom should approach the writers
of the soap opera and request that a few episodes are
written around the function of 3G or GPRS
4.5.4 Place
The Vodacom Service Provider Company (VSP) and Vodacom
Customer Care franchise (VCC) have offices in all the regions. VSP
is responsible to look after and support all the service providers and
companies that sell Vodacom products. VCC are the place where
customers can take their broken devices to and lodge complaints.
VSP, VCC and all other providers interact with a number of
customers daily. This meeting should be exploited. This research
endeavour indicates that:

- 102 -
• Vodacom Sales, Product and Servicing Divisions should
provide an interactive service in all these venues where
customers are afforded the opportunity to research products
and where
• sales staff can demonstrate the capabilities of mobile data
service.
• Customers must be able to see and handle products they
consider buying.
• Support staff must ensure the customer’s needs are matched
with the right product.
• The different options available should also be explained.
4.6 Controls
Controls form part of McDonald’s phase four, resource allocation and
monitoring stage, in the marketing plan model. When Vodacom rolled out
GPRS, the weakness was that no controls were in place. This research
undertaking denotes that the following types of control be evident:
• annual plan control, to examine whether the planned results are
being achieved
• profitability control, to analyse where Vodacom is making and
losing money
• efficiency control, to evaluate and improve the spending efficiency
and impact of marketing expenditures and
• strategic controls,to examine whether Vodacom is pursuing its
best opportunities in markets, products and channels.
• Vodacom must put extra controls in place to make sure that its
marketing strategy of 3G achieves the specific targets.
From the literature it is apparent that forecasts and actual events are
never the same and controls closes the planning loop. Vodacom needs
to appoint a group to control and monitor the marketing of 3G in South
Africa. This group should work in collaboration with the Vodafone 3G
marketing group. Vodacom has so far just copied what Vodafone did in
Europe. The South African market is fairly conservative in the take-up of
new services such as data and streaming (Rotter, 29 January 2002). The

- 103 -
need to educate the market is key to counter this slow take-up of new
services. Even controls for educating the market should be in place.
4.7 SUMMARY
In this chapter competitor analysis, marketing strategies and
controls were discussed, as they would pertain to the marketing
plan for Vodacom to market mobile data services. Michael Porter’s
five forces model was used as a reference to discuss competitor
analysis. From the competitor analysis it becomes evident that
Vodacom need to be one step ahead of the competition in
developing new usages for mobile data. A marketing strategy was
compiled with specific referencing to the four P’s of marketing that
constitutes the marketing mix. This chapter concluded with the
element of marketing controls referred to in McDonald’s model as
measurement and review. Measurements and review form part of
phase four, the resource allocation and monitoring. All these
elements discussed are based on McDonald’s model portrayed in
Table 2.3.

- 104 -
CHAPTER FIVE
SUMMARY AND RECOMMENDATIONS 5.1 INTRODUCTION
This final chapter summarises the most important conclusions that can
be drawn and recommendations made from the research into the
development of a marketing plan of selected elements for mobile data
services
.
5.2 SUMMARY
The main problem identified to be resolved in this research was: “What is
the role of a market overview in gaining a competitive advantage and
developing an effective marketing strategy, as parts of a marketing plan,
for a cellular company such as Vodacom when selling data services?”
The motivation behind this study is that for Vodacom to successfully
market mobile data services in the fast changing and ever increasingly
competitive South African and global environment, they must be able to
immediately identify, respond to and adapt to such conditions ahead of
their competitors. In creating the correct marketing approach will
differentiate the winners from the losers. The competitor analysis and the
empirical study on global operators made the position that a market
overview play very pertinent. The market overview provided clear
direction into the strategy options, thereby resolving the main problem of
this research.
The basis for this research was a literature study to describe the key
components of a marketing plan, from where a model was chosen to
base the research on. The literature study was followed by an empirical
study of selected global mobile operators to identify core concepts and
what these operators did to successfully market mobile data services.
The researcher used the Internet, print media and Vodacom Knowledge

- 105 -
Based Systems (KBS) to complete this study. From the study, certain
conclusions were drawn.
The combination of the above provided the necessary ingredients for an
effective marketing plan consisting of the three selected elements, the
competitor analysis, the development of a marketing strategy and
controls for Vodacom. Marketing control is an area the researcher
believes is a short coming in Vodacom’s marketing approaches. The
researcher is of the opinion that if proper controls were in place with the
launch of GPRS it would have been more successful.
5.3 RECOMMENDATIONS
• Vodacom should invest in R&D not only for marketing new products
but also in developing them. Joint ventures with other operators,
suppliers and partners are important if Vodacom wants to survive with
al the alternate technologies being developed. The integration of
wireless LAN technology into the larger mobile fabric is key so that
users has wireless access via a number of technologies such as Wi-
Fi, WiMax, GPRS, 3G and EDGE. Users must be able to access
these technologies wherever and whenever they want or need it. The
intelligent use of the technology will enable Vodacom to maximize its
effectiveness and get value for money.
• Most of the network operators have targeted post-paid subscribers for
mobile data services. Only the network, 3, has targeted pre-paid
customers. In South Africa, most of the networks subscribers are pre-
paid. This means that a big percentage of subscribers would not have
access to mobile data services. Vodacom should be the first South
African company to make all mobile data services available to pre-
paid subscribers.
• Vodacom and Vodafone use the Vodafone Mobile Connect data card.
This is a card that only fits in a notebook PC. A recommendation is to
develop a card that fits in a desktop PC. Subscribers that only have a

- 106 -
desktop PC will then have access to the 3G and GPRS technologies.
This could be a segment that proves to be valuable.
• In magazines over the last year (2004) several viruses and worms
was created to target smart phones. NTT DoCoMo has already
promised its subscribers security and antivirus packages. Vodacom
needs to follow their example and commit to subscriber devices being
safe and virus free whatever the risk. This would be another project
for the R&D and joint partnership teams.
• ITWeb (21 December 2004) reported that mobile radiation harms
DNA. At the end of the article they say that the tests did not prove the
statement, but more tests were needed prove or disprove it. ITWeb
further states that previous independent studies have found
cellphones may have some side effects like headache and nausea.
They suggested that subscribers use handsets and walk-and-talk kits
instead of putting the phone to their ear. Vodacom can use the mobile
radiation threat to their advantage by suggesting that video calls,
using a data card or cellphone, will reduce the risk as it is far away
from the users ear.
• Vodacom didn’t fare to well in their marketing of GPRS. The
researcher wants to recommend that 3G be used as the new angle to
sell all mobile data services. 3G will only be available in selected
areas as described earlier, but GPRS is available across the country.
• In the study of the global operators it was evident that they had strong
research and development teams in place with the launch of new
products. Vodacom does not have a section or department that does
research and development (R&D). This is a weakness and Vodacom
could perform better if it understands and knows its customers and
what they want. Vodacom has a KBS department that does some
research. This department must be expanded to cover marketing and
special projects like 3G. This new marketing research and
development team must link up with the global marketing teams of

- 107 -
Vodafone to use its R&D knowledge. This SA R&D team must also
educate and inform the public via different media mediums about
Vodacom’s mobile data products. This will help the market to realise
the benefits that can be gained by acquiring the product.
• The lesson Vodacom can learn from NTT DoCoMo is the one of value
chain. Vodacom must use this collaboration model to put the four
entities together that will create this value chain. The four entities will
be Vodacom, platform vendors, handset vendors and content
providers. Where possible these must be South African companies
that understand what content and functionality is required. This
collaboration model must be used when Vodacom looks for joint
partnerships with other South African companies. Vodacom must use
its ownership power in Tiscali to influence and create content that
South Africans will want and pay for.
• Empower staff to look for marketing and selling opportunities, offering
them a percentage of any additional income.
• The researcher wants to make the following recommendations for a
marketing strategy:
- categorise potential subscribers, and for each category
focus on desired content
- launch with all the content the market wants, from the very
first day
- for the business segment, this is secure and rapid links into
commercial intranets
- for the household segment, high-speed access to the
diverse riches of the Internet
- live videophone, SMS and creative information and
entertainment services
- keep on adding new post-launch content in each category
at regular intervals
- add interactive games, gambling, and local weather and
shopping sites

- 108 -
- develop a simple and secure billing and micropayment system.
5.4 FURTHER RESEARCH
This research had an exploratory nature and its focused was on
developing selected elements of a marketing plan. All the study
objectives have been achieved. The following research are suggested:
• A study to develop a full marketing plan for mobile data services,
using the market overview and marketing mix as basis for this new
research.
• To develop a similar marketing plan for Vodacom’s African
ventures to gain a competitive advantage.
• To repeat this study after the second national operator have
started their network to see what impact they would have on the
mobile data market.
• A research on developing a marketing plan for Vodacom in
November 2005, when all the licensing and regulatory issues in
the South African telecommunications market have been resolved.

- 109 -
REFERENCE LIST:
Ahonen, T. 2002. m-Profits: Making money from 3G services. West Sussex:
John Wiley.
Alberts, C. & Ashford, W. 1 November 2003. Slow update masks mobile data
push. IT Web (online) available from www.itweb.co.za (accessed 22-11-
2003).
Anderson, B. 30-7-2004. New broadband operator. (online) available from
http://m1.mny.co.za/BBStks.nsf/0/C2256A2A0053166642256EE10054C27C?O
penDocument (accessed 12-12-2004).
Czernowalow, M. 08-12-2004.CellC’s bold growth vision includes 3G. (Online)
available from www.engineeringnews.co.za(accessed 15-12-2004).
Christopher, M., Payne, A. & Ballantyne, D. 1991. Relationship marketing.
Butterworth: Heinemann.
De Wet, P. 2-08-2004. New Wireless Internet Providers Bursts on to market.
(online) available from www. Wbs.co.za (accessed 12-12-2004).
Diaz,S. & Takahashi, D. 4 October 2004,Taking WiFi to the Max.(Online)
available from www.siliconvalley.com (accessed 4-11-2004).
Dibb,S. & Simkin,L. 1996. The market segmentation workbook Target marketing
for marketing managers. New York: Routledge.
Finnie,G., Lewis, C., Lonergan,D., Mendler,C.& Northfield,D. 2003,The Yankee
Report.(Online) available from www. doc.gov.za accessed on 20-10-2004.
Furlong, C. B. 1993. Marketing for keeps: Building your business by retaining
your customers. United States of America: John Wiley.
Gerson,R.F. 1991.Writing and implementing a marketing plan A guide for small
business owners. California: Crisp.

- 110 -
Greenley, G.E. 1987. An exposition of empirical research into marketing
planning. Journal of Marketing Management, 3 (1), 83 –12.
Handy, C. 1994. Making sense of the future. London: Hutchinson.
Harris, L. Cool welcome for Wi-Fi hotspots, South African Wireles
Communications, 9 (2), 25.
Henten, A.,Olesen, H.,Saugstrup,D. &Tan,S.2004. Mobile communications:
Europe, Japan and South Korea in a comparative perspective. Journal of
Info 6 (3) 197-207.
Hill, C.W.L. 2003. International Business - Competing in the global marketplace
(4th ed.). New York: McGraw-Hill/Irwin.
Hooper, M.,2003. Marketing Data Services-Getting it right (Online) available
from www.telecoms.com.
Hutton, A. 2000. The definitive guide to marketing planning. Glasgow:Prentice
Hall.
Intel, Alcatel in broadband wireless pact, 26 March 2004, ITWeb (Online)
available from www.itweb.co.za (accessed 4-11-2004).
Johnson, G. & Scholes, K. 2002. Exploring corporate strategy (6th ed.). Europe:
Prentice-Hall.
Kelley, E.J. 1972. Marketing planning and competitive strategy. Englewood
Cliffs, NJ: Prentice-Hall.
Klein, M. 7 November 2004. Linkup may open doors. Sunday Times, Business
Times.
- 111 -
Kotler, P. 2000. Marketing management. The millennium edition. New Jersey:
Prentice Hall.
Kotler, P. & Armstrong, G.1996. Principles of marketing (7th ed.). Englewood
Cliffs, NJ: Prentice-Hall.
Lamb, C.W. & Hair, J.F. & McDaniel, C. 1998. Marketing (4th ed.). Cincinnati,
Ohio: South-Western Publishing.
Leedy, P.D.& Ormrod,J. E. 2001. Practical Research: Planning and Design (7th
ed.). Upper Saddle River, New Jersey: Prentice-Hall.
Lehr,W. & McKnight,L. 2002. Wireless Internet Access: 3G vs. Wi-Fi? (Online)
available from http://itc.mit.edu (accessed 3-11-2004).
LeRoux, H. 10-12-2004. 3G before Christmas. (Online) available from
www.engineeringnews.co.za(accessed 15-12-2004).
Lünsche, S. 2-12-2004.The Edge promises to bring greater speed and quality.
Financial Mail ( Online) available from www.fm.co.za (accessed 15-12-2004).
Masango, G. 19 September 2003. Margins for cellular looks bleaker. Business
Day.
McDaniel, S. The Seven Habits Of Highly Effective Marketers, Public Roads
Nov/Dec98, 62 (3).
McDonald, M.2002. Marketing Plans How to prepare them, how to use
them.(5th ed) Oxford: Butterworth.
McDonald, M.H.B. & Tideman, C.C.S. 1993. Retail marketing plans. Jordan Hill,
Oxford: Butterworth-Heinemann.
McGrath,A. & Axford,A. 21 February 2003. The business benefits from using
mobile data, GSM World Congress, Cannes.

- 112 -
McKeran, D.1990. Planning for Growth. London: Mercury Books.
McLeod, D. 10 September 2004. SA to get fourth cell operator. Financial mail.
McLeod, D. 17 September 2004. Local loop competitors line up to tackle phone
market. Financial mail.
Mobile Phone radiation harms DNA-New study, 21 December 2004. ITWeb
(Online) available from www.itweb.co.za (accessed 23-12-2004).
MTN Annual Results: 2004 (Online) available from www.mtn.co.za (accessed 3-
9-2004).
MTN SA “Ready for 3G when the market is” South African Wireless
Communications, 9 (2), 12.
Mzolo, S. 9 November 2004. New Vodacom Arrival, (Online) available from
www.finance2.com (accessed 25-11-2004).
New cellular network in a class of its own. Business Day. 11-11-2004
Not quite out of this world, 2 December 2004. (Online) available from
www.economist.com (accessed 8-12-2004).
Pienaar, M. 01-07-2004. Competitor Information Report-Mobile Network
Operator Marketing Strategies. Vodacom KBS report.
Pienaar, M.,Loureiro, J.& Pretorius, U. 14-06-2002. A research report on
WLAN’s. Vodacom KBS report.
Piercy, N. 1997. Market-led strategic change Transforming the process of going
to market ( 2nd ed.) Oxford:Butterworth.
Pophal, L. 2. Marketing plans work. Communication World, 17 (7), 2002.

- 113 -
Porter, M.E.1990. The competitive advantage of nations. Houndmills:
Macmillan.
Prahalad, C.K. 1997. Strategies for growth. In R.Gibson (Eds.) Rethinking the
future. (pp. 63 - 75). London: Nicholas Brealey.
Research Report – Analysys: Public Wireless LAN Access: A Threat to Mobile
Operators? (Online) available from http://research.analysys.com (accessed
12-12-2004).
Results from the first round of 3G groups. 10-08-2004. Vodacom KBS report.
Rotter, M. 29-01-2002. The hurdles facing 3G in SA. ITWeb (online) available
from www.itweb.co.za (accessed 20-10-2004)
Royal, W.F. 1995. Marketing with a plan. Sales & Marketing Management, 147
(1), 12.
Sale of Tiscali Cellular Division signed. 20-10-2004 ITWeb (online) at
www.itweb.co.za (accessed 12-12-2004).
Stones, L. 26 September 2003. MTN, Vodacom braced for turf war in Nigeria.
Business Day.
The Journal of Policy, Regulation and Strategy for Telecommunications
information and media: 2,7. Competition in Cellular markets.
Vegter,I. 3 December 2004. Wireless networking – a fountain is uncapped.
Financial Mail.
Vodacom Group Annual Results: 2004 (Online) available from
www.vodacom.net (accessed 3-9-2004).

- 114 -
Watch the Boks score their tries, 13 September 2004,Business Day
(Online)available from www.vodacom.net (accessed 3-9-2004).
Weidemann, R. 9 November 2004, 3G can only be good for Africa. ITWeb
(Online) available from www.itweb.co.za (accessed 25-11-2004).
Westwood, J. 1996. The Marketing Plan A practitioners guide. Polmont.
England:Palimpsestt.
Whitford, S. 4-06-2004. Cell C debuts GPRS. IT WEB. (Online) available from
www.itweb.co.za (accessed 7-10-2004).
Whitford, S. 24-06-2004. MTN downplays 3G hopes. IT WEB. (Online) available
from www.itweb.co.za (accessed 7-10-2004).
Winchester, J. & Manning, L 1997. So what’s the plan? Sales & Marketing
Management, 149 (11), 72.
Wood, M. B. 2003. The marketing Plan: a handbook. Upper Saddle
River,NJ,Prentise Hall.