The Market for Fake Reviews
77
The Market for Fake Reviews Sherry He Anderson School of Management UCLA * Brett Hollenbeck Anderson School of Management UCLA † Davide Proserpio Marshall School of Business USC ‡ August, 2021 § * [email protected] † [email protected] ‡ [email protected] § Authors listed in alphabetical order. Corresponding author: Brett Hollenbeck. We thank the Morrison Center for Marketing Analytics for generous funding. We also thank Elizabeth Paz, Jason Lei, Yoon Sang Moon, and Rachel Ziffer for excellent research assistance and seminar participants at the Duke University Fuqua School of Business, Frankfurt School of Finance & Management, Kel- logg School of Management at Northwestern, Olin Business School at Washington University in St Louis, Singapore Management University, Stanford Graduate School of Business, D’Amore-McKim School of Business at Northeastern, USC Marshall marketing workshop, UCLA Anderson marketing workshop, Virtual Quant Marketing Seminar, 2020 Conference on Digital Experimentation at MIT, 2020 WISE Conference, and the Toulouse Conference on Digital Economics for helpful suggestions.
Transcript of The Market for Fake Reviews

The Market for Fake Reviews
Sherry HeAnderson School of Management
UCLA∗
Brett HollenbeckAnderson School of Management
UCLA†
Davide ProserpioMarshall School of Business
USC‡
August, 2021 §
∗[email protected]†[email protected]‡[email protected]§Authors listed in alphabetical order. Corresponding author: Brett Hollenbeck. We thank the
Morrison Center for Marketing Analytics for generous funding. We also thank Elizabeth Paz, JasonLei, Yoon Sang Moon, and Rachel Ziffer for excellent research assistance and seminar participantsat the Duke University Fuqua School of Business, Frankfurt School of Finance & Management, Kel-logg School of Management at Northwestern, Olin Business School at Washington University in StLouis, Singapore Management University, Stanford Graduate School of Business, D’Amore-McKimSchool of Business at Northeastern, USC Marshall marketing workshop, UCLA Anderson marketingworkshop, Virtual Quant Marketing Seminar, 2020 Conference on Digital Experimentation at MIT,2020 WISE Conference, and the Toulouse Conference on Digital Economics for helpful suggestions.

Abstract
We study the market for fake product reviews on Amazon.com. These reviews are purchasedin large private internet groups on Facebook and other sites. We hand collect data on thesemarkets to understand what products buy fake reviews and then collect a panel of dataon these products’ ratings and reviews on Amazon, as well as their sales rank, advertising,and pricing policies. We find that a wide array of products purchase fake reviews, includingproducts with many reviews and high average ratings. Buying fake reviews on Facebook isassociated with a significant but short-term increase in average rating and number of reviews.We exploit a sharp but temporary policy shift by Amazon to show that rating manipulationhas a large causal effect on sales. Finally, we examine whether rating manipulation harmsconsumers or whether it is mostly used by high-quality or young products in a manner akinto advertising. We find that after firms stop buying fake reviews, their average ratings falland the share of one-star reviews increases significantly, particularly for young products,indicating rating manipulation is mostly used by low-quality products and is deceiving andharming consumers.

1 Introduction
Online markets have from their first days struggled to deal with malicious actors. These
include consumer scams, piracy, counterfeit products, malware, viruses, and spam. And yet
online platforms have become some of the world’s largest companies in part by effectively
limiting these malicious actors and retaining consumer trust. The economics of these plat-
forms suggest a difficult trade-off between opening the platform to outside actors such as
third-party developers and sellers and retaining strict control over access to and use of the
platform. Preventing deceptive or fraudulent actions is key to this trade-off. Third-party
participants may have strong incentives to manipulate platforms, such as increasing their
visibility in search rankings via fake downloads (Li et al., 2016), increasing revenue via bot-
driven advertising impressions (Wilbur and Zhu, 2009; Gordon et al., 2021), manipulating
social network influence with fake followers, manipulating auction outcomes, defrauding con-
sumers with false advertising claims (Rao and Wang, 2017; Chiou and Tucker, 2018; Rao,
2021), or manipulating their seller reputation with fake reviews (Mayzlin et al., 2014; Luca
and Zervas, 2016).
We study this last form of deception or fraudulent activity: the widespread purchasing of
fake product reviews. Fake reviews may be particularly harmful because they not only de-
ceive consumers into purchasing products that may be of low quality, but they also erode the
long-term trust in the review platforms that is crucial for online markets to flourish (Cabral
and Hortacsu, 2010; Einav et al., 2016; Tadelis, 2016). Therefore, if user feedback and prod-
uct reviews are not trustworthy, in addition to consumers being harmed, platform values
may suffer as well.
We study the effect of rating manipulation on seller outcomes, consumer welfare, and
platform value. Despite this practice being unlawful, we document the existence of a large
1

and fast-moving online market for fake reviews.1 This market features sellers posting in
private online groups to promote their products and solicit willing customers to purchase
them and leave positive reviews in exchange for compensation.2 These groups exist for
many online retailers, including Walmart and Wayfair, but we focus on Amazon because
it is the largest and most developed market. We collect data from this market by sending
research assistants into these groups to document what products are buying fake reviews
and the duration of these promotions. We then carefully track these products’ outcomes on
Amazon.com, including posted reviews, average ratings, prices, and sales rank. This is the
first data of this kind, in that it provides direct evidence on both the fake reviews themselves
and on detailed firm outcomes from buying fake reviews.
In general, because consumers value trustworthy information and e-commerce platforms
value having good reputations, their incentives should be aligned in that they both want
to avoid fake reviews. However, this may not always be the case. In particular, platforms
may benefit from allowing fake positive reviews if these reviews increase their revenue by
generating sales or allowing for higher prices. It may also be the case that fraudulent reviews
are not misleading in the aggregate if higher quality firms are more likely to purchase them
than lower quality firms. They could be an efficient method for high-quality sellers to solve
the “cold-start” problem and establish reputations. Indeed, Dellarocas (2006) shows that this
is a potential equilibrium outcome. In an extension of the signal-jamming literature on how
firms can manipulate strategic variables to distort beliefs, he shows that fake reviews are
mainly purchased by high-quality sellers and, therefore, increase market information under1The FTC has brought cases against firms alleged to have posted fake reviews, in-
cluding a case against a weight-loss supplement firm buying fake reviews on Amazonin February 2019. See: https://www.ftc.gov/news-events/press-releases/2019/02/ftc-brings-first-case-challenging-fake-paid-reviews-independent.On May 22, 2020, toward the end of our data collection window, the UK Competition and Mar-kets Authority (CMA) announced it was opening an investigation into these practices. See:https://www.gov.uk/government/news/cma-investigates-misleading-online-reviews.
2This practice is closely related to the use of incentivized reviews. The requirement that the reviews bepositive to receive payment and the lack of disclosure are how we differentiate “fake” reviews from “incen-tivized” reviews. In the latter case, sellers offer discounted or free products to potential reviewers in exchangefor posting an informative review. While incentivized reviews have raised concerns as well since they maybe biased upward, in principle, they can allow for authentic feedback and typically involve disclosure.
2

the condition that demand increases convexly with respect to user rating. Due to the way
ratings influence product rankings in search results in competitive markets, it is plausible
that this property may hold. Other attempts to model fake reviews have also concluded
these may benefit consumers and markets (Glazer et al., 2020; Yasui, 2020). The mechanism
is different, but this outcome is similar to signaling models of advertising for experience
goods. Nelson (1970) and later Milgrom and Roberts (1986) show that separating equilibria
exist where higher quality firms are more likely to advertise because the returns from doing so
are higher for them. This is because they expect repeat business or positive word-of-mouth
once consumers have discovered their true quality. Both Wu and Geylani (2020) and Rhodes
and Wilson (2018) study models of deceptive advertising and conclude that this practice
can benefit consumers under the right conditions. To the extent that fake reviews generate
sales, which generate future organic ratings, a similar dynamic may play out in our setting.
In this case, fake reviews may be seen as harmless substitutes for advertising rather than
as malicious. It is therefore an empirical question whether firms and regulators should view
rating manipulation as representing a significant threat to consumer welfare.
Our research objective is to answer a set of currently unsettled questions about online
rating manipulation. How does this market work, in particular, what are the costs and
benefits to sellers from buying fake reviews? What types of products buy fake reviews? How
effective are they at increasing sales? Does rating manipulation ultimately harm consumers
or are they mainly used by high quality products? That is, should they be seen more like
advertising or outright fraud? Do fake reviews lead to a self-sustaining increase in sales and
organic ratings? These questions can be directly answered using the unique panel nature of
our data.
Using a team of research assistants, we construct a sample of approximately 1, 500 prod-
ucts observed soliciting fake reviews over a nine-month period. We might expect these
products to be new products with very few reviews or else low-quality products with very
low ratings from organic reviews that must be countered with fake positive reviews. Instead,
3

we find a wide assortment of product types in many categories, including many products with
a very large number of reviews at the time we first observe them buying fake reviews. These
products also tend not to have especially low ratings, with an average rating slightly higher
than comparable products. Almost none of the sellers purchasing reviews in these markets
are well-known brands, consistent with research showing that online reviews are more effec-
tive and more important for small independent firms than for brand name firms (Hollenbeck,
2018).
We then track the outcomes of these products before and after the buying of fake reviews
using data collected from Amazon. In the weeks after they purchase fake reviews, the
number of reviews posted per week roughly doubles. Their average rating and share of
five-star reviews also increase substantially. We also observe a substantial increase in search
position and sales rank at this time. The increase in average ratings is short-lived, with
ratings falling back to the previous level within two to four weeks, but the increase in the
weekly number of reviews, sales rank, and position in search listings remains substantially
higher more than four weeks later. We also track the long-term outcomes associated with the
rating manipulation. We track outcomes after the last observed post soliciting fake reviews
and find that the increase in sales is not self-sustaining. Sales fall significantly after the fake
review campaign ends. New products with few reviews, which might be using fake reviews
efficiently to solve the cold-start problem, see a larger increase in sales initially but a similar
drop-off afterward.
We also document how the platform regulates fake reviews. We see that Amazon ulti-
mately deletes a very large share of reviews. For the products in our data observed buying
fake reviews, roughly half of their reviews are eventually deleted. The deletions seem well
targeted, but they occur with an average lag of over 100 days, thus allowing the short-term
boost in ratings, reviews, and sales that we document.
Next, we leverage these deletions to measure the causal effect of fake reviews on sales.
Our previous results are descriptive only, and the increase in sales we document could be
4

attributed in part to factors other than fake reviews, include unobserved demand shocks,
advertising, or price cuts. To isolate the effect of rating manipulation on sales, we take
advantage of a short period in which Amazon mass deletes a large number of reviews. Prod-
ucts that purchased fake reviews just before this period do not receive the boost in positive
reviews as other products that bought fake reviews, but they behave similarly otherwise,
allowing us to use these products as a control group. Comparing outcomes across products,
we find that rating manipulation causes a significant increase in sales rank.
Lastly, we track reviews and ratings after the fake review purchases end to provide ev-
idence of potential consumer harm. If the products continue to receive high ratings from
consumers after they stop buying reviews, it would suggest the fake reviews are more akin
to advertising and are mainly bought by high quality products, potentially to solve a cold-
start problem. In this case, consumers may not be harmed and the platform might not
want to regulate fake reviews too strictly. If, by contrast, their ratings fall and they begin
to receive many one-star ratings, it suggests that these consumers have been deceived into
buying products whose true quality was lower than they expected at the time of purchase
and, therefore, they overpaid or missed out on a higher quality alternative. While there is an
inherent limitation in using ratings to infer welfare, we nevertheless find that the evidence
primarily supports the consumer harm view. The share of reviews that are one-star increases
substantially after fake review purchases, relative to before. This pattern also holds for new
products and those with few reviews. Text analysis confirms that these one-star reviews are
distinctive and place a greater focus on product quality.
Prior studies of fake reviews include Mayzlin et al. (2014), who argue that in the hotel
industry, independent hotels with single-unit owners have a higher net gain from manipu-
lating reviews. They then compare the distribution of reviews for these hotels on Expedia
and TripAdvisor and find evidence consistent with review manipulation. Luca and Zervas
(2016) use Yelp’s review filtering algorithm as a proxy for fake reviews and find that these
reviews are more common on pages for firms with low ratings, independent restaurants, and
5

restaurants with more close competitors. Anderson and Simester (2014) show examples of a
different type of fake review: customers rating apparel products on a brand site who never
purchased those products. Using lab experiments, Ananthakrishnan et al. (2020) show that
a policy of flagging fake reviews but leaving them posted can increase consumer trust in a
platform.
We contribute to this literature in two primary ways. First, we document the actual
market where fake reviews are purchased and characterize the sellers participating in this
market. This data gives us a direct look at rating manipulation, rather than merely inferring
their existence. Second, we observe firm outcomes both before and after they purchase
fake reviews. This allows us to understand the short- and long-term effectiveness of rating
manipulation and assess whether and when consumers are harmed by them.
This research also contributes to the broader academic study of online reviews and rep-
utation. By now, it is well understood that online reviews affect firm outcomes and improve
the functioning of online markets (see Tadelis (2016) for a review). There is also a growing
body of research showing that firms take actions to respond to online reviews, including by
leaving responses directly on review sites (Proserpio and Zervas, 2016) and changing their
advertising strategy (Hollenbeck et al., 2019). A difficult tension has always existed in the
literature on online reviews, coming from the fact that the reviews and ratings being studied
may be manipulated by sellers. By documenting the types of sellers purchasing fake reviews
and the size and timing of their effects on ratings and reviews, we provide guidance to future
researchers on how to determine whether review manipulation is likely in their setting.
Finally, we contribute to the literature on fraudulent activity in marketing. This research
studies practices such as fake news on social media (Chiou and Tucker, 2018), and deceptive
online advertising (Rao, 2021; Wu and Geylani, 2020). The theoretical literature on deceptive
practices has emphasized that there are generally conditions when these might make markets
more efficient and possibly even benefit consumers (Dellarocas, 2006; Rhodes and Wilson,
2018). Therefore, it is up to empirical researchers to document the use of fraudulent practices
6

to inform the debate on how regulators and firms should respond to these practices.
The rest of the paper proceeds as follows: Section 2 describes our data collection proce-
dure and the settings of our paper; Section 3 presents a discussion of the costs and benefits
of buying fake reviews; Section 4 presents descriptive results on the short term changes in
outcomes like average ratings, number of reviews, and sales rank in the weeks following the
buying of fake reviews, the long-term changes in these variables, and Amazon’s response
to fake reviews; Section 5 estimates the causal effect of fake reviews on sales; Section 6
documents evidence that consumers feel harmed or deceived after purchasing fake review
products; and, finally, Section 7 discusses our findings and provides concluding remarks.
2 Data and Settings
In this section, we document the existence and nature of online markets for fake reviews and
discuss in detail the data collection process and the data we obtained to study fake reviews
and their effect on seller outcomes, consumer welfare, and platform value. Specifically, we
collected data mainly from two different sources, Facebook and Amazon. From Facebook,
we obtained data about sellers and products buying fake reviews, while from Amazon we
collect product information such as reviews, ratings, and sales rank data.
2.1 Facebook Groups and Data
Facebook is one of the major platforms that Amazon sellers use to recruit fake reviewers. To
do so, Amazon sellers create private Facebook groups where they promote their products by
soliciting users to purchase their products and leave a five-star review in exchange for a full
refund (and in some cases an additional payment). Discovering these groups is straightfor-
ward for interested reviewers; it only requires using the Facebook search engine to retrieve
a list of them by searching for “Amazon Review.” We begin by documenting the nature of
these markets and then describe how we collect product information from them.
7
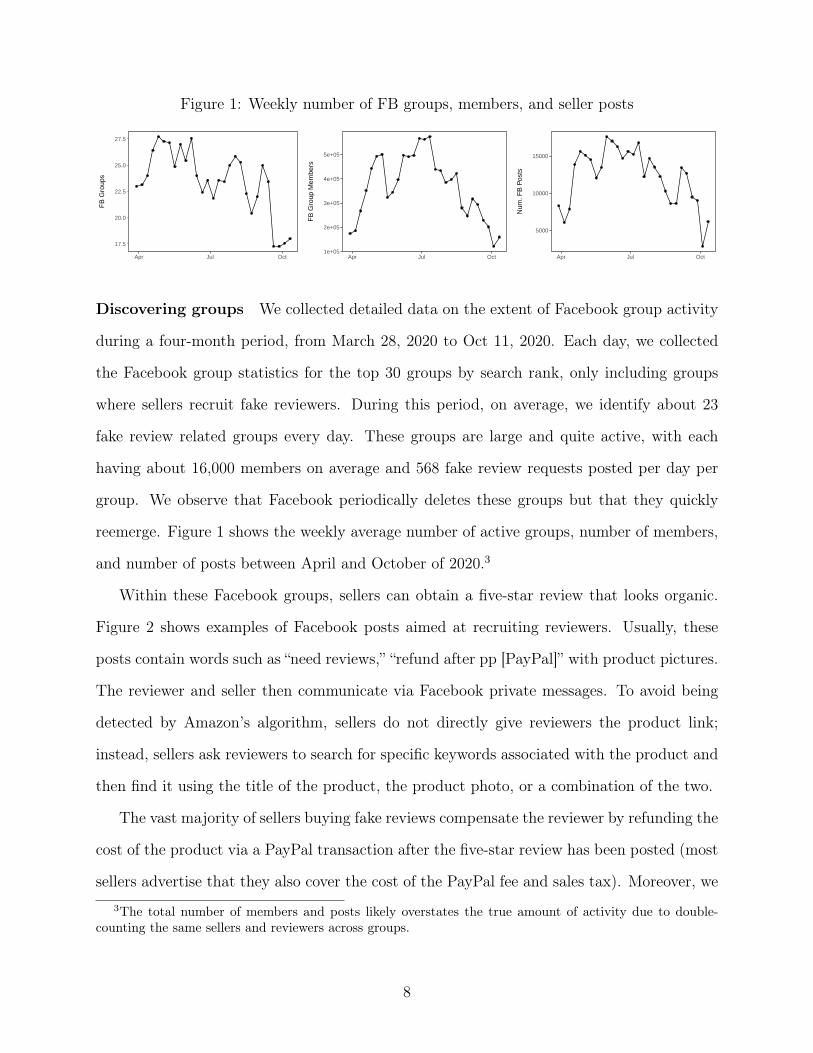
Figure 1: Weekly number of FB groups, members, and seller posts
17.5
20.0
22.5
25.0
27.5
Apr Jul Oct
FB
Gro
ups
1e+05
2e+05
3e+05
4e+05
5e+05
Apr Jul Oct
FB
Gro
up M
embe
rs
5000
10000
15000
Apr Jul Oct
Num
. FB
Pos
ts
Discovering groups We collected detailed data on the extent of Facebook group activity
during a four-month period, from March 28, 2020 to Oct 11, 2020. Each day, we collected
the Facebook group statistics for the top 30 groups by search rank, only including groups
where sellers recruit fake reviewers. During this period, on average, we identify about 23
fake review related groups every day. These groups are large and quite active, with each
having about 16,000 members on average and 568 fake review requests posted per day per
group. We observe that Facebook periodically deletes these groups but that they quickly
reemerge. Figure 1 shows the weekly average number of active groups, number of members,
and number of posts between April and October of 2020.3
Within these Facebook groups, sellers can obtain a five-star review that looks organic.
Figure 2 shows examples of Facebook posts aimed at recruiting reviewers. Usually, these
posts contain words such as “need reviews,” “refund after pp [PayPal]” with product pictures.
The reviewer and seller then communicate via Facebook private messages. To avoid being
detected by Amazon’s algorithm, sellers do not directly give reviewers the product link;
instead, sellers ask reviewers to search for specific keywords associated with the product and
then find it using the title of the product, the product photo, or a combination of the two.
The vast majority of sellers buying fake reviews compensate the reviewer by refunding the
cost of the product via a PayPal transaction after the five-star review has been posted (most
sellers advertise that they also cover the cost of the PayPal fee and sales tax). Moreover, we3The total number of members and posts likely overstates the true amount of activity due to double-
counting the same sellers and reviewers across groups.
8

observe that roughly 15% of products also offer a commission on top of refunding the cost of
the product. The average commission value is $6.24, with the highest observed commission
for a review being $15. Therefore, the vast majority of the cost of buying fake reviews is the
cost of the product itself.
Reviewers are compensated for creating realistic seeming five-star reviews, unlike reviews
posted by bots or cheap foreign workers with limited English skills, which are more likely to
be filtered by Amazon’s fraud detection algorithms. First, the fact that the reviewer buys
the product means that the Amazon review is listed as a “Verified Purchase” review; second,
reviewers are encouraged to leave lengthy, detailed reviews that include photos and videos to
mimic authentic and organic reviews.4 Third, sellers typically request that the reviewer wait
10 days after the purchase is made before posting the review, although reviewers who are
anxious to be paid do not always follow this guidance. Finally, sellers recruit only reviewers
located in the United States, with an Amazon.com account, and with a history of past
reviews.
This process differs from “incentivized reviews,” where sellers offer free or discounted
products or discounts on future products in exchange for reviews. Several features distin-
guish fake reviews from incentivized reviews. The payment for incentivized reviews is not
conditional on the review being positive, whereas reimbursement for fake reviews requires
a five-star rating. Incentivized reviews, in principle, contain informative content for con-
sumers, whereas in many cases the reviewer posting a fake review has not used or even
opened the product. Finally, incentivized reviews typically involve disclosure in the form
of a disclaimer contained in the review itself that the product was received for free or at
a discount in exchange for the review. Amazon has at times allowed incentivized reviews
and even has formally sponsored them through its Vine program and its “Early Reviewer
Program,” but the company considers fake reviews a violation of its terms of service by both
sellers and reviewers, leaving them subject to being banned from the platform if caught.4The fact that these fake reviews are from verified purchases indicates that an identification strategy like
the one used in Mayzlin et al. (2014) will not work in settings like ours.
9

Discovering products To discover products that are promoted, we rely on research as-
sistants. We assign a few active Facebook groups to each one of them and ask them to select
Facebook posts randomly. Facebook displays the posts in a group in an order determined
by some algorithm that factors in when the post was made as well as engagement with the
post via likes and comments. Likes and comments for these posts are relatively rare and so
the order is primarily chronological. We directed our research assistants to randomize which
products were selected by scrolling through the groups and selecting products in a quasi-
random way while explicitly ignoring the product type/category, amount of engagement with
the post, or the text accompanying the product photo.
Given a Facebook post, the goal of the research assistants is to retrieve the Amazon
URL of the product. To do so, they use the keywords provided by the seller. For example,
in Figure 2, the search words would be “shower self,” “toilet paper holder,” and “cordless
vacuum.”
After a research assistant successfully identifies the product, we ask them to document
the search keywords, product ID, product subcategory (from the Amazon product page),
date of the Facebook post, the earliest post date from the same seller for the same product
(if older posts promoting the same product exist), and the Facebook group name.
We use the earliest Facebook post date as a proxy for when the seller began to recruit
fake reviewers. To identify when a seller stops recruiting fake reviews for a product, we
continuously monitor each group and record any new posts regarding the same product by
searching for the seller’s Facebook name and the product keywords. We then use the date
of the last observed post as a proxy for when the seller stopped recruiting fake reviews.
We collect data from these Facebook fake review groups using this procedure on a weekly
basis from October 2019 to June 2020, and the result is a sample of roughly 1,500 unique
products. This provides us with the rough start and end dates of when fake reviews are
solicited, in addition to the product information.
10

Figure 2: Examples of Fake Review Recruiting Posts
2.2 Amazon Data
We use the Amazon information obtained by the research assistants to collect data about
products buying fake reviews from Amazon.com.
Search Results Data For each product buying fake reviews, we repeatedly collect all
information from the keyword search page results, i.e., the list of products returned as a
result of a keyword search query. This set of products is useful to form a competitor set
for each focal product. We collect this information daily and store all information available
on these pages including price, coupon, displayed rating, number of reviews, search page
number, whether the product buys sponsored listings, and the product position in each
page.5
Review Data We collect the reviews and ratings for each of the products observed buying
fake reviews on a daily basis. For each review, we store the following variables: rating,
product ID, review text, presence of photos, and helpful votes.
Additionally, we collect the full set of reviews for each product on a bimonthly basis. The5Using page number and product position, we can compute the keyword search position of every product.
11

reason for this is that it allows us to measure to what extent Amazon responds to sellers
recruiting reviews by deleting reviews that it deems as potentially fake.
In addition to collecting this data for the focal products, we collect daily and bi-monthly
review data for a set of 2,714 competitor products to serve as a comparison set. To do so,
for each focal product we select the two competitor products who show up most frequently
on the same search page as the focal product in the seven days before and seven days after
their first FB post. The rationale is that we want to create a comparison set of products
that are in the same subcategory as the focal products and have a similar search rank. We
collect these products’ reviews data from Aug 14th, 2020 to Jan 22rd, 2021.
Sales Rank Data We rely on Keepa.com and its API to collect sales rank data for the
products soliciting fake reviews. We collect this data twice a week for focal products and
any products that appear in the category data discussed above. Amazon reports a measure
called Best Seller Rank, whose exact formula is a trade secret, but which translates actual
sales within a specific period of time into a ranking of products by sales levels.
2.3 Descriptive Statistics
Here, we provide descriptive statistics on the set of roughly 1,500 products collected between
October 2019 to June 2020.
We use this sample of products to characterize the types of products that sellers promote
with fake reviews. On the one hand, we might expect these products to be primarily new
products with few or no reviews whose sellers are trying to jump-start sales by establishing a
good online reputation. On the other hand, these might be products with many reviews and
low average ratings, whose sellers resort to fake reviews to improve the product reputation
and therefore increase sales.
12

Table 1: Focal Product Categories and Subcategories
Category N Subcategory N
Beauty & Personal Care 193 Humidifiers 17
Health & Household 159 Teeth Whitening Products 15
Home & Kitchen 148 Power Dental Flossers 14
Tools & Home Improvement 120 Sleep Sound Machines 12
Kitchen & Dining 112 Men’s Rotary Shavers 11
Cell Phones & Accessories 81 Vacuum Sealers 11
Sports & Outdoors 77 Bug Zappers 10
Pet Supplies 62 Electric Back Massagers 10
Toys & Games 61 Cell Phone Replacement Batteries 9
Patio, Lawn & Garden 59 Light Hair Removal Devices 9
Electronics 57 Outdoor String Lights 9
Baby 42 Cell Phone Charging Stations 8
Office Products 30 Electric Foot Massagers 8
Automotive 29 Meat Thermometers & Timers 8
Arts, Crafts, & Sewing 21 Aromatherapy Diffusers 7
Camera & Photo 19 Blemish & Blackhead Removal Tools 7
Clothing, Shoes & Jewelry 14 Cell Phone Basic Cases 7
Computers & Accessories 12 Portable Bluetooth Speakers 7
Table 1 shows a breakdown of the top 20 categories and subcategories for our sample of
products. The use of fake reviews is widespread across products and product categories. The
top categories are “Beauty & Personal Care,” “Health & Household,” and “Home & Kitchen,”
but the full sample of products comes from a wide array of categories as the most represented
category still only accounts for just 13% of products, and the most represented product in
our sample, Humidifiers, only accounts for roughly 1% of products. Nearly all products are
sold by third-party sellers.
We observe substantial variation in the length of the Facebook fake reviews recruiting
13

period, with some products being promoted for a single day and others for over a month.
The average length of the Facebook promotion period is 23 days and the median is six days.
Turning to the product age (measured using the first date the product was listed on
Amazon), we find that the mean and median product age when these products first begin
soliciting fake reviews is 229 days and 156 days, respectively. This suggests that products
collecting fake reviews are rarely new and without any reputation. Indeed, out of the 1,500
products we observe, only 17 of them solicit fake reviews in their first week after the product
appears on Amazon, and only 94 solicit fake reviews in their first month.
Next, we compare the characteristics of our focal products to a set of competitor products.
We define competitor products as those products that appear on the same page of search
results for the same product keywords as our focal products. Even with these restrictions,
we obtain a set of about 200,000 competitor products.
Table 2 compares the focal products with their competitors over several characteristics.
We observe that while they are not extremely new when soliciting fake reviews, the focal
products are significantly younger than competitor products, with a median age of roughly 5
months compared with 15 months for products not observed buying fake reviews. Moreover,
our focal products charge slightly lower average prices than their competitors, having a
mean price of $33 (compared with $45 for the comparison products). However, this result
is mainly driven by the right tail of the price distribution. Fake review products actually
charge a higher median price than their competitors, but there are far fewer high-priced
products among the fake review products than among competitors. This may reflect the
fact that a primary cost of buying fake reviews is compensating the reviewer for the price of
the product. In other words, the more expensive a product is, the more costly is to buy fake
reviews.6
6We illustrate this in detail in Section 3.
14

Table 2: Characteristics of Focal Products and Comparison Products
Count Mean SD 25% 50% 75%
Displayed Rating
Fake Review Products 1,315 4.4 0.5 4.1 4.5 4.8
All Products 203,480 4.2 0.6 4.0 4.3 4.6
Number of Reviews
Fake Review Products 1,425 183.1 493.5 10.0 45.0 167.0
All Products 203,485 451.4 2,619.0 13.0 59.0 250.0
Price
Fake Review Products 1,425 33.4 45.0 16.0 24.0 35.0
All Products 236,542 44.7 154.8 13.0 21.0 40.0
Sponsored
Fake Review Products 1,425 0.1 0.3 0.0 0.0 0.0
All Products 236,542 0.1 0.3 0.0 0.0 0.0
Keyword Position
Fake Review Products 1,425 21.4 16.1 8.0 16.0 33.0
All Products 236,542 28.2 17.3 13.0 23.0 43.0
Age (days)
Fake Review Products 1,305 229.8 251.1 77.0 156.0 291.0
All Products 153,625 757.8 797.1 257.0 466.0 994.0
Sales Rank
Fake Review Products 1,300 73,292.3 151,236.4 7,893.3 26,200.5 74,801.5
All Products 5,647 89,926.1 323,028.9 5,495.0 21,610.0 72,563.5
15

Table 3: Seller Characteristics
Count Mean SD 25% 50% 75%
Focal Sellers
Number of Products 660 23.9 83.9 3.4 7.8 15.2
Number of Reviews 642 176.9 297.0 34.0 81.2 201.1
Price 655 37.2 71.1 16.4 23.5 37.2
Seller Country
Mainland China 798 0.8
United States 112 0.1
Hong Kong 13 0.0
Japan 7 0.0
Canada 6 0.0
Note: This table shows information on seller characteristics, where the number of products, number of
reviews and price variables are calculated as averages taken over all seller products. Variable counts
differ based on the structure of Amazon seller pages making data collection impossible for some sell-
ers. The number of observations for seller country is calculated at the product level.
Turning to ratings, we observe that products purchasing fake reviews have, at the time
of their first Facebook post, relatively high product ratings. The mean rating is 4.4 stars
and the median is 4.5 stars, which are both higher than the average ratings of competitor
products. Although, we note that ratings may of course be influenced by previous unobserved
Facebook campaigns. Only 14% of products have initial ratings below four stars and only
1.2% have ratings below three stars, compared with 19.5% and 3% for competitor products.
Thus, it appears that products purchasing fake reviews do not seem to do so because they
have a bad reputation.
We also examine the number of reviews. The mean number of reviews for focal products
is 183, which is driven by a long right tail of products with more than 1,000 reviews. The
median number of reviews is 45, and roughly 8% of products have zero reviews at the time
16

they are first seen soliciting fake reviews. These numbers are relatively low when compared
with the set of competitor products, which has a median of 59 reviews and a mean of 451
reviews. Despite these differences, it seems that most of the focal products are not buying
fake reviews because they have very few or no reviews.
The last comparison is in terms of sales. We observe that the focal products have slightly
lower sales than competitor products as measured by their sales rank, but the difference is
relatively minor.
Turning to brand names, we find that almost none of the sellers in these markets are well-
known brands. Brand name sellers may still be buying fake reviews via other (more private)
channels, or they may avoid buying fake reviews altogether to avoid damage to their repu-
tation. This result is also consistent with research showing that online reviews have larger
effects for small independent firms relative to firms with well-known brands (Hollenbeck,
2018).
Finally, to better understand which type of sellers are buying fake reviews, we collect
one additional piece of information. We take the sellers’ names from Amazon and check
the U.S. Trademark Office for records on each seller. We find a match for roughly 70% of
products. Of these products, the vast majority, 84%, are located in China, more precisely in
Shenzhen or Guangzhou in the Guangdong province, an area associated with manufacturing
and exporting. The distribution of sellers by country-of-origin and other seller characteristics
are shown in Table 3. This table shows that most sellers sell fewer than 15 products, with
a median 7.8 products. Their products tend to have fewer than 200 reviews, similar to the
focal products. The sellers’ other products are also priced similarly to the focal products.
To summarize, we observe purchases of fake reviews from a wide array of products across
many categories. These products are slightly younger than their competitors, but only a
small share of them are truly new products. They also have relatively high ratings, a large
number of reviews, and similar prices to their competitors.
17

3 The Simple Economics of Fake Reviews
We build on the results from the previous section on how the fake review marketplace works,
and briefly show the costs and benefits of buying fake reviews. We start by focusing on the
costs the sellers incur when buying a fake review.
First, to buy one fake review, a seller must pay to the reviewer:
P (1 + τ + FPP ) + Commission (1)
Where P is the product’s list price, τ is the sales tax rate, FPP is the PayPal fee, and
Commission refers to the additional cash offered by the seller, which is often zero but is
sometimes in the $5-10 range. After the reviewer buys the product, the seller receives a
payment from Amazon of:
P (1− c)
Where c is Amazon’s commission on each sale. So the difference in payments or net financial
cost of one review is:
P (1 + τ + FPP ) + Commission− P (1− c) = P (τ + FPP + c) + Commission
This is the share of the list price that is lost to PayPal, Amazon, and taxes, along with the
potential cash payment. Along with this financial cost the seller bears the production cost
of the product (MC), making the full cost of one fake review:
Cost =MC + P (τ + FPP + c) + Commission (2)
If we define the gross margins rate as λ such that λ = P−MCP
, we can show that equation 2
becomes
Cost = P (1− λ+ τ + FPP + c) + Commission (3)
18
This defines the marginal cost of a fake review to the seller. The benefit of receiving one fake
review is a function of how many organic sales it creates Qo and the profit on those sales,
which is:
Benefit = QoP (λ− c) (4)
where again c refers to Amazon’s commission from the sale. Setting equations 3 and 4 equal
allows us to calculate the break-even number of organic sales QBEo . This is the number of
extra incremental sales necessary to exactly justify buying one fake review. If the seller does
not offer an additional cash commission, and the vast majority of sellers do not, this can be
written as:
QBEo =
1− λ+ τ + FPP + c
λ− c(5)
Where the direct effect of price drops out and this is just a function of the product markup
and observable features of the market. We take these market features as known:
• τ = .06567
• FPP = 2.9%
• Amazon commission c varies by category but is either 8% or 15% in almost all cases.8
The result for products in the 8% commission categories is:
QBEo =
1.175− λ
λ− .08(6)
Thus the break-even level of incremental sales needed to justify buying one fake review is
a simple expression of a product’s price-cost margin. It is clear that products with larger
markups require fewer incremental organic sales to justify a fake review purchase. This is
for two reasons that this analysis makes clear. First, because the cost of a fake review is7https://taxfoundation.org/2020-sales-taxes/. We aggregate by taking an average of state and local sales
taxes.8https://sellercentral.amazon.com/gp/help/external/200336920.
19

lower since conditional on price the marginal cost is lower, and second because the benefit
of an organic sale is larger for products with larger markups.
Figure 3 plots equation 6 where the X-axis is λ and the Y-axis is QBEo . It shows that for
products with relatively low markups the break-even number of organic sales approaches 10
but for products with relatively high markups this number is below 1.
Note that this is not a theoretical model of the full costs and benefits of fake reviews,
many of which are not accounted for, including the risk of punishment and the extent to
whichQo varies as a result of product quality. This is merely a simple description of the direct
financial costs and benefits sellers face and how they determine the profitability cutoff for Qo.
Nevertheless, several direct implications follow from this analysis. First, the economics of
fake reviews can be quite favorable for sellers since a fairly small number of organic sales are
needed to justify their cost. In practice, cheap Chinese imported products often have very
large markups such that these sellers only need to generate roughly one additional organic
sale to profit from a fake review purchase.
Figure 3: Organic Sales Needed to Justify 1 Fake Review
Second, this is especially the case for lower quality products with larger markups. For a
concrete example, imagine two products that both list a price of $25. Product A costs $15
20
to produce and product B costs $20 to produce because A is of lower quality than B. For
product A QBEo = 2.4 and for product B QBE
o = 8.1. The lower cost product needs far fewer
organic sales to justify the expense of one fake review.
Third, this analysis makes clear why we are unlikely to observe fake negative reviews
applied to competitor products, as in Luca and Zervas (2016) and Mayzlin et al. (2014).
The cost of a fake review for a competitor product is significantly higher because it requires
the firm buying the review to incur the full price of the competitor’s product, and the benefit
is likely to be lower because the negative effect on competitor sales is indirect and dispersed
across potentially many other products.
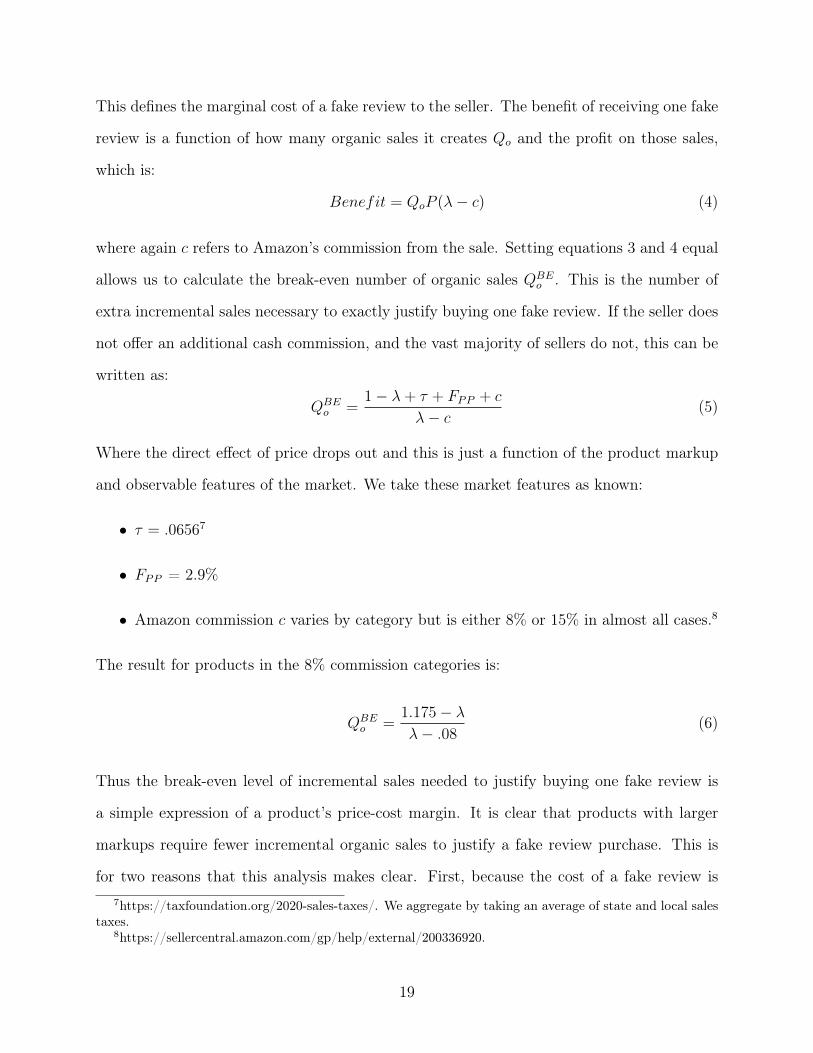
4 Descriptive Results on Product Outcomes After Buy-
ing Fake Reviews
In this section, we quantify the extent to which buying fake reviews is associated with changes
in average ratings, number of reviews, and sales rank, as well as other marketing activities
such as advertising and promotions. To do so we take advantage of a unique feature of
our data in that it contains a detailed panel on firm outcomes observed both before and
after sellers buy fake reviews. We stress that, in this section, the results are descriptive in
nature. We do not observe the counterfactual outcomes in which these sellers do not buy
fake reviews, and so the outcomes we measure are not to be interpreted strictly as causal
effects. We present results on the causal effects of fake reviews on sales outcomes in Section
5.
We first present results in the short term, immediately after they begin buying fake
reviews, including for subgroups of products. We then show results for the long-term persis-
tence of these effects after the fake review recruitment period has ended. Finally, we show
descriptive results on the extent to which Amazon responds by deleting reviews.
21

4.1 Short-term Outcomes After Buying Fake Reviews
We begin by quantifying the extent to which buying fake reviews is associated with changes
in average ratings, reviews, and sales rank in the short term. To evaluate these outcomes,
we partition the time around the earliest Facebook recruiting post date (day 0) in 7-day
intervals. For example, the interval 0 includes the days in the range [0,7) and the interval
-1 includes the days in the range [-7,0). We then plot the quantity of interest for eight 7-
day intervals before fake reviews recruiting start and four 7-day intervals after fake reviews
recruiting starts. We focus on roughly four weeks after fake reviews recruiting starts because,
in this section, we are interested in discussing short-term effects (recall that the mean length
in days of a Facebook campaign is 23 days in our dataset). We start by showing results
visually by plotting the raw data, and then calculating and displaying the magnitude of
these changes using pooled regressions.
Figure 4: 7-day average ratings, 7-day average number of reviews, and cumulative averageratings before and after fake reviews recruiting begins. The red dashed line indicates thelast week of data before we observe Facebook fake review recruiting.
4.3
4.4
4.5
−8 −6 −4 −2 0 2 4
Weeks around FB first post date
Avg
. Rat
ing
6
8
10
12
−8 −6 −4 −2 0 2 4
Weeks around FB first post date
Rev
iew
s
4.40
4.45
−8 −6 −4 −2 0 2 4
Weeks around FB first post date
Cum
ulat
ive
Avg
. Rat
ing
Ratings and reviews We start by looking at how ratings and reviews change after the
seller begins buying fake reviews. In the left panel of Figure 4 we plot the weekly average
rating. Several interesting facts emerge from this figure. First, the average ratings increase
by about 5%, from 4.3 stars to 4.5 stars at its peak, after Amazon sellers start recruiting
fake reviewers. Second, this increase in rating is short-lived, and it starts dissipating just
two weeks after the beginning of the recruiting of fake reviews; despite this, even after four
weeks after the beginning of the promotion, average ratings are still slightly higher than
22

ratings in the pre-promotion period. Third, the average star-rating starts increasing roughly
two weeks before the first Facebook post we observe, suggesting that we may not be able to
capture with high precision the exact date at which sellers started promoting their products
on Facebook. Despite this limitation, our data seems to capture the beginning date of the
fake review recruitment fairly well.
Next, we turn to the number of reviews. In the middle panel of Figure 4, we plot the
weekly average number of posted reviews. We observe that the number of reviews increases
substantially around interval 0, nearly doubling, providing suggestive evidence that recruiting
fake reviewers is effective at generating new product reviews at a fast pace. Moreover, and
differently from the average rating plot, the increase in the weekly number of reviews persists
for more than a month. This increase in the number of reviews likely reflects both the fake
reviews themselves and additional organic reviews that follow naturally from the increase
in sales we document below. Finally, Figure 4 confirms that we are not able to capture the
exact data at which the Facebook promotion started.
Does this increase in positive reviews lead to higher displayed product ratings? To answer
this question, in the right panel of Figure 4, we plot the cumulative average rating before
and after the Facebook promotion starts. We observe a positive change centered around
the beginning of the promotion and that stabilized for about two weeks after the promotion
begins, after which the increase starts to dissipate.
Sales rank In the left panel of Figure 5 we plot the average log of sales rank. This figure
reveals several facts. First, the figure shows that the sales rank of products that are eventually
promoted is increasing between the intervals -8 and -3. This suggests that Amazon sellers
tend to promote products for which sales are falling. Second, recruiting fake reviewers is
associated with a large decrease in sales rank (i.e., product sales increase). This decrease is
likely reflecting both the initial product purchases by the reviewers paid to leave fake reviews
as well as the subsequent increase in organic sales that follow. Finally, the increase in sales
23

lasts for at least several weeks.
The center panel of Figure 5 plots sales in units sold. Amazon does not display this
metric but it is possible to measure sales in units for a subset of products and then estimate
the relationship between rank and units. Appendix B describes how we collect this data
and model the relationship, and more details are available in He and Hollenbeck (2020). We
plot the observed sales and point estimates of estimated sales around the time of the first
FB post and see a sharp increase in average units sold, from around 16 units per week to
roughly 20.
Figure 5: 7-day average sales rank before and after fake reviews recruiting begins (left), salesin units (center), and keyword search position (right) before and after fake reviews recruitingbegins. The red dashed line indicates the last week of data before we observe Facebook fakereview recruiting.
9.9
10.0
10.1
10.2
−8 −6 −4 −2 0 2 4
Weeks around FB first post date
log
Sal
es R
ank
16
18
20
22
−8 −6 −4 −2 0 2 4
Weeks around FB first post date
Sal
es Q
uant
ity
120
130
140
150
−8 −6 −4 −2 0 2 4
Weeks around FB first post date
Key
wor
ds S
earc
h P
ositi
on
Keyword search position So far we have shown that recruiting fake reviews is associated
with improvements in ratings, reviews, and sales. One reason for observing higher sales may
be that higher ratings signal higher quality to consumers, who then are more likely to buy
the product. A second reason for higher sales is that products recruiting fake reviews will
be ranked higher in the Amazon search results due to them having higher ratings and more
reviews (both factors that are likely to play a role in determining a product search rank).
To investigate whether this is the case, in the right panel of Figure 5 we plot the search
position rank of products recruiting fake reviews. We observe a large drop in search position
rank corresponding with the beginning of the Facebook promotions, indicating that products
recruiting fake reviews improve their search position substantially. Moreover, this change
24

seems to be long-lasting as the position remains virtually constant for several weeks.
Verified purchases and photos Next, we investigate the relationship between recruiting
fake reviewers and whether reviews are written by someone who actually bought the product
(Amazon “verified purchase” reviews) and the number of photos associated with the reviews.
An important aspect of the market for fake reviews is that reviewers are compensated for
creating realistic reviews, meaning they actually buy the product and can therefore be listed
as a verified reviewer, and they are encouraged to post long and detailed reviews. We plot
these two quantities in Figure 6. In the left panel, we show changes in 7-day interval average
verified purchase reviews. Despite being quite noisy in the pre-promotion period, the figure
suggests that verified purchases increase with the beginning of the promotion. Turning to
the number of photos (right panel) we observe a sharp increase that begins around interval
-1 suggesting an increase associated with the beginning of the Facebook promotion.
Figure 6: 7-day average verified purchase and number of photos before and after fake reviewsrecruiting begins. The red dashed line indicates the last week of data before we observeFacebook fake review recruiting.
0.93
0.94
0.95
0.96
0.97
−8 −6 −4 −2 0 2 4
Weeks around FB first post date
Ver
ified
Pur
chas
e
0.20
0.25
0.30
−8 −6 −4 −2 0 2 4
Weeks around FB first post date
Pho
tos
Marketing activities Finally, we investigate to what extent recruiting fake reviewers is
associated with changes in other marketing activities such as promotions (sponsored listings
and coupons). We plot these quantities in Figure 7. We observe a substantial negative
change in prices (left panel) that persists for several weeks. We also observe a persistent
25
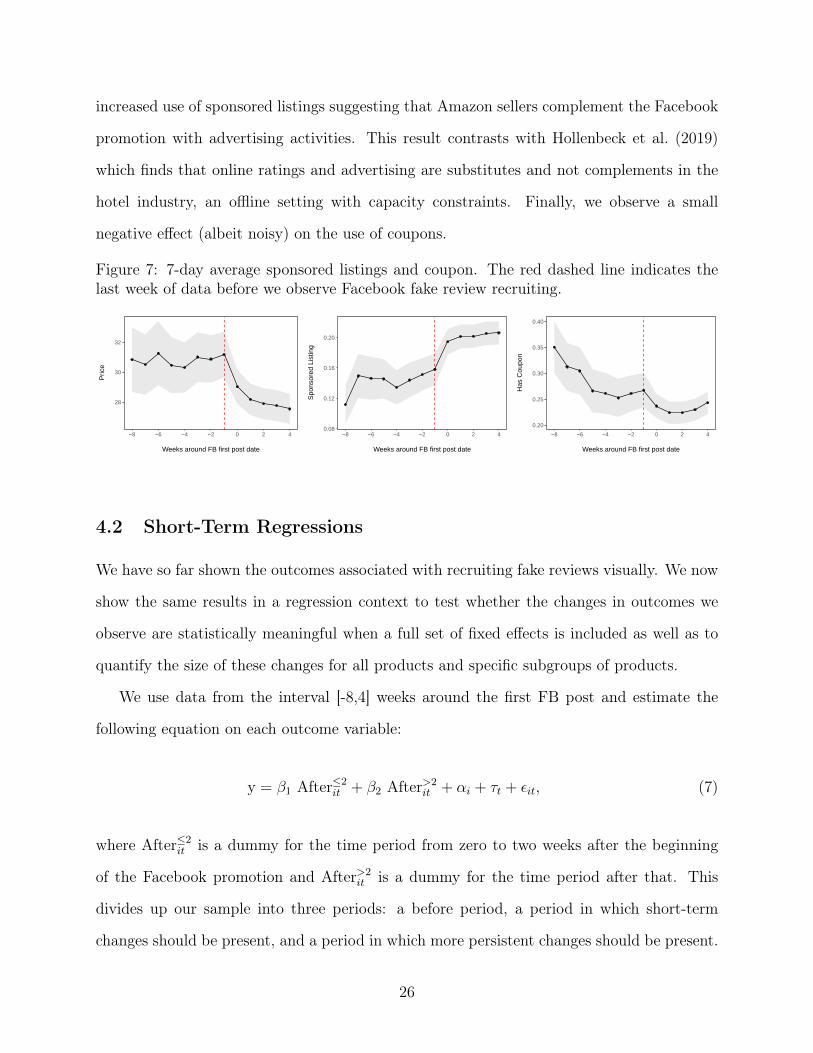
increased use of sponsored listings suggesting that Amazon sellers complement the Facebook
promotion with advertising activities. This result contrasts with Hollenbeck et al. (2019)
which finds that online ratings and advertising are substitutes and not complements in the
hotel industry, an offline setting with capacity constraints. Finally, we observe a small
negative effect (albeit noisy) on the use of coupons.
Figure 7: 7-day average sponsored listings and coupon. The red dashed line indicates thelast week of data before we observe Facebook fake review recruiting.
28
30
32
−8 −6 −4 −2 0 2 4
Weeks around FB first post date
Pric
e
0.08
0.12
0.16
0.20
−8 −6 −4 −2 0 2 4
Weeks around FB first post date
Spo
nsor
ed L
istin
g
0.20
0.25
0.30
0.35
0.40
−8 −6 −4 −2 0 2 4
Weeks around FB first post date
Has
Cou
pon
4.2 Short-Term Regressions
We have so far shown the outcomes associated with recruiting fake reviews visually. We now
show the same results in a regression context to test whether the changes in outcomes we
observe are statistically meaningful when a full set of fixed effects is included as well as to
quantify the size of these changes for all products and specific subgroups of products.
We use data from the interval [-8,4] weeks around the first FB post and estimate the
following equation on each outcome variable:
y = β1 After≤2it + β2 After>2
it + αi + τt + εit, (7)
where After≤2it is a dummy for the time period from zero to two weeks after the beginning
of the Facebook promotion and After>2it is a dummy for the time period after that. This
divides up our sample into three periods: a before period, a period in which short-term
changes should be present, and a period in which more persistent changes should be present.
26

In each case we include year-week, τt, and product fixed effects, αi. We include data on the
2,714 competitor products for which we have collected daily review data. These products
are never observed buying fake reviews, so their Afterit dummies are all set at zero.
The results for each variable for all products are shown in Table 4.9 Consistent with
our visual analysis, we see significant short-term increases in average rating, number of
reviews, sales, and search position (keyword rank). The increase in weekly average rating
is roughly .11 stars. We also see significantly higher use of sponsored listings in this period
and a significant increase in the share of reviews that are from verified purchases. There are
also positive coefficients for the longer-term dummy for the number of reviews and search
position, confirming that the changes in these variables are more persistent.
Table 4: Short-term Outcomes After Recruiting Fake Reviews Including the competitive setof products
(1) (2) (3) (4) (5) (6) (7) (8) (9)Avg. log log Sales log Keyword Sponsored Coupon log Verified log
Rating Reviews Rank Rank Photos Price
≤ 2 wks 0.107*** 0.445***−0.260*** −0.412*** 0.044*** 0.002 0.022*** 0.022***−0.013**(0.019) (0.017) (0.022) (0.028) (0.009) (0.013) (0.006) (0.003) (0.004)
> 2 wks 0.034 0.320***−0.246*** −0.434*** 0.061*** −0.007 0.003 0.018***−0.016**(0.021) (0.020) (0.028) (0.030) (0.010) (0.014) (0.007) (0.004) (0.005)
N 186389 247218 193381 91733 94122 94122 186389 186389 92361R2 0.22 0.67 0.81 0.64 0.55 0.52 0.15 0.15 0.98
Note: All specifications include product and year-week FE. Cluster-robust standard errors (at the product level) in parentheses.Significance levels: * p<0.05, ** p<0.01, *** p<0.001.
Overall, we observe that when sellers purchase fake reviews there is an immediate and
substantial increase in the number of reviews they receive and average ratings. Additionally,
these products increase their use of marketing activities such as sponsored listings at this
time, and the net outcome associated with these is a large increase in their sales that persist
for several weeks.9The high R2 are likely due to the inclusion of product and year-week fixed effects fixed effect.
27

4.2.1 Heterogeneous effects
Next, we expand these regressions for the main variables of interest to also include interac-
tions for products belonging to notable subgroups to understand whether there are hetero-
geneous outcomes associated with fake review purchase timing. These tables are located in
Appendix A.1 and show results for average ratings, weekly number of reviews, sales rank,
keyword position, and use of sponsored listings. We also consider these heterogeneous effects
in the long-term product outcomes described in the next subsection.
New vs. old products The first interaction we test is for products that we call “cold-
start” products, i.e., those who have only been listed for fewer than four months and have
accumulated eight or fewer reviews. We might expect these products to have different out-
comes than older and more established products in terms of the size of the short-term increase
in ratings, reviews, and sales and whether these effects are self-sustaining in the longer term.
In fact we do observe different outcomes, specifically that these products’ sales increase by a
much larger margin than for regular products, as shown in Table 15. They also get a larger
increase in number of reviews (Table 14) but do not see an increase in weekly average rating
(Table 13). This last result may be due to the fact that cold-start products typically start
out with a perfect five-star rating, which inevitably decreases as more reviews are added.
High- vs. low-price products The second interaction is based on whether products
are listed above or below the median price for the products in our sample. We estimate
that products with below-median prices receive a much larger and more sustained increase
in average ratings and keyword position, and increase their use of advertising by a larger
margin, but these do not translate into a larger sales increase.
Durable vs. nondurable products The third interaction is based on whether products
are durable vs. nondurable. We categorize products as durable or nondurable, using the
method described in Appendix A. We find that nondurable products (around 10% of prod-
28

ucts) perform similarly to low-priced products, with larger effects for ratings, reviews, and
position but smaller increases in sales rank.
Search vs. experience products The fourth and final interaction is based on whether
products are experience vs. search products. We categorize products as being either search
or experience goods using the method described in Appendix A. We might expect rating
inflation to have larger effects for experience goods than search goods. We do find that
the search goods get a smaller increase in sales despite getting a larger increase in keyword
position, but these effects are not statistically significant.
Sales effect by category Lastly, we analyze the key outcome variable, change in sales
rank, to see how it varies across product categories. To do so, we estimate Equation 7, but
replacing product fixed effects with category fixed effects. We plot the coefficients on these
category fixed effects in Figure 8, where the red horizontal line indicates the mean change
normalized to zero. The figure shows significant differences across categories in the size of
the increase in sales rank, with the largest increases in sales coming from the insect repellent
category and hair removal category, and significantly smaller increases in sales in the fashion
category, as well as in cellphones, smartwatches and power banks.
4.3 Long-term Outcomes After Buying Fake Reviews
In this subsection, we describe what happens after sellers stop buying fake reviews. We are
particularly interested in using the long-term outcomes to assess whether buying fake reviews
generates a self-sustaining increase in sales. If we observe that these products continue to
receive high organic ratings and have high sales after they stop recruiting fake reviews, we
might conclude that fake reviews are a potentially helpful way to solve the cold start problem
of selling online with limited reputation.
We therefore track the long-term trends for ratings, reviews, and sales rank. Similar to
Section 4.1, we partition the time around the last Facebook recruiting post date (day 0) in
29

Figure 8: Cross-category Changes in Sales Rank
-1-.5
0.5
11.
5
Repe
llant
sHa
ir re
mov
alCo
mpu
ter P
arts
Cam
era
& Ph
oto
Gro
cery
Usb-
to-v
ga A
dapt
ers
Spor
ts &
Out
door
sAu
tom
otive
Indu
stria
l & S
cient
ificBa
byHo
me
Impr
ovem
ent
Clot
hing
& J
ewel
ryPe
t Sup
plie
sTo
ys &
Gam
esPe
rson
al C
are
Offi
ce P
rodu
cts
Phon
es a
cces
sorie
sHo
me
& Ki
tche
nHe
alth
& H
ouse
hold
Lawn
& G
arde
nM
usica
l Ins
trum
ents
Elec
troni
csTV
Mou
nts
Amaz
on L
aunc
hpad
Vide
o Pr
ojec
tors
Cell p
hone
sSm
artw
atch
esPo
wer B
anks
Fash
ion
Note: This figure plots category-level coefficients of a regression of sales rank on a dummy for the two-weekperiod following a products’ first FB post.
7-day intervals, and plot the quantity of interest for four 7-day intervals before fake reviews
recruiting stop (thus covering most of the period where products recruited fake reviews) and
eight 7-day intervals after fake reviews recruiting starts. Doing so, we compare the Facebook
promotion period (negative intervals) with the post-promotion period (positive intervals)
after sellers had stopped buying fake reviews. We first provide the results visually using
plots of the raw data, followed by pooled regression analysis for the key outcome variables.
Ratings and Reviews The long-term changes in ratings and reviews associated with fake
reviews are shown in Figure 9. We observe that the increase that occurs when sellers buy fake
reviews is fairly short. After one to two weeks from the end of the Facebook promotion, both
the weekly average rating and the number of reviews (left and middle panel, respectively)
start to decrease substantially. The cumulative average rating (right panel) drops as well.
30

Figure 9: 7-day average number of average ratings, reviews, and average share of one-starreviews before and after fake reviews recruiting stops. The red dashed line indicates the lastweek of data in which we observe Facebook fake review recruiting.
4.1
4.2
4.3
4.4
−4 −2 0 2 4 6 8
Weeks around FB last post date
Avg
. Rat
ing
8
9
10
11
12
13
−4 −2 0 2 4 6 8
Weeks around FB last post dateR
evie
ws
4.350
4.375
4.400
4.425
4.450
−4 −2 0 2 4 6 8
Weeks around FB last post date
Cum
. Avg
. Rat
ing
Figure 10: 7-day average sales rank, sales in units, and keyword rank before and after fakereview recruiting stops. The red dashed line indicates the last week of data in which weobserve Facebook fake review recruiting.
9.8
9.9
10.0
10.1
10.2
−4 −2 0 2 4 6 8
Weeks around FB last post date
log
Sal
es R
ank
16
18
20
−4 −2 0 2 4 6 8
Weeks around FB last post date
Sal
es Q
uant
ity
120
125
130
135
140
−4 −2 0 2 4 6 8
Weeks around last FB post dateK
eyw
ord
Sea
rch
Pos
ition
Interestingly, these products end up having average ratings that are significantly worse than
when they began recruiting fake reviews (approximately interval -4).
Sales Rank The left panel of Figure 10 shows the long-term trend in the average log sales
rank. It shows that sales decline substantially after the last observed Facebook post. This
suggests that the increase associated with recruiting fake reviews is not long lasting as it
does not lead to a self-sustaining set of sales and positive reviews.
The middle panel of Figure 10 shows sales in units, estimated using the procedure de-
scribed in Appendix B. The result is consistent with rank, showing that sales peak during
the week of the last FB post and subsequently decline.
Keyword search position The right panel of Figure 10 shows the long-term trend in
average keyword search position. We observe that after the Facebook campaign stops, the
31
downward trend in search position stops but does not substantially reverse even after two
months. Therefore, all products enjoy a better ranking in keyword searches for a relatively
long period after fake review recruiting stops.
The relatively stable and persistent increase in search position suggests that this measure
may have a high degree of inertia. After an increase in sales and ratings causes a product’s
keyword rank to improve, it does not decline quickly, even when sales are decreasing. This
also suggests that the decrease in sales shown in Figure 10 does not come from a reduced
product visibility but from the lower ratings and increase in one-star reviews. Finally, while
we demonstrate in the next section that Amazon deletes a large share of reviews from prod-
ucts that recruit fake reviews, the inertia in keyword rank suggests it does not punish these
sellers using the algorithm that determines organic keyword rank. This could therefore serve
as an additional policy lever for the platform to regulate fake reviews.
4.4 Long-term Regressions
Similar to how we presented results for the short-term outcomes, we now show the same
results in a regression context. To do so, we take the interval [-4,8] weeks around the last
FB post and regress each outcome variable on a dummy for the time period from one to
three weeks afterward, as well as an additional dummy for the time period after that. In
each case, we include year-week and product fixed effects.
We show separate regressions for each of the main variables of interest and include in-
teractions for products belonging to the same set of subgroups used in Section 4.2, with
the same goal of understanding whether there are heterogeneous outcomes associated with
fake review purchase timing. These tables are all located in Appendix A.2 and show re-
sults for average ratings, weekly number of reviews, sales rank, keyword position, and use of
sponsored listings.
The overall results, shown in the first column of each table, confirm the visual analysis
that shows that average ratings, number of reviews, sales and keyword position all fall after
32

fake review recruiting ends. However, some of the increases in these variables are still present
in the first week or two after the last FB post.
Turning to the heterogeneous effects, we find that “cold-start” products ratings fall even
further than for regular products, but that their increase in number of weekly reviews is
more persistent. This is consistent with the fact that the decrease in sales rank is larger
and more persistent for “cold-start” products. We don’t find differences in terms of keyword
rank, and find that the use of sponsored listings decreases for “cold-start” products while it
increases for the rest of the products.
We find that the average ratings of low-priced products decrease less than high-priced
products in the first two weeks after the Facebook promotion ends. Turning to reviews, we
find that the number of reviews for low-priced products decreases by much less than for high-
priced products. Accordingly, we find that sales rank increases more for high-priced products.
Keyword rank keeps dropping with a slightly stronger effect for low-priced products. Finally,
we observe a long-term (2+ weeks) increase in sponsored listings for higher-priced products.
In the long term, the nondurable products experience a smaller decrease in ratings, while
durable products seem to be more resilient to the loss of reviews in the 2 weeks following the
end of the Facebook promotion, after which reviews decrease for all products in a similar
way. We do not find any difference in sales rank across durable and nondurable products,
but we find a larger decrease in keyword rank for nondurable products.
Finally, turning to search vs. experience, the only difference we find is in term of the use
of sponsored listings, which is more persistent for experience products.
4.5 Amazon’s Response
In this subsection, we provide evidence on the extent to which Amazon is aware of the fake
review problem and what steps it is taking to remove these reviews.
While we cannot observe reviews that are filtered by Amazon’s fraud detection practices
and never made public, by collecting review data on a daily and bimonthly basis, we can
33

observe if reviews are posted and then later deleted. We calculate the share of reviews that
are deleted by comparing the full set of observed reviews from our daily scraper with the set
of reviews that remain posted at the end of our data collection window. We find that for
the set of products observed recruiting fake reviews, the average share of ultimately deleted
reviews is about 43%. This suggests that, to some extent, Amazon can identify fake reviews.
To further characterize Amazon’s current policy, we next analyze the characteristics of
deleted reviews and the timing of review deletion.
Characteristics of Deleted Reviews In Table 5, we report the mean and standard de-
viation for several review characteristics for deleted and non-deleted reviews and deleted
reviews, respectively. Following the literature on fake reviews, we focus on characteristics
that are often found to be associated with fake reviews. Specifically, we focus on whether the
reviewer purchased the product through Amazon (verified purchase), review rating, number
of photos associated with the review, whether the reviewer is part of Amazon’s “Early Re-
viewer Program”, i.e., is one of the first users to write a review for a product the length of
the review title, and the length of the review.10
We find that deleted reviews have higher average ratings than non-deleted reviews. This
is driven by the fact that the vast majority of deleted reviews are five-star reviews (see
Figure 11). Deleted reviews are also associated with more photos, shorter review titles, and
longer review text. In general, we might expect longer reviews, those that include photos,
and those from verified purchases to be less suspicious. The fact that these reviews are more
likely to be deleted suggests that Amazon is fairly sophisticated in targeting potentially fake
reviews.11 Finally, we find no difference for whether the review is associated with a verified
purchase or tagged as “Amazon Earlier Reviews.”12
10For more details about the “Early Reviewer Program,” we refer the reader to https://smile.amazon.com/gp/help/customer/display.html?nodeId=202094910.
11This result contrasts with Luca and Zervas (2016), who find that longer reviews are less likely to befiltered as fake by Yelp.
12We find that Amazon does not delete any reviews tagged as “Amazon Earlier Reviews” potentiallybecause Amazon’s process to identify and select early reviewers drastically reduces the possibility of thesereviews being fake.
34

Table 5: Comparing deleted and non-deleted reviews characteristics
Deleted Reviews Non-deleted Reviews
Verified purchase 0.98 0.96(0.16) (0.20)
Review rating 4.65 4.24(0.98) (1.37)
Number of photos 0.35 0.19(0.93) (0.72)
Early reviewer 0.00 0.01(0.00) (0.11)
Title length 9.81 21.08(13.94) (13.80)
Review length 236.73 198.75(222.88) (231.68)
Note: Standard deviations in parentheses.
Figure 11: Rating distribution for deleted and non deleted reviews
0%
20%
40%
60%
80%
1 2 3 4 5Review rating
Deleted Not Deleted
35
When Are Reviews Deleted? Finally, we analyze when Amazon deletes fake reviews for
focal products. We do so by plotting the number of products for which reviews are deleted
over time relative to the first Facebook post, i.e., the beginning of the buying of fake reviews.
To do so, we partition the time in days around the first Facebook post and then plot the
number of products for which reviews are deleted. Because products recruit fake reviews
for different time periods, we perform this analysis by segmenting products based on the
quartiles of campaign duration. Figure 12 shows the results of this analysis.
What emerges from this figure is that Amazon starts deleting reviews for more products
after the Facebook campaign begins and often it does so only after the campaign terminated.
Indeed, it seems that most of the review deletion happens during the period covering the two
months after the first Facebook post date, but most campaigns are shorter than a month. A
simple calculation suggests that reviews are deleted only after a quite large lag. The mean
time between when a review is posted and when it is deleted is over 100 days, with a median
time of 53 days.
This analysis suggests the deleted reviews may be well-targeted at fake reviews, but that
there is a significant lag between when the reviews are posted and when they are deleted; and
this lag allows sellers buying fake reviews to enjoy the short-term benefits of this strategy
discussed in Section 4.1. In the next section, we show that there is one time period in our
data during which Amazon’s deletion policy changes significantly, and we use this period to
identify the causal effects of fake reviews on sales.
5 The Causal Effect of Fake Reviews on Sales
The results presented so far are descriptive and should not be interpreted as measuring causal
effects. There are two concerns in estimating the effect of rating manipulation on sales. The
first is that sellers buying fake reviews may time these purchases around unobserved shocks
to demand, either positive or negative. While the product fixed effects included in the results
36

Figure 12: Number of products for which reviews are being deleted over time relative to thefirst Facebook post date. The red dashed line indicates the first time we observe Facebookfake review recruiting, and the blue dashed line indicates the last time we observe Facebookfake review recruiting.
0
50
100
150
200
−100 0 100 200
Days around first FB post
Num
ber
of p
rodu
cts
1 day
0
50
100
150
200
−100 0 100 200
Days around first FB post
Num
ber
of p
rodu
cts
[2,7) days
0
50
100
150
200
−100 0 100 200
Days around first FB post
Num
ber
of p
rodu
cts
[7,32) days
0
50
100
150
200
−200 0 200
Days around first FB post
Num
ber
of p
rodu
cts
[32,281] days
presented in Table 4 capture time-invariant products’ unobserved heterogeneity, they would
not capture these shocks. The second concern is that we observe that many sellers cut prices
and increase advertising at the same time they recruit fake reviews, making it difficult to
isolate the effect of fake reviews on sales.
In this section, we exploit a temporary change in Amazon policy to isolate and measure
the causal effect of fake review recruiting on sales. This allows us to establish that this is a
profitable strategy for sellers and understand the magnitude of the effects that fake reviews
can have on sales.
To accomplish this, we take advantage of an event that occurred during our sample period
that provides a clean measurement of the effects of fake review recruiting. As we discussed
at length in Section 4.5, Amazon deletes a large number of reviews. Figure 13 shows the
amount of review deletion over time during our sample period for the products seen buying
37

Figure 13: Amazon deleted reviews by date
0
2000
4000
6000
01−0
3
01−0
6
01−0
9
01−1
2
01−1
5
01−1
8
01−2
1
01−2
4
01−2
7
01−3
0
02−0
2
02−0
5
02−0
8
02−1
1
02−1
4
02−1
7
02−2
0
02−2
3
02−2
6
02−2
9
03−0
3
03−0
6
03−0
9
03−1
2
03−1
5
03−1
8
03−2
1
03−2
4
03−2
7
03−3
0
04−0
2
04−0
5
04−0
8
04−1
1
04−1
4
04−1
7
04−2
0
04−2
3
04−2
6
04−2
9
05−0
2
05−0
5
05−0
8
05−1
1
05−1
4
05−1
7
05−2
0
05−2
3
05−2
6
05−2
9
06−0
1
06−0
4
06−0
7
06−1
0
06−1
3
06−1
6
06−1
9
06−2
2
06−2
5
06−2
8
Del
eted
Rev
iew
s
fake reviews. There is one occasion during mid-March 2020 when Amazon undertakes a
large-scale purge of reviews with much higher rates of deletion than normal.13 Assuming
sellers had no foresight that this review purge was about to be undertaken, a subset of the
sellers who recruited fake reviews had the misfortune of doing so during or just before the
review purge occurred. Therefore, the products of these unlucky sellers should have no (or
a much smaller) increase in positive reviews after they recruited fake reviews compared to
the other products. We thus refer to the products that recruited fake reviews just before
or during the review purge as control products and all other products that recruited fake
reviews at different times as treated products. We can therefore employ a difference-in-
differences (DD) strategy that compares sales of treated products before and after they buy
fake reviews with respect to a baseline of changes in sales of control products, and estimate
the causal effect of rating manipulation on sales.
In our case, the DD identification strategy requires four assumptions to hold to identify
a causal effect. First, Amazon should not have strategically selected the products for which
reviews were deleted, i.e., control products should be similar to treated products in both
observable and unobservable characteristics. Second, the review purge should be effective
at preventing the control products from acquiring fake reviews. Third, treated and control13There is another spike in review deletion in May of 2020, but it affects substantially fewer reviews and
is not as long-lasting.
38

products should not differ in their use of marketing activities that can affect sales. Fourth,
the parallel trends assumption should hold, i.e., pre-treatment sales trends for treated and
controls products should be similar.
We start by presenting the empirical strategy setup, we then test each of the assumptions
discussed above, and finally, we proceed to estimate the effect of fake review recruiting on
sales.
5.1 Empirical strategy setup
We start by taking the midpoint date of the review purge, which is March 15, and defining our
set of control products as all products whose first observed Facebook post is in the interval
[-2,1] weeks around this date. This results in 74 control products. The 1,307 products whose
sellers started recruiting fake reviews outside of this window is the set of treated products.
We then estimate a standard DD regression which takes the following form:
yit = β1 Treatedi + β2 Afterit + β3 Treatedi × Afterit + αi + τt +X′
itγ + εit, (8)
where yit is the outcome of interest for product i at year-week t, Treatedi is an indicator for
whether product i is treated and Afterit is an indicator for the period after the first observed
Facebook post for product i. α are product fixed effects to account for time-invariant product
characteristics that could be correlated with the outcome, and τ are year-week fixed effects
to account for time-varying shocks to the outcome that affect all products (e.g., holidays).
The coefficient β2 measures the effect of fake review recruiting for control products and the
coefficient of interest, β3, is the classical DD estimate and it measures the difference in sales
for treated products. We estimate the regression in Equation 8 using OLS and clustering
standard errors at the product level.
39

5.2 Identification checks
Treated and control products are similar To test this assumption, we show that (1)
treated and control products are similar in most of their observable characteristics, and (2)
Amazon does not seem to select specific products with the review purge. In Table 6 we
compare treated and control products over a large set of variables by taking the average over
the period [-8,-2) weeks before the products begin to recruit fake reviews.14 We find that
control products are older, with lower average weekly ratings, and more cumulative reviews.
To reduce concerns about this difference, we employ Propensity Score Matching (Rosenbaum
and Rubin, 1983) to match treated and controls products on these variables and thus obtain
a more balanced set of products. We describe this procedure in detail in Appendix C.
Table 6: Comparison of Treated and Control Products
Control Treated t-stat
Age 9.84 7.15 2.36*
Weekly Avg. Ratings 4.10 4.32 −2.07*
Cum. Avg. Ratings 4.32 4.43 −1.36
Weekly Reviews 5.21 5.78 −0.33
Cumulative Reviews 234.80 109.90 3.11**
Price 27.10 33.60 −1.38
Coupon 0.23 0.26 −0.37
Verified 0.92 0.93 −0.60
Number of Photos 0.25 0.26 −0.15
Category 41.60 40.20 0.42
Note: t-test for equality of means for treated and control units. Means arecomputed at the interval level for the period [-8,-2) weeks.
Significance levels: * p<0.05, ** p<0.01, *** p<0.001.
Turning to Amazon’s criteria of selecting which products’ reviews are deleted, in Ap-
pendix D, we show that review deletion during the purge period is highly concentrated
on individual reviewers and is not targeted at specific products, further reassuring us that14We exclude weeks [-2,-1] because the analysis in Section 4.1 suggests that for some products, outcomes
start to change up to two weeks before the first Facebook post.
40

Amazon selection should not be an issue for this analysis.
Manipulation Check Here we present evidence showing that the review purge creates
a valid set of control products. To do so, the purge must prevent these products, who
were observed attempting to buy fake reviews, from receiving the treatment of an increase in
reviews. We do so by estimating Equation 8 with the outcome set to be the log of cumulative
reviews. We report these results in column 1 of Table 7. As expected, After is small and
close to zero, suggesting that there is no increase in reviews for treated products. However,
the interaction coefficient After× Treated, is positive and significant and suggests that the
number of cumulative reviews for treated products increased by approximately 10% more
than control products.
Table 7: Diff-in-Diff Estimates
(1) (2) (3) (4) (5)log Cum. Reviews Sponsored Coupon log Price log Sales Rank
After 0.047 0.014 0.011 −0.003 0.198*(0.036) (0.026) (0.047) (0.009) (0.097)
After × Treated 0.099* 0.027 −0.031 0.006 −0.375**(0.048) (0.032) (0.046) (0.013) (0.116)
PSM Sample Yes Yes Yes Yes YesN 12620 7477 7477 7417 11553R2 0.96 0.65 0.65 0.99 0.87
Note: All specifications include product and year-week FE. Cluster-robust standard errors (at the product level) in paren-theses.
Significance levels: * p<0.05, ** p<0.01, *** p<0.001.
Marketing activities are similar To investigate whether treated and control products’
marketing activities are similar, we estimate Equation 8 for three different outcomes: (1)
whether product i buys sponsored listings: (2) whether product i offers discounts through
coupons; and (3) product i price. We report these estimates in columns 2-4 of Table 7.
We do not observe any statistically significant change in sponsored listings, coupons, and
price after the first Facebook post for both treated and control products. Therefore, the
41

assumption about marketing activities being similar across treatment and control products
is satisfied.
Parallel trends Finally, we test the parallel assumption. To do so we estimate the fol-
lowing Equation:
yit = β1 Treatedi + β2 Afterit + γ Treatedi ×Weekit + αi + τt +X′
itγ + εit, (9)
where everything is as in Equation 8, and Weekit represents a set of dummies identifying
7-days intervals around the first Facebook post of each product. The γ coefficients can be
interpreted as weekly treatment effects estimated before and after the treatment with respect
to the baseline week -3.15 We plot these estimates along with their 95% confidence intervals
in Figure 14. Two findings emerge from this figure. First, while there is a decreasing trend in
the pre-treatment period, the estimates are indistinguishable from zero, suggesting that the
parallel trends assumption is satisfied. Second, in the post-treatment period, we observe a
large decrease in sales rank for treated products associated with the start of the fake review
recruiting (week 0), which points to a strong effect of fake reviews on sales. We proceed to
estimate the magnitude of this effect next.
5.3 The effect of fake reviews on sales
To measure the causal effect of fake reviews on sales, we estimate Equation 8 using as the
outcome the log of sales rank. We report these estimates in column 5 of Table 7. First,
we find that the sales rank of control products increases about 22%. This is in line with
the evidence we provided in Section 4.1 where we showed that products start recruiting fake
reviews after sales fall for a prolonged period. In the absence of rake reviews, sales are
therefore likely to continue to fall and thus sales rank should increase. Second, and in line15We choose to set the baseline week to be -3 because, as we discussed in Section 4.1 we observe that for
some products outcomes start to change at week -2
42
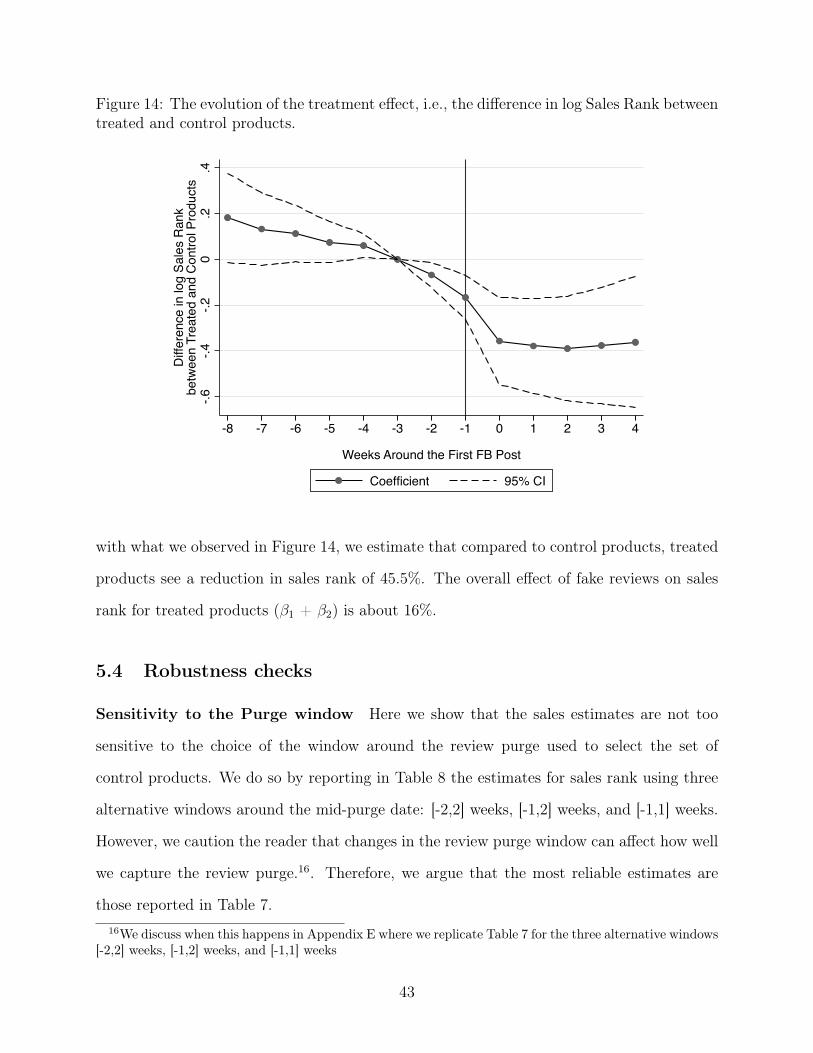
Figure 14: The evolution of the treatment effect, i.e., the difference in log Sales Rank betweentreated and control products.
-.6-.4
-.20
.2.4
Diff
eren
ce in
log
Sale
s R
ank
betw
een
Trea
ted
and
Con
trol P
rodu
cts
-8 -7 -6 -5 -4 -3 -2 -1 0 1 2 3 4
Weeks Around the First FB Post
Coefficient 95% CI
with what we observed in Figure 14, we estimate that compared to control products, treated
products see a reduction in sales rank of 45.5%. The overall effect of fake reviews on sales
rank for treated products (β1 + β2) is about 16%.
5.4 Robustness checks
Sensitivity to the Purge window Here we show that the sales estimates are not too
sensitive to the choice of the window around the review purge used to select the set of
control products. We do so by reporting in Table 8 the estimates for sales rank using three
alternative windows around the mid-purge date: [-2,2] weeks, [-1,2] weeks, and [-1,1] weeks.
However, we caution the reader that changes in the review purge window can affect how well
we capture the review purge.16. Therefore, we argue that the most reliable estimates are
those reported in Table 7.16We discuss when this happens in Appendix E where we replicate Table 7 for the three alternative windows
[-2,2] weeks, [-1,2] weeks, and [-1,1] weeks
43

Table 8: Diff-in-Diff using different purge windows
(1) (2) (3)Purge Window [-2,2] [-1,2] [-1,1]
After 0.166* 0.178* 0.198(0.070) (0.077) (0.115)
After × Treated −0.325*** −0.338*** −0.377**(0.086) (0.092) (0.131)
PSM Sample Yes Yes YesN 12512 12512 11553R2 0.85 0.85 0.87
Note: All specifications include product and year-week FE. Cluster-robust stan-dard errors (at the product level) in parentheses.
Significance levels: * p<0.05, ** p<0.01, *** p<0.001.
Continuous Treatment To further reduce concerns about our results being driven by
the way in which we select control products, here we show that our estimates are robust to
a continuous definition of the treatment. To do so, for each product, we define a treatment
variable, log Purge Distancei, which is equal to the log of the absolute value of the difference
in days between the mid-purge date (March 15, 2020) and the date of the first Facebook post
of each product. We then estimate Equation 8, but replacing the binary treatment variable
with this new continuous treatment. We report these results in Table 9. We observe that for
small values of the treatment variable, i.e., for products whose first Facebook post is very
close to the mid-purge date, there is no or small increase in the number of reviews and a
positive effect on sales. However, as the distance increases, the opposite is true for products
far from the mid-purge date. For example, at the median log Purge Distancei which is 3.89,
the increase in cumulative reviews is about 22% (p < 0.01) and the decrease is sales rank is
about 17% (p < 0.01).
Placebo review purge To further reinforce the validity of our estimates, we perform a
placebo test in which we create a placebo review purge by moving the mid-purge date either
four weeks back or four weeks forward. We estimate Equation 8 using these thresholds and
report these results in Table 10. As expected, we observe that recruiting fake reviews has
44

Table 9: Estimates using a continuous treatment variable
(1) (2) (3) (4) (5)log Cum. Reviews Sponsored Coupon log Price log Sales Rank
After 0.040 −0.042 −0.034 −0.025 0.362*(0.070) (0.047) (0.067) (0.019) (0.146)
After × log Purge Distance 0.041* 0.019 0.009 0.004 −0.135***(0.019) (0.013) (0.018) (0.005) (0.037)
N 15789 9543 9543 9463 15077R2 0.93 0.64 0.67 0.99 0.87
Note: All specifications include product and year-week FE. Cluster-robust standard errors (at the product level) in parentheses.Significance levels: * p<0.05, ** p<0.01, *** p<0.001.
a negative effect on sales rank for control products and that this effect is not different for
treated products.17
Table 10: Estimates using placebo review purges
(1) (2)4 weeks before 4 weeks after
After −0.166* −0.142*(0.079) (0.060)
After × Treated 0.027 0.001(0.086) (0.065)
N 15077 15077R2 0.87 0.87
Note: All specifications include product and year-week FE.Cluster-robust standard errors (at the product level) inparentheses.
Significance levels: * p<0.05, ** p<0.01, *** p<0.001.
6 Evidence of Consumer Harm from Fake Reviews
In this section, we evaluate the potential harm to consumers from fake reviews. To do so,
we analyze the long-term trends in consumer ratings for products observed being promoted17We do not use PSM in this exercise to further reinforce the fact that potential differences between treated
and control products are not driving the sales effects reported in Table 7 (however, we obtain qualitativelysimilar results when we apply PSM). In addition, using the full data sample and the real purge, we obtainresults consistent with those reported in Table 7.
45

using fake reviews. If these products continue to receive high ratings after the fake review
recruiting period ends it would provide evidence that fake reviews are used by high-quality
products in a manner akin to advertising. This would be consistent with the predictions of
theoretical results in Dellarocas (2006) and others. If, by contrast, we see declining ratings
and observe a large number of one-star reviews, it may suggest that the sellers buying fake
reviews are using them to mask the low quality of these products and deceive consumers into
buying them.
There is an inherent limitation in using ratings to infer welfare because consumers leave
ratings for many reasons and generally ratings are not a literal expression of utility. But
we argue that when products receive low ratings and a large number of one-star reviews,
it indicates that the actual quality of these products is lower than what many customers
expected at the time of their purchase. The low ratings are either a direct expression of
product quality or an attempt to realign the average rating back toward the true level and
away from the manipulated level. In this latter case, we might still infer some degree of
consumer harm, either because it indicates consumers paid a higher price than what they
would have if the product was not overrated due to rating manipulation, or because the
fake reviews caused them to buy a lower quality product than the closest alternative. This
analysis is also important from the platform’s perspective. An increase in one-star reviews
would indicate that fake reviews are a significant problem since they reflect negative consumer
experiences that should erode the sense of trust the platform’s reputation system is meant
to provide.
We therefore track the long-term trends for ratings and the share of reviews that come
with a rating of one star, the lowest possible rating, as an indicator of low product quality or
consumers who feel they have been deceived into buying these products. Lastly, we perform
a detailed text analysis of the post-recruiting one-star reviews to see if they are distinctive
compared with other one-star reviews and, if so, what text features they are associated with.
46

6.1 One-Star Ratings and Reviews
We have already shown in Figure 9 in Section 4.3 that ratings decline after fake review re-
cruiting ends. Figure 15 clearly explains why the average rating is dropping. The share of
one-star reviews starts to increase considerably once recruiting fake reviews stops. Interest-
ingly, these products end up having average ratings that are significantly worse than when
they began recruiting fake reviews (approximately interval -4).
Figure 15: 7-day average share of one-star reviews before and after fake reviews recruitingstops. The red dashed line indicates the last time we observe Facebook fake review recruiting.
0.08
0.10
0.12
0.14
0.16
−4 −2 0 2 4 6 8
Weeks around FB last post date
Sha
re o
f One
Sta
r
Next, we explore the long-term change in the share of one-star reviews for different
types of products. It may be the case that while one-star reviews increase after fake review
purchases stop, certain products are able to retain high ratings. For example, new products
(i.e., products with few reviews or that have been listed on Amazon for a brief period of
time) might use fake reviews to bootstrap their reputation, which they can sustain if these
products are high-quality products.
To test this hypothesis, we segment products by number of reviews and age. Figure 16
shows how the share of one-star reviews changes for products with fewer than 50 reviews at
the time they started recruiting fake reviews compared to all other products. The products
with few reviews show a somewhat sharper increase in one-star ratings. Figure 17 shows the
same outcome, but for products that have been listed on Amazon for fewer than 60 days
47
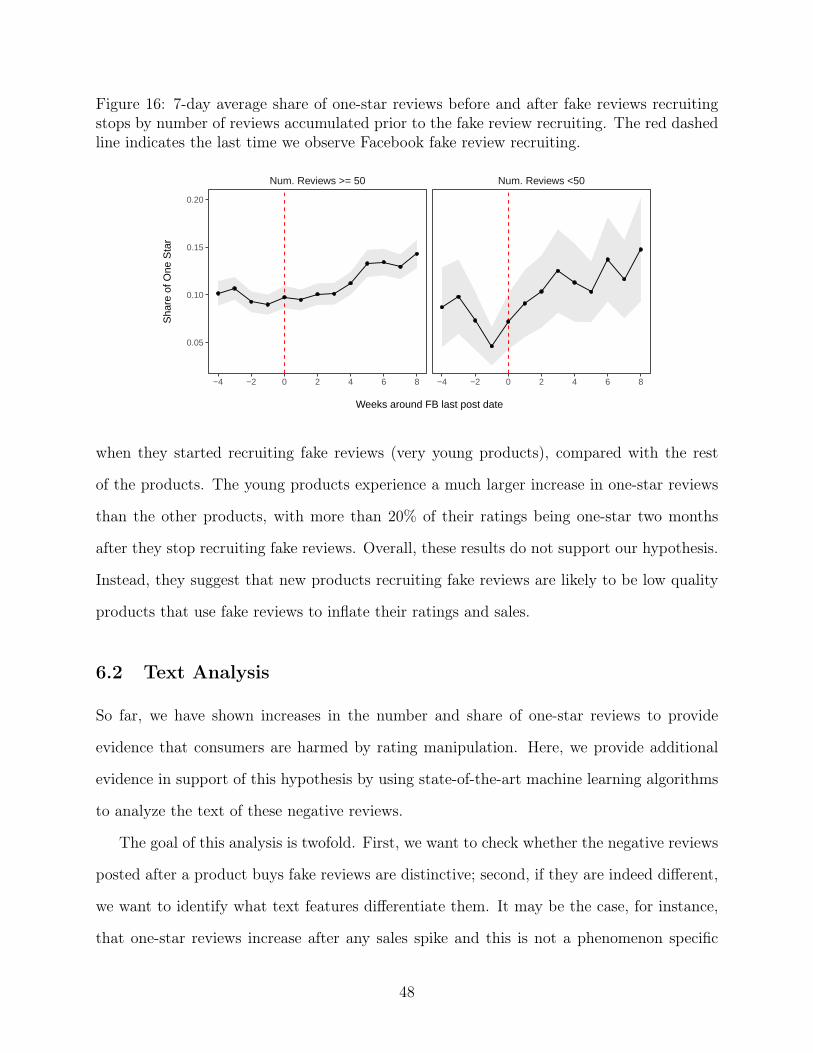
Figure 16: 7-day average share of one-star reviews before and after fake reviews recruitingstops by number of reviews accumulated prior to the fake review recruiting. The red dashedline indicates the last time we observe Facebook fake review recruiting.
Num. Reviews >= 50 Num. Reviews <50
−4 −2 0 2 4 6 8 −4 −2 0 2 4 6 8
0.05
0.10
0.15
0.20
Weeks around FB last post date
Sha
re o
f One
Sta
r
when they started recruiting fake reviews (very young products), compared with the rest
of the products. The young products experience a much larger increase in one-star reviews
than the other products, with more than 20% of their ratings being one-star two months
after they stop recruiting fake reviews. Overall, these results do not support our hypothesis.
Instead, they suggest that new products recruiting fake reviews are likely to be low quality
products that use fake reviews to inflate their ratings and sales.
6.2 Text Analysis
So far, we have shown increases in the number and share of one-star reviews to provide
evidence that consumers are harmed by rating manipulation. Here, we provide additional
evidence in support of this hypothesis by using state-of-the-art machine learning algorithms
to analyze the text of these negative reviews.
The goal of this analysis is twofold. First, we want to check whether the negative reviews
posted after a product buys fake reviews are distinctive; second, if they are indeed different,
we want to identify what text features differentiate them. It may be the case, for instance,
that one-star reviews increase after any sales spike and this is not a phenomenon specific
48

Figure 17: 7-day average share of one-star reviews before and after fake reviews recruitingstops by product age (very young products are those listed for fewer than 60 days). The reddashed line indicates the last time we observe Facebook fake review recruiting.
Product Age: All Other Product Age: Very Young
−4 −2 0 2 4 6 8 −4 −2 0 2 4 6 8
0.0
0.1
0.2
0.3
Weeks around FB last post date
Sha
re o
f One
Sta
r
to fake reviews. Our simple model discussed in Section 3 shows that the returns to rating
manipulation are more favorable to products with lower production costs, holding all else
equal, including price. It therefore predicts that negative reviews from these products are
likely to focus on quality issues and value relative to price. By analyzing the text of the
reviews, we can test whether the negative reviews received by fake review products are
distinctive from regular one-star reviews and use the text features to discern why they are
different and whether they indicate harm to consumers.
We perform two types of comparisons. First, we compare the post-campaign one-star
reviews for fake review products to the one-star reviews for these same products prior to
their first Facebook post. Second, we compare the post-campaign one-star reviews to one-
star reviews for a different set of products that were not observed buying fake reviews.
We start by sampling 5,000 one-star reviews of each type: from products recruiting fake
reviews prior to the first Facebook post, from those same products after the last Facebook
post, and from a set of competitor products.18 Then, we train a text-based classifiers to
predict whether each one-star review is from either before or after fake review recruiting, or18As we discuss in Section 2, competitor products are defined as those products showing up on the same
results page for a keyword search as the focal products.
49

in the second test, from either a product recruiting fake reviews or not. Following standard
practice, we split the review dataset into an 80% training sample and a 20% test sample.
We present the results using a Naive Bayes Classifier based on tf-idf. Depending on the
configuration of the classifier (we can change the number of text features used by the classifier
by removing very rare and very popular words), we achieve an accuracy rate that ranges
between 61% and 75% and a ROC-AUC score that varies between 66% and 83% for both
types of comparisons.19 These results suggest that, in both cases, the text of the reviews
is sufficiently distinctive for the classifier to distinguish between the different kinds of one-
star reviews. In other words, despite the products themselves being held constant and
their reviews having the same star-rating, the one-star reviews written for products after
fake review recruiting contain a significantly different set of words compared with one-star
reviews written beforehand. Similarly, these reviews contain a significantly different set of
words compared with one-star reviews written for the products that did not recruit fake
reviews.
We next look at what are the most predictive text features for distinguishing the differ-
ent product types. In Table 11, we compare the text features of negative reviews posted
before and after rating manipulation by reporting the top 30 features. What emerges from
this table is that one-star reviews written after rating manipulation occurs are predicted
by text features mostly related to product quality (“work”, “broke”, “stop work”) or value
(“money”, “waste money”) or else explicitly suggest the consumer felt deceived or harmed
(“return”, “disappoint”). By contrast, the one-star reviews for the same products prior to
rating manipulation are associated with idiosyncratic product features, such as “earplug”,
“milk frother”, or “duvet”.
In Table 12, we report the top features for the model trained to distinguish between
negative reviews from fake review products and competitor products. Again, reviews for fake
review products are associated with text features mostly related to product quality (“qualiti”,19Other types of classifiers led to similar performance.
50

“stop work”, “work”, etc.), value/price (“waste money”, “money”, “disappoint”, etc.); instead,
competitors’ one-star reviews are predicted by text features mostly related to idiosyncratic
product characteristic (“second attach”, “fade”, “reseal”, etc.)
Overall, these results are consistent with one another and add further evidence that
consumers who bought products that recruited fake reviews felt deceived in thinking that
the products were of higher quality than they really were.
Table 11: Most Predictive Text Features: Before v After Fake Reviews
Period Top 30 Text Features
Before recruiting fake reviews
muzzl, around neck, duvet, laundri, earplug, needless,
milk frother, foam earplug, rectal, topper, espresso,
lightn, like go, keep lick, nois reduct, degre differ, like
tri, frizzi, espresso machin, wildli, breath, work never,
expect much, concert, time open, stori, octob, inflat col-
lar, unsaf, vinegar
After recruiting fake reviews
work, product, money, return, use, month, wast, time,
would, wast money, stop, charg, like, even, disappoint,
broke, stop work, week, first, tri, light, back, good,
bought, batteri, qualiti, item, recommend, purchas, turn
Note: Model accuracy and ROC-AUC are 61% and 66%, respectively
51

Table 12: Most Predictive Text Features: Focal vs Non-Focal Products
Products Top 30 Text Features
Recruiting fake reviews
work, product, money, return, use, time, stop, wast,
month, would, like, wast money, charg, even, broke,
stop work, week, disappoint, good, back, light, first, tri,
bought, qualiti, review, turn, batteri, recommend, great
Not recruiting fake reviews
reseal, command, bang, fixtur, apart piec, septemb,
product dont, fade, ignit, use never, use standard, ter-
rier, compani make, desktop, love idea, wifi connect,
bead, solar panel, inexpens, within year, return sent,
compani product, second attach, pure, cycl, thought
great, solar charg, blame, bought march, price paid
Note: Model accuracy and ROC-AUC are 63% and 69%, respectively
7 Discussion and Conclusions
It has become commonplace for online sellers to manipulate their reputations on online
platforms. In this paper, we study the market for fake reviews on Amazon, one of the world’s
largest e-commerce platforms. We study how rating manipulation affects seller outcomes
both in the short term and in the long term. These two analyses allow us to study both the
immediate effectiveness of fake reviews and to understand whether these reviews are harming
consumers and online platforms or not.
We find that the Facebook promotion is highly effective at improving several sellers’
outcomes, such as number of reviews, ratings, search position rank, and sales rank, in the
short term. However, these effects are often short-lived as many of these outcomes return to
pre-promotion levels a few weeks after the fake reviews recruiting stops. In the long run, this
boost in sales does not lead to a positive self-sustaining relationship between organic ratings
52
and sales, and both sales and average ratings fall significantly once fake review recruiting
ends. Rating manipulation is not used efficiently by sellers to solve a cold-start problem, in
other words.
This decrease in ratings once sellers stop buying fake reviews and the large increase in the
share of one-star reviews suggest that consumers who bought these products felt deceived.
The implication is that they either overpaid for the true quality of the product or bought a
different, lower quality product than they would have in the absence of rating manipulation.
In addition to harming consumers, rating manipulation likely harms honest sellers and the
platform’s reputation itself. If large numbers of low-quality sellers are using fake reviews,
the signal value of high ratings could decrease, making consumers more skeptical of new and
highly rated products. This, in turn, would make it harder for new, high-quality sellers to
enter the market and would likely reduce innovation.
Firms are continuously improving and perfecting their manipulation strategies so that
findings that were true only a few years ago, or strategies that could have worked in the past
to eliminate fake reviews, might be outdated today. This is why studying and understanding
how firms manipulate their ratings continue to be an extremely important topic of research
for both academics and practitioners. As a testament to this, Amazon claims to have spent
over $500 million in 2019 alone and employed over 8,000 people to reduce fraud and abuse
on its platform.20
Our last finding is to document how Amazon responds to sellers recruiting fake reviews.
We find that Amazon responds by deleting reviews at a very high rate. Moreover, we find
that Amazon’s response is quite sophisticated. The timing of review deletion suggests that
it is able to identify which sellers and reviews are likely fake despite these reviews being very
similar to real ones. However, while review deletion seems well targeted, there is a large lag
between these reviews being posted and then deleted. In practice, this means that currently,
Amazon is not able to eliminate the short-term profits from these reviews or the consumer20See: https://themarkup.org/ask-the-markup/2020/07/21/how-to-spot-fake-amazon-product-reviews
53

backlash we see expressed in the large number of one-star reviews.
We can also document that Amazon does not use other potential policy levers at its
disposal to regulate fake reviews. We do not observe in our sample that Amazon either
deletes many products or bans sellers as a result of them manipulating their ratings. We
also do not observe punishment in the products’ organic ranking in keyword searches. This
keyword ranking stays elevated several months after fake review recruiting has ended, even
as Amazon finds and deletes many of the fake reviews posted on the platform. Reducing
product visibility in keyword rankings at the time fake reviews are deleted could potentially
turn fake reviews from a profitable endeavor into a highly unprofitable one.
It is not obvious whether Amazon is simply under-regulating rating manipulation in a
way that allows this market to continue to exist at such a large scale, or if it is assessing the
short-term profits that come from the boost in ratings and sales and weighing these against
the long-term harm to the platform’s reputation. Quantifying these two forces is, therefore,
an important area of future research.
54

ReferencesAnanthakrishnan, U., Li, B., and Smith, M. (2020). A tangled web: Should online review
portals display fraudulent reviews? Information Systems Research.
Anderson, E. and Simester, D. (2014). Reviews without a purchase: Low ratings, loyalcustomers, and deception. Journal of Marketing Research, 51.
Cabral, L. and Hortacsu, A. (2010). The Dynamics Of Seller Reputation: Evidence FromEbay. Journal of Industrial Economics, 58(1):54–78.
Chevalier, J. and Goolsbee, A. (2003). Measuring Prices and Price Competition Online:Amazon.com and BarnesandNoble.com. Quantitative Marketing and Economics, 1(2).
Chiou, L. and Tucker, C. (2018). Fake news and advertising on social media: A study of theanti-vaccination movement.
Dellarocas, C. (2006). Strategic manipulation of internet opinion forums: Implications forconsumers and firms. Management science, 52(10):1577–1593.
Einav, L., Farronato, C., and Levin, J. (2016). Peer-to-peer markets. Annual Review ofEconomics, 8(1):615–635.
Glazer, J., Herrera, H., and Perry, M. (2020). Fake reviews. The Economic Journal.
Gordon, B., Jerath, K., Katona, Z., Narayanan, S., Shin, J., and Wilbur, K. (2021). Ineffi-ciencies in digital advertising markets. Journal of Marketing, 85(1):7–25.
He, S. and Hollenbeck, B. (2020). Sales and rank on amazon.com.
Hollenbeck, B. (2018). Online reputation mechanisms and the decreasing value of chainaffiliation. Journal of Marketing Research, 55(5):636–654.
Hollenbeck, B., Moorthy, S., and Proserpio, D. (2019). Advertising strategy in the presenceof reviews: An empirical analysis. Marketing Science, pages 793–811.
Li, X., Bresnahan, T. F., and Yin, P.-L. (2016). Paying incumbents and customers to enteran industry: Buying downloads.
Luca, M. and Zervas, G. (2016). Fake it till you make it: Reputation, competition, and yelpreview fraud. Management Science, 62(12):3412–3427.
Mayzlin, D., Y., D., and Chevalier, J. (2014). Promotional Reviews: An Empirical Investi-gation of Online Review Manipulation. The American Economic Review, 104:2421–2455.
Milgrom, P. and Roberts, J. (1986). Prices and Advertising Signals of Product Quality.Journal of Political Economy, 94:297–310.
Nelson, P. (1970). Information and consumer behavior. Journal of political economy,78(2):311–329.
55

Proserpio, D. and Zervas, G. (2016). Online Reputation Management: Estimating the Impactof Management Responses on Consumer Reviews. Marketing Science.
Rao, A. (2021). Deceptive claims using fake news marketing: The impact on consumers.volume Forthcoming.
Rao, A. and Wang, E. (2017). Demand for “healthy” products: False claims and ftc regula-tion. Journal of Marketing Research, 54.
Rhodes, A. and Wilson, C. M. (2018). False advertising. The RAND Journal of Economics,49(2):348–369.
Rosenbaum, P. R. and Rubin, D. B. (1983). The central role of the propensity score inobservational studies for causal effects. Biometrika, 70(1):41–55.
Tadelis, S. (2016). Reputation and feedback systems in online platform markets. AnnualReview of Economics, 8(1):321–340.
Wilbur, K. and Zhu, Y. (2009). Click fraud. Marketing Science, 28(2):293–308.
Wu, Y. and Geylani, T. (2020). Regulating deceptive advertising: False claims and skepticalconsumers. Marketing Science, 39(4):669–848.
Yasui, Y. (2020). Controlling fake reviews.
56

Appendix
A Heterogeneous Effects
The regression tables contained in this appendix divide products into subgroups along four
dimensions. The first is the designation of some products as “cold-start” products. These
are new products without established reputations, who we may expect to have different
incentives to buy fake reviews or different outcomes afterwards. We define these products
as cold-start if they have been listed on Amazon for 4 or fewer months and have 8 or fewer
reviews. This is roughly 10% of the observed products. Next, we divide products into high
and low-priced based on the median price of products measured 1 week prior to when we
observe them posting in the FB groups for the first time.
Second, we designate product as high- vs. low-price products by using the median price
for the products in our sample.
Third, we designate products as durable vs non-durable. To do so, rather than hand-
code products or designate them based on category, we crowdsource this definition. We
solicit workers on Amazon MTurk for each product and ask them to select from a menu of
commonly accepted definitions of durable and non-durable products. For durability, they
view each product and answer whether it is either “Something that should last at 3 or more
years before it needs to be replaced” or “Something that is purchased multiple times in a
year.” They also have the option of selecting neither. We solicit two answers for each product
and only designate a product as either durable or non-durable if both workers agree. For
the products where the Mturkers disagreed or where one of them chose not to select either
phrasing, we treat the product as ambiguous, i.e. not falling into either category. The
results are that we code 63% of products as durable, 11% non-durable, and the remainder
as ambiguous.
Fourth, we use a similar procedure to define each product as a search good or an ex-
perience good, again using Mturk workers and commonly accepted definitions. We define
experience goods using the phrase “Need to test this product to tell if it is good or bad” and
search goods using the phrase “Can tell if this is a good or bad product just from the de-
57
scription”. They again have the option of selecting neither and we rely on consensus answers.
We code 24% of products as search goods and 34% as experience goods.
We present the short-term results in Appendix A.1 and the long-term results in Ap-
pendix A.2.
A.1 Short-term Results
58
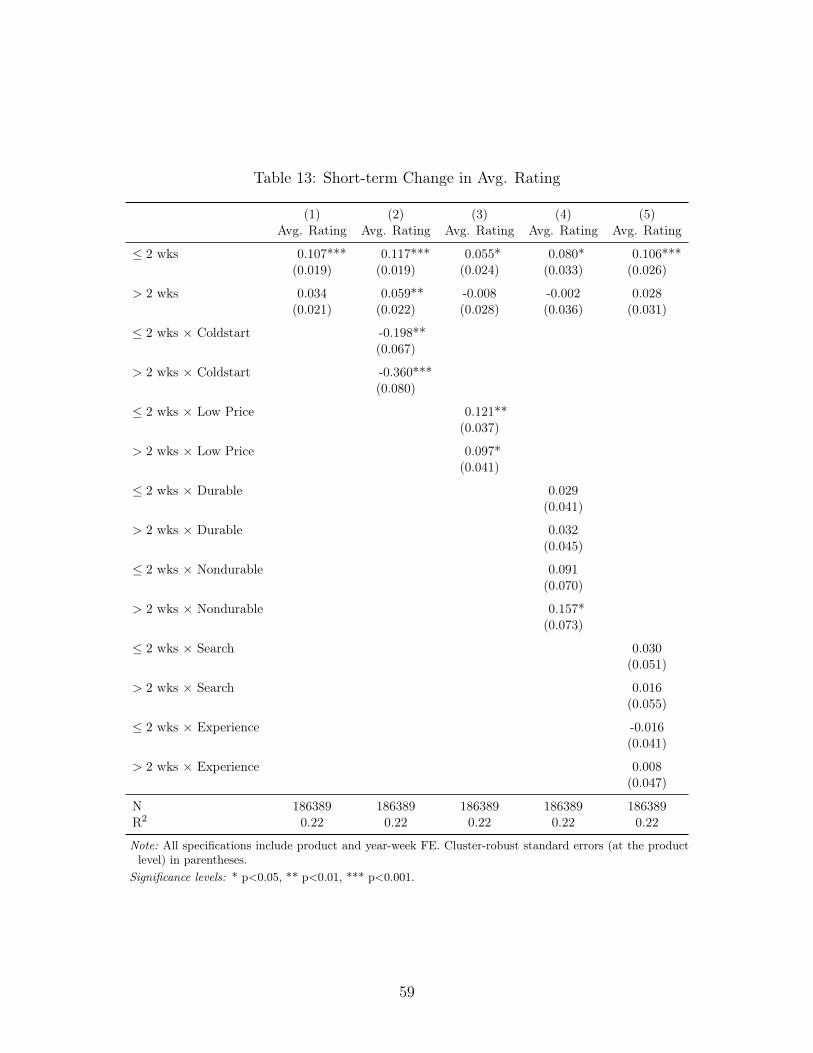
Table 13: Short-term Change in Avg. Rating
(1) (2) (3) (4) (5)Avg. Rating Avg. Rating Avg. Rating Avg. Rating Avg. Rating
≤ 2 wks 0.107*** 0.117*** 0.055* 0.080* 0.106***(0.019) (0.019) (0.024) (0.033) (0.026)
> 2 wks 0.034 0.059** -0.008 -0.002 0.028(0.021) (0.022) (0.028) (0.036) (0.031)
≤ 2 wks × Coldstart -0.198**(0.067)
> 2 wks × Coldstart -0.360***(0.080)
≤ 2 wks × Low Price 0.121**(0.037)
> 2 wks × Low Price 0.097*(0.041)
≤ 2 wks × Durable 0.029(0.041)
> 2 wks × Durable 0.032(0.045)
≤ 2 wks × Nondurable 0.091(0.070)
> 2 wks × Nondurable 0.157*(0.073)
≤ 2 wks × Search 0.030(0.051)
> 2 wks × Search 0.016(0.055)
≤ 2 wks × Experience -0.016(0.041)
> 2 wks × Experience 0.008(0.047)
N 186389 186389 186389 186389 186389R2 0.22 0.22 0.22 0.22 0.22
Note: All specifications include product and year-week FE. Cluster-robust standard errors (at the productlevel) in parentheses.
Significance levels: * p<0.05, ** p<0.01, *** p<0.001.
59

Table 14: Short-term Change in Weekly Reviews
(1) (2) (3) (4) (5)log Reviews log Reviews log Reviews log Reviews log Reviews
≤ 2 wks 0.445*** 0.439*** 0.460*** 0.417*** 0.448***(0.017) (0.018) (0.023) (0.030) (0.025)
> 2 wks 0.320*** 0.309*** 0.308*** 0.268*** 0.327***(0.020) (0.021) (0.028) (0.038) (0.030)
≤ 2 wks × Coldstart 0.091(0.057)
> 2 wks × Coldstart 0.142*(0.070)
≤ 2 wks × Low Price -0.034(0.034)
> 2 wks × Low Price 0.027(0.039)
≤ 2 wks × Durable 0.036(0.038)
> 2 wks × Durable 0.067(0.045)
≤ 2 wks × Nondurable 0.063(0.058)
> 2 wks × Nondurable 0.113(0.075)
≤ 2 wks × Search -0.106*(0.043)
> 2 wks × Search -0.074(0.050)
≤ 2 wks × Experience 0.057(0.039)
> 2 wks × Experience 0.028(0.046)
N 247218 247218 247218 247218 247218R2 0.67 0.67 0.67 0.67 0.67
Note: All specifications include product and year-week FE. Cluster-robust standard errors (at the productlevel) in parentheses.
Significance levels: * p<0.05, ** p<0.01, *** p<0.001.
60

Table 15: Short-term Change in Log Sales Rank
(1) (2) (3) (4) (5)log Sales Rank log Sales Rank log Sales Rank log Sales Rank log Sales Rank
≤ 2 wks -0.260*** -0.238*** -0.264*** -0.275*** -0.277***(0.022) (0.023) (0.030) (0.036) (0.031)
> 2 wks -0.246*** -0.217*** -0.263*** -0.252*** -0.249***(0.028) (0.029) (0.039) (0.050) (0.039)
≤ 2 wks × Coldstart -0.275**(0.085)
> 2 wks × Coldstart -0.349***(0.100)
≤ 2 wks × Low Price 0.007(0.043)
> 2 wks × Low Price 0.037(0.053)
≤ 2 wks × Durable 0.016(0.046)
> 2 wks × Durable -0.002(0.060)
≤ 2 wks × Nondurable 0.051(0.077)
> 2 wks × Nondurable 0.060(0.101)
≤ 2 wks × Search 0.078(0.057)
> 2 wks × Search 0.057(0.073)
≤ 2 wks × Experience -0.001(0.049)
> 2 wks × Experience -0.030(0.061)
N 193381 193381 193381 193381 193381R2 0.81 0.81 0.81 0.81 0.81
Note: All specifications include product and year-week FE. Cluster-robust standard errors (at the product level) in paren-theses.
Significance levels: * p<0.05, ** p<0.01, *** p<0.001.
61

Table 16: Short-term Change in Log Keyword Rank
(1) (2) (3) (4) (5)log Keyword Rank log Keyword Rank log Keyword Rank log Keyword Rank log Keyword Rank
≤ 2 wks -0.412*** -0.409*** -0.342*** -0.420*** -0.384***(0.028) (0.030) (0.034) (0.048) (0.043)
> 2 wks -0.434*** -0.440*** -0.361*** -0.419*** -0.396***(0.030) (0.031) (0.037) (0.054) (0.045)
≤ 2 wks × Coldstart -0.030(0.074)
> 2 wks × Coldstart 0.067(0.086)
≤ 2 wks × Low Price -0.168**(0.057)
> 2 wks × Low Price -0.173**(0.059)
≤ 2 wks × Durable 0.035(0.059)
> 2 wks × Durable 0.010(0.065)
≤ 2 wks × Nondurable -0.166(0.110)
> 2 wks × Nondurable -0.240*(0.119)
≤ 2 wks × Search -0.084(0.082)
> 2 wks × Search -0.107(0.086)
≤ 2 wks × Experience -0.034(0.060)
> 2 wks × Experience -0.050(0.062)
N 91733 91733 91733 91733 91733R2 0.64 0.64 0.64 0.64 0.64
Note: All specifications include product and year-week FE. Cluster-robust standard errors (at the product level) in parentheses.Significance levels: * p<0.05, ** p<0.01, *** p<0.001.
62

Table 17: Short-term Change in Sponsored Listings
(1) (2) (3) (4) (5)Sponsored Sponsored Sponsored Sponsored Sponsored
≤ 2 wks 0.044*** 0.049*** 0.015 0.067*** 0.028*(0.009) (0.010) (0.012) (0.016) (0.013)
> 2 wks 0.061*** 0.069*** 0.031* 0.086*** 0.045**(0.010) (0.011) (0.013) (0.018) (0.014)
≤ 2 wks × Coldstart -0.078*(0.031)
> 2 wks × Coldstart -0.114***(0.034)
≤ 2 wks × Low Price 0.069***(0.018)
> 2 wks × Low Price 0.070***(0.020)
≤ 2 wks × Durable -0.033(0.020)
> 2 wks × Durable -0.032(0.022)
≤ 2 wks × Nondurable -0.027(0.042)
> 2 wks × Nondurable -0.050(0.047)
≤ 2 wks × Search 0.008(0.028)
> 2 wks × Search 0.010(0.032)
≤ 2 wks × Experience 0.038*(0.019)
> 2 wks × Experience 0.037(0.021)
N 94122 94122 94122 94122 94122R2 0.55 0.55 0.55 0.55 0.55
Note: All specifications include product and year-week FE. Cluster-robust standard errors (at theproduct level) in parentheses.
Significance levels: * p<0.05, ** p<0.01, *** p<0.001.
63

A.2 Long-Term Results
Table 18: Long-term Change in Avg. Ratings
(1) (2) (3) (4) (5)Avg. Rating Avg. Rating Avg. Rating Avg. Rating Avg. Rating
≤ 2 wks -0.033 -0.026 -0.069** -0.079* -0.068*(0.018) (0.019) (0.022) (0.031) (0.026)
> 2 wks -0.156*** -0.146*** -0.182*** -0.202*** -0.163***(0.020) (0.020) (0.024) (0.035) (0.027)
≤ 2 wks × Coldstart -0.121(0.075)
> 2 wks × Coldstart -0.180*(0.079)
≤ 2 wks × Low Price 0.106**(0.037)
> 2 wks × Low Price 0.077(0.041)
≤ 2 wks × Durable 0.059(0.039)
> 2 wks × Durable 0.053(0.043)
≤ 2 wks × Nondurable 0.104(0.061)
> 2 wks × Nondurable 0.131*(0.067)
≤ 2 wks × Search 0.081(0.048)
> 2 wks × Search 0.023(0.053)
≤ 2 wks × Experience 0.054(0.040)
> 2 wks × Experience 0.005(0.043)
N 187640 187640 187640 187640 187640R2 0.22 0.22 0.22 0.22 0.22
Note: All specifications include product and year-week FE. Cluster-robust standard errors (at the productlevel) in parentheses.
Significance levels: * p<0.05, ** p<0.01, *** p<0.001.
64

Table 19: Long-term Change in Weekly Reviews
(1) (2) (3) (4) (5)log Reviews log Reviews log Reviews log Reviews log Reviews
≤ 2 wks 0.060*** 0.042* 0.006 0.001 0.030(0.018) (0.018) (0.022) (0.032) (0.026)
> 2 wks -0.239*** -0.251*** -0.283*** -0.301*** -0.254***(0.020) (0.021) (0.026) (0.038) (0.030)
≤ 2 wks × Coldstart 0.259***(0.064)
> 2 wks × Coldstart 0.186**(0.071)
≤ 2 wks × Low Price 0.156***(0.035)
> 2 wks × Low Price 0.128***(0.039)
≤ 2 wks × Durable 0.076*(0.039)
> 2 wks × Durable 0.083(0.045)
≤ 2 wks × Nondurable 0.122(0.065)
> 2 wks × Nondurable 0.118(0.073)
≤ 2 wks × Search 0.025(0.046)
> 2 wks × Search 0.063(0.049)
≤ 2 wks × Experience 0.074(0.040)
> 2 wks × Experience 0.006(0.045)
N 249444 249444 249444 249444 249444R2 0.67 0.67 0.67 0.67 0.67
Note: All specifications include product and year-week FE. Cluster-robust standard errors (at the productlevel) in parentheses.
Significance levels: * p<0.05, ** p<0.01, *** p<0.001.
65

Table 20: Long-term Change in Log Sales Rank
(1) (2) (3) (4) (5)log Sales Rank log Sales Rank log Sales Rank log Sales Rank log Sales Rank
≤ 2 wks -0.052** -0.041* -0.029 -0.056 -0.060*(0.019) (0.020) (0.024) (0.035) (0.029)
> 2 wks 0.082** 0.090** 0.110** 0.063 0.085*(0.027) (0.027) (0.034) (0.048) (0.038)
≤ 2 wks × Coldstart -0.151(0.083)
> 2 wks × Coldstart -0.114(0.108)
≤ 2 wks × Low Price -0.065(0.038)
> 2 wks × Low Price -0.079(0.051)
≤ 2 wks × Durable 0.008(0.042)
> 2 wks × Durable 0.023(0.057)
≤ 2 wks × Nondurable -0.005(0.064)
> 2 wks × Nondurable 0.051(0.093)
≤ 2 wks × Search 0.055(0.050)
> 2 wks × Search 0.017(0.068)
≤ 2 wks × Experience -0.010(0.042)
> 2 wks × Experience -0.019(0.057)
N 194840 194840 194840 194840 194840R2 0.81 0.81 0.81 0.81 0.81
Note: All specifications include product and year-week FE. Cluster-robust standard errors (at the product level) in paren-theses.
Significance levels: * p<0.05, ** p<0.01, *** p<0.001.
66

Table 21: Long-term Change in Log Keyword Rank
(1) (2) (3) (4) (5)log Keyword Rank log Keyword Rank log Keyword Rank log Keyword Rank log Keyword Rank
≤ 2 wks -0.169*** -0.171*** -0.143*** -0.143*** -0.139***(0.017) (0.018) (0.021) (0.031) (0.025)
> 2 wks -0.138*** -0.144*** -0.134*** -0.123** -0.124***(0.021) (0.021) (0.025) (0.038) (0.030)
≤ 2 wks × Coldstart 0.044(0.073)
> 2 wks × Coldstart 0.111(0.088)
≤ 2 wks × Low Price -0.074*(0.035)
> 2 wks × Low Price -0.015(0.042)
≤ 2 wks × Durable -0.018(0.038)
> 2 wks × Durable -0.004(0.045)
≤ 2 wks × Nondurable -0.148*(0.063)
> 2 wks × Nondurable -0.122(0.073)
≤ 2 wks × Search -0.078(0.048)
> 2 wks × Search -0.034(0.056)
≤ 2 wks × Experience -0.043(0.037)
> 2 wks × Experience -0.020(0.043)
N 97022 97022 97022 97022 97022R2 0.65 0.65 0.65 0.65 0.65
Note: All specifications include product and year-week FE. Cluster-robust standard errors (at the product level) in parentheses.Significance levels: * p<0.05, ** p<0.01, *** p<0.001.
67

Table 22: Long-term Change in Sponsored Listings
(1) (2) (3) (4) (5)Sponsored Sponsored Sponsored Sponsored Sponsored
≤ 2 wks 0.021*** 0.022*** 0.012 0.024* 0.012(0.005) (0.006) (0.007) (0.010) (0.008)
> 2 wks 0.036*** 0.040*** 0.031*** 0.040*** 0.035***(0.007) (0.007) (0.008) (0.012) (0.009)
≤ 2 wks × Coldstart -0.035(0.023)
> 2 wks × Coldstart -0.074*(0.029)
≤ 2 wks × Low Price 0.025*(0.012)
> 2 wks × Low Price 0.014(0.014)
≤ 2 wks × Durable -0.006(0.012)
> 2 wks × Durable -0.003(0.014)
≤ 2 wks × Nondurable -0.001(0.021)
> 2 wks × Nondurable -0.020(0.025)
≤ 2 wks × Search 0.001(0.015)
> 2 wks × Search -0.012(0.018)
≤ 2 wks × Experience 0.025*(0.012)
> 2 wks × Experience 0.011(0.014)
N 99409 99409 99409 99409 99409R2 0.56 0.56 0.56 0.56 0.56
Note: All specifications include product and year-week FE. Cluster-robust standard errors (at theproduct level) in parentheses.
Significance levels: * p<0.05, ** p<0.01, *** p<0.001.
68

B Sales Data
In this appendix, we first describe how we collect data on sales in units, and then how we
convert sales rank to sales in units for instances in which this is unobserved. Amazon does
not display metrics on sales quantities, only on an ordinal Best Seller Rank, a number that
ranks products based on their rate of sales relative to other products in the same category.
To acquire sales quantity data, we exploit a feature of the Amazon website that allows us
to infer the number of units of a product that are currently in stock. To observe a product’s
inventory, one must simply add to an Amazon cart increasing numbers of units of the product
until the seller runs out of stock. At this point, Amazon will display an alert telling the buyer
the total number of units available. The highest number of units that can be added to an
Amazon cart is 999 and so for products with inventories below 1000 this method allows us to
observe the number of units currently in stock. We employ research assistants to collect data
using this method for a panel of products every 2 days. By observing inventories repeatedly
over time, we can infer the rate of sales.
After collecting inventory data, we first remove observations in which the inventory is 0
or at the upper limit of 999 or if the seller has placed a limit on the number of units that
can be purchased. We then calculate the difference in inventories between each two day
period. We remove any observations where the inventory increases over this period. We use
the remaining data to calculate sales per day. A more detailed description of this procedure
and the resulting data can be found in He and Hollenbeck (2020). We observe data on sales
in units for 683 of the focal products.
These data do not cover every period and, most importantly, we cannot observe sales
data prior to the first FB post of these products. Therefore we estimate the relationship
between sales rank and sales in units using the sales data to approximate the level of sales
for these missing periods. To do so, we generalize the approach taken by Chevalier and
Goolsbee (2003) and estimate a log-log regression with product fixed effects. This provides a
good fit, with an adjusted-R2 of .89. More details on the estimation and alternative models
for estimated sales quantities are available in He and Hollenbeck (2020).
Lastly, we then use the regression estimates to infer the missing data on sales units at
69

different dates for the same set of products based on their observed rank on those dates. We
plot these outcomes in the short run and long run in Figures 5 and 10.
70

C Propensity Score Matching
To reduce concerns about differences between treated and control products that could affect
the DD estimates, we employ Propensity Score Matching (PSM) (Rosenbaum and Rubin,
1983) to match treated and control products on the observable variables that are different
across treatment conditions, i.e., age, weekly average ratings, and cumulative reviews. To
do so, for every product, we average these variables over the period [-8,2) weeks and then
implement PSM using a the Gaussian kernel matching procedure and imposing a common
support, i.e., we retain treatment observations whose propensity score is higher than the
maximum or less than the minimum propensity score of the controls. We start with 1,412
treated and 78 control products and, after matching, we are left with 987 treated and 48
control products. We verify that PSM eliminates the imbalance between treated and control
units by computing a weighted (using the PSM weights) t-test for equality of means of
treated and control products. We report the results of this test in Table 23 below.
Table 23: Comparison of Treated and Control Products after matching
Control Treated t-stat
Age 7.78 7.63 0.10
Weekly Avg. Ratings 4.07 4.15 −0.48
Cum. Avg. Ratings 4.34 4.33 0.07
Weekly Reviews 5.11 7.24 −0.72
Cumulative Reviews 109.48 124.69 −0.39
Price 25.74 32.63 −1.20
Coupon 0.24 0.27 −0.30
Verified 0.94 0.95 −0.31
Number of Photos 0.22 0.24 −0.19
Category 43.30 39.32 0.75
Note: Weighted t-test for equalty of means for treated and control units. Meansare computed at the interval level for the period [-8,-2) weeks.
Significance levels: * p<0.05, ** p<0.01, *** p<0.001.
71

D Analysis of the mid-march Amazon purge
We have done an investigation of the patterns in review deletion across products, time, and
reviewers in order to better understand the review “purge” and what selection criterion Ama-
zon is using for these deletions. We focus first on the distribution of deletions across products
and across reviewers to determine whether deletions are targeted at specific products buying
fake reviews or at reviewers writing them. To give an example of this logic: if 10% of reviews
were deleted during the review purge event, it could be that 10% of products were targeted
and they all had 100% of their reviews deleted or it could be that specific products were not
targeted and all products had about 10% of their reviews deleted. Similar analysis could
find if individual reviewers were targeted or if the deletions are uniform across reviewers (of
course these are extreme examples - reality must lie somewhere in between.)
We focus our investigation on the focal products (products observed buying fake reviews
on Facebook) and find that during the 2-week period we call the review “purge”, 3.2% of all
230,000 reviews are deleted. This is a small share of the total stock of reviews but in terms
of the flow of deletions is many times higher than during normal periods. These deletions
effect 40.6% of products (i.e. they have at least one review deleted) and 3.2% of reviewers.
This suggests deletions are targeted at a small group of specific reviewers and are not
targeted at a narrow set of products. We next show the distribution of the share of reviews
deleted at both the product and reviewer levels (conditional on having at least one review
deleted.) We plot histograms of each in Figure 18.
This figure shows that the vast majority (93%) of products affected by the review deletion
event have fewer than 20% of their reviews deleted and nearly half have fewer than 5% of their
reviews deleted. Among reviewers, the opposite pattern holds. The vast majority (87.5%) of
reviewers have all of their reviews deleted. This evidence is unfortunately biased, however,
by the nature of our data collection. We initially only collect reviews at the daily basis for
our focal products and so the set of reviewers we analyze here are those who have posted
on these products in this time period. We did not scrape these reviewers’ other reviews (for
non-focal products) at the time, as would be required to track the full share of their reviews
deleted at a given point in time. Therefore the vast majority (83%) of these reviewers have
72

Figure 18: Distribution of Deletions During Purge Event
Distribution of Deletions Across Products
Share of Reviews Deleted
Den
sity
0.0 0.2 0.4 0.6 0.8 1.0
02
46
8
Distribution of Deletions Across Reviewers
Share of Reviews Deleted
Den
sity
0.0 0.2 0.4 0.6 0.8 1.0
05
1015
only 1 review observed to begin with.
Yet, among reviewers with more than 1 review who have reviews deleted, the same pattern
does hold. In this group, reviewers with multiple reviews, at least one of which is deleted in
the review purge, 77% have 100% of their reviews deleted. When we condition on reviewers
having at least 5 reviews the share with all reviews deleted is 78%.
This analysis strongly suggests that individual products are not targeted when Amazon
deleted large numbers of reviews in mid-March 2020 but rather that individual reviewers
were targeted.
73

E Diff-in-Diff estimates for all outcomes using alternative
purge windows
Here, we report the DD estimates for all outcomes using alternative review purge windows.
Similarly to what we did with the main sample, before proceeding to the estimation, we use
PSM to balance the treated and control products. In Table 24, we increase the window by
one week by using a purge window of [-2,2] weeks around the mid-purge date; in Table 25, we
shift the purge window to the left by using a purge window of [-1,2] weeks around the mid-
purge date; in Table 26, we reduce the purge window by one week use a purge window of [-1,1]
weeks around the mid-purge date. As discussed in Section 5.4, sales estimates are similar to
the main estimates using a [-2,1] purge windows (see column 5 of Table 7). However, either
increasing or shifting the window to the left reduces our ability to capture the review purge as
demonstrated by the estimates in column 1 of Tables 24 and 25 (note, however that despite
the estimate not being significant at conventional levels, the increase in cumulative reviews is
always larger than that for control products). Instead, the estimates using a smaller window
(Table 26) are almost exactly the same as the main estimates reported in Table 7.
Table 24: Diff-in-Diff using purge window [-2,2] weeks around the mid-purge date.
(1) (2) (3) (4) (5)log Cum. Reviews Sponsored Coupon log Price log Sales Rank
After 0.087* 0.010 −0.026 −0.021* 0.166*(0.039) (0.021) (0.043) (0.010) (0.070)
After × Treated 0.052 0.038 0.002 0.016 −0.325***(0.047) (0.023) (0.047) (0.012) (0.086)
PSM Sample Yes Yes Yes Yes YesN 13706 7902 7902 7834 12512R2 0.95 0.68 0.68 0.99 0.85
Note: All specifications include product and year-week FE. Cluster-robust standard errors (at the product level) in paren-theses.
Significance levels: * p<0.05, ** p<0.01, *** p<0.001.
74

Table 25: Diff-in-Diff using purge window [-1,2] weeks around the mid-purge date.
(1) (2) (3) (4) (5)log Cum. Reviews Sponsored Coupon log Price log Sales Rank
After 0.065 0.006 −0.040 −0.030** 0.178*(0.033) (0.024) (0.047) (0.011) (0.077)
After × Treated 0.077 0.043 0.008 0.024 −0.338***(0.046) (0.026) (0.050) (0.014) (0.092)
PSM Sample Yes Yes Yes Yes YesN 13706 7902 7902 7834 12512R2 0.95 0.68 0.69 0.99 0.85
Note: All specifications include product and year-week FE. Cluster-robust standard errors (at the product level) in paren-theses.
Significance levels: * p<0.05, ** p<0.01, *** p<0.001.
Table 26: Diff-in-Diff using purge window [-1,1] weeks around the mid-purge date.
(1) (2) (3) (4) (5)log Cum. Reviews Sponsored Coupon log Price log Sales Rank
After 0.054 0.018 −0.020 −0.015 0.198(0.041) (0.031) (0.052) (0.010) (0.115)
After × Treated 0.103* 0.025 −0.016 0.018 −0.377**(0.052) (0.037) (0.048) (0.015) (0.131)
PSM Sample Yes Yes Yes Yes YesN 12620 7477 7477 7417 11553R2 0.96 0.65 0.65 0.99 0.87
Note: All specifications include product and year-week FE. Cluster-robust standard errors (at the product level) in paren-theses.
Significance levels: * p<0.05, ** p<0.01, *** p<0.001.
75


![Exploratory Study on Anchoring: Fake Vote Counts in ... · Online consumer reviews (online reviews or reviews hereafter) offer great value to customers [52]. About 70% of Americans](https://static.fdocuments.us/doc/165x107/5f4fa6d8a616a27fc4092f51/exploratory-study-on-anchoring-fake-vote-counts-in-online-consumer-reviews.jpg)