The mapping of hydrothermal alteration zones on the island ...
16
. . , 2001, 1–16, preview article RES 100586d The mapping of hydrothermal alteration zones on the island of Lesvos, Greece using an integrated remote sensing dataset G. FERRIER Department of Geography, University of Hull, Hull, HU6 7RX, England, UK K. WHITE, G. GRIFFITHS Department of Geography, University of Reading, Reading RG6 6AL, England, UK R. BRYANT Department of Geography, University of Sheffield, Sheffield S10 2TN, England, UK and M. STEFOULI Greek Geological Survey, Messigion Street, Athens, Greece (Received 23 August 1999; in final form 6 July 2000 ) Abstract. The mapping of hydrothermal alteration zones associated with epither- mal gold deposits on the island of Lesvos in Greece has been carried out using Landsat Thematic Mapper (TM) satellite and ground remote sensing data. The initial analysis of the satellite data using the minimum noise fraction, matched filter and spectral unmixing techniques identified the altered rock outcrops clearly. The identified pixels were almost completely contained within the highest grade alteration zones mapped by the field geologists. The analysis of the field spectro- scopy data using two quantitative techniques, spectral angle mapper and cross- correlogram spectral matching, identified clearly the presence of high grade kaolinite and alunite outcrops. The further application of the matched filter and spectral unmixing techniques using the additional information from the field spectroscopy survey identified the outcrop of alunite and kaolinite quite clearly. This study indicates the ability of existing satellite data combined with atmo- spheric correction and novel image processing techniques to locate the regions of highest mineral prospectivity. The addition of a limited amount of field spectro- scopy data into the processing of the satellite data suggests that two of the most diagnostic clay minerals can be differentiated. 1. Introduction Economic mineralization is often produced by fluid processes that substantially alter the mineralogy and chemistry of the host rocks. This alteration can produce distinctive assemblages of minerals that vary according to the location, degree and longevity of those flow processes. When exposed at the surface of the Earth this alteration can be mapped sometimes at a zonal pattern, in the simplest case concent- rically, around a core of highest grade alteration and greatest economic interest. International Journal of Remote Sensing ISSN 0143-1161 print/ISSN 1366-5901 online © 2001 Taylor & Francis Ltd http://www.tandf.co.uk/journals DOI: 10.1080/01431160010003857
Transcript of The mapping of hydrothermal alteration zones on the island ...
. . , 2001, 1–16, preview article
RES 100586d
The mapping of hydrothermal alteration zones on the island of Lesvos,Greece using an integrated remote sensing dataset
G. FERRIER
Department of Geography, University of Hull, Hull, HU6 7RX, England, UK
K. WHITE, G. GRIFFITHS
Department of Geography, University of Reading, Reading RG6 6AL, England,UK
R. BRYANT
Department of Geography, University of Sheffield, Sheffield S10 2TN, England,UK
and M. STEFOULI
Greek Geological Survey, Messigion Street, Athens, Greece
(Received 23 August 1999; in final form 6 July 2000)
Abstract. The mapping of hydrothermal alteration zones associated with epither-mal gold deposits on the island of Lesvos in Greece has been carried out usingLandsat Thematic Mapper (TM) satellite and ground remote sensing data. Theinitial analysis of the satellite data using the minimum noise fraction, matchedfilter and spectral unmixing techniques identified the altered rock outcrops clearly.The identified pixels were almost completely contained within the highest gradealteration zones mapped by the field geologists. The analysis of the field spectro-scopy data using two quantitative techniques, spectral angle mapper and cross-correlogram spectral matching, identified clearly the presence of high gradekaolinite and alunite outcrops. The further application of the matched filter andspectral unmixing techniques using the additional information from the fieldspectroscopy survey identified the outcrop of alunite and kaolinite quite clearly.This study indicates the ability of existing satellite data combined with atmo-spheric correction and novel image processing techniques to locate the regions ofhighest mineral prospectivity. The addition of a limited amount of field spectro-scopy data into the processing of the satellite data suggests that two of the mostdiagnostic clay minerals can be differentiated.
1. IntroductionEconomic mineralization is often produced by fluid processes that substantially
alter the mineralogy and chemistry of the host rocks. This alteration can producedistinctive assemblages of minerals that vary according to the location, degree andlongevity of those flow processes. When exposed at the surface of the Earth thisalteration can be mapped sometimes at a zonal pattern, in the simplest case concent-rically, around a core of highest grade alteration and greatest economic interest.
International Journal of Remote SensingISSN 0143-1161 print/ISSN 1366-5901 online © 2001 Taylor & Francis Ltd
http://www.tandf.co.uk/journalsDOI: 10.1080/01431160010003857

G. Ferrier et al.2
Recognition of such spatial patterns of alteration is one of the goals of explorationgeology.
Remote sensing provides information on the properties of the surface of explorationtargets that is potentially of value in mapping alteration zones. Broadband sensorssuch as the Landsat Thematic Mapper (TM) and the SPOT are capable of discriminat-ing between some rock types such as iron-rich and iron-poor lithologies. Narrow-band field instruments such as the Analytical Systems Devices (ASD) spectro-radiometer are capable of detecting spectral absorption’s in the visible to shortwaveinfrared specific to some individual minerals (Hunt 1977). If these minerals are indicat-ive of the type of alteration, and are present in sufficient quantities at the surface fromwhich solar radiation can be reflected to the sensor, then spectroradiometers offer theprospect of a valuable, additional source of data for the exploration geologist.
2. Study areaThe island of Lesvos lies in the east central Aegean and is characterized by two
main stratigraphic units, an epimetamorphic series forming the stratigraphic base-ment of the island and an overlying sequence of volcanic rocks of calc-alkalineaffinity consisting of andesitic lavas, acid pyroclastics and a number of intrusions.The shape of Lesvos has been determined by a sequence of extensional faultingwhich have formed two large grabens, running NE–SW (Gulf of Kalloni) and runningNW–SE (Gulf of Year) (figure 1). This paper is concerned with the study of two ofthe four discrete occurrences of hydrothermal alteration which are situated in arelatively narrow band (40 km×10 km) which runs SW–NE across the central sectionof the island (figure 1). The alteration ranges from argillic, pyritic to silicic levelsand is closely associated with the distribution of veins that were controlled byexisting fault patterns. These veins vary in length from several metres to severalkilometres and their widths vary from 5 to 30 m. These veins are enveloped byargillic–sericitic alteration, hosted in broadly propylitized andesite. Anomalous valuesof Cu, Pb, Zn, Au, Mo and Hg associated with sulphide mineralization have beendetected. The gold mineralization is associated with the highest levels of alterationwith the areas around Mesotopos and Stipsi being identified as having the highestpotential for gold mineralization with gold concentration varying from tens to a fewhundreds of a ppm.
These hydrothermal deposits have remained undisturbed by mining activity andtherefore provide an excellent simulation for assessing the applicability of remotesensing in identifying undiscovered mineral resources. Lesvos is composed almostentirely of hills giving excellent rock exposure in the area under study. Lesvos has avery arid climate and given that the satellite and ground data were obtained in latesummer this reduces further the possibility of disruption by atmospheric conditionsas well as minimizing the amount of vegetation cover.
3. Spectral characteristics of alteration mineral assemblagesRemote sensing data is of invaluable use in mapping hydrothermally altered
rocks because many of the alteration minerals produced have distinctive absorptionfeatures caused by the presence of OH, and other hydroxyl bonds: Mg-OH andAl-OH, particularly in the shortwave infrared (SWIR) part of the spectrum(2000–2400 nm) (Hunt 1977).
Laboratory reflectance spectra typical of the main diagnostic minerals of altera-tion zones around epithermal gold deposits are shown in figures 2(a) and (b). The

Mapping of hydrothermal alteration zones 3
Figure 1. Outcrop of hydrothermally altered rocks in north-central Lesvos as determinedfrom field mapping.

G. Ferrier et al.4
(a)
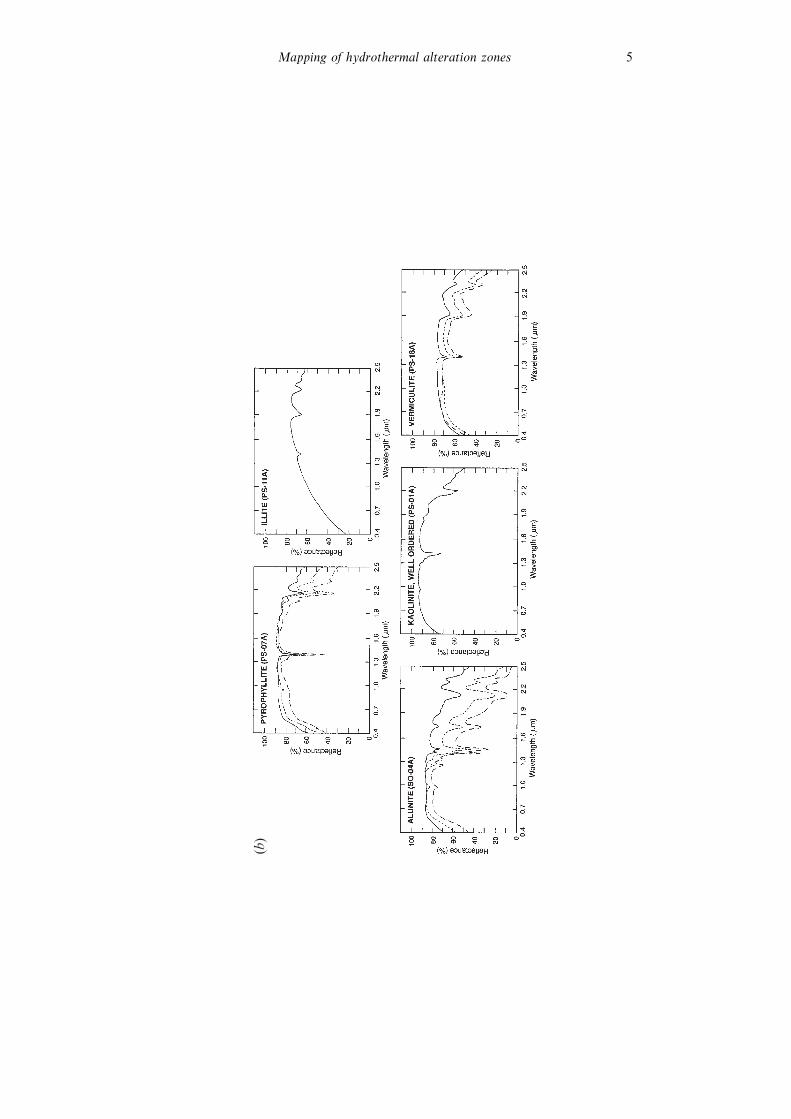
Figure 2. (a) VNIR Laboratory spectra of most important mineral species: hematite (OH-1A), goethite (OH-2A) and natrojarosite (SO-7A) (Grove et al. 1992). (b) Laboratoryspectra of main diagnostic minerals of the hydrothermal alteration zones: alunite,pyrophyllite, kaolinite, illite and vermicullite (from the USGS spectral library (inENVI Version 3.1, Research Systems, Inc. 1995).
wavelength positions, depths and number of absorption features allow the identifica-tion of a number of diagnostic minerals present and hence form the basis for mappingthe zonation of the alteration.
Mapping of hydrothermal alteration zones 5
(b)
G. Ferrier et al.6
4. Satellite remote sensingThe reflectance values retrieved from remotely sensed data are affected by many
factors including the physical state of the surface and its orientation towards the sunat the time of the data acquisition. Therefore even after the correction of the remotelysensed data for atmospheric effects only an apparent reflectance value can beretrieved. A correction for the effects of the intervening atmosphere was carried outusing the radiative transfer modelling software 6S (Vermote et al. 1995). The applica-tion of this technique is discussed fully in Ferrier and Wadge (1996) and Ferrier(1997).
4.1. Analysis and resultsThe first step in analysing the satellite remote sensing data was to carry out a
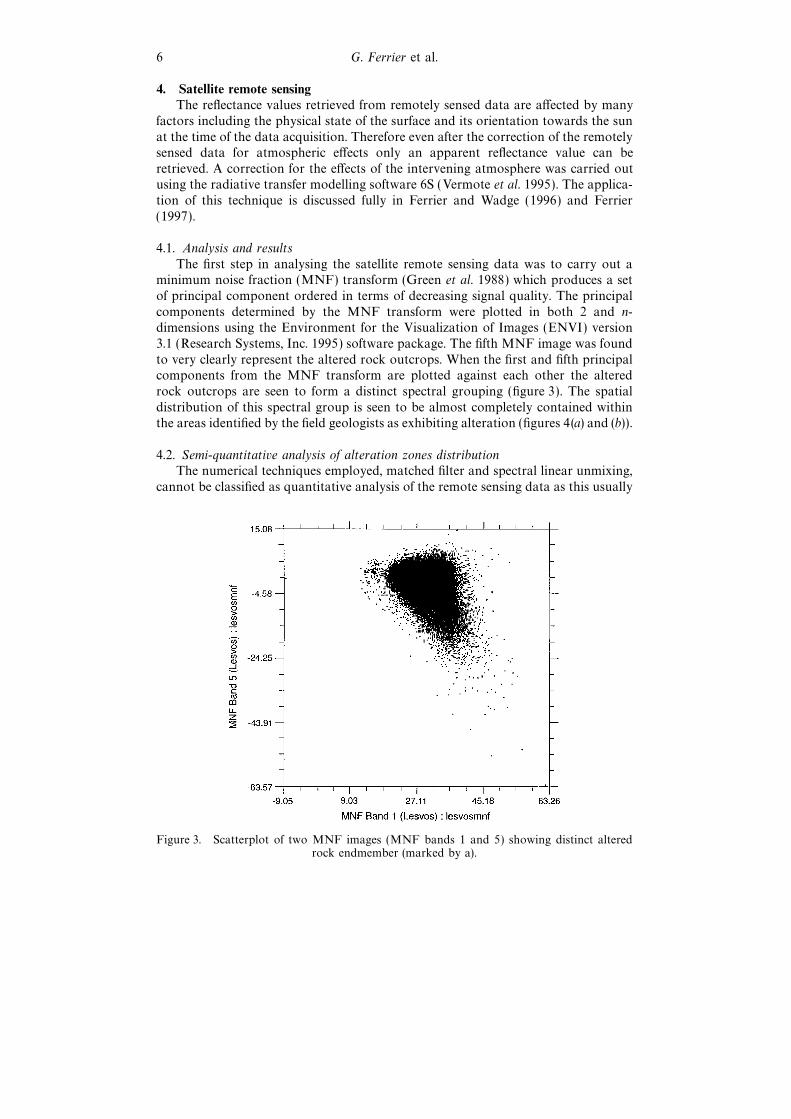
minimum noise fraction (MNF) transform (Green et al. 1988) which produces a setof principal component ordered in terms of decreasing signal quality. The principalcomponents determined by the MNF transform were plotted in both 2 and n-dimensions using the Environment for the Visualization of Images (ENVI) version3.1 (Research Systems, Inc. 1995) software package. The fifth MNF image was foundto very clearly represent the altered rock outcrops. When the first and fifth principalcomponents from the MNF transform are plotted against each other the alteredrock outcrops are seen to form a distinct spectral grouping (figure 3). The spatialdistribution of this spectral group is seen to be almost completely contained withinthe areas identified by the field geologists as exhibiting alteration (figures 4(a) and (b)).
4.2. Semi-quantitative analysis of alteration zones distributionThe numerical techniques employed, matched filter and spectral linear unmixing,
cannot be classified as quantitative analysis of the remote sensing data as this usually
Figure 3. Scatterplot of two MNF images (MNF bands 1 and 5) showing distinct alteredrock endmember (marked by a).

Mapping of hydrothermal alteration zones 7
(a) (b)
Figure 4. Distribution of altered rock endmember (as defined from the scatterplot in figure 3)around (a) Mesotopos and (b) Stipsi; displayed as red pixels. The dotted outlines arethe alteration zones identified by the field geologists (see figures 7(a) and 7(b)).
relates to concentration. This attribute is not readily obtainable from remote sensingdata because the length, or the distance through the surface material, traversed bya photon is not obtainable. These techniques will yield different estimates of meanpercent cover and are therefore most appropriately classed as semi-quantitative.
4.2.1. Matched filteringMatched filtering maximizes the response of a known endmember and suppresses
the response of the composite unknown background, thus ‘matching’ the knownsignature (Harsanyi and Chang 1994). Matched filtering performs a partial unmixing
(a)
(b)
Figure 5. Distribution of altered rock endmember calculated using matched filtering algo-rithm around (a) Mesotopos and (b) Stipsi, scaled between 0 ( lowest) and 1 (highest).The dotted outlines are the alteration zones identified by the field geologists (seefigures 7(a) and (b)).

G. Ferrier et al.8
finding the abundances of user-defined endmembers. It provides a rapid means ofdetecting specific minerals based on matches to specific library or image endmemberspectrum and does not require knowledge of all the endmembers within an imagescene. Matched filter results are presented as grey-scale images with values from 0to 1.0, which provide a means of estimating relative degree of match to the referencespectrum (where 1.0 is a perfect match). Two areas of altered rock outcrop identifiedin the field were selected from the TM image. A matched filter analysis was appliedusing these selected outcrops. The distributions of the identified areas were againalmost completely contained within the areas previously mapped as having beenaltered (figures 5(a) and (b)).
4.2.2. L inear spectral unmixingLinear spectral unmixing is a means of determining the relative abundances of
materials depicted in multispectral imagery based on the materials spectral character-istics. The reflectance at each pixel of the image is assumed to be a linear combinationof the reflectance of each material (or endmember) present within the pixel. Thenumber of endmembers must be no more than n+1 where n is the number of spectralbands (Adams et al. 1993). After identifying these types or endmembers from theimage or spectral library, the appropriate proportional mixture to fit the spectrumof each pixel is computed using least squares techniques (e.g. Settle and Drake 1993).
Spectral unmixing results are highly dependent on the input endmembers. Theanalysis of the MNF transform images indicated six spectrally distinct endmembers,altered rock, shade, country rock, forest, live vegetation and sea. As with the otheranalysis technique the altered rock outcrops were completely contained within theareas mapped as having been altered (figures 6(a) and (b)).
5. Field spectroscopyField surveys were conducted across two of the discrete alteration cells, to the
east of Mesotopos (i) and around Stipsi (ii) (figure 1). Spectra and ground samples
(a)
(b)
Figure 6. Distribution of altered rock endmember calculated by linear spectral unmixinganalysis around (a) Mesotopos and (b) Stipsi, scaled between 0 ( lowest) and 1 (highest).The dotted outlines are the alteration zones identified by the field geologists (seefigures 7(a) and (b)).

Mapping of hydrothermal alteration zones 9
from each of the representative zones as described by the Greek exploration geologistswere collected. At each sample site a number of spectra were taken of the exposedrock, the soil and gravel and the representative vegetation. Each spectral sampleconsists of three separate spectra which represents the average of 75 spectral scansobtained over 1 s. XRD (X-Ray Diffraction) analyses were carried out to confirmthe presence of the clay species identified by the ground spectra.
5.1. Quantitative analysis of endmember typesTo assist in the determination of these endmembers two quantitative techniques
have been applied to this spectral analysis. The first technique was the spectral anglemetric (Kruse et al. 1993) implemented in the spectral analyst function of the ENVIsoftware package. This algorithm determines the spectral similarity between theinput and the laboratory spectrum giving a match score between 0 and 1, with aresult of 1 indicating a perfect match. The second technique was a cross-correlogramspectral matching approach (Van der Meer and Bakker 1997). A cross-correlogramis constructed by calculating the cross-correlation coefficient between a test spectrum(a pixel spectrum) and a reference spectrum (a laboratory or endmember pixel) atdifferent match positions. By convention, the reference spectrum is moved andreferred to a negative match position when shifting toward a longer wavelength.Thus match position 1 means that we are calculating the cross-correlation betweenthe test spectrum and the reference spectrum in which all channels have been shiftedby one channel position number to the lower end of the spectrum. The cross-correlation, at each match position, m, is equivalent to the linear correlationcoefficient and is defined as the ratio of the covariance to the product of the sumof the standard deviations. If we denote the test and reference spectrum as l
tand l
r, respectively, and define n as the number of overlapping positions, the
cross-correlation for match position m can be calculated as
rm=
nSlrlt−Sl
rSl
t√[nSl2
r−(Sl
r)2 |nSl2
t−(Sl
t)2]
(1)
The cross-correlogram provides information for discriminating between mineralspecies, specifically the cross-correlation at m=0, the shape of the correlogram(defined by the skewness) and the position of the peak of the function.
5.2. Results of field spectroscopyTo extract as much information as possible from the field results the spectrum
were separated into three waveranges: (i) the visible to near infra-red (VNIR),0.4–1.2 mm, (ii) the near to short wave infrared (NSIR), 1.4–1.8 mm and (iii) the shortwave infrared (SWIR), 2.0–2.4 mm.
In the VNIR waverange the primary objective is to differentiate between thedifferent ferruginous mineral phases whereas in both the NSIR and SWIR waverangesthe primary aim is to differentiate between the different clay species. The spectraand the results of three examples of cross-correlation spectral matching from two ofthe field locations, MTOP1 and MTOP2, are shown in figures 7 and 8.
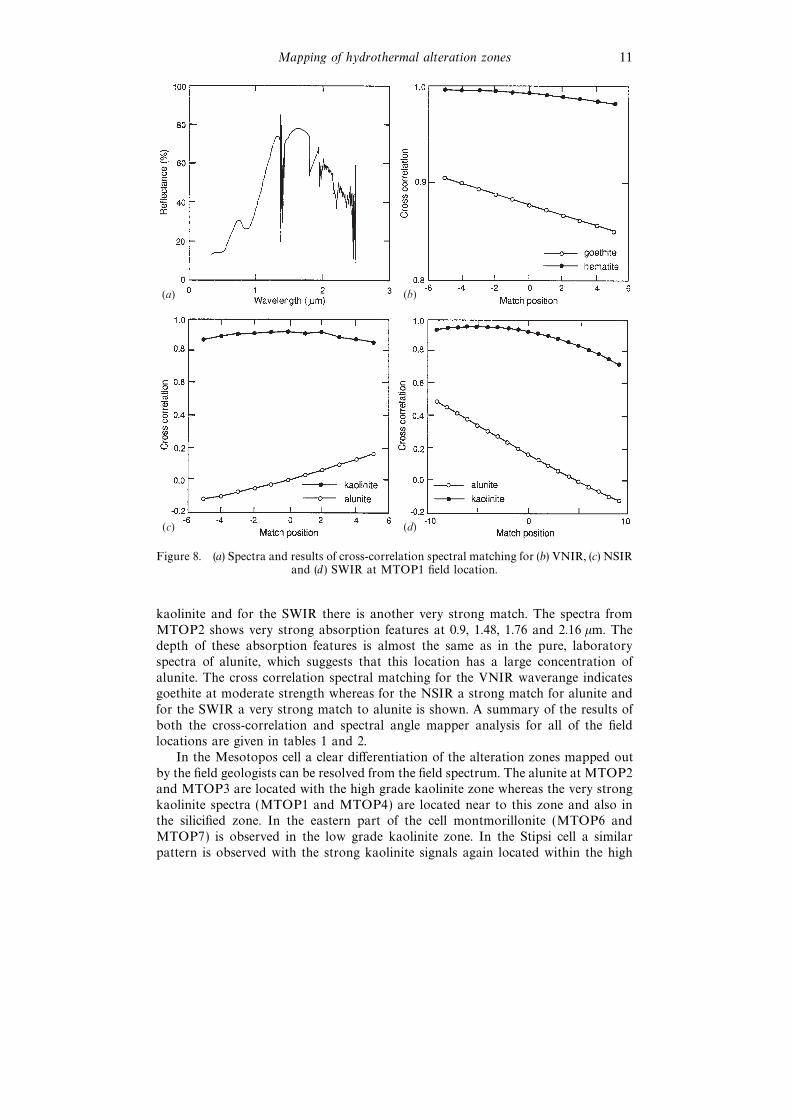
The spectrum from MTOP1 shows very strong absorption features at 0.9 and adoublet at 2.16 and 2.20. The depth of these absorption features is again very strong,75% of the kaolinite library spectra, suggesting a large concentration of kaolinite.The cross-correlation spectral matching for the VNIR waverange indicates goethitevery strongly whereas for the NSIR waverange there is a very strong match for

G. Ferrier et al.10
(a)
(b)
Figure 7. Location of field surveys at (a) Mesotopos and (b) Stipsi.
Mapping of hydrothermal alteration zones 11
(a) (b)
(c) (d)
Figure 8. (a) Spectra and results of cross-correlation spectral matching for (b) VNIR, (c) NSIRand (d ) SWIR at MTOP1 field location.
kaolinite and for the SWIR there is another very strong match. The spectra fromMTOP2 shows very strong absorption features at 0.9, 1.48, 1.76 and 2.16 mm. Thedepth of these absorption features is almost the same as in the pure, laboratoryspectra of alunite, which suggests that this location has a large concentration ofalunite. The cross correlation spectral matching for the VNIR waverange indicatesgoethite at moderate strength whereas for the NSIR a strong match for alunite andfor the SWIR a very strong match to alunite is shown. A summary of the results ofboth the cross-correlation and spectral angle mapper analysis for all of the fieldlocations are given in tables 1 and 2.
In the Mesotopos cell a clear differentiation of the alteration zones mapped outby the field geologists can be resolved from the field spectrum. The alunite at MTOP2and MTOP3 are located with the high grade kaolinite zone whereas the very strongkaolinite spectra (MTOP1 and MTOP4) are located near to this zone and also inthe silicified zone. In the eastern part of the cell montmorillonite (MTOP6 andMTOP7) is observed in the low grade kaolinite zone. In the Stipsi cell a similarpattern is observed with the strong kaolinite signals again located within the high

G. Ferrier et al.12
Table 1. Results of field survey around Mesotopos.
Location VVNIR MIDIR SWIR SAM results
MTOP1 very strong very strong very strong 0.959 (kaolinite)goethite kaolinite kaolinite
MTOP2 strong goethite very strong alunite very strong alunite 0.946 (alunite)MTOP3 strong goethite very strong alunite very strong alunite 0.951 (alunite)MTOP4 strong goethite weak kaolinite weak kaolinite 0.894 (kaolinite)MTOP5 no match no match no match no matchMTOP6 very strong weak weak 0.811
hematite montmorillonite montmorillonite (montmorillonite)MTOP7 strong goethite weak weak 0.875
montmorillonite montmorillonite (montmorillonite)AGRA no match no match no match no match
VVNIR, Visible to Very Near Infra Red; MIDIR, Middle Infra Red; SAM, SpectralAngle Mapper.
Table 2. Results of field survey around Stipsi.
Location VVNIR MIDIR SWIR SAM results
STIPS1 very strong no clear match very strong 0.90 (kaolinite)goethite kaolinite
STIPS2 strong goethite strong kaolinite very strong 0.947 (kaolinite)kaolinite
STIPS3 no match no match no match no matchSTIPS4 no match no match no match no matchSTIPS5 very strong moderate kaolinite moderate kaolinite 0.94 (kaolinite)
goethiteSTIPS6 very strong weak weak 0.976
goethite montmorillonite montmorillonite (montmorillonite)STIPS7 very strong moderate kaolinite moderate kaolinite 0.917 (kaolinite)
goethiteSTIPS8 strong goethite no match strong kaolinite 0.952 (kaolinite)STIPS9 no match no match no match no match
VVNIR, Visible to Very Near Infra Red; MIDIR, Middle Infra Red; SAM, SpectralAngle Mapper.
grade kaolinite zone and the silicified zone (STIPS1 and STIPS2), with the exceptionof STIPS5 which is outside the mapped area. At STIPS7 on the edge of the propylitic–kaolinite zone a weak kaolinite signal is observed while montmorillonite is againobserved within the low grade kaolinite zone (STIPS6). The occurrence of montmor-illonite at STIPS8 suggests that the field mapping is in error and this is a continuationof the low grade kaolinite zone.
6. Integration of ground and satellite remote sensing dataFrom the results of the field spectroscopy study it was possible to subdivide the
alteration outcrops identified in the TM data into two, (i ) goethite/alunite and(ii) goethite/kaolinite. Outcrops of these alteration types were then used asendmember inputs into the matched filter and spectral unmixing analysis.
In the Mesotopos alteration cell the outcrop of alunite produced from thematched filter and unmixing analysis are very similar picking out one very strong

Mapping of hydrothermal alteration zones 13
(a) (b)
(c) (d)
Figure 9. (a) Spectra and results of cross-correlation spectral matching for (b) VNIR, (c) NSIRand (d ) SWIR at MTOP2 field location.
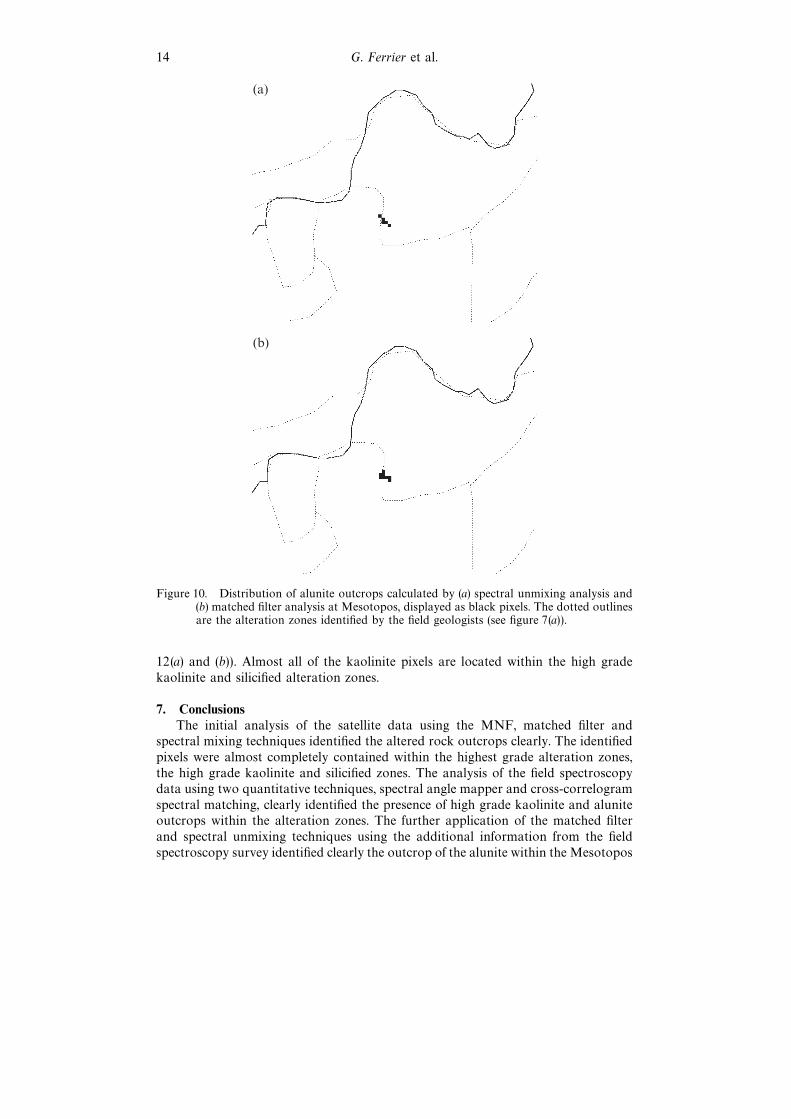
occurrence located approximately 2 km east of Mesotopos (figures 10(a) and 10(b)).In the output from the unmixing analysis the outcrop has a linear form trendingtowards the south-east which strongly suggests the alunite alteration is containedwithin a vein (figure 10(a)). The field geologists in the Mesotopos area mapped noalunite. When the alunite distribution from the remote sensing study is comparedto the alteration zones mapped by the field geologists it can be seen that the aluniteoutcrops at the edge of the high grade kaolinite with associated ferric oxides zone.The outcrop of kaolinite produced from the matched filter and unmixing analysisare again similar with the unmixing analysis picking out more pixels than thematched filter (figures 11(a) and 11(b)). Almost all of the kaolinite is located in thehigh grade kaolinite and the silicified alteration zones except along the south-westedge. This suggests that the silicified zone might extend further to the south-west.
In the Stipsi alteration cell there were no discernible occurrences of alunite. Theoutcrops of kaolinite produced from the matched filter and unmixing analysis aresimilar with the unmixing analysis producing significantly more match pixels (figures
G. Ferrier et al.14
(a)
(b)
Figure 10. Distribution of alunite outcrops calculated by (a) spectral unmixing analysis and(b) matched filter analysis at Mesotopos, displayed as black pixels. The dotted outlinesare the alteration zones identified by the field geologists (see figure 7(a)).
12(a) and (b)). Almost all of the kaolinite pixels are located within the high gradekaolinite and silicified alteration zones.
7. ConclusionsThe initial analysis of the satellite data using the MNF, matched filter and
spectral mixing techniques identified the altered rock outcrops clearly. The identifiedpixels were almost completely contained within the highest grade alteration zones,the high grade kaolinite and silicified zones. The analysis of the field spectroscopydata using two quantitative techniques, spectral angle mapper and cross-correlogramspectral matching, clearly identified the presence of high grade kaolinite and aluniteoutcrops within the alteration zones. The further application of the matched filterand spectral unmixing techniques using the additional information from the fieldspectroscopy survey identified clearly the outcrop of the alunite within the Mesotopos

Mapping of hydrothermal alteration zones 15
(a) (b)
Figure 11. Distribution of kaolinite outcrops calculated by (a) spectral unmixing analysisand (b) matched filter analysis at Mesotopos, scaled between 0 (lowest) and 1 (highest).The dotted outlines are the alteration zones identified by the field geologists (seefigure 7(a)).
(a) (b)
Figure 12. Distribution of kaolinite outcrops calculated by (a) spectral unmixing analysisand (b) matched filter analysis at Stipsi, scaled between 0 ( lowest) and 1 (highest). Thedotted outlines are the alteration zones identified by the field geologists (see figure 7(b)).
alteration cell. The linear form of the alunite outcrop strongly suggests its locationwithin a vein trending towards the south-east.
This study clearly indicates the ability of existing satellite data combined withatmospheric correction and novel image processing techniques to locate the regionsof highest mineral prospectivity. The addition of a limited amount of field spectro-scopy data into the processing of the satellite data suggested that two of the mostdiagnostic clay minerals could be differentiated. This confirms the benefits of integrat-ing different remote sensing datasets into the mapping of hydrothermal alterationzones.

Mapping of hydrothermal alteration zones16
ReferencesA, J. B., S, M. O., and G, A. R., 1993, Imaging spectroscopy: interpretation
based on spectral mixture analysis. In Remote Geochemical Analysis: Elemental andMineralogical Composition, edited by C. M. Pieters and P. A. J. Englert (New York:Cambridge University Press), pp. 145–166.
F, G., and W, G., 1996, The application of imaging spectrometry data to mappingalteration zones associated with gold mineralization in southern Spain. InternationalJournal of Remote Sensing, 17, 331–350.
F, G., 1997, Enhanced estimation of apparent surface reflectance. International Journalof Remote Sensing, 17, 2881–2889.
G, A. A., B, M., S, P., and C, M. D., 1988, A transformation forordering multispectral data in terms of image quality with implications for noiseremoval. IEEE T ransactions on Geoscience and Remote Sensing, 26, 65–74.
G, C. I., H, S. J., and P, E. D. (1992), Laboratory reflectance spectrum of 160minerals, 0.4–2.5 micron. JPL Publication 92-2, Jet Propulsion Laboratory, Pasadena,CA, USA, 280 pp.
H, J. C., and C, C. I., 1994, Hyperspectral image classification and dimensionalityreduction: an orthogonal subspace projection approach. IEEE T ransactions onGeoscience and Remote Sensing, 32, 779–785.
H, G. R., 1977, Spectral signatures of particulate minerals in the visible and near-infrared.Geophysics, 42, 501–503.
K, F. A., L, A. B., and B, J. W., 1993, The spectral image processingimage processing system (SIPS)—interactive visualization and analysis of imagingspectrometer data. Remote Sensing of Environment, 44, 145–163.
S, J. J., and D, N. A., 1993, Linear mixing and the estimation of ground coverproportions. International Journal of Remote Sensing, 14, 1159–1177.
V M, F., and B, W., 1997, Cross correlogram spectral matching: applicationto surface mineralogical mapping by using AVIRIS data from Cuprite, Nevada. RemoteSensing of Environment, 61, 371–382.
V, E., T, D., D, J. L., H, M., and M, J. J., 1995, On-line usermanual for the Second Simulation of the Satellite Signal in the Solar Spectrum (6S)software (version 3.2), software and manual obtainable on request from the authors.