The many faces of the learning crisis - World Bank · 2019-10-01 · The many faces of the learning...
17
The many faces of the learning crisis | 71 The global schooling expansion hides another statis- tic: for millions, schooling is not producing enough learning. Learning outcomes in basic education are so low, in so many contexts, that the developing world is facing a learning crisis. In many low-income coun- tries, learning levels are low in an absolute sense, while in many middle-income countries average learning levels remain far behind those in high- income countries. The learning crisis disproportion- ately affects children from poor households: they are far more likely to leave school without acquiring basic skills like literacy or numeracy. Ultimately, the learn- ing crisis translates into severe shortcomings in the skills of the workforce. For too many, learning isn’t happening In South Africa, 27 percent of 12-year-olds were enrolled in grade 6 but were functionally illiterate; in Zambia that share was 44 percent (Hungi and others 2010). Globally, 125 million children are not acquiring func- tional literacy or numeracy, even after spending at least four years in school. 1 In Malawi and Zambia in 2012, more than 89 percent of students could not read a single word by the end of grade 2. 2 In Guyana in 2008 (when the most recent data were collected), that share was 29 percent at the start of grade 3. 3 A similar picture emerges for numeracy. In rural India in 2016, less than 28 percent of students in grade 3 could master double-digit subtraction. 4 Emerging data on student achievement show that, for millions, schooling is producing little learning in crucial early grades. 5 Millions complete primary education without acquiring the basic competencies needed for further learning. According to a 2014 regional assessment, among grade 6 students in West and Central Africa, nearly 58 percent are not sufficiently competent in reading or mathematics to continue schooling (figure 3.1). 6 Similarly, the most recently available regional assessment of grade 6 students in southern and East Africa (from 2007) shows that 37 percent are not com- petent in reading, and more than 60 percent are not competent in mathematics (figure 3.2). 7 This lack of basic competency is systematically lower for students from poorer families. In Honduras, half of the grade 6 students from the poorest quintile scored at the low- est reading competency level in a 2013 regional Latin American assessment; only 7 percent of those from the richest quintile did (figure 3.3). Low-performing education systems are failing to meet their own curriculum standards (box 3.1). RabiaNura,a16-year-oldgirlfromKanoinnorthernNigeria,goestoschooldespite ever-presentthreatsfromBokoHaram.Sheisdeterminedtobecomeadoctor (Smith2014).But37millionAfricanchildrenwilllearnsolittleinschoolthatthey willnotbemuchbetteroffthankidswhoneverattendschool(vanFleet2012). Themanyfacesofthe learningcrisis 3
Transcript of The many faces of the learning crisis - World Bank · 2019-10-01 · The many faces of the learning...
The many faces of the learning crisis | 71
The global schooling expansion hides another statis-tic: for millions, schooling is not producing enough learning. Learning outcomes in basic education are so low, in so many contexts, that the developing world is facing a learning crisis. In many low-income coun-tries, learning levels are low in an absolute sense, while in many middle-income countries average learning levels remain far behind those in high- income countries. The learning crisis disproportion-ately affects children from poor households: they are far more likely to leave school without acquiring basic skills like literacy or numeracy. Ultimately, the learn-ing crisis translates into severe shortcomings in the skills of the workforce.
For too many, learning isn’t happening
In South Africa, 27 percent of 12-year-olds were enrolled in grade 6 but were functionally illiterate; in Zambia that share was 44 percent
(Hungi and others 2010).
Globally, 125 million children are not acquiring func-tional literacy or numeracy, even after spending at least four years in school.1 In Malawi and Zambia in 2012, more than 89 percent of students could not
read a single word by the end of grade 2.2 In Guyana in 2008 (when the most recent data were collected), that share was 29 percent at the start of grade 3.3 A similar picture emerges for numeracy. In rural India in 2016, less than 28 percent of students in grade 3 could master double-digit subtraction.4 Emerging data on student achievement show that, for millions, schooling is producing little learning in crucial early grades.5
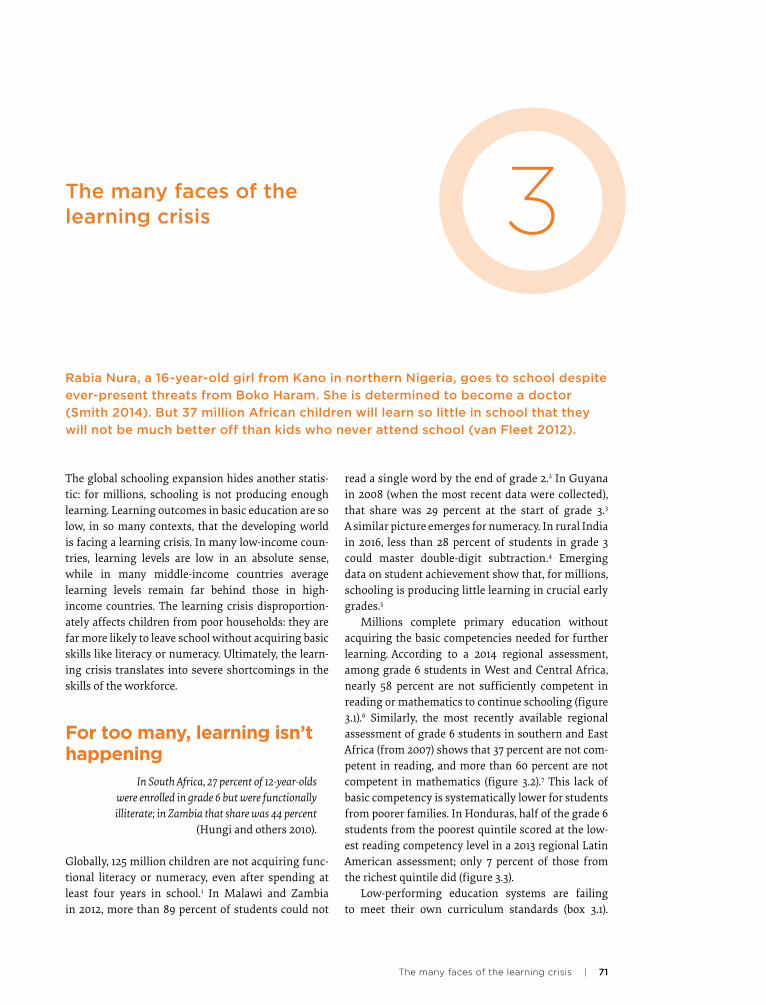
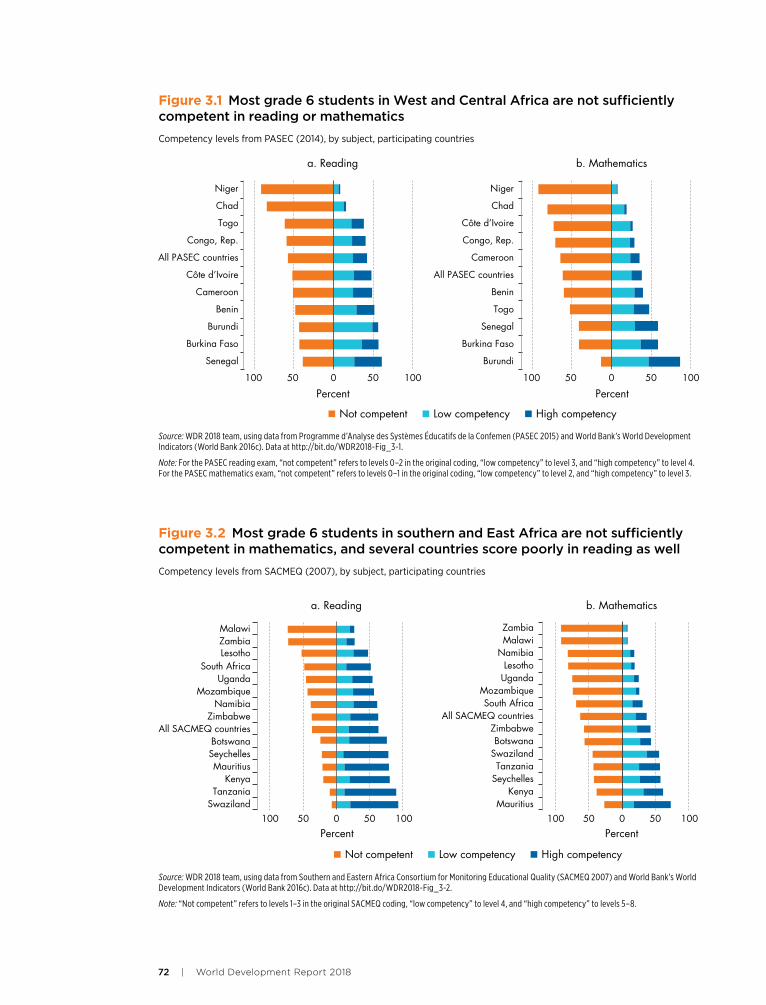
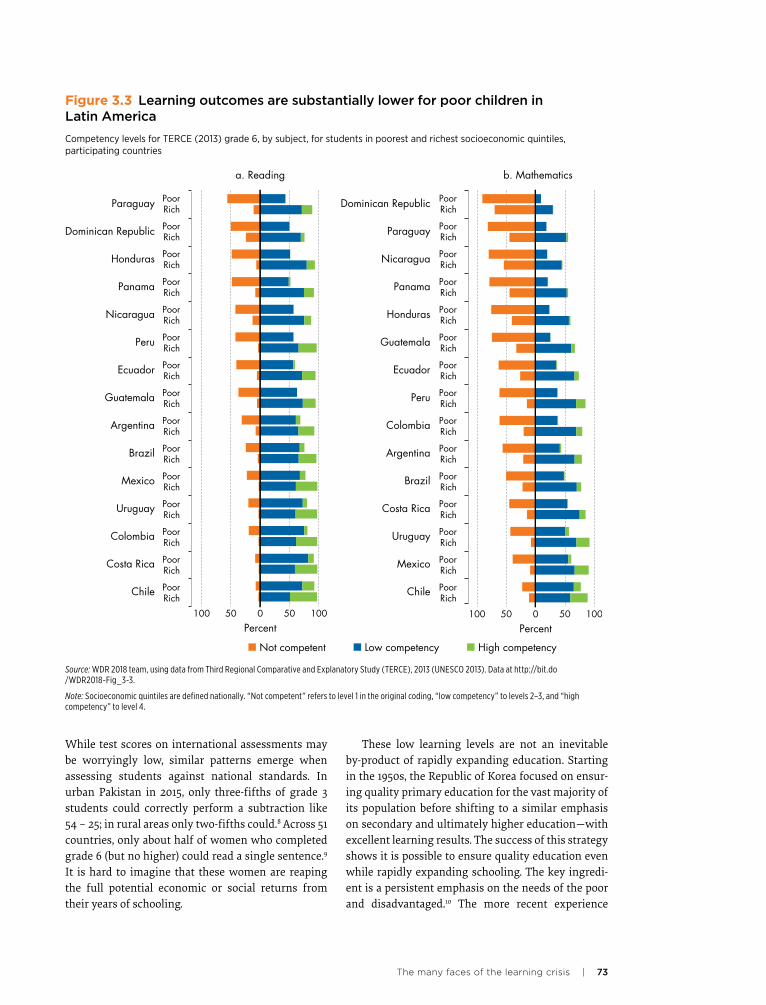
Millions complete primary education without acquiring the basic competencies needed for further learning. According to a 2014 regional assessment, among grade 6 students in West and Central Africa, nearly 58 percent are not sufficiently competent in reading or mathematics to continue schooling (figure 3.1).6 Similarly, the most recently available regional assessment of grade 6 students in southern and East Africa (from 2007) shows that 37 percent are not com-petent in reading, and more than 60 percent are not competent in mathematics (figure 3.2).7 This lack of basic competency is systematically lower for students from poorer families. In Honduras, half of the grade 6 students from the poorest quintile scored at the low-est reading competency level in a 2013 regional Latin American assessment; only 7 percent of those from the richest quintile did (figure 3.3).
Low-performing education systems are failing to meet their own curriculum standards (box 3.1).
�Rabia�Nura,�a�16-year-old�girl�from�Kano�in�northern�Nigeria,�goes�to�school�despite�
ever-present�threats�from�Boko�Haram.�She�is�determined�to�become�a�doctor�
(Smith�2014).�But�37�million�African�children�will�learn�so�little�in�school�that�they�
will�not�be�much�better�off�than�kids�who�never�attend�school�(van�Fleet�2012).
The�many�faces�of�the�learning�crisis 3
72 | World Development Report 2018
Source: WDR 2018 team, using data from Programme d’Analyse des Systèmes Éducatifs de la Confemen (PASEC 2015) and World Bank’s World Development Indicators (World Bank 2016c). Data at http://bit.do/WDR2018-Fig_3-1.
Note: For the PASEC reading exam, “not competent” refers to levels 0–2 in the original coding, “low competency” to level 3, and “high competency” to level 4. For the PASEC mathematics exam, “not competent” refers to levels 0–1 in the original coding, “low competency” to level 2, and “high competency” to level 3.
Figure 3.1 Most�grade�6�students�in�West�and�Central�Africa�are�not�sufficiently�competent�in�reading�or�mathematics
Competency levels from PASEC (2014), by subject, participating countries
100 50 0 50 100
Percent
Senegal
Burkina Faso
Burundi
Benin
Cameroon
Côte d’Ivoire
All PASEC countries
Congo, Rep.
Togo
Chad
Niger
a. Reading
Percent
Burundi
Burkina Faso
Senegal
Togo
Benin
All PASEC countries
Cameroon
Congo, Rep.
Côte d’Ivoire
Chad
Niger
b. Mathematics
Not competent Low competency High competency
100 50 0 50 100
Figure 3.2 Most�grade�6�students�in�southern�and�East�Africa�are�not�sufficiently�competent�in�mathematics,�and�several�countries�score�poorly�in�reading�as�well�
Competency levels from SACMEQ (2007), by subject, participating countries
Source: WDR 2018 team, using data from Southern and Eastern Africa Consortium for Monitoring Educational Quality (SACMEQ 2007) and World Bank’s World Development Indicators (World Bank 2016c). Data at http://bit.do/WDR2018-Fig_3-2.
Note: “Not competent” refers to levels 1–3 in the original SACMEQ coding, “low competency” to level 4, and “high competency” to levels 5–8.
Percent Percent100 50 0 50 100
SwazilandTanzania
KenyaMauritius
SeychellesBotswana
All SACMEQ countriesZimbabwe
NamibiaMozambique
UgandaSouth Africa
LesothoZambiaMalawi
a. Reading
MauritiusKenya
SeychellesTanzania
SwazilandBotswana
ZimbabweAll SACMEQ countries
South AfricaMozambique
UgandaLesotho
NamibiaMalawiZambia
b. Mathematics
100 50 0 50 100
Not competent Low competency High competency
The many faces of the learning crisis | 73
These low learning levels are not an inevitable by-product of rapidly expanding education. Starting in the 1950s, the Republic of Korea focused on ensur-ing quality primary education for the vast majority of its population before shifting to a similar emphasis on secondary and ultimately higher education—with excellent learning results. The success of this strategy shows it is possible to ensure quality education even while rapidly expanding schooling. The key ingredi-ent is a persistent emphasis on the needs of the poor and disadvantaged.10 The more recent experience
While test scores on international assessments may be worryingly low, similar patterns emerge when assessing students against national standards. In urban Pakistan in 2015, only three-fifths of grade 3 students could correctly perform a subtraction like 54 – 25; in rural areas only two-fifths could.8 Across 51 countries, only about half of women who completed grade 6 (but no higher) could read a single sentence.9 It is hard to imagine that these women are reaping the full potential economic or social returns from their years of schooling.
Figure 3.3 Learning�outcomes�are�substantially�lower�for�poor�children�in��Latin�America
Competency levels for TERCE (2013) grade 6, by subject, for students in poorest and richest socioeconomic quintiles, participating countries
Source: WDR 2018 team, using data from Third Regional Comparative and Explanatory Study (TERCE), 2013 (UNESCO 2013). Data at http://bit.do /WDR2018-Fig_3-3.
Note: Socioeconomic quintiles are defined nationally. “Not competent” refers to level 1 in the original coding, “low competency” to levels 2–3, and “high competency” to level 4.
Not competent Low competency High competency
100 50 0 50 100
Percent
Chile
Costa Rica
Colombia
Uruguay
Mexico
Brazil
Argentina
Guatemala
Ecuador
Peru
Nicaragua
Panama
Honduras
Dominican Republic
Paraguay RichPoor
RichPoor
RichPoor
RichPoor
RichPoor
RichPoor
RichPoor
RichPoor
RichPoor
RichPoor
RichPoor
RichPoor
RichPoor
RichPoor
RichPoor
a. Reading
Chile
Mexico
Uruguay
Costa Rica
Brazil
Argentina
Colombia
Peru
Ecuador
Guatemala
Honduras
Panama
Nicaragua
Paraguay
Dominican Republic
b. Mathematics
100 50 0 50 100
Percent
RichPoor
RichPoor
RichPoor
RichPoor
RichPoor
RichPoor
RichPoor
RichPoor
RichPoor
RichPoor
RichPoor
RichPoor
RichPoor
RichPoor
RichPoor
74 | World Development Report 2018
standards of quality has steadily increased over the last 25 years.16
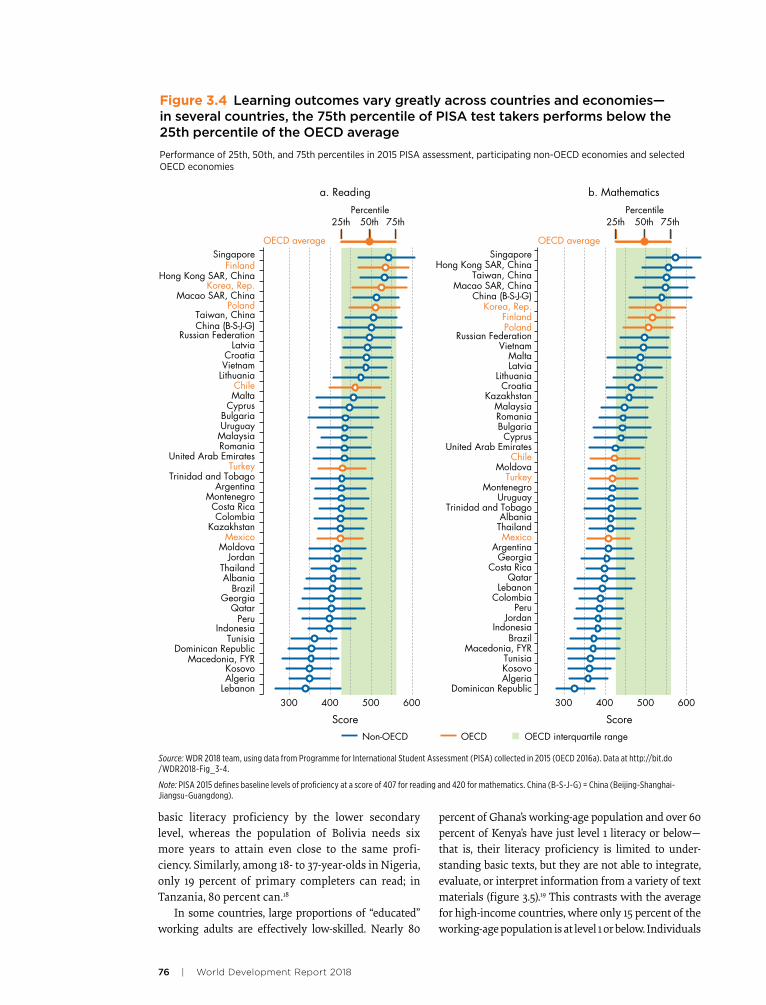
Low student achievement in some middle-income countries relative to their economic competitors signals a failure to live up to their own expectations. According to the leading international assessments of literacy and numeracy, the average student in low-income countries performs worse than 95 percent of the students in Organisation for Economic Co-oper-ation and Development (OECD) countries—meaning that student would be singled out for remedial atten-tion in a class in a wealthier country.17 In Colombia, Indonesia, and Peru, student performance at the 75th percentile on the PISA math test is barely above that at the 25th percentile of the OECD average. In Algeria, the Dominican Republic, Kosovo, and Tunisia, it is below the 25th percentile of the OECD average (figure 3.4). The disparity between the average PISA score for Latin American countries and OECD countries is equivalent to over two full years of math education. Based on its rate of progress in average PISA scores from 2003 to 2015, it would take Tunisia over 180 years to reach the OECD average in math. This slow rate of improvement is especially problematic for middle- income countries trying to position themselves as important players in the global economic landscape.
The mapping between schooling and workforce skills varies dramatically across countries. For exam-ple, the working-age population in Colombia reaches
of Vietnam reinforces that lesson; it, too, has main-tained education quality during rapid expansion by ensuring that disadvantaged students receive rela-tively equitable access to quality schooling.11
Even in middle-income countries, millions of students are lagging behind. In Brazil, internation-ally comparable assessments reveal that more than three-quarters of youth are reaching the age of 15 without being able to perform at the lowest level of competence on the Programme for International Student Assessment (PISA) tests.12 Similarly, a third of students in Paraguay have only a basic grasp of read-ing skills (“reading for meaning”) by grade 6.13 These students are therefore ill-equipped to participate in their economy and society.14 These numbers also show interesting gender-based differences (box 3.2).
However, some countries are doing better. Albania, Peru, and Portugal have made impressive progress in improving average student achievement relative to countries with similar incomes.15 Latvia outperforms several countries in eastern Europe; Vietnam is a positive outlier in Southeast Asia. Although it is not always possible to clearly isolate the factors responsible for systemwide improve-ments in student learning, a policy focus on educa-tion quality appears to be important. For example, a major component of Vietnam’s strong performance has been a convergence in school quality within the country. The share of schools that meet the national
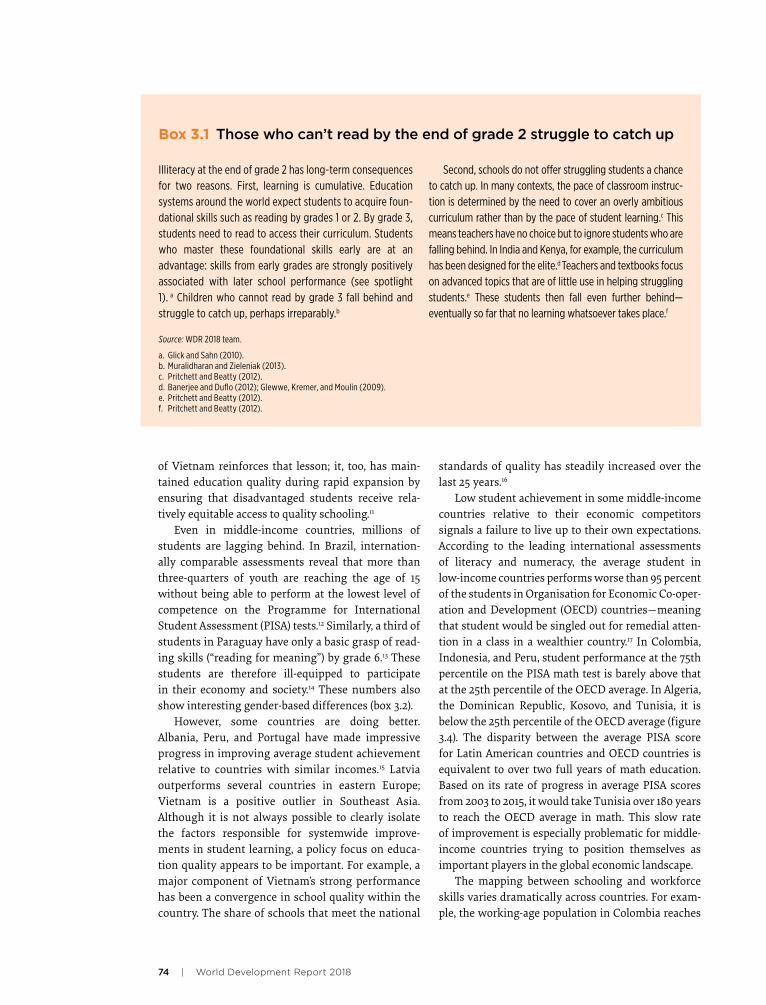
Box 3.1 Those�who�can’t�read�by�the�end�of�grade�2�struggle�to�catch�up�
Illiteracy at the end of grade 2 has long-term consequences for two reasons. First, learning is cumulative. Education systems around the world expect students to acquire foun-dational skills such as reading by grades 1 or 2. By grade 3, students need to read to access their curriculum. Students who master these foundational skills early are at an advantage: skills from early grades are strongly positively associated with later school performance (see spotlight 1). a Children who cannot read by grade 3 fall behind and struggle to catch up, perhaps irreparably.b
Second, schools do not offer struggling students a chance to catch up. In many contexts, the pace of classroom instruc-tion is determined by the need to cover an overly ambitious curriculum rather than by the pace of student learning.c This means teachers have no choice but to ignore students who are falling behind. In India and Kenya, for example, the curriculum has been designed for the elite.d Teachers and textbooks focus on advanced topics that are of little use in helping struggling students.e These students then fall even further behind—eventually so far that no learning whatsoever takes place.f
Source: WDR 2018 team.
a. Glick and Sahn (2010).b. Muralidharan and Zieleniak (2013).c. Pritchett and Beatty (2012).d. Banerjee and Duflo (2012); Glewwe, Kremer, and Moulin (2009). e. Pritchett and Beatty (2012).f. Pritchett and Beatty (2012).
The many faces of the learning crisis | 75
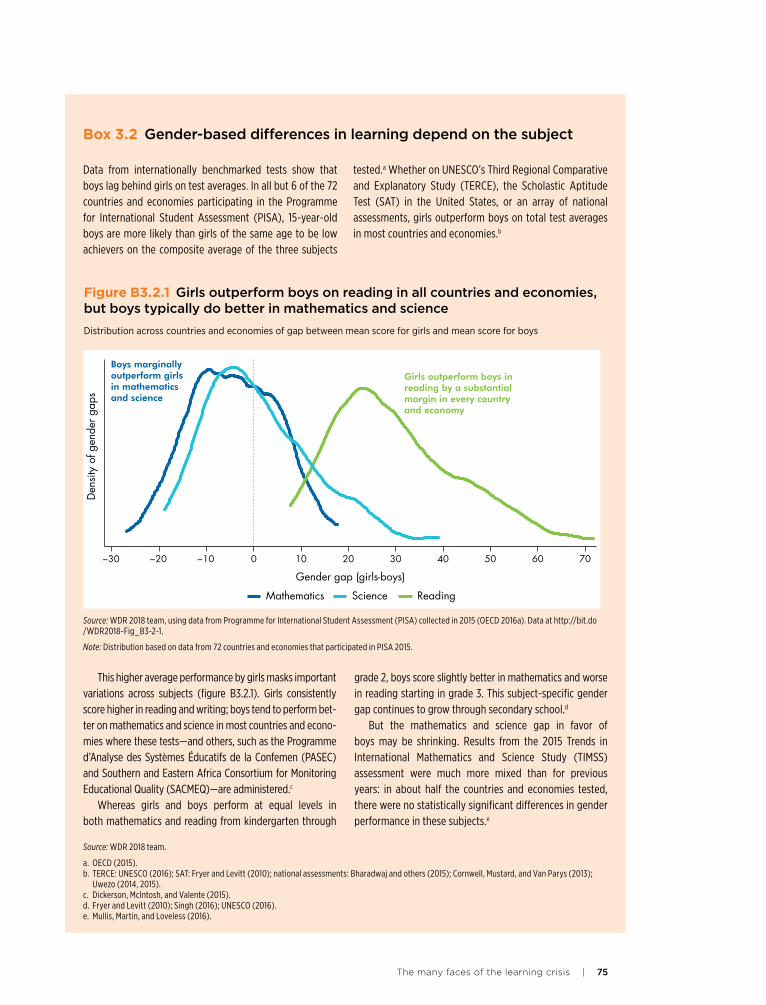
Box 3.2 Gender-based�differences�in�learning�depend�on�the�subject
Data from internationally benchmarked tests show that boys lag behind girls on test averages. In all but 6 of the 72 countries and economies participating in the Programme for International Student Assessment (PISA), 15-year-old boys are more likely than girls of the same age to be low achievers on the composite average of the three subjects
tested.a Whether on UNESCO’s Third Regional Comparative and Explanatory Study (TERCE), the Scholastic Aptitude Test (SAT) in the United States, or an array of national assessments, girls outperform boys on total test averages in most countries and economies.b
Source: WDR 2018 team.
a. OECD (2015).b. TERCE: UNESCO (2016); SAT: Fryer and Levitt (2010); national assessments: Bharadwaj and others (2015); Cornwell, Mustard, and Van Parys (2013);
Uwezo (2014, 2015).c. Dickerson, McIntosh, and Valente (2015).d. Fryer and Levitt (2010); Singh (2016); UNESCO (2016).e. Mullis, Martin, and Loveless (2016).
Figure B3.2.1 Girls�outperform�boys�on�reading�in�all�countries�and�economies,�but�boys�typically�do�better�in�mathematics�and�science
Distribution across countries and economies of gap between mean score for girls and mean score for boys
Source: WDR 2018 team, using data from Programme for International Student Assessment (PISA) collected in 2015 (OECD 2016a). Data at http://bit.do /WDR2018-Fig_B3-2-1.
Note: Distribution based on data from 72 countries and economies that participated in PISA 2015.
Boys marginally outperform girls in mathematics and science
Girls outperform boys inreading by a substantialmargin in every countryand economy
Den
sity
of g
ende
r gap
s
−30 −20 −10 0 10 20 30 40 50 60 70
Gender gap (girls-boys)
Mathematics Science Reading
This higher average performance by girls masks important variations across subjects (figure B3.2.1). Girls consistently score higher in reading and writing; boys tend to perform bet-ter on mathematics and science in most countries and econo-mies where these tests—and others, such as the Programme d’Analyse des Systèmes Éducatifs de la Confemen (PASEC) and Southern and Eastern Africa Consortium for Monitoring Educational Quality (SACMEQ)—are administered.c
Whereas girls and boys perform at equal levels in both mathematics and reading from kindergarten through
grade 2, boys score slightly better in mathematics and worse in reading starting in grade 3. This subject-specific gender gap continues to grow through secondary school.d
But the mathematics and science gap in favor of boys may be shrinking. Results from the 2015 Trends in International Mathematics and Science Study (TIMSS) assessment were much more mixed than for previous years: in about half the countries and economies tested, there were no statistically significant differences in gender performance in these subjects.e
76 | World Development Report 2018
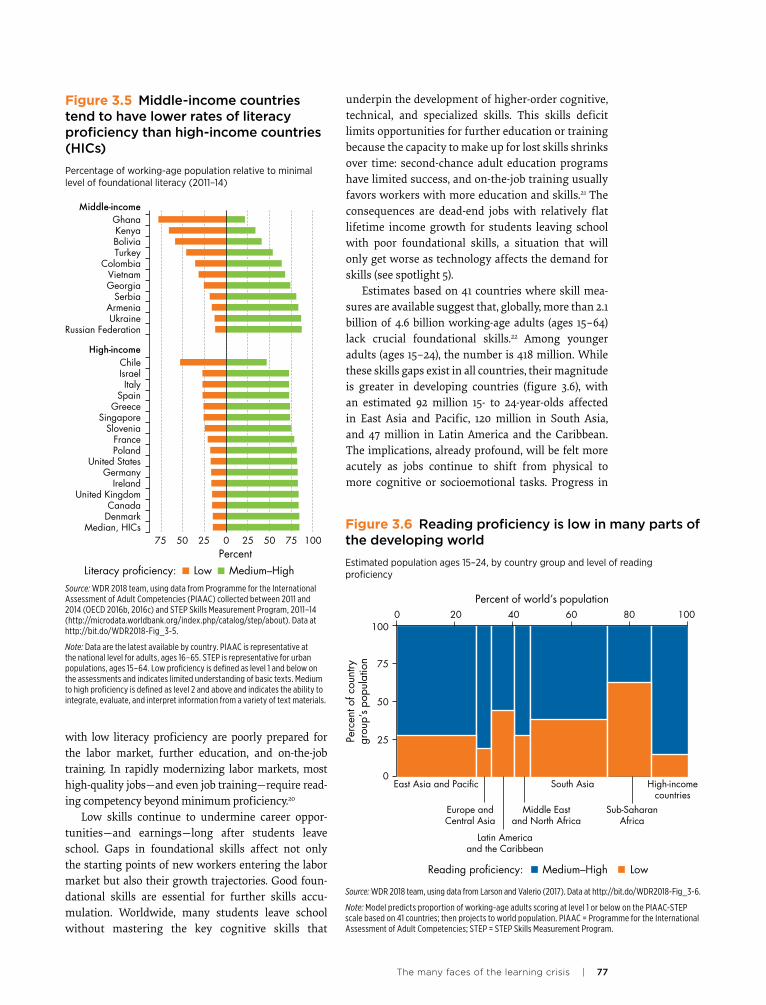
percent of Ghana’s working-age population and over 60 percent of Kenya’s have just level 1 literacy or below—that is, their literacy proficiency is limited to under-standing basic texts, but they are not able to integrate, evaluate, or interpret information from a variety of text materials (figure 3.5).19 This contrasts with the average for high-income countries, where only 15 percent of the working-age population is at level 1 or below. Individuals
basic literacy proficiency by the lower secondary level, whereas the population of Bolivia needs six more years to attain even close to the same profi-ciency. Similarly, among 18- to 37-year-olds in Nigeria, only 19 percent of primary completers can read; in Tanzania, 80 percent can.18
In some countries, large proportions of “educated” working adults are effectively low-skilled. Nearly 80
Peru
Albania
Algeria
Argentina
Brazil
Bulgaria
Chile
China (B-S-J-G)
ColombiaCosta Rica
Croatia
Cyprus
Dominican Republic
Finland
Georgia
Hong Kong SAR, China
Indonesia
Jordan
Kazakhstan
Korea, Rep.
Kosovo
Latvia
Lebanon
Lithuania
Macao SAR, ChinaPoland
Macedonia, FYR
Malaysia
Malta
MexicoMoldova
Montenegro
Qatar
Romania
Russian Federation
Singapore
Taiwan, China
Thailand
Trinidad and Tobago
Tunisia
TurkeyUnited Arab Emirates
Uruguay
Vietnam
Percentile25th 50th 75th
OECD average
300 400
Score Score500 600
a. Reading
Albania
Algeria
Argentina
Brazil
Bulgaria
Chile
China (B-S-J-G)
Colombia
Costa Rica
Croatia
Cyprus
Dominican Republic
Finland
Georgia
Hong Kong SAR, China
IndonesiaJordan
Kazakhstan
Korea, Rep.
Kosovo
Latvia
Lebanon
Lithuania
Macao SAR, China
Macedonia, FYR
Malaysia
Malta
Mexico
Moldova
Montenegro
Peru
Poland
Qatar
Romania
Russian Federation
Singapore
Taiwan, China
Thailand
Trinidad and Tobago
Tunisia
Turkey
United Arab Emirates
Uruguay
Vietnam
b. Mathematics
Non-OECD OECD OECD interquartile range
Percentile25th 50th 75th
OECD average
300 400 500 600
Figure 3.4 Learning�outcomes�vary�greatly�across�countries�and�economies—�in�several�countries,�the�75th�percentile�of�PISA�test�takers�performs�below�the��25th�percentile�of�the�OECD�average�
Performance of 25th, 50th, and 75th percentiles in 2015 PISA assessment, participating non-OECD economies and selected OECD economies
Source: WDR 2018 team, using data from Programme for International Student Assessment (PISA) collected in 2015 (OECD 2016a). Data at http://bit.do /WDR2018-Fig_3-4.
Note: PISA 2015 defines baseline levels of proficiency at a score of 407 for reading and 420 for mathematics. China (B-S-J-G) = China (Beijing-Shanghai- Jiangsu-Guangdong).
The many faces of the learning crisis | 77
underpin the development of higher-order cognitive, technical, and specialized skills. This skills deficit limits opportunities for further education or training because the capacity to make up for lost skills shrinks over time: second-chance adult education programs have limited success, and on-the-job training usually favors workers with more education and skills.21 The consequences are dead-end jobs with relatively flat lifetime income growth for students leaving school with poor foundational skills, a situation that will only get worse as technology affects the demand for skills (see spotlight 5).
Estimates based on 41 countries where skill mea-sures are available suggest that, globally, more than 2.1 billion of 4.6 billion working-age adults (ages 15–64) lack crucial foundational skills.22 Among younger adults (ages 15–24), the number is 418 million. While these skills gaps exist in all countries, their magnitude is greater in developing countries (figure 3.6), with an estimated 92 million 15- to 24-year-olds affected in East Asia and Pacific, 120 million in South Asia, and 47 million in Latin America and the Caribbean. The implications, already profound, will be felt more acutely as jobs continue to shift from physical to more cognitive or socioemotional tasks. Progress in
with low literacy proficiency are poorly prepared for the labor market, further education, and on-the-job training. In rapidly modernizing labor markets, most high-quality jobs—and even job training—require read-ing competency beyond minimum proficiency.20
Low skills continue to undermine career oppor-tunities—and earnings—long after students leave school. Gaps in foundational skills affect not only the starting points of new workers entering the labor market but also their growth trajectories. Good foun-dational skills are essential for further skills accu-mulation. Worldwide, many students leave school without mastering the key cognitive skills that
Figure 3.5 Middle-income�countries�tend�to�have�lower�rates�of�literacy�proficiency�than�high-income�countries�(HICs)�
Percentage of working-age population relative to minimal level of foundational literacy (2011–14)
75 50 25 0 25 50 75 100
Middle-income
High-income
Percent
Median, HICsDenmarkCanada
United KingdomIreland
GermanyUnited States
PolandFrance
SloveniaSingapore
GreeceSpain
ItalyIsraelChile
Russian FederationUkraine
ArmeniaSerbia
GeorgiaVietnam
ColombiaTurkeyBoliviaKenyaGhana
Low Medium–HighLiteracy proficiency:Source: WDR 2018 team, using data from Programme for the International Assessment of Adult Competencies (PIAAC) collected between 2011 and 2014 (OECD 2016b, 2016c) and STEP Skills Measurement Program, 2011–14 (http://microdata.worldbank.org/index.php/catalog/step/about). Data at http://bit.do/WDR2018-Fig_3-5.
Note: Data are the latest available by country. PIAAC is representative at the national level for adults, ages 16–65. STEP is representative for urban populations, ages 15–64. Low proficiency is defined as level 1 and below on the assessments and indicates limited understanding of basic texts. Medium to high proficiency is defined as level 2 and above and indicates the ability to integrate, evaluate, and interpret information from a variety of text materials.
Figure 3.6 Reading�proficiency�is�low�in�many�parts�of�the�developing�world
Estimated population ages 15–24, by country group and level of reading proficiency
Source: WDR 2018 team, using data from Larson and Valerio (2017). Data at http://bit.do/WDR2018-Fig_3-6.
Note: Model predicts proportion of working-age adults scoring at level 1 or below on the PIAAC-STEP scale based on 41 countries; then projects to world population. PIAAC = Programme for the International Assessment of Adult Competencies; STEP = STEP Skills Measurement Program.
0East Asia and Pacific
Europe andCentral Asia
Latin Americaand the Caribbean
Middle Eastand North Africa
South Asia
Sub-SaharanAfrica
High-incomecountries
25
50
75
100
Perc
ent o
f cou
ntry
grou
p’s
popu
latio
n
0 20 40 60 80 100
Percent of world’s population
Medium–High LowReading proficiency:
78 | World Development Report 2018
evidence suggests not. In Pakistan, rich-poor learning gaps are smaller than learning gaps between children from good and bad schools. In tests of English lan-guage, the difference in learning between a high-per-forming and a low-performing public school is 24 times the difference between children from poor and nonpoor backgrounds, after controlling for observed child-level differences.29 Analysis of the 2009 PISA found that “the best performing school systems [in Canada; Finland; Hong Kong SAR, China; Japan; the Republic of Korea; and Shanghai, China] manage to provide high-quality education to all students” rather than only to students from privileged groups.30
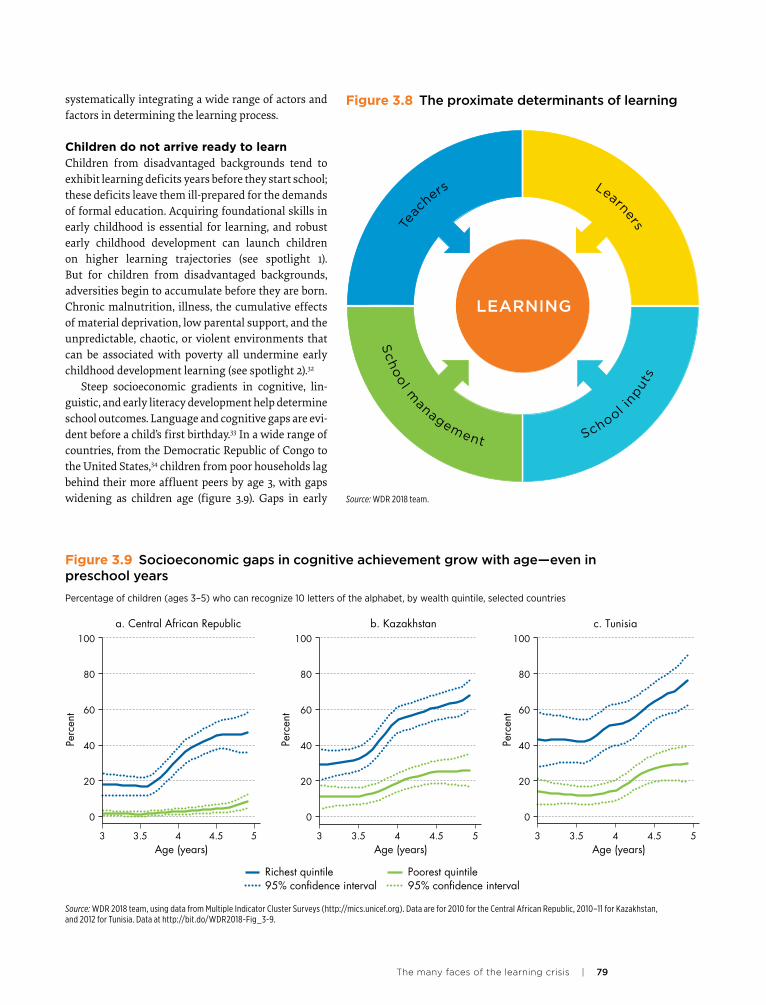
What is causing the learning crisis?A simple framework can be used to organize the prox-imate (or immediate) determinants of the learning crisis.31 Proximate determinants are those most directly linked to learning outcomes and are them-selves the result of deeper determinants. The frame-work identifies four proximate determinants: learner preparation, teacher skills and motivation, the availability of relevant inputs, and the school man-agement and governance that bring these together (figure 3.8). This approach provides a simple tool for
meeting global development goals will be limited as long as the dimensions of this problem, its origins, and its implications remain unrecognized.
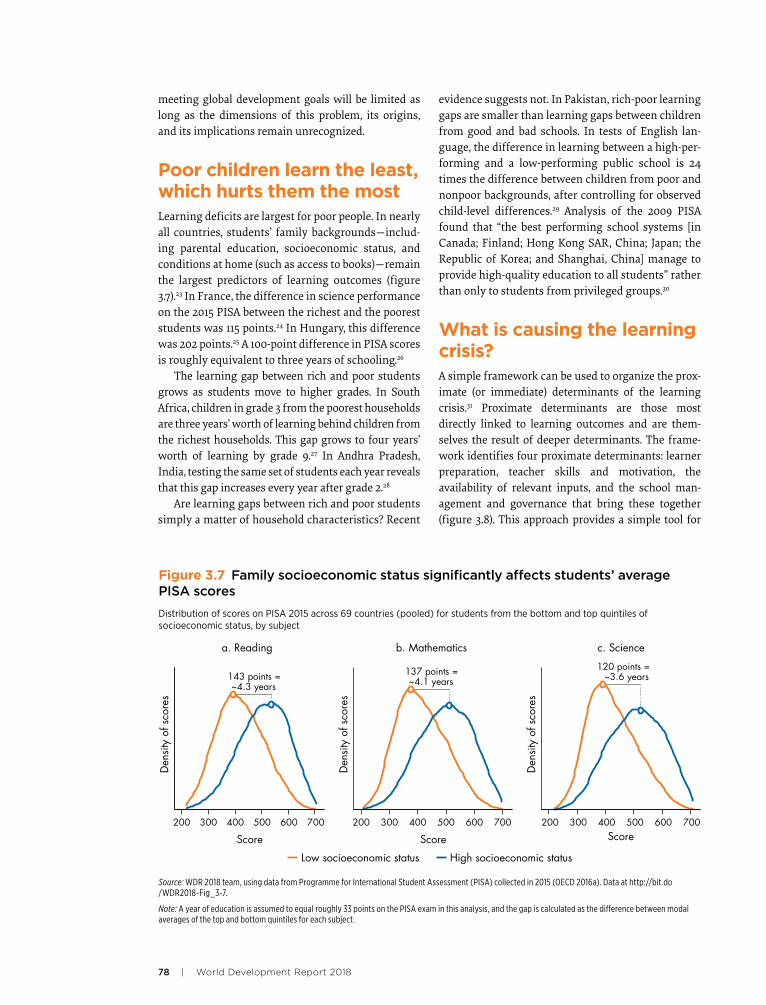
Poor children learn the least, which hurts them the mostLearning deficits are largest for poor people. In nearly all countries, students’ family backgrounds—includ-ing parental education, socioeconomic status, and conditions at home (such as access to books)—remain the largest predictors of learning outcomes (figure 3.7).23 In France, the difference in science performance on the 2015 PISA between the richest and the poorest students was 115 points.24 In Hungary, this difference was 202 points.25 A 100-point difference in PISA scores is roughly equivalent to three years of schooling.26
The learning gap between rich and poor students grows as students move to higher grades. In South Africa, children in grade 3 from the poorest households are three years’ worth of learning behind children from the richest households. This gap grows to four years’ worth of learning by grade 9.27 In Andhra Pradesh, India, testing the same set of students each year reveals that this gap increases every year after grade 2.28
Are learning gaps between rich and poor students simply a matter of household characteristics? Recent
Figure 3.7 Family�socioeconomic�status�significantly�affects�students’�average�PISA�scores
Distribution of scores on PISA 2015 across 69 countries (pooled) for students from the bottom and top quintiles of socioeconomic status, by subject
Source: WDR 2018 team, using data from Programme for International Student Assessment (PISA) collected in 2015 (OECD 2016a). Data at http://bit.do /WDR2018-Fig_3-7.
Note: A year of education is assumed to equal roughly 33 points on the PISA exam in this analysis, and the gap is calculated as the difference between modal averages of the top and bottom quintiles for each subject.
143 points =~4.3 years
Den
sity
of s
core
s
200 300 400 500 600 700
Score
a. Reading
Den
sity
of s
core
s
137 points =~4.1 years
200 300 400 500 600 700
Score
b. Mathematics
Den
sity
of s
core
s
120 points =~3.6 years
200 300 400 500 600 700Score
c. Science
Low socioeconomic status High socioeconomic status
The many faces of the learning crisis | 79
systematically integrating a wide range of actors and factors in determining the learning process.
Children do not arrive ready to learnChildren from disadvantaged backgrounds tend to exhibit learning deficits years before they start school; these deficits leave them ill-prepared for the demands of formal education. Acquiring foundational skills in early childhood is essential for learning, and robust early childhood development can launch children on higher learning trajectories (see spotlight 1). But for children from disadvantaged backgrounds, adversities begin to accumulate before they are born. Chronic malnutrition, illness, the cumulative effects of material deprivation, low parental support, and the unpredictable, chaotic, or violent environments that can be associated with poverty all undermine early childhood development learning (see spotlight 2).32
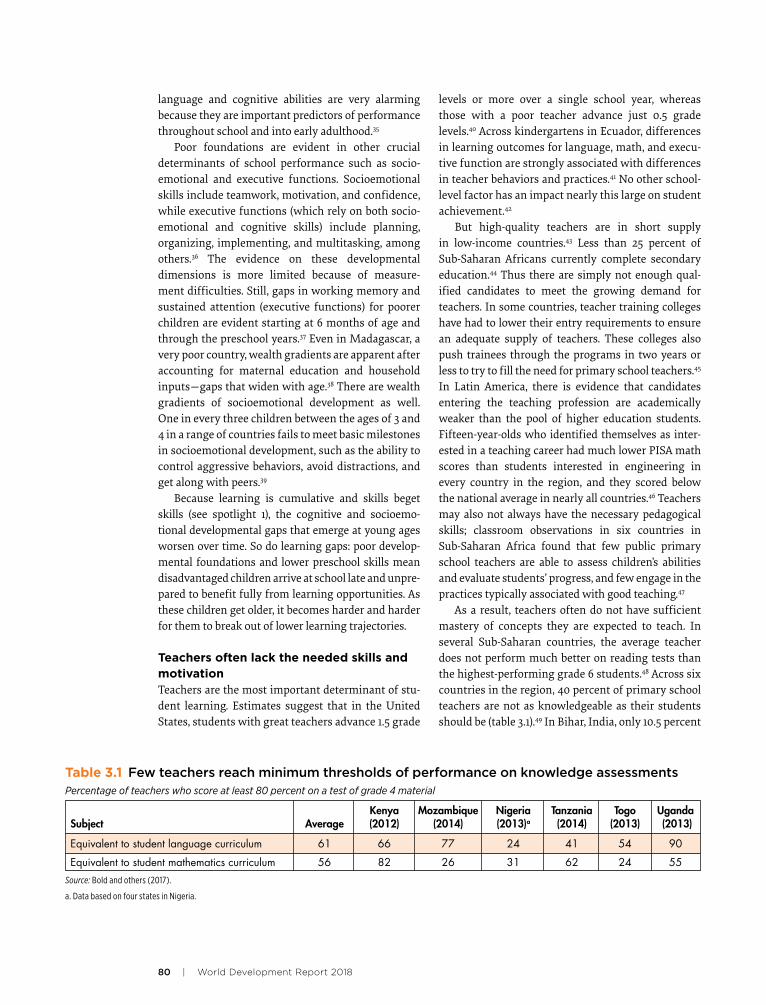
Steep socioeconomic gradients in cognitive, lin-guistic, and early literacy development help determine school outcomes. Language and cognitive gaps are evi-dent before a child’s first birthday.33 In a wide range of countries, from the Democratic Republic of Congo to the United States,34 children from poor households lag behind their more affluent peers by age 3, with gaps widening as children age (figure 3.9). Gaps in early
Figure 3.8 The�proximate�determinants�of�learning
Source: WDR 2018 team.
Sch
ool m
anagement School i
nputs
Tea
chers
Learners
LEARNING
FIGURE 3.7
Figure 3.9 Socioeconomic�gaps�in�cognitive�achievement�grow�with�age—even�in�preschool�years
Percentage of children (ages 3–5) who can recognize 10 letters of the alphabet, by wealth quintile, selected countries
Source: WDR 2018 team, using data from Multiple Indicator Cluster Surveys (http://mics.unicef.org). Data are for 2010 for the Central African Republic, 2010–11 for Kazakhstan, and 2012 for Tunisia. Data at http://bit.do/WDR2018-Fig_3-9.
Richest quintile Poorest quintile95% confidence interval 95% confidence interval
0
20
40
60
80
100
Perc
ent
3 3.5 4 4.5 5Age (years) Age (years) Age (years)
a. Central African Republic
Perc
ent
3 3.5 4 4.5 5
b. Kazakhstan
0
20
40
60
80
100
Perc
ent
3 3.5 4 4.5 5
c. Tunisia
0
20
40
60
80
100
80 | World Development Report 2018
levels or more over a single school year, whereas those with a poor teacher advance just 0.5 grade levels.40 Across kindergartens in Ecuador, differences in learning outcomes for language, math, and execu-tive function are strongly associated with differences in teacher behaviors and practices.41 No other school-level factor has an impact nearly this large on student achievement.42
But high-quality teachers are in short supply in low-income countries.43 Less than 25 percent of Sub-Saharan Africans currently complete secondary education.44 Thus there are simply not enough qual-ified candidates to meet the growing demand for teachers. In some countries, teacher training colleges have had to lower their entry requirements to ensure an adequate supply of teachers. These colleges also push trainees through the programs in two years or less to try to fill the need for primary school teachers.45 In Latin America, there is evidence that candidates entering the teaching profession are academically weaker than the pool of higher education students. Fifteen-year-olds who identified themselves as inter-ested in a teaching career had much lower PISA math scores than students interested in engineering in every country in the region, and they scored below the national average in nearly all countries.46 Teachers may also not always have the necessary pedagogical skills; classroom observations in six countries in Sub-Saharan Africa found that few public primary school teachers are able to assess children’s abilities and evaluate students’ progress, and few engage in the practices typically associated with good teaching.47
As a result, teachers often do not have sufficient mastery of concepts they are expected to teach. In several Sub-Saharan countries, the average teacher does not perform much better on reading tests than the highest-performing grade 6 students.48 Across six countries in the region, 40 percent of primary school teachers are not as knowledgeable as their students should be (table 3.1).49 In Bihar, India, only 10.5 percent
language and cognitive abilities are very alarming because they are important predictors of performance throughout school and into early adulthood.35
Poor foundations are evident in other crucial determinants of school performance such as socio-emotional and executive functions. Socioemotional skills include teamwork, motivation, and confidence, while executive functions (which rely on both socio-emotional and cognitive skills) include planning, organizing, implementing, and multitasking, among others.36 The evidence on these developmental dimensions is more limited because of measure-ment difficulties. Still, gaps in working memory and sustained attention (executive functions) for poorer children are evident starting at 6 months of age and through the preschool years.37 Even in Madagascar, a very poor country, wealth gradients are apparent after accounting for maternal education and household inputs—gaps that widen with age.38 There are wealth gradients of socioemotional development as well. One in every three children between the ages of 3 and 4 in a range of countries fails to meet basic milestones in socioemotional development, such as the ability to control aggressive behaviors, avoid distractions, and get along with peers.39
Because learning is cumulative and skills beget skills (see spotlight 1), the cognitive and socioemo-tional developmental gaps that emerge at young ages worsen over time. So do learning gaps: poor develop-mental foundations and lower preschool skills mean disadvantaged children arrive at school late and unpre-pared to benefit fully from learning opportunities. As these children get older, it becomes harder and harder for them to break out of lower learning trajectories.
Teachers often lack the needed skills and motivation Teachers are the most important determinant of stu-dent learning. Estimates suggest that in the United States, students with great teachers advance 1.5 grade
Table 3.1 Few�teachers�reach�minimum�thresholds�of�performance�on�knowledge�assessmentsPercentage of teachers who score at least 80 percent on a test of grade 4 material
Kenya Mozambique Nigeria Tanzania Togo Uganda Subject Average (2012) (2014) (2013)a (2014) (2013) (2013)
Equivalent to student language curriculum 61 66 77 24 41 54 90
Equivalent to student mathematics curriculum 56 82 26 31 62 24 55Source: Bold and others (2017).
a. Data based on four states in Nigeria.
The many faces of the learning crisis | 81
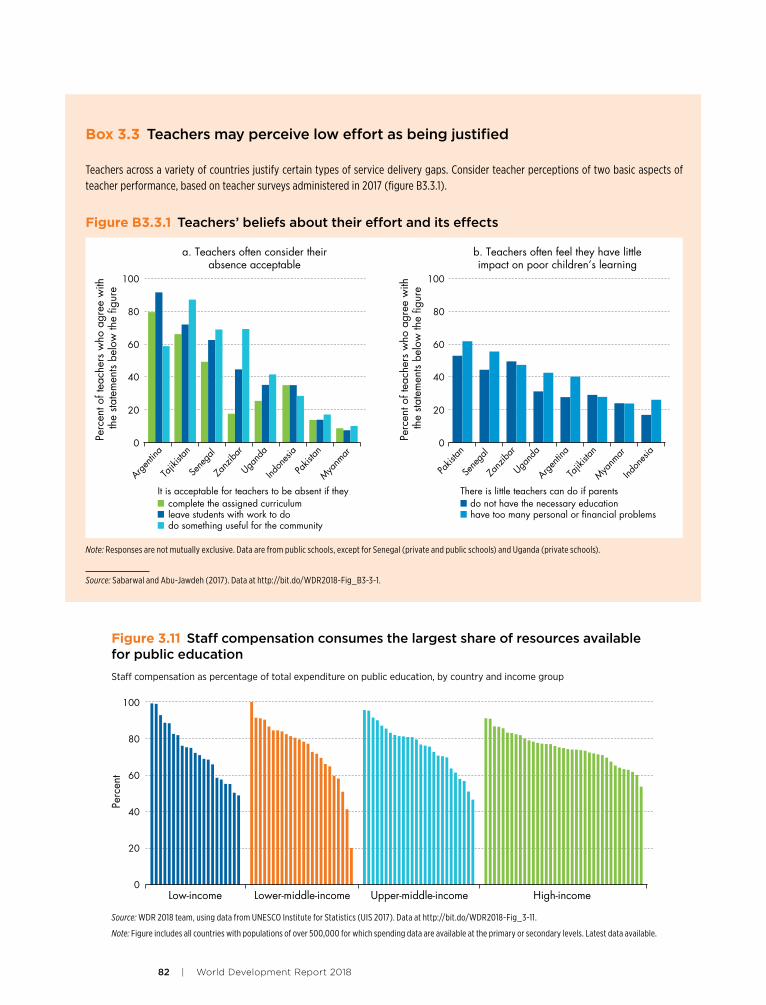
This problem is particularly concerning because the bulk of national education budgets goes to teacher salaries. In Latin America and the Caribbean, teacher salaries absorb nearly 4 percent of the regional gross domestic product (GDP).55 Staff compensation accounts for 80 percent of public spending on edu-cation in some countries (figure 3.11). If one in five government primary school teachers is absent from school, developing countries are wasting consider-able resources.
According to recent data on 1,300 villages in India, nearly 24 percent of teachers were absent during unannounced visits, at an associated fiscal cost of US$1.5 billion a year.56 Reducing absenteeism in these schools would be over 10 times more cost- effective at increasing student-teacher contact time than hiring additional teachers.
School management skills are lowThe effective management of schools relies on capac-ity and autonomy for decision making at the school level, which are often lacking. Higher management quality57 and school leadership are associated with better education outcomes.58 Yet in many developing countries effective school management is missing
of tested public school teachers are able to solve a three-digit by one-digit division problem and show the steps correctly.50
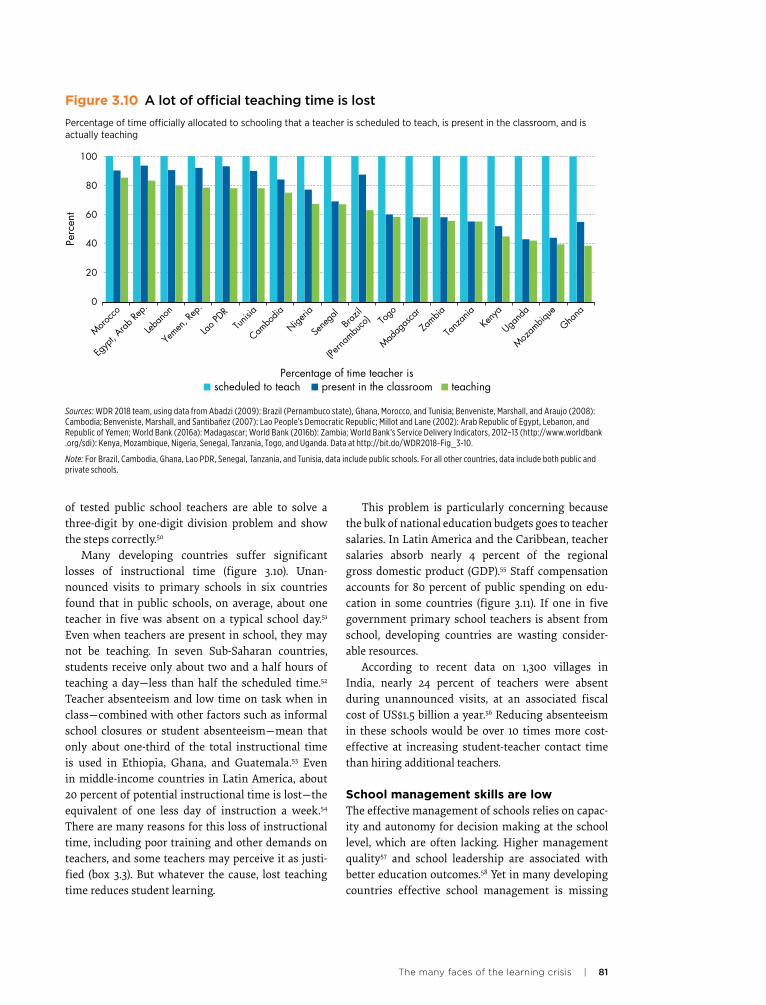
Many developing countries suffer significant losses of instructional time (figure 3.10). Unan-nounced visits to primary schools in six countries found that in public schools, on average, about one teacher in five was absent on a typical school day.51 Even when teachers are present in school, they may not be teaching. In seven Sub-Saharan countries, students receive only about two and a half hours of teaching a day—less than half the scheduled time.52 Teacher absenteeism and low time on task when in class—combined with other factors such as informal school closures or student absenteeism—mean that only about one-third of the total instructional time is used in Ethiopia, Ghana, and Guatemala.53 Even in middle-income countries in Latin America, about 20 percent of potential instructional time is lost—the equivalent of one less day of instruction a week.54 There are many reasons for this loss of instructional time, including poor training and other demands on teachers, and some teachers may perceive it as justi-fied (box 3.3). But whatever the cause, lost teaching time reduces student learning.
Figure 3.10 A�lot�of�official�teaching�time�is�lost�
Percentage of time officially allocated to schooling that a teacher is scheduled to teach, is present in the classroom, and is actually teaching
Sources: WDR 2018 team, using data from Abadzi (2009): Brazil (Pernambuco state), Ghana, Morocco, and Tunisia; Benveniste, Marshall, and Araujo (2008): Cambodia; Benveniste, Marshall, and Santibañez (2007): Lao People’s Democratic Republic; Millot and Lane (2002): Arab Republic of Egypt, Lebanon, and Republic of Yemen; World Bank (2016a): Madagascar; World Bank (2016b): Zambia; World Bank’s Service Delivery Indicators, 2012–13 (http://www.worldbank .org/sdi): Kenya, Mozambique, Nigeria, Senegal, Tanzania, Togo, and Uganda. Data at http://bit.do/WDR2018-Fig_3-10.
Note: For Brazil, Cambodia, Ghana, Lao PDR, Senegal, Tanzania, and Tunisia, data include public schools. For all other countries, data include both public and private schools.
0
20
40
60
80
100
Perc
ent
Morocc
o
Egyp
t, Arab
Rep.
Leban
on
Yemen
, Rep
.
Lao P
DRTu
nisia
Cambo
dia
Nigeria
Sene
gal
Brazil
(Perna
mbuco
) Togo
Madag
asca
r
Zambia
Tanz
ania
Keny
a
Ugand
a
Mozam
bique
Ghana
Percentage of time teacher isscheduled to teach present in the classroom teaching
82 | World Development Report 2018
Box 3.3 Teachers�may�perceive�low�effort�as�being�justified
Teachers across a variety of countries justify certain types of service delivery gaps. Consider teacher perceptions of two basic aspects of teacher performance, based on teacher surveys administered in 2017 (figure B3.3.1).
Source: Sabarwal and Abu-Jawdeh (2017). Data at http://bit.do/WDR2018-Fig_B3-3-1.
Figure B3.3.1 Teachers’�beliefs�about�their�effort�and�its�effects
Note: Responses are not mutually exclusive. Data are from public schools, except for Senegal (private and public schools) and Uganda (private schools).
do not have the necessary educationhave too many personal or financial problems
There is little teachers can do if parents
Zanz
ibar
0
20
40
60
80
100
b. Teachers often feel they have littleimpact on poor children’s learning
Perc
ent o
f tea
cher
s w
ho a
gree
with
th
e sta
tem
ents
belo
w th
e fig
ure
Argen
tina
Tajik
istan
Sene
gal
Ugand
a
Indon
esia
Pakis
tan
Mya
nmar
complete the assigned curriculumleave students with work to dodo something useful for the community
It is acceptable for teachers to be absent if they
a. Teachers often consider theirabsence acceptable
0
20
40
60
80
100
Perc
ent o
f tea
cher
s w
ho a
gree
with
th
e sta
tem
ents
belo
w th
e fig
ure
Argen
tina
Tajik
istan
Sene
gal
Zanz
ibar
Ugand
a
Indon
esia
Pakis
tan
Mya
nmar
Figure 3.11 Staff�compensation�consumes�the�largest�share�of�resources�available�for�public�education
Staff compensation as percentage of total expenditure on public education, by country and income group
Source: WDR 2018 team, using data from UNESCO Institute for Statistics (UIS 2017). Data at http://bit.do/WDR2018-Fig_3-11.
Note: Figure includes all countries with populations of over 500,000 for which spending data are available at the primary or secondary levels. Latest data available.
0Low-income Lower-middle-income Upper-middle-income High-income
20
40
60
80
100
Perc
ent
The many faces of the learning crisis | 83
1. UNESCO (2014). 2. RTI International (2015). 3. Gove and Cvelich (2011). 4. ASER Centre (2017). 5. Muralidharan and Zieleniak (2013); Pritchett (2013). 6. Programme d’Analyse des Systèmes Éducatifs de la
Confemen (PASEC) results for grade 6 students in 10 francophone countries in 2015 (PASEC 2015).
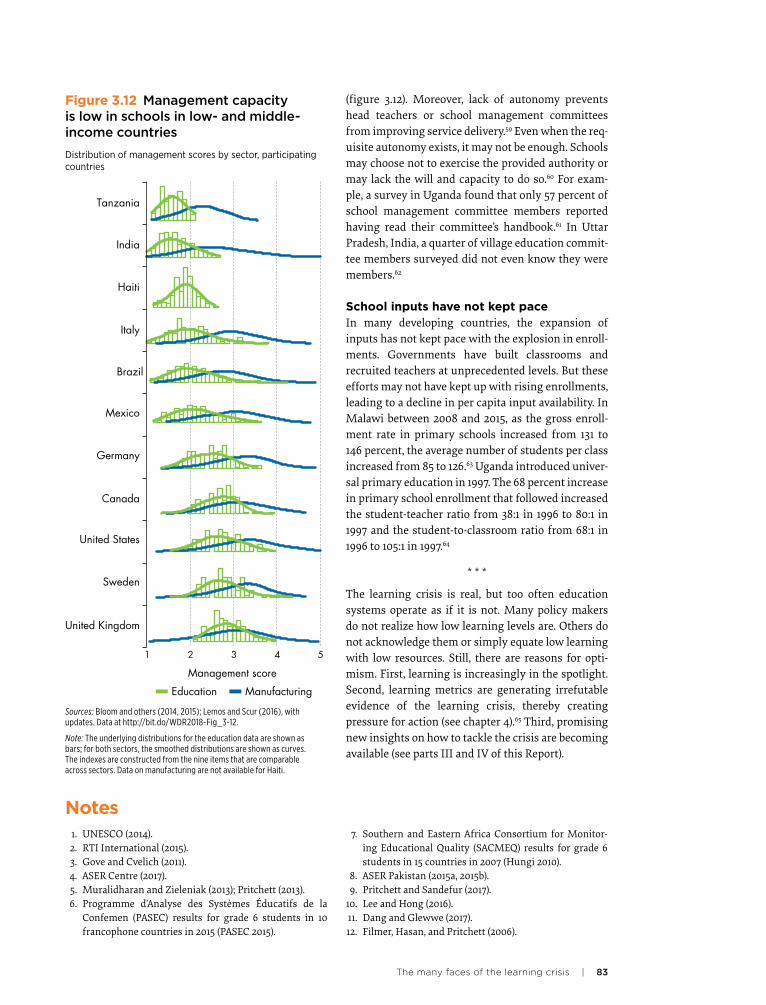
(figure 3.12). Moreover, lack of autonomy prevents head teachers or school management committees from improving service delivery.59 Even when the req-uisite autonomy exists, it may not be enough. Schools may choose not to exercise the provided authority or may lack the will and capacity to do so.60 For exam-ple, a survey in Uganda found that only 57 percent of school management committee members reported having read their committee’s handbook.61 In Uttar Pradesh, India, a quarter of village education commit-tee members surveyed did not even know they were members.62
School inputs have not kept paceIn many developing countries, the expansion of inputs has not kept pace with the explosion in enroll-ments. Governments have built classrooms and recruited teachers at unprecedented levels. But these efforts may not have kept up with rising enrollments, leading to a decline in per capita input availability. In Malawi between 2008 and 2015, as the gross enroll-ment rate in primary schools increased from 131 to 146 percent, the average number of students per class increased from 85 to 126.63 Uganda introduced univer-sal primary education in 1997. The 68 percent increase in primary school enrollment that followed increased the student-teacher ratio from 38:1 in 1996 to 80:1 in 1997 and the student-to-classroom ratio from 68:1 in 1996 to 105:1 in 1997.64
* * *
The learning crisis is real, but too often education systems operate as if it is not. Many policy makers do not realize how low learning levels are. Others do not acknowledge them or simply equate low learning with low resources. Still, there are reasons for opti-mism. First, learning is increasingly in the spotlight. Second, learning metrics are generating irrefutable evidence of the learning crisis, thereby creating pressure for action (see chapter 4).65 Third, promising new insights on how to tackle the crisis are becoming available (see parts III and IV of this Report).
Figure 3.12 Management�capacity�is�low�in�schools�in�low-�and�middle-income�countries�
Distribution of management scores by sector, participating countries
Sources: Bloom and others (2014, 2015); Lemos and Scur (2016), with updates. Data at http://bit.do/WDR2018-Fig_3-12.
Note: The underlying distributions for the education data are shown as bars; for both sectors, the smoothed distributions are shown as curves. The indexes are constructed from the nine items that are comparable across sectors. Data on manufacturing are not available for Haiti.
Tanzania
India
Haiti
Italy
Brazil
Mexico
Germany
Canada
United States
Sweden
United Kingdom
1 2 3 4 5
Management score
Education Manufacturing
Notes 7. Southern and Eastern Africa Consortium for Monitor-
ing Educational Quality (SACMEQ) results for grade 6 students in 15 countries in 2007 (Hungi 2010).
8. ASER Pakistan (2015a, 2015b). 9. Pritchett and Sandefur (2017). 10. Lee and Hong (2016). 11. Dang and Glewwe (2017). 12. Filmer, Hasan, and Pritchett (2006).
84 | World Development Report 2018
52. Bold and others (2017). 53. Informal school closures may stem from strikes, inclem-
ent weather, or ad hoc holidays. For Ethiopia and Guate-mala see EQUIP2 (2010); for Ghana, see Abadzi (2009).
54. Bruns and Luque (2015). 55. Bruns and Luque (2015). 56. Muralidharan and others (2017). 57. Bloom and others (2015); Fryer (2017). 58. Robinson, Lloyd, and Rowe (2008). 59. Bruns, Filmer, and Patrinos (2011); Orazem, Glewwe, and
Patrinos (2007). 60. King, Özler, and Rawlings (1999). 61. Najjumba, Habyarimana, and Bunjo (2013). 62. Banerjee and others (2010). 63. MoEST (2008, 2015); World Bank (2016c). Gross enroll-
ment includes students whose age exceeds the official age group for a particular education level, so the rate may exceed 100 percent.
64. Bentaouet-Kattan (2006). 65. The World Bank’s 2020 sector strategy and the U.K.
Department for International Development’s 2010 strat-egy are learning for all; the U.S. Agency for International Development’s strategy is opportunity through learn-ing; and AusAID is also adopting learning goals.
ReferencesAbadzi, Helen. 2009. “Instructional Time Loss in Developing
Countries: Concepts, Measurement, and Implications.” World Bank Research Observer 24 (2): 267–90.
Araujo, María Caridad, Pedro Carneiro, Yyannú Cruz-Aguayo, and Norbert R. Schady. 2016. “Teacher Quality and Learning Outcomes in Kindergarten.” Quarterly Journal of Economics 131 (3): 1415–53.
ASER Centre. 2017. Annual Status of Education Report (Rural). New Delhi: ASER Centre.
ASER Pakistan. 2015a. “Annual Status of Education Report: ASER Pakistan 2015 National (Rural).” Lahore, Pakistan: South Asian Forum for Education Development.
————. 2015b. “Annual Status of Education Report: ASER Pakistan 2015 National (Urban).” Lahore, Pakistan: South Asian Forum for Education Development.
Banerjee, Abhijit Vinayak, Rukmini Banerji, Esther Duflo, Rachel Glennerster, and Stuti Khemani. 2010. “Pitfalls of Participatory Programs: Evidence from a Randomized Evaluation in Education in India.” American Economic Journal: Economic Policy 2 (1): 1–30.
Banerjee, Abhijit Vinayak, and Esther Duflo. 2012. Poor Economics: A Radical Rethinking of the Way to Fight Global Poverty. New York: PublicAffairs.
Bentaouet-Kattan, Raja. 2006. “Implementation of Free Basic Education Policy.” Education Working Paper 7 (December), World Bank, Washington, DC.
Benveniste, Luis, Jeffrey Marshall, and M. Caridad Araujo. 2008. “Teaching in Cambodia.” Human Development Sector, East Asia and the Pacific Region, World Bank, Washington, DC, and Ministry of Education, Youth and Sport, Phnom Penh, Cambodia.
Benveniste, Luis, Jeffrey Marshall, and Lucrecia Santibañez. 2007. “Teaching in the Lao PDR.” Human Development
13. UNESCO (2015). 14. Filmer, Hasan, and Pritchett (2006). 15. OECD (2016a). 16. Dang and Glewwe (2017). 17. Crouch and Gove (2011), which is based on the Progress
in International Reading Literacy Study (PIRLS) and Trends in International Mathematics and Science Study (TIMSS).
18. Kaffenberger and Pritchett (2017). 19. The literacy skills proficiency construct covers a range of
skills from the decoding of written words and sentences to the comprehension, interpretation, and evaluation of complex texts. It takes into account workplace, personal, society, and community. To facilitate the interpretation of individual scores, described proficiency scales are available to articulate the requisite skills and knowledge needed to perform specific tasks along a 500-point scale. The tasks move progressively in complexity from level 0 to level 5. See ETS (2014) and OECD (2016c).
20. Desjardins and Rubenson (2011); OECD (2016b). 21. di Gropello (2011); Fouarge, Schils, and de Grip (2013);
Heckman (2000); O’Connell and Jungblut (2008); Wind-isch (2015).
22. WDR 2018 team estimates using literacy proficiency as a proxy for foundational skills.
23. Bruns and Luque (2015); Filmer and Pritchett (1999). 24. OECD (2016a). 25. OECD (2016a). 26. OECD (2016a). 27. Spaull and Kotze (2015). 28. Muralidharan and Zieleniak (2013). 29. Das, Pandey, and Zajonc (2006). 30. OECD (2010). 31. Hanushek (1979). 32. Lupien and others (2000); McCoy and others (2016);
Walker and others (2007). 33. Rubio-Codina and others (2015). 34. Countries where these outcomes have been evaluated
include Cambodia, Chile, the Democratic Republic of Congo, Ethiopia, India, Madagascar, Mozambique, Nige-ria, Sierra Leone, Togo, the United States, and Vietnam.
35. Fernald, Marchman, and Weisleder (2013). 36. Galasso, Weber, and Fernald (2017); McCoy and others
(2016). 37. Fernald and others (2012); Lipina and others (2005);
Noble, Norman, and Farah (2005). 38. Galasso, Weber, and Fernald (2017). 39. McCoy and others (2016). 40. Hanushek (1992); Rockoff (2004). 41. Araujo and others (2016). 42. Bruns and Luque (2015). 43. UIS (2006). 44. UNESCO Institute for Statistics, 2016 (UIS 2017). 45. Mulkeen (2010). 46. Bruns and Luque (2015). 47. Bold and others (2017). 48. UIS (2006). 49. Bold and others (2017). 50. Sinha, Banerji, and Wadhwa (2016). 51. Chaudhury and others (2006).
The many faces of the learning crisis | 85
Mathematics in Africa.” Economics of Education Review 46: 1–22.
di Gropello, Emanuela. 2011. Skills for the Labor Market in Indo-nesia: Trends in Demand, Gaps, and Supply. With Aurelien Kruse and Prateek Tandon. Directions in Development: Human Development Series. Washington, DC: World Bank.
EQUIP2 (Educational Quality Improvement Program 2). 2010. “Using Opportunity to Learn and Early Grade Reading Fluency to Measure School Effectiveness in Ethiopia, Guatemala, Honduras, and Nepal.” Working Paper, Educational Policy, Systems Development, and Management, U.S. Agency for International Develop-ment, Washington, DC.
ETS (Educational Testing Service). 2014. “A Guide to Under-standing the Literacy Assessment of the STEP Skills Measurement Surveys.” ETS, Princeton, NJ.
Fernald, Anne, Virginia A. Marchman, and Adriana Weis-leder. 2013. “SES Differences in Language Processing Skill and Vocabulary Are Evident at 18 Months.” Develop-mental Science 16 (2): 234–48.
Fernald, Lia C. H., Patricia Kariger, Melissa Hidrobo, and Paul J. Gertler. 2012. “Socioeconomic Gradients in Child Devel-opment in Very Young Children: Evidence from India, Indonesia, Peru, and Senegal.” Proceedings of the National Academy of Sciences 109 (Supplement 2): 17273–80.
Filmer, Deon, Amer Hasan, and Lant Pritchett. 2006. “A Mil-lennium Learning Goal: Measuring Real Progress in Education.” Working Paper 97 (August), Center for Global Development, Washington, DC.
Filmer, Deon, and Lant Pritchett. 1999. “The Effect of House-hold Wealth on Educational Attainment: Evidence from 35 Countries.” Population and Development Review 25 (1): 85–120.
Fouarge, Didier, Trudie Schils, and Andries de Grip. 2013. “Why Do Low-Educated Workers Invest Less in Further Training?” Applied Economics 45 (18): 2587–601.
Fryer, Roland G., Jr. 2017. “Management and Student Achievement: Evidence from a Randomized Field Exper-iment.” NBER Working Paper 23437, National Bureau of Economic Research, Cambridge, MA.
Fryer, Roland G., Jr., and Steven D. Levitt. 2010. “An Empirical Analysis of the Gender Gap in Mathematics.” American Economic Journal: Applied Economics 2 (2): 210–40.
Galasso, Emanuela, Ann Weber, and Lia C. H. Fernald. 2017. “Dynamics of Child Development: Analysis of a Longitu-dinal Cohort in a Very Low Income Country.” Policy Research Working Paper 7973, World Bank, Washington, DC.
Glewwe, Paul W., Michael R. Kremer, and Sylvie Moulin. 2009. “Many Children Left Behind? Textbooks and Test Scores in Kenya.” American Economic Journal: Applied Economics 1 (1): 112–35.
Glick, Peter, and David E. Sahn. 2010. “Early Academic Perfor-mance, Grade Repetition, and School Attainment in Senegal: A Panel Data Analysis.” World Bank Economic Review 24 (1): 93–120.
Gove, Amber, and Peter Cvelich. 2011. “Early Reading, Ignit-ing Education for All: A Report by the Early Grade
Sector, East Asia and the Pacific Region, World Bank, Washington, DC, and Ministry of Education, Vientiane, Lao People’s Democratic Republic.
Bharadwaj, Prashant, Giacomo De Giorgi, David R. Hansen, and Christopher Neilson. 2015. “The Gender Gap in Mathematics: Evidence from a Middle-Income Country.” Staff Report 721 (March 2), Federal Reserve Bank of New York, New York.
Bloom, Nicholas, Renata Lemos, Raffaella Sadun, Daniela Scur, and John Van Reenen. 2014. “JEEA-FBBVA Lecture 2013: The New Empirical Economics of Management.” Journal of the European Economic Association 12 (4): 835–76.
Bloom, Nicholas, Renata Lemos, Raffaella Sadun, and John Van Reenen. 2015. “Does Management Matter in Schools?” Economic Journal 125 (584): 647–74.
Bold, Tessa, Deon Filmer, Gayle Martin, Ezequiel Molina, Brian Stacy, Christophe Rockmore, Jakob Svensson, et al. 2017. “What Do Teachers Know and Do? Does It Matter? Evidence from Primary Schools in Africa.” Policy Research Working Paper 7956, World Bank, Washing- ton, DC.
Bruns, Barbara, Deon Filmer, and Harry Anthony Patrinos. 2011. Making Schools Work: New Evidence on Accountability Reforms. Human Development Perspectives Series. Washington, DC: World Bank.
Bruns, Barbara, and Javier Luque. 2015. Great Teachers: How to Raise Student Learning in Latin America and the Caribbean. With Soledad De Gregorio, David K. Evans, Marco Fernández, Martin Moreno, Jessica Rodriguez, Guill-ermo Toral, and Noah Yarrow. Latin American Develop-ment Forum Series. Washington, DC: World Bank.
Chaudhury, Nazmul, Jeffrey Hammer, Michael R. Kremer, Karthik Muralidharan, and F. Halsey Rogers. 2006. “Missing in Action: Teacher and Health Worker Absence in Developing Countries.” Journal of Economic Perspectives 20 (1): 91–116.
Cornwell, Christopher, David B. Mustard, and Jessica Van Parys. 2013. “Noncognitive Skills and the Gender Dispar-ities in Test Scores and Teacher Assessments: Evidence from Primary School.” Journal of Human Resources 48 (1): 236–64.
Crouch, Luis, and Amber K. Gove. 2011. “Leaps or One Step at a Time: Skirting or Helping Engage the Debate? The Case of Reading.” In Policy Debates in Comparative, International, and Development Education, edited by John N. Hawkins and W. James Jacob, 155–74. New York: Springer.
Dang, Hai-Anh H., and Paul W. Glewwe. 2017. “Well Begun, but Aiming Higher: A Review of Vietnam’s Education Trends in the Past 20 Years and Emerging Challenges.” Policy Research Working Paper 8112, World Bank, Wash-ington, DC.
Das, Jishnu, Priyanka Pandey, and Tristan Zajonc. 2006. “Learning Levels and Gaps in Pakistan.” Policy Research Working Paper 4067, World Bank, Washington, DC.
Desjardins, Richard, and Kjell Rubenson. 2011. “An Analysis of Skill Mismatch Using Direct Measures of Skills.” OECD Education Working Paper 63, Organisation for Economic Co-operation and Development, Paris.
Dickerson, Andy, Steven McIntosh, and Christine Valente. 2015. “Do the Maths: An Analysis of the Gender Gap in
86 | World Development Report 2018
————. 2015. “Education Management Information System.” Report, MoEST, Lilongwe, Malawi.
Mulkeen, Aidan G. 2010. Teachers in Anglophone Africa: Issues in Teacher Supply, Training, and Management. Development Practice in Education Series. Washington, DC: World Bank.
Mullis, Ina V. S., Michael O. Martin, and Tom Loveless. 2016. “20 Years of TIMSS: International Trends in Mathemat-ics and Science Achievement, Curriculum, and Instruc-tion.” International Association for the Evaluation of Educational Achievement, TIMSS and PIRLS Interna-tional Study Center, Lynch School of Education, Boston College, Chestnut Hill, MA.
Muralidharan, Karthik, Jishnu Das, Alaka Holla, and Aakash Mohpal. 2017. “The Fiscal Cost of Weak Governance: Evi-dence from Teacher Absence in India.” Journal of Public Economics 145: 116–35.
Muralidharan, Karthik, and Yendrick Zieleniak. 2013. “Mea-suring Learning Trajectories in Developing Countries with Longitudinal Data and Item Response Theory.” Paper presented at the Young Lives Conference, Oxford University, Oxford, U.K., July 8–9.
Najjumba, Innocent Mulindwa, James Habyarimana, and Charles Lwanga Bunjo. 2013. School-Based Management: Policy and Functionality. Vol. 3 of Improving Learning in Uganda. World Bank Study Series. Washington, DC: World Bank.
Noble, Kimberly G., M. Frank Norman, and Martha J. Farah. 2005. “Neurocognitive Correlates of Socioeconomic Sta-tus in Kindergarten Children.” Developmental Science 8 (1): 74–87.
O’Connell, Philip J., and Jean-Marie Jungblut. 2008. “What Do We Know about Training at Work?” In Skill Formation: Interdisciplinary and Cross-National Perspectives, edited by Karl Ulrich Mayer and Heike Solga, 109–25. New York: Cambridge University Press.
OECD (Organisation for Economic Co-operation and Devel-opment). 2010. PISA 2009 Results, What Students Know and Can Do: Student Performance in Reading, Mathematics, and Science. Vol. 1. Paris: OECD.
————. 2015. The ABC of Gender Equality in Education: Aptitude, Behaviour, Confidence. Paris: OECD.
————. 2016a. PISA 2015 Results: Excellence and Equity in Educa-tion. Vol. 1. Paris: OECD.
————. 2016b. Skills Matter: Further Results from the Survey of Adult Skills. OECD Skills Studies Series. Paris: OECD.
————. 2016c. The Survey of Adult Skills: Reader’s Companion. 2d ed. OECD Skills Studies Series. Paris: OECD.
Orazem, Peter F., Paul W. Glewwe, and Harry Anthony Patrinos. 2007. “The Benefits and Costs of Alternative Strategies to Improve Educational Outcomes.” Depart-ment of Economics Working Paper 07028 (November), Iowa State University, Ames.
PASEC (Programme d’Analyse des Systèmes Éducatifs de la Confemen). 2015. PASEC 2014: Education System Performance in Francophone Africa, Competencies and Learning Factors in Primary Education. Dakar, Senegal: PASEC.
Pritchett, Lant. 2013. The Rebirth of Education: Schooling Ain’t Learning. Washington, DC: Center for Global Develop-ment; Baltimore: Brookings Institution Press.
Learning Community of Practice.” Rev. ed. Research Tri-angle Institute, Research Triangle Park, NC.
Hanushek, Eric A. 1979. “Conceptual and Empirical Issues in the Estimation of Educational Production Functions.” Journal of Human Resources 14 (3): 351–88.
————. 1992. “The Trade-Off between Child Quantity and Quality.” Journal of Political Economy 100 (1): 84–117.
Heckman, James J. 2000. “Policies to Foster Human Capital.” Research in Economics 54 (1): 3–56.
Hungi, Njora. 2010. “What Are the Levels and Trends in Grade Repetition?” SACMEQ Policy Issues 5 (September), Southern and Eastern Africa Consortium for Monitoring Educational Quality, Paris.
Hungi, Njora, Demus Makuwa, Kenneth Ross, Mioko Saito, Stephanie Dolata, Frank van Cappelle, Laura Paviot, et al. 2010. “SACMEQ III Project Results: Pupil Achievement Levels in Reading and Mathematics.” Working Docu-ment Number 1, Southern and Eastern Africa Consor-tium for Monitoring Educational Quality, Paris.
Kaffenberger, Michelle, and Lant Pritchett. 2017. “More School or More Learning? Evidence from Learning Pro-files from the Financial Inclusion Insights Data.” Back-ground paper, World Bank, Washington, DC.
King, Elizabeth M., Berk Özler, and Laura B. Rawlings. 1999. “Nicaragua’s School Autonomy Reform: Fact or Fiction?” Working Paper 19, Impact Evaluation of Education Reforms, World Bank, Washington, DC.
Larson, Bradley, and Alexandria Valerio. 2017. “Estimating the Stock of Skills around the World: A Technical Note.” World Bank, Washington, DC.
Lee, Ju-Ho, and Song-Chang Hong. 2016. “Accumulating Human Capital for Sustainable Development in Korea.” Paper presented at the Korea Development Institute’s International Conference on More and Better Invest-ment in Global Education, Seoul, June 14.
Lemos, Renata, and Daniela Scur. 2016. “Developing Man-agement: An Expanded Evaluation Tool for Developing Countries.” RISE Working Paper 16/007, Research on Improving Systems of Education, Blavatnik School of Government, Oxford University, Oxford, U.K.
Lipina, Sebastián J., María I. Martelli, Beatriz Vuelta, and Jorge A. Colombo. 2005. “Performance on the A-Not-B Task of Argentinean Infants from Unsatisfied and Satis-fied Basic Needs Homes.” Interamerican Journal of Psychol-ogy 39 (1): 46–60.
Lupien, Sonia J., Suzanne King, Michael J. Meaney, and Bruce S. McEwen. 2000. “Child’s Stress Hormone Levels Correlate with Mother’s Socioeconomic Status and Depressive State.” Biological Psychiatry 48 (10): 976–80.
McCoy, Dana Charles, Evan D. Peet, Majid Ezzati, Goodarz Danaei, Maureen M. Black, Christopher R. Sudfeld, Wafaie Fawzi, et al. 2016. “Early Childhood Developmental Status in Low- and Middle-Income Countries: National, Regional, and Global Prevalence Estimates Using Pre-dictive Modeling.” PLOS Medicine 13 (6): e1002034.
Millot, Benoît, and Julia Lane. 2002. “The Efficient Use of Time in Education.” Education Economics 10 (2): 209–28.
MoEST (Malawi, Ministry of Education, Science, and Tech-nology). 2008. “Education Management Information System.” Report, MoEST, Lilongwe, Malawi.
The many faces of the learning crisis | 87
UIS (UNESCO Institute for Statistics). 2006. Teachers and Educational Quality: Monitoring Global Needs for 2015. Montreal: UIS.
————. 2017. Education (database). Montreal. http://data.uis .unesco.org/.
UNESCO (United Nations Educational, Scientific, and Cul-tural Organization). 2013. Third Regional Comparative and Explanatory Study (TERCE). UNESCO Regional Bureau for Education in Latin America and the Carib-bean, Santiago, Chile. http://www.unesco.org/new/en /santiago/education/education-assessment-llece/third -regional-comparative-and-explanatory-study-terce/.
————. 2014. EFA Global Monitoring Report 2013/4, Teaching and Learning: Achieving Quality for All. Paris: UNESCO.
————. 2015. Informe de resultados, TERCE: Logros de aprendizaje. Paris: UNESCO. Santiago, Chile: UNESCO Regional Office for Education in Latin America and the Caribbean; Paris: UNESCO.
————. 2016. “Gender Inequality in Learning Achievement in Primary Education: What Can TERCE Tell Us?” Third Regional Comparative and Explanatory Study, UNESCO Regional Office for Education in Latin America and the Caribbean, Santiago, Chile; UNESCO, Paris.
Uwezo. 2014. “Are Our Children Learning? Literacy and Numeracy in Kenya 2014.” Twaweza East Africa, Nairobi.
————. 2015. “Are Our Children Learning? Five Stories on the State of Education in Uganda in 2015 and Beyond.” Twaweza East Africa, Kampala, Uganda.
van Fleet, Justin W. 2012. “Africa’s Education Crisis: In School but Not Learning.” Up Front (blog), September 17. https://www.brookings.edu/blog/up-front/2012/09/17/africas -education-crisis-in-school-but-not-learning/.
Walker, Susan P., Theodore D. Wachs, Julie Meeks Gardner, Betsy Lozoff, Gail A. Wasserman, Ernesto Pollitt, Julie A. Carter, et al. 2007. “Child Development: Risk Factors for Adverse Outcomes in Developing Countries.” Lancet 369 (9556): 145–57.
Windisch, Hendrickje Catriona. 2015. “Adults with Low Literacy and Numeracy Skills: A Literature Review on Policy Intervention.” OECD Education Working Paper 123, Organisation for Economic Co-operation and Devel-opment, Paris.
World Bank. 2016a. “Africa Education Service Delivery in Mada-gascar: Results of 2016 Service Delivery Indicator Survey.” Washington, DC: World Bank.
————. 2016b. “Education Sector Public Expenditure Tracking and Service Delivery Survey in Zambia.” Washington, DC: World Bank.
————. 2016c. World Development Indicators (database). World Bank, Washington, DC. http://data.worldbank .org/data-catalog/world-development-indicators.
Pritchett, Lant, and Amanda Beatty. 2012. “The Negative Con-sequences of Overambitious Curricula in Developing Countries.” CGD Working Paper 293, Center for Global Development, Washington, DC.
Pritchett, Lant, and Justin Sandefur. 2017. “Girls’ Schooling and Women’s Literacy: Schooling Targets Alone Won’t Reach Learning Goals.” CGD Policy Paper 104, Center for Global Development, Washington, DC.
Robinson, Viviane M. J., Claire A. Lloyd, and Kenneth J. Rowe. 2008. “The Impact of Leadership on Student Out-comes: An Analysis of the Differential Effects of Leader-ship Types.” Educational Administration Quarterly 44 (5): 635–74.
Rockoff, Jonah E. 2004. “The Impact of Individual Teachers on Student Achievement: Evidence from Panel Data.” American Economic Review 94 (2): 247–52.
RTI International. 2015. Status of Early Grade Reading in Sub- Saharan Africa. Washington, DC: U.S. Agency for Interna-tional Development.
Rubio-Codina, Marta, Orazio Attanasio, Costas Meghir, Natalia Varela, and Sally Grantham-McGregor. 2015. “The Socioeconomic Gradient of Child Development: Cross-Sectional Evidence from Children 6–42 Months in Bogota.” Journal of Human Resources 50 (2): 464–83.
Sabarwal, Shwetlena, and Malek Abu-Jawdeh. 2017. “Under-standing Teacher Effort: Insights from Cross-Country Data on Teacher Perceptions.” Background paper, World Bank, Washington, DC.
SACMEQ (Southern and Eastern Africa Consortium for Monitoring Educational Quality). Various years. Univer-sity of Botswana, Gaborone. http://www.sacmeq.org/.
Singh, Abhijeet. 2016. “Starting Together, Growing Apart: Gender Gaps in Learning from Preschool to Adult- hood in Four Developing Countries.” Paper presented at the Association for Public Policy Analysis and Management’s International Conference, “Inequalities: Addressing the Growing Challenge for Policymakers Worldwide,” London School of Economics, London, June 13–14.
Sinha, Shabnam, Rukmini Banerji, and Wilima Wadhwa. 2016. Teacher Performance in Bihar, India: Implications for Education. Directions in Development: Human Develop-ment Series. Washington, DC: World Bank.
Smith, David. 2014. “Nigerian Schoolchildren Defiant in City That Defied Boko Haram.” Guardian (May 17). https://www.theguardian.com/world/2014/may/18/nigeria-kano -schoolchildren-boko-haram.
Spaull, Nicholas, and Janeli Kotze. 2015. “Starting Behind and Staying Behind in South Africa: The Case of Insur-mountable Learning Deficits in Mathematics.” Interna-tional Journal of Educational Development 41: 13–24.