The Management of Ship-Generated Waste On-board Ships
90
The Management of Ship-Generated Waste On-board Ships EMSA/OP/02/2016
Transcript of The Management of Ship-Generated Waste On-board Ships

The Management of
Ship-Generated Waste
On-board Ships
EMSA/OP/02/2016

1 January 2017 7.I85 – The Management of Ship-Generated Waste On-board Ships
Delft, CE Delft, January 2017
This report is prepared by:
CE Delft
CHEW
Client: European Maritime Safety Agency.
Publication code: 16.7I85.130
Shipping / Waste / Management / Regulations / Oil / Sewage / Plastics / Food / Incineration
waste / Domestic waste / Ozone-depleting gases / Cargo / Residues
CE publications are available from www.cedelft.eu
Further information on this study can be obtained from the contact person, Jasper Faber.
© copyright, CE Delft, Delft
The Management of
Ship-Generated Waste
On-board Ships EMSA/OP/02/2016
CE Delft
Committed to the Environment
Through its independent research and consultancy work CE Delft is helping build a sustainable
world. In the fields of energy, transport and resources our expertise is leading-edge. With our
wealth of know-how on technologies, policies and economic issues we support government
agencies, NGOs and industries in pursuit of structural change. For 35 years now, the skills and
enthusiasm of CE Delft’s staff have been devoted to achieving this mission.

2 January 2017 7.I85 – The Management of Ship-Generated Waste On-board Ships
Content
Summary 5
List of abbreviations 7
1 Introduction 8 1.1 Background, objective and methods 8 1.2 Scope of the study 9 1.3 EU legislation 10 1.4 IMO legislation 11 1.5 Outline of the report 18
2 Oily Bilge Water 19 2.1 Introduction 19 2.2 Oily bilge water management and technology 19 2.3 Drivers for oily bilge water generation 21 2.4 Quantity of oi ly bilge water generation 21 2.5 Conclusion 22
3 Oily Residues (Sludge) 23 3.1 Introduction 23 3.2 Oily residues management and technology 23 3.3 Drivers for oily residues generation 25 3.4 Quantity of oi ly residues generation 25 3.5 Conclusion 26
4 Oily Tank Washings (Slops) 27 4.1 Introduction 27 4.2 Oily tank washings management and technology 27 4.3 Drivers for oily tank washings generation 29 4.4 Quantity of oi ly tank washings 29 4.5 Conclusion 29
5 Sewage 30 5.1 Introduction 30 5.2 Sewage management and technology 30 5.3 Drivers for sewage generation 32 5.4 Quantity of sewage generation 32 5.5 Conclusion 33
6 Plastics 34 6.1 Introduction 34 6.2 Plastic management and technology 34 6.3 Drivers for plastics generation 36 6.4 Quantity of plastics generation 36 6.5 Conclusion 37

3 January 2017 7.I85 – The Management of Ship-Generated Waste On-board Ships
7 Food Wastes 38 7.1 Introduction 38 7.2 Food waste management and technologies 38 7.3 Drivers for food waste generation 40 7.4 Quantity of food waste generation 40 7.5 Conclusion 41
8 Domestic Wastes 42 8.1 Introduction 42 8.2 Domestic waste management and technology 42 8.3 Drivers for domestic waste generation 43 8.4 Quantity of domestic waste generation 43 8.5 Conclusion 44
9 Cooking Oil 45 9.1 Introduction 45 9.2 Cooking oil management and technology 45 9.3 Drivers for cooking oil generation 46 9.4 Quantity of cooking oil generation 46 9.5 Conclusion 46
10 Incinerator Ashes 47 10.1 Introduction 47 10.2 Incinerator ashes management and technology 47 10.3 Drivers for incineration ashes generation 48 10.4 Quantity of incineration ashes generation 49 10.5 Conclusion 49
11 Operational Wastes 50 11.1 Introduction 50 11.2 Operational waste management and technologies 50 11.3 Drivers for operational waste generation 51 11.4 Quantity of operational waste generation 52 11.5 Conclusion 52
12 Cargo Residues 53 12.1 Introduction 53 12.2 Cargo residues management 53 12.3 Drivers for cargo residues generation 54 12.4 Quantity of cargo residues generation 54 12.5 Conclusion 55
13 Ozone Depleting Substances 56 13.1 Introduction 56 13.2 Ozone depleting substances management 56 13.3 Quantity of ozone depleting substance waste generation 56 13.4 Conclusion 57
4 January 2017 7.I85 – The Management of Ship-Generated Waste On-board Ships
14 Other Non-common Waste Streams 58 14.1 Dirty ballast water 58 14.2 Animal carcasses 58 14.3 Fishing gear 58
15 Observations on Waste Handling 60 15.1 Introduction 60 15.2 Waste notification forms 60 15.3 Other observations 61
16 Conclusions 63 16.1 Waste estimations per type of waste 63 16.2 Key findings waste notification form audits 64 16.3 Treatment systems 64 16.4 Classification of waste 65
Annex A References 66
Annex B Overview interviews and audits 71
Annex C Results online survey 73
5 January 2017 7.I85 – The Management of Ship-Generated Waste On-board Ships
Summary
This study provides an empirical overview of the management, drivers,
technologies and the quantities of different categories of ship-generated
waste. The data presented in this report have been collected from ship audits,
interviews, a literature review, an online survey among stakeholders and
audits of waste notification forms.
For almost every type of ship-generated waste, there is a variety of waste
flows and on-board treatment methods. The empirical evidence gathered in
this study shows that ships use different treatment methods and often only
treat part of a waste stream. This results in a difference between the amounts
of waste generated and the amounts landed.
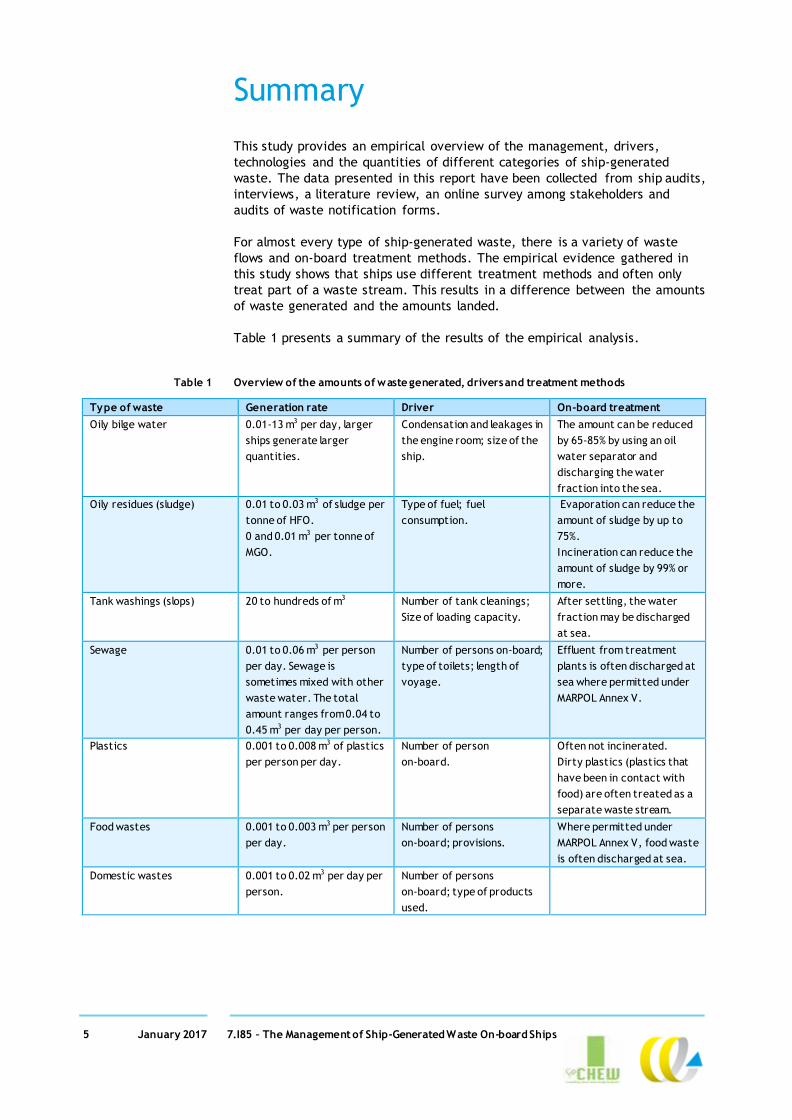
Table 1 presents a summary of the results of the empirical analysis.
Table 1 Overview of the amounts of waste generated, drivers and treatment methods
Type of waste Generation rate Driver On-board treatment
Oily bilge water 0.01-13 m3 per day, larger
ships generate larger
quantities.
Condensation and leakages in
the engine room; size of the
ship.
The amount can be reduced
by 65-85% by using an oil
water separator and
discharging the water
fraction into the sea.
Oily residues (sludge) 0.01 to 0.03 m3 of sludge per
tonne of HFO.
0 and 0.01 m3 per tonne of
MGO.
Type of fuel; fuel
consumption.
Evaporation can reduce the
amount of sludge by up to
75%.
Incineration can reduce the
amount of sludge by 99% or
more.
Tank washings (slops) 20 to hundreds of m3 Number of tank cleanings;
Size of loading capacity.
After settling, the water
fraction may be discharged
at sea.
Sewage 0.01 to 0.06 m3 per person
per day. Sewage is
sometimes mixed with other
waste water. The total
amount ranges from 0.04 to
0.45 m3 per day per person.
Number of persons on-board;
type of toilets; length of
voyage.
Effluent from treatment
plants is often discharged at
sea where permitted under
MARPOL Annex V.
Plastics 0.001 to 0.008 m3 of plastics
per person per day.
Number of person
on-board.
Often not incinerated.
Dirty plastics (plastics that
have been in contact with
food) are often treated as a
separate waste stream.
Food wastes 0.001 to 0.003 m3 per person
per day.
Number of persons
on-board; provisions.
Where permitted under
MARPOL Annex V, food waste
is often discharged at sea.
Domestic wastes 0.001 to 0.02 m3 per day per
person.
Number of persons
on-board; type of products
used.

6 January 2017 7.I85 – The Management of Ship-Generated Waste On-board Ships
Type of waste Generation rate Driver On-board treatment
Cooking oil 0.01 to 0.08 litres per person
per day.
Number of persons
on-board; type of food
prepared.
Although not permitted,
cooking oil is sometimes still
added to the sludge tank.
Incinerator ashes 0.004 and 0.06 m3 per
month.
Use of incinerator; cost of
using incinerator.
The incinerator is not used
for all types of waste, mostly
for paper sometimes for oily
sludge.
Operational wastes 0.001 to 0.1 m3 per person
per day.
Size of the ship;
type of cargo.
Cargo residues 0.001–2 % of cargo load. Type of cargo.
Size of ship.

7 January 2017 7.I85 – The Management of Ship-Generated Waste On-board Ships
List of abbreviations
AWTS - Advanced Wastewater Treatment System
COW – Crude Oil Washing
EEDI - Energy Efficiency Design Index
EMSA – European Maritime Safety Agency
ESSF – European Sustainable Shipping Forum
GRB – Garbage Record Book
HCFC – Hydro chlorofluorocarbons
HFO – Heavy Fuel Oil
IOPP – International Oil Pollution Prevention
IMO – International Maritime Organisation
ISPP – International Sewage Pollution Prevention
MARPOL - International Convention for the Prevention of Pollution from Ships
MEPC - Marine Environment Protection Committee
MGO - Marine Gas Oil
MSD - Marine Sewage Device
ODMCS – Oil Discharge Monitoring and Control System
ODM-E – Oil Discharge Monitoring Equipment
ORB – Oil Record Book
OWS – Oil Water Separator
PCB – polychlorinated biphenyls
Ppm – parts per million
PVC – polyvinyl chlorides
PRF – Port Reception Facility
RO - Reverse Osmosis
SGW – Ship Generated Waste
8 January 2017 7.I85 – The Management of Ship-Generated Waste On-board Ships
1 Introduction
1.1 Background, objective and methods
EMSA is assisting the European Commission in its work on the potential revision
of Directive 2000/59/EC (EC, 2000) on port reception facilities for ship-
generated waste and cargo residues, also called the PRF Directive. One of the
issues that have been raised is the quantity of ship-generated waste (SGW) on-
board of ships and how it is managed. The literature on this issue is outdated
and does not reflect new developments in waste handling and treatment.
Better information on the amount of waste generated during a voyage, the
waste management practices on-board of ships and on the amount of waste
discharged in ports, would help regulators, ports and waste handlers plan for
the reception and delivery of waste.
The objectives of this study are:
1. To provide a detailed review of the waste practices and management of
ship-generated waste on-board on the range of ships visiting EU ports.
2. To provide average quantities of different types of waste being generated
on-board of ships.
3. To provide a comprehensive review of the present technologies and
methods being used to reduce SGW produced by ships.
The study has an empirical nature; the findings are based on:
interviews with shipping companies, ports, waste handlers and technology
providers;
audits of garbage management plans, International Oil Pollution Prevention
(IOPP) certificates, International Sewage Pollution Prevention (ISPP)
certificates, garbage management books, oil record books(ORB) and ozone
depleting substances (ODS) record books of ships;
audits of waste notification forms and delivery receipts;
a literature review; and
an internet survey to validate the results.
The empirical basis of the study was gathered in 13 ship audits, 25 interviews
(see Annex B for an overview) and from 33 participants in the internet survey.
The aim of the audits and interviews was to obtain copies of oil record books
and garbage record books (GRB), and gather information on waste generation,
treatment and handling on-board. While it was possible to obtain these data
on all ship audits, it was not possible for every interview because copies of
relevant record books are not regularly kept on shore. The information from
the record books was analysed to obtain estimates of the quantities of waste
generated and delivered to PRF.
The relatively small size of the sample means that the results presented in the
following chapters cannot always be extrapolated to the entire fleet. In some
cases, like oily residues, the amounts of waste generated in the entire sample
lies within a small range which is consistent with information found in the
literature. Consequently, we are confident that this range is valid for most
ships. In other cases, however, there is a large variation between ships that
cannot be ascribed to ship types or other characteristics. In these cases, the
ranges presented in this report can serve as an indication of the quantities of
waste, but should not be considered to be statistical averages.
9 January 2017 7.I85 – The Management of Ship-Generated Waste On-board Ships
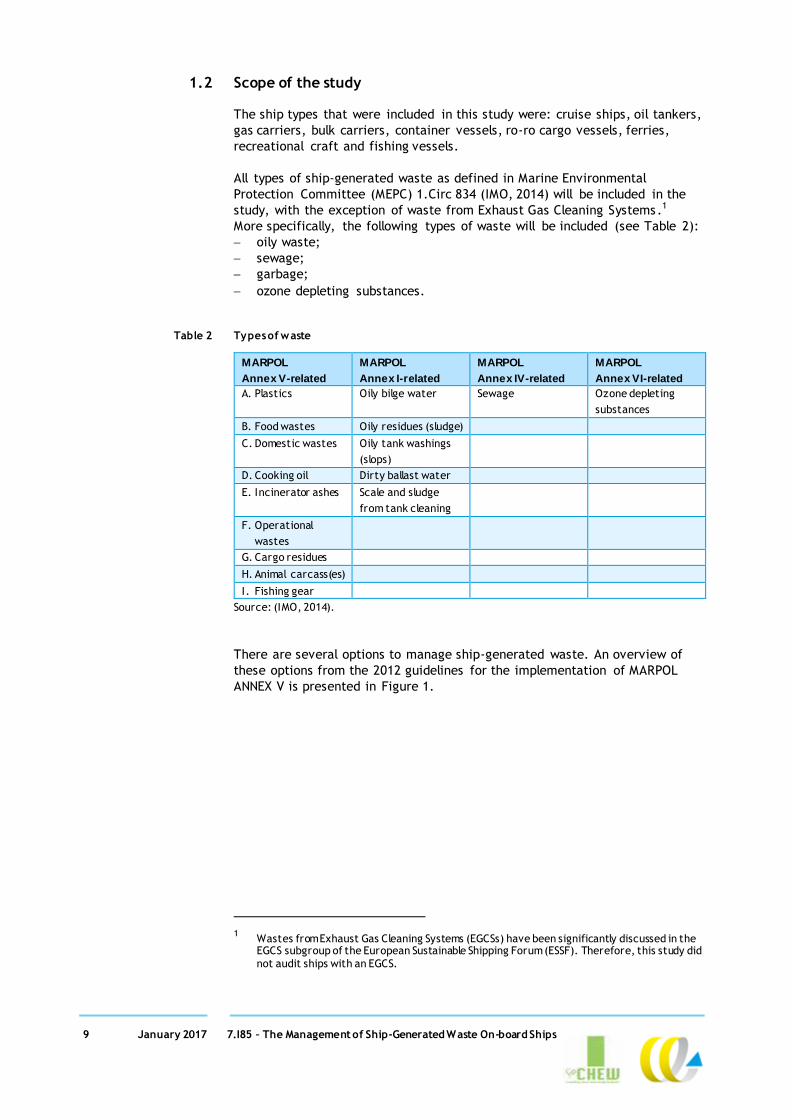
1.2 Scope of the study
The ship types that were included in this study were: cruise ships, oil tankers,
gas carriers, bulk carriers, container vessels, ro-ro cargo vessels, ferries,
recreational craft and fishing vessels.
All types of ship-generated waste as defined in Marine Environmental
Protection Committee (MEPC) 1.Circ 834 (IMO, 2014) will be included in the
study, with the exception of waste from Exhaust Gas Cleaning Systems.1
More specifically, the following types of waste will be included (see Table 2):
oily waste;
sewage;
garbage;
ozone depleting substances.
Table 2 Types of waste
MARPOL
Annex V-related
MARPOL
Annex I-related
MARPOL
Annex IV-related
MARPOL
Annex VI-related
A. Plastics Oily bilge water Sewage Ozone depleting
substances
B. Food wastes Oily residues (sludge)
C. Domestic wastes Oily tank washings
(slops)
D. Cooking oil Dirty ballast water
E. Incinerator ashes Scale and sludge
from tank cleaning
F. Operational
wastes
G. Cargo residues
H. Animal carcass(es)
I. Fishing gear
Source: (IMO, 2014).
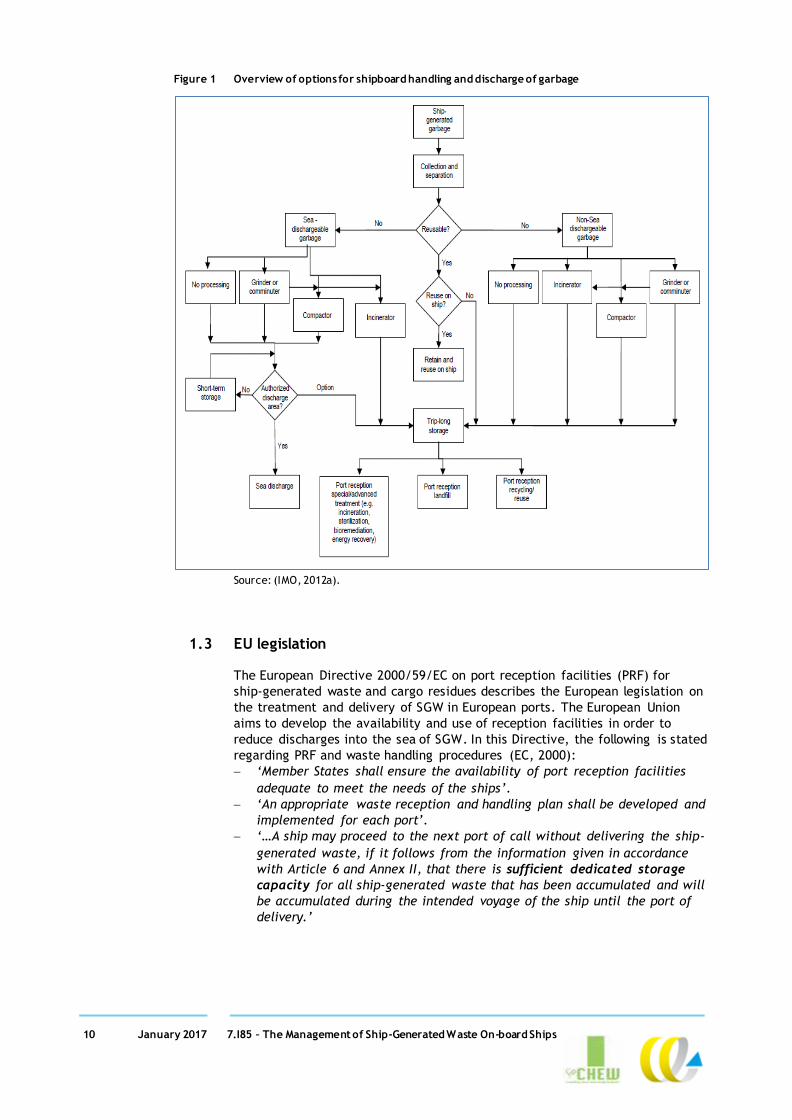
There are several options to manage ship-generated waste. An overview of
these options from the 2012 guidelines for the implementation of MARPOL
ANNEX V is presented in Figure 1.
1 Wastes from Exhaust Gas Cleaning Systems (EGCSs) have been significantly discussed in the
EGCS subgroup of the European Sustainable Shipping Forum (ESSF). Therefore, this study did
not audit ships with an EGCS.
10 January 2017 7.I85 – The Management of Ship-Generated Waste On-board Ships
Figure 1 Overview of options for shipboard handling and discharge of garbage
Source: (IMO, 2012a).
1.3 EU legislation
The European Directive 2000/59/EC on port reception facilities (PRF) for
ship-generated waste and cargo residues describes the European legislation on
the treatment and delivery of SGW in European ports. The European Union
aims to develop the availability and use of reception facilities in order to
reduce discharges into the sea of SGW. In this Directive, the following is stated
regarding PRF and waste handling procedures (EC, 2000):
‘Member States shall ensure the availability of port reception facilities
adequate to meet the needs of the ships’.
‘An appropriate waste reception and handling plan shall be developed and
implemented for each port’.
‘…A ship may proceed to the next port of call without delivering the ship-
generated waste, if it follows from the information given in accordance
with Article 6 and Annex II, that there is sufficient dedicated storage
capacity for all ship-generated waste that has been accumulated and will
be accumulated during the intended voyage of the ship until the port of
delivery.’
11 January 2017 7.I85 – The Management of Ship-Generated Waste On-board Ships
1.4 IMO legislation
The legislation on on-board processing of SGW is described in the IMO MARPOL
Convention. MARPOL has six Annexes of which five relate to waste in the scope
of this study:
oily waste (sludge, bilge water, engine oil, Annex I);
cargo residues (Annex II and V);
sewage (Annex IV);
garbage (food waste, plastic, Annex V);
ozone depleting substances (Annex VI).
1.4.1 MARPOL ANNEX I Regulation on the prevention of pollution by oil can be found in Annex I of
MARPOL. Regulation 15 and 17 provide requirements for machinery spaces of
all ships (IMO, 2016); (IMO, 2006a):
Regulation 15: Discharge of oil or oily mixtures from ships of 400 gross
tonnage and above into the sea is generally prohibited. The oil residues
which cannot be discharged into the sea in compliance with this regulation
should be retained on-board for subsequent discharge to reception
facilities. In the case of a ship of less than 400 gross tonnage, oil and all
oily mixtures should either be retained on-board for subsequent delivery
to reception facilities or discharged into the sea given certain provisions.
Only when a number of criteria are met, including that the oil content may
not exceed 15 ppm, may water contaminated with oil be discharged in the
sea by way of exception to this general rule.
Regulation 17: Oil tankers of 150 gross tonnage and above and other ships
of 400 gross tonnage and above should have an Oil Record Part I book
which has to be completed if a machinery space operation takes place.
In case of oil discharge a statement has to be made in the Oil Record Book
Part I.
Regulation 34 and 36 provide requirements on the handling of waste from oil
cargo:
Regulation 34: Any discharge into the sea of oil or oily mixture from the
cargo area of an oil tanker is prohibited while in a special area. In the case
of discharges outside a special area, discharge into the sea of oil or oily
mixtures from the cargo area of an oil tanker is prohibited except when
several conditions are satisfied. The oil residues which cannot be
discharged into the sea should be retained on-board for subsequent
discharge to reception facilities.
Regulation 36: Oil tankers of 150 gross tonnage and above should have an
Oil Record book Part II which has to be completed if a cargo/ballast
operation takes place. In case of oil or oily mixture discharge a statement
has to be made in the Oil Record Book Part II.
An exception on Regulation 15 and 34 is the discharge at sea in case of
securing the safety of a ship and those on-board and to save a life at sea.
It is also allowed to discharge in case of discharge as a result of damage to
a ship provided all precautions have been taken.

12 January 2017 7.I85 – The Management of Ship-Generated Waste On-board Ships
1.4.2 MARPOL ANNEX II Although Annex II waste is beyond the scope of the empirical part of this
study, a brief discussion on cargo residues is included here in order to present
a complete overview of the IMO legislation.
Regulation for the control of pollution of noxious liquid substances in bulk can
be found in Annex II. Annex II contains a set of regulations including Regulation
13 on the control of discharge of residues of noxious liquid substances.
The following regulations are relevant for cargo residues (IMO, 2016):
Ventilation of cargo residues may be used to remove cargo residues from a
tank. Water that is introduced in the tank after the ventilation will be
regarded as clean.
An exemption of a prewash can be granted in the case that the cargo
residues will be removed by a ventilation procedure.
The procedures for ventilation of cargo residues are described in
Appendix 7 of Annex 7. Cargo residues that are allowed to be removed
from a cargo tank by ventilation are substances with a vapour pressure
greater than 5kPa at 20°C.
It is allowed to discharge at sea in case of securing the safety of a ship and
those on-board and to save a life at sea. It is also allowed to discharge in
case of discharge as a result of damage to a ship provided all precautions
have been taken.
Regulation 6 describes the categorisation of noxious liquid substances:
Category X: Noxious liquid substances which, if discharged into sea are
considered to present a major hazard to the marine resources or human
health and are prohibited to be discharged into the marine environment;
Category Y: Noxious liquid substances which, if discharged into sea are
considered to present a hazard to the marine resources or human health or
cause harm to amenities or other legitimate uses of the sea and are
limited on the quality and quantity of discharge into the marine
environment;
Category Z: Noxious liquid substances which, if discharged into sea are
considered to present a minor hazard to the marine resources or human
health and have less stringent restrictions on the quality and quantity of
discharge into the marine environment;
Other substances: Other substances that are considered not to present
harm to marine resources, human health, amenities or other legitimate
uses of the sea when discharged and which are not subject to any
requirements.
1.4.3 MARPOL ANNEX IV Regulation for the prevention of pollution by sewage can be found in Annex IV
of MARPOL (IMO, 2016). Annex IV contains a set of regulations regarding the
discharge of sewage into the sea from ships, including:
regulations regarding the ships' equipment and systems for the control of
sewage discharge;
the provision of port reception facilities for sewage; and
requirements for survey and certification.
It is generally considered that on the high seas, the oceans are capable of
assimilating and dealing with raw sewage through natural bacterial action.
Therefore, the regulations in Annex IV of MARPOL prohibit the discharge of
sewage into the sea within a specified distance from the nearest land, unless
otherwise provided.
13 January 2017 7.I85 – The Management of Ship-Generated Waste On-board Ships
The revised Annex applies to new ships engaged in international voyages of
400 gross tonnage and above or which are certified to carry more than
15 persons and includes the following requirements:
The Annex requires ships to be equipped with either an approved sewage
treatment plant or an approved sewage comminuting and disinfecting
system or a sewage holding tank.
The discharge of sewage into the sea is prohibited, except when the ship
has in operation an approved sewage treatment plant or when the ship is
discharging comminuted and disinfected sewage using an approved system
at a distance of more than 3 nautical miles from the nearest land.
Sewage which is not comminuted or disinfected may be discharged at a
distance of more than 12 nautical miles from the nearest land, and the
rate of discharge of untreated sewage shall be approved by the
Administration (see resolution MEPC.157(55) (MEPC, 2006)).
It is allowed to discharge at sea in case of securing the safety of a ship and
those on-board and to save a life at sea. It is also allowed to discharge in
case of discharge as a result of damage to a ship provided all precautions
have been taken.
A special area established under Annex IV is the Baltic Sea area. The discharge
of sewage from passenger ships within the special area will generally be
prohibited under the new regulations, except when the ship has in operation
an approved sewage treatment plant which has been certified by the
Administration. The sewage treatment plant installed on a passenger ship
intending to discharge sewage effluent in special areas should meet more
stringent nitrogen and phosphorus removal standards (tertiary treatment2).
The discharge of sewage from passenger ships within special areas are
prohibited after 1 January 2019 for new passenger ships and after 1 January
2021 for existing passenger ships (MEPC, 2016)
1.4.4 MARPOL ANNEX V Regulation for the prevention of pollution by garbage from ships can be found
in Annex V which applies for all types of ships. In July 2011, MEPC 62 adopted
the revised MARPOL Annex V which entered into force on the first of January
2013 (MEPC, 2011). Garbage is defined as all kinds of food, domestic and
operational waste, all plastics, cargo residues, incinerator ashes, cooking oil,
fishing gear, and animal carcasses. Garbage does not include fresh fish (parts)
as a result of fishing activities or as a result of aquaculture activities.
Annex V prohibits the discharge of garbage except as provided otherwise in the
regulations 4, 5, 6 and 7 of the Annex:
Regulation 4: Cleaning agents or additives may be discharged into sea,
if they are not harmful to the marine environment. The discharge of the
following garbage outside special areas shall only be permitted while the
ship is en route and as far as practicable from the nearest land, but not
less than:
3 nm from the nearest land for food wastes which have been passed
through a comminuter or grinder with a screen less than 25mm.
12 nm from the nearest land for food wastes that have not been
treated in accordance with previous paragraph.
2 Tertiary treatment is the removal of for example nutrients, secondary treatment is the
removal of organic matter and primary treatment is the removal of solids. (World Bank Group,
2016)

14 January 2017 7.I85 – The Management of Ship-Generated Waste On-board Ships
12 nm from the nearest land for cargo residues that cannot be
recovered using commonly available methods for unloading. These
cargo residues shall not contain any substances classified as harmful to
the marine environment, taking into account guidelines developed by
the Organization.
For animal carcasses, discharge shall occur as far from the nearest land
as possible, taking into account the guidelines developed by the
Organization
Regulation 5: The discharge into the sea of any garbage is prohibited from
fixed or floating platforms and from all other ships when alongside or
within 500 m of such platforms. Food wastes may be discharged into the
sea from fixed or floating platforms located more than 12 nautical miles
from the nearest land and from all other ships when alongside or
within 500 m of such platforms, but only when the wastes have been
passed through a comminuter or grinder. Such comminuted or ground food
wastes shall be capable of passing through a screen with openings no
greater than 25 mm.
Regulation 6: Discharge of the following garbage into the sea within special
areas shall only be permitted while the ship is en route and as follows:
Discharge into the sea of food wastes as far as practicable from the
nearest land, but not less than 12 nautical miles from the nearest land
or the nearest ice shelf. Food wastes shall be comminuted or ground
and shall be capable of passing through a screen with openings no
greater than 25 mm. Food wastes shall not be contaminated by any
other garbage type. Discharge of introduced avian products, including
poultry and poultry parts, is not permitted in the Antarctic area unless
it has been treated to be made sterile.
Discharge of cargo residues that cannot be recovered using commonly
available methods for unloading, where all the following conditions are
satisfied:
Cargo residues, cleaning agents or additives, contained in hold
washing water do not include any substances classified as harmful to
the marine environment, taking into account guidelines developed
by the Organization;
Both the port of departure and the next port of destination are
within the special area and the ship will not transit outside the
special area between those ports;
No adequate reception facilities are available at those ports taking
into account guidelines developed by the Organization; and
Where the conditions of subparagraphs 2.1, 2.2 and 2.3 of this
paragraph have been fulfilled, discharge of cargo hold washing
water containing residues shall be made as far as practicable from
the nearest land or the nearest ice shelf and not less than 12
nautical miles from the nearest land or the nearest ice shelf.
Cleaning agents or additives contained in deck and external surfaces wash
water may be discharged into the sea, but only if these substances are not
harmful to the marine environment, taking into account guidelines
developed by the Organization.

15 January 2017 7.I85 – The Management of Ship-Generated Waste On-board Ships
The following rules (in addition to the rules in paragraph 1 of this
regulation) apply with respect to the Antarctic area:
Each Party at whose ports ships depart en route to or arrive from the
Antarctic area undertakes to ensure that as soon as practicable
adequate facilities are provided for the reception of all garbage from
all ships, without causing undue delay, and according to the needs of
the ships using them.
Each Party shall ensure that all ships entitled to fly its flag, before
entering the Antarctic area, have sufficient capacity on board for the
retention of all garbage, while operating in the area and have
concluded arrangements to discharge such garbage at a reception
facility after leaving the area.
When garbage is mixed with or contaminated by other substances
prohibited from discharge or having different discharge requirements,
the more stringent requirements shall apply.
Regulation 7: Exceptions of regulation 3,4,5 and 6 are:
The discharge of garbage from a ship necessary for the purpose of
securing the safety of a ship and those on board or saving life at sea; or
The accidental loss of garbage resulting from damage to a ship or its
equipment, provided that all reasonable precautions have been taken
before and after the occurrence of the damage, to prevent or minimize
the accidental loss; or
The accidental loss of fishing gear from a ship provided that all
reasonable precautions have been taken to prevent such loss; or
The discharge of fishing gear from a ship for the protection of the
marine environment or for the safety of that ship or its crew.
The en route requirements of regulations 4 and 6 shall not apply to the
discharge of food wastes where it is clear the retention on board of
these food wastes presents an imminent health risk to the people on
board
ANNEX V provides several regulations on control and enforcement of the
disposal prohibition of garbage: Regulation 8: Each Party undertakes to
ensure the provision of adequate facilities at ports and terminals for the
reception of garbage without causing undue delay to ships, and according
to the needs of the ships using them.
Regulation 9 : A ship when in a port or an offshore terminal of another
Party is subject to inspection by officers duly authorized by such Party
concerning operational requirements under this Annex, where there are
clear grounds for believing that the master or crew are not familiar with
essential shipboard procedures relating to the prevention of pollution by
garbage. Procedures relating to the port State control as prescribed in
article 5 also apply to this regulation
Regulation 10: Regulation on placards, garbage management plans and
garbage record-keeping:
Every ship of 12 m or more in length overall and fixed or floating
platforms shall display placards which notify the crew and passengers
of the discharge requirements of regulations 3, 4, 5 and 6 of this
Annex, as applicable. The placards shall be written in the working
language of the ship's crew and, for ships engaged in voyages to ports
or offshore terminals under the jurisdiction of other Parties to the
Convention, shall also be in English, French or Spanish.
Every ship of 100 gross tonnage and above, and every ship which is
certified to carry 15 or more persons, and fixed or floating platforms
shall carry a garbage management plan which the crew shall follow.

16 January 2017 7.I85 – The Management of Ship-Generated Waste On-board Ships
This plan shall provide written procedures for minimizing, collecting,
storing, processing and disposing of garbage, including the use of the
equipment on board. It shall also designate the person or persons in
charge of carrying out the plan. Such a plan shall be based on the
guidelines developed by the Organization2 and written in the working
language of the crew.
Every ship of 400 gross tonnage and above and every ship which is certified to carry 15 or more persons engaged in voyages to ports or offshore terminals under the jurisdiction of another Party to the Convention and
every fixed or floating platform shall be provided with a Garbage Record Book
The competent authority of the Government of a Party to the Convention
may inspect the Garbage Record Books or ship's official log–book on board
any ship to which this regulation applies while the ship is in its ports or
offshore terminals and may make a copy of any entry in those books, and
may require the master of the ship to certify that the copy is a true copy
of such an entry. Any copy so made, which has been certified by the
master of the ship as a true copy of an entry in the ship's Garbage Record
Book or ship's official log-book, shall be admissible in any judicial
proceedings as evidence of the facts stated in the entry. The inspection of
a Garbage Record Book or ship's official log-book and the taking of a
certified copy by the competent authority under this paragraph shall be
performed as expeditiously as possible without causing the ship to be
unduly delayed.
The accidental loss or discharge of fishing gear as provided for in
regulations 7.1.3 and 7.1.3bis which poses a significant threat to the
marine environment or navigation shall be reported to the State whose flag
the ship is entitled to fly, and, where the loss or discharge occurs within
waters subject to the jurisdiction of a coastal State, also to that coastal
State.
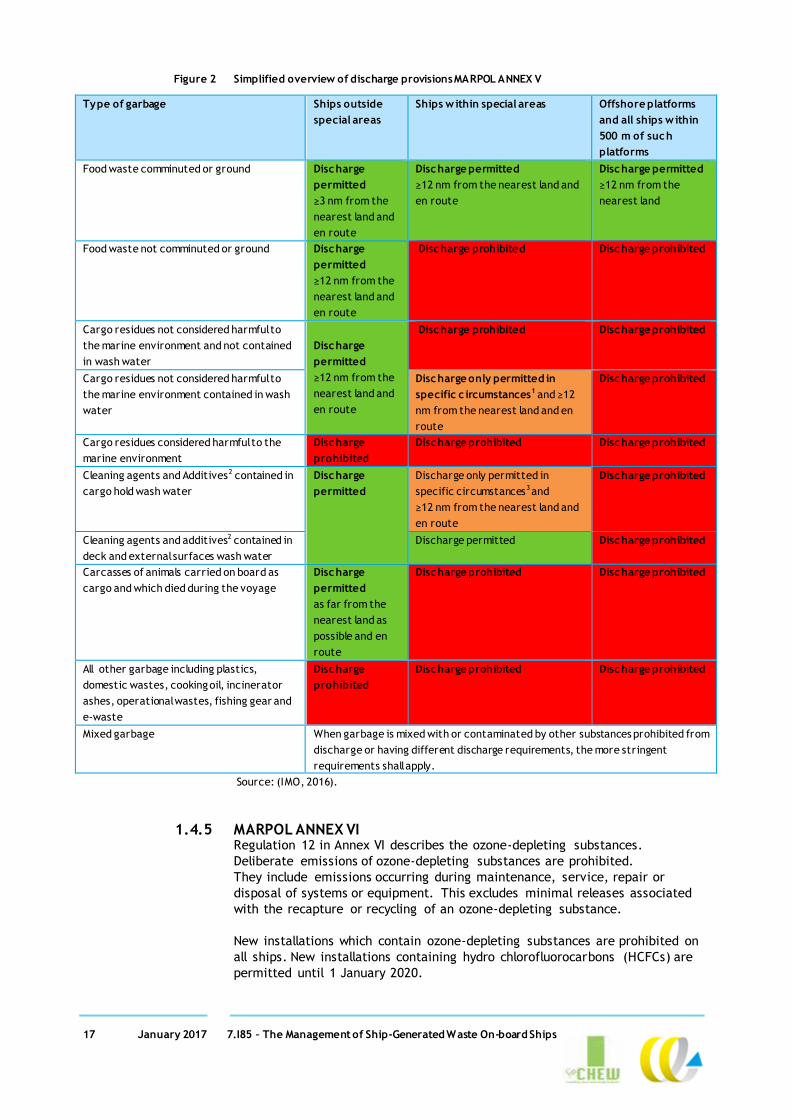
An overview of the types of garbage and whether ships are allowed to
discharge waste into the sea is provided in Figure 2 (IMO, 2016).
17 January 2017 7.I85 – The Management of Ship-Generated Waste On-board Ships
Figure 2 Simplified overview of discharge provisions MARPOL ANNEX V
Type of garbage Ships outside
special areas
Ships within special areas Offshore platforms
and all ships within
500 m of such
platforms
Food waste comminuted or ground Discharge
permitted
≥3 nm from the
nearest land and
en route
Discharge permitted
≥12 nm from the nearest land and
en route
Discharge permitted
≥12 nm from the
nearest land
Food waste not comminuted or ground Discharge
permitted
≥12 nm from the
nearest land and
en route
Discharge prohibited Discharge prohibited
Cargo residues not considered harmful to
the marine environment and not contained
in wash water
Discharge
permitted
≥12 nm from the
nearest land and
en route
Discharge prohibited Discharge prohibited
Cargo residues not considered harmful to
the marine environment contained in wash
water
Discharge only permitted in
specific c ircumstances1 and ≥12
nm from the nearest land and en
route
Discharge prohibited
Cargo residues considered harmful to the
marine environment
Discharge
prohibited
Discharge prohibited Discharge prohibited
Cleaning agents and Additives2 contained in
cargo hold wash water
Discharge
permitted
Discharge only permitted in
specific circumstances3 and
≥12 nm from the nearest land and
en route
Discharge prohibited
Cleaning agents and additives2 contained in
deck and external surfaces wash water
Discharge permitted Discharge prohibited
Carcasses of animals carried on board as
cargo and which died during the voyage
Discharge
permitted
as far from the
nearest land as
possible and en
route
Discharge prohibited Discharge prohibited
All other garbage including plastics,
domestic wastes, cooking oil, incinerator
ashes, operational wastes, fishing gear and
e-waste
Discharge
prohibited Discharge prohibited Discharge prohibited
Mixed garbage When garbage is mixed with or contaminated by other substances prohibited from
discharge or having different discharge requirements, the more stringent
requirements shall apply.
Source: (IMO, 2016).
1.4.5 MARPOL ANNEX VI Regulation 12 in Annex VI describes the ozone-depleting substances.
Deliberate emissions of ozone-depleting substances are prohibited.
They include emissions occurring during maintenance, service, repair or
disposal of systems or equipment. This excludes minimal releases associated
with the recapture or recycling of an ozone-depleting substance.
New installations which contain ozone-depleting substances are prohibited on
all ships. New installations containing hydro chlorofluorocarbons (HCFCs) are
permitted until 1 January 2020.
18 January 2017 7.I85 – The Management of Ship-Generated Waste On-board Ships
The substances referred to in this regulation, and equipment containing such
substances, should be delivered to appropriate reception facilities when
removed from ships (IMO, 2006d).
Again, waste arising from Annex VI regulations can be discharged at sea for the
purpose of securing the safety of a ship and those on-board and to save a life
at sea. It is also allowed to discharge in case of discharge as a result of
damage to a ship provided all precautions have been taken.
Annex VI includes a regulation on SOX emissions (Regulation 14). While ships
are within a SECA (SOX emission control area), the Sulphur content of fuel oil
should not exceed 0.1% m/m or an EGCS (exhaust gas cleaning system) should
be used. From 2020 onwards, the limit outside ECAs will be 0.5% sulphur m/m.
EGCSs produce washwater, which is not waste, and sludge. The latter is not
included in the scope of this research because wastes from EGCS have been
discussed significantly in the EGCS Sub-Group of the European Sustainable
Shipping Forum. Therefore, this study did not audit ships with an EGCS.
Regulation 16 of Annex VI on shipboard incineration allows shipboard
incineration only in a shipboard incinerator and each incinerator should be
approved by the Administration. Shipboard incineration is prohibited for the
following substances:
MARPOL Annex I, II and III cargo residues and related contaminated packing
materials;
polychlorinated biphenyls (PCBs);
garbage, as defined in Annex V of the present Convention, containing more
than traces of heavy metals; and
refined petroleum products containing halogen compounds.
Shipboard incineration of polyvinyl chlorides (PVCs) is prohibited, except in
shipboard incinerators for which IMO Type Approval Certificates have been
issued. Shipboard incineration of sewage sludge and sludge oil generated
during the normal operation of a ship may also take place in the main or
auxiliary power plant or boilers, but in those cases, shall not take place inside
ports, harbours and estuaries.
1.5 Outline of the report
Chapters 2 through 14 provide a review of waste generation, treatment and
disposal per type of waste. Each chapter contains a definition of the type of
waste, a description of its management on-board ships, technologies to reduce
the amount of waste, the drivers for waste generation and an estimate of the
quantity of waste. In those cases where any of these issues vary over ship
types, a reference is made to specific ship types involved.
Chapter 15 provides an audit of waste notification forms and other
observations. Chapter 16 contains the conclusions.
Annex A contains the full references of literature sources. An overview of
interviews and ships audited is presented in Annex B. The results from the
online survey are presented in Annex C.

19 January 2017 7.I85 – The Management of Ship-Generated Waste On-board Ships
2 Oily Bilge Water
2.1 Introduction
Bilge water is a mixture of liquids that are collected in the bilge of a ship.
It is made of a mixture of fresh water, sea water, oil, sludge, chemicals and
various other fluids that drain into the Bilge. Sea water and fresh water can
find its way to the bilge wells due to drainage from the deck, leakage in the
pipe lines, leaky pump and valve glands from machinery or spillages in the
engine room.
Bilge water is generated through condensation, leakages and cleaning. As a
general rule, bilge water contains oil from the engine rooms; hence the term
‘oily bilge water’. Any liquid entering the bilge system including bilge wells,
bilge piping, tank top or bilge holding tanks is considered to be oily bilge water
(Lloyd's Register, 2008). All vessels have oily bilge water, although the
quantities for recreational vessels are minimal.
2.2 Oily bilge water management and technology
The bilge water can be managed by retaining it on-board in a tank and
discharging it to a port reception facility, or it can be treated on-board with
an OWS. This on-board treatment system is designed to remove the oily part
from the vessel bilge water prior to the discharge of the treated bilge water.
Bilge separator technologies have advanced in recent years to improve the
effectiveness of oily bilge water treatment. Most of the tested bilge separators
by the US Coast Guard were treatment systems that combined a gravity
oil-water separator (OWS) or centrifuge with one or more additional unit
operations that ‘polish’ the bilge water effluent to reduce concentrations of
emulsified oil (EPA, 2011). Even though there are several technologies to
separate the water and oil, such as absorption/adsorption, biological
treatment, coagulation/flocculation, flotation and membranes, the most
frequently found technology during the ship audits are the ones based on
density differences between oil and water. This type of treatment can reduce
the quantity of bilge water by 65–85%.
MARPOL has regulated that all ships over 400 gross tons (GT) are required to
have equipment installed on-board that limits the discharge of oil into the
oceans to 15 ppm when a ship is en route. They are also required to have an
oil content monitor (OCM) and a bilge alarm to detect if the treated bilge
water meets the discharge requirements. The system consists of a three-way
valve that makes it possible to retain treated bilge water on-board in case the
discharge does not comply with the requirements.
Figure 3 presents the waste flow diagram of oily bilge water, based on the ship
audits and interviews and confirmed by the internet survey. Oily bilge water is
collected in a holding tank (the oily bilge tank) and either disposed of directly
to a port reception facility or, more often, treated in an OWS. The clean water
is generally discharged to sea. The oil fraction from the oil/water separator is
usually fed into a waste oil or sludge tank and treated as such (see also (EPA,
2008); (Friends of the Earth, 2009)).

20 January 2017 7.I85 – The Management of Ship-Generated Waste On-board Ships
Figure 3 Waste flow diagram oily bilge water
All the ships audited in this study had some type of OWS treatment system
installed. In some cases the OWS system was not operational, as the waste
management plan required the ship to retain all generated bilge water
on-board until the possibility of discharge to a PRF. In most cases, however,
an OWS was used and the water was discharged at sea.
An example of the waste flow for oily bilge waters on-board a ship is presented
in Table 3. The ship in the first case study treats part of the oily bilge water
generated in an OWS (less than 50%). In this case not all of the oily bilge is
delivered in port to PRF, the ship elected to keep some on-board as it has
sufficient capacity to store it and deliver it to PRF in the next port
(approximately 20%).3 In the second case study, the ship does not use an OWS
but stores the bilge water in a sludge tank and delivers it to PRF in port.
The amount that is generated does not have to be the same as the amount
disposed, as some bilge water can be stored on-board for delivery to PRF in a
port. The third case study is the case of an oil tanker that normally uses an
OWS and disposes the water fraction of the oily bilge water at sea.
However, in the period of studying the waste flows of this ship, no OWS was
used and no discharge was made at sea and no delivery was made to PRF.
The amount of bilge water generated in this period was only 25% of the
storage capacity. The fourth case study is a ferry which uses settling and an
OWS to treat oily bilge water and disposes the water at sea while storing the
oil in a dirty oil tank. In this period more bilge water is generated than the
storage capacity of 70.2 m3 thus a large amount is disposed at sea.
These examples show that the management of oily bilge water can differ
per ship, as well as the amount of waste being treated, disposed at sea or
retained on-board for delivery at PRF.
3 Although the PRF Directive states that ,,.... the European Commission in its
“interpretative.........” has stated that this should be the next port of call. However if a vessel has sufficient capacity at the next port of call to keep this waste on-board for a
subsequent voyage it can re-notify that it wishes to keep this waste on-board through the
Advanced Waste Notification Form.
PRF
Sea
Oil/water
separator
Oily bilge
tank
Generation:
- Condensation- Oil and lube
leakages
- Cooling pump leakages
- Cleaning
Oil
Water
Oily bilge water
Waste oil
tankor
sludge tank
21 January 2017 7.I85 – The Management of Ship-Generated Waste On-board Ships
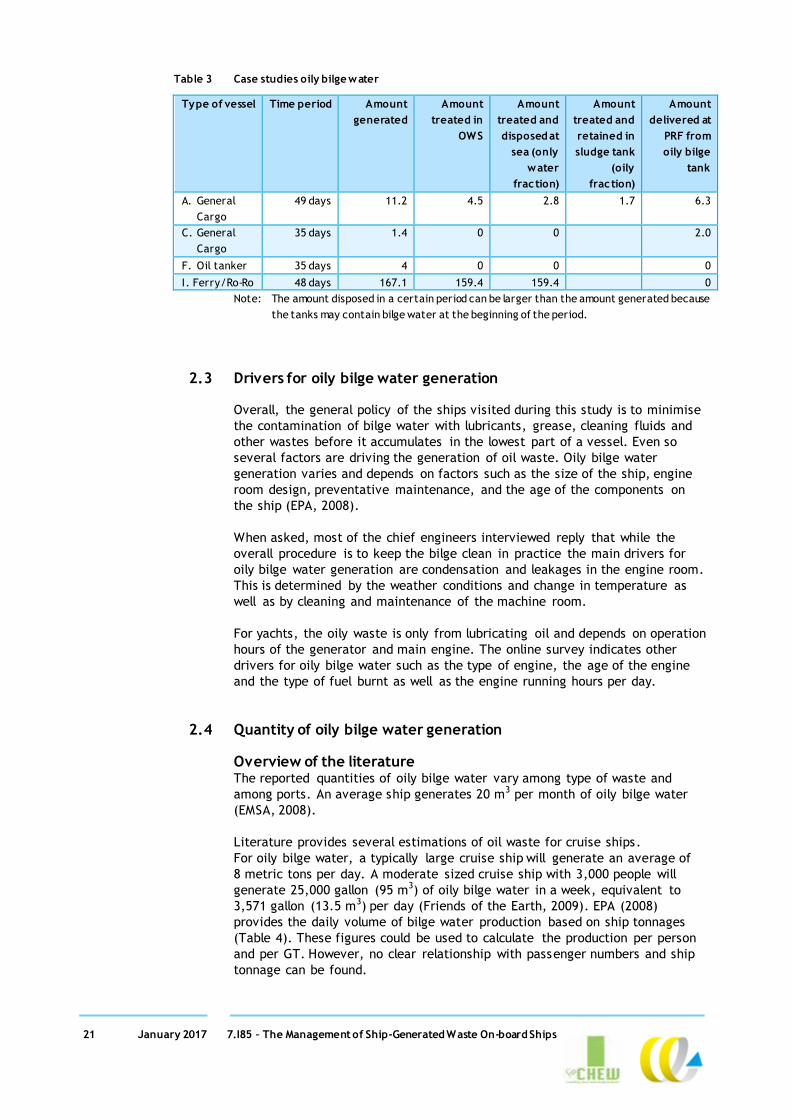
Table 3 Case studies oily bilge water
Type of vessel Time period Amount
generated
Amount
treated in
OWS
Amount
treated and
disposed at
sea (only
water
fraction)
Amount
treated and
retained in
sludge tank
(oily
fraction)
Amount
delivered at
PRF from
oily bilge
tank
A. General
Cargo
49 days 11.2 4.5 2.8 1.7 6.3
C. General
Cargo
35 days 1.4 0 0 2.0
F. Oil tanker 35 days 4 0 0 0
I. Ferry/Ro-Ro 48 days 167.1 159.4 159.4 0
Note: The amount disposed in a certain period can be larger than the amount generated because
the tanks may contain bilge water at the beginning of the period.
2.3 Drivers for oily bilge water generation
Overall, the general policy of the ships visited during this study is to minimise
the contamination of bilge water with lubricants, grease, cleaning fluids and
other wastes before it accumulates in the lowest part of a vessel. Even so
several factors are driving the generation of oil waste. Oily bilge water
generation varies and depends on factors such as the size of the ship, engine
room design, preventative maintenance, and the age of the components on
the ship (EPA, 2008).
When asked, most of the chief engineers interviewed reply that while the
overall procedure is to keep the bilge clean in practice the main drivers for
oily bilge water generation are condensation and leakages in the engine room.
This is determined by the weather conditions and change in temperature as
well as by cleaning and maintenance of the machine room.
For yachts, the oily waste is only from lubricating oil and depends on operation
hours of the generator and main engine. The online survey indicates other
drivers for oily bilge water such as the type of engine, the age of the engine
and the type of fuel burnt as well as the engine running hours per day.
2.4 Quantity of oily bilge water generation
Overview of the literature The reported quantities of oily bilge water vary among type of waste and
among ports. An average ship generates 20 m3 per month of oily bilge water
(EMSA, 2008).
Literature provides several estimations of oil waste for cruise ships.
For oily bilge water, a typically large cruise ship will generate an average of
8 metric tons per day. A moderate sized cruise ship with 3,000 people will
generate 25,000 gallon (95 m3) of oily bilge water in a week, equivalent to
3,571 gallon (13.5 m3) per day (Friends of the Earth, 2009). EPA (2008)
provides the daily volume of bilge water production based on ship tonnages
(Table 4). These figures could be used to calculate the production per person
and per GT. However, no clear relationship with passenger numbers and ship
tonnage can be found.
22 January 2017 7.I85 – The Management of Ship-Generated Waste On-board Ships
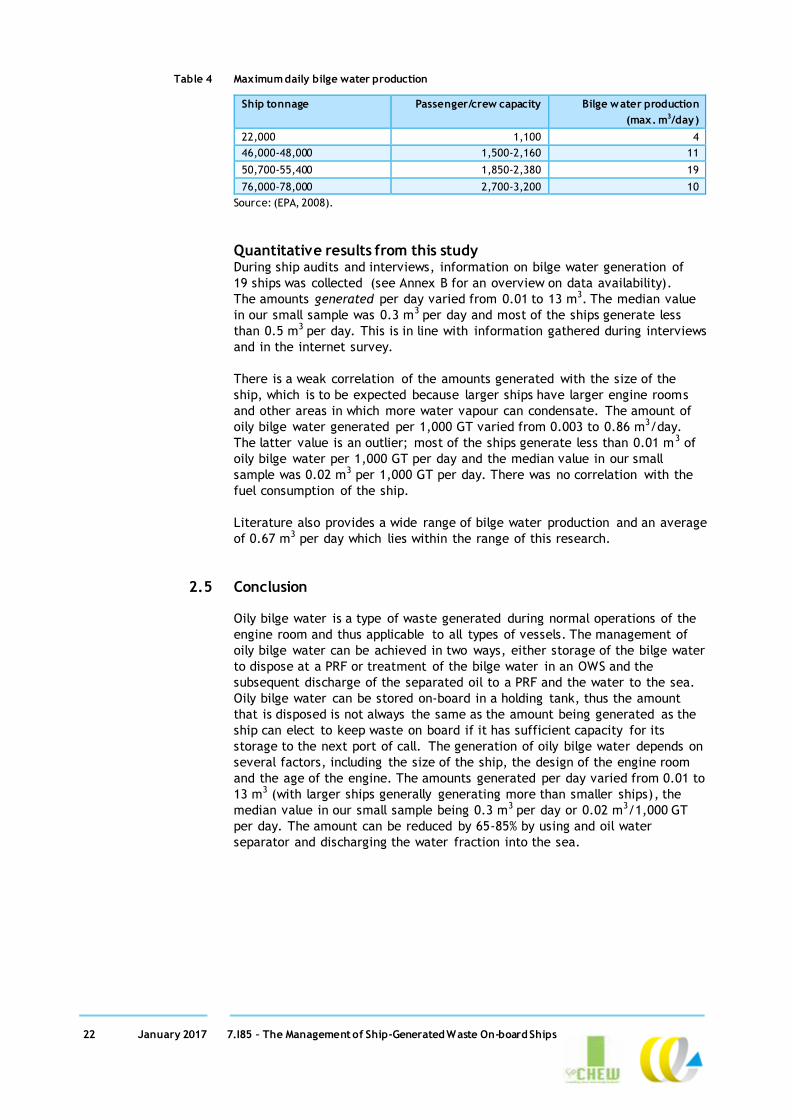
Table 4 Maximum daily bilge water production
Ship tonnage Passenger/crew capacity Bilge water production
(max. m3/day)
22,000 1,100 4
46,000-48,000 1,500-2,160 11
50,700-55,400 1,850-2,380 19
76,000-78,000 2,700-3,200 10
Source: (EPA, 2008).
Quantitative results from this study During ship audits and interviews, information on bilge water generation of
19 ships was collected (see Annex B for an overview on data availability).
The amounts generated per day varied from 0.01 to 13 m3. The median value
in our small sample was 0.3 m3 per day and most of the ships generate less
than 0.5 m3 per day. This is in line with information gathered during interviews
and in the internet survey.
There is a weak correlation of the amounts generated with the size of the
ship, which is to be expected because larger ships have larger engine rooms
and other areas in which more water vapour can condensate. The amount of
oily bilge water generated per 1,000 GT varied from 0.003 to 0.86 m3/day.
The latter value is an outlier; most of the ships generate less than 0.01 m3 of
oily bilge water per 1,000 GT per day and the median value in our small
sample was 0.02 m3 per 1,000 GT per day. There was no correlation with the
fuel consumption of the ship.
Literature also provides a wide range of bilge water production and an average
of 0.67 m3 per day which lies within the range of this research.
2.5 Conclusion
Oily bilge water is a type of waste generated during normal operations of the
engine room and thus applicable to all types of vessels. The management of
oily bilge water can be achieved in two ways, either storage of the bilge water
to dispose at a PRF or treatment of the bilge water in an OWS and the
subsequent discharge of the separated oil to a PRF and the water to the sea.
Oily bilge water can be stored on-board in a holding tank, thus the amount
that is disposed is not always the same as the amount being generated as the
ship can elect to keep waste on board if it has sufficient capacity for its
storage to the next port of call. The generation of oily bilge water depends on
several factors, including the size of the ship, the design of the engine room
and the age of the engine. The amounts generated per day varied from 0.01 to
13 m3 (with larger ships generally generating more than smaller ships), the
median value in our small sample being 0.3 m3 per day or 0.02 m3/1,000 GT
per day. The amount can be reduced by 65-85% by using and oil water
separator and discharging the water fraction into the sea.

23 January 2017 7.I85 – The Management of Ship-Generated Waste On-board Ships
3 Oily Residues (Sludge)
3.1 Introduction
Oil residue (sludge) is the waste from the purification of fuel or lubricating oil
or separated waste oil from oil water separators, oil filtering equipment or oil
collected in drip trays, and waste hydraulic and lubricating oils (IMO, 2008).
In addition to oil or fuel, sludge often contains water, tar, asphalts and other
contaminants (both soluble and insoluble matter).
Sludge is generally generated in a fuel or lube oil purifier, which centrifuges
the fuel to separate these impurities. This is done to prevent damage to
engine components, reduce wear and improve fuel combustion. At regular
intervals, the resulting sludge is drained. Fuel from leakages, tank cleanings
and, in some cases, the oil fraction from the oil/water separator is also
treated as sludge.
All vessels produce sludge, with the possible exception of vessels that run
exclusively on distillates (see, however, Section 3.3).
3.2 Oily residues management and technology
Oily residues can be managed on-board by retaining them in a tank and then
delivering them to PRF, or they can be treated on-board. The most frequently
used technology to treat oily sludge is an incinerator. Prior to incineration a
heating system (evaporator) is often used to evaporate the water fraction of
the sludge. In some cases, the evaporator is also used just to reduce the
amount of sludge.
An incinerator consists of a combustion chamber with a burner unit, a sludge
inlet and an electric control panel.
The standard specification for shipboard incinerators intended to incinerate garbage and other shipboard wastes generated during the ship's normal service
covers the design, manufacture, performance, operation and testing of incinerators up to 4,000 kW. The standard for type approval of incinerators has
recently been reviewed and renewed. See Resolution MEPC.244(66) (MEPC, 2014).
Figure 4 presents the waste flow diagram of sludge. Sludge is generally
collected in a sludge tank, a waste fuel tank, a waste oil tank or a lube oil or
fuel oil drain tank. It may then be transferred directly from the tank to a port
reception facility. In other cases, the quantity is reduced in an evaporator
which evaporates water from the sludge. It can also be incinerated on-board,
in which case the incinerator ashes are delivered to a PRF.
Many of the ships on which this study has gathered information do not treat
oily residues but dispose of them to a PRF. Some ships, especially smaller
ships, are not equipped with evaporators and incinerators. Additionally ships
that have this equipment do not always use them.

24 January 2017 7.I85 – The Management of Ship-Generated Waste On-board Ships
In most cases, the sludge is stored in a sludge tank before delivery to PRF in a
port. Sometimes, sludge and oily bilge water are stored in one tank before
delivery.
Figure 4 Waste flow diagram oily residues
An example of the waste flow on-board different ships is presented in Table 5
below. The first ship is a large bulk carrier that evaporates 50% of the sludge
and incinerates 50% and therefore none of the waste is disposed of as sludge
(incinerator ashes may be delivered to PRF but they are a different type of
waste) during a period of 96 days. This ship has a capacity for storing 43 m3 of
sludge and therefore the untreated sludge was kept on-board. The second ship
is a smaller general cargo ship which does not treat the oily sludge and only
delivers it to PRF. This ship delivers more than generated in this time period
which also indicates that oily sludge has been stored before (0.4 m3) as it had
sufficient storage capacity on board. This ship has a capacity of storing sludge
of 20 m3. The third ship does not treat oily sludge and only delivers this at the
PRF. This ship delivers less than is generated, indicating the rest is stored.
The storage capacity in the sludge tank is 33.1 m3.These examples show that
oily sludge can be managed in different ways.
Table 5 Case studies oily residues
Type of vessel Time period Amount
generated
Amount treated Amount
delivered at PRF
D. Dry bulk
carrier
(HFO/MGO)
96 days 25.2 m3 8.4 m3 0 m3
C. General
Cargo
(MGO)
35 days 1.6 m3 0 m3 2 m3
I. Ferry/Ro-Ro
(ULSF)
48 days 48.6 m3 0 m3 30 m3
PRF
Evaporator
Incinerator
- Sludge
tank- Waste fuel
tank
- LO/FO drain tank
Generation:
- Fuelpurifier
- Fuel and
lubeleakages
- Fuel tank cleanings
- O/W
separator
Sludge

25 January 2017 7.I85 – The Management of Ship-Generated Waste On-board Ships
3.3 Drivers for oily residues generation
The amount of oily residues generated depends on the type and the amount
of fuel consumed. Most interviewees indicate that as a rule of thumb, 1-3% of
heavy fuel oil is sludge. This has also been found by Maersk Line, who also
confirmed that fuel quality is a driver. In addition other drivers have been
presented including oily bilge water landed as sludge, increased waste oil
production due to machinery failure, leaks, cleaning operations and
maintenance jobs. Other technical factors could also affect sludge production
for example desludging intervals, back pressure setting on the purifiers,
running of a bilge water separator and operating efficiency of various purifiers
and filters.4 The same range applies to ultra-low sulphur fuel oils (fuels with a
sulphur content of 0.10% m/m or less that are sold with residual fuel
specifications).
We have observed significant differences in the amount of sludge from Marine
Gas Oil (MGO). While some ships claim not to produce sludge from MGO and do
not use purifiers, others do generate sludge when consuming MGO, although
slightly less than in the case of Heavy Fuel Oil (HFO). For ships that can use
both MGO and HFO, the price difference between this fuel is a driver for the
type of fuel consumption and thus for the generation of sludge.
The amount of sludge from lube oil depends on the type of lube oil and the
lube oil consumption. It is generally several orders of magnitude less than oil
residues from fuel. Through an automatic lubrication system it is possible to
decrease usage by 70% by choosing the exact dosage required for the
installation to achieve a sound performance. This enables installations to
achieve significant lubricant savings (Netherlands Maritime Technology, 2016).
The amount of fuel consumed is driven by the engine efficiency and the energy
demand of the vessel for e.g. propulsion and electric power. As a result of
market forces and regulation, the energy efficiency of ships is improving.
Market forces have for example resulted in slow steaming, weather routing,
et cetera, while the EEDI (Energy Efficiency Design Index) has resulted in an
improvement of the energy efficiency of new ships. Lower fuel consumption
will result in a lower production of sludge.
3.4 Quantity of oily residues generation
Overview of the literature A short overview of some quantity indications from literature and the
percentage of oily residues of fuel consumption is presented in Table 6.
Data from a selection of Maersk Line container vessels indicated that a range
of 21.4 to 71.2 m3/ of oily residues were produced in the period January to
June 2015 (Maersk Line, 2015)The corresponding percentage of fuel
consumption is between approximately 0.75% and 4.75%.
4 Maersk Line collected data on 19 vessels between January and June 2015. One vessel
produced less than 1% sludge and 2 vessels more than 3%. Maersk Line, 2015, Collected data
on garbage and sludge generation, Presentation to the ESSF subgroup on PRF.

26 January 2017 7.I85 – The Management of Ship-Generated Waste On-board Ships
Table 6 Overview of oily residue as percentage of fuel consumption
Type of ship Oil residue as a % of fuel consumption Source
Gas 1% of daily fuel consumption Afcan, 2006
Container ship 1% of daily fuel consumption Afcan, 2006
Cargo liner 1.1% of daily fuel consumption Afcan, 2006
Tanker 0.9% of daily fuel consumption Afcan, 2006
Cruise ships 1-2% of the heavy fuel oil EPA, 2008
General 1.0-1.5 % of the daily HFO fuel consumption
and 0.5 % of the daily MDO fuel
consumption
EMSA, 2015
Quantitative results from this study During ship audits and interviews, information on the oily residue generation
of 18 ships was collected. In some cases, fuel purifiers generate a fixed share
of sludge, e.g. 1 or 2% of the fuel or lube oil that is purified. In other cases,
fuel purifiers generated amounts dependent on the quality of the fuel.
The amounts generated per day varied from 0.003 to 11.3 m3. There was a
strong correlation with the amount of fuel consumed: most of the ships
generated 0.01 to 0.03 m3 of sludge per tonne of HFO and between 0 and
0.01 m3 per tonne of MGO, although many indicated during interviews that the
amount of sludge generated from MGO was negligible. One audited ship used
ultra-low sulphur fuel oils which was said to generate an amount of sludge
similar to HFO.
Half of the ships visited had an incinerator installed although this was not
always used, e.g. because the costs of heating up the tank are higher than the
costs of disposal. In several cases, sludge is heated up in a separated tank
before being incinerated to remove the water fraction through evaporation.
This can reduce the amount of sludge by up to 75%. Other ships have a
management policy to deliver the sludge to a PRF and not use incineration as a
disposal route.
Incineration of sludge, either with or without prior use of an evaporator,
reduces the volume of waste to 0.5% of the volume of sludge or less.
Again, the cost of incineration of sludge can outweigh the cost of disposing the
sludge at a port facility. The use of incinerators can be restricted if vessels are
trading in purely coastal areas. Moreover, not all incinerators are type-
approved to incinerate sludge.
3.5 Conclusion
Oily sludge is residual waste as a result of consuming fuel and is applicable to
all types of vessels. The treatment of oily sludge can be achieved through
evaporation and or incineration. Most of the sludge is stored and disposed
at a PRF without treatment. The generation of oily sludge water depends on
several factors, including the type and amount of fuel. Ships generate
between 0.01 to 0.03 m3 of sludge per tonne of HFO and between 0 and
0.01 m3 per tonne of MGO, although many do not generate sludge when using
MGO as a fuel. Ultra-low sulphur fuel oils generate an amount of sludge similar
to HFO.
Evaporation can reduce the amount of sludge by up to 75%, while incineration
of the remaining sludge reduces the amount by 99% or more.
27 January 2017 7.I85 – The Management of Ship-Generated Waste On-board Ships
4 Oily Tank Washings (Slops)
4.1 Introduction
Cargo tanks in oil tankers need to be cleaned before a new cargo is loaded
that is not compatible with the previous cargo or before dry-docking.
Generally, when lighter oil is loaded after a heavier one, the tank has to be
cleaned.
Tank cleaning may be carried our by spraying with crude oil (crude oil washing
or COW), with seawater or with fresh water and detergents. The former does
not generate waste because the residues are converted to useful cargo.
Oil tank washings (slops) are generated when oil cargo tanks are cleaned with
water. They are a mixture of oil, water and dispersants.
4.2 Oily tank washings management and technology
After cleaning their tanks, oil tankers store their washings in a slop or residual
tank. Figure 4 presents the waste flow diagram after oily tank washings.
After generation and if the voyage is long enough, the slops in the tank are
able to settle and the water fraction is discharged to sea in a controlled
manner, while the oily fraction is delivered to a PRF.
Under MARPOL Annex 1, regulation 34 provides the possibility for a controlled
discharge when a ship is on route, not in a special area and more than 50
nautical miles from shore. The water fraction can be discharged at a maximum
of 30 litres per nautical mile. When a ship has an oil discharge monitoring and
control system (ODMCS) and a slop tank no further requirements are needed
for discharging at sea. In contrast to bilge water discharges to sea no ppm
limits are required for discharge of settled slops and consequently oil water
separators are not generally used. The total quantity of oil discharged into the
sea may not exceed 1/30,000 of the total quantity of the cargo of which the
residue was formed for tankers built/delivered after 31 January 1979.
An ODMCS can consist essentially of following the systems (Marineinsight,
2016):
An Oil content meter: The oil content meter is used to analyse the content
of oil in the water that is to be discharged overboard. This oil is expressed
in parts per million (PPM).
A flow meter: The flow rate of the oily water to be discharged is measured
at the discharge pipe.
A computing unit: A computing unit calculates the oil discharge in
litres/nautical miles and the total quantity, along with date and time
identification.
An overboard valve control system: The auto control valve is installed at
the overboard so that it must close and stop the discharge when
permissible limit has been reached.
In other cases, e.g. when the voyage is not long enough for the slops to settle,
the contents of the storage tank is delivered to PRF without separating oil and
water fractions.
28 January 2017 7.I85 – The Management of Ship-Generated Waste On-board Ships
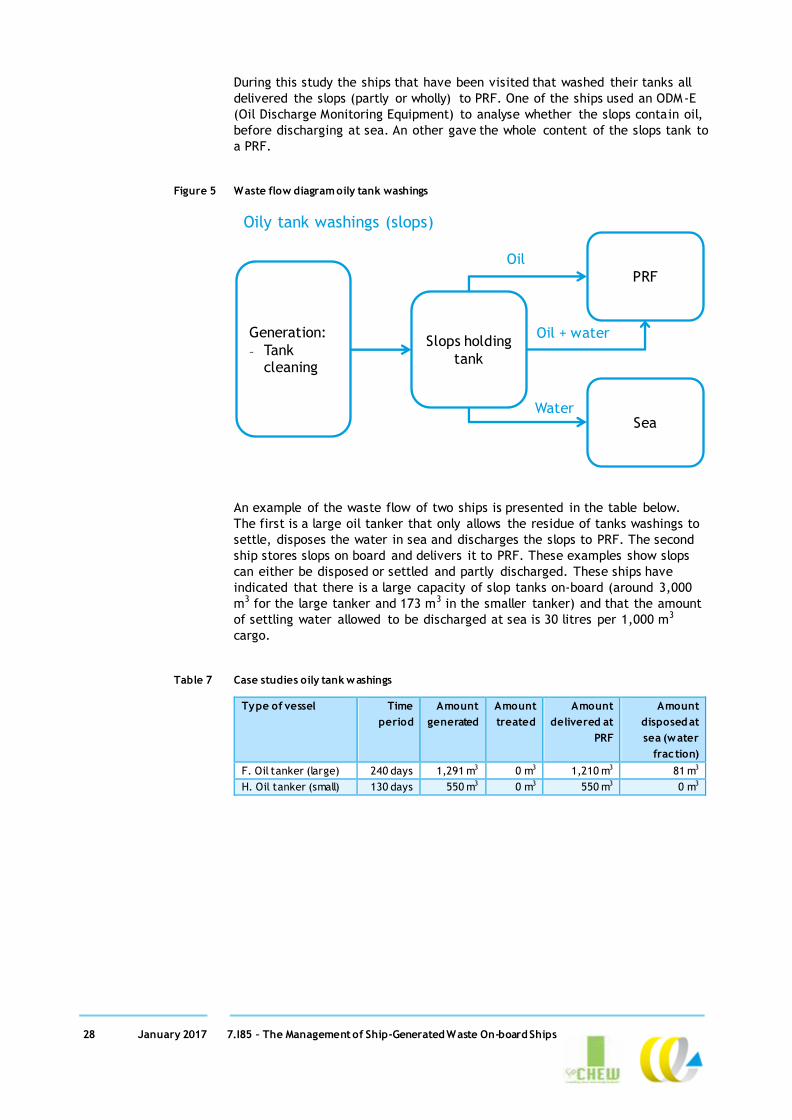
During this study the ships that have been visited that washed their tanks all
delivered the slops (partly or wholly) to PRF. One of the ships used an ODM-E
(Oil Discharge Monitoring Equipment) to analyse whether the slops contain oil,
before discharging at sea. An other gave the whole content of the slops tank to
a PRF.
Figure 5 Waste flow diagram oily tank washings
An example of the waste flow of two ships is presented in the table below.
The first is a large oil tanker that only allows the residue of tanks washings to
settle, disposes the water in sea and discharges the slops to PRF. The second
ship stores slops on board and delivers it to PRF. These examples show slops
can either be disposed or settled and partly discharged. These ships have
indicated that there is a large capacity of slop tanks on-board (around 3,000
m3 for the large tanker and 173 m3 in the smaller tanker) and that the amount
of settling water allowed to be discharged at sea is 30 litres per 1,000 m3
cargo.
Table 7 Case studies oily tank washings
Type of vessel Time
period
Amount
generated
Amount
treated
Amount
delivered at
PRF
Amount
disposed at
sea (water
fraction)
F. Oil tanker (large) 240 days 1,291 m3 0 m3 1,210 m3 81 m3
H. Oil tanker (small) 130 days 550 m3 0 m3 550 m3 0 m3
PRF
Sea
Slops holding
tank
Generation:
- Tank cleaning
Oil
Water
Oily tank washings (slops)
Oil + water

29 January 2017 7.I85 – The Management of Ship-Generated Waste On-board Ships
4.3 Drivers for oily tank washings generation
The driver of this type of waste is the number of oil tank cleanings and the
type of fuel carried.
The volumes of waste depend on the type of cargo and are related to the
efficiency of water/oil decanting separation and available areas to discharge
the water in sailing route.
4.4 Quantity of oily tank washings
Quantitative results from this study During ship audits and interviews, information on oily tank washings from
4 ships was collected. The amounts generated per tank washing ranged from
60 to 500 m3 when all the tanks on a ship were washed Relative to the size of
the tanks, slops can be up to 2% of loading capacity.
4.5 Conclusion
Oil tank washing only occur on oil tankers. They are generally stored in a
settling tank after which the water is discharged at sea and the oil is delivered
to PRF. Some technologies are available to reduce and monitor slops, although
in practice it is often settled and delivered at the port.
The amount of slops generated depends on several factors, including the
number of tank cleanings and the size of the tanks. The amount can range
from 60 to 500 m3 for a ship and up to 2% of the loading capacity per tank.

30 January 2017 7.I85 – The Management of Ship-Generated Waste On-board Ships
5 Sewage
5.1 Introduction
Sewage is defined as drainage and other wastes from any form of toilets and
urinals; drainage from medical premises (dispensary, sick bay, etc.) via wash
basins, wash tubs and scuppers located in such premises; drainage from spaces
containing living animals; or other waste waters when mixed with the
drainages defined above (IMO, 2006b). This is generally referred to as ‘black
water’. It does not include grey water which is the drainage generated from
dishwasher, showers, laundry, bath and washbasin drains (MEPC, 2012).
The discharge of sewage into the sea is prohibited under MARPOL IV, except
when the ship has in operation an approved sewage treatment plant or when
the ship is discharging comminuted and disinfected sewage using an approved
system at a distance of more than three nautical miles from the nearest land.
Sewage which is not comminuted or disinfected may be discharged at a
distance of more than 12 nautical miles from the nearest land.
Within the Baltic Sea, a special area under MARPOL Annex IV, discharge of
sewage from passenger ships is only permitted the ship has in operation an
approved sewage treatment plant which meets specific nitrogen and
phosphorus removal standards and which has been certified by the
Administration.
5.2 Sewage management and technology
A holding tank is usually the minimum system that a ship has on-board.
The size of the tank should take into account the capacity for the retention of
all sewage, the operation of the ship, the number of persons on-board and
other relevant factors. The holding tank shall have a means to indicate visually
the amount of its contents.
A ship using an approved a sewage comminuting and disinfecting system shall
be fitted with facilities for the temporary storage of sewage when the ship is
less than 3 nautical miles from the nearest land. This type of on-board
treatment system uses a physical/chemical-based system that relies on
reducing the size of sewage and chlorination.
There are several types of approved sewage treatment plants. The most
common is an on-board treatment system that uses biological or aerobic
digestion based system (thus a mix of primary and secondary treatment),
which consists of three compartments. The first chamber is similar to
conventional septic tanks, where solids settle to the bottom and scum floats to
the top. In the second compartment, the aeration chamber, the partially
clarified wastewater is mixed with air to assist bacteria to further break down
solids. In the third compartment further settling of solids and final chlorination
for disinfection is added.

31 January 2017 7.I85 – The Management of Ship-Generated Waste On-board Ships
Most ships visited during this study had one or a combination of the systems
described above. However, in one case a ship did not have a holding tank and
the sewage was discharged immediately after treatment in the sewage
treatment plant.
Figure 6 presents the waste flow diagram of sewage. Sewage can be either
collected in a holding tank, comminuted and disinfected, or treated in a
sewage treatment plant. The effluent of the sewage treatment plant is either
discharged directly to the sea or kept in a holding tank. Ships that do not have
a sewage treatment plant collect the black water in a holding tank.
The holding tank can also be used to collect grey water and/or galley water.
However, grey water is not always routed to the holding tank and sometimes
stored in dedicated holding tanks. Grey water can sometimes be discharged
directly into the sea or mixed with sewage to be treated. It can also be
recycled into the toilet flushing system.
Roughly a quarter of cruise ships have Advanced Wastewater Treatment
System (AWTS) installed which mix and treat grey and black water producing a
bio-residual or sewage sludge that needs to be retained for discharge ashore
(HELCOM, 2013). In cruise ships it is common to have a separated tank for
galley water, which is discharged in accordance with the regulations for food
waste. For cruise ships it is common to comminute, mix and disinfect the
water prior to discharge to the sea.
The ship audits show that most of the ships have a treatment plant on-board
and only a few disinfect the sewage. These are predominately smaller and
older vessels. Most of the time, the treated effluent is discharged in the open
sea.
Figure 6 Waste flow diagram sewage
Sea
Grey water
Galley water
Holding tank
Sewage
treatment plant
Generation:
- Toilet use
Sewage
PRF
Comminute
and disinfect

32 January 2017 7.I85 – The Management of Ship-Generated Waste On-board Ships
An example from the ship audits is presented in Table 8. The first is a
chemical tanker with a crew of 24 people. On this ship sewage is being
disinfected and treated in a type approved sewage treatment plant.
If the ship is in the port, all of the generated effluent is delivered to PRF in
the port and on the route all is continuously discharged at sea as this ship
does not have a holding tank. The second ship is a ferry that has a crew of
152 people and 1,360 passengers. On this ship sewage is treated in a type
approved sewage treatment plant (only 37 m3 in this case, the remainder is
grey water). The third ship also treats the sewage in a treatment plant and
discharges directly after treatment and disinfection. These examples show the
different ways of managing sewage effluent and the difference between types
of vessels.
Table 8 Case studies sewage
Type of vessel Time
period
Amount
generated
Amount
treated
Amount
delivered at
PRF
Amount
disposed at
sea
E. Chemical tanker Daily 3-4 m3 1 m3 All during stay Continuous
disposal on
route
I. Ferry/Ro-Ro Monthly 1,900 m3 37 m3 0 m3 1,900 m3
D. Dry bulk carrier Daily 3 m3 3 m3 0 m3 3 m3
5.3 Drivers for sewage generation
The main drivers for the amount of sewage are:
the number of crew members and passengers;
the type of toilets: water toilets produce larger amounts of sewage than
vacuum toilets;
length of voyage;
type of treatment: the presence of a sewage treatment plant, or
comminuting and disinfection system provides different quantities of
waste.
5.4 Quantity of sewage generation
Overview of the literature The generation and collection of sewage has also been reported by several
ports in their waste management plan. The port of Dudinka (Russia) has
estimated an annual waste volume of both bilge waters and sewage to be
352.8 m3 for 110 calls at the port (MMPA, 2012). The port of Durres (Albania)
estimated a generation of 4,354.9 m3 grey & black water in 2012 (TEN
ECOPORT, 2014). The port of Tallinn (Estonia) received in 2014 a total of
11,211 m3 of sewage based on 7,624 ships (Environmental Board, 2015).
The port of Igoumenitsa (Greece) reports for passenger vessels in 2011 a total
quantity of sewage of 6.3 m3 (Beza, et al., 2014). The quantity of sewage
waste from in 2010 for over 26 EU ports was reported to be approx.
1,250,000 m3 (Ramboll, 2012).
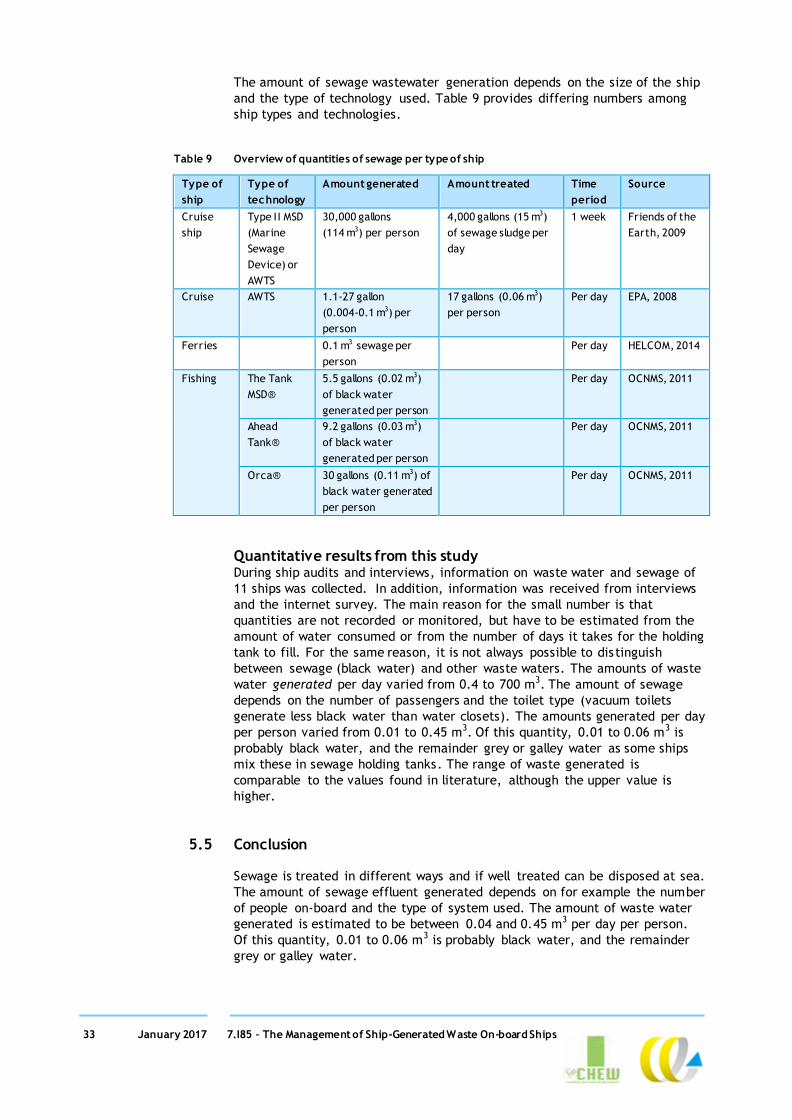
33 January 2017 7.I85 – The Management of Ship-Generated Waste On-board Ships
The amount of sewage wastewater generation depends on the size of the ship
and the type of technology used. Table 9 provides differing numbers among
ship types and technologies.
Table 9 Overview of quantities of sewage per type of ship
Type of
ship
Type of
technology
Amount generated Amount treated Time
period
Source
Cruise
ship
Type II MSD
(Marine
Sewage
Device) or
AWTS
30,000 gallons
(114 m3) per person
4,000 gallons (15 m3)
of sewage sludge per
day
1 week Friends of the
Earth, 2009
Cruise AWTS 1.1-27 gallon
(0.004-0.1 m3) per
person
17 gallons (0.06 m3)
per person
Per day EPA, 2008
Ferries 0.1 m3 sewage per
person
Per day HELCOM, 2014
Fishing The Tank
MSD®
5.5 gallons (0.02 m3)
of black water
generated per person
Per day OCNMS, 2011
Ahead
Tank®
9.2 gallons (0.03 m3)
of black water
generated per person
Per day OCNMS, 2011
Orca® 30 gallons (0.11 m3) of
black water generated
per person
Per day OCNMS, 2011
Quantitative results from this study During ship audits and interviews, information on waste water and sewage of
11 ships was collected. In addition, information was received from interviews
and the internet survey. The main reason for the small number is that
quantities are not recorded or monitored, but have to be estimated from the
amount of water consumed or from the number of days it takes for the holding
tank to fill. For the same reason, it is not always possible to distinguish
between sewage (black water) and other waste waters. The amounts of waste
water generated per day varied from 0.4 to 700 m3. The amount of sewage
depends on the number of passengers and the toilet type (vacuum toilets
generate less black water than water closets). The amounts generated per day
per person varied from 0.01 to 0.45 m3. Of this quantity, 0.01 to 0.06 m3 is
probably black water, and the remainder grey or galley water as some ships
mix these in sewage holding tanks. The range of waste generated is
comparable to the values found in literature, although the upper value is
higher.
5.5 Conclusion
Sewage is treated in different ways and if well treated can be disposed at sea.
The amount of sewage effluent generated depends on for example the number
of people on-board and the type of system used. The amount of waste water
generated is estimated to be between 0.04 and 0.45 m3 per day per person.
Of this quantity, 0.01 to 0.06 m3 is probably black water, and the remainder
grey or galley water.
34 January 2017 7.I85 – The Management of Ship-Generated Waste On-board Ships
6 Plastics
6.1 Introduction
Plastic waste can be generated in all types of vessels and often originates from
domestic provisions and supplies used for operations on board the ship.
Plastic waste typically comprises sheets, wrapping, bottles, drums, synthetic
ropes, synthetic fishing nets, plastic garbage bags and empty chemical cans.
In some cases ships and waste handlers distinguish plastics that have been in
contact with food (‘contaminated’ or ‘dirty’) and ‘clean’ plastics. The two are kept separate for hygienic reasons and because dirty plastics (and
other food waste) may contain pathogens and may need to be disposed differently by the port.
6.2 Plastic management and technology
There are two ways to manage plastics on-board, either they are kept
separately (compacted or otherwise) and delivered to PRF or they can be
incinerated, the ashes being treated as incinerator ashes. Incineration is
constrained by MARPOL VI, Regulation 16 which prohibits shipboard
incineration of polyvinyl chlorides (PVC) except in a shipboard incinerator for
which an IMO Type Approval Certificates has been issued in accordance with
MEPC.244(66) (MEPC, 2014) (see also Chapter 10). Incineration of plastics with
PCBs is always prohibited.
The ship audits and interviews have shown that the ship crew often doesn’t
have expertise to assess the type of plastic they are handling, and therefore
chose not to incinerate plastics at all. If plastics are incinerated without
knowledge of the type of plastics, the ashes may be liable to laboratory
analysis before delivery is permitted and the costs of delivery and subsequent
disposal will rise. The ships audited in this study that had an on-board
incinerator, did therefore not incinerate plastic.
Consequently, the basic handling method for plastic on-board the vessels
included in this study was to keep it separately (in combination with
minimization) until it can be delivered to PRF. For the prevention of the
amount of plastic waste produced by drinking bottles, desalination by Reverse
Osmosis (RO) has proven to be a reliable and economical means of drinking
water production on ships. This could prevent the amount of plastic waste
from drinking bottles5.
5 More information on the cost analysis and technology can be found in for example:
Guler et al. 2015 (COST ANALYSIS OF SEAWATER DESALINATION USING AN INTEGRATED
REVERSE OSMOSIS SYSTEM ON A CRUISE SHIP) and Abdella 1994 (Reverse Osmosis
Desalination).

35 January 2017 7.I85 – The Management of Ship-Generated Waste On-board Ships
Ships with large amounts of plastics, such as cruise ships can use a crusher or
compactor to minimize the volume of the waste, since the delivery to PRF is
often based on the volume. Other cargo ships often crush these containers by
hand to minimize their volume.
Figure 7 presents the waste flow diagram of plastic waste. Plastics are often
generated by hoteling and cargo handling. Plastics are collected in bags or
bins. Sometimes clean and dirty plastics are collected separately, especially
when they are to be delivered to different PRF. They can be incinerated when
the ship incinerator is certified for this use. Even though most garbage
management plans aim for prevention of plastic waste when provisions are
taken in, it is often not realized because of practical reasons, e.g. because
plastics are part of the supplies and supplies are unpacked well after delivery
so the plastics cannot be returned to the supplier.
Figure 7 Waste flow diagram plastic waste
Four examples from the ship audits are presented in Table 10. The first is a
general cargo ship that incinerates a share of the plastic waste (about 50%).
The second ship is a chemical tanker that does not treat but only stores plastic
waste. The waste is delivered to PRF in European ports as other ports are
expensive or PRFs are not available. The third ship has a compactor and
delivers the plastic waste to PRF. An incinerator is not used as it is not known
which plastic can be burnt. Sometimes the volume of plastic waste is large
because there is no time to compact it. The fourth ship does not treat the
waste, but collects the recyclable plastic separately and delivers this to
recycling companies on shore. These examples show the different ways of
managing and the factors influencing the place of disposal.
Table 10 Case studies plastics
Type of vessel Time period Amount
generated
Amount
inc inerated
Amount
delivered at
PRF
A. General
cargo
90 days 8.1 m3 4 m3 4.1 m3
E. Chemical
tanker
70 days 13.54 m3 0 m3 13.5 m3
G. Bulk carrier 130 days 18.24 m3 0 m3 18.24 m3
I. Ferry/Ro-Ro 60 days 43.5 m3 0 m3 43.5 m3
Bag/bin
- Clean and dirty sometimes
separate
Generation:
- Provisions- Cargo
handling
Plastics
Incinerator PRF
36 January 2017 7.I85 – The Management of Ship-Generated Waste On-board Ships
6.3 Drivers for plastics generation
The generation of garbage, including plastics, on ships depends on several
factors. The amount of hoteling waste is based on the number of passengers
and crew, and consumption of material and is proportional to the standard of
living (EPA, 2008). In practice, provisions, packaging and galley waste mainly
drive the generation of plastics. Plastic waste from cargo handling is limited to
general cargo and depends entirely on the type and packaging of the cargo.
In addition, waste reduction before loading can affect the amount of plastic
waste generation on-board, for example of plastic packaging is removed
before loaded on-board.
The online survey indicates that the generation of plastic depends on several
factors such as the trading area, supplier, policy of the companies buying and
selling provisions and supplies, and the goods delivered to the ship.
6.4 Quantity of plastics generation
Overview of the literature There is very little information available at the current time on the actual
volumes of plastic waste generated on ships and often this is provided as
figures for garbage or solid waste. According to the literature each person
generates 1 kg of solid waste daily and other sources provide an estimation
of 3 kg/day per crew member (Beza, et al., 2014). Solid waste related to
maintenance is 11 kg/vessel-day for all ships (NEA; PM Group, 2009).
These estimations are not for plastic waste specifically but provide a range of
0.06 to 0.2 m3 per person per day and 0.7 per day6 (Cantin, et al., 1999)
Quantitative results from this study During ship audits and interviews, information on plastic waste of 14 ships was
collected. The amounts generated per day varied from 0.001 to 8.2 m3.
The amounts per crew member day varied from 0.001 to 0.016 m3.
We consider the latter value an outlier due to rounding of the quantity of
waste in the garbage record book. Most of the observations are between 0.001
and 0.008 m3 per crew member per day, with an average of 0.006 m3 per crew
member per day. In interviews and in the online surveys, quantities of up to
0.025 m3 per person per day were suggested. This is only possible if large
amounts of operational wastes are plastics.
The range of waste per person per day is comparable with the literature values
for solid waste, although with a smaller lower limit.
6 Assuming a density of 16 kg/m3 taken from: (Cantin, et al., 1999)

37 January 2017 7.I85 – The Management of Ship-Generated Waste On-board Ships
6.5 Conclusion
Plastic waste is mostly generated from packaging and is often stored and
delivered to PRF. It is possible to compact and incinerate plastic although this
is not often done in practice. The generation of plastic waste depends on
several factors including the number of people on-board, as well as the type of
cargo. It can also depend on the policy and operational practices of suppliers.
Most ships generate between 0.001 and 0.008 m3 of plastics per person per
day, although in a few cases quantities up to 0.025 m3 per person per day have
been reported.
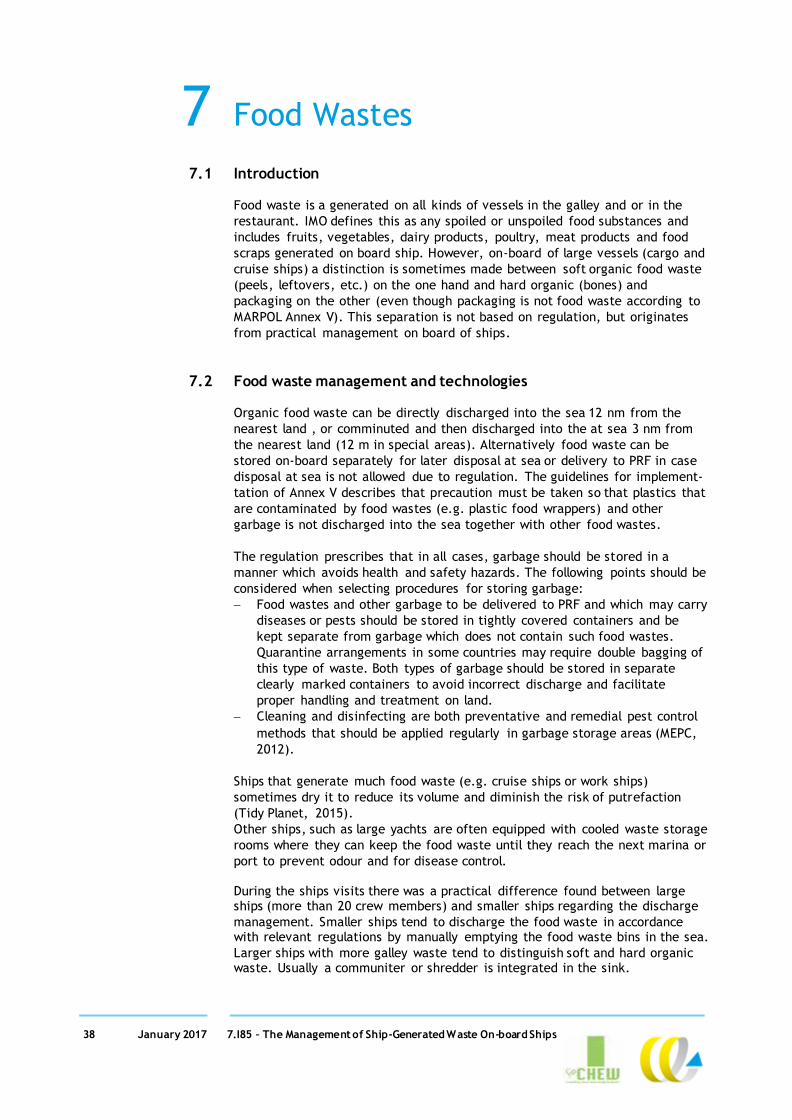
38 January 2017 7.I85 – The Management of Ship-Generated Waste On-board Ships
7 Food Wastes
7.1 Introduction
Food waste is a generated on all kinds of vessels in the galley and or in the
restaurant. IMO defines this as any spoiled or unspoiled food substances and
includes fruits, vegetables, dairy products, poultry, meat products and food
scraps generated on board ship. However, on-board of large vessels (cargo and
cruise ships) a distinction is sometimes made between soft organic food waste
(peels, leftovers, etc.) on the one hand and hard organic (bones) and
packaging on the other (even though packaging is not food waste according to
MARPOL Annex V). This separation is not based on regulation, but originates
from practical management on board of ships.
7.2 Food waste management and technologies
Organic food waste can be directly discharged into the sea 12 nm from the
nearest land , or comminuted and then discharged into the at sea 3 nm from
the nearest land (12 m in special areas). Alternatively food waste can be
stored on-board separately for later disposal at sea or delivery to PRF in case
disposal at sea is not allowed due to regulation. The guidelines for implement-
tation of Annex V describes that precaution must be taken so that plastics that
are contaminated by food wastes (e.g. plastic food wrappers) and other
garbage is not discharged into the sea together with other food wastes.
The regulation prescribes that in all cases, garbage should be stored in a
manner which avoids health and safety hazards. The following points should be
considered when selecting procedures for storing garbage:
Food wastes and other garbage to be delivered to PRF and which may carry
diseases or pests should be stored in tightly covered containers and be
kept separate from garbage which does not contain such food wastes.
Quarantine arrangements in some countries may require double bagging of
this type of waste. Both types of garbage should be stored in separate
clearly marked containers to avoid incorrect discharge and facilitate
proper handling and treatment on land.
Cleaning and disinfecting are both preventative and remedial pest control
methods that should be applied regularly in garbage storage areas (MEPC,
2012).
Ships that generate much food waste (e.g. cruise ships or work ships)
sometimes dry it to reduce its volume and diminish the risk of putrefaction
(Tidy Planet, 2015).
Other ships, such as large yachts are often equipped with cooled waste storage
rooms where they can keep the food waste until they reach the next marina or
port to prevent odour and for disease control. During the ships visits there was a practical difference found between large ships (more than 20 crew members) and smaller ships regarding the discharge
management. Smaller ships tend to discharge the food waste in accordance with relevant regulations by manually emptying the food waste bins in the sea.
Larger ships with more galley waste tend to distinguish soft and hard organic waste. Usually a communiter or shredder is integrated in the sink.

39 January 2017 7.I85 – The Management of Ship-Generated Waste On-board Ships
The food waste (soft parts) are comminuted or shredded while adding fresh water and flushed through the piping system to a galley tank or a greywater
sewage tank until it can be disposed at sea.
Hard organic waste, waste from plates and packages are collected in bags and bins and disposed at port reception facilities (see also (Mohammed, et al., 1998); (EPA, 2008)). In some cases this is delivered under category of domestic
waste instead of food waste. No difference was found between cruise ships and normal cargo ships regarding the food waste management. The exception
is that cruise ships tend to have a galley waste tank, which is discharged following the same regulation as food waste and/or as grey water.
The survey showed that in some passenger ships, the food waste is sometimes
dried and incinerated. However, we have not come across this in the ship
audits or interviews undertaken in this study.
The ships included in this study often passed the food waste through a grinder
or shredded the food waste on-board and discharged it to the sea where
permitted. Other ships included in the study collected their food waste in bins
and delivered it to PRF.
Figure 8 presents the waste flow diagram for food waste.
Figure 8 Waste flow diagram food waste
An example from four ships audited is presented in Table 11. The first ship is a
passenger ship that grinds the food waste and disposes part of the generated
waste to sea (about 2%) and disposes the rest to PRF (98%) On this ship, food
waste is often disposed at sea with galley water. The second ship is a bulk
carrier that does not treat the food waste and only disposes in open sea (about
40%) or delivers it to PRF (about 60%). The third ship comminutes the food
waste and stores the waste in separate bins. Half of the waste is disposed at
sea while the other half is delivered to PRF. The fourth ship uses a shredder,
although it is usually disposes waste at sea beyond the 12 nm limit which
means no treatment is required. These examples show that different types of
ship manage food waste in different ways and that they generate different
volumes.
Soft organic
Generation:
- Galley- Mess
Food waste Comminuter
PRF
Hard organic
andpackaging
or
all food waste
Bags or bins
Sea
Sewage tank
Galley tank
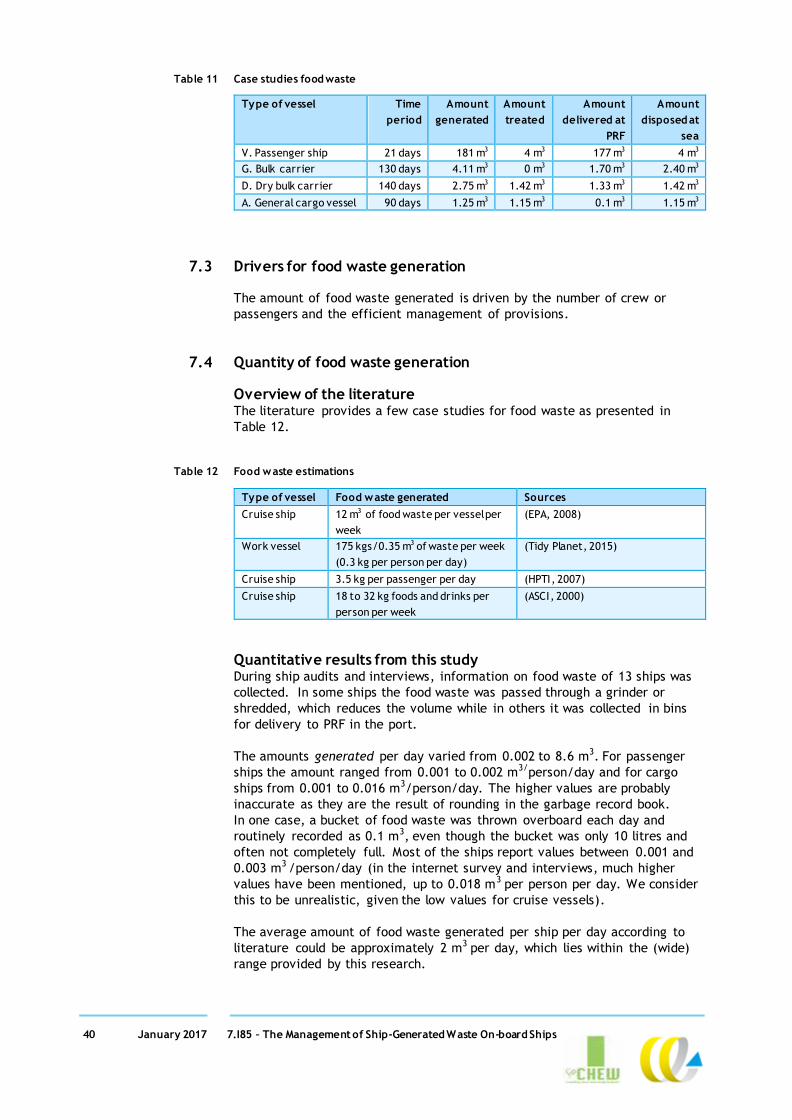
40 January 2017 7.I85 – The Management of Ship-Generated Waste On-board Ships
Table 11 Case studies food waste
Type of vessel Time
period
Amount
generated
Amount
treated
Amount
delivered at
PRF
Amount
disposed at
sea
V. Passenger ship 21 days 181 m3 4 m3 177 m3 4 m3
G. Bulk carrier 130 days 4.11 m3 0 m3 1.70 m3 2.40 m3
D. Dry bulk carrier 140 days 2.75 m3 1.42 m3 1.33 m3 1.42 m3
A. General cargo vessel 90 days 1.25 m3 1.15 m3 0.1 m3 1.15 m3
7.3 Drivers for food waste generation
The amount of food waste generated is driven by the number of crew or
passengers and the efficient management of provisions.
7.4 Quantity of food waste generation
Overview of the literature The literature provides a few case studies for food waste as presented in
Table 12.
Table 12 Food waste estimations
Type of vessel Food waste generated Sources
Cruise ship 12 m3 of food waste per vessel per
week
(EPA, 2008)
Work vessel 175 kgs/0.35 m3 of waste per week
(0.3 kg per person per day)
(Tidy Planet, 2015)
Cruise ship 3.5 kg per passenger per day (HPTI, 2007)
Cruise ship 18 to 32 kg foods and drinks per
person per week
(ASCI, 2000)
Quantitative results from this study During ship audits and interviews, information on food waste of 13 ships was
collected. In some ships the food waste was passed through a grinder or
shredded, which reduces the volume while in others it was collected in bins
for delivery to PRF in the port.
The amounts generated per day varied from 0.002 to 8.6 m3. For passenger
ships the amount ranged from 0.001 to 0.002 m3/person/day and for cargo
ships from 0.001 to 0.016 m3/person/day. The higher values are probably
inaccurate as they are the result of rounding in the garbage record book.
In one case, a bucket of food waste was thrown overboard each day and
routinely recorded as 0.1 m3, even though the bucket was only 10 litres and
often not completely full. Most of the ships report values between 0.001 and
0.003 m3 /person/day (in the internet survey and interviews, much higher
values have been mentioned, up to 0.018 m3 per person per day. We consider
this to be unrealistic, given the low values for cruise vessels).
The average amount of food waste generated per ship per day according to
literature could be approximately 2 m3 per day, which lies within the (wide)
range provided by this research.
41 January 2017 7.I85 – The Management of Ship-Generated Waste On-board Ships
7.5 Conclusion
Food waste can be managed in different ways, either by being comminuted,
shredded or passed though a grinder and afterwards disposed at sea or by
being collected in bins and delivered to PRF. This depends on the policy of the
ship and the generation of waste depends on other factors such as the amount
of crew and passengers on-board and storage of food waste on-board. The ship
audits show that the amounts of food waste generated varied from 0.001 to
0.003 m3 per person per day.

42 January 2017 7.I85 – The Management of Ship-Generated Waste On-board Ships
8 Domestic Wastes
8.1 Introduction
Domestic waste is all waste from domestic spaces on-board of the ship that is
not food waste, cooking oil or plastic. IMO defines this as “all types of waste
not covered by other Annexes that are generated in the accommodation spaces
on board the ship. Domestic wastes does not include grey water” Domestic
waste therefore typically comprises paper, cardboard, fluorescent lamps,
synthetic material, foils, metal cans, lids, glass, pantry packaging waste
et cetera. Domestic waste is generated on-board as a consequence of crew
and passenger hoteling and is generated on all types of vessels.
8.2 Domestic waste management and technology
Treatment of domestic waste differs depending on what types are generated
and the amount of waste generated. The following treatments were found
during this study: glass crusher, compactor for several types of waste such as
cans and tins, and incineration of paper and cardboard. Incineration of paper
and cardboard occurs on most ships that have an incinerator (cargo and
passenger). Waste minimisation measures are mostly found in cruise ships to
reduce the amounts generated in the domestic areas.
Figure 9 presents the waste flow diagram for domestic waste. After collection,
domestic waste is sometimes compacted or crushed and stored in bags or bins.
Several ships that were visited collected paper and cardboard, fluorescent
lamps, metals and glass separately. Sometimes, these are delivered to PRF,
however, sometimes paper and cardboard is incinerated and then the ashes
are delivered to PRF.
Most of the ships included in this study stored their domestic waste and
delivered it to PRF. Some used a compactor or incineration, especially for
certain types of waste such as cardboards and paper.
Figure 9 Waste flow diagram domestic waste
IncinerationBags/binsCompacting/
crushing
Generation:
- Hotelling
Domestic waste
PRF
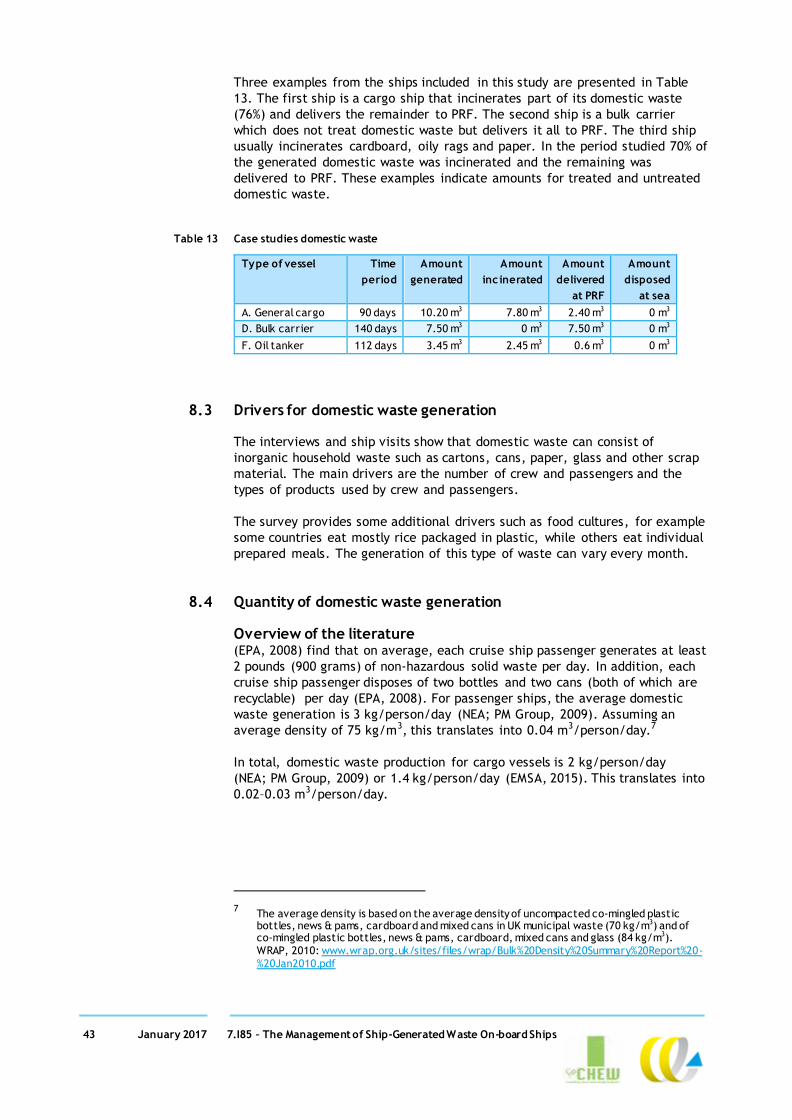
43 January 2017 7.I85 – The Management of Ship-Generated Waste On-board Ships
Three examples from the ships included in this study are presented in Table
13. The first ship is a cargo ship that incinerates part of its domestic waste
(76%) and delivers the remainder to PRF. The second ship is a bulk carrier
which does not treat domestic waste but delivers it all to PRF. The third ship
usually incinerates cardboard, oily rags and paper. In the period studied 70% of
the generated domestic waste was incinerated and the remaining was
delivered to PRF. These examples indicate amounts for treated and untreated
domestic waste.
Table 13 Case studies domestic waste
Type of vessel Time
period
Amount
generated
Amount
inc inerated
Amount
delivered
at PRF
Amount
disposed
at sea
A. General cargo 90 days 10.20 m3 7.80 m3 2.40 m3 0 m3
D. Bulk carrier 140 days 7.50 m3 0 m3 7.50 m3 0 m3
F. Oil tanker 112 days 3.45 m3 2.45 m3 0.6 m3 0 m3
8.3 Drivers for domestic waste generation
The interviews and ship visits show that domestic waste can consist of
inorganic household waste such as cartons, cans, paper, glass and other scrap
material. The main drivers are the number of crew and passengers and the
types of products used by crew and passengers.
The survey provides some additional drivers such as food cultures, for example
some countries eat mostly rice packaged in plastic, while others eat individual
prepared meals. The generation of this type of waste can vary every month.
8.4 Quantity of domestic waste generation
Overview of the literature (EPA, 2008) find that on average, each cruise ship passenger generates at least
2 pounds (900 grams) of non-hazardous solid waste per day. In addition, each
cruise ship passenger disposes of two bottles and two cans (both of which are
recyclable) per day (EPA, 2008). For passenger ships, the average domestic
waste generation is 3 kg/person/day (NEA; PM Group, 2009). Assuming an
average density of 75 kg/m3, this translates into 0.04 m3/person/day.7
In total, domestic waste production for cargo vessels is 2 kg/person/day
(NEA; PM Group, 2009) or 1.4 kg/person/day (EMSA, 2015). This translates into
0.02–0.03 m3/person/day.
7 The average density is based on the average density of uncompacted co-mingled plastic
bottles, news & pams, cardboard and mixed cans in UK municipal waste (70 kg/m3) and of co-mingled plastic bottles, news & pams, cardboard, mixed cans and glass (84 kg/m3).
WRAP, 2010: www.wrap.org.uk/sites/files/wrap/Bulk%20Density%20Summary%20Report%20-
%20Jan2010.pdf

44 January 2017 7.I85 – The Management of Ship-Generated Waste On-board Ships
Quantitative results from this study During ship audits and interviews, information on food waste of 14 ships was
collected. Some of the ships visited incinerated or compacted some of the
waste while others stored domestic waste and delivered it to PRF.
The amounts generated per day on the ships studied varied from 0.001 to
8 m3. The amounts per crew member day varied from 0.001 to 0.02 m3, which
was confirmed in the internet survey. For passenger vessels the amount ranged
from 0.0004 to 0.002 m3 per person per day. The average amount of waste
production per day from the literature lies within the range provided in this
study.
8.5 Conclusion
Domestic waste consists of different types of products and is generated by
crew and passenger hoteling. Domestic waste is often stored on-board and
disposed in the port. It is also possible to compact or incinerate part of the
domestic waste. The main drivers for generation of domestic waste are the
number of people on-board and the type of products used by them. The ship
audits provide a range of domestic waste generation per day per person of
0.001 to 0.02 m3, which is confirmed by the online survey.

45 January 2017 7.I85 – The Management of Ship-Generated Waste On-board Ships
9 Cooking Oil
9.1 Introduction
Cooking oil waste is generated on-board during food preparation and is
generated on most types of vessels.
9.2 Cooking oil management and technology
Cooking oil is in most cases collected and delivered to PRF. In some cases it is
incinerated. On some ships, it used to be customary to mix the cooking oil
with sludge and treat it as sludge. However, MEPC 68 decided that this was not
in line with MARPOL Annex V (MEPC 68/21 paragraph 12.14 (MEPC, 2015)
Large cruise liners tend to have separate tank for the storage of cooking oil
with large capacities (up to 1,000 m3). The used oil is sold when in port and
can be used for e.g. biofuel production.
Figure 10 presents the waste flow diagram of cooking oil based on the
interviews, ship audits, the internet survey and a review of garbage
management plans. Generally, cooking oil is generated during food
preparation, stored into a container and delivered to PRF. Despite the
regulation prohibiting it, the ship audits showed that not all crew are aware
of this regulation and cooking oil is still mixed with sludge.
Figure 10 Waste flow diagram cooking oil
Sludge tank
Container
Generation:
- Food preparation
Cooking oil
PRF
Treated as
sludge
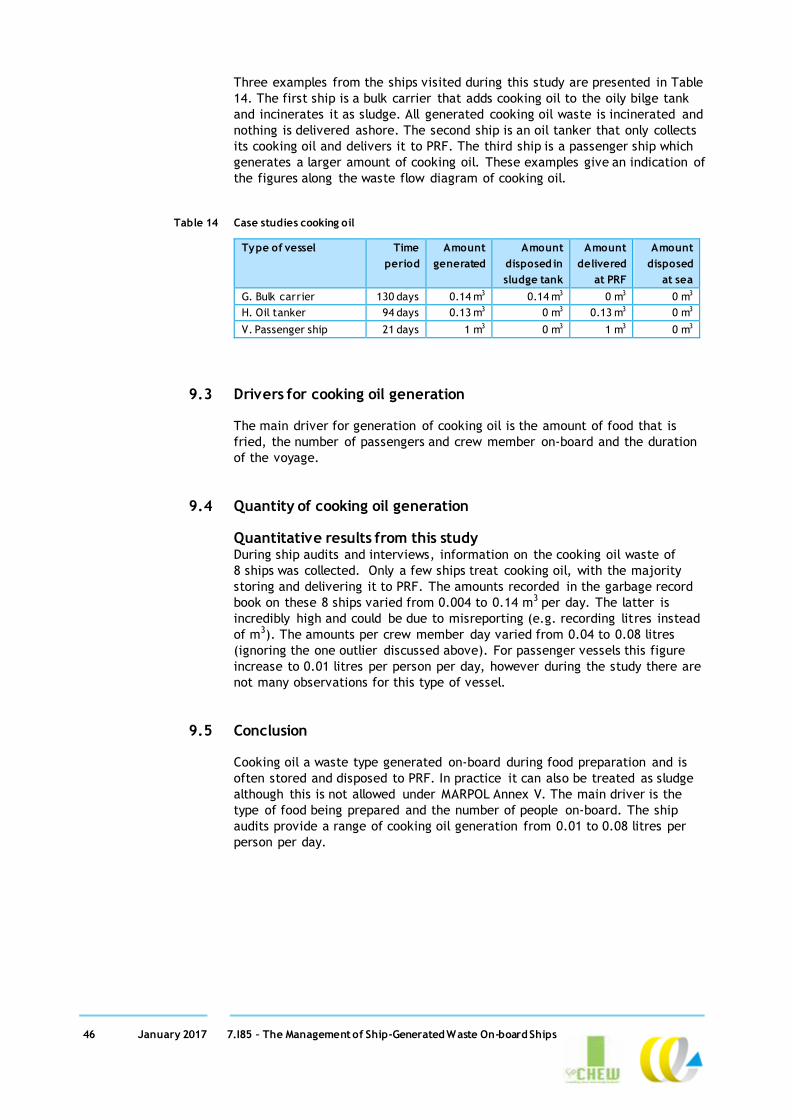
46 January 2017 7.I85 – The Management of Ship-Generated Waste On-board Ships
Three examples from the ships visited during this study are presented in Table
14. The first ship is a bulk carrier that adds cooking oil to the oily bilge tank
and incinerates it as sludge. All generated cooking oil waste is incinerated and
nothing is delivered ashore. The second ship is an oil tanker that only collects
its cooking oil and delivers it to PRF. The third ship is a passenger ship which
generates a larger amount of cooking oil. These examples give an indication of
the figures along the waste flow diagram of cooking oil.
Table 14 Case studies cooking oil
Type of vessel Time
period
Amount
generated
Amount
disposed in
sludge tank
Amount
delivered
at PRF
Amount
disposed
at sea
G. Bulk carrier 130 days 0.14 m3 0.14 m3 0 m3 0 m3
H. Oil tanker 94 days 0.13 m3 0 m3 0.13 m3 0 m3
V. Passenger ship 21 days 1 m3 0 m3 1 m3 0 m3
9.3 Drivers for cooking oil generation
The main driver for generation of cooking oil is the amount of food that is
fried, the number of passengers and crew member on-board and the duration
of the voyage.
9.4 Quantity of cooking oil generation
Quantitative results from this study During ship audits and interviews, information on the cooking oil waste of
8 ships was collected. Only a few ships treat cooking oil, with the majority
storing and delivering it to PRF. The amounts recorded in the garbage record
book on these 8 ships varied from 0.004 to 0.14 m3 per day. The latter is
incredibly high and could be due to misreporting (e.g. recording litres instead
of m3). The amounts per crew member day varied from 0.04 to 0.08 litres
(ignoring the one outlier discussed above). For passenger vessels this figure
increase to 0.01 litres per person per day, however during the study there are
not many observations for this type of vessel.
9.5 Conclusion
Cooking oil a waste type generated on-board during food preparation and is
often stored and disposed to PRF. In practice it can also be treated as sludge
although this is not allowed under MARPOL Annex V. The main driver is the
type of food being prepared and the number of people on-board. The ship
audits provide a range of cooking oil generation from 0.01 to 0.08 litres per
person per day.
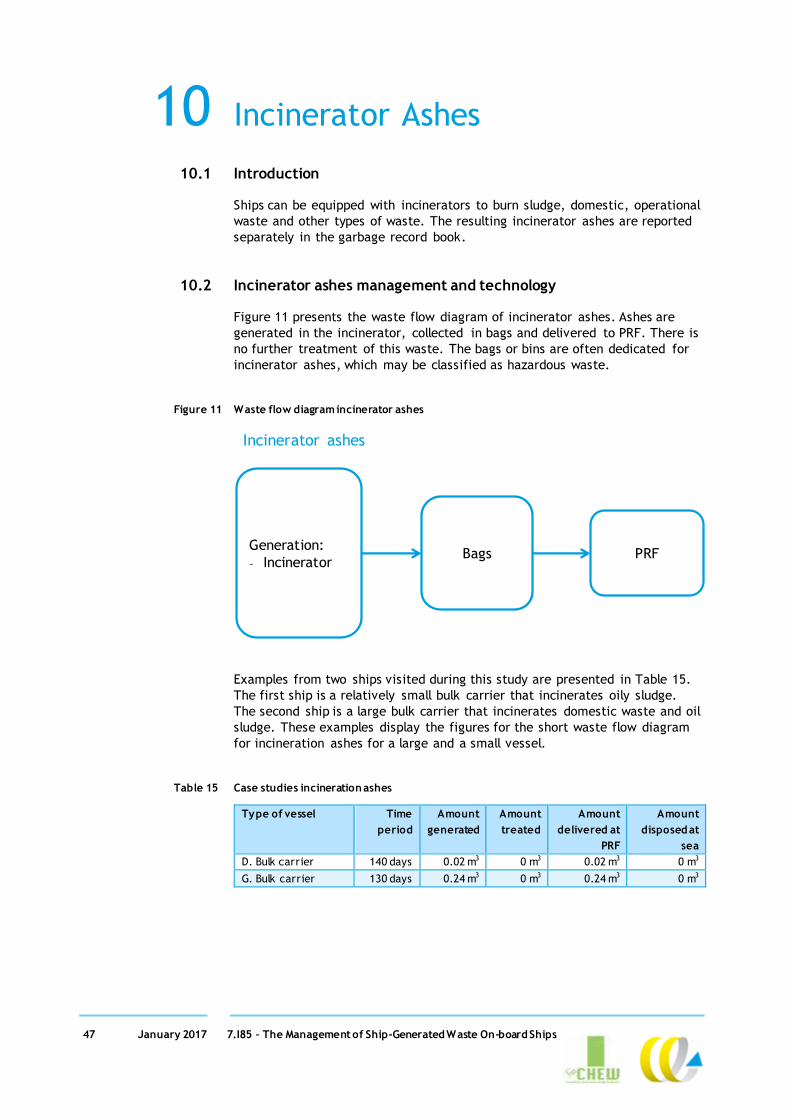
47 January 2017 7.I85 – The Management of Ship-Generated Waste On-board Ships
10 Incinerator Ashes
10.1 Introduction
Ships can be equipped with incinerators to burn sludge, domestic, operational
waste and other types of waste. The resulting incinerator ashes are reported
separately in the garbage record book.
10.2 Incinerator ashes management and technology
Figure 11 presents the waste flow diagram of incinerator ashes. Ashes are
generated in the incinerator, collected in bags and delivered to PRF. There is
no further treatment of this waste. The bags or bins are often dedicated for
incinerator ashes, which may be classified as hazardous waste.
Figure 11 Waste flow diagram incinerator ashes
Examples from two ships visited during this study are presented in Table 15.
The first ship is a relatively small bulk carrier that incinerates oily sludge.
The second ship is a large bulk carrier that incinerates domestic waste and oil
sludge. These examples display the figures for the short waste flow diagram
for incineration ashes for a large and a small vessel.
Table 15 Case studies incineration ashes
Type of vessel Time
period
Amount
generated
Amount
treated
Amount
delivered at
PRF
Amount
disposed at
sea
D. Bulk carrier 140 days 0.02 m3 0 m3 0.02 m3 0 m3
G. Bulk carrier 130 days 0.24 m3 0 m3 0.24 m3 0 m3
Bags Generation:
- Incinerator
Incinerator ashes
PRF
48 January 2017 7.I85 – The Management of Ship-Generated Waste On-board Ships
10.3 Drivers for incineration ashes generation
The driver for generation of incineration ashes is the amount of incineration of
oily sludge (including the oily part of bilge water), plastics, domestic waste
including cardboard and operational wastes including oily rags on-board a
vessel.
There is a large variety in incinerator use. While some ships incinerate most of
their sludge and domestic waste, others have a waste management plan that
prohibits the use of an incinerator.
If a ship has an incinerator installed, it is common practice to use it for
treatment of oily sludge. From the ships visited 6 out of 13 had an incinerator,
although these were not always used. The choice to have an incinerator
installed depends on the route of the ship, the duration of the voyage, the
waste storage capacity on-board the ship and or the overall waste
management policies on the ship.
The use of the incinerator on one of the ships in this study was related to cost
reduction for the ship when it visited EU ports. The management explained
that oily sludge may be delivered free of charge at Chinese and African ports.
Therefore to reduce costs in EU ports the sludge was incinerated before
arriving in the EU so that no more sludge would be delivered to the PRF than
could be done for free. In another case a ship was bought containing an
incinerator, but the new management decided to remove it as the company’s
operating procedure was to deliver all types of waste to PRF.
The use of the incinerator also requires fuel which is an additional cost.
Furthermore, the use of an incinerator could be seen as not environmentally
friendly which means ships will not get a high ranking in the Clean Shipping
Index (CSI). The scoring in the CSI depends on several environmental
indicators, such as CO2 and water and waste control. For the latter, there
should be no incinerator on board or documentation of no incineration of
garbage and sludge oil (Clean Shipping Index, ongoing).
The type of waste that is burnt in on-board incinerators differs per ship.
The ships included in this study mostly use the incinerator to burn domestic
waste and garbage (paper, plastics, etc.) and in a few cases oily sludge.
An example of the latter from the ships included in this study is a bulk carrier
with an incinerator for sludge. In a period of 96 days, the ORB shows that the
incinerator was used 7 times and in total 4 m3 was incinerated, while 25 m3
was generated in this period (so approximately 20% is incinerated).
The garbage record book shows that for a period of 140 day, 0.02 m3
incineration ashes were disposed to PRF, which means that assuming that
no other incineration has taken place, the waste volume has been reduced
from 4 m3 to 0.02 m3.
The survey has identified some additional drivers that can be mentioned.
In some ports or countries (e.g. Antwerp, Cape Town), independent companies
used to buy oily residues and oily sludge from vessels to process and sell it.
The market for sludge has become smaller as the oil price has decreased.
If ship trades only in coastal areas, the use of the incinerator is restricted so
the waste that would normally be incinerated will have to be delivered to PRF.

49 January 2017 7.I85 – The Management of Ship-Generated Waste On-board Ships
10.4 Quantity of incineration ashes generation
Quantitative results from this study During ship audits and interviews, information on incineration ashes produced
by 4 ships was collected. The type of waste and the amount of waste that is
being incinerated differs among the ships visited. The amounts generated per
month varied from 0.004 to 0.06 m3.
10.5 Conclusion
Incineration ashes only occur if a ship uses an incinerator, which can be used
for garbage and or sludge incineration. The ashes are collected in bags and
disposed at a PRF. The use of an incinerator depends on management plans
but also on the cost of delivery of the ashes to PRF outside the EU and the cost
of fuel used in the incinerator. In coastal areas the use of an incinerator is
restricted. The quantities from ship visits provide a range of small generation
rates between 0.004 and 0.06 m3 per month, although this depends entirely on
the frequency of incinerator use.
50 January 2017 7.I85 – The Management of Ship-Generated Waste On-board Ships
11 Operational Wastes
11.1 Introduction
Many different types of waste are classified as ‘operational wastes’.
Most ships include waste from the machine room in this category, such as oily
rags and batteries, but can also include other wastes resulting from operation
of the ship, such as old ropes, jerry cans, wood, washing machines, scrap,
refrigerators, aerosols, ladders, fireworks and flares, chemical remains,
asbestos and paint. Therefore, some of this waste should be classified as
hazardous material. Some ships also report waste related to cargo handling in
this category, such as wooden pallets, stowage material and rubber gloves.
On other ships, the category is used for other domestic wastes, such as
fluorescent tubes, torn working clothes, etc.
Often, as in the IMO MARPOL Annex V text, the definition of operational waste
on-board ship is waste that is not classified elsewhere. To be precise:
“Operational wastes means all solid wastes (including slurries) not covered by
other Annexes that are collected on board during normal maintenance or
operations of a ship, or used for cargo stowage and handling. This includes
cleaning agents and additives contained in cargo hold and external wash water
but not grey water, bilge water, or other similar discharges essential to the
operation of a ship, taking into account the guidelines developed by the
Organization” (IMO, 2011).
11.2 Operational waste management and technologies
Figure 12 presents the waste flow diagram for operational waste based on
the interviews, ship visits and analysis of the garbage management plans
undertaken in this study. Operational waste, however defined, is collected and
stored. Often, different types of waste (glass, paper, metals) are segregated
and stored separately. Hazardous waste is also often also kept separately in
certified containers. In some cases operational waste is incinerated as legally
appropriate, in other cases it is delivered to PRF.
Occasionally, the amount of operational waste delivered to a PRF is reduced
by recycling and re-using. For instance through a ‘Life, For Life’ service, rope
is being reused for research or recycled into new products. In this programme,
the rope is tested before reusing and recycling to ensure that ropes are not
replaced prematurely, thus enhancing sustainable rope management.
Most of the ships included in this study did not treat the operational waste and
only stored it on-board before delivering it to PRF. A few incinerated oily rags
and cardboard and one indicated plastics and paper are compacted.
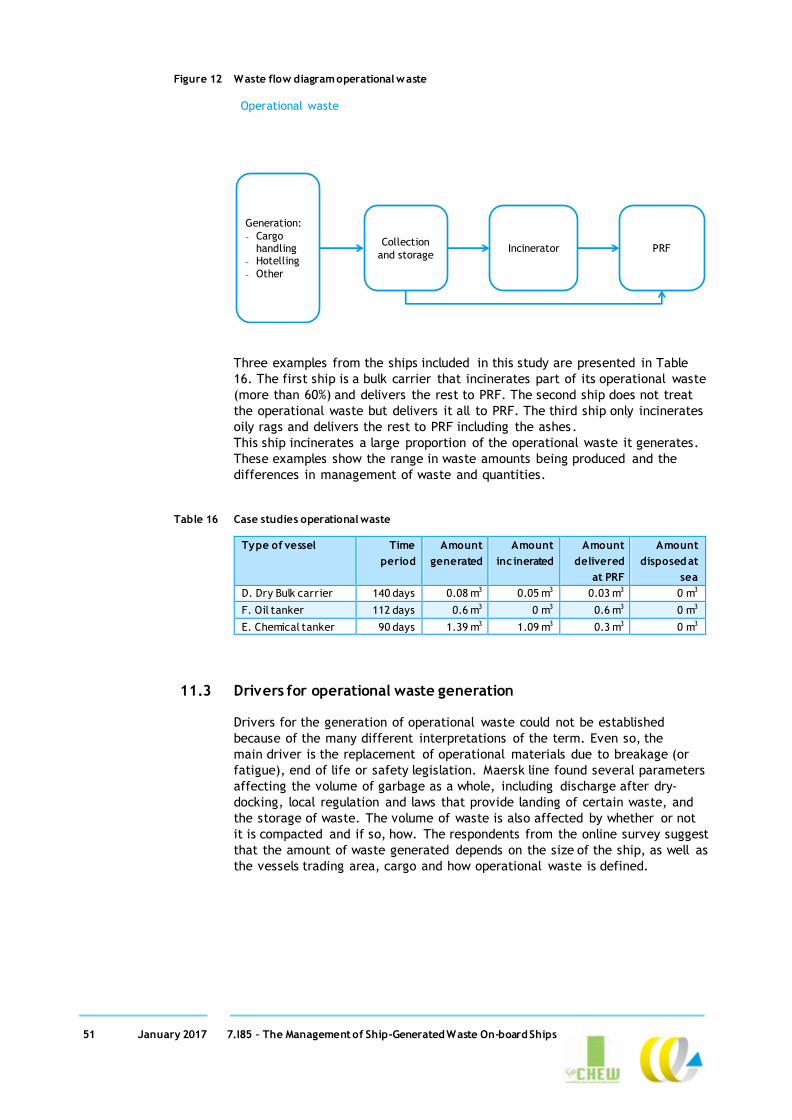
51 January 2017 7.I85 – The Management of Ship-Generated Waste On-board Ships
Figure 12 Waste flow diagram operational waste
Three examples from the ships included in this study are presented in Table
16. The first ship is a bulk carrier that incinerates part of its operational waste
(more than 60%) and delivers the rest to PRF. The second ship does not treat
the operational waste but delivers it all to PRF. The third ship only incinerates
oily rags and delivers the rest to PRF including the ashes.
This ship incinerates a large proportion of the operational waste it generates.
These examples show the range in waste amounts being produced and the
differences in management of waste and quantities.
Table 16 Case studies operational waste
Type of vessel Time
period
Amount
generated
Amount
inc inerated
Amount
delivered
at PRF
Amount
disposed at
sea
D. Dry Bulk carrier 140 days 0.08 m3 0.05 m3 0.03 m3 0 m3
F. Oil tanker 112 days 0.6 m3 0 m3 0.6 m3 0 m3
E. Chemical tanker 90 days 1.39 m3 1.09 m3 0.3 m3 0 m3
11.3 Drivers for operational waste generation
Drivers for the generation of operational waste could not be established
because of the many different interpretations of the term. Even so, the
main driver is the replacement of operational materials due to breakage (or
fatigue), end of life or safety legislation. Maersk line found several parameters
affecting the volume of garbage as a whole, including discharge after dry-
docking, local regulation and laws that provide landing of certain waste, and
the storage of waste. The volume of waste is also affected by whether or not
it is compacted and if so, how. The respondents from the online survey suggest
that the amount of waste generated depends on the size of the ship, as well as
the vessels trading area, cargo and how operational waste is defined.
PRFIncineratorCollection
and storage
Generation:
- Cargo handling
- Hotelling
- Other
Operational waste

52 January 2017 7.I85 – The Management of Ship-Generated Waste On-board Ships
11.4 Quantity of operational waste generation
Quantitative results from this study During the ship audits and interviews, information on operational waste of
6 ships was collected. Many ships do not report any waste under this category.
The amounts generated per month varied from 0.02 to 18.6 m3. The amounts
per crew member day varied from 0.001 to 0.1 m3. Other estimations range
from 0.001 m3 per person per day to up to 0.5 m3 per person per day,
depending on the size of the ship and the voyages undertaken.
11.5 Conclusion
Operation waste can be defined in different waste, which means that there
might be some overlap with other types of waste. Operational waste can be
stored and/or incinerated before being delivered at a PRF. In practice, mainly
oily rags, cardboard and wood are incinerated and in many cases operational
waste is collected and not treated on board. The generation depends on
several factors such as the size of the ship, as well as the ship’s trading area
and type of cargo. The ship audits provide a range of 0.001 to 0.1 m3 per
person per day.
53 January 2017 7.I85 – The Management of Ship-Generated Waste On-board Ships
12 Cargo Residues
12.1 Introduction
MARPOL Annex V defines cargo residues as ‘the remnants of any cargo which
are not covered by other Annexes to the present Convention and which remain
on the deck or in holds following loading or unloading, including loading and
unloading excess or spillage, whether in wet or dry condition or entrained in
wash water but does not include cargo dust remaining on the deck after
sweeping or dust on the external surfaces of the ship’ (IMO, 2011).
Residues of oil cargoes are covered by MARPOL Annex I and residues of
chemical cargoes by Annex II so they are not included in the above definition.
Hence, this type of waste is generated on dry bulk carriers and occasionally on
general cargo carriers when they transport dry cargoes in bulk. Cargo residues
can be left in the corners of the holds or in other places that are not
accessible during unloading and very much depend on the efficiency and
methods used in unloading the cargo.
12.2 Cargo residues management
Figure 13 presents the waste flow diagram for cargo residues. In general,
unloading is done as efficiently as possible to prevent generation of cargo
residues. After unloading, cargo holds are brushed or washed (usually by hand)
and residues are collected in bags and either handled by the stevedores (as
cargo) or delivered to PRF (as waste).
If needed, the cargo holds are rinsed with seawater and the residues disposed
of at sea, if discharge is permitted, or to PRF, if it is not.
The information from ship visits indicates that often the waste goes to
stevedores or PRF. Some ships have indicated disposal at sea, but this
relates to the disposal of washing water.
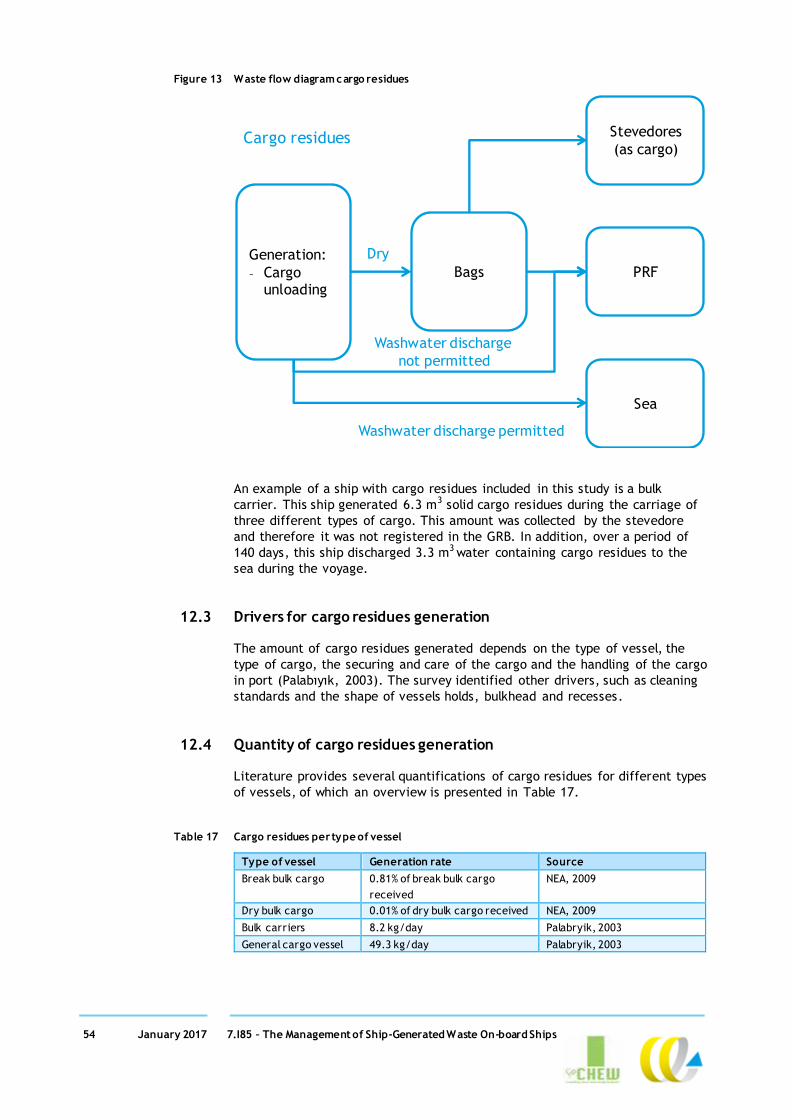
54 January 2017 7.I85 – The Management of Ship-Generated Waste On-board Ships
Figure 13 Waste flow diagram cargo residues
An example of a ship with cargo residues included in this study is a bulk
carrier. This ship generated 6.3 m3 solid cargo residues during the carriage of
three different types of cargo. This amount was collected by the stevedore
and therefore it was not registered in the GRB. In addition, over a period of
140 days, this ship discharged 3.3 m3 water containing cargo residues to the
sea during the voyage.
12.3 Drivers for cargo residues generation
The amount of cargo residues generated depends on the type of vessel, the
type of cargo, the securing and care of the cargo and the handling of the cargo
in port (Palabıyık, 2003). The survey identified other drivers, such as cleaning
standards and the shape of vessels holds, bulkhead and recesses.
12.4 Quantity of cargo residues generation
Literature provides several quantifications of cargo residues for different types
of vessels, of which an overview is presented in Table 17.
Table 17 Cargo residues per type of vessel
Type of vessel Generation rate Source
Break bulk cargo 0.81% of break bulk cargo
received
NEA, 2009
Dry bulk cargo 0.01% of dry bulk cargo received NEA, 2009
Bulk carriers 8.2 kg/day Palabryik, 2003
General cargo vessel 49.3 kg/day Palabryik, 2003
Stevedores
(as cargo)
Sea
Bags
Generation:
- Cargo unloading
Dry
Washwater discharge permitted
Cargo residues
PRF
Washwater discharge
not permitted
55 January 2017 7.I85 – The Management of Ship-Generated Waste On-board Ships
Quantitative results from this study Discharge of cargo residues to the sea, incineration and delivery to PRF has to
be recorded in the GRB. No recording is required if the waste is collected by
the stevedores and not delivered to PRF.
During the ship audits and interviews undertaken as part of this study,
information on cargo residues was only found for one ship indicating that, on
average, 2.1 m3 solid waste was generated per discharge of cargo (see above).
In the records of the same ship it was found that between 0.5 and 2.8 m3 of
washwater was discharged at sea per washing of the holds. The interviews and
the online survey have indicated that the amount of waste generated may
range from 0.001% of the cargo to up to 2% of the cargo.
12.5 Conclusion
Cargo residues are only generated on cargo ships (mainly dry bulk carriers) and
are often delivered to PRF or stevedores, while washwater is often discharged
in sea. The amount generated depends on several factors such as the type of
cargo, the handling equipment and the efficiency of the stevedores.
The quantities vary widely from almost nothing to 2% of the cargo.

56 January 2017 7.I85 – The Management of Ship-Generated Waste On-board Ships
13 Ozone Depleting Substances
13.1 Introduction
MARPOL Annex VI defines ozone depleting substances as controlled substances
defined in paragraph 4 of article 1 of the Montreal Protocol on Substances that
Deplete the Ozone Layer, 1987, listed in Annexes A, B, C or E to the said
Protocol in force at the time of application or interpretation of this Annex.
This includes for example Halon 1211, Halon 1301, Halon 2402, CFC-11,
CFC-12, CFC-113, CFC-114 and CFC-115 (IMO, 2006d).
Ozone depleting substances are used on-board ships in air conditioning
appliances or cooling equipment on reefers. They can also be contained in
mobile equipment (fridges, mobile air conditioners). Ozone depleting
substance waste is generated on different types of vessels, depending on the
presence of appliances and technologies that emit this type of waste.
13.2 Ozone depleting substances management
The generation of ozone depleting substance waste depends on the type of
cooling and refrigeration systems on-board ships and the maintenance
schedule of these technologies. Ozone depleting substance waste is generated
during system checks, repair of leakages or/and annual survey of the systems.
Some ships such as yachts have little waste production due to the use of AC
and refrigerators with more ozone friendly gases.
Ozone depleting substances which are released to the atmosphere during
leakages cannot be collected. Ozone depleting substances that are replaced
during maintenance are collected by the specialist engineer undertaking the
maintenance work and removed as waste. The major source of non-controlled
ozone depleting substance waste is in broken mobile equipment that the ship
wants to deliver to PRF.
In the ship audits and interviews conducted for this study, ozone depleting
substance waste was not identified. This is probably because major
refurbishments of cooling systems, which would require these systems to be
drained of ozone depleting substances, do not occur at sea. Also, equipment
containing ozone depleting substances may not be classified as ozone
depleting substance waste but rather as operational or domestic waste.
13.3 Quantity of ozone depleting substance waste generation
Quantitative results from this study During ship audits and interviews, information ODS leakages and refillings
(which is strictly speaking not waste) was only found for three vessels, one has
reported a monthly average generation of 0.83 kg and the other reported
15.9 kg per month on average. A third has reported a monthly average
generation of 95 kg, which is about 5% of the weight of the system on this
passenger ship.
57 January 2017 7.I85 – The Management of Ship-Generated Waste On-board Ships
There is not much information in the literature to compare these values with.
As there is not much information from the ship visits or literature, this type of
waste was not been validated in the online survey.
13.4 Conclusion
Equipment containing ozone depleting substances produce ozone depleting
substances when being refurbished, however this is likely to be taken away by
the specialist companies undertaking this repair. The major source of non-
controlled ozone depleting substance waste is in broken mobile cooling of
refrigeration equipment that the ship delivers to PRF. However, this waste
may be classified as operational or domestic waste, and not as ozone depleting
substances waste.
It has proven difficult to provide a range of waste generation on-board ships
for this type of waste.

58 January 2017 7.I85 – The Management of Ship-Generated Waste On-board Ships
14 Other Non-common Waste Streams
14.1 Dirty ballast water
Ballast water is carried in ships’ ballast tanks to improve stability, balance
and trim. When oil tanks are used to carry ballast water, the water is
contaminated with oil and is classified as waste in MARPOL Annex I (IMO,
2006a). We have not identified ships that generate oily ballast water and
hence have not analysed this type of waste further.
The production of oily ballast water on a ship is a very rare occurrence.
The likely waste arising from ballast water operations on a ship is when
sediment in a ballast water tank may have to be removed during a Port State
Control tank integrity survey in a port, or when the vessel has to treat its
ballast water and cannot do so. Both of these circumstances are very rare and
in the event of these circumstances happening, ports are likely to provide the
ship with contacts of specialist waste contractors to handle this waste.
14.2 Animal carcasses
Animal carcasses are the remains of deceased livestock. As shown in Figure 2,
discharge of animal carcasses is only allowed outside special areas and as far
from the nearest land as possible and en route. So the option for disposal of
animal carcasses are either discharge into sea or delivery to a PRF. When the
ship has an appropriate storage area on board, limited quantities of carcasses
may be stored for short periods before discharge. If there are health and
safety threats, it is recommended to discharge into sea however more than
12 nm from the nearest land. Before discharge into sea, animal carcasses
should be split or treated in order to facilitate the sinking or dispersal of the
carcasses (IMO, 2012). We have not identified ships that generate animal
carcasses and hence have not analysed this type of waste.
14.3 Fishing gear
Fishing gear waste is generated when fishing gear wears and tears beyond
repair. It is only generated on fishing vessels.
14.3.1 Fishing gear waste management Figure 14 presents the waste flow diagram for fishing gear. Gear that cannot
be repaired is generally collected in bags and disposed of in ports, although it
also ends up in the sea (Eunomia, 2016). It is also possible to recycle the
fishing gear waste into new packaging as done in Skagen (Handson tv/e, 2004).
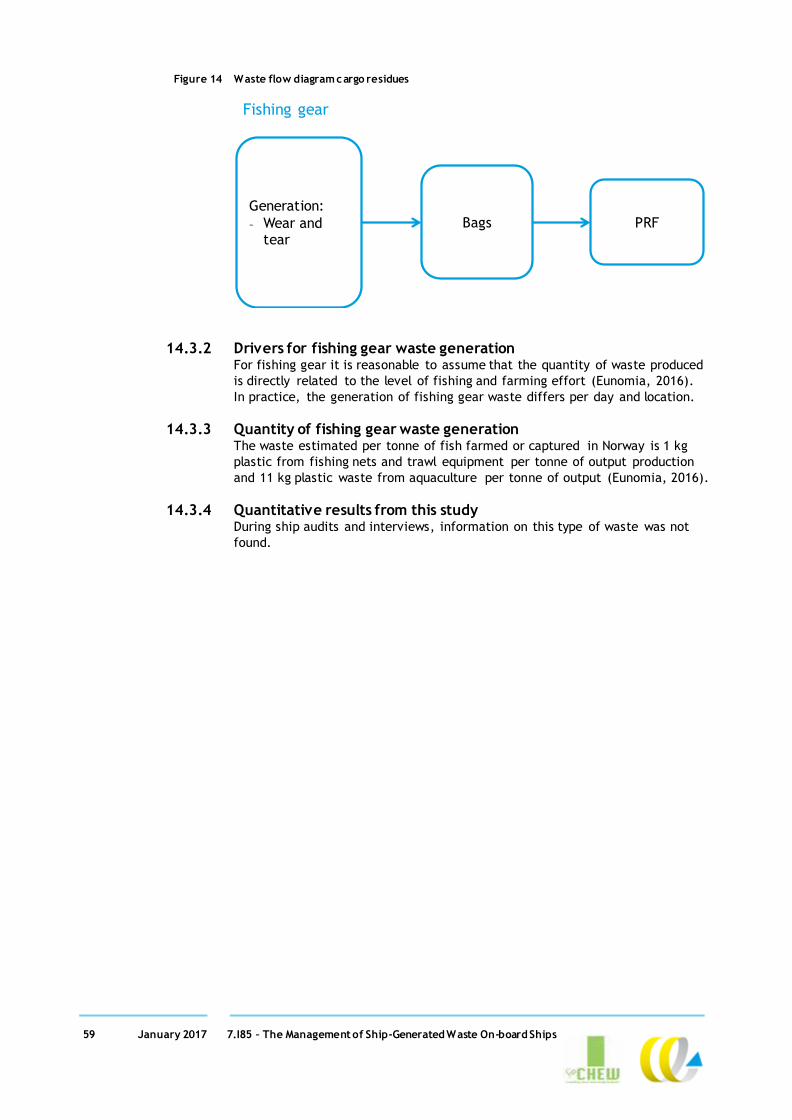
59 January 2017 7.I85 – The Management of Ship-Generated Waste On-board Ships
Figure 14 Waste flow diagram cargo residues
14.3.2 Drivers for fishing gear waste generation For fishing gear it is reasonable to assume that the quantity of waste produced
is directly related to the level of fishing and farming effort (Eunomia, 2016).
In practice, the generation of fishing gear waste differs per day and location.
14.3.3 Quantity of fishing gear waste generation The waste estimated per tonne of fish farmed or captured in Norway is 1 kg
plastic from fishing nets and trawl equipment per tonne of output production
and 11 kg plastic waste from aquaculture per tonne of output (Eunomia, 2016).
14.3.4 Quantitative results from this study During ship audits and interviews, information on this type of waste was not
found.
Bags
Generation:
- Wear andtear
Fishing gear
PRF

60 January 2017 7.I85 – The Management of Ship-Generated Waste On-board Ships
15 Observations on Waste Handling
15.1 Introduction
This chapter presents the results of an analysis of waste notification forms in
Section 15.2 and some observations made during ship visits in Section 15.3.
15.2 Waste notification forms
We have audited 40 waste notification forms and compared them with the
amounts of waste actually delivered to a port reception facility.
The total amount of MARPOL Annex I (IMO, 2006a) waste notified for delivery
of all ships in our sample was close to the total amount landed (85-135% of the
notified amount was landed). In some specific cases ships actually delivered
ranges from 25% of the notified amount to 200% of the notified amount per
ship. Case studies showed several reasons for the difference:
In some cases the oil record book was not updated quickly enough and the
amount notified wasn’t accurate.
A discharge on sea of bilge water through an OWS was done after the
notification was done.
The ship notified the port that a set amount of oily waste was to be kept
on-board, but was ordered after the notification to deliver it to PRF by a
port state control inspector.
Waste notification forms are sent to port a few days prior to arrival, so
they are based on estimates of the amount of waste generated during the
time period between drafting the WNF and entry in port. These estimates
may be inaccurate.
For MARPOL Annex IV (IMO, 2006b) the amount of sewage notified and
delivered differs depending on local regulations. As most ships have a
treatment plant, no sewage is stored on-board. The delivery to PRF only
occurs when a port does not allow the discharge of treated sewage into the
port, or when the ship does not have the technology to discharge raw or
treated water into the sea in line with MARPOL Annex IV regulations .
Notification does not often happen as sewage is treated and not kept
on-board. In some cases raw sewage, treated sewage and wastewater from
sewage plants is kept in storage tanks when it cannot be legally discharged
under MARPOL Annex IV for subsequent discharge at sea or delivery to PRF.
The total amount of MARPOL Annex V (IMO, 2006c) waste notified for delivery
differs strongly from what was actually landed and ranges between 20% and
1,800% of the notified amount. The big difference between notified and
landed could be partly due to:
The waste notification forms are often prepared a few days in advance,
while a big part of the generation of garbage is related to the provisions
obtained once the ship enters the port. If all the packaging material is
delivered before departing, this amount of garbage may not be notified.
61 January 2017 7.I85 – The Management of Ship-Generated Waste On-board Ships
Records kept for garbage are unlike those for MARPOL Annex I (IMO, 2006a)
as they focus on the quantities delivered rather than the quantities on
board. The quantities of garbage on-board are often estimated by the
responsible crew member through a visual inspection. If the amount of
garbage exceeds the storage capacity, then this estimation is difficult to
make.
The amount of cargo residues is generated during the discharge and
washing of cargo holds (after the notification). In case that cargo residues
were on-board when the notification is made, no record is kept of
amounts, so estimations may not be accurate.
In general the following observations were made:
crews do not appear to have a strong incentive to provide accurate
estimates of waste in the waste notification forms;
often the notification is done by the agent and the information flow is
handled by several people between the ship/ agent and the National Single
Window/the port/the PRF. Mistakes can easily be made;.
The notification form differs from port to port and from ship to ship as ports
tend to have a need for detailed information, which is specific for their own
situation; and
The quantities of garbage differ in units, from Kg to m3 depending on how
it’s notified and reported when landed. A comparison cannot always be
made.
Waste that is landed at stevedores is not registered.
15.3 Other observations
Prevention of waste Although many garbage management plans state that their aim is to prevent
waste, we have not come across a concrete strategy for waste prevention in
shipping companies. Agents interviewed have not been approached with
requests to reduce the amount of packaging or otherwise prevent waste from
forming on ships. In addition ship suppliers do not take back packaging
material, and in fact this type of domestic waste is often not generated in port
but at sea, when the crew has more time to unpack supplies.
Even though many ships have a water purifier on-board, the crew often prefers
bottled water. Plastic bottles and packaging material constitute the largest
share of plastic waste.
Waste classification The classification of waste is sometimes not clear, especially in the case of
‘operational waste’. Domestic waste ‘not in any other category’ is sometimes
recorded as operational waste, while other ships limit this category to wastes
directly relating to the operation of the ship (e.g. ropes, pallets, empty paint
tins, etc.).
There is a mismatch between the classification of waste in MARPOL Annex V
(IMO, 2006c), the classification used on-board ships and the classification used
by waste handlers. For example:
waste handlers insist on separating clean and dirty plastics. Both are in the
same category in MARPOL Annex V (IMO, 2006c);
paper, glass and fluorescent tubes are often collected separately, while
they all classify as ‘domestic waste’ in MARPOL Annex V (IMO, 2006c).

62 January 2017 7.I85 – The Management of Ship-Generated Waste On-board Ships
Different classifications may be the cause of misreporting or of errors in
entries in the garbage record book.
Ashes that are generated during the incineration of oily sludge are not always
recorded in the oil record book. Sometimes, but not always, they are recorded
in the garbage record book and sometimes there is no record of these ashes in
anywhere. Similarly, ashes that are generated from the incineration of
domestic wastes are sometimes recorded in the oil record book and not in the
garbage record book.
Recording The amount of generated waste under MARPOL Annex I is easily followed by
the records entered into the oil record book, due to inclusion of a weekly
report of the amount of waste in the tanks. The amount of waste under
MARPOL Annex V is much harder to predict as the Garbage Record Book only
registers the amount incinerated, discharged at sea or landed to PRF.
No weekly report of the amount of garbage on board is kept, in synergy with
MARPOL Annex I.
Mixing of different types of waste On many ships, cooking oil (IMO, 2006c) has traditionally been disposed in the
sludge tank (MARPOL Annex I) and treated as sludge. MEPC 68 (MEPC, 2015)
decided that this was not in line with MARPOL Annex V (IMO, 2006c), and that
cooking oil should be kept separate. This has, however, not been implemented
on all ships.
A similar situation of mixing different types of waste occurs on ships that add
the galley water and/or ground food waste (MARPOL Annex V) to the sewage
tank (MARPOL Annex IV) and then release the combined waste to the sea.
Delivery of waste to PRF Shipping companies appear to optimize their waste delivery in order to reduce
the cost of waste management. Some ships indicate that waste is separated on
a ship but the company that collects the waste does not separate this.
In addition, the separation categories of waste can differ among countries.
Some companies have indicated that the storage capacity on board can be
expanded by using bags for excess waste.
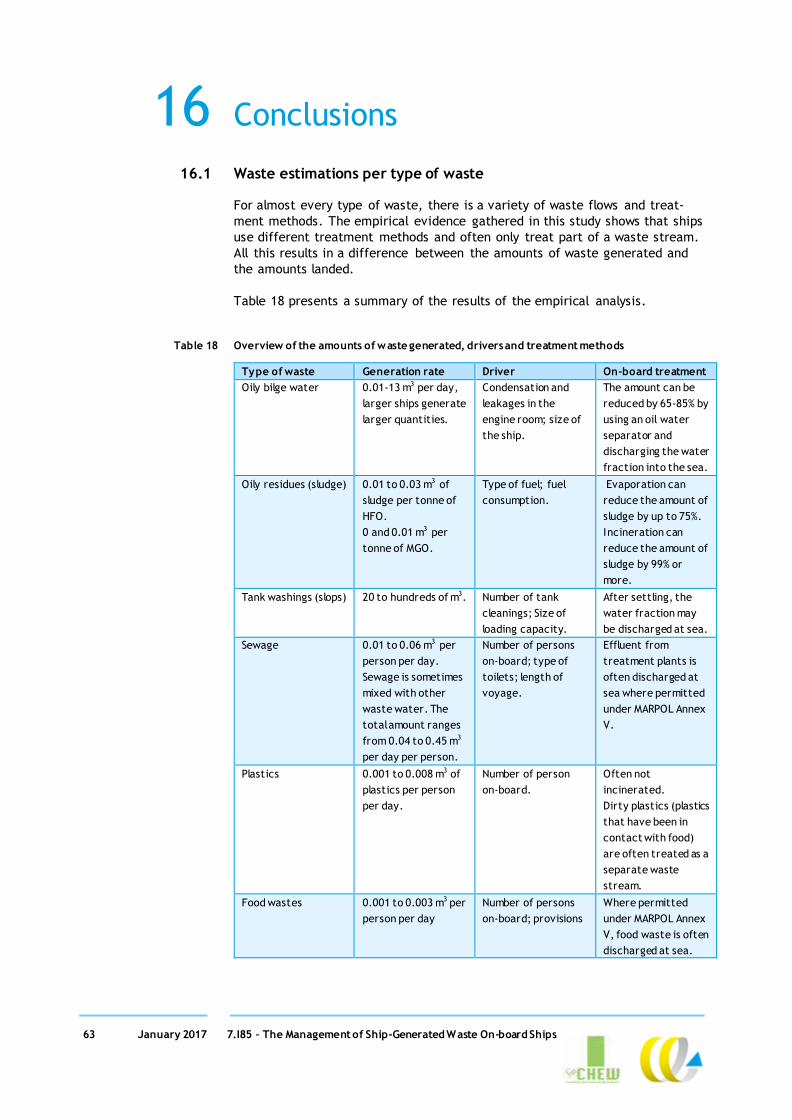
63 January 2017 7.I85 – The Management of Ship-Generated Waste On-board Ships
16 Conclusions
16.1 Waste estimations per type of waste
For almost every type of waste, there is a variety of waste flows and treat-
ment methods. The empirical evidence gathered in this study shows that ships
use different treatment methods and often only treat part of a waste stream.
All this results in a difference between the amounts of waste generated and
the amounts landed.
Table 18 presents a summary of the results of the empirical analysis.
Table 18 Overview of the amounts of waste generated, drivers and treatment methods
Type of waste Generation rate Driver On-board treatment
Oily bilge water 0.01-13 m3 per day,
larger ships generate
larger quantities.
Condensation and
leakages in the
engine room; size of
the ship.
The amount can be
reduced by 65-85% by
using an oil water
separator and
discharging the water
fraction into the sea.
Oily residues (sludge) 0.01 to 0.03 m3 of
sludge per tonne of
HFO.
0 and 0.01 m3 per
tonne of MGO.
Type of fuel; fuel
consumption.
Evaporation can
reduce the amount of
sludge by up to 75%.
Incineration can
reduce the amount of
sludge by 99% or
more.
Tank washings (slops) 20 to hundreds of m3. Number of tank
cleanings; Size of
loading capacity.
After settling, the
water fraction may
be discharged at sea.
Sewage 0.01 to 0.06 m3 per
person per day.
Sewage is sometimes
mixed with other
waste water. The
total amount ranges
from 0.04 to 0.45 m3
per day per person.
Number of persons
on-board; type of
toilets; length of
voyage.
Effluent from
treatment plants is
often discharged at
sea where permitted
under MARPOL Annex
V.
Plastics 0.001 to 0.008 m3 of
plastics per person
per day.
Number of person
on-board.
Often not
incinerated.
Dirty plastics (plastics
that have been in
contact with food)
are often treated as a
separate waste
stream.
Food wastes 0.001 to 0.003 m3 per
person per day
Number of persons
on-board; provisions
Where permitted
under MARPOL Annex
V, food waste is often
discharged at sea.
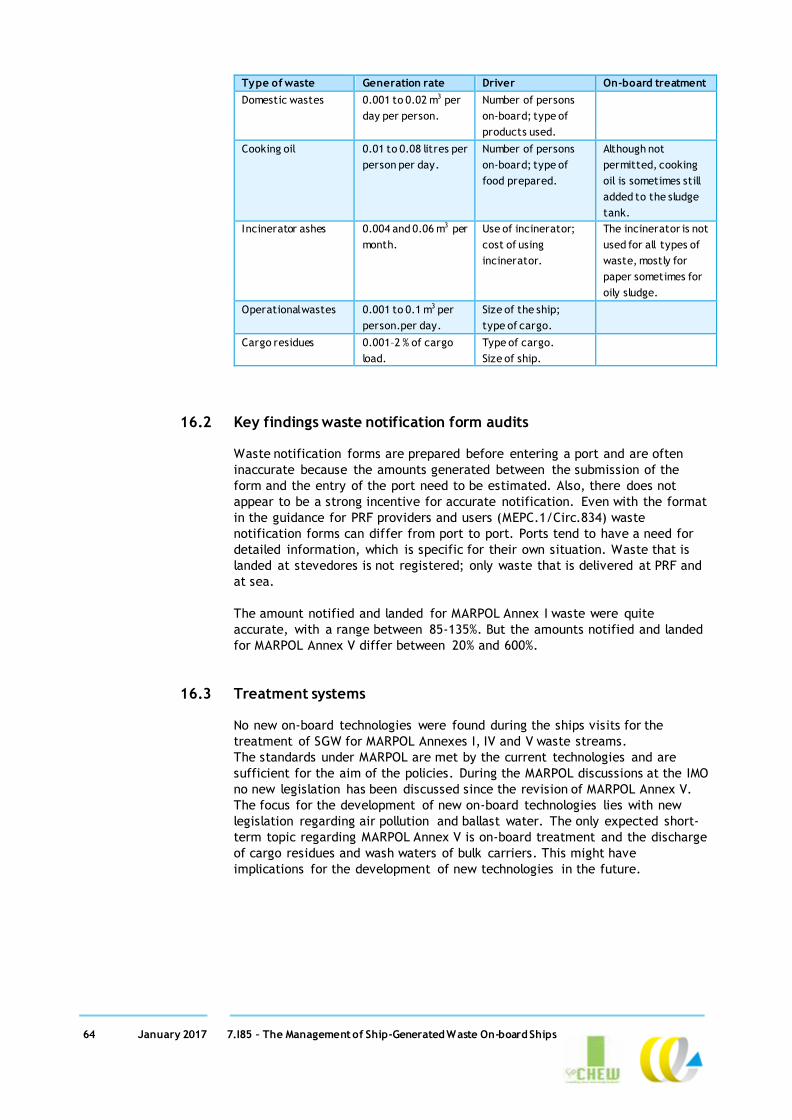
64 January 2017 7.I85 – The Management of Ship-Generated Waste On-board Ships
Type of waste Generation rate Driver On-board treatment
Domestic wastes 0.001 to 0.02 m3 per
day per person.
Number of persons
on-board; type of
products used.
Cooking oil 0.01 to 0.08 litres per
person per day.
Number of persons
on-board; type of
food prepared.
Although not
permitted, cooking
oil is sometimes still
added to the sludge
tank.
Incinerator ashes 0.004 and 0.06 m3 per
month.
Use of incinerator;
cost of using
incinerator.
The incinerator is not
used for all types of
waste, mostly for
paper sometimes for
oily sludge.
Operational wastes 0.001 to 0.1 m3 per
person.per day.
Size of the ship;
type of cargo.
Cargo residues 0.001–2 % of cargo
load.
Type of cargo.
Size of ship.
16.2 Key findings waste notification form audits
Waste notification forms are prepared before entering a port and are often
inaccurate because the amounts generated between the submission of the
form and the entry of the port need to be estimated. Also, there does not
appear to be a strong incentive for accurate notification. Even with the format
in the guidance for PRF providers and users (MEPC.1/Circ.834) waste
notification forms can differ from port to port. Ports tend to have a need for
detailed information, which is specific for their own situation. Waste that is
landed at stevedores is not registered; only waste that is delivered at PRF and
at sea.
The amount notified and landed for MARPOL Annex I waste were quite
accurate, with a range between 85-135%. But the amounts notified and landed
for MARPOL Annex V differ between 20% and 600%.
16.3 Treatment systems
No new on-board technologies were found during the ships visits for the
treatment of SGW for MARPOL Annexes I, IV and V waste streams.
The standards under MARPOL are met by the current technologies and are
sufficient for the aim of the policies. During the MARPOL discussions at the IMO
no new legislation has been discussed since the revision of MARPOL Annex V.
The focus for the development of new on-board technologies lies with new
legislation regarding air pollution and ballast water. The only expected short-
term topic regarding MARPOL Annex V is on-board treatment and the discharge
of cargo residues and wash waters of bulk carriers. This might have
implications for the development of new technologies in the future.
65 January 2017 7.I85 – The Management of Ship-Generated Waste On-board Ships
16.4 Classification of waste
The classification of waste in MARPOL does not always match the practice on
board.
Operational waste and domestic waste are overlapping categories and it is
often not clear to the crew how certain wastes should be classified. The same
holds for galley and restaurant waste that contains plastics, tins and other
packaging material in addition to food waste.
Likewise, the MARPOL classification does not always reflect the categories of
waste handlers. Waste handlers often insist on keeping clean and dirty plastics
separately, for example, even though they are one category under MARPOL.

66 January 2017 7.I85 – The Management of Ship-Generated Waste On-board Ships
Annex A References
AFCAN, 2006. Oily waste management onboard of vessels : update. [Online]
Available at:
http://www.afcan.org/dossiers_techniques/gestion_dech_huileux2_gb.html [Accessed 2016].
ASCI, 2000. Alaska Cruise Ship Initiative Part I Final Report : Activiteit and Workproducts up to June 1, 2000, s.l.: Alaska Cruise Ship Initiative (ASCI).
Beza, P. E., Kitsantas, T. D. & Mitselos, F. A., 2014. Ship Waste Management in
the Port of Igoumenitsa, Greece. Journal of Physical Science and Application, 4(6), pp. 375-380.
Brandstoftafel scheepvaart, 2014. Visie Duurzame Brandstoffenmix : Deelrapport Brandstoftafel scheepvaart, s.l.: Brandstoftafel scheepvaart.
Cantin, J., Eyraud, J. & Fenton, C., 1999. Quantitative estimates of garbage
generation and disposal in the US Maritime sectors before and after MARPOL
ANNEX V. In: Shomura, R.S. et al. Proceedings of the Second International
Conference on Marine Debris 2-7 April 1989, Honolulu, Hawaii, volume 1.
NOAA Technical Memorandum, NMFS-SWFSC(154). Panama City: US Department of Commerce, NOAA, pp. 119-181.
Clean Shipping Index, ongoing. Environmental parameters. [Online]
Available at:
http://www.cleanshippingindex.com/information/environmental-parameters-
2/ [Accessed 2016].
Committee on Shipborne Wastes ; Marine Board ; Commission on Engineering
and Technical Systems : National Research Council, 1995. Clean ships clean
ports clean oceans : Controlling garbage and plastic wastes at sea.. Washington D.C.: National Academy Press.
Committee on Shipborne Wastes; Marine Board; Commission on Engineering
and Technical Systems: National Research Council, 1995. Clean ships clean
ports clean oceans : Controlling garbage and plastic wastes at sea.. Washington D.C.: National Academy Press.
EC, 2000. Directive 2000/59/EC of the European Parliament and of the Council
of 27 November 2000 on port reception facilities for ship-generated waste and
cargo residues. Official Journal of the European Communities, 2000(L332), pp. 81-89.
EMSA, 2008. Preventing Pollution from Ships. Lissabon: European Maritime Safety Agency (EMSA).
EMSA, 2015. Draft Guidelines fot the Implementation of Directive 2000/59/EC on Port Reception Facilities, s.l.: The European Maritime Safety Agency.

67 January 2017 7.I85 – The Management of Ship-Generated Waste On-board Ships
Environment Protection Authority Victoria, 2016. Ballast water. [Online]
Available at: http://www.epa.vic.gov.au/your-environment/water/ballast-
water [Accessed 18 August 2016].
Environmental Board , 2015. Ship-generated waste and cargo residues reception and handling plan , Tallin: Environmental Board of Port of Tallin.
Environmental Board, 2015. Ship-generated waste and cargo residues reception and handling plan, Tallin: Environmental Board of Port of Tallin.
EPA, 2008. Cruise Ship Discharge Assessment Report, Washington D.C.: U.S.
Environmental Protection Agency, Oceans and Coastal Protection Division, Office of Wetlands, Oceans, and Watersheds, Office of Water.
EPA, 2011. Oily Bilgewater Separators, Washington D.C.: United States Environmental Protection Agency (EPA), Office of Wastewater Management.
Eunomia, 2016. Study to support the development of measures to combat a range of marine litter sources, Bristol: Eunomia Research & Consulting Ltd.
Friends of the Earth, 2009. Getting a Grip on Cruise Ship Pollution, s.l.: Friends of the Earth.
Handson tv/e, 2004. Fishing for Litter – Denmark. [Online]
Available at: http://handson.tve.org/series-5/green-current/fishing-litter-
denmark/ [Accessed 2016].
HELCOM, 2013. HELCOM interim guidance on technical and operational aspects
of delivery of sewage by passenger ships to port reception facilities : 2013
HELCOM Ministerial Declaration, Helsinki: HELCOM, Baltic Marine Environment Protection Commission.
HELCOM, 2015. Baltic Sea Sewage Port Reception Facilities : HELCOM
Overview 2014, Revised Second Edition, Helsinki: HELCOM, Baltic Marine Environment Protection Commission.
HPTI, 2007. Study on Ships producing reduced quantities of ships generated
waste : present situation and future opportunities to encourage the
development of cleaner ships, Lissabon: European Maritime Safety Agency (EMSA), Unit D – Implementation EU maritime legislation.
IMO, [1983]. Annex I- Regulations for the Prevention of Pollution by Oil :
Chapter 4, Part B, Regulations 33: Crude oil washing requirements , London: IMO.
IMO, 2006a. Marpol Consolidation 2006 : Annex I- Regulations for the
Prevention of Pollution by Oil. [Online]
Available at:
http://www.marpoltraining.com/MMSKOREAN/MARPOL/Annex_I/index.htm [Accessed 21 June 2016].
68 January 2017 7.I85 – The Management of Ship-Generated Waste On-board Ships
IMO, 2006b. Marpol Consolidation 2006 : Annex IV- Regulations for the
Prevention of Pollution by Sewage from Ships. [Online]
Available at:
http://www.marpoltraining.com/MMSKOREAN/MARPOL/Annex_IV/index.htm [Accessed June 21 2016].
IMO, 2006c. Marpol Consolidation 2006 : Annex V- Regulations for the
Prevention of Pollution by Garbage from Ships. [Online]
Available at:
http://www.marpoltraining.com/MMSKOREAN/MARPOL/Annex_V/index.htm [Accessed 21 June 2016].
IMO, 2006d. Marpol Consolidation 2006 : Annex VI Regulations for the
Prevention of Air Pollution from Ships. [Online]
Available at:
http://www.marpoltraining.com/MMSKOREAN/MARPOL/Annex_VI/r12.htm [Accessed 16 August 2016].
IMO, 2008. 2008 Revised Guidelines for Systems for handling Oily Wastes in
Machinery spaces of Ships incorporating Guidance Notes for an Integrated
Bilge Water Treatment System (IBTS), MEPC.1/Circ.642, London: International Maritime Organization (IMO).
IMO, 2012. MARPOL73-78: Brief history - list of amendments to date an where
to find them. [Online]
Available at:
www.imo.org/en/KnowledgeCentre/ReferencesAndArchives/HistoryofMARPOL/
Documents/MARPOL%2073-78%20Brief%20History%20-
%20List%20of%20amendments%20and%20how%20to%20find%20them.htm#amend
ments year by year [Accessed 27 June 2016].
IMO, 2014. Cosolidated Guidance for Port Reception Facility Providers and
Users, MEPC.1/Circ.834. [Online]
Available at: www.register-iri.com/forms/upload/MEPC.1-Circ.834%20-
%20Consolidated%20Guidance%20For%20Port%20Reception%20Facility%20Provid
ers%20And%20Users%20(Secretariat).pdf [Accessed 28 June 2016].
IMO, 2016. MARPOL Annex I – Prevention of Pollution by Oil. [Online]
Available at:
http://www.imo.org/en/OurWork/Environment/PollutionPrevention/OilPolluti
on/Pages/Default.aspx [Accessed 21 June 2016].
Lloyd's Register, 2008. IMO MEPC 58 Report : Lloyd's Register report on the
58th session of IMO Marine Environment Protection Agency, London: Lloyd's Register.
Maersk Line, 2015. Collected data on garbage and sludge generation, Presentation to the ESSF subgroup on PRF, s.l.: Maersk Line.
Marineinsight, 2016. Marineinsight. [Online]
Available at: http://www.marineinsight.com/ [Accessed 2016].
69 January 2017 7.I85 – The Management of Ship-Generated Waste On-board Ships
MEPC, 2006. Resolution MEPC.157(55) Adopted on 13 October 2006 :
Recommendation on Standards for the Rate of Discharge of Untreated Sewage from Ships, London: The Marine Environment Protection Committee.
MEPC, 2007. Prevention of Air Pollution from Ships : Washwater Discharge
Criteria for Exhaust Gas-SOx Cleaning Systems, MEPC 56/INF5, London: IMO, Marine Environmental Protection Committee (MEPC).
MEPC, 2011a. ANNEX 12: Resolution MEPC.200(62), Adopted on 15 July 2011 :
Amendments to the annex of the protocol of 1978 relating to the
international convention for the prevention of pollution from ships, 1973. MEPC 62/24, London: The Marine Environment Protection Committee (MEPC).
MEPC, 2011. ANNEX 12: Resolution MEPC.200(62), Adopted on 15 July 2011 :
Amendments to the annex of the protocol of 1978 relating to the
international convention for the prevention of pollution from ships, 1973. MEPC 62/24, London: The Marine Environment Protection Committee (MEPC).
MEPC, 2011. Resolution MEPC 201(62) adopted on 15 July 2011 : Amendments
to the Annex of the Protocol of 1978 relating to the International Convention
for the prevention of pollution from ships, 1973 (Revised MARPOL Annex V), London: International Maritime Organization (IMO).
MEPC, 2012. Annex 24: Resolution MEPC.219(63) : Guidlines for the
Implementation of MARPOL Annex V. [Online]
Available at:
www.imo.org/en/OurWork/environment/pollutionprevention/garbage/docum
ents/219(63).pdf [Accessed 27 June 2016].
MEPC, 2014. Resolution MEPC.244(66) Adopted on 4 April 2014 : The 2014
Standard specification for shipboard incinerators, London: The Marine Environment Protection Committee (MEPC).
MEPC, 2015. Report of the Marine Environment Protection Committee on its
sixty-eight Session, MEPC 68/21, London: International Maritime Organization (IMO), Marine Environment Protection Committee (MEPC).
MEPC, 2016. ANNEX 9 (Adopted on 22 April 2016) : Amendments to the Annex
of the International Convention for the Prevention of Pollution from Ships,
1973, as modified by the Protocol of 1978 relating thereto Amendments to
MARPOL Annex IV, Resulution MEPC.274(69), London: The Marine Environment protection Committee (MEPC).
MMPA, 2012. Ship-generated waste management plan at the maritime port of
Dudinka. , Dudinka: Murmansk Maritime Port Administration (MMPA), Dudinskiy Branche.
Mohammed, J., Torres, R. & Obenshain, E., 1998. Waste Reduction at Sea :
Pollution prevention Strategies on Miami-Based Cruise Lines, Ann Arbor:
National Pollution Prevention Center for Higher Education, University of Michigan.
NEA; PM Group, 2009. Annex 2 : Ship Generated Waste Analysis, Zoetermeer: NEA.

70 January 2017 7.I85 – The Management of Ship-Generated Waste On-board Ships
Netherlands Maritime Technology, 2016. Sustainable Maritime Solutions :
Waste. [Online]
Available at: http://sustainable-maritime-solutions.nl/waste/ [Accessed 2016].
OCNMS, 2011. Final Management Plan and Environmental Assessment, Port Angeles: Olympic Coast National Marine Santuary (OCNMS).
OVAM, 2014. Assessment on how far the current Basel Convention technical
guidelines cover wastes covered by the MARPOL Convention, Mechelen (Belgium): OVAM/Public Waste Agency of Flanders.
Palabıyık, H., 2003. Waste Management Planning for Ship Generated Waste. Journal of Naval Science and Engineering, 1(2), pp. 151-159.
Ramboll, 2012. EMSA Study on the Delivery of Ship-generated Waste and Cargo
Residues to Port Reception Facilities in EU Ports, Final report, Copenhagen: Ramboll.
RBP, 2014. Ship-generated Waste Management Plan of the Freeport of Riga, Riga: The Freeport of Riga Authority (RBP).
TEN ECOPORT, 2014. Common Action Plan for ship-generated waste Ports of
Bari and Durres, s.l.: Transnational ENhancement of ECOPORT8 network (TEN ECOPORT).
Tidy Planet, 2015. Marine Food Waste Management. [Online]
Available at: http://www.tidyplanet.co.uk/who-we-work-with/case-
studies/marine-food-waste-management/ [Accessed 2016].
World Bank Group, 2016. Introduction to Wastwater Treatment Processes.
[Online]
Available at: http://water.worldbank.org/shw-resource-
guide/infrastructure/menu-technical-options/wastewater-treatment [Accessed 2016].

71 January 2017 7.I85 – The Management of Ship-Generated Waste On-board Ships
Annex B Overview interviews and audits
Table 19 Data availability per type of ship
Type of vessel Ship audit (interview +
ORB/GRB)
Interview including ORB/
GRB
Interview without
ORB/GRB
A. General cargo vessel X
B. Chemical tanker/ oil tanker X
C. General cargo vessel X
D. Dry bulk carrier X
E. Chemical tanker X
F. Oil tanker X
G. Bulk carrier X
H. Oil tanker X
I. Ferry/Ro-Ro X
J. Container/gas carrier X
K. Container vessel X
L. Container vessel X
M. Roro/Ropax X
N. Container/bulk carrier X
O. Container/oil tanker X
P. Ferry X
Q. Fishing vessel X
R. Cargo vessel/oil tanker X
S. Car carrier/oil tanker X
T. Cargo ship X
U. Container ship X
V. Passenger vessel X
W. Yacht X
X. Yacht X
Sum 13 11
Table 20 Data availability per type of waste
Type of vessel
Oily b
ilge w
ate
r
Oily r
esi
du
es
(slu
dge)
Oily t
an
k w
ash
ings
Oily b
allast
wate
r
Scale
& s
ludge tan
k
cle
an
ing
Sew
age
Pla
stic
s
Food w
ast
es
Dom
est
ic w
ast
es
Cookin
g o
il
Incin
era
tion
ash
es
Opera
tion
al w
ast
es
Carg
o r
esi
du
es
An
imal c
arc
ass
es
Fis
hin
g g
ear
Ozon
e d
eple
tin
g
subst
an
ces
A. General cargo vessel X X X X X X
B. Chemical tanker/oil
tanker
C. General cargo vessel X X X X X X X
D. Dry bulk carrier X X X X X X X X X X
E. Chemical tanker X X X X X X X X X X
F. Oil tanker X X X X X X X X X X X
G. Bulk carrier X X X X X X X X X
H. Oil tanker X X X X X X X X
I. Ferry/Ro-Ro X X X X X X X X X

72 January 2017 7.I85 – The Management of Ship-Generated Waste On-board Ships
Type of vessel
Oily b
ilge w
ate
r
Oily r
esi
du
es
(slu
dge)
Oily t
an
k w
ash
ings
Oily b
allast
wate
r
Scale
& s
ludge tan
k
cle
an
ing
Sew
age
Pla
stic
s
Food w
ast
es
Dom
est
ic w
ast
es
Cookin
g o
il
Incin
era
tion
ash
es
Opera
tion
al w
ast
es
Carg
o r
esi
du
es
An
imal c
arc
ass
es
Fis
hin
g g
ear
Ozon
e d
eple
tin
g
subst
an
ces
J. Container/gas
carrier
K. Container vessel X X X
L. Container vessel
M. Roro/Ropax X X X X X X X
N. Container/bulk
carrier
X X X X X X X X X
O. Container/oil tanker X X X X X X X
P. Ferry X X X X X X X
Q. Fishing vessel X X X X
R. Cargo vessel/oil
tanker
X X X X
S. Car carrier/oil
tanker
X X
T. Cargo ship X X
U. Container ship X X
V. Passenger vessel X X X X X X X X X
W. Yacht X
X. Yacht

73 January 2017 7.I85 – The Management of Ship-Generated Waste On-board Ships
Annex C Results online survey
CE Delft-EMSA study on Ship-generated Waste
1. What type of ship-generated waste is applicable in your case? (possible to select more than one)
Answer
Answer Total % of answers %
Oily bilge water 14
82
Oily residues (sludge) 14
82
Oily tank washings 4
24
Sewage 14
82
Plastics 13
76
Food wastes 12
71
Domestic wastes 12
71
Cooking oil 10
59
Incineration ashes 4
24
Operational wastes 7
41
Cargo residues 8
47
Total number of respondents: 17
Skipped question: 0
0% 20% 40% 60% 80%

74 January 2017 7.I85 – The Management of Ship-Generated Waste On-board Ships
The following questions are about oily bilge water (MARPOL ANNEX I).
The information available to us shows that the waste flow diagram of oily bilge water looks as follows:
Oily bilge water is collected in a holding tank and either disposed of directly to a port reception facility
or, more often, treated in an oil/water separator. These separators are equipped with outlet valves
that open as long as the oil content of 15 ppm or less. The clean water is either discharged to sea or
kept in another holding tank. The oil fraction from the oil/water separator is either fed into a waste oil or sludge tank and treated as such, or directly transferred to a port reception facility.
2. In your opinion, does the waste flow diagram contain all relevant routes for the management of oily bilge water?
Answer Total % of answers %
Yes 12
86
No 2
14
I do not know 0
0
Total number of respondents: 14
Skipped question: 3
0% 20% 40% 60% 80%
3. What are other ways to manage oily bilge water in your opinion (please specify and if possible, provide links to documents, websites or other information sources)?
Answer Total % van Total number of
respondents %
Open Answer 14
82
Total number of respondents: 14
Skipped question: 3
0% 20% 40% 60% 80%
4. We assume that the amount of oily bilge water generated per day varies from 0.01 to 13 m3 and that the quantity cannot be related to either fuel use or distance sailed. Do you agree with these numbers?
Answer Total % of answers %
Yes 10
71
No 2
14
I do not know 2
14
Total number of respondents: 14
Skipped question: 3
0% 20% 40% 60% 80%

75 January 2017 7.I85 – The Management of Ship-Generated Waste On-board Ships
5. What are your estimates for the amount of oily bilge water generated per day (please specify and if possible, provide links to documents, websites or other information sources)?
Answer Total % van Total number of
respondents %
Open Answer 14
82
Total number of respondents: 14
Skipped question: 3
0% 20% 40% 60% 80%
The following questions are about oily residues (sludge) (MARPOL ANNEX I). The information available to
us shows that the waste flow diagram of oily residues (sludge) looks as follows: Sludge is generally
collected in a sludge tank, a waste fuel tank, a waste oil tank or a lube oil or fuel oil drain tank. It may
be transferred directly from the tank to a port reception facility. In other cases, the quantity is
reduced in an evaporator which evaporates water from the sludge. It can also be incinerated on-board, in which case the incinerator ashes are delivered to the port reception facility.
6. In your opinion, does the waste flow diagram contain all relevant routes for the management of oily residues?
Answer Total % of answers %
Yes 6
43
No 4
29
I do not know 4
29
Total number of respondents: 14
Skipped question: 3
0% 20% 40% 60% 80%
7. What are other ways to manage oily residues in your opinion (please specify and if possible, provide links to documents, websites or other information sources)?
Answer Total % van Total number of
respondents %
Open Answer 14
82
Total number of respondents: 14
Skipped question: 3
0% 20% 40% 60% 80%

76 January 2017 7.I85 – The Management of Ship-Generated Waste On-board Ships
8. Do you agree that the amount of fuel consumed and the type of fuel are the most important drivers for the amount of sludge generated on-board?
Answer Total % of answers %
Yes 9
64
No 2
14
I do not know 3
21
Total number of respondents: 14
Skipped question: 3
0% 20% 40% 60% 80%
9. We assume that the amount of oily residues generated per day per tonne of HFO varies from 0.0002 to 0.05 m3. Do you agree with these numbers?
Answer Total % of answers %
Yes 4
29
No 5
36
I do not know 5
36
Total number of respondents: 14
Skipped question: 3
0% 20% 40% 60% 80%
10. We assume that the amount of oily residues generated per day per tonne of MGO varies from 0.001 to 0.3 m3. Do you agree with these numbers?
Answer Total % of answers %
Yes 4
29
No 6
43
I do not know 4
29
Total number of respondents: 14
Skipped question: 3
0% 20% 40% 60% 80%

77 January 2017 7.I85 – The Management of Ship-Generated Waste On-board Ships
11. What are your estimations for the amount of oily residues generated per day and per tonne of fuel (please specify and if possible, provide links to documents, websites or other information sources)?
Answer Total % van Total number of
respondents %
Open Answer 14
82
Total number of respondents: 14
Skipped question: 3
0% 20% 40% 60% 80%
12. Our information indicates that the amount of sludge that is heated can be reduced up to 60% by using an evaporator. Do you agree with this estimate?
-
Answer Total % of answers %
Yes 3
21
No 1
7
I do not know 10
71
Total number of respondents: 14
Skipped question: 3
0% 20% 40% 60% 80%
13. If you disagree on the information on sludge reduction from using an evaporator, could you provide some additional information?
Answer Total % van Total number of
respondents %
Open Answer 4
24
Total number of respondents: 4
Skipped question: 13
0% 20% 40% 60% 80%
14. Our information indicates that the amount of sludge can be reduced up to 99% by using an incinerator. Do you agree with this estimate?
Answer Total % of answers %
Yes 5
36
No 1
7
I do not know 8
57
Total number of respondents: 14
Skipped question: 3
0% 20% 40% 60% 80%

78 January 2017 7.I85 – The Management of Ship-Generated Waste On-board Ships
15. If you disagree with the information on sludge reduction from using an incineration, could you provide some additional information?
Answer Total % of Total number of respondents %
Open Answer 3
18
Total number of respondents: 3
Skipped question: 14
0% 20% 40% 60% 80%
The following questions are about oily tank washings (MARPOL ANNEX I).
The information available to us shows that the waste flow diagram of oily tank washings looks as
follows: Oily tank washings are collected in holding tanks. In some cases, the tank holdings are allowed
to settle and the water fraction is discharged to sea, while the oily fraction is delivered to a waste reception facility. In other cases, the entire contents of the tank are delivered in port.
16. In your opinion, does the waste flow diagram contain all relevant routes for the management of oily tank washings?
Answer Total % of answers %
Yes 3
75
No 1
25
I do not know 0
0
Total number of respondents: 4
Skipped question: 13
0% 20% 40% 60% 80%
17. What are other ways to manage oily tank washings in your opinion (please specify and if possible, provide links to documents, websites or other information sources)?
Answer Total % van Total number of
respondents %
Open Answer 4
24
Total number of respondents: 4
Skipped question: 13
0% 20% 40% 60% 80%
18. We assume that the amount of waste generated per tank washing varies from 1 to 2 m3. Do you agree with these numbers?
Answer Total % of answers %
Yes 0
0
No 3
75
I do not know 1
25
Total number of respondents: 4
Skipped question: 13
0% 20% 40% 60% 80%

79 January 2017 7.I85 – The Management of Ship-Generated Waste On-board Ships
19. What are your estimations for the amount of oily tank washings generated per day and per tank washing (please specify and if possible, provide links to documents, websites or other information sources)?
Answer Total % van Total number of
respondents %
Open Answer 4
24
Total number of respondents: 4
Skipped question: 13
0% 20% 40% 60% 80%
The following questions are about sewage (MARPOL ANNEX IV).
The information available to us shows that the waste flow diagram of sewage looks as follows: Most
ships have a sewage treatment plant in which the black water is treated. The effluent of the sewage
treatment plant is either discharged directly to the sea or kept in a holding tank. Ships that do not have
a sewage treatment plant collect the black water in a holding tank. The holding tank is sometimes also
used to collect grey water and/or galley water. From the holding tank, it can be either discharged to
sea or, in especially sensitive sea areas such as the Baltic, delivered at port reception facilities. The latter is only compulsory for passenger ships.
20. In your opinion, does the waste flow diagram contain all relevant routes for the management of sewage?
Answer Total % of answers %
Yes 8
57
No 4
29
I do not know 2
14
Total number of respondents: 14
Skipped question: 2
0% 20% 40% 60% 80%
21. What are other ways to manage sewage in your opinion (please specify and if possible, provide links to documents, websites or other information sources)?
Answer Total % van Total number of
respondents %
Open Answer 14
82
Total number of respondents: 14
Skipped question: 2
0% 20% 40% 60% 80%

80 January 2017 7.I85 – The Management of Ship-Generated Waste On-board Ships
22. We assume that the amount of sewage generated per person per day varies from 0.04 to 0.26 m3. Do you agree with these numbers?
Answer Total % of answers %
Yes 6
43
No 2
14
I do not know 6
43
Total number of respondents: 14
Skipped question: 2
0% 20% 40% 60% 80%
23. What are your estimations for the amount of sewage generated per person per day (please specify and if possible, provide links to documents, websites or other information sources)?
Answer Total % van Total number of
respondents %
Open Answer 14
82
Total number of respondents: 14
Skipped question: 2
0% 20% 40% 60% 80%
The following questions are about plastics (MARPOL ANNEX V).
The information available to us shows that the waste flow diagram of plastics looks as follows: Plastics
are generated by hoteling and cargo handling. Plastics are collected in bags or bins. Sometimes clean
and dirty plastics are collected separately, especially when they are to be delivered to a port reception
facility. Dirty plastics are sometimes kept separate and added to the food waste. Plastics are
sometimes incinerated when the ship incinerator is certified for this use. However, since not all plastics
can be incinerated safely and not all crews have the expertise to separate different types of plastics,
ships may choose not to incinerate plastics even when they have an on-board incinerator. Because not all plastics are fit for incineration, the amount of plastic waste is almost never reduced to zero.
24. In your opinion, does the waste flow diagram contain all relevant routes for the management of plastics?
Answer Total % of answers %
Yes 7
54
No 5
38
I do not know 1
8
Total number of respondents: 13
Skipped question: 2
0% 20% 40% 60% 80%
25. What are other ways to manage plastics in your opinion (please specify and if possible, provide links to documents, websites or other information sources)?
Answer Total % van Total number of
respondents %
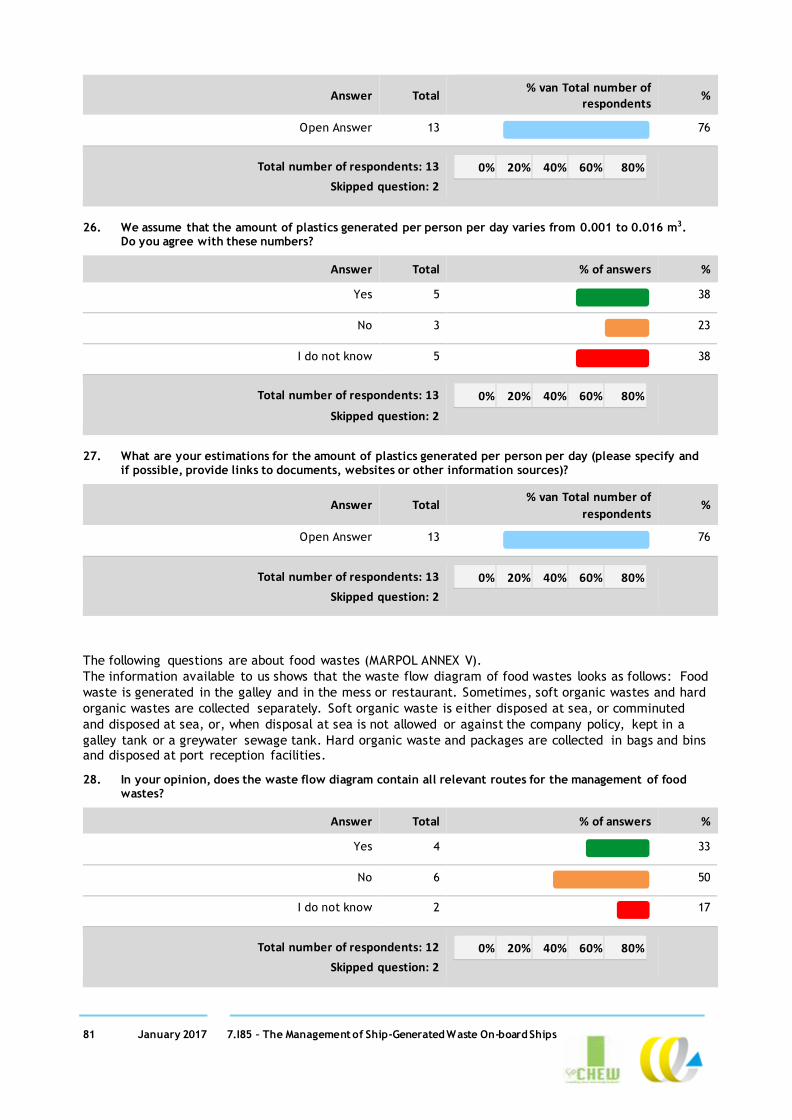
81 January 2017 7.I85 – The Management of Ship-Generated Waste On-board Ships
Answer Total % van Total number of
respondents %
Open Answer 13
76
Total number of respondents: 13
Skipped question: 2
0% 20% 40% 60% 80%
26. We assume that the amount of plastics generated per person per day varies from 0.001 to 0.016 m3. Do you agree with these numbers?
Answer Total % of answers %
Yes 5
38
No 3
23
I do not know 5
38
Total number of respondents: 13
Skipped question: 2
0% 20% 40% 60% 80%
27. What are your estimations for the amount of plastics generated per person per day (please specify and if possible, provide links to documents, websites or other information sources)?
Answer Total % van Total number of
respondents %
Open Answer 13
76
Total number of respondents: 13
Skipped question: 2
0% 20% 40% 60% 80%
The following questions are about food wastes (MARPOL ANNEX V).
The information available to us shows that the waste flow diagram of food wastes looks as follows: Food
waste is generated in the galley and in the mess or restaurant. Sometimes, soft organic wastes and hard
organic wastes are collected separately. Soft organic waste is either disposed at sea, or comminuted
and disposed at sea, or, when disposal at sea is not allowed or against the company policy, kept in a
galley tank or a greywater sewage tank. Hard organic waste and packages are collected in bags and bins and disposed at port reception facilities.
28. In your opinion, does the waste flow diagram contain all relevant routes for the management of food wastes?
Answer Total % of answers %
Yes 4
33
No 6
50
I do not know 2
17
Total number of respondents: 12
Skipped question: 2
0% 20% 40% 60% 80%

82 January 2017 7.I85 – The Management of Ship-Generated Waste On-board Ships
29. What are other ways to manage food waste in your opinion (please specify and if possible, provide links to documents, websites or other information sources)?
Answer Total % van Total number of
respondents %
Open Answer 12
71
Total number of respondents: 12
Skipped question: 2
0% 20% 40% 60% 80%
30. We assume that the amount of food waste generated per person per day varies from 0.01 to 0.016 m3. Do you agree with these numbers?
Answer Total % of answers %
Yes 4
33
No 3
25
I do not know 5
42
Total number of respondents: 12
Skipped question: 2
0% 20% 40% 60% 80%
31. What are your estimations for the amount of food wastes generated per person per day (please specify and if possible, provide links to documents, websites or other information sources)?
Answer Total % van Total number of
respondents %
Open Answer 12
71
Total number of respondents: 12
Skipped question: 2
0% 20% 40% 60% 80%
The following questions are about domestic wastes (MARPOL ANNEX V).
The information available to us shows that the waste flow diagram of domestic wastes looks as follows:
After collection, domestic waste is sometimes compacted or crushed and stored in bags or bins.
Sometimes, it is directly disposed in a port reception facility, and sometimes it is incinerated on-board and the ashes disposed of in port.
32. In your opinion, does the waste flow diagram contain all relevant routes for the management of domestic wastes?
Answer Total % of answers %
Yes 9
75
No 2
17
I do not know 1
8
Total number of respondents: 12 0% 20% 40% 60% 80%

83 January 2017 7.I85 – The Management of Ship-Generated Waste On-board Ships
Answer Total % of answers %
Skipped question: 1
33. What are other ways to manage domestic wastes in your opinion (please specify and if possible, provide links to documents, websites or other information sources)?
Answer Total % van Total number of
respondents %
Open Answer 12
71
Total number of respondents: 12
Skipped question: 1
0% 20% 40% 60% 80%
34. We assume that the amount of domestic waste generated per person per day varies from 0.001 to 0.02 m3. Do you agree with these numbers?
Answer Total % of answers %
Yes 8
67
No 0
0
I do not know 4
33
Total number of respondents: 12
Skipped question: 1
0% 20% 40% 60% 80%
35. What are your estimations for the amount of domestic wastes generated per person per day (please specify and if possible, provide links to documents, websites or other information sources)?
Answer Total % van Total number of
respondents %
Open Answer 12
71
Total number of respondents: 12
Skipped question: 1
0% 20% 40% 60% 80%

84 January 2017 7.I85 – The Management of Ship-Generated Waste On-board Ships
The following questions are about cooking oil (MARPOL ANNEX V).
The information available to us shows that the waste flow diagram of cooking oil looks as follows:
Generally, cooking oil is generated during food preparation, stored into a container and disposed at a
port reception facility. On some ships, it used to be customary to mix the cooking oil with sludge and
treat it as sludge. While MEPC 68 (May 2015) decided that this was not in line with MARPOL Annex V, it is still customary on some ships (MEPC 68/21 paragraph 12.14).
36. In your opinion, does the waste flow diagram contain all relevant routes for the management of cooking oil?
Answer Total % of answers %
Yes 7
70
No 2
20
I do not know 1
10
Total number of respondents: 10
Skipped question: 3
0% 20% 40% 60% 80%
37. What are other ways to manage cooking oil in your opinion (please specify and if possible, provide links to documents, websites or other information sources)?
Answer Total % van Total number of
respondents %
Open Answer 10
59
Total number of respondents: 10
Skipped question: 3
0% 20% 40% 60% 80%
38. We assume that the amount of cooking oil generated per day per person varies from 0.01 to 0.016 m3. Do you agree with these numbers?
Answer Total % of answers %
Yes 3
30
No 3
30
I do not know 4
40
Total number of respondents: 10
Skipped question: 3
0% 20% 40% 60% 80%

85 January 2017 7.I85 – The Management of Ship-Generated Waste On-board Ships
39. What are your estimations for the amount of cooking oil generated per person per day (please specify and if possible, provide links to documents, websites or other information sources) ?
(Iedere respondent kon één enkel open Answer van maximum 2000 tekens ingeven.)
Answer Total % van Total number of
respondents %
Open Answer 10
59
Total number of respondents: 10
Skipped question: 3
0% 20% 40% 60% 80%
The following questions are about incineration ashes (MARPOL ANNEX V).
The information available to us shows that the waste flow diagram of incineration ashes looks as
follows: Ashes are generated in the incinerator, collected in bags and disposed of at a port reception facility.
40. In your opinion, does the waste flow diagram contain all relevant routes for the management of incineration ashes?
Answer Total % of answers %
Yes 3
75
No 0
0
I do not know 1
25
Total number of respondents: 4
Skipped question: 6
0% 20% 40% 60% 80%
41. What are other ways to manage incineration ashes in your opinion (please specify and if possible, provide links to documents, websites or other information sources)?
Answer Total % van Total number of
respondents %
Open Answer 4
24
Total number of respondents: 4
Skipped question: 6
0% 20% 40% 60% 80%

86 January 2017 7.I85 – The Management of Ship-Generated Waste On-board Ships
42. We assume that the amount of incineration ashes generated is 1-2% the amount of waste that is incinerated. Do you agree with these numbers?
Answer Total % of answers %
Yes 1
25
No 1
25
I do not know 2
50
Total number of respondents: 4
Skipped question: 6
0% 20% 40% 60% 80%
43. What are your estimations for the amount of incineration ashes generated per month (please specify and if possible, provide links to documents, websites or other information sources)?
Answer Total % van Total number of
respondents %
Open Answer 4
24
Total number of respondents: 4
Skipped question: 6
0% 20% 40% 60% 80%
The following questions are about operational wastes (MARPOL ANNEX V).
The information available to us shows that the waste flow diagram of operational wastes looks as
follows: Operational waste, however defined, is collected and stored. In some cases it is incinerated, in other cases it is disposed of in port reception facilities.
44. Our information indicates that the definition of operational wastes varies considerably. Which of the following do you consider operational wastes?
Answer Total % of answers %
Waste generated during cargo handling (pallets, plastic packages, etc.)
0
0
Wastes emanating from the operation of a ship (empty paint cans, worn ropes, etc.)
3
43
Domestic wastes not elsewhere classified (fluorescent tubes, …)
0
0
All wastes not elsewhere classified. 4
57
Other, please specify 0
0
Total number of respondents: 7
Skipped question: 3
0% 20% 40% 60% 80%

87 January 2017 7.I85 – The Management of Ship-Generated Waste On-board Ships
45. In your opinion, does the waste flow diagram contain all relevant routes for the management of operational wastes?
Answer Total % of answers %
Yes 3
43
No 4
57
I do not know 0
0
Total number of respondents: 7
Skipped question: 3
0% 20% 40% 60% 80%
46. What are other ways to manage operational wastes in your opinion (please specify and if possible, provide links to documents, websites or other information sources)?
Answer Total % van Total number of
respondents %
Open Answer 7
41
Total number of respondents: 7
Skipped question: 3
0% 20% 40% 60% 80%
47. We assume that the amount of operational wastes generated per person per day varies from 0.001 to 0.1 m3. Do you agree with these numbers?
Answer Total % of answers %
Yes 4
57
No 1
14
I do not know 2
29
Total number of respondents: 7
Skipped question: 3
0% 20% 40% 60% 80%
48. What are your estimations for the amount of operational wastes generated per person per day (please specify and if possible, provide links to documents, websites or other information sources) ?
Answer Total % van Total number of
respondents %
Open Answer 7
41
Total number of respondents: 7
Skipped question: 3
0% 20% 40% 60% 80%
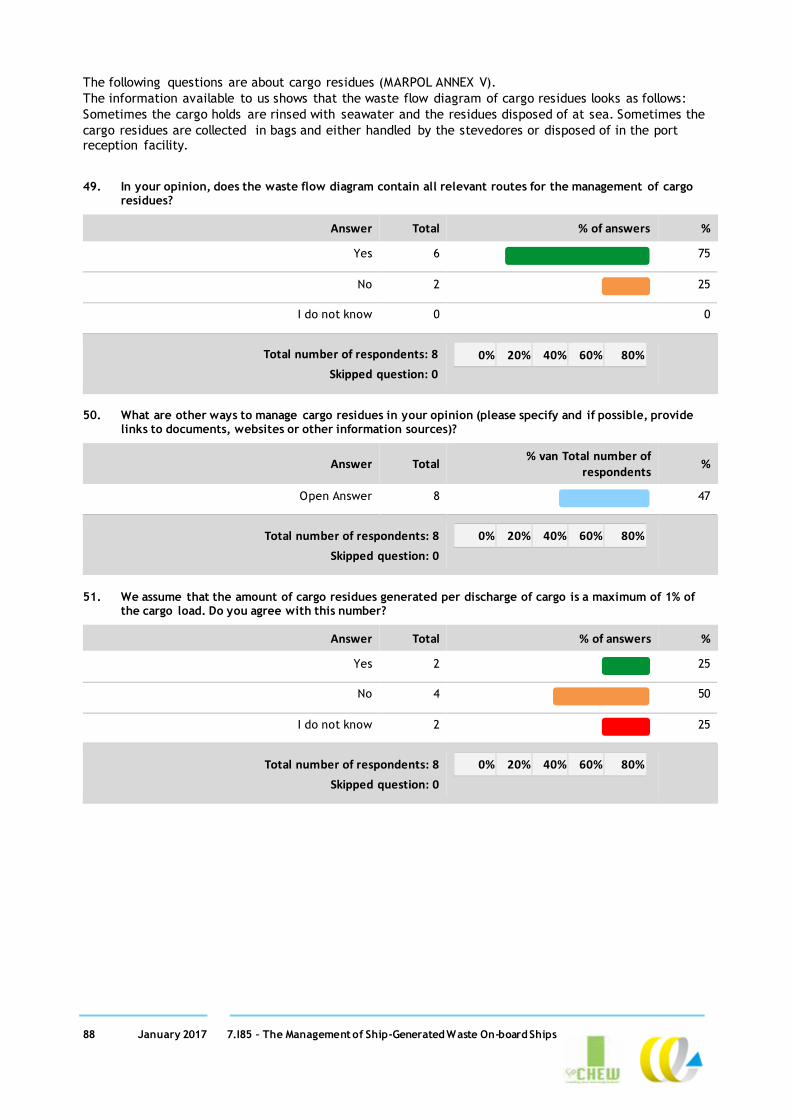
88 January 2017 7.I85 – The Management of Ship-Generated Waste On-board Ships
The following questions are about cargo residues (MARPOL ANNEX V).
The information available to us shows that the waste flow diagram of cargo residues looks as follows:
Sometimes the cargo holds are rinsed with seawater and the residues disposed of at sea. Sometimes the
cargo residues are collected in bags and either handled by the stevedores or disposed of in the port reception facility.
49. In your opinion, does the waste flow diagram contain all relevant routes for the management of cargo residues?
Answer Total % of answers %
Yes 6
75
No 2
25
I do not know 0
0
Total number of respondents: 8
Skipped question: 0
0% 20% 40% 60% 80%
50. What are other ways to manage cargo residues in your opinion (please specify and if possible, provide links to documents, websites or other information sources)?
Answer Total % van Total number of
respondents %
Open Answer 8
47
Total number of respondents: 8
Skipped question: 0
0% 20% 40% 60% 80%
51. We assume that the amount of cargo residues generated per discharge of cargo is a maximum of 1% of the cargo load. Do you agree with this number?
Answer Total % of answers %
Yes 2
25
No 4
50
I do not know 2
25
Total number of respondents: 8
Skipped question: 0
0% 20% 40% 60% 80%

89 January 2017 7.I85 – The Management of Ship-Generated Waste On-board Ships
52. What are your estimations for the amount of cargo residues generated per cargo discharge (please specify and if possible, provide links to documents, websites or other information sources)?
Answer Total % van Total number of
respondents %
Open Answer 8
47
Total number of respondents: 8
Skipped question: 0
0% 20% 40% 60% 80%