The Magruder Plots A Century of Wheat Research in Oklahoma
23
The Magruder Plots A Century of Wheat Research in Oklahoma A.C. Magruder A.C. Magruder 1867-1924 1867-1924 Horace J. Harper Horace J. Harper 1895-1963 1895-1963 Robert L. Westerman Robert L. Westerman Oklahoma State University Oklahoma State University
-
Upload
esteban-ivarra -
Category
Documents
-
view
33 -
download
2
description
The Magruder Plots A Century of Wheat Research in Oklahoma. A.C. Magruder 1867-1924. Horace J. Harper 1895-1963. Robert L. Westerman Oklahoma State University. P. Check. NPK. 1920-1930. 100’. 10’. (6) Nitrogen, Phosphorus, Potash and Lime 60-30-30+Lime. - PowerPoint PPT Presentation
Transcript of The Magruder Plots A Century of Wheat Research in Oklahoma

The Magruder PlotsA Century of Wheat
Research in Oklahoma
The Magruder PlotsA Century of Wheat
Research in OklahomaA.C. MagruderA.C. Magruder
1867-19241867-1924
Horace J. HarperHorace J. Harper1895-19631895-1963
Robert L. WestermanRobert L. WestermanOklahoma State UniversityOklahoma State University

1920-19301920-1930
CheckCheckPP NPKNPK

(6) Nitrogen, Phosphorus, Potash and Lime 60-30-30+Lime(6) Nitrogen, Phosphorus, Potash and Lime 60-30-30+Lime
(5) Nitrogen, Phosphorus and Potash 60-30-30(5) Nitrogen, Phosphorus and Potash 60-30-30
(4) Nitrogen and Phosphorus 60-30-0(4) Nitrogen and Phosphorus 60-30-0
(3) Phosphorus 0-30-0(3) Phosphorus 0-30-0
(2) Check(2) Check
(1) Manure every four years at 240 lbs N/ac(1) Manure every four years at 240 lbs N/ac
10’10’100’100’
125’125’ Magruder Plots1947-presentStillwater ExperimentStation
Magruder Plots1947-presentStillwater ExperimentStation

TreatmentsTreatments
ManureManure 1892, 240 lb N/ac every 4 yr 1892, 240 lb N/ac every 4 yr CheckCheck 1892, no nutrients applied 1892, no nutrients applied PP 1929, 30 lb P 1929, 30 lb P22OO55/ac/yr/ac/yr
NPNP 1929, 60 lb N and 30 lb P 1929, 60 lb N and 30 lb P22OO55/ac/yr, /ac/yr,
NPKNPK 1929, 60 lb N, 30 lb P 1929, 60 lb N, 30 lb P22OO55 and 30 lb and 30 lb KK22O/ac/yrO/ac/yr
NPKLNPKL 1929, 60 lb N, 30 lb P 1929, 60 lb N, 30 lb P22OO55 , 30 lb K , 30 lb K22O/ac/yr O/ac/yr and lime (1954)and lime (1954)
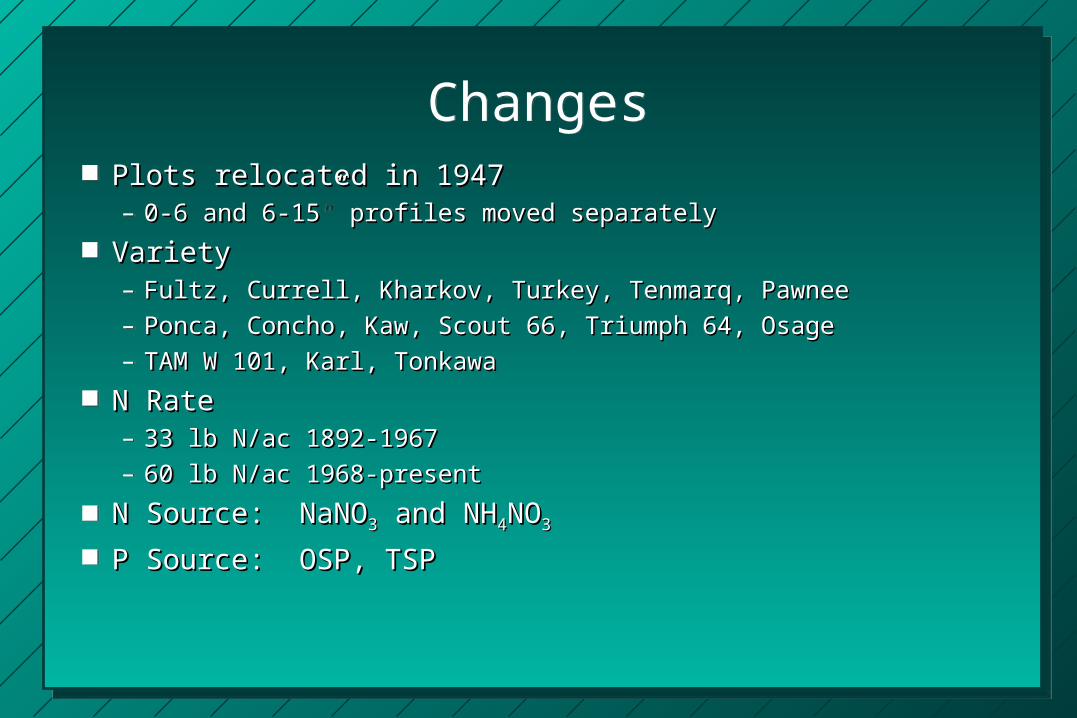
ChangesChanges Plots relocated in 1947 Plots relocated in 1947
– 0-6 and 6-15” profiles moved separately0-6 and 6-15” profiles moved separately VarietyVariety
– Fultz, Currell, Kharkov, Turkey, Tenmarq, PawneeFultz, Currell, Kharkov, Turkey, Tenmarq, Pawnee– Ponca, Concho, Kaw, Scout 66, Triumph 64, OsagePonca, Concho, Kaw, Scout 66, Triumph 64, Osage– TAM W 101, Karl, TonkawaTAM W 101, Karl, Tonkawa
N RateN Rate– 33 lb N/ac 1892-196733 lb N/ac 1892-1967– 60 lb N/ac 1968-present60 lb N/ac 1968-present
N Source: NaNON Source: NaNO33 and NH and NH44NONO33
P Source: OSP, TSPP Source: OSP, TSP
Plots relocated in 1947 Plots relocated in 1947 – 0-6 and 6-15” profiles moved separately0-6 and 6-15” profiles moved separately
VarietyVariety– Fultz, Currell, Kharkov, Turkey, Tenmarq, PawneeFultz, Currell, Kharkov, Turkey, Tenmarq, Pawnee– Ponca, Concho, Kaw, Scout 66, Triumph 64, OsagePonca, Concho, Kaw, Scout 66, Triumph 64, Osage– TAM W 101, Karl, TonkawaTAM W 101, Karl, Tonkawa
N RateN Rate– 33 lb N/ac 1892-196733 lb N/ac 1892-1967– 60 lb N/ac 1968-present60 lb N/ac 1968-present
N Source: NaNON Source: NaNO33 and NH and NH44NONO33
P Source: OSP, TSPP Source: OSP, TSP
1930
-193
7
1930
-193
7
1930
-193
7
1938
-194
7
1938
-194
7
1938
-194
7
1948
-195
7
1948
-195
7
1948
-195
7
1958
-196
7
1958
-196
7
1958
-196
7
1968
-197
7
1968
-197
7
1968
-197
7
1978
-198
7
1978
-198
7
1978
-198
7
1988
-199
4
1988
-199
4
1988
-199
4000
202020
404040
606060
808080
100100100
NNN
PPP
KKK
Re
liab
ility
Re
liab
ility
Re
liab
ility
1930
-193
7
1930
-193
7
1930
-193
7
1938
-194
7
1938
-194
7
1938
-194
7
1948
-195
7
1948
-195
7
1948
-195
7
1958
-196
7
1958
-196
7
1958
-196
7
1968
-197
7
1968
-197
7
1968
-197
7
1978
-198
7
1978
-198
7
1978
-198
7
1988
-199
4
1988
-199
4
1988
-199
4000
0.20.20.2
0.40.40.4
0.60.60.6
0.80.80.8
111
Eco
no
mic
Rel
iab
ility
Eco
no
mic
Rel
iab
ility
Eco
no
mic
Rel
iab
ility
NNNPPP
KKK

y = -7.59 + 1.40x r = 0.92 y = -7.59 + 1.40x r = 0.92 y = -7.59 + 1.40x r = 0.92 y = -7.59 + 1.40x r = 0.92 y = -7.59 + 1.40x r = 0.92 y = -7.59 + 1.40x r = 0.92
y = 3.97 + 0.51x r = 0.76 y = 3.97 + 0.51x r = 0.76 y = 3.97 + 0.51x r = 0.76 y = 3.97 + 0.51x r = 0.76 y = 3.97 + 0.51x r = 0.76 y = 3.97 + 0.51x r = 0.76
y = 3.03 + 0.57x r = 0.57 y = 3.03 + 0.57x r = 0.57 y = 3.03 + 0.57x r = 0.57 y = 3.03 + 0.57x r = 0.57 y = 3.03 + 0.57x r = 0.57 y = 3.03 + 0.57x r = 0.57
y = -4.06 + 1.28x r = 0.87 y = -4.06 + 1.28x r = 0.87 y = -4.06 + 1.28x r = 0.87 y = -4.06 + 1.28x r = 0.87 y = -4.06 + 1.28x r = 0.87 y = -4.06 + 1.28x r = 0.87
y = 2.73 + 1.07x r = 0.88 y = 2.73 + 1.07x r = 0.88 y = 2.73 + 1.07x r = 0.88 y = 2.73 + 1.07x r = 0.88 y = 2.73 + 1.07x r = 0.88 y = 2.73 + 1.07x r = 0.88
y = 2.89 + 1.13x r = 0.89 y = 2.89 + 1.13x r = 0.89 y = 2.89 + 1.13x r = 0.89 y = 2.89 + 1.13x r = 0.89 y = 2.89 + 1.13x r = 0.89 y = 2.89 + 1.13x r = 0.89
101010101010 202020202020 303030303030 404040404040555555
151515151515
252525252525
353535353535
454545454545
555555555555ManureManureManureManureManureManure
CheckCheckCheckCheckCheckCheck
PPPPPP
NPNPNPNPNPNP
NPKNPKNPKNPKNPKNPK
NPK+LNPK+LNPK+LNPK+LNPK+LNPK+L
Environment mean, bu/acreEnvironment mean, bu/acreEnvironment mean, bu/acreEnvironment mean, bu/acreEnvironment mean, bu/acreEnvironment mean, bu/acre
Gra
in y
ield
, bu
/acr
eG
rain
yie
ld, b
u/a
cre
Gra
in y
ield
, bu
/acr
eG
rain
yie
ld, b
u/a
cre
Gra
in y
ield
, bu
/acr
eG
rain
yie
ld, b
u/a
creStability Analyses
K Response in Stress EnvironmentsStability Analyses
K Response in Stress Environments
-20-20-20
101010
404040
707070
100100100
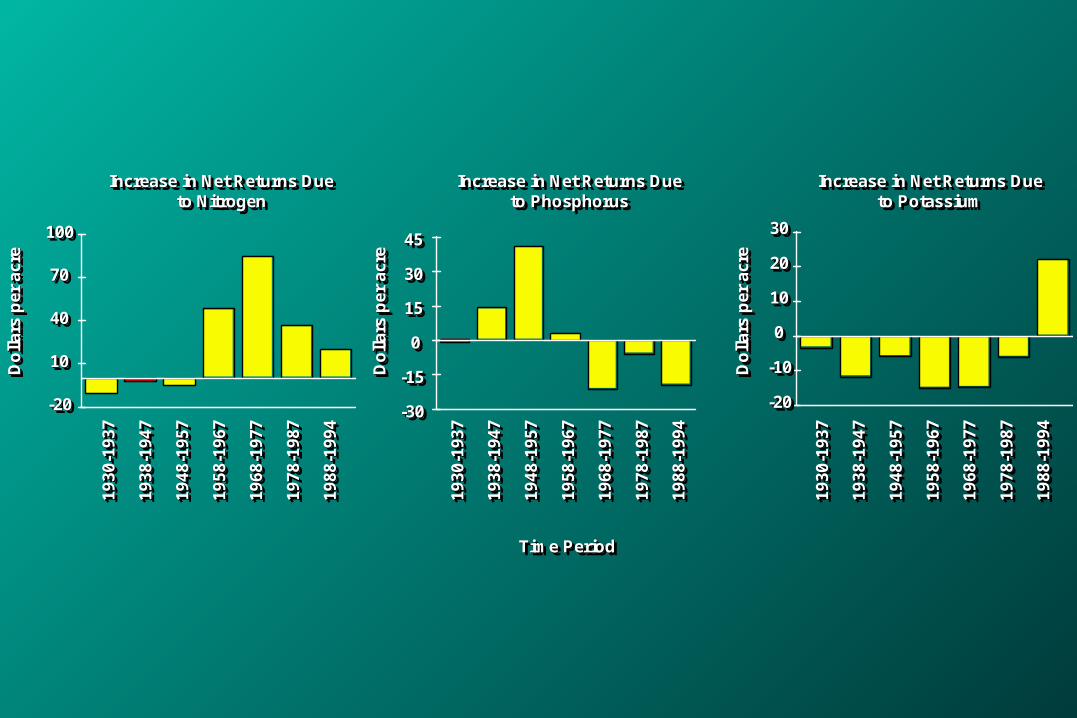
Increase in Net Returns Dueto Nitrogen
Increase in Net Returns DueIncrease in Net Returns Dueto Nitrogento Nitrogen
1930
-193
719
30-1
937
1930
-193
7
1938
-194
719
38-1
947
1938
-194
7
1948
-195
719
48-1
957
1948
-195
7
1958
-196
719
58-1
967
1958
-196
7
1968
-197
719
68-1
977
1968
-197
7
1978
-198
719
78-1
987
1978
-198
7
1988
-199
419
88-1
994
1988
-199
4
-30-30-30
-15-15-15
000
151515
303030
454545
Do
llars
per
acr
eD
olla
rs p
er a
cre
Do
llars
per
acr
e
-20-20-20
-10-10-10
000
101010
202020
303030
Time PeriodTime PeriodTime Period
Do
llars
per
acr
eD
olla
rs p
er a
cre
Do
llars
per
acr
e
Do
llars
per
acr
eD
olla
rs p
er a
cre
Do
llars
per
acr
e
1930
-193
719
30-1
937
1930
-193
7
1938
-194
719
38-1
947
1938
-194
7
1948
-195
719
48-1
957
1948
-195
7
1958
-196
719
58-1
967
1958
-196
7
1968
-197
719
68-1
977
1968
-197
7
1978
-198
719
78-1
987
1978
-198
7
1988
-199
419
88-1
994
1988
-199
4
1930
-193
719
30-1
937
1930
-193
7
1938
-194
719
38-1
947
1938
-194
7
1948
-195
719
48-1
957
1948
-195
7
1958
-196
719
58-1
967
1958
-196
7
1968
-197
719
68-1
977
1968
-197
7
1978
-198
719
78-1
987
1978
-198
7
1988
-199
419
88-1
994
1988
-199
4
Increase in Net Returns Dueto Phosphorus
Increase in Net Returns DueIncrease in Net Returns Dueto Phosphorusto Phosphorus
Increase in Net Returns Dueto Potassium
Increase in Net Returns DueIncrease in Net Returns Dueto Potassiumto Potassium

1930
-193
719
30-1
937
1930
-193
7
1938
-194
719
38-1
947
1938
-194
7
1948
-195
719
48-1
957
1948
-195
7
1958
-196
719
58-1
967
1958
-196
7
1968
-197
719
68-1
977
1968
-197
7
1978
-198
719
78-1
987
1978
-198
7
1988
-199
419
88-1
994
1988
-199
4
-4-4-4
111
666
111111
161616
NP - P (Yield increase due to N)
NP - P NP - P (Yield increase due to N)(Yield increase due to N)
1930
-193
719
30-1
937
1930
-193
7
1938
-194
719
38-1
947
1938
-194
7
1948
-195
719
48-1
957
1948
-195
7
1958
-196
719
58-1
967
1958
-196
7
1968
-197
719
68-1
977
1968
-197
7
1978
-198
719
78-1
987
1978
-198
7
1988
-199
419
88-1
994
1988
-199
4
-4-4-4
000
444
888
121212
161616
bu
shel
s p
er a
cre
bu
shel
s p
er a
cre
bu
shel
s p
er a
cre
P - Check (Yield increase due to P)
P - Check P - Check (Yield increase due to P)(Yield increase due to P)
1930
-193
719
30-1
937
1930
-193
7
1938
-194
719
38-1
947
1938
-194
7
1948
-195
719
48-1
957
1948
-195
7
1958
-196
719
58-1
967
1958
-196
7
1968
-197
719
68-1
977
1968
-197
7
1978
-198
719
78-1
987
1978
-198
7
1988
-199
419
88-1
994
1988
-199
4
-4-4-4
000
444
888
121212
161616
NPK - NP (Yield increase due to K)
NPK - NP NPK - NP (Yield increase due to K)(Yield increase due to K)
Time PeriodTime PeriodTime Period
bu
shel
s p
er a
cre
bu
shel
s p
er a
cre
bu
shel
s p
er a
cre
bu
shel
s p
er a
cre
bu
shel
s p
er a
cre
bu
shel
s p
er a
cre
1.51.51.5 222 2.52.52.5 333 3.53.53.5 444 4.54.54.5000
666
121212
181818
242424
303030
363636
424242
484848
545454
Dep
th, i
nD
epth
, in
Dep
th, i
n
000 101010 202020 303030 404040 505050 606060000
666
121212
181818
242424
303030
363636
424242
484848
545454
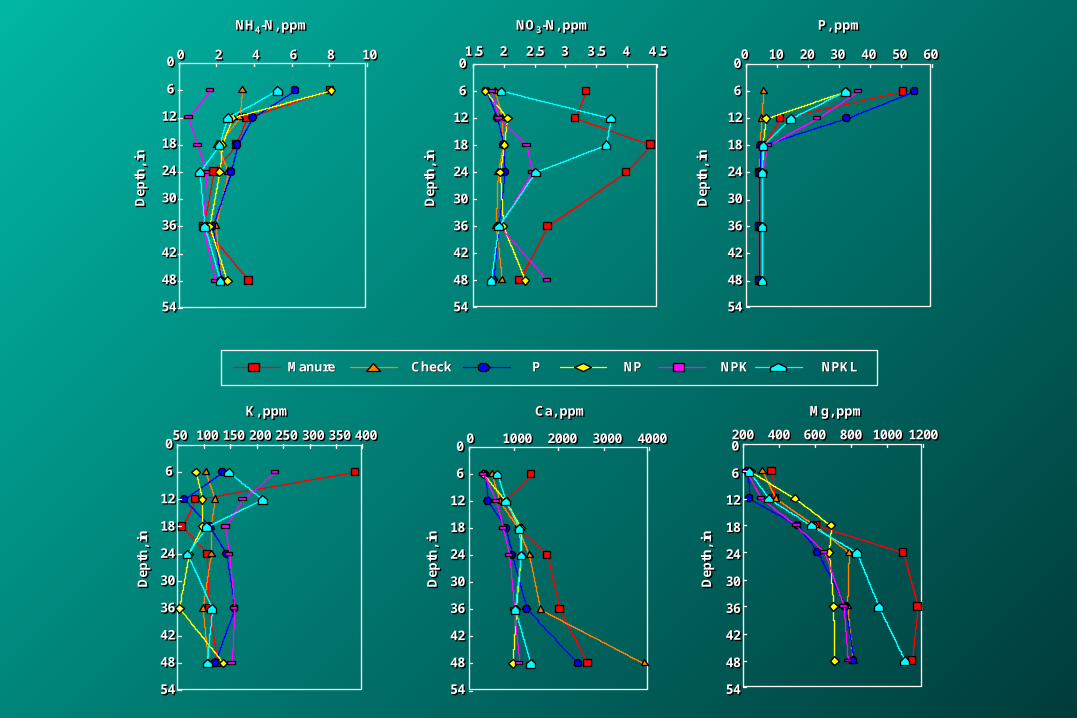
P, ppmP, ppmP, ppm
Dep
th, i
nD
epth
, in
Dep
th, i
n
000 100010001000 200020002000 300030003000 400040004000000
666
121212
181818
242424
303030
363636
424242
484848
545454
ManureManure CheckCheck PP NPNP NPKNPK NPKLNPKL
Ca, ppmCa, ppmCa, ppm
Dep
th, i
nD
epth
, in
Dep
th, i
n200200200 400400400 600600600 800800800 100010001000 120012001200000
666
121212
181818
242424
303030
363636
424242
484848
545454
Mg, ppmMg, ppmMg, ppm
Dep
th, i
nD
epth
, in
Dep
th, i
n
505050 100100100 150150150 200200200 250250250 300300300 350350350 400400400000
666
121212
181818
242424
303030
363636
424242
484848
545454
K, ppmK, ppmK, ppm
Dep
th, i
nD
epth
, in
Dep
th, i
n
000 222 444 666 888 101010000
666
121212
181818
242424
303030
363636
424242
484848
545454
NH4-N, ppmNHNH44-N, ppm-N, ppm
Dep
th, i
nD
epth
, in
Dep
th, i
n
NO3-N, ppmNONO33-N, ppm-N, ppm
193019301930 194019401940 195019501950 196019601960 197019701970 198019801980 199019901990 2000200020004.54.54.5
555
5.55.55.5
666
6.56.56.5
777
7.57.57.5
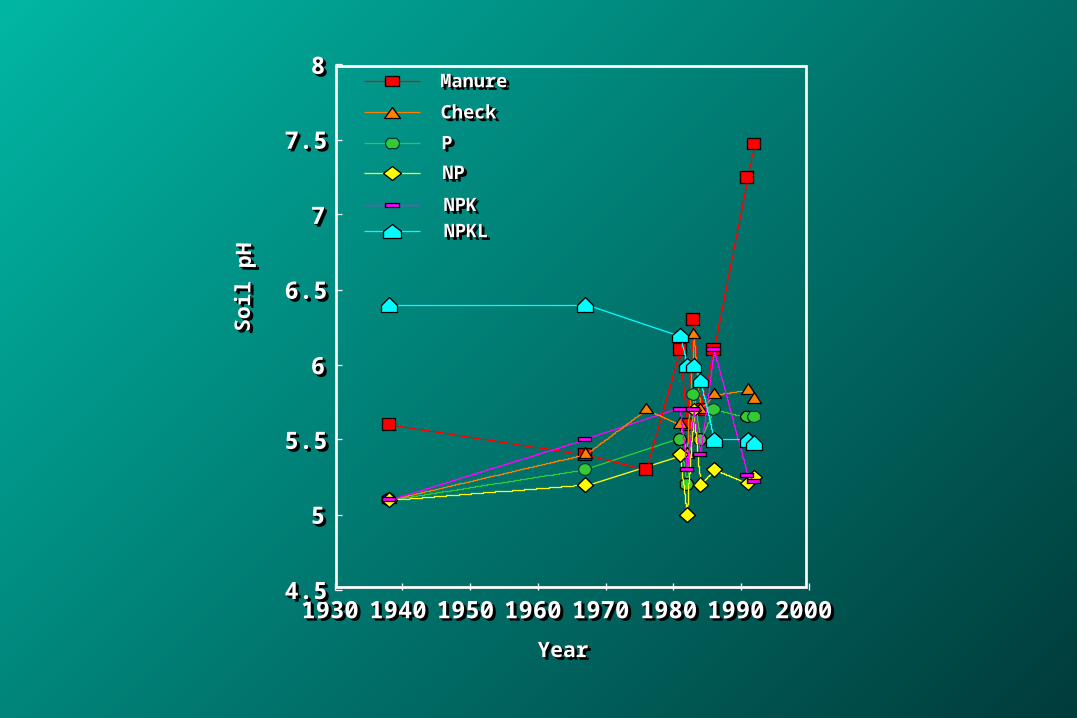
888ManureManureManure
CheckCheckCheck
PPP
NPNPNP
NPKNPKNPK
NPKLNPKLNPKLS
oil
pH
So
il p
HS
oil
pH
YearYearYear

333444111
666111 222 ... ...
222
999
888
222444...
111666...222 ...222 222 ...666 222333 222222
Man
ure
Man
ure
Man
ure
Ch
eck
Ch
eck
Ch
eck PPP
NP
NP
NP
NP
KN
PK
NP
K
NP
KL
NP
KL
NP
KL
000
101010
202020
303030
404040
222000...
111222...333
000
101010
202020
303030
404040
bu
shel
s p
er a
cre
bu
shel
s p
er a
cre
bu
shel
s p
er a
cre
111222...666
000
101010
202020
303030
404040
I. 1892-1898I. 1892-1898I. 1892-1898 II. 1899-1929II. 1899-1929II. 1899-1929 III. 1930-1937III. 1930-1937III. 1930-1937
bu
shel
s p
er a
cre
bu
shel
s p
er a
cre
bu
shel
s p
er a
cre
bu
shel
s p
er a
cre
bu
shel
s p
er a
cre
bu
shel
s p
er a
cre
Man
ure
Man
ure
Man
ure
Ch
eck
Ch
eck
Ch
eck
Ch
eck
Ch
eck
Ch
eck
bu
shel
s p
er a
cre
bu
shel
s p
er a
cre
bu
shel
s p
er a
cre
444
111222
000 000 333333 ...111
999...666222...444
333 ...555 333 ...999 333
000
101010
202020
303030
404040
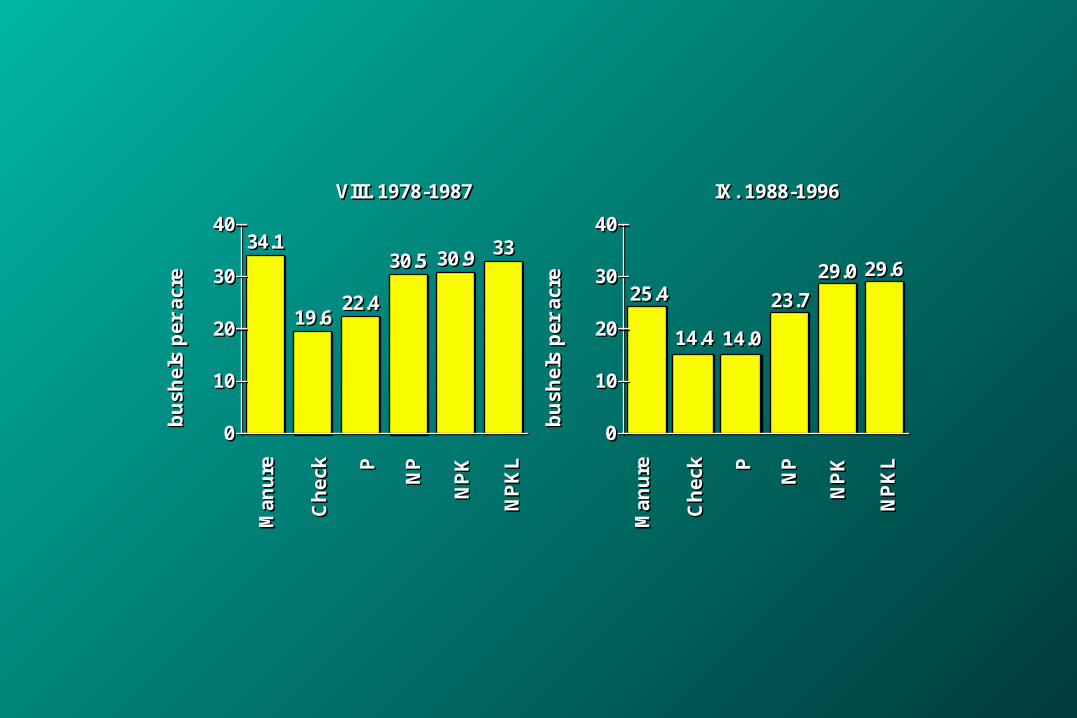
VIII. 1978-1987VIII. 1978-1987VIII. 1978-1987b
ush
els
per
acr
eb
ush
els
per
acr
eb
ush
els
per
acr
e
Man
ure
Man
ure
Man
ure
Ch
eck
Ch
eck
Ch
eck PPP
NP
NP
NP
NP
KN
PK
NP
K
NP
KL
NP
KL
NP
KL
14.414.414.4 14.014.014.0
000
101010
202020
303030
404040
IX. 1988-1996IX. 1988-1996IX. 1988-1996
Man
ure
Man
ure
Man
ure
Ch
eck
Ch
eck
Ch
eck PPP
NP
NP
NP
NP
KN
PK
NP
K
NP
KL
NP
KL
NP
KL
23.723.723.729.029.029.0 29.629.629.6
25.425.425.4
888555
111888 888
999 777999
333000
666 ...777
222999...
111 ...999222111...
333111...222 ...444
333
000
101010
202020
303030
404040
333 ...222
111 ...888
333 333333 999333 ...555
000
101010
202020
303030
404040
bu
shel
s p
er a
cre
bu
shel
s p
er a
cre
bu
shel
s p
er a
cre
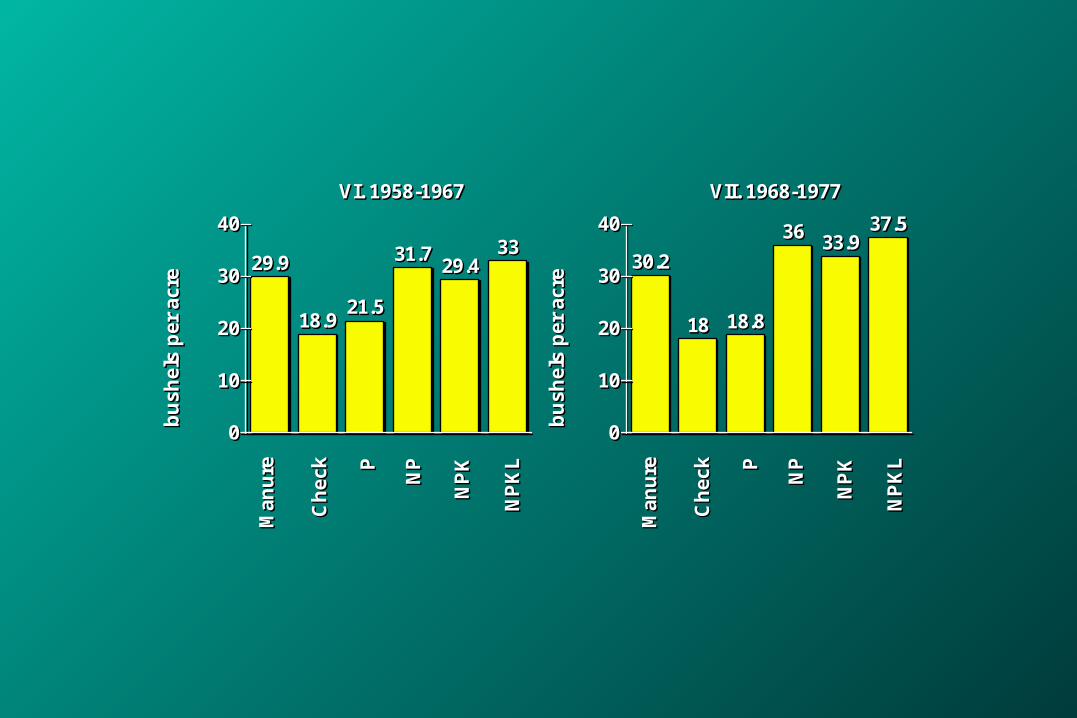
VI. 1958-1967VI. 1958-1967VI. 1958-1967 VII. 1968-1977VII. 1968-1977VII. 1968-1977
bu
shel
s p
er a
cre
bu
shel
s p
er a
cre
bu
shel
s p
er a
cre
Man
ure
Man
ure
Man
ure
Ch
eck
Ch
eck
Ch
eck PPP
NP
NP
NP
NP
KN
PK
NP
K
NP
KL
NP
KL
NP
KL
Man
ure
Man
ure
Man
ure
Ch
eck
Ch
eck
Ch
eck PPP
NP
NP
NP
NP
KN
PK
NP
K
NP
KL
NP
KL
NP
KL
999555
888
555
777
...
555 777 777 777 888333
111 ... 999111 ...555
999
111 ...999 111 ...222 111 ...444 111 ...333
000
101010
202020
303030
404040
111111333...
111999... 111999 111 ...222222...
000
101010
202020
303030
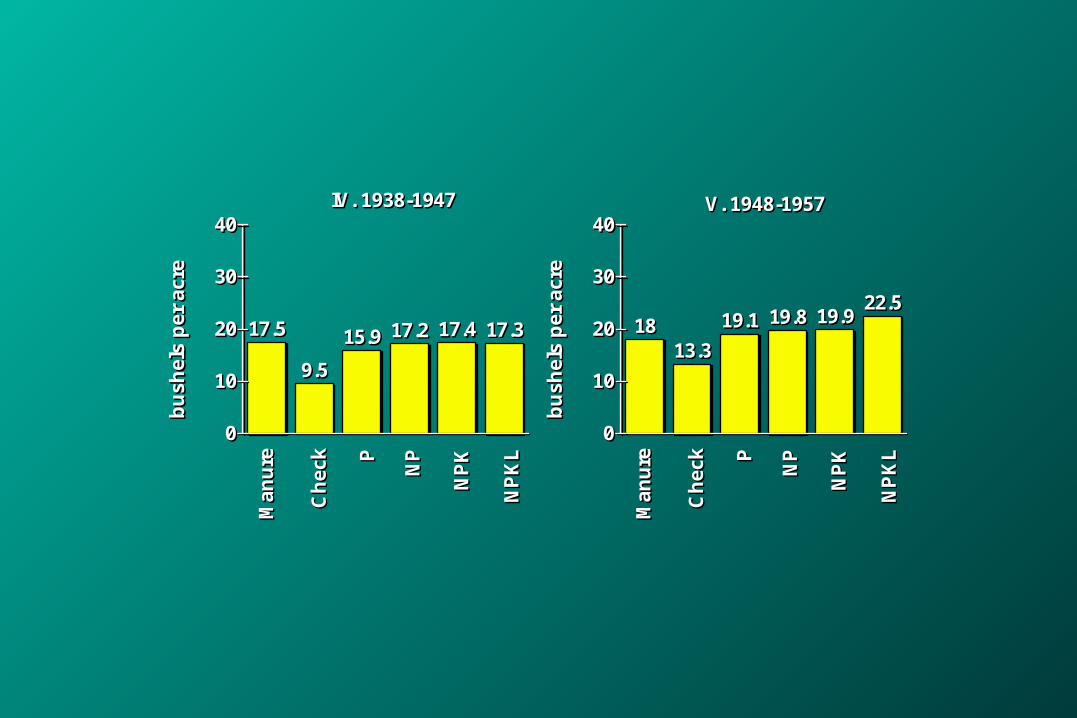
404040IV. 1938-1947IV. 1938-1947IV. 1938-1947 V. 1948-1957V. 1948-1957V. 1948-1957
bu
shel
s p
er a
cre
bu
shel
s p
er a
cre
bu
shel
s p
er a
cre
bu
shel
s p
er a
cre
bu
shel
s p
er a
cre
bu
shel
s p
er a
cre
Man
ure
Man
ure
Man
ure
Ch
eck
Ch
eck
Ch
eck PPP
NP
NP
NP
NP
KN
PK
NP
K
NP
KL
NP
KL
NP
KL
Man
ure
Man
ure
Man
ure
Ch
eck
Ch
eck
Ch
eck PPP
NP
NP
NP
NP
KN
PK
NP
K
NP
KL
NP
KL
NP
KL
1880188018801880 1900190019001900 1920192019201920 1940194019401940 1960196019601960 1980198019801980 20002000200020001111
1.51.51.51.5
2222
2.52.52.52.5
3333
3.53.53.53.5
4444
ManureManureManureManure
CheckCheckCheckCheck
Soi
l org
anic
mat
ter,
%S
oil o
rgan
ic m
atte
r, %
YearYear

18801880 19001900 19201920 19401940 19601960 19801980 200020000.040.04
0.060.06
0.080.08
0.10.1
0.120.12
0.140.14
0.160.16
0.180.18ManureManure
CheckCheck
Tot
al s
oil N
, %
Tot
al s
oil N
, %
YearYear

18901890 19101910 19301930 19501950 19701970 1990199000
1010
2020
3030
4040 Environment MeanEnvironment Mean
YearYear
Gra
in y
ield
, bu
/ac
Gra
in y
ield
, bu
/ac
Grain Yield TrendGrain Yield Trend
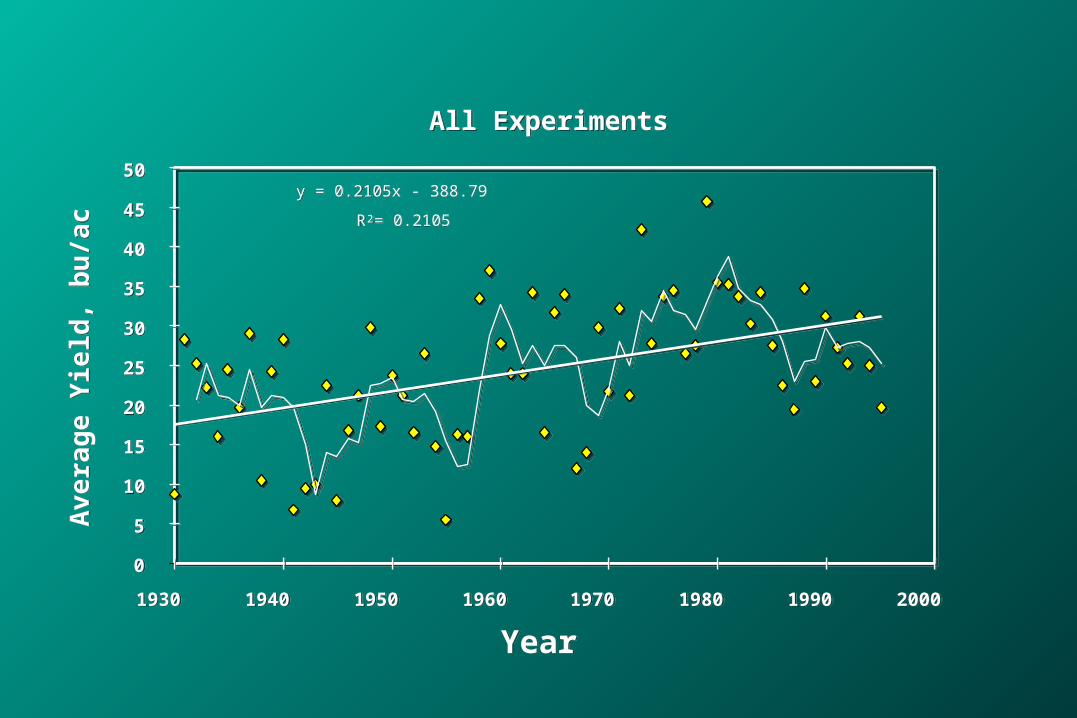
All ExperimentsAll Experiments
y = 0.2105x - 388.79y = 0.2105x - 388.79
RR22 = 0.2105 = 0.2105
00
55
1010
1515
2020
2525
3030
3535
4040
4545
5050
19301930 19401940 19501950 19601960 19701970 19801980 19901990 20002000
YearYear
Av
era
ge
Yie
ld, b
u/a
cA
ve
rag
e Y
ield
, bu
/ac

ConclusionsConclusions Manure applications were shown to increase Manure applications were shown to increase
yields very early in the studyyields very early in the study Applied P fertilizer increased grain yields Applied P fertilizer increased grain yields
(1930-57), but no increases were found as a (1930-57), but no increases were found as a result of applying N, K or lime up to 1957result of applying N, K or lime up to 1957
After 100 years of cultivation and continuous After 100 years of cultivation and continuous wheat production, N is deficient for crop wheat production, N is deficient for crop production on this soil. Now, N, P and K are production on this soil. Now, N, P and K are required for maximum yieldsrequired for maximum yields
Manure applications were shown to increase Manure applications were shown to increase yields very early in the studyyields very early in the study
Applied P fertilizer increased grain yields Applied P fertilizer increased grain yields (1930-57), but no increases were found as a (1930-57), but no increases were found as a result of applying N, K or lime up to 1957result of applying N, K or lime up to 1957
After 100 years of cultivation and continuous After 100 years of cultivation and continuous wheat production, N is deficient for crop wheat production, N is deficient for crop production on this soil. Now, N, P and K are production on this soil. Now, N, P and K are required for maximum yieldsrequired for maximum yields
Application of commercial fertilizer has improved Application of commercial fertilizer has improved yields as much as applications of barnyard yields as much as applications of barnyard manuremanure
Potassium addition had no notable effect on crop Potassium addition had no notable effect on crop yields until 1988, but since that time has been yields until 1988, but since that time has been needed for maximum yields. Liming has only needed for maximum yields. Liming has only been slightly beneficial at this locationbeen slightly beneficial at this location
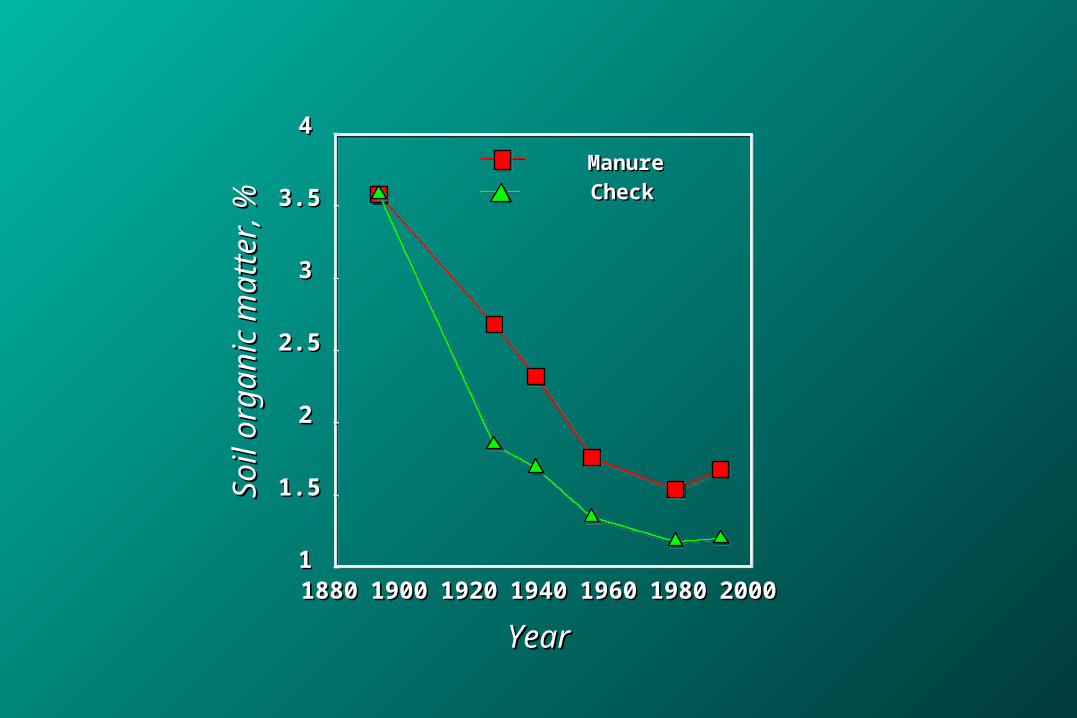
Soil organic matter has declined from 4.0% to Soil organic matter has declined from 4.0% to <1.25% and has tended to stabilize. Barnyard <1.25% and has tended to stabilize. Barnyard manure has slowed the decay of soil organic manure has slowed the decay of soil organic matter compared to the unfertilized plot.matter compared to the unfertilized plot.
Long-term relevancy achieved via the use of Long-term relevancy achieved via the use of simple treatment structure.simple treatment structure.
Application of commercial fertilizer has improved Application of commercial fertilizer has improved yields as much as applications of barnyard yields as much as applications of barnyard manuremanure
Potassium addition had no notable effect on crop Potassium addition had no notable effect on crop yields until 1988, but since that time has been yields until 1988, but since that time has been needed for maximum yields. Liming has only needed for maximum yields. Liming has only been slightly beneficial at this locationbeen slightly beneficial at this location
Soil organic matter has declined from 4.0% to Soil organic matter has declined from 4.0% to <1.25% and has tended to stabilize. Barnyard <1.25% and has tended to stabilize. Barnyard manure has slowed the decay of soil organic manure has slowed the decay of soil organic matter compared to the unfertilized plot.matter compared to the unfertilized plot.
Long-term relevancy achieved via the use of Long-term relevancy achieved via the use of simple treatment structure.simple treatment structure.
Soil test indices for P and K have been increased Soil test indices for P and K have been increased to adequate levels by continuous application of to adequate levels by continuous application of phosphorus and potassium fertilizer and phosphorus and potassium fertilizer and barnyard manure applications.barnyard manure applications.
The initial objective of this study was to The initial objective of this study was to determine how long this reddish prairie soil could determine how long this reddish prairie soil could produce wheat. After 100 years of soil fertility produce wheat. After 100 years of soil fertility research with multiple variables on continuous research with multiple variables on continuous wheat, the question remains unanswered. It has wheat, the question remains unanswered. It has been shown that inorganic fertilizer applications been shown that inorganic fertilizer applications as well as manure applications result in as well as manure applications result in sustainable and environmentally acceptable sustainable and environmentally acceptable agricultural production systems.agricultural production systems.