The Macroecology of Airborne Pollen in Australian and New … · 2014-06-23 · The Macroecology of...
13
The Macroecology of Airborne Pollen in Australian and New Zealand Urban Areas Simon G. Haberle 1 *, David M. J. S. Bowman 2 , Rewi M. Newnham 3 , Fay H. Johnston 4 , Paul J. Beggs 5 , Jeroen Buters 6 , Bradley Campbell 7 , Bircan Erbas 8 , Ian Godwin 7 , Brett J. Green 9 , Alfredo Huete 10 , Alison K. Jaggard 5 , Danielle Medek 11 , Frank Murray 12 , Ed Newbigin 13 , Michel Thibaudon 14 , Don Vicendese 8 , Grant J. Williamson 2 , Janet M. Davies 15 1 Department of Archaeology and Natural History, College of Asia and the Pacific, Australian National University, Canberra, Australian Capital Territory, Australia, 2 School of Plant Science, University of Tasmania, Hobart, Tasmania, Australia, 3 School of Geography, Environment and Earth Sciences, Victoria University of Wellington, Wellington, New Zealand, 4 Menzies Research Institute Tasmania, University of Tasmania, Hobart, Tasmania, Australia, 5 Department of Environment and Geography, Faculty of Science, Macquarie University, Sydney, New South Wales, Australia, 6 Center for Allergy and Environment, Technical University of Munich, Munich, Germany, 7 School of Agriculture and Food Science, The University of Queensland, St Lucia, Queensland, Australia, 8 School of Public Health and Human Biosciences, La Trobe University, Bundoora, Victoria, Australia, 9 Allergy and Clinical Immunology Branch, Health Effects Laboratory Division, National Institute for Occupational Safety and Health, Centre for Disease Control and Prevention, Morgantown, West Virginia, United States of America, 10 Plant Functional Biology and Climate Change, University of Technology, Sydney, New South Wales, Australia, 11 School of Medicine, Australian National University, Canberra, Australian Capital Territory, Australia, 12 School of Environmental Science, Murdoch University, Murdoch, Western Australia, Australia, 13 School of Botany, University of Melbourne, Melbourne, Victoria, Australia, 14 European Aerobiology Society, Re ´seau National de Surveillance Ae ´ robiologique, Lyon, Rho ˆ ne-Alpes, France, 15 Lung and Allergy Research Centre, School of Medicine, and Translational Research Institute, The University of Queensland, Woolloongabba, Queensland, Australia Abstract The composition and relative abundance of airborne pollen in urban areas of Australia and New Zealand are strongly influenced by geographical location, climate and land use. There is mounting evidence that the diversity and quality of airborne pollen is substantially modified by climate change and land-use yet there are insufficient data to project the future nature of these changes. Our study highlights the need for long-term aerobiological monitoring in Australian and New Zealand urban areas in a systematic, standardised, and sustained way, and provides a framework for targeting the most clinically significant taxa in terms of abundance, allergenic effects and public health burden. Citation: Haberle SG, Bowman DMJS, Newnham RM, Johnston FH, Beggs PJ, et al. (2014) The Macroecology of Airborne Pollen in Australian and New Zealand Urban Areas. PLoS ONE 9(5): e97925. doi:10.1371/journal.pone.0097925 Editor: Gil Bohrer, The Ohio State University, United States of America Received June 6, 2013; Accepted April 26, 2014; Published May 29, 2014 This is an open-access article, free of all copyright, and may be freely reproduced, distributed, transmitted, modified, built upon, or otherwise used by anyone for any lawful purpose. The work is made available under the Creative Commons CC0 public domain dedication. Funding: Funding support for the Working Group came from the Australian Centre for Ecological Analysis and Synthesis (ACEAS). Terrestrial Ecosystem Research Network (TERN). Merck Sharp and Dohme provided additional independent untied co-sponsorship for the Working Group. The funders had no role in study design, data collection and analysis, decision to publish, or preparation of the manuscript. Competing Interests: The authors have declared that no competing interests exist. * E-mail: [email protected] Introduction Pollen is the microscopic haploid stage of the plant life cycle. Pollen grains from different plant species have a remarkable diversity of shapes, sizes, and biochemical compositions. The identification of fossilised pollen in sedimentary sequences (palynology) has been pivotal in illuminating past environmental changes caused by, or associated with, climate change, human impacts and natural disturbances such as fires and tectonic activity. This technique is dependent on the assumption that deposited pollen provides a faithful representation of the vegetation patterns surrounding sedimentary traps. Palynologists test this assumption by collecting pollen from the ground surface within or between typical vegetation types or by sampling pollen in the atmosphere (e.g., D’Costa and Kershaw [1]; Wilmshurst and McGlone [2]; Fletcher and Thomas [3]; Tng et al. [4]). These investigations of ‘modern pollen rain’ have focused on wilderness or rural areas, to provide a basis for reconstructing historic biogeographic patterns. How pollen rain varies geographically within urban environments in Australia and New Zealand, where over 85% of the population live in Australia and New Zealand, remains poorly characterised (see Tng et al. [4] for an exception). Parallel studies have produced substantial time series of airborne pollen data for urban locations to underpin investigations of seasonal allergic reaction such as rhinitis or asthma in humans. These large data sets have enabled the development of predictive models between meteorological variables and the concentration of pollen from specific allergenic pollen taxa such as grass and birch (e.g., Scha ¨ppi et al. [5]; Emberlin et al. [6]; Rodrı ´guez-Rajo et al. [7]; Sofiev et al. [8]). In addition, in some urban areas, particularly in Europe, the aerobiological datasets now span several decades and are beginning to provide insights into biogeographic variation in landscape phenological patterns, and how these patterns respond to current climate change [9–12]. In contrast to the well-studied Northern Hemisphere, aerobi- ological studies of the Southern Hemisphere have been conducted in isolation and limited to monitoring specific cities for narrow time periods with few attempts made to discern generalised patterns across a country or region (see [13] for an exception). Indeed, many of the existing aerobiological studies located in PLOS ONE | www.plosone.org 1 May 2014 | Volume 9 | Issue 5 | e97925
Transcript of The Macroecology of Airborne Pollen in Australian and New … · 2014-06-23 · The Macroecology of...

The Macroecology of Airborne Pollen in Australian andNew Zealand Urban AreasSimon G. Haberle1*, David M. J. S. Bowman2, Rewi M. Newnham3, Fay H. Johnston4, Paul J. Beggs5,
Jeroen Buters6, Bradley Campbell7, Bircan Erbas8, Ian Godwin7, Brett J. Green9, Alfredo Huete10,
Alison K. Jaggard5, Danielle Medek11, Frank Murray12, Ed Newbigin13, Michel Thibaudon14,
Don Vicendese8, Grant J. Williamson2, Janet M. Davies15
1 Department of Archaeology and Natural History, College of Asia and the Pacific, Australian National University, Canberra, Australian Capital Territory, Australia, 2 School
of Plant Science, University of Tasmania, Hobart, Tasmania, Australia, 3 School of Geography, Environment and Earth Sciences, Victoria University of Wellington,
Wellington, New Zealand, 4 Menzies Research Institute Tasmania, University of Tasmania, Hobart, Tasmania, Australia, 5 Department of Environment and Geography,
Faculty of Science, Macquarie University, Sydney, New South Wales, Australia, 6 Center for Allergy and Environment, Technical University of Munich, Munich, Germany,
7 School of Agriculture and Food Science, The University of Queensland, St Lucia, Queensland, Australia, 8 School of Public Health and Human Biosciences, La Trobe
University, Bundoora, Victoria, Australia, 9 Allergy and Clinical Immunology Branch, Health Effects Laboratory Division, National Institute for Occupational Safety and
Health, Centre for Disease Control and Prevention, Morgantown, West Virginia, United States of America, 10 Plant Functional Biology and Climate Change, University of
Technology, Sydney, New South Wales, Australia, 11 School of Medicine, Australian National University, Canberra, Australian Capital Territory, Australia, 12 School of
Environmental Science, Murdoch University, Murdoch, Western Australia, Australia, 13 School of Botany, University of Melbourne, Melbourne, Victoria, Australia,
14 European Aerobiology Society, Reseau National de Surveillance Aerobiologique, Lyon, Rhone-Alpes, France, 15 Lung and Allergy Research Centre, School of Medicine,
and Translational Research Institute, The University of Queensland, Woolloongabba, Queensland, Australia
Abstract
The composition and relative abundance of airborne pollen in urban areas of Australia and New Zealand are stronglyinfluenced by geographical location, climate and land use. There is mounting evidence that the diversity and quality ofairborne pollen is substantially modified by climate change and land-use yet there are insufficient data to project the futurenature of these changes. Our study highlights the need for long-term aerobiological monitoring in Australian and NewZealand urban areas in a systematic, standardised, and sustained way, and provides a framework for targeting the mostclinically significant taxa in terms of abundance, allergenic effects and public health burden.
Citation: Haberle SG, Bowman DMJS, Newnham RM, Johnston FH, Beggs PJ, et al. (2014) The Macroecology of Airborne Pollen in Australian and New ZealandUrban Areas. PLoS ONE 9(5): e97925. doi:10.1371/journal.pone.0097925
Editor: Gil Bohrer, The Ohio State University, United States of America
Received June 6, 2013; Accepted April 26, 2014; Published May 29, 2014
This is an open-access article, free of all copyright, and may be freely reproduced, distributed, transmitted, modified, built upon, or otherwise used by anyone forany lawful purpose. The work is made available under the Creative Commons CC0 public domain dedication.
Funding: Funding support for the Working Group came from the Australian Centre for Ecological Analysis and Synthesis (ACEAS). Terrestrial Ecosystem ResearchNetwork (TERN). Merck Sharp and Dohme provided additional independent untied co-sponsorship for the Working Group. The funders had no role in studydesign, data collection and analysis, decision to publish, or preparation of the manuscript.
Competing Interests: The authors have declared that no competing interests exist.
* E-mail: [email protected]
Introduction
Pollen is the microscopic haploid stage of the plant life cycle.
Pollen grains from different plant species have a remarkable
diversity of shapes, sizes, and biochemical compositions. The
identification of fossilised pollen in sedimentary sequences
(palynology) has been pivotal in illuminating past environmental
changes caused by, or associated with, climate change, human
impacts and natural disturbances such as fires and tectonic
activity. This technique is dependent on the assumption that
deposited pollen provides a faithful representation of the
vegetation patterns surrounding sedimentary traps. Palynologists
test this assumption by collecting pollen from the ground surface
within or between typical vegetation types or by sampling pollen in
the atmosphere (e.g., D’Costa and Kershaw [1]; Wilmshurst and
McGlone [2]; Fletcher and Thomas [3]; Tng et al. [4]). These
investigations of ‘modern pollen rain’ have focused on wilderness
or rural areas, to provide a basis for reconstructing historic
biogeographic patterns. How pollen rain varies geographically
within urban environments in Australia and New Zealand, where
over 85% of the population live in Australia and New Zealand,
remains poorly characterised (see Tng et al. [4] for an exception).
Parallel studies have produced substantial time series of
airborne pollen data for urban locations to underpin investigations
of seasonal allergic reaction such as rhinitis or asthma in humans.
These large data sets have enabled the development of predictive
models between meteorological variables and the concentration of
pollen from specific allergenic pollen taxa such as grass and birch
(e.g., Schappi et al. [5]; Emberlin et al. [6]; Rodrıguez-Rajo et al.
[7]; Sofiev et al. [8]). In addition, in some urban areas, particularly
in Europe, the aerobiological datasets now span several decades
and are beginning to provide insights into biogeographic variation
in landscape phenological patterns, and how these patterns
respond to current climate change [9–12].
In contrast to the well-studied Northern Hemisphere, aerobi-
ological studies of the Southern Hemisphere have been conducted
in isolation and limited to monitoring specific cities for narrow
time periods with few attempts made to discern generalised
patterns across a country or region (see [13] for an exception).
Indeed, many of the existing aerobiological studies located in
PLOS ONE | www.plosone.org 1 May 2014 | Volume 9 | Issue 5 | e97925

Australia and New Zealand have been motivated by an interest in
the public health burden of pollen sensitization and allergic
asthma at major population centres. Aerobiology in the Southern
Hemisphere is as complex as that in the Northern Hemisphere,
given the variability of abiotic factors and environmental gradients
that span the tropics to the temperate zones. The coexistence of
very distinct indigenous vegetation, introduced Northern Hemi-
sphere ornamentals, as well as exotic invasive species are
additional variables that contribute to the aerobiology of each
Southern Hemisphere regional center. Here we compile and
analyse an historic atmospheric pollen dataset from 11 cities across
Australia and New Zealand and examine the regional variations in
pollen content and relative abundance. The geographical distri-
bution of the 11 Australasian sites was broad enough to enable
further examination of the role that biogeography plays in regional
and urban variations in pollen composition. These data can
potentially provide insights into how pollen production and
dispersal derived from both native and exotic taxa may respond
to changes in climate and urban and peri-urban land use. The
influence of these variables and how that may affect allergic
diseases is also discussed.
We emphasise that these results were achieved by collating data
sets that were originally obtained for other purposes and were
often of limited duration and collected using a variety of methods.
The combined data set provides impetus for further work and
suggests the potential of a more systematic and coordinated pollen
monitoring network in Australasia for long-term studies into
environmental change and the production of more accurate pollen
forecasting systems to help allergy sufferers and their health care
providers better manage their conditions. We conclude by
considering some important issues that such an initiative could
address.
Materials and Methods
Sampling SitesAerobiological data have been collected across Australia and
New Zealand using a range of methods and counting periods (see
Table 1). This paper describes the re-analysis of approved
university studies of aerobiological pollen in Australia and New
Zealand. All studies have been published (Table 1) with the
exception of pollen data from Perth and Canberra, where
unpublished data were provided by the investigators at these sites
(also authors in this paper FM and SGH). In cities where more
than one station is operating the secondary station is not included
in the numerical analysis as they overlap and are shorter records
than the nearby stations in the same cities. Land cover attributes
for Australia and New Zealand with climate summaries for each
major urban centre associated with aerobiology studies are shown
in Figure 1. Table 1 provides the location details of each
aerobiological station including the collection periods of 14
aerobiology stations across 11 urban centres, which have been in
operation for at least one season over the last 25 years. In
aerobiology, pollen traps are situated well above ground level,
Figure 1. Land cover attribute for Australia and New Zealand with climatological summaries for each major urban centreassociated with an aerobiology study. Climate summaries include average monthly precipitation and minimum and maximum temperatures foreach urban area (see Table 3 for data sources). Data shown for Whangarei represents the Kaikohe pollen count site.doi:10.1371/journal.pone.0097925.g001
Airborne Pollen in Australia and New Zealand
PLOS ONE | www.plosone.org 2 May 2014 | Volume 9 | Issue 5 | e97925

both to avoid the complicating influence of local vegetation and
anthropogenic disturbance as well as to better sample the regional
pollen flux that are dominated by the major anemophilous (wind-
dispersed) taxa [19]. This group of wind-pollinated species
comprise many of the important allergenic sources [20]. The data
presented here were obtained at pollen sampling sites ranging in
elevation above ground level that, along with other differences in
collection methods described below, are likely to affect the total
volume of pollen sampled. Nevertheless the methods used at each
location provide estimates of airborne pollen volume (in grains/
cm3) that can be compared between regions and through time.
Pollen Data CollectionThe most common method of daily pollen counts in Australia is
based on the deployment of a seven-day Hirst-type volumetric
pollen and spore trap [21] located on structures (mostly rooftops)
ranging from between 2–14 m above the ground. In New
Zealand, an alternative device, the Intermittent Cycling Rotorod
sampler [22] was deployed at all sites, but provides similar
volumetric data. The Hirst-type sampler uses a range of adhesive
surface compounds including vaseline and 10% paraffin wax in
toluene on MelinexTM tape (Burkard Manufacturing Co. Ltd.,
Rickmansworth, Hertfordshire, UK), silicon-based adhesive (Lan-
zoni s.r.l., Bologna, Italy) or a 50% saturated Dow Corning high
vacuum grease in solvent [23]. The seven-day tapes are then cut
into 24-hr segments and mounted on glass slides with a stain such
as fuchsine stained Gelvatol [24], Calberla’s stain, or 2% Saffranin
O in glycerol jelly. Alternatively daily pollen monitoring can be
done using a glass microscope slide that is coated and stained as
described. Analysis of each 24-hr period is conducted by counting
between one and four transects at 400 magnification [25], though
at one site the entire slide surface was counted (Brisbane, [26]).
Pollen and spore counts were then converted to grains/m3 of air
and expressed as a daily mean value [21]. Hirst-type pollen and
spore traps are known to show an instrumental variation of about
25% [27]. In New Zealand the Intermittent Cycling Rotorod
sampler is an impaction collector with a retracting collector rod
sampling head [22]. Particles are collected on the leading, greased,
edge of two 1.59632 mm clear polystyrene collector rods spun
intermittently by an electric motor at 2400 rev./min. The
samplers were set-up to operate for 6 min every hour. Sampling
rods were replaced every 24 hours, stained with Calberla’s
solution, and examined under a transmitted light microscope.
Raw pollen counts for each of the pollen/spore types identified
were converted to the volumetric index (grains/m3 of air) using a
standard formula taking into account the sampling period and
volume of air sampled [22]. The daily mean concentration of
fungal spores, particularly Alternaria, was also recorded at some
stations (Darwin, Brisbane, Sydney, Canberra, Melbourne and
Hobart), though detailed analysis of these data is not presented
here. The raw pollen counts for each site used in this paper have
been archived in excel files at the Australian Centre for Ecological
Analysis and Synthesis data portal (http://aceas-data.science.uq.
edu.au/portal/). Links to specific station datasets are provided in
Table 1.
Pollen IdentificationPollen identification was aided by the existing reference
collections held by individual analysts or collated into digital or
online reference collections (e.g., the Department of Archaeology
and Natural History at the Australian National University, http://
apsa.anu.edu.au, the CD published by Hjelmroos et al. [28]). In a
number of these aerobiological surveys, it was not possible to place
identifications at a species or genus taxonomic level. In these cases
the taxon name reverted to the higher level (i.e., all genus-level
identifications were placed into the relevant family) such as the
Poaceae and Myrtaceae. The introduced tree taxa are referred to
by their generic name (Alnus, Betula, Pinus, Quercus, Salix and Ulmus)
as all are represented in Australia and New Zealand by more than
one species in the genus and these are not distinguished in the
available datasets.
Pollen Count AnalysisIn order to reduce variation in pollen abundance records due to
variations in equipment or handling protocols, the datasets were
transformed into percentage values based on a total pollen sum
(total pollen abundance of a single taxon recorded over the time of
study divided by the total pollen abundance of all taxa recorded
over the time of study) (Table 2). This data transformation
mitigated other sources of variation in abundance between
monitoring sites such as location, as coastal cities are exposed to
a smaller proportion of land area and hence vegetation sources
than inland cities (Figure 1).
The pollen season has been defined in many ways by different
authors [29]. To date, no standardized approach to identifying the
pollen season has been defined in Australia or New Zealand
[13,15–17]. In general, the pollen season is said to have four
parameters, the start, duration, peak and the end. In this study we
adopted the Nilsson and Persson [30] approach, where the ‘start
day’ is when the sum of daily pollen concentrations reaches 5% of
the total yearly count and the ‘end day’ when the sum reaches
95% of the yearly count. The ‘year’ for all subtropical and
temperate sites began on July 1 and ends on June 30. The
exception was the tropical site (Darwin), where the ‘year’ begins on
January 1 and ends on December 31. The season is thus the period
when 90% of the total annual pollen count is collected on the
trapping surface (see example given in Figure 2). Here we also
point out that the years of sampling varied between certain sites,
ranging from 1988 to 2012, with some sites sampled for a single
season, a single year, or a small number of years. This factor must
be considered when comparing phenological observations such as
the timing of pollen season parameters between sites, as pollen
season for the same species may vary substantially between years
[31].
Similarities between the airborne pollen assemblages recorded
within the 11 urban areas were calculated using non-metric
multidimensional scaling ordination (nMDS, [32]), a technique
that reduces the dimensionality of multivariate data, and
graphically represented using the relative dissimilarities amongst
(a) urban areas and (b) dominant taxa. The robust nature of the
ordination is measured through the numerical stress value. A stress
less than two corresponds to a good ordination and useful two-
dimensional picture of sample similarity [32]. The nMDS outputs
show vector positions for each variable within the environmental
space. The length of the vectors correspond to the square-root of
the r2 values, so weak predictors have a shorter length than strong
predictors. High r2 values indicate a vector that is strongly
associated with site/species variation in the ordination space. Low
r2 values would indicate a vector that doesn’t really explain much
in the ordination space. Environmental vectors representing three
meteorological variables (Mean annual maximum and minimum
temperature and mean annual precipitation) and the proportion of
four broad land cover types in a 100 km radius around each urban
area were fitted to the species ordination using the envfit function
of the vegan package in R [33], with random permutations of
environmental variables performed in order to assess their
significance. We make the assumption that the proportion of land
cover types found in a 100 km radius around pollen sampling
Airborne Pollen in Australia and New Zealand
PLOS ONE | www.plosone.org 3 May 2014 | Volume 9 | Issue 5 | e97925

Ta
ble
1.
Site
san
dm
eth
od
olo
gie
se
mp
loye
din
aero
bio
log
yre
cord
ing
stat
ion
sac
ross
Au
stra
liaan
dN
ew
Ze
alan
d.
Lo
cati
on
na
me
Su
bu
rb(s
ite
)C
ou
ntr
y(S
tate
/T
err
ito
ry)
La
titu
de
(S)
Lo
ng
itu
de
(E)
Ele
va
tio
n(m
)M
on
ito
rH
eig
ht
(m)
Sta
rtD
ate
En
dD
ate
Du
rati
on
(da
ys)
Tim
est
ep
Tim
eS
tart
/En
dM
on
ito
rty
pe
Ma
gn
ific
ati
on
Co
un
tin
gm
eth
od
Dar
win
Cas
uar
ina
(Ch
arle
sD
arw
inU
niv
ers
ity)
A(N
T)
12u2
29
13
0u5
29
13
14
18
/03
/20
04
15
/11
/20
05
60
72
4h
rs0
:00
Bu
rkar
d4
006
4tr
anse
cts
Dar
win
Pal
me
rsto
nA
(NT
)1
2u2
89
13
0u5
89
24
14
1/0
4/2
00
43
1/0
3/2
00
53
64
24
hrs
0:0
0B
urk
ard
40
064
tran
sect
s
Bri
sban
eR
ock
lea
A(Q
LD)
27u2
99
15
3u0
89
13
27
/06
/19
94
17
/05
/19
99
18
05
7d
ayu
nkn
ow
nB
urk
ard
25
06e
nti
resl
ide
Pe
rth
Mu
rdo
ch(M
urd
och
Un
ive
rsit
y)A
(WA
)3
2u0
49
11
5u5
09
30
un
kno
wn
1/0
9/2
00
63
1/1
2/2
00
61
21
24
hrs
*0
:00
Bu
rkar
d6
40
03
tran
sect
s
Syd
ne
yC
amp
be
llto
wn
(Un
ive
rsit
yo
fW
est
ern
Syd
ne
y)
A(N
SW)
34u0
49
15
0u4
79
74
10
1/0
1/1
99
33
1/1
2/1
99
51
09
42
4h
rsu
nkn
ow
nB
urk
ard
40
063
tran
sect
s
Can
be
rra
Act
on
(Au
stra
lian
Nat
ion
alU
niv
ers
ity)
A(A
CT
)3
5u1
69
14
9u7
95
69
82
6/0
9/2
00
71
3/1
2/2
00
98
09
24
hrs
0:0
0B
urk
ard
40
064
tran
sect
s
Can
be
rra
Ho
lde
rA
(AC
T)
35u1
99
14
9u2
95
70
14
27
/8/0
9,
29
/9/
10
31
/1/1
0,
26
/11
/10
21
02
4h
rs1
0am
(20
09
),4
pm
(20
10
)B
urk
ard
64
0(2
00
9),
62
0(2
01
0)
1tr
anse
ct
Me
lbo
urn
eP
arkv
ille
(Me
lbo
urn
eU
niv
ers
ity)
A(V
IC)
37u4
89
14
4u1
79
14
1/0
9/2
00
93
1/1
2/2
01
18
52
24
hrs
16
:00
Bu
rkar
d2
06w
ith
afi
eld
of
vie
wo
f1
mm
1tr
anse
ct
Ho
bar
tSa
nd
yB
ay(U
niv
ers
ity
of
Tas
man
ia)
A(T
AS)
42u5
49
14
7u1
99
58
12
6/0
9/2
00
73
1/1
2/2
01
01
21
22
4h
rs0
:00
Bu
rkar
d4
006
4tr
anse
cts
Kai
koh
eK
aiko
he
NZ
35u2
49
17
3u4
89
19
82
15
/11
/19
88
11
/02
/19
89
88
24
hrs
12
:00
Ro
toro
d4
006
n/a
Au
ckla
nd
Gra
fto
n(M
use
um
)N
Z3
6u5
19
17
4u4
69
61
82
8/1
0/1
98
92
7/0
4/1
99
01
81
24
hrs
9:0
0R
oto
rod
40
06n
/a
Au
ckla
nd
On
eh
un
ga
NZ
36u5
19
17
4u4
69
15
32
7/1
0/1
98
93
0/0
4/1
99
01
85
24
hrs
9:0
0R
oto
rod
40
06n
/a
Ch
rist
chu
rch
Ch
rist
chu
rch
(Can
terb
ury
Un
ive
rsit
y)N
Z4
3u3
19
17
2u3
59
14
20
17
/11
/19
88
13
/02
/19
89
88
24
hrs
12
:00
Ro
toro
d4
006
n/a
Du
ne
din
Du
ne
din
NZ
45u5
19
17
0u3
09
05
1/1
0/1
99
23
1/0
1/1
99
31
22
24
hrs
9:0
0R
oto
rod
40
06n
/a
Dat
ad
eri
ved
fro
mu
np
ub
lish
ed
and
pu
blis
he
dd
ata
(Ne
wn
ham
eta
l.[1
3];
Bas
san
dM
org
an[1
4];
On
get
al.
[15
];G
ree
net
al.
[16
];St
eve
nso
net
al.
[17
];T
ng
eta
l.[4
];M
ed
ek
eta
l.[1
8])
.N
ote
that
dat
afr
om
seco
nd
ary
stat
ion
sin
Dar
win
(Pal
me
rsto
n),
Can
be
rra
(Ho
lde
r)an
dA
uck
lan
d(G
raft
on
Mu
seu
m)
are
no
tin
clu
de
din
the
nu
me
rica
lan
alys
isin
this
pap
er.
Th
era
wp
olle
nco
un
tsfo
re
ach
site
use
din
this
pap
er
hav
eb
ee
nar
chiv
ed
ine
xce
lfi
les
atth
eA
ust
ralia
nC
en
tre
for
Eco
log
ical
An
alys
isan
dSy
nth
esi
sd
ata
po
rtal
(htt
p:/
/ace
as-d
ata.
scie
nce
.uq
.ed
u.a
u/p
ort
al/)
.Clic
ko
nth
efo
llow
ing
hyp
erl
inke
dte
xtto
do
wn
load
dat
afr
om
eac
hae
rob
iolo
gy
reco
rdin
gst
atio
n.D
arw
in,B
risb
ane
,P
ert
h,
Syd
ne
y,C
anb
err
a,M
elb
ou
rne
,H
ob
art,
Kai
koh
e,
Au
ckla
nd
,C
hri
stch
urc
h,
Du
ne
din
.A
ssu
mp
tio
ns:
All
air
sam
ple
dat
10
l/m
inu
te(e
xce
pt
NZ
roto
rod
:1
.596
32
mm
rod
ssp
un
at2
40
0re
v/m
info
r6
min
/hr)
,an
dal
le
xpre
ssco
nce
ntr
atio
nas
gra
ins/
m3
of
air.
*No
tSa
turd
ays
and
Sun
day
s.A
;A
ust
ralia
,N
Z;
Ne
wZ
eal
and
,N
T;
No
rth
ern
Te
rrit
ory
,Q
LD;
Qu
ee
nsl
and
,W
A;
We
ste
rnA
ust
ralia
,N
SW;
Ne
wSo
uth
Wal
es,
AC
T;
Au
stra
lian
Cap
ital
Te
rrit
ory
,V
IC;
Vic
tori
a,T
AS;
Tas
man
ia.
do
i:10
.13
71
/jo
urn
al.p
on
e.0
09
79
25
.t0
01
Airborne Pollen in Australia and New Zealand
PLOS ONE | www.plosone.org 4 May 2014 | Volume 9 | Issue 5 | e97925

Ta
ble
2.
Ae
rob
iolo
gic
ally
sig
nif
ican
tp
olle
nta
xaco
ntr
ibu
tin
g.
80
%to
the
tota
lan
nu
alat
mo
sph
eri
cp
olle
nin
urb
anar
eas
acro
ssA
ust
ralia
and
Ne
wZ
eal
and
.
Ta
xa
Da
rwin
Bri
sba
ne
Pe
rth
Sy
dn
ey
Ca
nb
err
aM
elb
ou
rne
Ho
ba
rtK
iak
oh
eA
uck
lan
dC
hri
stch
urc
hD
un
ed
inA
ve
(ra
nk
)
Are
cace
ae2
6.0
*26
.0
Ca
sua
rin
a3
.16
.56
.21
.80
.44
.33
.7(8
)
Urt
icac
eae
1.6
1.8
0.7
1.9
0.9
0.1
1.2
(16
)
Aca
cia
3.1
0.2
0.3
0.3
0.3
0.5
,0
.10
.7(1
8)
Myr
tace
ae3
1.0
3.1
6.0
11
.05
.75
.68
.2,
0.1
5.2
37
.9(4
)
Ch
eno
po
dia
cea
e0
.30
.10
.80
.20
.3,
0.1
11
.06
.82
.4(1
2)
Cyp
era
ceae
5.5
1.3
0.3
1.2
0.5
0.0
31
.5(1
3)
Ast
era
ceae
0.1
0.7
2.5
1.0
0.8
0.4
0.5
0.3
2.1
21
.0(1
7)
Cu
pre
ssac
eae
5.2
9.0
27
.52
3.0
22
.55
8.0
13
.30
.41
.01
.72
8.5
17
.3(2
)
Pin
us
0.1
4.5
31
.03
.01
7.0
1.2
3.3
0.3
0.5
2.4
11
.46
.8(5
)
Po
ace
ae1
8.0
71
.02
3.0
17
.51
5.0
10
.81
0.4
84
.04
3.7
51
.62
5.8
33
.7(1
)
Pla
nta
go
0.2
5.1
3.2
1.8
3.4
11
.11
6.0
8.6
6.2
(7)
Ulm
us
,0
.13
.80
.41
.61
.5(1
4)
Ole
ace
ae2
0.0
1.8
5.2
5.2
,0
.17
.26
.6(6
)
Salix
0.2
1.7
5.0
,0
.10
.21
.4(1
5)
Ru
mex
4.3
0.1
2.3
3.6
3.5
6.5
3.4
(9)
Qu
ercu
s0
.13
.14
.91
.6,
0.1
0.2
11
.23
.0(1
0)
Aln
us
3.9
1.8
2.0
2.6
(11
)
Bet
ula
1.7
4.5
16
.70
.60
.35
27
.08
.5(3
)
Co
pro
sma
0.4
,0
.10
.11
.70
.6(1
9)
Sub
-to
tal
93
.99
8.3
90
.08
8.3
90
.59
6.3
79
.49
9.8
84
.09
6.1
99
.99
2.4
Oth
er
6.1
1.7
10
.01
1.7
9.5
3.7
20
.60
.21
63
.90
.17
.6
Po
llen
taxa
valu
es
are
exp
ress
ed
asa
pe
rce
nta
ge
of
the
tota
lp
olle
nco
un
tfo
rth
ere
cord
pe
rio
dav
aila
ble
ine
ach
urb
anar
ea
(*e
xclu
de
dfr
om
ran
kin
gas
on
lyo
ccu
rsin
on
eu
rban
are
a).T
he
ave
rag
ean
dra
nk
of
pe
rce
nta
ge
valu
es
acro
ssal
lu
rban
are
asis
giv
en
inth
eri
gh
th
and
colu
mn
.T
he
cate
go
ry‘‘O
the
r’’
incl
ud
es
all
po
llen
taxa
cou
nte
din
the
tota
lp
olle
nsu
man
dn
ot
ide
nti
fie
dto
taxa
he
re.
do
i:10
.13
71
/jo
urn
al.p
on
e.0
09
79
25
.t0
02
Airborne Pollen in Australia and New Zealand
PLOS ONE | www.plosone.org 5 May 2014 | Volume 9 | Issue 5 | e97925

stations is representative of the total potential pollen dispersal area.
However, it must be acknowledged that little is known of the
pollen dispersal characteristics of Australasian pollen types and
that further research is required to understand the influence that
meteorological factors such as wind strength and distance from
source vegetation might have on pollen concentrations in the
atmosphere.
Results
Pollen Ranking Among Urban AreasThe airborne pollen data were ranked by percentage represen-
tation, with the top 20 pollen taxa making up .80% of the total
pollen collected across 11 cities in Australia and New Zealand
(Table 2 and Figure 3). The dataset incorporates taxa of high
relative percentage representation that commonly occur in two or
more urban areas (Arecaceae is an exception because of the high
values recorded in Darwin). The most significant taxa across all
sites are Poaceae and Cupressaceae, making up over 50% of the
total airborne pollen in urban environments throughout the year.
These are followed by Betula, the trees and shrubs in Myrtaceae,
Pinus, Oleaceae, Casuarina, and the important herbaceous taxa
such as Plantago and Rumex. Differences between the pollen taxa
rankings (highest to lowest percentage representation) across the
broad biogeographic regions of Australia (tropics to temperate:
Australian Tropical/Subtropical = Darwin, Brisbane; Australian
Temperate = Perth, Sydney, Canberra, Melbourne, Hobart) and
New Zealand (North and South Island: NZ North = Kaikohe,
Auckland; NZ South = Christchurch, Dunedin), reflect the strong
climate controls on plant distributions, particularly those associ-
Figure 2. Climate summary and daily airborne pollen (Poaceae and Non-native arboreal taxa) for Canberra (26 Sept 2007–31 Dec2009). Pollen season is depicted by the shaded columns and defined by 90% of the airborne pollen falling in this time for each year (July 1 to June30). Climate data from the Australian Bureau of Meteorology.doi:10.1371/journal.pone.0097925.g002
Airborne Pollen in Australia and New Zealand
PLOS ONE | www.plosone.org 6 May 2014 | Volume 9 | Issue 5 | e97925

ated with Northern Hemisphere introductions such as Betula,
Quercus, Alnus and Ulmus that contribute high levels of pollen into
the atmosphere of the southern temperate cities.
Biogeographic PatternsThe two dimensional ordination had a low stress level
(stress = 0.11) indicating it was a robust graphical representation
of the similarity matrix among the cities and the dominant taxa.
The ordination displays a gradation in vegetation formation (and
land cover) across the set of urban areas (Figure 4A). The x-axis
separates the tree dominant urban landscapes (negative values
associated with pie charts dominated by tree taxa) from the
grassland dominated urban landscapes (positive values associated
with pie charts dominated by herbaceous taxa). The y-axis is
associated with latitudinal position of Australian and New Zealand
sites with positive values corresponding to lower latitude urban
areas and negative values corresponding with higher latitude
urban areas. The most significant environmental variable
explaining the difference between airborne pollen in each urban
area was minimum annual temperature (MinT, r2 = 0.77,
P = 0.002), which is closely aligned to the latitudinal transect
along which the urban areas lie (Table 3). The second
environmental factor that showed a significant correlation with
the airborne pollen was mean annual precipitation (MAP,
r2 = 0.66, P = 0.01). Increased grass pollen dominance is clearly
apparent in Figure 4, particularly in the savanna dominated
tropics (Darwin), dry sclerophyll subtropical forests (Brisbane) and
pastoral dominated temperate landscapes of New Zealand, where
associated ruderal taxa such as Rumex, Plantago, Asteraceae and
Chenopodiaceae are also prominent. The contribution of grass
pollen was reduced in the southern temperate cities, where other
woody taxa such as Cupressaceae (including both native and
introduced species) and the introduced Northern Hemisphere
trees (Betula, Alnus, Ulmus, and Quercus) become significant
contributors.
Pollen SeasonsFigure 5 illustrates the Australasian pollen calendar for the top
20 taxa across 11 urban areas. The matrix is organised according
to geographical distribution from tropical to temperate for both
urban areas and pollen taxa. The clear shifts from long pollen
seasons in the tropics to shorter periods in the temperate regions
reflects the strong control of solar radiation incidence on pollen
production during spring and summer months in the southern
urban areas [36]. There is also a discernible shift in the initiation
and length of pollen season towards higher latitude. For example,
Poaceae has a long flowering season in the northern cities of
Darwin and Brisbane (across the dry season and into the wet
season as different grass species flower through the year),
compared to the progressively shorter and later initiation of the
pollen season in the southern cities.
The effect of temperature and solar incidence on the beginning
and end of the pollen season in the temperate zone is illustrated
with an example from Canberra in Figure 2, where the
relationship between airborne pollen and key climate variables
for Poaceae and total non-native tree species (Northern Hemi-
sphere) is shown. While this is simply a visual comparison,
previous studies from Melbourne [15,37], Brisbane [26] and New
Zealand [38] have also documented the significant influence of
temperature and precipitation on the commencement and
duration of the grass pollen season. The lack of consistent pollen
season in some taxa such as Oleaceae may be a function of the
multiple species from different genera being incorporated into this
taxon (including Olea and Fraxinus), reflecting a significant
limitation imposed by the inability to resolve pollen to the species
level.
Discussion
The history of aerobiology research in Australia and New
Zealand, like the rest of the world, can be characterised by its focus
on local site (urban area) issues. Unlike other continents however,
Figure 3. Ranking for top 20 pollen taxa based on average percentage representation of airborne pollen areas across all urbanareas (black bars). These urban areas are then grouped into regional biogeographic zones (blank space = taxa not recorded). Australian Tropical/Subtropical = Darwin, Brisbane; Australian Temperate = Perth, Sydney, Canberra, Melbourne, Hobart; NZ North = Kaikohe, Auckland; NZ South = -Christchurch, Dunedin.doi:10.1371/journal.pone.0097925.g003
Airborne Pollen in Australia and New Zealand
PLOS ONE | www.plosone.org 7 May 2014 | Volume 9 | Issue 5 | e97925
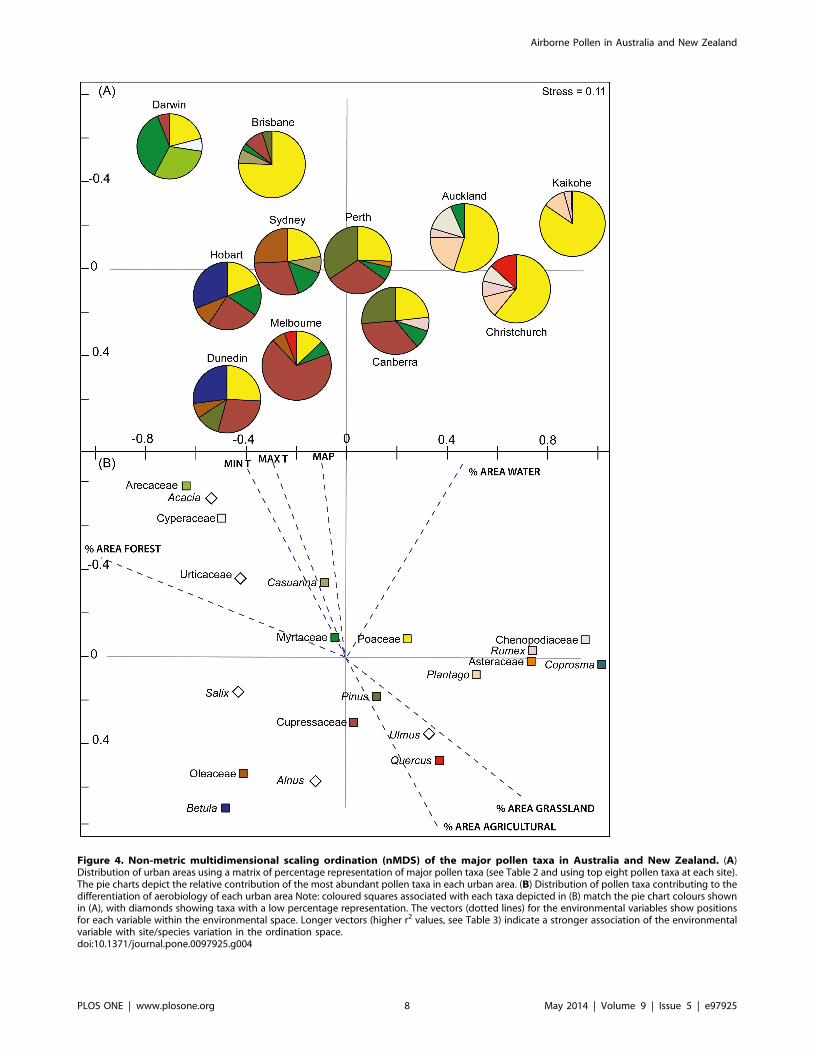
Figure 4. Non-metric multidimensional scaling ordination (nMDS) of the major pollen taxa in Australia and New Zealand. (A)Distribution of urban areas using a matrix of percentage representation of major pollen taxa (see Table 2 and using top eight pollen taxa at each site).The pie charts depict the relative contribution of the most abundant pollen taxa in each urban area. (B) Distribution of pollen taxa contributing to thedifferentiation of aerobiology of each urban area Note: coloured squares associated with each taxa depicted in (B) match the pie chart colours shownin (A), with diamonds showing taxa with a low percentage representation. The vectors (dotted lines) for the environmental variables show positionsfor each variable within the environmental space. Longer vectors (higher r2 values, see Table 3) indicate a stronger association of the environmentalvariable with site/species variation in the ordination space.doi:10.1371/journal.pone.0097925.g004
Airborne Pollen in Australia and New Zealand
PLOS ONE | www.plosone.org 8 May 2014 | Volume 9 | Issue 5 | e97925

Ta
ble
3.
Lan
dco
ver
attr
ibu
tes
wit
hin
a1
00
kmra
diu
sas
soci
ate
dw
ith
eac
hae
rob
iolo
gy
reco
rdin
gst
atio
n,
ne
are
stw
eat
he
rst
atio
nsu
mm
ary
dat
aan
dn
MD
Sax
is1
and
axis
2sc
ore
s.
Urb
an
Are
a%
Are
aW
ate
r%
Are
aA
gri
cult
ura
l%
Are
aG
rass
%A
rea
Fo
rest
Ma
xT
( 6C
)M
inT
( 6C
)M
AP
(mm
)
Da
rwin
45
.50
.10
.25
4.3
33
.31
9.3
17
30
Bri
sba
ne
34
.91
.50
.11
0.1
30
.31
0.0
99
7
Pe
rth
38
.13
1.6
3.5
26
.83
1.4
7.7
85
0
Sy
dn
ey
51
.14
.20
.34
4.3
25
.98
.01
21
3
Ca
nb
err
a2
.23
0.2
5.1
62
.52
8.0
20
.16
12
Me
lbo
urn
e1
9.0
27
.61
4.3
39
.12
5.9
6.0
65
0
Ho
ba
rt4
0.2
6.3
7.3
46
.22
1.6
4.5
61
6
Ka
iko
he
65
.10
.62
2.2
12
.22
4.3
7.8
13
04
Au
ckla
nd
62
.92
.22
4.8
10
.12
3.7
7.1
12
39
Ch
rist
chu
rch
57
.92
0.5
18
3.6
23
.02
.06
51
Du
ne
din
62
.46
.13
1.1
0.4
18
.93
.28
14
nM
DS
Ax
is1
0.4
80
.36
0.7
22
0.8
92
0.2
92
0.4
02
0.1
1
nM
DS
Ax
is2
20
.88
0.9
30
.70
20
.45
20
.96
20
.92
20
.99
r20
.14
0.3
90
.33
0.3
40
.38
0.7
70
.66
Pr(
.r)
0.5
68
0.1
64
0.2
05
0.1
95
0.1
54
0.0
02
0.0
13
Th
esi
gn
ific
ant
rela
tio
nsh
ips
(p,
0.0
5)
be
twe
en
en
viro
nm
en
tal
vari
able
san
dai
rbo
rne
po
llen
are
ind
icat
ed
inb
old
(T=
tem
pe
ratu
re,
MA
P=
Me
anA
nn
ual
Pre
cip
itat
ion
).M
ete
oro
log
ical
dat
ad
eri
ved
fro
mW
orl
dcl
im[3
4]
and
lan
dco
ver
dat
afr
om
Gir
iet
al.
[35
].d
oi:1
0.1
37
1/j
ou
rnal
.po
ne
.00
97
92
5.t
00
3
Airborne Pollen in Australia and New Zealand
PLOS ONE | www.plosone.org 9 May 2014 | Volume 9 | Issue 5 | e97925
Airborne Pollen in Australia and New Zealand
PLOS ONE | www.plosone.org 10 May 2014 | Volume 9 | Issue 5 | e97925

where considerable effort has been applied to standardise
methodologies, teams working in Australia and New Zealand
have tended to use a variety of collection and counting
methodologies with little or no co-ordination between aerobiology
stations in different urban areas. Despite the idiosyncrasies of the
data, this study supports a basic principle that underpins
palynology – that airborne pollen is a sensitive proxy of the
current climate and flora of a region. Our results indicate that this
principle applies as much to the introduced flora as to indigenous
vegetation, despite concerted human effort to manipulate the
former.
We found that Australian and New Zealand urban areas from a
similar climate zones have similar pollen spectra but important
differences occur due to surrounding land use and the establish-
ment of non-native plants. Likewise, in similar climate zones,
pollen season of each taxon is similar but not the same. For
example, urban areas are often surrounded by agricultural
landscapes that have a diversity of pollen predominantly
represented by grass pollen and characterized by short seasons
(Figure 5) compared to urban areas where there is more
surrounding forest cover (e.g. Sydney and Hobart). Changes in
land use on urban boundaries also have the potential to affect the
types of airborne pollen inside the urban area [39]. The
predominance of exotic and invasive tree and shrub species (and
certainly non-native grasses, albeit these cannot be taxonomically
resolved) highlights the profound changes that have occurred
following European colonisation of Australia and New Zealand.
For instance, in the urban areas of southern Australia and New
Zealand, the widely planted birches are particularly dominant.
Temperature and rainfall are known to be primary controls on
the daily distribution of airborne pollen in Australia and New
Zealand, however, other climate variables that may influence the
dissemination of these allergenic pollen types in the atmosphere
are not well understood. Other variables such as the El Nino-
Southern Oscillation (ENSO) have not been investigated, even
though this large-scale ocean-atmosphere anomaly has been
shown to modify climatic patterns, leading to droughts and floods,
which have local and regional implications on the biosphere as
well as vector borne diseases. A similar climate oscillation in
western Europe, the North Atlantic Oscillation, has been linked
with seasonal variation in grass pollen (e.g. [40]). ENSO and other
short term climate oscillations such as the Southern Annular Mode
and Indian Ocean Dipole may be important variables that could
account for interseasonal differences observed in airborne pollen
counts and seasonal starting dates in Australasia. The broad-scale
patterns in the distribution, abundance and season of pollen
amongst Australasian urban areas provide some clues as to
potential changes in aerobiology due to climate change. Evidence
from Europe and North America demonstrates that climate
change has already increased the abundance and seasonal
duration of allergenic pollens such as birch and ragweed and
possibly increased concentrations of allergenic compounds
[9,12,41]. Changes in the burden of allergenic disease related to
changing climate have also been demonstrated [41,42].
In marked contrast to developed countries of the northern
hemisphere [43], the potential allergenic impacts of endemic
southern hemisphere plants are poorly characterized despite many
being identified as important allergens. Given the widespread
population exposure to known allergenic plants we endorse the
recommendation of the 2007 study of the economic impact of
allergic diseases in Australia by Access Economics that ‘studies of the
aerobiology and clinical significance of potential native Australian triggers of
respiratory allergic disease should be made a priority’ [44]. Possible triggers
include both native and non-native taxa. Native genera include
common woody plants (Eucalyptus, Melaleuca, Callistemon and Acacia
[45–51]) and grasses (Sorghum, Sarga and Andropogon [52–54]). Non-
native plants include a number of taxa known to be allergenic. For
example, birch is an important allergenic pollen in Scandinavia
and a notable allergen throughout north-central Europe [6,55]
and it has been identified as an important allergenic pollen type in
southern Australian urban areas [56]. Similarly, the non-native
gamba grass (Andropogon gayensis) is thought to have lengthened the
pollen season and increased the community burden of allergic
rhinitis in Darwin [57].
Exotic allergenic plants have the potential to cause profound
public health impacts if their ranges were to expand and their
population to increase. For example, pollen produced by olive
trees (Olea europaea) is the leading cause of seasonal allergic diseases
in some regions of southern Europe [58], and this species is
expanding its range across mediterranean climate zones in
Australia [59] adding a new allergic pollen in areas where there
are already allergic pollen in the atmosphere. If Ragweed species
(Ambrosia spp.) were to expand their range and abundance they
would add a new source of allergenic into autumn [60–62], a
season currently with very few types of pollen (see Figure 5).
Because allergic sensitisation to multiple plant allergens is common
[63], our results show that the juxtaposition of non-native tree
pollen such as birch in early-mid spring with Poaceae pollen in
mid-late spring and summer could result in a lengthened period of
risk for people allergic to pollens (cf. Figure 2).
Conclusions
Our study highlights the need to monitor changes to the
aerobiology and provides a framework for targeting the most
important taxa in terms of abundance and allergenic effects for
each urban area. Establishing systematic regionally-based moni-
toring of airborne pollen will enable Australian and New
Zealanders to better understand the high taxonomic diversity
and seasonal variability of allergenic pollens. This will redress the
paucity of research on the clinical and public health impacts and
treatments for common endemic allergenic species such as
Eucalyptus and Sorghum. Monitoring the increasing abundance of
allergenic exotic species populations that can move from a
dormant ‘sleeper’ populations to aggressive expansion phases,
Ragweed (Ambrosia spp.) being a example, will also be a priority.
Understanding the impacts that climate change will have on the
phenological cycles and range of allergenic species into the future
will be a critical step in the advancement of aerobiology studies in
the Australasian region [9].
Acknowledgments
The authors wish to thank the staff of Australian Centre for Ecological
Analysis and Synthesis, Terrestrial Ecosystem Research Network for
assistance in organising the Workshop 1 of the Working Group
‘‘Understanding Australian aerobiology to monitor environmental change
Figure 5. Pollen calendar for aerobiologically significant pollen taxa (contributing 80%+ to the annual atmospheric pollen) inAustralian and New Zealand urban areas. The pie charts are divided into monthly segments with the red shade depicting the pollen season foreach taxa to the nearest month in a given urban area. The pollen season for each taxon is determined using the period encompassing 90% of theannual pollen rain (see Figure 2).doi:10.1371/journal.pone.0097925.g005
Airborne Pollen in Australia and New Zealand
PLOS ONE | www.plosone.org 11 May 2014 | Volume 9 | Issue 5 | e97925

and human allergenic exposure’’, North Stradbroke Island, Australia (11–
15 March, 2013). Alison Specht, Kaitao Lai and Siddeswara Guru assisted
with the construction and implementation of the online aerobiology data
set. We thank Doctors Diana Bass and Geoffrey Morgan for provision of
their published pollen count data from Sydney. Alison Jaggard has been
assisted by the Environmental Trust (project reference number 2011/RD/
0049), New South Wales Government. The authors also acknowledge the
contributions a diverse group of people made to this study through
counting pollen and maintaining the pollen records that we consolidated
and analysed.
Author Contributions
Conceived and designed the experiments: SGH DMJSB RMN FHJ PJB JB
BC BE IG BJG AJ DM EN MT AH DV JMD. Analyzed the data: SGH
GJW. Wrote the paper: SGH DMJSB RMN FHJ. Contributed data: EN
BE SGH DM DMJSB FM BJG FHJ RMN. The application for funding
support was led by the principal investigator: JMD.
References
1. D’Costa D, Kershaw AP (1997) An expanded recent pollen database from south-eastern Australia and its potential for refinement of palaeoclimatic estimates.
Aust J Bot 45: 583–605.
2. Wilmshurst JM, McGlone MS (2005) Origin of pollen and spores in surface lake
sediments: comparison of modern palynomorph assemblages in moss cushions,surface soils and surface lake sediments. Rev Palaeobot Palynol 136: 1–15.
3. Fletcher M-S, Thomas I (2007) Modern pollen–vegetation relationships inwestern Tasmania, Australia. Rev Palaeobot Palynol 146: 146–168.
4. Tng DYP, Hopf F, Haberle SG, Bowman DMJS (2010) Seasonal pollen
distribution in the atmosphere of Hobart, Tasmania: preliminary observations
and congruence with flowering phenology. Aust J Bot 58: 440–452.
5. Schappi GF, Taylor PE, Kenrick J, Staff IA, Suphioglu C (1998) Predicting thegrass pollen count from meteorological data with regard to estimating the
severity of hayfever symptoms in Melbourne (Australia). Aerobiologia 14: 29–37.
6. Emberlin J, Detandt M, Gehrig R, Jaeger S, Nolard N, et al. (2002) Responses in
the start of Betula (birch) pollen seasons to recent changes in spring temperaturesacross Europe. Int J Biometeorol 46: 159–170. [Erratum published (2003) 47:
113–115.].
7. Rodrıguez-Rajo FJ, Frenguelli G, Jato MV (2003) Effect of air temperature on
forecasting the start of the Betula pollen season at two contrasting sites in thesouth of Europe (1995–2001). Int J Biometeorol 47: 117–125.
8. Sofiev M, Siljamo P, Ranta H, Linkosalo T, Jaeger S, et al. (2013) A numericalmodel of birch pollen emission and dispersion in the atmosphere. Description of
the emission module. Int J Biometeorol 57: 45–58.
9. Ziska L, Knowlton K, Rogers C, Dalan D, Tierney N, et al. (2011) Recent
warming by latitude associated with increased length of ragweed pollen season incentral North America. Proc Natl Acad Sci U S A 108: 4248–4251.
10. Ziello C, Sparks TH, Estrella N, Belmonte J, Bergmann KC, et al. (2012)
Changes to airborne pollen counts across Europe. PLoS ONE 7: e34076.
11. Ziska LH, Beggs PJ (2012) Anthropogenic climate change and allergen exposure:
The role of plant biology. J Allergy Clin Immunol 129: 27–32.
12. Newnham RM, Sparks TH, Skjøth CA, Head K, Adams-Groom B, et al. (2013)
Pollen season and climate: Is the timing of birch pollen release in the UKapproaching its limit? Int J Biometeorol 57: 391–400.
13. Newnham RM, Fountain DW, Cornford CC, Forde MB (1995) A national
survey of airborne pollen and grass flowering in New Zealand, with implications
for respiratory disorder. Aerobiologia 11: 239–252.
14. Bass D, Morgan G (1997) A three year (1993–1995) calendar of pollen andAlternaria mould in the atmosphere of south western Sydney. Grana 36: 293–300.
15. Ong EK, Singh MB, Knox RB (1995) Seasonal distribution of pollen in theatmosphere of Melbourne: an airborne pollen calendar. Aerobiologia 11: 51–55.
16. Green BJ, Dettmann ME, Yli-Panula E, Rutherford S, Simpson R (2004)
Aeropalynology of Australian native arboreal species in Brisbane, Australia.
Aerobiologia 20: 43–52.
17. Stevenson J, Haberle SG, Johnston FH, Bowman DMJS (2007) Seasonaldistribution of pollen in the atmosphere of Darwin, tropical Australia:
Preliminary results. Grana 46: 34–42.
18. Medek DE, Kljakovic M, Fox I, Pretty DG, Prebble M (2012) Hay fever in a
changing climate: linking an internet-based diary with environmental data.Ecohealth 9: 440–447.
19. European Aerobiology Society (2011) Minimum requirements to manageaerobiological monitoring stations included in a national network involved in the
EAN. International Aerobiology Newsletter 72: 1.
20. Knox RB (1979) Pollen and Allergy. Southampton, Edward Arnold, 60pp.
21. Hirst JM (1952) An automatic volumetric spore trap. Ann Appl Biol 39: 257–
265.
22. Chapman JA (1982) The enhancement of the practice of clinical allergy with
daily pollen and spore counts. Immunol Allergy Pract 4: 13–18.
23. Comtois P, Mandrioli P (1997) Pollen capture media: a comparative study.Aerobiologia 13: 149–154.
24. Lacey ME, West JS (2006) The air spora. A manual for catching and identifyingairborne biological particles. Dordrecht: Springer.
25. Comtois P, Alcazar P, Neron D (1999) Pollen counts statistics and its relevanceto precision. Aerobiologia 15: 19–28.
26. Green BJ, Dettmann ME, Rutherford S, Simpson RW (2002) Airborne pollen of
Brisbane, Australia: a five-year record, 1994–1999. Grana 41: 242–250.
27. Buters JTM, Thibaudon M, Smith M, Kennedy R, Rantio-Lehtimaki A, et al.
(2012) Release of Bet v 1 from birch pollen from 5 European countries. Resultsfrom the HIALINE study. Atmos Environ 55: 496–505.
28. Hjelmroos M, Beyon F, Culliver S, Jones AS, Tovey E (1999) Airborne allergens:
Interactive identification of allergenic pollen and fungal spores. Compact Disc,
Institute of Respiratory Medicine Limited, Sydney.
29. Jato V, Rodrıguez-Rajo FJ, Alcazar P, De Nuntiis P, Galan C, et al. (2006) May
the definition of pollen season influence aerobiological results? Aerobiologia 22:
13–25.
30. Nilsson S, Persson S (1981) Tree pollen spectra in the Stockholm region
(Sweden), 1973–1980. Grana 20: 179–182.
31. Spieksma FThM, Emberlin JC, Hjelmroos M, Jager S, Leuschner RM (1995)
Atmospheric birch (Betula) pollen in Europe: Trends and fluctuations in annual
quantities and the starting dates of the seasons. Grana 34: 51–57.
32. Clarke KR (1993) Non-parametric multivariate analyses of changes in
community structure. Aust J Ecol 18: 117–143.
33. Oksanen J, Blanchet FG, Kindt R, Legendre P, Minchin PR, et al. (2013) vegan:
Community Ecology Package. R package version 2.0-8. http://CRAN.R-
project.org/package = vegan
34. Hijmans RJ, Cameron SE, Parra JL, Jones PG, Jarvis A (2005) Very high
resolution interpolated climate surfaces for global land areas. Int J Climatol 25:
1965–1978.
35. Giri C, Zhu Z, Reed B (2005) A comparative analysis of the Global Land Cover
2000 and MODIS land cover data sets. Remote Sens Environ 94: 123–132.
36. Hutchinson MF, McIntyre S, Hobbs RJ, Stein JL, Garnett S, et al. (2005)
Integrating a global agro-climatic classification with bioregional boundaries in
Australia. Global Ecol Biogeogr 14: 197–212.
37. Ong EK, Singh MB, Knox RB (1995) Grass pollen in the atmosphere of
Melbourne: seasonal distribution over nine years. Grana 34: 58–63.
38. Newnham RM (1999) Monitoring biogeographical response to climate change:
The potential role of aeropalynology. Aerobiologia 15: 87–94.
39. Emberlin J, Mullins J, Corden J, Jones S, Millington W, et al. (1999) Regional
variations in grass pollen seasons in the UK, long-term trends and forecast
models. Clin Exp Allergy 29: 347–356.
40. Smith M, Emberlin J, Stach A, Rantio-Lehtimaki A, Caulton E, et al. (2009)
Influence of the North Atlantic Oscillation on grass pollen counts in Europe.
Aerobiologia 25 (4): 321–332.
41. Beggs PJ (2004) Impacts of climate change on aeroallergens: past and future.
Clin Exp Allergy 34: 1507–1513.
42. Beggs PJ, Bambrick HJ (2005) Is the global rise of asthma an early impact of
anthropogenic climate change? Environ Health Perspect 113: 915–919.
43. Patel NJ, Bush RK (2000) The role of environmental allergens in rhinitis.
Immunol Allergy Clin North Am 20: 323–353.
44. Access Economics PL (2007) The economic impact of allergic disease in
Australia: not to be sneezed at. Australasian Society of Clinical Immunology and
Allergy (ASCIA). 111 p.
45. Howlett BJ, Hill DJ, Knox RB (1982) Cross-reactivity between Acacia (wattle)
and rye grass pollen allergens: Detection of allergens in Acacia (wattle) pollen.
Clin Allergy 12: 259–268.
46. Sweeney M, Hosseiny S, Hunter S, Klotz SD, Gennaro RN, et al. (1994)
Immunodetection and comparison of melaleuca, bottlebrush, and bahia pollens.
Int Arch Allergy Immunol 105: 289–296.
47. Liam C-K, Loo K-L, Wong CM-M, Lim K-H, Lee T-C (2002) Skin prick test
reactivity to common aeroallergens in asthmatic patients with and without
rhinitis. Respirology 7: 345–350.
48. Altintas DU, Karakoc GB, Yilmaz M, Pinar M, Kendirli SG, et al. (2004)
Relationship between pollen counts and weather variables in East-Mediterra-
nean Coast of Turkey: Does it affect allergic symptoms in pollen allergic
children? Clin Dev Immunol 11: 87–96.
49. Sritipsukho P (2004) Aeroallergen sensitivity among Thai children with allergic
respiratory diseases: a hospital-based study. Asian Pac J Allergy Immunol 22:
91–95.
50. Rutherford S (2001) Air pollution and asthma severity in South East
Queensland: exposure and effects [PhD]. Griffith University.
51. Hanigan IC, Johnston FH (2007) Respiratory hospital admissions were
associated with ambient airborne pollen in Darwin, Australia, 2004–2005. Clin
Exp Allergy 37: 1556–1565.
52. Davies JM, Li H, Green M, Towers M, Upham JW (2012) Subtropical grass
pollen allergens are important for allergic respiratory diseases in subtropical
regions. Clin Transl Allergy 2:4.
Airborne Pollen in Australia and New Zealand
PLOS ONE | www.plosone.org 12 May 2014 | Volume 9 | Issue 5 | e97925

53. Lazarides M, Hacker JB, Andrew MH (1991) Taxonomy, cytology and ecology
of indigenous Australian sorghums (Sorghum Moench: Andropogoneae: Poaceae).Aust Syst Bot 4: 591–635.
54. Spangler RE (2003) Taxonomy of Sarga, Sorghum and Vacoparis (Poaceae:
Andropogoneae). Aust Syst Bot 16: 279–299.55. Burbach GJ, Heinzerling LM, Edenharter G, Bachert C, Bindslev-Jensen C, et
al. (2009) GA2LEN skin test study II: Clinical relevance of inhalant allergensensitizations in Europe. Allergy 64: 1507–1515.
56. Baldo BA, Wrigley CW (1984) Allergy in Australia: Symptoms, diagnosis and
treatment. Special Supplement. Med J Aust 141: S12–S18.57. Johnston FH, Hanigan IC, Bowman DMJS (2009) Pollen loads and allergic
rhinitis in Darwin, Australia: a potential health outcome of the grass-fire cycle.Ecohealth 6: 99–108.
58. D’Amato G, Liccardi G (2002) The increasing trend of seasonal respiratory
allergy in urban areas. Allergy 57: 35–36.59. Cuneo P, Leishman MR (2006) African olive (Olea europaea subsp. cuspidata) as an
environmental weed in eastern Australia: a review. Cunninghamia 9: 545–77.
60. White JF, Bernstein DI (2003) Key pollen allergens in North America. AnnAllergy Asthma Immunol 91: 425–435; quiz 35–6, 92.
61. Bass DJ, Delpech V, Beard J, Bass P, Walls RS (2000) Ragweed in Australia.Aerobiologia 16: 107–111.
62. Bass DJ, Delpech V, Beard J, Bass P, Walls RS (2000) Late summer and fall
(March–May) pollen allergy and respiratory disease in Northern New SouthWales, Australia. Ann Allergy Asthma Immunol 85: 374–381.
63. Greiner AN, Hellings PW, Rotiroti G, Scadding GK (2011) Allergic rhinitis.Lancet 378: 2112–2122.
Airborne Pollen in Australia and New Zealand
PLOS ONE | www.plosone.org 13 May 2014 | Volume 9 | Issue 5 | e97925