The macro perspective on generalized trust
22
Aarhus, 3/10-2007 The macro perspective on generalized trust Martin Paldam, 1 School of Economics and Management, University of Aarhus 2 For G.T. Svendsen and G.L.H. Svendsen, eds., Handbook of Public Choice. Forthcoming Abstract: The paper looks at 188 polls of generalized trust (most people can be trusted). This question has been asked by the World Values Surveys in 83 countries, over a period of almost 20 years. It is argued that the 188 resulting average “G-scores” measures the justified “rational” trust levels in the countries. It is demonstrated that the G-scores are sufficiently volatile to be endogenous, and that they reacted strongly to the transition from socialism in Eastern Europe. It is further demon- strated that the Gini coefficient, life satisfaction, corruption, and thus indirectly income are the best explanatory factors for the G-trust. They are all strongly related to income, and dominate the direct effect of trust on income, and trust is at most weakly related to democracy either way. Keywords: Generalized trust, economic development, social capital Jel: O11, D70, Z13 1. Address: School of Economics and Management, University of Aarhus DK-8000 Aarhus C, Denmark. E-mail: [email protected], URL: http://martin.paldam.dk 2. The paper has been presented at the Workshop and Summer School on Social capital, corporate social responsi- bility and sustainable economic development. I am grateful to the discussants, especially to Giacomo degli Antoni, Leonardo Becchetti and Felix Roth. I have also benefited from discussions with Gert Tinggaard Svendsen and Christian Bjørnskov. A longer version with the statistical analysis is published as Paldam (2008). 1
Transcript of The macro perspective on generalized trust

Aarhus, 3/10-2007
The macro perspective on generalized trust
Martin Paldam,1 School of Economics and Management, University of Aarhus2
For G.T. Svendsen and G.L.H. Svendsen, eds., Handbook of Public Choice. Forthcoming
Abstract:
The paper looks at 188 polls of generalized trust (most people can be trusted). This question has
been asked by the World Values Surveys in 83 countries, over a period of almost 20 years. It is
argued that the 188 resulting average “G-scores” measures the justified “rational” trust levels in
the countries. It is demonstrated that the G-scores are sufficiently volatile to be endogenous, and
that they reacted strongly to the transition from socialism in Eastern Europe. It is further demon-
strated that the Gini coefficient, life satisfaction, corruption, and thus indirectly income are the
best explanatory factors for the G-trust. They are all strongly related to income, and dominate the
direct effect of trust on income, and trust is at most weakly related to democracy either way.
Keywords: Generalized trust, economic development, social capital
Jel: O11, D70, Z13
1. Address: School of Economics and Management, University of Aarhus DK-8000 Aarhus C, Denmark. E-mail: [email protected], URL: http://martin.paldam.dk 2. The paper has been presented at the Workshop and Summer School on Social capital, corporate social responsi-bility and sustainable economic development. I am grateful to the discussants, especially to Giacomo degli Antoni, Leonardo Becchetti and Felix Roth. I have also benefited from discussions with Gert Tinggaard Svendsen and Christian Bjørnskov. A longer version with the statistical analysis is published as Paldam (2008).
1

1. Introduction: The G-trust variable
One of the key variables in the social capital discussions is generalized trust.3 To save words the
average generalized trust for a country is termed: G-trust. Table 1 gives the formulation and the
aggregate of all answers in the World Value Surveys4 that covers 188 pools in 83 countries during
the last two decades of the 20th century. Almost 30% of the 255,399 answers say that “most
people can be trusted”. The individual country G-trusts are listed in the Appendix.
Table 1. The G-trust item in the World value Surveys: 1980-2000 Item A165: Generally speaking, would you say that most people can
be trusted or that you need to be very careful in dealing with people?
Answer Frequency Percent
Most people can be trusted 75,466 29.55
Can’t be too careful 179,933 70.45
Sum 255,399 100.00
Note: The WVS covers 188 polls covering 267,870 people in 83 countries
in 4 waves. The G-trust item is included in all 188 polls done.
Justified trust reduces transaction and monitoring costs. It saves time and trouble the higher it is
in society. It is thus a factor of production – it will be demonstrated that it is not a powerful one.
Any country has a level of justifiable trust. If you have more trust than that, you are a
“sucker” that other people exploit. If you have less trust, you are a “cynic”, who creates costs and
trouble for other people. Most prefer to deal with reasonable people, who are realistic by being
close to the justifiable level. By the law of large numbers we get:
Thesis: The Rationality Theorem of Trust: Trust is rational for society at large.
We may measure it poorly and individuals deviate to both sides, but the G–trust is rational and an
important characteristic of a society.
3. See Fukuyama (1995). The present article does not discuss the definitions of social capital; see Paldam (2000). 4. For easy replicability the WV-survey data are used throughout this paper. The data are documented in Inglehart et al. (1998, 2004). I use the full data set as available from http://www.worldvaluessurvey.org.
2

The G-trusts of the 188 polls are depicted on Figure 1, which shows that they have a
strong correlation to income. The concept of income used is natural logarithm to gdp. Here gdp is
GDP per capita – the distribution of that income is measured by another variable, Gini. The
logarithm is used to make the income measure relative, so that an increase of 10% appears
equally big when it takes place at a low level or at a high level of income.
Figure 1. Scatter of the 188 G-trust and income
Figure 2 shows an almost equally strong correlation of G-trust and LiSa, high life satisfaction
used in happiness research as a welfare measure (see Frey and Stutzer, 2002). The two – rather
similar – figures allow us to make three observations about the G-trust:
Obs 1: It varies widely between countries, from close to 0% to almost 70%.
Obs 2: It is related to other important matters in society as income and welfare.
Obs 3: It contains a “cultural” element so that some groups of similar countries cluster also as
regards GT-trust.
3

Figure 2. Scatter of the 187 G-trust and LiSa, high life satisfaction
Note: Life satisfaction is missing in one of the 188 polls.
As G-trusts from a wide variety of countries are considered, an organizing principle is necessary.
For this purpose I use the theory of the Grand Transition. It is the process, whereby poor
countries become wealthy, and the article thus has the relation between the G-trust and economic
development as the underlying theme.
The newest survey of the literature on growth and trust is Bjørnskov (2007). It appears
that the variables in Table 2 are the main ones that enter in the family of models tried, but a
handful of other variables have been tried as well, though with less success, see e.g. and Delhey
Newton (2005) and Bjørnskov (2006).
Section 2 offers a few notes on GT-theory. Figure 1 suggests that the Grand Transition is
associated with a change from a G-trust of 10% to about 40%, i.e. by 30 points. Section 3
discusses the time dimension: Is trust a stable factor in the society? Section 4 looks at a set of the
main variables – listed in Table 2 – which are related to the G-trust and discusses causality.
Section 5 discussed the problematic relations between the G-trust and on one side development
and on the other democracy. Section 6 contains concluding remarks.
4
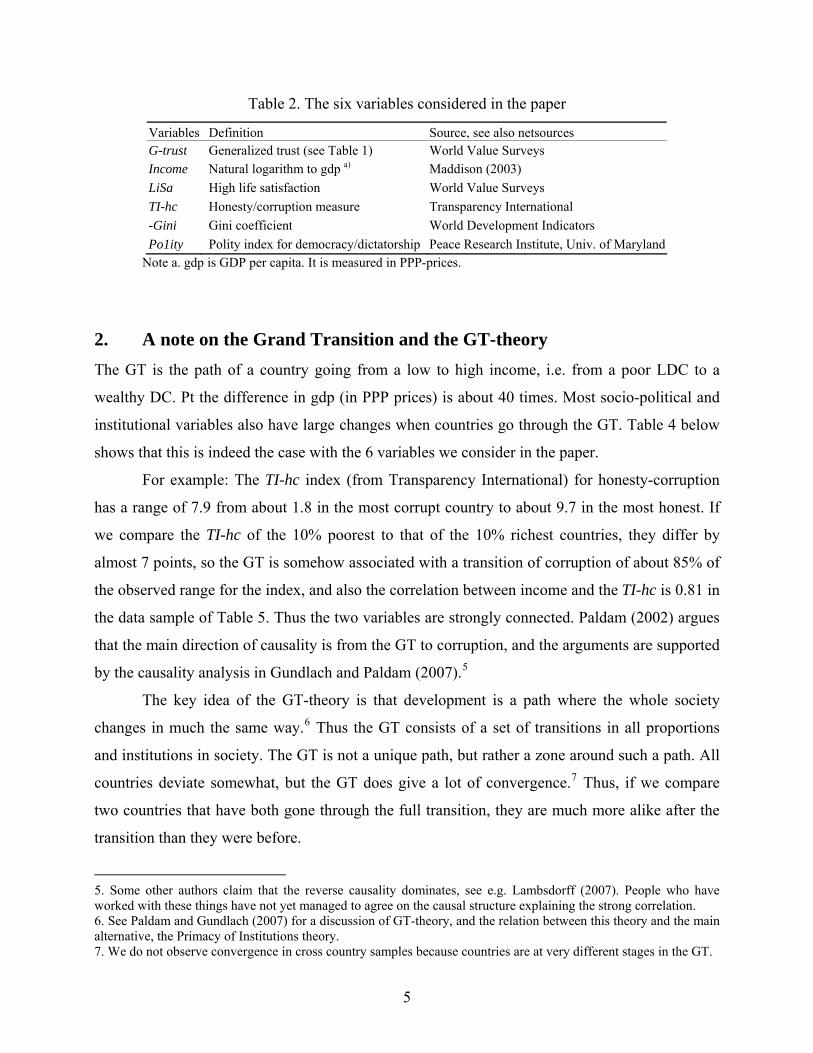
Table 2. The six variables considered in the paper
Variables Definition Source, see also netsources G-trust Generalized trust (see Table 1) World Value SurveysIncome Natural logarithm to gdp a) Maddison (2003)LiSa High life satisfaction World Value SurveysTI-hc Honesty/corruption measure Transparency International -Gini Gini coefficient World Development Indicators Po1ity Polity index for democracy/dictatorship Peace Research Institute, Univ. of Maryland
Note a. gdp is GDP per capita. It is measured in PPP-prices.
2. A note on the Grand Transition and the GT-theory The GT is the path of a country going from a low to high income, i.e. from a poor LDC to a
wealthy DC. Pt the difference in gdp (in PPP prices) is about 40 times. Most socio-political and
institutional variables also have large changes when countries go through the GT. Table 4 below
shows that this is indeed the case with the 6 variables we consider in the paper.
For example: The TI-hc index (from Transparency International) for honesty-corruption
has a range of 7.9 from about 1.8 in the most corrupt country to about 9.7 in the most honest. If
we compare the TI-hc of the 10% poorest to that of the 10% richest countries, they differ by
almost 7 points, so the GT is somehow associated with a transition of corruption of about 85% of
the observed range for the index, and also the correlation between income and the TI-hc is 0.81 in
the data sample of Table 5. Thus the two variables are strongly connected. Paldam (2002) argues
that the main direction of causality is from the GT to corruption, and the arguments are supported
by the causality analysis in Gundlach and Paldam (2007).5
The key idea of the GT-theory is that development is a path where the whole society
changes in much the same way.6 Thus the GT consists of a set of transitions in all proportions
and institutions in society. The GT is not a unique path, but rather a zone around such a path. All
countries deviate somewhat, but the GT does give a lot of convergence.7 Thus, if we compare
two countries that have both gone through the full transition, they are much more alike after the
transition than they were before.
5. Some other authors claim that the reverse causality dominates, see e.g. Lambsdorff (2007). People who have worked with these things have not yet managed to agree on the causal structure explaining the strong correlation. 6. See Paldam and Gundlach (2007) for a discussion of GT-theory, and the relation between this theory and the main alternative, the Primacy of Institutions theory. 7. We do not observe convergence in cross country samples because countries are at very different stages in the GT.
5

Poor countries have little physical and human capital, mortality is high, people live in the
countryside, religiosity and corruption are high, etc. Development changes all of that, and we
speak of the urban transition, the demographic and the democratic transitions, the sectoral
transition, the religious transition (or secularization), the transition of corruption, etc. Here the
GT-claim is that all these transitions are basically endogenous, but if one of them does not occur
it turns into a development barrier.
Consequently, the GT is a highly simultaneous dynamic process, where everything
depends upon everything else, resulting in much multicollinearity that makes it difficult to
untangle causality as illustrated by a comparison of Figures 1 and 2.
GT-theory takes income/production as the most representative “catch all” variable for the
Grand Transition, and thus says that the key causal link expected is from the income level to the
other variable. This is obviously a reduced form relation, as it covers the full web of simultaneity.
All variables that are within the GT-complex can be used to explain each other – see e.g. Table 5
below. From nearly all sets of 3 variables from that table it is easy to present a model where any
two of them explain the third in a seemingly convincing way.
Thus the key variable is income/production. We use the natural logarithm to gdp, which is
the GDP (gross domestic product) per capita, as the best income variable.
Income is ln gdp, where we use the gdp-data, from Maddison (2001, 2003).
The concept of the Grand Transition thus implies that everything depends upon everything else.
The big simultaneity has caused many researchers to look for a key: Something that is primary,
in the sense that it causes development, but is not caused by development. In order to work, such
a key has to be reasonably stable and must differ substantially between countries.
6

3. The time dimension: Are G-trusts stable? The book that pushed the concept of Social Capital into it present status was Putnam (1993).8
Two of its main ideas are:9
Claim 1: Stability: Social capital stays stable for centuries. At present we take this claim to mean
that the G-trusts are stable.
Claim 2: Primacy: Social capital is primary to institutional and economic development.
Putnam’s claim is that social capital is primary and hereby fills a crucial role. Claim 2 states that
social capital is primary to institutions – or at least to the effectiveness of institutions.10
The same claim is also made – though in a different context – by Uslaner (2002) as
regards G-trust. Uslaner takes G-trust back to the “moral” foundation of society. It is thus some-
thing basic that even deserves to be primary.
To the extent that G-trust is a factor of production, the idea that G-trust changes slowly is
a troubling idea, especially if it has to do with the moral foundation. Putnam’s claim is that poor
countries are deemed to remain poor for a long time to come, due to something that was formed
slowly centuries ago. Uslaner’s idea leads to the conclusion that countries are – and maybe even
deserve to be – richer because they have a sounder moral foundation.
Table 3. All changes ΔG that can be calculated from the 188 polls
About 5 years 10 years 15 years 20 years Waves W2-W3 W3-W4 All W1-W2 W2-W4 All W1-W3 W1-W4 App. years 1990-95 1995-00 5 year 1982-90 1990-00 10 year 1982-95 1982-00 Number 31 41 72 20 39 59 11 19 (A) Average ΔG -4.49 1.10 -1.31 3.08 -3.54 -1.30 -4.50 -0.57 (B) Average |ΔG| 5.76 6.73 6.91 5.44 7.25 7.39 5.68 8.74 Fraction of |ΔG| >10% 19.4% 14.6% 16.7% 10.0% 23.1% 18.6% 18.2% 42.1% Note: The table covers all 161 pairs of G-trusts for the same country that can be calculated from the 188 polls.
8. Putnam’s definition of social capital is network density, though he discusses its relation to trust. Thesis 3 is defended in Helliwell and Putnam (1995). 9. I should state that this is the standard interpretation of Putmans book, and that it does not speak of G-trust, but of network density. Also, Putnam (2000) describes a large fall in social capital in the US over a couple of decades. 10. Consequently Putnam’s claim encompasses the primacy of institutions hypothesis claim by Acemoglu, Johnson and Robinson (see their 2005).
7
Below we show that G-trust do move more than enough to be endogenous, and that it is – at least
in one important case – endogenous.11
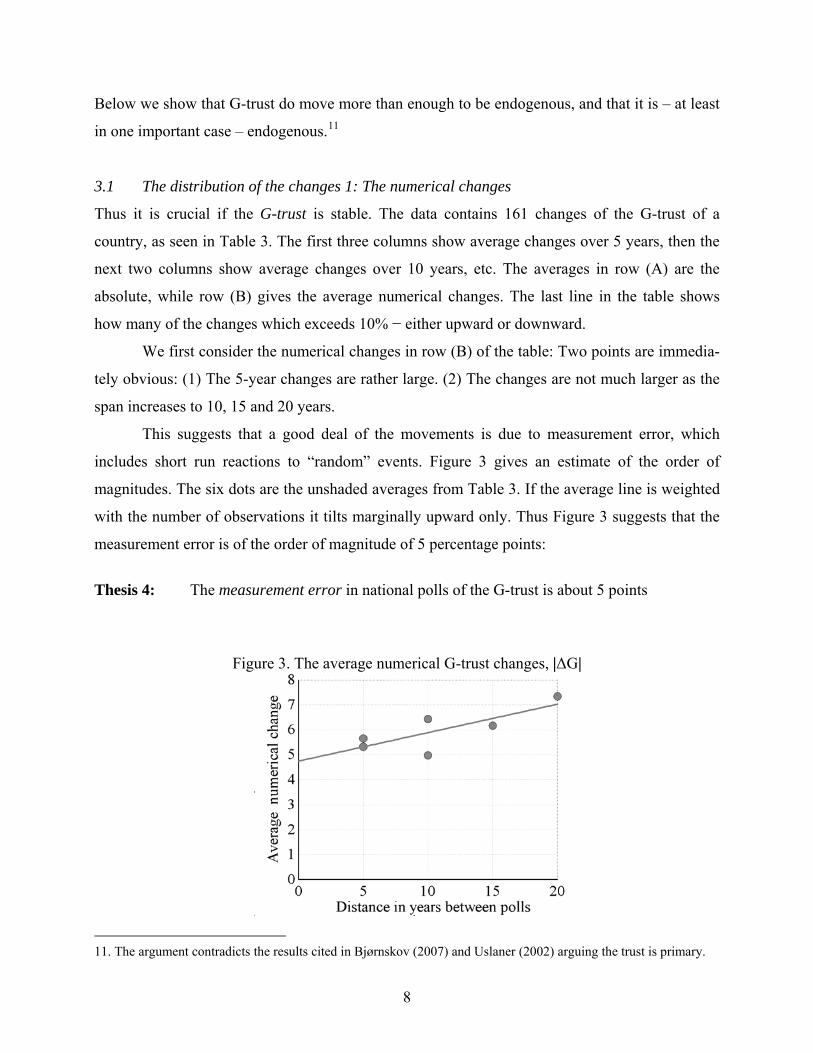
3.1 The distribution of the changes 1: The numerical changes
Thus it is crucial if the G-trust is stable. The data contains 161 changes of the G-trust of a
country, as seen in Table 3. The first three columns show average changes over 5 years, then the
next two columns show average changes over 10 years, etc. The averages in row (A) are the
absolute, while row (B) gives the average numerical changes. The last line in the table shows
how many of the changes which exceeds 10% − either upward or downward.
We first consider the numerical changes in row (B) of the table: Two points are immedia-
tely obvious: (1) The 5-year changes are rather large. (2) The changes are not much larger as the
span increases to 10, 15 and 20 years.
This suggests that a good deal of the movements is due to measurement error, which
includes short run reactions to “random” events. Figure 3 gives an estimate of the order of
magnitudes. The six dots are the unshaded averages from Table 3. If the average line is weighted
with the number of observations it tilts marginally upward only. Thus Figure 3 suggests that the
measurement error is of the order of magnitude of 5 percentage points:
Thesis 4: The measurement error in national polls of the G-trust is about 5 points
Figure 3. The average numerical G-trust changes, |ΔG|
11. The argument contradicts the results cited in Bjørnskov (2007) and Uslaner (2002) arguing the trust is primary.
8

Hence, the “true” average movement in the G-trust is about 2 points over the 20 years or 0.1
points per year. This is rather modest – much as suggested by Thesis 2. But if the movement adds
up over two centuries it does reach 20 points. Note also (from the last line of the table) than no
less than 42% of the 19 first differences that extends 20 years change more that 10 points, which
is twice the likely measurement error. Consequently this measure of social capital is not stable.
If we take into account that the Grand Transition in most cases takes 2-3 centuries and
that is associated with a change of about 20 points change in the G-trust there is really nothing in
these orders of magnitudes that prevents the full change in the G-trust shown on Figure 1 to be
endogenous.
3.2 The distribution of the changes 2: The absolute changes
With such a large measurement uncertainty it is difficult to determine how much the results
change. However, it may help to look at the absolute changes.
Figure 4. The distribution of all changes over 5, 10, 15 and 20 years
9

Figure 4 compares the distribution of the differences. It is obvious that they are almost as large
over 20 years as over 5 years. Roughly half of the changes are above the measurement error.
Hence, we know that these data show large, but not very systematic movement
3.3 A large scale social experiment: The transition from socialism 12
The period from 1982 to 2000 contains a large social experiment: The collapse of communism in
East and Central Europe and the transition to a western (capitalist/democratic) society. The
collapse happened very fast 1988-90. It came unpredicted, and it caused a large U-shaped econo-
mic crisis, where the full recuperation has only taken place after 2000 in most of the countries,
and it is not even yet complete in some of the transition countries. It seems reasonable to treat the
transition as a large, sudden, exogenous chock to the system. It is documented rather well in the
WVS data, with 2-3 observations from 19 countries for waves 2-4. However, there is only one
observation from 1982, namely from Hungary, which was a unique communist country.13
Figure 5. The G-trust and life satisfaction during the transition from communism
12. This subsection uses the term transition for the transition from socialism. 13. Hungary was the communist country that was allowed the most market institutions and the most contacts with the West, also, it had an relatively easy transition to a market system.
10
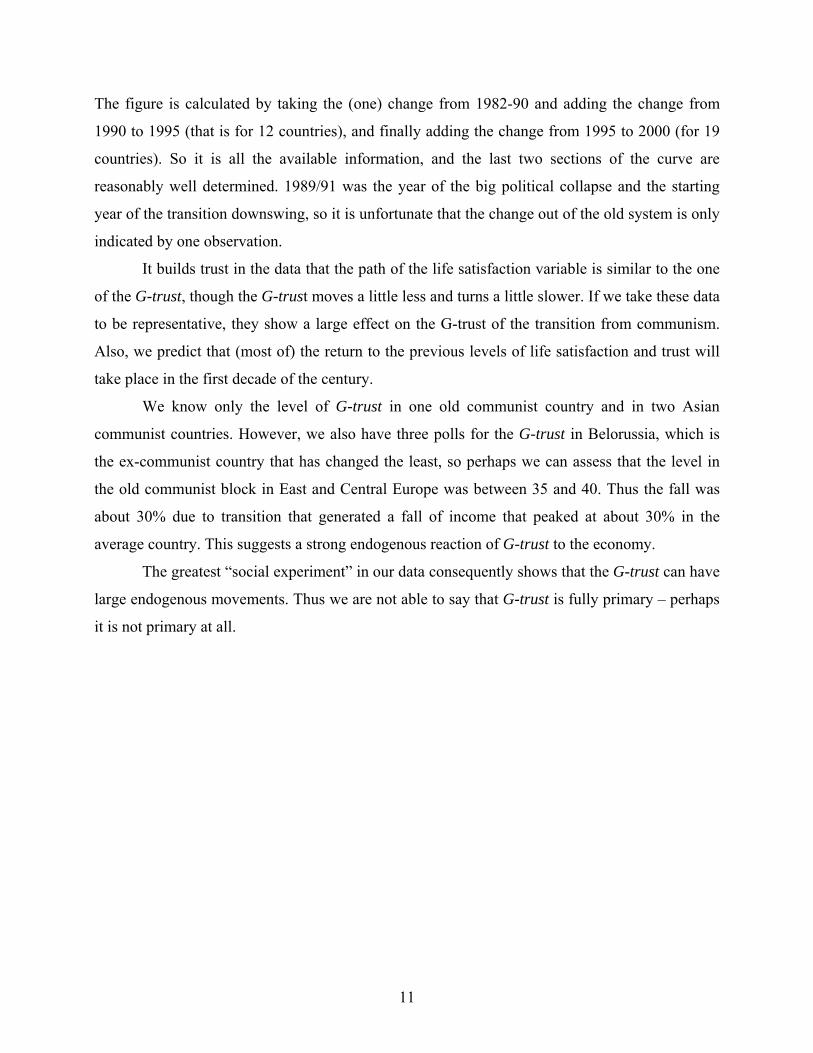
The figure is calculated by taking the (one) change from 1982-90 and adding the change from
1990 to 1995 (that is for 12 countries), and finally adding the change from 1995 to 2000 (for 19
countries). So it is all the available information, and the last two sections of the curve are
reasonably well determined. 1989/91 was the year of the big political collapse and the starting
year of the transition downswing, so it is unfortunate that the change out of the old system is only
indicated by one observation.
It builds trust in the data that the path of the life satisfaction variable is similar to the one
of the G-trust, though the G-trust moves a little less and turns a little slower. If we take these data
to be representative, they show a large effect on the G-trust of the transition from communism.
Also, we predict that (most of) the return to the previous levels of life satisfaction and trust will
take place in the first decade of the century.
We know only the level of G-trust in one old communist country and in two Asian
communist countries. However, we also have three polls for the G-trust in Belorussia, which is
the ex-communist country that has changed the least, so perhaps we can assess that the level in
the old communist block in East and Central Europe was between 35 and 40. Thus the fall was
about 30% due to transition that generated a fall of income that peaked at about 30% in the
average country. This suggests a strong endogenous reaction of G-trust to the economy.
The greatest “social experiment” in our data consequently shows that the G-trust can have
large endogenous movements. Thus we are not able to say that G-trust is fully primary – perhaps
it is not primary at all.
11

4. The web of connections between the G-trust and other variables
The research on trust has found several variables that are related to the G-trust. The five main
ones included are – as defined in Table 2:
Income, or production is (the natural) logarithm to gdp as explained. LiSa, High life
satisfaction. TI-hc, Transparency International’s honesty/corruption index, It is scaled from 10 for
full honesty to 0 for full corruption. Here only data for the last period are available. Gini, the Gini
coefficient. Here, the data has many gaps, and time series are not available. As it should be
negatively correlated to the G-trust, the sign has been reversed, and we thus use –Gini. Polity, the
Polity index of democracy/dictatorship, Polity. It is scaled from 10 for a perfect democracy to -10
for a perfect dictatorship. An average for the last 10 years is used.
The expected result from Grand Transition theory is that the variables contain much
simultaneity, in the sense that all other variables contribute somewhat to explaining income, and
the income contributes much to explaining all other variables. However, we hope to find that
some variables are only indirectly related to income. That is, if A, B and C are used to explain
income, then C is not needed, in the sense that C is insignificant, and contributes nothing to the
R2 when it is adjusted for degrees of freedom. In this case we say that A and B encompass C.
4.1 Correlations
Table 4 is a correlation matrix between these variables. Due to the scaling all coefficients of
correlation in the table should be positive, as they actually are. Only two of the correlations are
insignificant. The least significant is the one between the Gini and LiSa. This is puzzling, but not
central to our story. It is much more important for that story that the correlation between the G-
trust and the Polity index is insignificant.
Income is the variable that is most correlated to all the others, as it should be by the Grand
Transition theory. The variable that has the least correlation to the others is the Gini. This is not
unexpected given the quality of measurement for that variable, and the literature. The second
least correlated coefficient is G-trust, which also has a large measurement problem.
As a most 4 observations are available, it is difficult to establish causality in most cases.
However, many of the cells in the table have been the subject of a whole little literature, and
some of this research has reached agreement.
12

Table 4. Correlation matrix – pure cross-country
N = 80 G-trust Income LiSa TI-hc -Gini Polity G-trust 1 0.38 0.45 0.49 0.52 0.13 Income, Ln gdp 0.38 1 0.73 0.81 0.33 0.71 LiSa, High Life satisfaction 0.45 0.73 1 0.71 0.07 0.46 TI-hc, index for honesty/corruption 0.49 0.81 0.71 1 0.29 0.57 -1 x Gini coefficient 0.52 0.33 0.07 0.29 1 0.25 Polity index, last 10 years 0.13 0.71 0.46 0.57 0.25 1 Average correlation 0.39 0.59 0.48 0.57 0.29 0.42
Note: The bolded variables are significant at the 5% level.
4.2 The links to income via growth
By far the most researched connections are the ones to income via growth, dealt with in Table 5.
The effects of hundreds of variables on the growth rate have been studied by a range of methods,
and large scale attempts have been made to determine which of these variables have a robust
impact.14 This literature shows that a little more than 10 variables have a robust effect on growth,
while another 5 to 10 are borderline robust. None of our variables are among the robust ones, but
a couple is in the borderline group. These results are helpful when it comes to untangling a
pattern such as the one we consider
Table 5. The links to income, the central variable
(1) (2) Corre
lation
Size in %
of range
(1) (2)
Via growth
Comments to growth connection (2) (1)
GT-pattern
G-trust Income 0.38 50% Some Social capital is a factor of production Yes?
LiSa Income 0.73 70% No? Perhaps a link via productivity Yes
TI-hc Income 0.81 85% Weaker Weak effect from TI investment growth Yes
Gini Income 0.33 50% Dubious Much researched, but weak results Yes
Po1ity Income 0.71 60% Weak Borderline significant Yes
Note: Column (4) considers the difference between the value of the said index in the poorest 10% and in the
richest 10% of the countries relative to the range observed for the index.
14. See Doppelhofer, Miller, Sala-i-Martin (2004) and Sturm and Haan (2005).
13

.Figure 6a. The causal links from/to income
Note: See Figure 6b for some corrections, where arrows are dominated by the links which are not included.
Consider the observation that income and democracy have a correlation of no less than 0.71. The
growth literature tells us that the many attempts to find an effect of democracy on growth have
only led to a weak effect, see Doucouliagos and Ulubasoglu (2006) for a new meta study
covering the literature. At least 10 other effects are stronger, and there is a considerable residual
factor. So there is no way the causality from democracy to income can explain more than a small
fraction of the correlation. Thus the large correlation has to be mainly a GT-effect, i.e. a Grand
Transition effect.
This is only a reduced form conclusion, for there are a number of possible channels
whereby the Grand Transition may lead to democracy. One may be a pure demand effect saying
that the income elasticity of people’s demand for democracy is larger than 1. Another explanation
goes via the vast expansion in education that is associated with the GT, etc. However, our
analysis contains no education variable. This allows us to start with the causal connections
from/to income as drawn on Figure 6. Income influences all the other variables, but they do in
turn all influence income a little, as per the theory of the Grand Transition.
14

Figure 6b. All causal links between the 6 variables
4.3 All links
The 5 links the other way have been investigated by a set of regression reported in Paldam
(2008). This has given the pattern of causality shown on Figure 6b. There are still some uncertain
links, which are indicated with a question mark and, of course, more variables may be included.
Note that several of the links from Figure 6a are dominated by other stronger links.
How much can we trust the causal directions indicated? I am fairly confident that the ones
on Figure 6a are trustworthy. Also the causal links from the Gini, LiSa and TI-hc to G-trust on
Figure 6b seem reasonably well justified.15
4.4 The links between the G-trust and income
The correlation between income and G-trust, and is 0.38 in Table 4 – also, the relation looks
convincing on Figure 1. There is no doubt that the two variables are connected. However, the
income/G-trust-relation is dominated by some of the other stronger relations. Thus we have to
conclude that most of the connections are indirect and more of a general GT-nature than due to
direct causality.16
15. The significant coefficient to the Gini is common in this research; see e.g. Uslaner (2002) and Leigh (2006). 16 . See also Berggren, Elinder and Jordahl (2007) for a study of the robustness of the relation.
15

The causality: G-trust income. A substantial literature from Putnam (1993), Dasgupta
and Seargeldin (2000) and in particular Grootaert and Bastelaer (2002) argues that social capital
plays a role for development. It is easy to argue that social capital is a factor of production. Social
capital – certainly trust – makes transactions faster and cheaper, it reduces monitoring costs, etc.
Above thesis 2 and thesis 3 claim that G-trust is the primary factor that explains develop-
ment. This should give a clear causal link from the G-trust to income, but our finding is that the
link is encompassed by other links. It must mean that the causal link operates through other
variables. Thus it is difficult to argue that social capital is the primary factor for development we
are all looking for. It rather appears as another endogenous factor in the complex causal net of the
Grand Transition. This does not reject that it is an important variable to study.
The causality: income G-trust. Here it appears that the link goes via other variables,
and is a typical GT-effect. It is interesting that the link goes via two seemingly independent
variables, the Gini and LiSa, so that income Gini G-trust and income LiSa G-trust.
As the two intermediate variables are independent, we are dealing with a complex web where the
influence of additional variables is likely to be involved.
4.5 The links between the G-trust and Polity, the degree of democracy
We then turn to the links between G-trust and Polity. Here the correlation is only 0.13 in Table 4,
and Figure 7 shows a picture corresponding to Figures 1 and 2. It looks much less convincing.
Also, it is strange that the line through Other countries has a negative slope, while the line
through all points (not included) has almost the same slope, but positive. Neither slope is
significant. Also, the Polity/G-trust coefficients are weak in the statistical analysis.
The causality: G-trust Polity. A considerable literature discusses social capital as an
important prerequisite for democracy, in particular see Deth et al. (2002). Also, many develop-
ment aid agencies argue that it is important for development to build civic society and social
capital. Thus we expect a positive link from Polity to G-trust. Our findings suggest that this link
must be indirect and weak.
16

Figure 7. Scatter of the 80 G-trust and the Polity index for the degree of democracy
The causality: Polity G-trust. It is one of the cornerstones in the argument in Putnam (1993)
that the difference in social capital in the north and south of Italy is due to the political history of
the two parts of Italy in the previous 500 years, where especially the dictatorship in The Kingdom
of the two Sicilies in the south prevented the development of social capital, while the north of
Italy had a complex set of regimes that were often less oppressive, and hence permitted the
building of social capital.
This idea has been developed in Paldam and Svendsen (2000, 2002) to explain the differ-
rence between West and East Europe, due to democratic history of the West and the communist
dictatorship in the East. This led to: The dictatorship theory of social capital is that dictatorial
regimes fear voluntary cooperation between its citizens and thus tries to bring such cooperation
under the control of the political system. Also, it is well known that many dictators use fear as a
deliberate instrument.
17
Thus I expected to find a clear connection from Polity to G-trust. However, this did not
work.17 Part of the reason may be that the transition from communism in East and Central Europe
was associated with a rather large depression, a chaotic period of rent grabbing, and a wave of
high inflation that caused a large drop in life satisfaction. So perhaps something may still appear
in a longer perspective.
17. An alternative way to study this connection is to analyze the relation between G-trust and economic freedom directly as done by Berggren and Jordahl (2006), who do find considerable correlation.
18

5. Conclusion: The trust transition
The article is a mixture of a survey and a basic exposition of the macro data on generalized trust,
G-trust. It covers only one of the main series used to measure social capital. However, a great
deal of data has been collected on this variable. The article has looked at the dynamics of the
measured G-trusts, and at its relation to five other series.
The organizing framework is the theory/empirics of the Grand Transition, which sees the
process of development as a broad transition of all socio-political and economic variables in
society. All these transitions add up to the Grand Transition. It is not helpful to say that
everything depends on everything else, so the literature on development has searched for the key
to development: Something that is primary to all other factors. Since Putnam (1993) it has been
frequently claimed that social capital is that key.
It is clear from the results in the paper that the data show a transition from low trust in
poor societies to high trust in rich societies. Thus, there is a transition of trust. The article
discusses how the transition of trust relates to development.
The article demonstrates that the measures of G-trust have a considerable element of
measurement error, and though it normally changes slowly it does change enough so that it is
perfectly possible that the trust transition is fully endogenous. Thus the Putnam claim that social
capital is a deep constant in society and hence primary does not appear to hold as regards the G-
trusts.
In the analysis of the relation between generalized trust and other variables a number of
connections were found strongly significant: The main variables that appear to be causal to social
capital is the Gini and LiSa (high life satisfaction), but also corruption matters. My interpretation
of the literature (including my own research) is that these variables all have income as a key
causal factor. Thus it is clear that the G-trust enters into the complex
So whereas G-trust is an interesting variable that plays a role in the Grand Transition, it is
hardly the key causal factor for the transition.
19
References A:
Acemoglu, D., Johnson, S., Robinson, J., 2005. Institutions as the fundamental cause of long-run growth. Cpt 6,
385-472 in Aghion and Durlauf (2005)
Aghion, P., Durlauf, S., eds., 2005. Handbook of Economic Growth. North-Holland, Amsterdam
Berggren, N., Elinder, M., Jordahl, H., 2007. Trust and Growth: A Shaky Relationship. IFN Working Paper No.
705, Stockholm, Sweden
Berggren, N., Jordahl, H., 2006. Free to Trust: Economic Freedom and Social Capital. Kyklos 59, 141–169
Bjørnskov, C., 2006. Determinants of generalized trust: A cross-country comparison. Public Choice 130,1-21
Bjørnskov, C., 2007. Economic Growth. For Svendsen, G.L.H., Svendsen, G.S., eds.,. Handbook of Social
Capital. (Expected published in 2008)
Dasgupta, P. & Serageldin, I., eds., 2000. Social Capital: A Multifaceted Perspective, World Bank: Washington, DC
Delhany, J., Newton, K., 2005. Predicting cross-national levels of social trust: Global pattern or Nordic
exceptionalism? European Sociological Review 21, 311-27
Deth, J.W.v., Maraffi, M., Newton, K., Whiteley, P.F., eds., 2002. Social capital and European democracy.
Routledge, Abingdon
Doppelhofer, G., Miller, R.I., Sala-i-Martin, X., 2004. Determinants of Long-Term Growth: A Bayesian
Averaging of Classical Estimates (BACE) Approach. American Economic Review 94, 813-35
Doucouliagos, H., Ulubasoglu, M., 2006. Democracy and Economic Growth: A meta-analysis. Forthcoming in
the American Journal of Political Science
Frey, B.S., Stutzer, A., 2002. Happiness and Economics: How the Economy and Institutions Affect Human Well-
being. Princeton UP, Princeton, N.J.
Fukuyama, F., 1995. Trust. Simon and Schuster/Free Press, New York
Grootaert, C., Bastelaer, T.v., eds., 2002. The role of social capital in development. Cambridge UP., Cambridge,
UK
Helliwell, J.F., Putnam, R., 1995. Economic growth and social capital in Italy. Eastern Economic Journal 21,
295-307
Inglehart, R., Basáñez, M., Díez-Medrano, J, Halman, L., Luijks, R., eds. 2004. Human Beliefs and Values. A
Cross-Cultural Sourcebook Based on the 1999-2002 Value Surveys. Siglo XXI Editiones, México, D.F. Inglehart, R., Basáñez, M., Moreno, A., eds. 1998. Human Values and Beliefs. A Cross-Cultural Sourcebook.
University of Michigan Press, Ann Arbor, M.I. Lambsdorff, J.G., 2007. The Institutional economics of corruption and reform. Cambridge UP., Cambridge, UK
Leigh, A., 2006. Does equality lead to fraternity? Economics Letters 93 121-5
Maddison, A., 2001. The World Economy: A Millennial Perspective. OECD, Paris
Maddison, A., 2003. The World Economy: Historical Statistics. OECD, Paris
Paldam, M., 2000. Social capital: one or many? Journal of Economic Surveys 14, 629- 653
Paldam, M., 2002. The big pattern of corruption. Economics, culture and the seesaw dynamics. European
20

Journal of Political Economy 18: 215-40
Paldam, M., 2008. Generalized Trust. The Macro Perspective. In ##.
Paldam, M., Gundlach, E., 2007. Two Views on Institutions and Development: The Grand Transition vs the
Primacy of Institutions. WP 2007-2, Department of Economics, Aarhus Univ., and WP 1315, Institute
for the World Economy, Kiel, Germany.
Paldam, M., Svendsen, G.T., 2000. An essay on social capital: Looking for the fire behind the smoke. European
Journal of Political Economy 16, 339-366
Paldam, M., Svendsen, G.T., 2002. Missing social capital and the transition in Eastern Europe. Journal for
Institutional Innovation, Development and Transition (IB Review), 21-34
Paldam, M.,2008. Generalized Trust. The macro perspective. Forthcoming in volume from conference: Social
Capital, Corporate Social Responsibility (CSR) and Sustainable Economic Development. Organized by
Lorenzo Sacconi, Giacomo Degli Antoni and Marco Faillo) in Trento July 2007
Putnam, R.D., 1993. Making Democracy Work: Civic Traditions in Modern Italy. Princeton UP: Princeton, NJ
Putnam, R.D., 2000. Bowling Alone. The Collapse and Revival of American Community. Simon & Schuster, NY
Sturm J.-E., Haan, J.d., 2005. Determinants of long-term growth: New results applying robust estimation and
extreme bounds analysis. Empirical Economics, 30, 597-617
Uslaner, E.M., 2002. The Moral Foundation of Trust. Cambridge UP, Cambridge UK and New York
References B: Net links
Author’s working papers are at: http://www.martin.paldam.dk
Maddison’s data set is at: http://www.ggdc.net/maddison/
Polity is at: http://www.cidcm.umd.edu/inscr/polity
Transparency International is at: http://www.transparency.org/
World Values Survey is available from: http://www.worldvaluessurvey.org
World Development Indicators are at: http://devdata.worldbank.org/dataonline/
21

Appendix table. All G-trusts in the World Values Survey – first four waves
Country 1982 1990 1995 2000 Country 1982 1990 1995 2000 1 Albania 27.0 24.4 44 Lithuania 30.8 21.9 25.9 2 Algeria 11.2 45 Luxemburg 24.8 3 Argentina 26.1 23.3 17.6 15.9 46 Macedonia 8.2 13.7 4 Armenia 24.7 47 Malta 10.1 23.8 20.8 5 Australia 48.2 40.1 48 Mexico 33.5 31.2 21.8 6 Austria 31.8 33.4 49 Moldova 22.2 14.6 7 Azerbaijan 20.5 50 Morocco 22.8 8 Bangladesh 20.9 23.5 51 Netherlands 44.8 53.5 60.1 9 Belarus 25.5 24.1 41.9 52 New Zealand 49.1 10 Belgium 29.2 33.5 29.2 53 Nigeria 23.2 17.3 25.6 11 Bosnia 28.3 15.8 54 Norway 60.9 65.1 65.3 12 Brazil 6.5 2.8 55 Pakistan 18.8 30.8 13 Bulgaria 30.4 28.6 26.8 56 Peru 5.0 10.7 14 Canada 48.5 53.1 37.0 57 Philippines 5.5 8.6 15 Chile 22.7 21.4 23.0 58 Poland 31.8 17.9 18.4 16 China 60.3 52.3 54.5 59 Portugal 21.7 12.3 17 Colombia 10.8 60 Puerto Rico 6.0 22.6 18 Croatia 25.1 20.5 61 Romania 16.1 18.7 10.1 19 Czech Re 27.4 28.5 24.6 62 Russia 37.5 23.9 24.0 20 Denmark 52.7 57.7 66.5 63 Saudi Arabia 53.0 21 Dominican Re 26.5 64 Serbia 30.2 25.8 22 Egypt 37.9 65 Singapore 14.7 23 El Salvador 14.6 66 Slovakia 22.0 27.0 15.9 24 Estonia 27.6 21.5 23.5 67 Slovenia 17.4 15.5 21.7 25 Finland 62.7 48.8 57.4 68 South Africa 29.1 15.9 13.1 26 France 24.8 22.8 21.4 69 Spain 35.1 34.2 29.7 36.3 27 Georgia 18.7 70 Sweden 56.7 66.1 59.7 66.3 28 Germany 32.3 32.9 33.3 37.5 71 Switzerland 42.6 37.0 29 Greece 23.7 72 Taiwan 38.2 30 Hungary 33.6 24.6 22.7 22.4 73 Tanzania 8.1 31 Iceland 39.8 43.6 41.1 74 Turkey 10.1 5.5 16.0 32 India 35.4 37.9 41.0 75 Uganda 7.8 33 Indonesia 51.6 76 UK 43.1 43.7 29.6 28.9 34 Iran 65.4 77 Ukraine 31.0 27.8 35 Iraq 47.6 78 Ulster 44.0 43.6 39.5 36 Ireland 41.1 47.4 36.0 79 Uruguay 21.6 37 Israel 23.5 80 USA 40.5 51.1 35.9 36.3 38 Italy 26.8 35.3 32.6 81 Venezuela 13.8 15.9 39 Japan 41.5 41.7 42.3 43.1 82 Vietnam 41.1 40 Jordan 27.7 83 Zimbabwe 11.2 41 Korea S 38.0 34.2 30.3 27.3 Number 21 43 54 70 42 Kyrgyzstan 16.7 Average 38.9 34.8 25.8 28.4 43 Latvia 19.8 24.7 17.1 Standard deviation 11.5 14.5 13.2 14.7 Note: Every poll in the WVS includes this item. The list thus also covers the 188 pools of the WVS data set.
22