The MACBETH approach to health value … 4...1 The MACBETH approach to health value measurement: a...
23
1 The MACBETH approach to health value measurement: a multicriteria model for building a value-based population health index Teresa C. Rodrigues a* , Mónica D. Oliveira a , Carlos A. Bana e Costa a , Paula Santana b a Centre for Management Studies of Instituto Superior Técnico, Universidade de Lisboa, Avenida Rovísco Pais, 1049-01 Lisbon, Portugal b Centre for Studies in Geography and Territorial Planning, University of Coimbra, Faculdade de Letras Colégio de S. Jerónimo, 3004-530 Coimbra, Portugal Paper to be discussed at the EHPG London 2014. Work in progress. Please do not circulate without permission of the authors. * Corresponding author. Tel.: + 351 21 8417729; fax: + 351 21 8417979. E-mail address: [email protected]
Transcript of The MACBETH approach to health value … 4...1 The MACBETH approach to health value measurement: a...
1
The MACBETH approach to health value measurement: a multicriteria
model for building a value-based population health index
Teresa C. Rodriguesa*
, Mónica D. Oliveiraa, Carlos A. Bana e Costa
a, Paula
Santanab
aCentre for Management Studies of Instituto Superior Técnico, Universidade de Lisboa, Avenida Rovísco Pais, 1049-01 Lisbon,
Portugal bCentre for Studies in Geography and Territorial Planning, University of Coimbra, Faculdade de Letras
Colégio de S. Jerónimo, 3004-530 Coimbra, Portugal
Paper to be discussed at the EHPG London 2014.
Work in progress. Please do not circulate without permission of the authors.
* Corresponding author. Tel.: + 351 21 8417729; fax: + 351 21 8417979. E-mail address: [email protected]
2
Abstract
Health indexes have been used to evaluate population health in its multiple dimensions, providing
valuable information to drive health related policies and the planning of health services. Nevertheless,
health indexes reported in the literature have often lacked theoretical foundations and incurred in
drawbacks. Aiming to contribute to this literature, this study proposes (and applies) a framework that
combines concepts from multicriteria value measurement with participatory methods to build a value-
based population health index. From the technical side, the MACBETH approach was used to construct
the population health index within a hierarchical multicriteria model structure, with the model having
two main areas of concern – health determinants and outcomes – that are specified by a set of
evaluation criteria in which several dimensions of the health of a population are appraised. From the
social side, the application of MACBETH was supported by a combination of participatory methods
including a modified Delphi process with a large group of health stakeholders and experts, and decision
conferences with a strategic group. The proposed framework was applied to build an index to evaluate
population health at the municipality level in Portugal over the past twenty years (within the scope of
the GeoHealthS research project). The index generates a ide set of outputs ithi a ta leau-de- o d structure which will integrate a Geographic Information System and will be the starting point for policy
makers and planners analysing variations in population health and geographical health inequalities in
the Portuguese territory and to evaluate the impact of health and health equity oriented policies.
1. Introduction
A common goal among the health systems of OECD countries is to improve the health of individuals
and populations in an equitable, efficient and effective way [1]. Therefore, assessing the health of
populations and tackling geographical health inequalities are very important challenges for governments
and health decision-makers [2, 3].
Population health comprises multiple aspects, including the burden of disease, quality of health care,
individual behaviour, education and environment [4, 5, 6, 7]. Hence, appraising population health and
accessing patterns of health and disease in the community requires the development of formal
assessment tools, such as health indexes, that consider both health determinants and outcomes [8]. The
main advantage of these indexes is their capability of considering multiple aspects and simultaneously
delivering an aggregate score that permits a global view of population health [9], being regarded as an
efficient information tool [1] that fa ilitates the ta geti g of health esou es ased o health eeds f o a ultidi e sio al pe spe ti e ([10], p.246).
Nevertheless, there are accuracy and reliability issues associated with health indexes [10], as most of
the times they are built with resort to ad hoc processes [9] and used as black boxes [1], potentially
leading to distorted results and to misleading conclusions. Above all, the construction of a health index
is not a straightforward process since it involves assumptions that need to be properly assessed to avoid
a tool with dubious analytic rigor [11]. Smith emphasized that the process of constructing these indexes
is i its i fa , a d a of atte pts to date ha e ee se iousl i ade uate f o a te h i al pe spe ti e [12], p.309). Hence, it is recognised a need to develop comprehensive evaluation tools,
based on methodologically sound procedures, which can adequately evaluate population health in its
multiple dimensions, providing valuable information for building health oriented and equity based
policies.
This paper proposes a framework to build a (multidimensional) value-based population health index
with the MACBETH (Measuring Attractiveness by a Categorical Based Evaluation Technique) approach,
combining concepts and methods from multicriteria value measurement and participatory methods. The
model was designed (and built) within the scope of the GeoHealthS R&D project to develop a population
3
health index to evaluate population health in Portuguese municipalities over the past 20 years (in the
years of 1991, 2001 and 2011). The index is to be used within a web-based Geographical Information
System (GIS), to be made available to health decision-makers and to the general public, so that health
patterns could be analysed and explored. In this paper we focus on the design of methods to build this
population health index, rather than on the results from its application.
The paper is structured as follows: section 2 briefly reviews approaches that seek to evaluate
population health on multiples dimensions; section 3 presents the proposed framework for building the
value-based population health index; section 4 describes how the multicriteria approach was developed
to build a health index to evaluate population health at the municipality level in Portugal over the past
twenty years. Finally, section 5 discusses issues and lessons learned from the process of developing and
implementing the health index.
2. Literature review
Population health has been described as involving the measurement of health outcomes and their
distribution within a group of individuals, the patterns of determinants that influence such outcomes, as
well as the policies that influence the optimal balance of determinants [13, 14]. Monitoring and
evaluating population health is crucial to understand the major health challenges of each community or
geographic area, providing appropriate and timely information to guide the elaboration of future
guidelines and interventions, and consequently, help policy-makers to allocate the available resources
according to their objectives and goals [15].
Individual health indicators, as mortality rates, life expectancy and years of life lost, have been
traditionally used by governments to make decisions regarding resource allocation in health care [8, 10].
Nonetheless, individually-based health indicators are unidimensional [10] and do not capture all the
relevant aspects that influence the health of populations. In response to this, there has been a growing
trend in the use of multidimensional tools that aggregate several indicators in an overall score
permitting: a) a more rounded, comprehensive and accountable assessment of system performance
than single indicators [12]; b) a clearer overview of population health and health care performance
which simplifies the process of comparing different geographic areas [9], while considering multiple
health aspects [16]; c) the definition of targets in each indicator used in the index, enabling benchmark
analyses [8]; d) the delivery of information for analysing overall health performance of the population of
a geographical area, through the use of a type of traffic light system [17]; and e) the incorporation of
geographical information [18], which can help policy-makers and health decision-makers to explore
t e ds a d elatio ships o e spa e a d ti e i o de to o ito the i flue e of go e e t poli ies su h as those ai ed at edu i g health i e ualities [19].
Nevertheless, literature points out for problems in the construction of these indexes [8, 9, 10, 20],
partly due to difficulties in the choice of indicators to be included in the index and in the use of methods
to aggregate indicators in an overall measure; this aggregation procedure is usually compensatory,
which can mask some important problems regarding population health (for instance, a good score may
mask serious shortcomings in some indicators, being difficult to determine the precise source of failings
and, therefore, remedial actions are not implemented). Kaltenthaler et al. [10] have further emphasized
that health indexes must undergo extensive testing to ensure their reliability and validity.
In a review of the literature, we have searched in ISI Web of Knowledge, Pubmed, Science Direct and
Google “ hola data ases fo studies usi g o posite easu e , o posite i de , o posite i di ato , dep i atio i de , a ea i de o health i de , a d found that that these tools have
been built resorting to the following approaches: data envelopment analysis (DEA) [21, 22], statistical
methods [23, 24, 25, 26, 27, 28, 29, 30] and multi-criteria decision analysis (MCDA) [31, 32, 33, 34, 35,
36]. Many approaches rely on ad-hoc processes that lack sound theoretical foundations [4, 6, 16, 37,
38]. Although DEA and statistical methods allow for computing global measures, they do not allow for a
transparent evaluation of population health, nor the definition of meaningful references for each

4
indicator in use (thus precluding benchmark analyses). MCDA approaches have already shown: to be a
useful method for building health indexes [31, 32, 33, 34, 35, 36], allowing for spatial analysis of
population health (see for example [39, 40]); to have sound theoretical foundations [41, 42, 43]; and to
produce transparent models that consider both evidence and all the viewpoints of health stakeholders
and experts. However, studies using MCDA techniques have often incurred in well-known mistakes
reported in the decision analysis literature, which precludes the use of several of the proposed indexes.
Such errors include: i) not distinguishing between the notion of performance and the notion of value
(e.g. [31, 33, 36]); ii eighti g o the asis of the otio of i t i si i po ta e leadi g to the ost o o iti al istake e.g. [36]) and iii) applying the MCDA approach Analytical Hierarchy Process
(e.g. [32, 34, 35]) that presents reported methodological problems (for details see [42, 44]).
Overall, the process of building tools to measure population health is in its i fa ([12], p. 309)
and several methodological problems still need to be addressed. In fact, it is necessary to build health
indexes that:
a) incorporate all the relevant aspects that capture and/or influence the health of a population (there
being no aspects neglected due to lack of data availability);
b) do not confuse performance indicators with evaluation criteria;
c) reflect not only scientific evidence but also the concerns and strategic objectives of health
stakeholders, through the use of appropriate participatory methods;
d) deal with possible synergies and interactions between performance indicators;
e) assign relative weights to the criteria that adequately reflect value trade-off judgments between
criteria;
f) are validated and do not mask critical problems regarding population health;
g) generate a wide range of outputs, within a management tableau-de-bord structure (see [45] and
[46]) that can be used to populate a GIS (for instance, including the performance profile of each
geographic area, as well as aggregated and disaggregated values of population health in multiple
dimensions).
MCDA allows for building a multicriteria model to support the measurement of a health index in a
transparent, comprehensive and systematic manner, as well as provides sound methods [41, 42, 43] and
which fulfils the requirements and conditions outlined before. Hence, this study proposes a novel
framework to support the construction of value-based population health index, to be used for
evaluating population health status at municipal level on multiple dimensions based on concepts and
methods of multiple criteria value measurement [41, 42, 43].
3. Multicriteria modelling for a value-based population health index
3.1 Methodological framework
A socio-technical process [47] was designed for building a value-based population health index: it
integrates the technical elements of a multicriteria value model (with sound theoretical foundations [41,
42, 43]) and the social elements of participatory methods, involving the use of a modified Delphi process
with a large and multidisciplinary group of nineteen health stakeholders and experts – the SK-Group –
and decision conferencing with a smaller strategic group with five members – the ST-Group (this is a
sub-group of the SK-Group).
The use of participatory processes to build the multicriteria value model allows for combining
scientific evidence with the opinions of different experts and stakeholders (e.g. epidemiologists,
geographers, economists and policy-makers) with different health backgrounds to build the multicriteria
value model. Following the insights from Buescu and Chen [48], the aggregation of multiple sources of
information maximizes the amount of information available to build the evaluation model, reduces the
potential impact of stakeholders and experts that rely on inaccurate and unreliable information, as well
as increases the credibility and validity of the model by making it more inclusive and representative.
5
The constitution of two groups of decision-makers (SK-Group and ST-Group) was driven by the need
of having, on the one hand, a multidisciplinary and large group - SK-Group - with different experts and
stakeholders that have different perspectives and skills, belong to different regions of Portugal and can
provide valuable insights to the construction of the model; and, on the other hand, a strategic group (ST-
Group) that has a holistic view of the index-building process, is big enough to be representative but
simultaneously small enough not to preclude the effectiveness of the process [49], and that is available
to participate often in face to face meetings.
Both groups were designed to participate in distinct formats in different parts of the index building
process. For instance, the SK-Group was involved in a modified Delphi process [50], with the use of this
participatory method being motivated by two reasons: firstly this is an anonymous process implying that
panel members can shift position without losing face if they see convincing reasons for doing so; and
secondly, it does not require physical presence. The ST-Group, within a decision conferencing process,
was engaged in building the multicriteria value model that underlies the population health index. This
participatory process allows the group to develop a shared understanding of the issues, generate a
sense of common purpose, gain commitment in the way forward and confidence in the results provided
by the model [47] to be used for evaluating population health. These participatory formats were further
enhanced with complementary workshops, as described below.
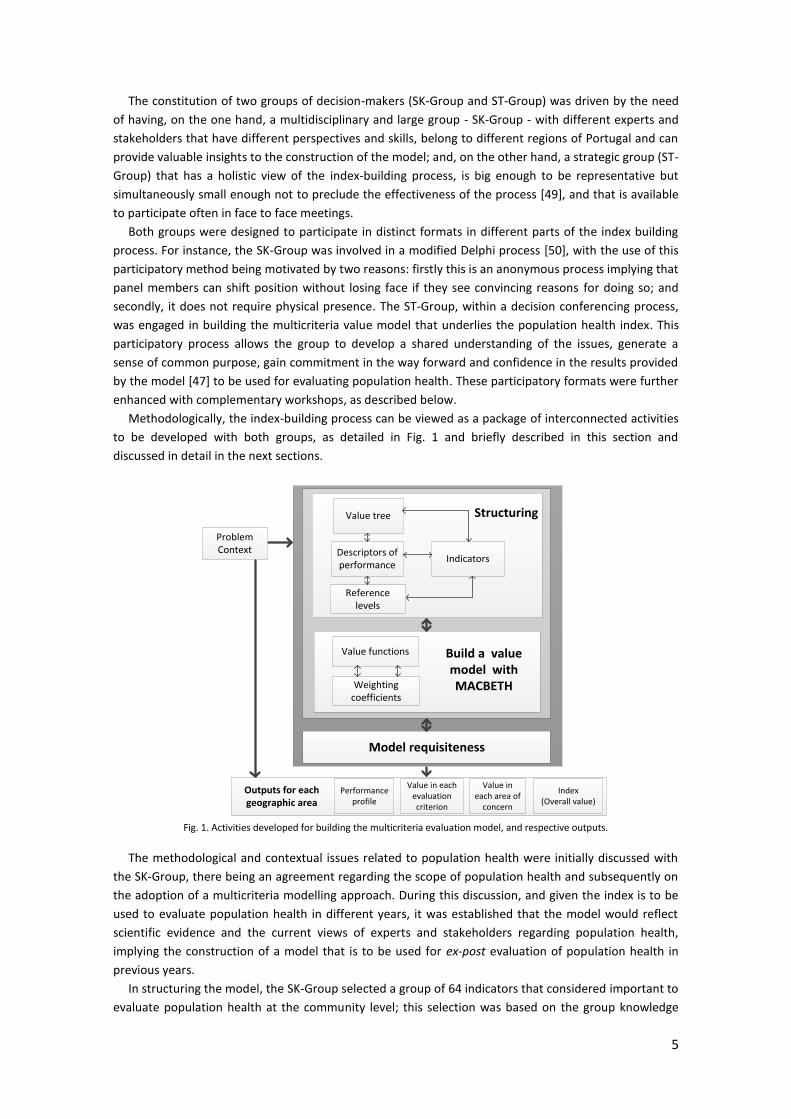
Methodologically, the index-building process can be viewed as a package of interconnected activities
to be developed with both groups, as detailed in Fig. 1 and briefly described in this section and
discussed in detail in the next sections.
Problem
Context
Value tree
Descriptors of
performanceIndicators
Reference
levels
Value functions
Weighting
coefficients
Performance
profile
Value in each
evaluation
criterion
Index
(Overall value)
Structuring
Build a value
model with
MACBETH
Outputs for each
geographic area
Value in
each area of
concern
Model requisiteness
Fig. 1. Activities developed for building the multicriteria evaluation model, and respective outputs.
The methodological and contextual issues related to population health were initially discussed with
the SK-Group, there being an agreement regarding the scope of population health and subsequently on
the adoption of a multicriteria modelling approach. During this discussion, and given the index is to be
used to evaluate population health in different years, it was established that the model would reflect
scientific evidence and the current views of experts and stakeholders regarding population health,
implying the construction of a model that is to be used for ex-post evaluation of population health in
previous years.
In structuring the model, the SK-Group selected a group of 64 indicators that considered important to
evaluate population health at the community level; this selection was based on the group knowledge
6
and on scientific evidence regarding the link between each indicator and population health. Based on
the discussion of each indicator, overlaps and redundancy between indicators were detected and
eliminated; and a set of dimensions important for the evaluation of population health were defined. To
overcome problems of interdependency and synergies between dimensions, a series of systematic tests
were performed with the support of a tool named Multicriteria Cognitive Map, by using the concepts
and procedures described in [51]. These procedures allowed for defining a set of (difference
independent [52]) evaluation criteria in which the status of population health should be appraised – we
leave outside the scope of this article a description of the technical processes involved in this step.
While in most cases evaluation criteria entailed one dimension (e.g. Obesity), in a few cases an
evaluation criterion comprised several interrelated dimensions – fo e a ple, the ite io hospital espo si e ess e o passes the do to s i hospital a e a d hospital eds di e sio s, as one
cannot evaluate how important is improving the number of beds if one does not know if there are
sufficient doctors to treat more inpatients.
Finally, the set of evaluation criteria were grouped in different areas of concern, leading to the
construction of an initial tree (we name this tree as a value tree as it embodies all the dimensions
contributing for population health). The initial proposal for the value tree was presented to the SK-
Group in a workshop. After discussion within the SK-Group and several iterative modifications with the
ST-Group, a new proposal for the value tree was achieved and presented in a new workshop, in which
the SK-Group commonly accepted the proposed tree.
In this process of structuring the value tree, a descriptor of performance (i.e. an ordered set of
plausible performance levels) [53] that makes each criterion operational for evaluating population
health and allows tracing the performance profile of each municipality, was assigned to each evaluation
criteria. In the aforementioned cases in which the evaluation criterion comprised only one dimension,
the descriptor assigned was a quantitative indicator; in the few cases in which evaluation criteria
encompassed several interrelated dimensions, the assigned descriptor comprised a cluster of several
interrelated quantitative indicators.
Building an evaluation model requires the definition of two reference levels for each descriptor with
substantive meanings [53], as such references are required for benchmark analysis (for instance
allowing to investigate the distance in performance of each municipality to the reference values) and
later for building weighting coefficients (required for aggregating value in different criteria). Several
studies (see, for example, [45, 53, 54]) have shown the relevance of using as references: a neutral
level that traduces the level of performance for a given criterion that is regarded as acceptable (neither
attractive nor unattractive), and a good level that makes explicit what is a good performance in each
criterion expressing a clear commitment to achieve a specified result in a defined time period. Given the
need for evaluating population health in different time periods, these references needed to be defined
generally and in a meaningful way to be applied for the years in which population health is to be
evaluated (for 2011, 2001 and 1991 in our application to the Portuguese context). In this way, two
statistical measures were used as proxies – base_year and top10%_year – for the neutral and
good levels, respectively. The ase_year le el as set as a a e age of the pe fo a e of the municipalities in the year a d a top %_year le el as set as the a e age of the pe fo a e of the 10% best municipalities in the year. When applied to the set of years for evaluation, these references
allow for identifying poor and good performance in all the evaluation criteria relevant for evaluating
population health.
Once evaluation criteria were defined and descriptors of performance were selected, several
activities were required to transform performance into partial and global population health value
scores. The first activity was to build value functions, enabling performance to be transformed into value
in each evaluation criterion (this process will be detailed in sections 3.3.1 and 3.3.2). In order to evaluate
population health at the level of each area of concern and in overall terms, the value scores on the
criteria and across areas (that capture partial value) were to be aggregated, requiring a conversion of
partial value into a value scale of population health. With this purpose, criteria and area weights were
7
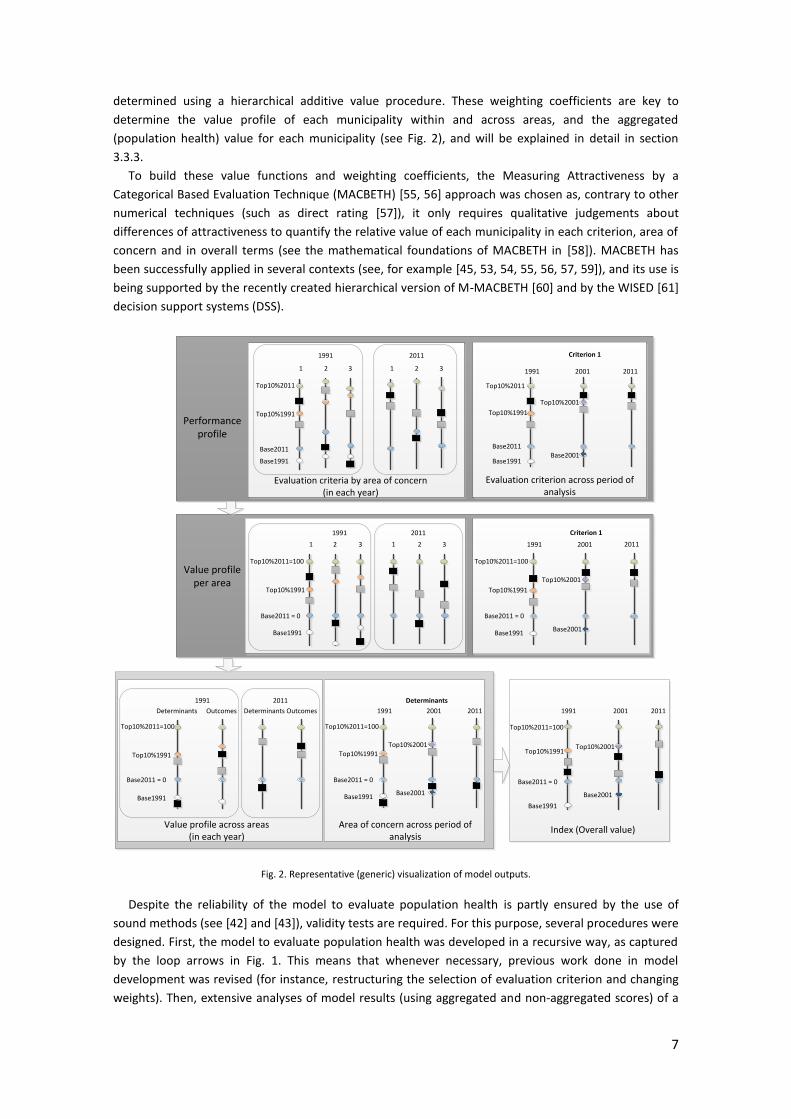
determined using a hierarchical additive value procedure. These weighting coefficients are key to
determine the value profile of each municipality within and across areas, and the aggregated
(population health) value for each municipality (see Fig. 2), and will be explained in detail in section
3.3.3.
To build these value functions and weighting coefficients, the Measuring Attractiveness by a
Categorical Based Evaluation Technique (MACBETH) [55, 56] approach was chosen as, contrary to other
numerical techniques (such as direct rating [57]), it only requires qualitative judgements about
differences of attractiveness to quantify the relative value of each municipality in each criterion, area of
concern and in overall terms (see the mathematical foundations of MACBETH in [58]). MACBETH has
been successfully applied in several contexts (see, for example [45, 53, 54, 55, 56, 57, 59]), and its use is
being supported by the recently created hierarchical version of M-MACBETH [60] and by the WISED [61]
decision support systems (DSS).
1 2 31 2 3 1 2 3
Performance
profile
Evaluation criteria by area of concern
(in each year)
Evaluation criterion across period of
analysis
1991 2011
20111991 2001
Value profile
per area
1 2 3Determinants Outcomes
Value profile across areas
(in each year)
1991
20111991 2001Determinants Outcomes
2011 Determinants
Area of concern across period of
analysis
20111991 2001
Index (Overall value)
Base2011
Base1991
Top10%2011
Top10%1991
Top10%2001
Base2001Base1991
Top10%1991
Base2011
Top10%2011
1 31 2 3 1 2 3
1991 2011
Base2011 = 0
Base1991
Top10%2011=100
Top10%1991
Base2011 = 0
Base1991
Top10%2011=100
Top10%1991
Base2011 = 0
Base1991
Top10%2011=100
Top10%1991
Top10%2001
Base2001
Base2011 = 0
Base1991
Top10%2011=100
Top10%1991Top10%2001
Base2001
20111991 2001
Top10%2001
Base2001Base1991
Top10%1991
Top10%2011=100
Base2011 = 0
Criterion 1
Criterion 1
Fig. 2. Representative (generic) visualization of model outputs.
Despite the reliability of the model to evaluate population health is partly ensured by the use of
sound methods (see [42] and [43]), validity tests are required. For this purpose, several procedures were
designed. First, the model to evaluate population health was developed in a recursive way, as captured
by the loop arrows in Fig. 1. This means that whenever necessary, previous work done in model
development was revised (for instance, restructuring the selection of evaluation criterion and changing
weights). Then, extensive analyses of model results (using aggregated and non-aggregated scores) of a
8
group of representative municipalities were carried out by the ST-Group. The model was developed until
it as o side ed e uisite [62], i.e., when its form and content were deemed as appropriate for
evaluating population health at a community level in practice [47].
3.2 Multicriteria model to evaluate population health
The mathematical elements of the multicriteria value model built with MACBETH are as follows. Let = ,…, desig ate the e aluatio ite io i e.g. O esit of the area of concern h e.g. Life “t le , the descriptor of performance of criterion (e.g. Percentage of adults (age 20 years and over) who
are obese or are overweighed ) and (.) the respective value function. Let be the performance of a
municipality m on criterion and ( ) the respective value score; let ( ) and
( ,…, ) be the performance and value profile of municipality m, respectively. Then, the
evaluation of population health of a municipality m in the area of concern h is given by the simple
additive model (1):
( ) ∑ { ( ) ( ) (1)
where and a e, espe ti el , the top % a d the ase efe e e le els of performance on criterion in the year of 2011; and are the weights assigned to criteria, when
those references are considered, and such that ∑ and > 0. By applying model (1)
bottom-up successively, it is possible to compute the (population health) value in each area of concern,
in the different levels of the hierarchy of the value tree, and in overall terms.
The proposed additive model makes use of interval scales, implying that the zero assigned to the
ase le el of is a atte of o e ie e [42]. Consequently, only the relative magnitudes of
differences between the municipalitys scores have a meaning, and the attribution of zero and 100 to
the references is arbitrary. Therefore, although the model is built with two references, the model
outputs may be rescaled through linear transformation. This is important as the scale used to build the
model may be deemed as inadequate for communicating results – for example, by fixing the zero on
ase le el of , it is e pe ted that se e al u i ipalities i 99 a d p ese t egati e s o es ha i g pe fo a es elo the ase le el of i se e al ite ia - but a different scale of
value can be used to communicate results.
3.3 Design of participatory methods
Participatory methods comprised the use of decision conferencing with the ST-Group and workshops
and a modified Delhi process with the SK-Group to carry out the evaluation activities of Fig.1:
the ST-Group, in a series of decision conferencing workshops, was involved in structuring the set
of evaluation criteria and in building the value model. Along the decision conferencing process
[48], developed in several structured meetings, neutral facilitators guided the ST-Group to build
an evaluation model on-the-spot, capturing the knowledge and concerns of the group [48] and
encouraging the group to represent its collective judgements in a logically consistent and easily
communicated fashion [63]; individual differences of opinion were allowed. A face-to-face
environment promoted a successful collaboration between members of the ST-Group. This
decision conferencing process was supported by the MACBETH approach. Decision conferencing
workshops were combined with intensive homework by the members of the ST-Group.
Intercalated with the decision conferencing meetings, a few workshops with the SK-Group also
took place, so that all participants could have a better understanding and comment the methods
in use and could improve their understanding on the components of the model to evaluate
population health.
9
the SK-Group, resorting to a modified Delphi process (the design of this process is described
below), provided valuable information to help the ST-Group in the construction of the value
functions for each evaluation criteria.
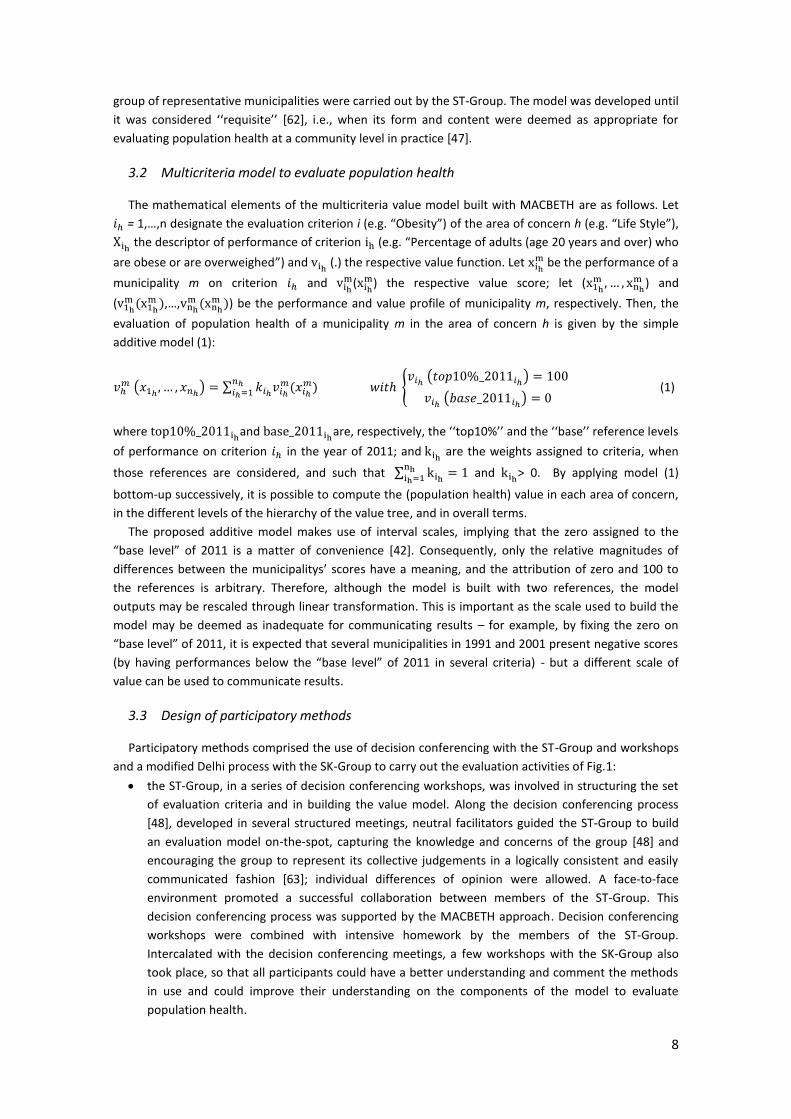
Fig. 3 summarises the timetable of the process including the decision conferences workshops, the
meetings with the SK-Group and the modified Delphi process. Note that this process is not concluded,
and a meeting for validating the model outputs with the SK-Group is still scheduled for September 2014.
DC = Decision conferencing with the ST-Group
WK = Workshops with the SK-Group
DCStructuring
WK DCStructuring
WKDelphi
process
March
2013
DCWeighting
WKDC
Model
outputs
WK
February
2013
January
2013
April
2013
May
2013
... September
2013
October
2013
November
2013
December
2013
March
2014
February
2014
January
2014
April
2014
May
2014
... September
2014
DCValue
functions
DCValue
functions
June
2013
2012
Workshops with
both groups to
select the group
of indicators
...
WK
Fig. 3. Timetable of the process.
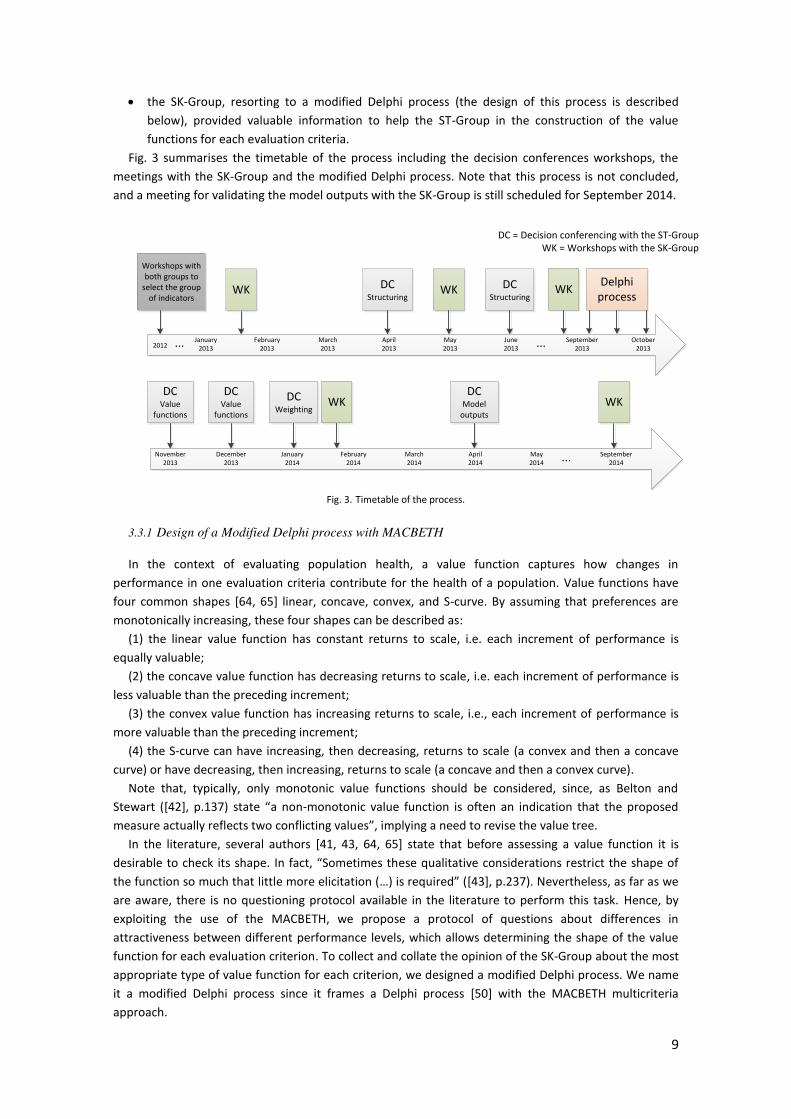
3.3.1 Design of a Modified Delphi process with MACBETH
In the context of evaluating population health, a value function captures how changes in
performance in one evaluation criteria contribute for the health of a population. Value functions have
four common shapes [64, 65] linear, concave, convex, and S-curve. By assuming that preferences are
monotonically increasing, these four shapes can be described as:
(1) the linear value function has constant returns to scale, i.e. each increment of performance is
equally valuable;
(2) the concave value function has decreasing returns to scale, i.e. each increment of performance is
less valuable than the preceding increment;
(3) the convex value function has increasing returns to scale, i.e., each increment of performance is
more valuable than the preceding increment;
(4) the S-curve can have increasing, then decreasing, returns to scale (a convex and then a concave
curve) or have decreasing, then increasing, returns to scale (a concave and then a convex curve).
Note that, typically, only monotonic value functions should be considered, since, as Belton and
Stewart ([42], p. 7 state a o -monotonic value function is often an indication that the proposed
measure actually reflects two conflicting values , i pl i g a eed to e ise the alue t ee. In the literature, several authors [41, 43, 64, 65] state that before assessing a value function it is
desirable to check its shape. I fa t, “o eti es these qualitative considerations restrict the shape of
the function so much that little o e eli itatio … is e ui ed [43], p.237). Nevertheless, as far as we
are aware, there is no questioning protocol available in the literature to perform this task. Hence, by
exploiting the use of the MACBETH, we propose a protocol of questions about differences in
attractiveness between different performance levels, which allows determining the shape of the value
function for each evaluation criterion. To collect and collate the opinion of the SK-Group about the most
appropriate type of value function for each criterion, we designed a modified Delphi process. We name
it a modified Delphi process since it frames a Delphi process [50] with the MACBETH multicriteria
approach.
10
Several studies (for e.g. [66], [67] and [68]) have reported difficulties associated with Delphi
processes associated with: being time consuming and requiring participant commitment, as typically
they are used to reach consensus, which can force, in some cases, an apparent convergence of
responses by conformity pressures [66]. To overcome these problems, we designed a Delphi process
with only two rounds to define the shape of the value functions, where the main goal is not to reach
consensus but to acquire the opinion of the SK-Group, through a structured process, about the shape
that the group considered most appropriate for each criterion. Therefore, the experts are consulted
twice to, on one hand, give them opportunity to reconsider their answer, aided by the information they
receive from the rest of the experts (to some extent promoting a convergence of opinions); and, on the
other hand, avoiding a time consuming process since the main goal is not to reach consensus, but to
provide valuable information to help the ST-Group to construct the value model. The modified Delphi
process was conducted by neutral facilitators [50] (two of the authors of this article) that provided
controlled feedback, informing the group members of the opinions of their anonymous colleagues. The
SK-Group (composed of 19 members1) was divided into three smaller groups according to the expertise
and skills of each expert (two groups with six members and one with seven). Each of these groups was
responsible to provide judgments for a set of criteria related with their area of knowledge and
experience.
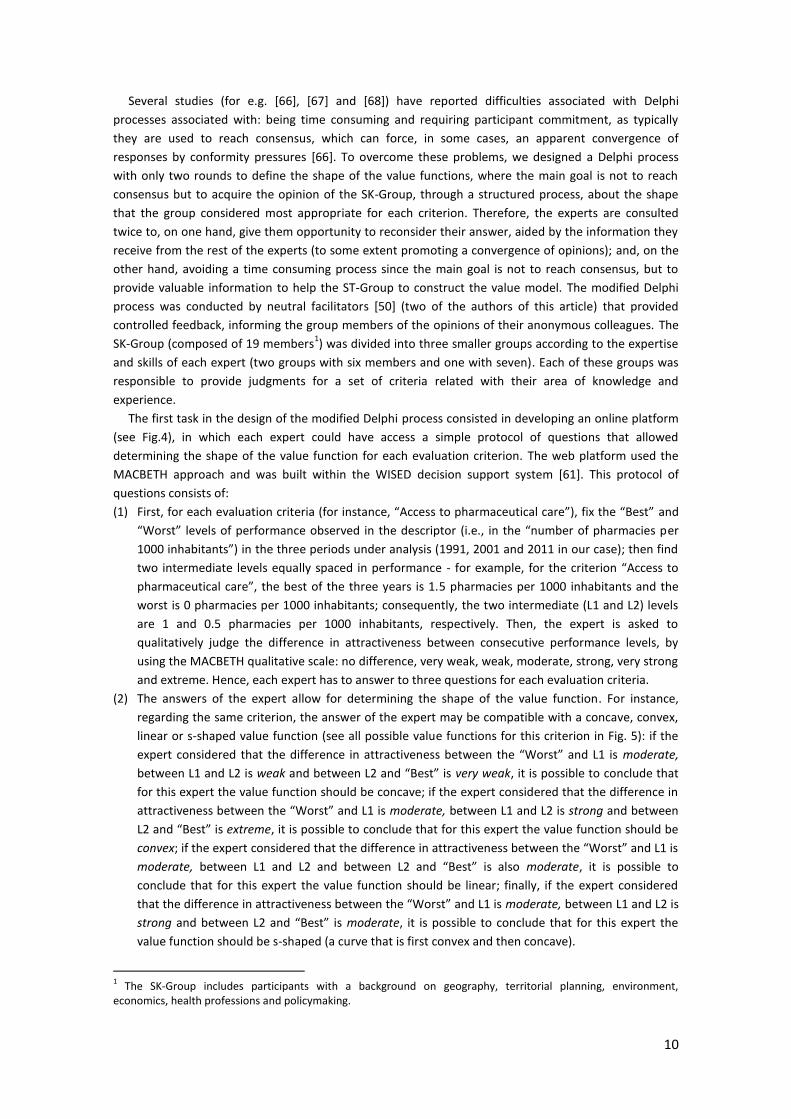
The first task in the design of the modified Delphi process consisted in developing an online platform
(see Fig.4), in which each expert could have access a simple protocol of questions that allowed
determining the shape of the value function for each evaluation criterion. The web platform used the
MACBETH approach and was built within the WISED decision support system [61]. This protocol of
questions consists of:
(1) Fi st, fo ea h e aluatio ite ia fo i sta e, A ess to pha a euti al a e , fi the Best and
Wo st le els of pe fo a e o se ed i the des ipto i.e., i the u e of pha a ies per
i ha ita ts in the three periods under analysis (1991, 2001 and 2011 in our case); then find
two intermediate levels equally spaced in performance - fo e a ple, fo the ite io A ess to pha a euti al a e , the est of the th ee ea s is .5 pharmacies per 1000 inhabitants and the
worst is 0 pharmacies per 1000 inhabitants; consequently, the two intermediate (L1 and L2) levels
are 1 and 0.5 pharmacies per 1000 inhabitants, respectively. Then, the expert is asked to
qualitatively judge the difference in attractiveness between consecutive performance levels, by
using the MACBETH qualitative scale: no difference, very weak, weak, moderate, strong, very strong
and extreme. Hence, each expert has to answer to three questions for each evaluation criteria.
(2) The answers of the expert allow for determining the shape of the value function. For instance,
regarding the same criterion, the answer of the expert may be compatible with a concave, convex,
linear or s-shaped value function (see all possible value functions for this criterion in Fig. 5): if the
expert considered that the diffe e e i att a ti e ess et ee the Wo st a d L is moderate,
between L1 and L2 is weak a d et ee L a d Best is very weak, it is possible to conclude that
for this expert the value function should be concave; if the expert considered that the difference in
att a ti e ess et ee the Wo st a d L is moderate, between L1 and L2 is strong and between
L a d Best is extreme, it is possible to conclude that for this expert the value function should be
convex; if the e pe t o side ed that the diffe e e i att a ti e ess et ee the Wo st a d L is moderate, et ee L a d L a d et ee L a d Best is also moderate, it is possible to
conclude that for this expert the value function should be linear; finally, if the expert considered
that the diffe e e i att a ti e ess et ee the Wo st a d L is moderate, between L1 and L2 is
strong a d et ee L a d Best is moderate, it is possible to conclude that for this expert the
value function should be s-shaped (a curve that is first convex and then concave).
1 The SK-Group includes participants with a background on geography, territorial planning, environment,
economics, health professions and policymaking.
11
Fig. 4. Online platform designed with the WISED DSS for the modified Delphi process.
Then, after implementing the web platform, it was possible to launch the Delphi process, that was
organized as follows:
(1) In a kick-off meeting, the facilitators explained in detail the modified Delphi process, the protocol
of questions and how this questionnaire was used to assess the shape of the value function, and
the process deadlines; scientific evidence about each criterion and a script about the Delphi
process was also delivered to each expert.
(2) Then each expert received via e-mail a password, username and instructions to access to the online
platform; in this online platform each member of the SK-Group answered to the aforementioned
questionnaire, using the MACBETH qualitative scale.
(3) Based upon this questionnaire, the type of value function that at hed the e pe ts a s e s as then determined by the facilitators and this ended the first round of the modified Delphi process.
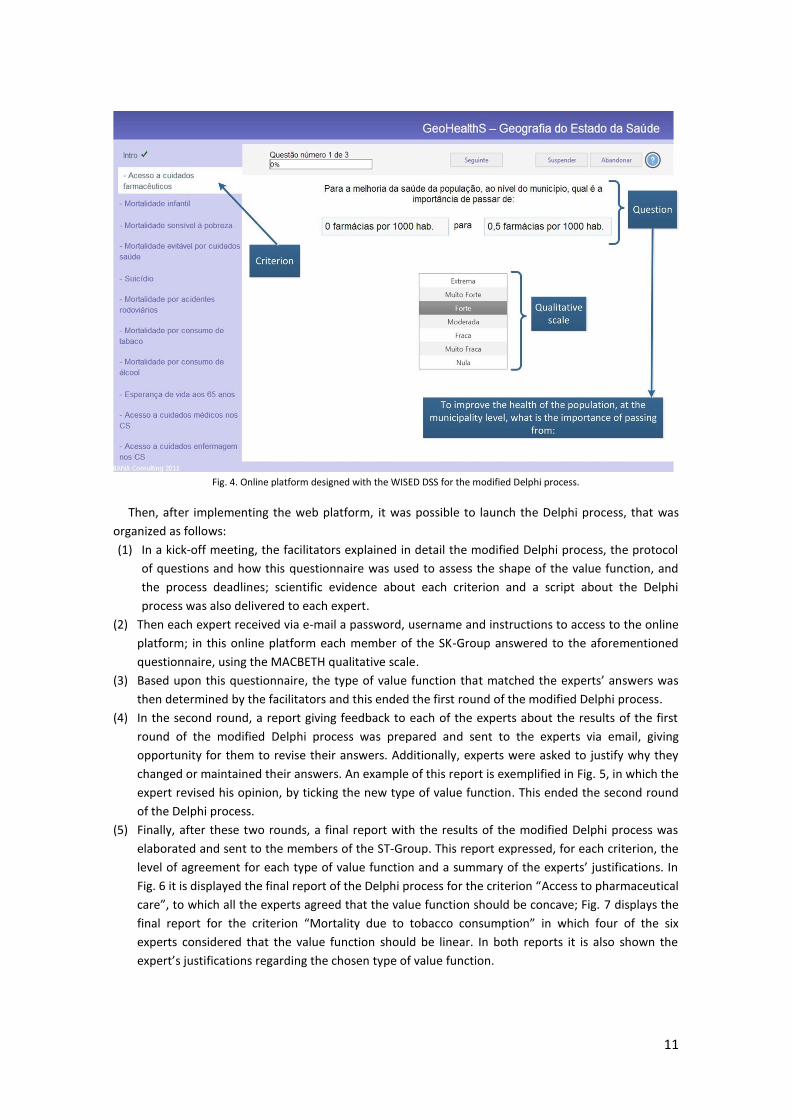
(4) In the second round, a report giving feedback to each of the experts about the results of the first
round of the modified Delphi process was prepared and sent to the experts via email, giving
opportunity for them to revise their answers. Additionally, experts were asked to justify why they
changed or maintained their answers. An example of this report is exemplified in Fig. 5, in which the
expert revised his opinion, by ticking the new type of value function. This ended the second round
of the Delphi process.
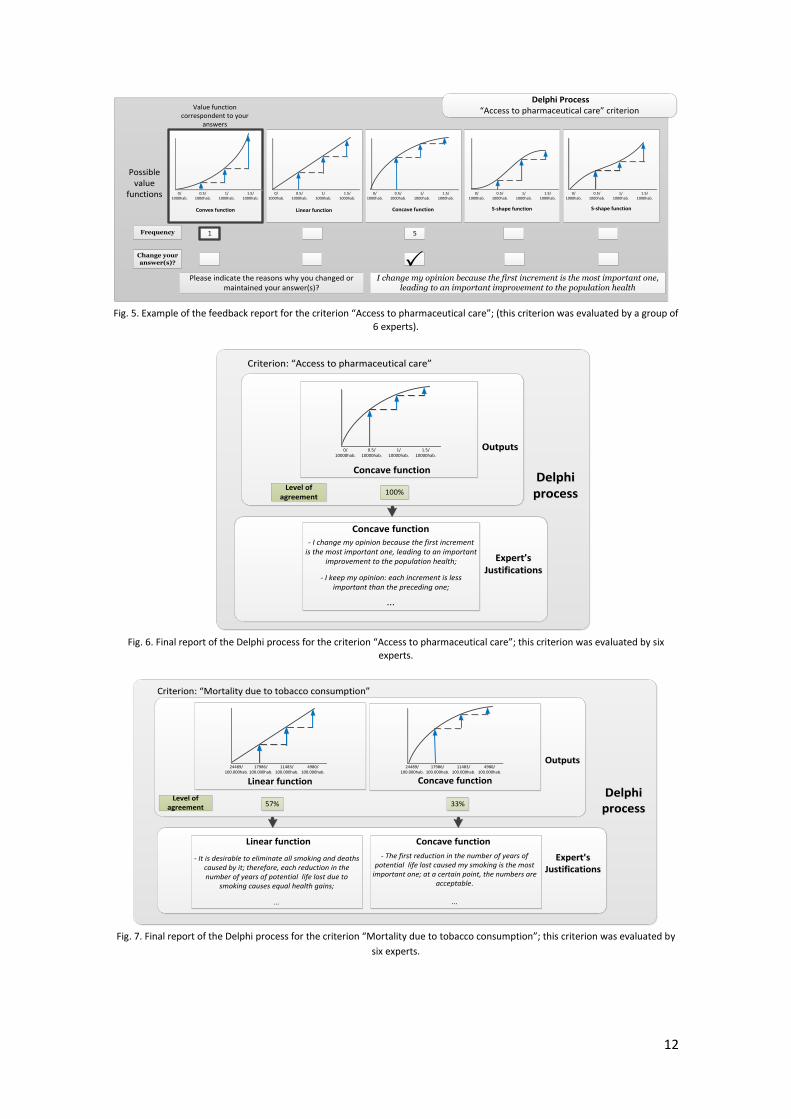
(5) Finally, after these two rounds, a final report with the results of the modified Delphi process was
elaborated and sent to the members of the ST-Group. This report expressed, for each criterion, the
le el of ag ee e t fo ea h t pe of alue fu tio a d a su a of the e pe ts justifi atio s. I Fig. 6 it is displa ed the fi al epo t of the Delphi p o ess fo the ite io Access to pharmaceutical
care , to hi h all the e pe ts ag eed that the alue fu tio should e o a e; Fig. 7 displays the
fi al epo t fo the ite io Mo talit due to to a o o su ptio in which four of the six
experts considered that the value function should be linear. In both reports it is also shown the
e pe t s justifi atio s regarding the chosen type of value function.
12
desempenho
20.5% 27% 9% 2%20.5
%27% 9% 2%
20.5
%27% 9% 2%
20.5
%6% 2%
Convex function Linear function Concave function S-shape function S-shape function
1 5Frequency
Possible
value
functions
Possible
value
functions
Value function
correspondent to your
answers
Value function
correspondent to your
answers
Change your answer(s)?
0/
1000hab.
0.5/
1000hab.
1/
1000hab.
1.5/
1000hab.
0/
1000hab.
0.5/
1000hab.
1/
1000hab.
1.5/
1000hab.
0/
1000hab.
0.5/
1000hab.
1/
1000hab.
1.5/
1000hab.
0/
1000hab.
0.5/
1000hab.
1/
1000hab.
1.5/
1000hab.
0/
1000hab.
0.5/
1000hab.
1/
1000hab.
1.5/
1000hab.
P Please indicate the reasons why you changed or
maintained your answer(s)?
I change my opinion because the first increment is the most important one, leading to an important improvement to the population health
Delphi Process
Access to pharmaceutical care ite io
Fig. 5. Example of the feedback report fo the ite io Access to pharmaceutical care ; (this criterion was evaluated by a group of
6 experts).
Concave function
OutputsOutputs
Criterion: A ess to pha a euti al a e Criterion: A ess to pha a euti al a e
Level of
agreement100%
0/
10000hab.
0.5/
10000hab.
1/
10000hab.
1.5/
10000hab.
- I change my opinion because the first increment
is the most important one, leading to an important
improvement to the population health;
- I keep my opinion: each increment is less
important than the preceding one;
...
Concave function
Expert’s Justifications
Expert’s Justifications
Delphi
process
Delphi
process
Fig. 6. Final report of the Delphi process fo the ite io Access to pharmaceutical care ; this criterion was evaluated by six
experts.
Concave function
OutputsOutputs
Criterion: Mo talit due to to a o o su ptio Criterion: Mo talit due to to a o o su ptio
Level of
agreement
Linear function
57% 33%
- It is desirable to eliminate all smoking and deaths
caused by it; therefore, each reduction in the
number of years of potential life lost due to
smoking causes equal health gains;
...
- The first reduction in the number of years of
potential life lost caused my smoking is the most
important one; at a certain point, the numbers are
acceptable.
...
Concave function Linear function
24489/
100.000hab.
17986/
100.000hab.
11483/
100.000hab.
4980/
100.000hab.
24489/
100.000hab.
17986/
100.000hab.
11483/
100.000hab.
4980/
100.000hab.
Expert’s Justifications
Expert’s Justifications
Delphi
process
Delphi
process
Fig. 7. Fi al epo t of the Delphi p o ess fo the ite io Mo talit due to to a o o su ptio ; this ite io as e aluated y
six experts.
13
3.3.2 Design of decision conferencing with MACBETH to build value functions
With the ST-Group, in a series of decision conferencing workshops, and with the support of
M-MACBETH, the modified Delphi process results were analyzed and a value function was assessed. In
this stage, first a final report with the Delphi process outputs was sent to the ST-Group for analyses,
being then discussed in a decision conferencing meeting. For instance: 1) the members of the ST-Group
agreed that a concave function was appropriate fo the ite io Access to pharmaceutical care (see
Fig. 6) because, after a certain level of availability of pharmacies per capita, the added value of an extra
pharmacy is almost negligible; 2) and agreed with a linear value function for the link between Mo talit due to to a o o su ptio and population health (see Fig. 7) as they regarded that each decrease in
the number of years of life lost caused by smoking equally contributes for population health.
In the case of linear value functions, it was straightforward to determine the mathematical
expression of the value function for each of the evaluation criteria. In the other cases, an iterative and
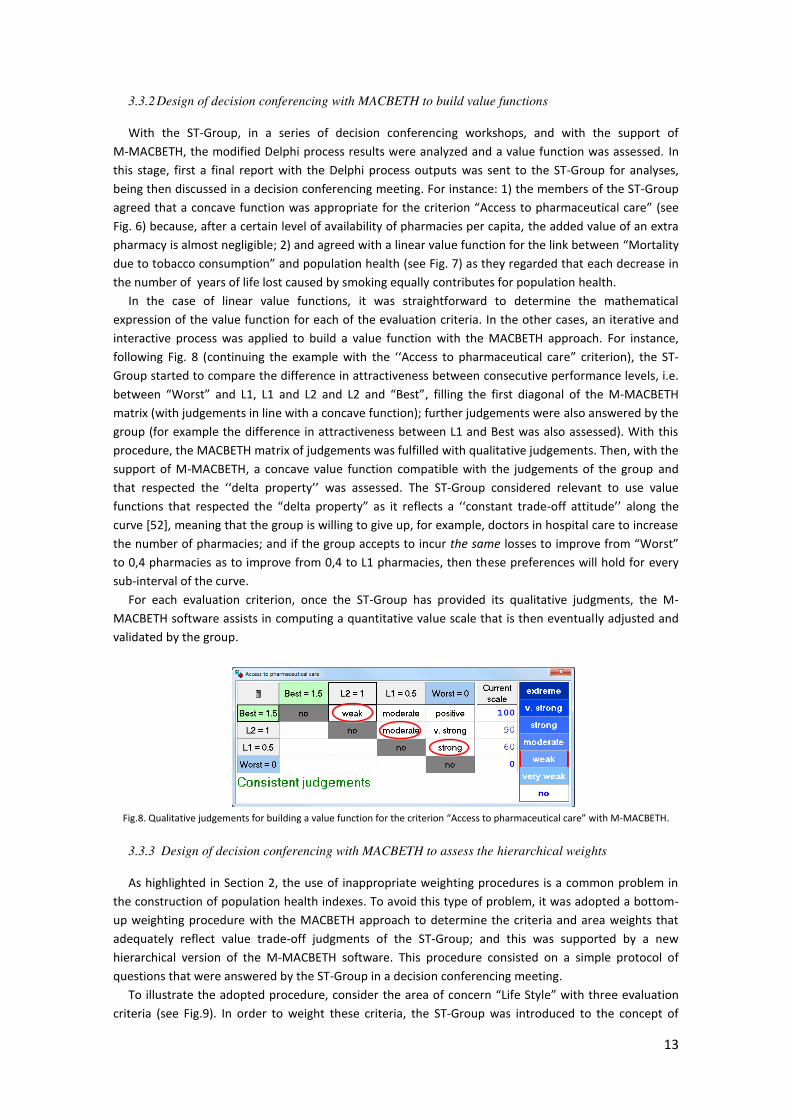
interactive process was applied to build a value function with the MACBETH approach. For instance,
following Fig. 8 (continuing the example with the Access to pharmaceutical care criterion), the ST-
Group started to compare the difference in attractiveness between consecutive performance levels, i.e.
between Wo st a d L , L a d L a d L a d Best , filling the first diagonal of the M-MACBETH
matrix (with judgements in line with a concave function); further judgements were also answered by the
group (for example the difference in attractiveness between L1 and Best was also assessed). With this
procedure, the MACBETH matrix of judgements was fulfilled with qualitative judgements. Then, with the
support of M-MACBETH, a concave value function compatible with the judgements of the group and
that respected the delta p ope t was assessed. The ST-Group considered relevant to use value
functions that respected the delta p ope t as it efle ts a o sta t t ade-off attitude along the
curve [52], meaning that the group is willing to give up, for example, doctors in hospital care to increase
the number of pharmacies; and if the group accepts to incur the same losses to i p o e f o Wo st to 0,4 pharmacies as to improve from 0,4 to L1 pharmacies, then these preferences will hold for every
sub-interval of the curve.
For each evaluation criterion, once the ST-Group has provided its qualitative judgments, the M-
MACBETH software assists in computing a quantitative value scale that is then eventually adjusted and
validated by the group.
Fig.8. Qualitative judgements for building a alue fu tio fo the ite io A ess to pha a euti al a e with M-MACBETH.
3.3.3 Design of decision conferencing with MACBETH to assess the hierarchical weights
As highlighted in Section 2, the use of inappropriate weighting procedures is a common problem in
the construction of population health indexes. To avoid this type of problem, it was adopted a bottom-
up weighting procedure with the MACBETH approach to determine the criteria and area weights that
adequately reflect value trade-off judgments of the ST-Group; and this was supported by a new
hierarchical version of the M-MACBETH software. This procedure consisted on a simple protocol of
questions that were answered by the ST-Group in a decision conferencing meeting.
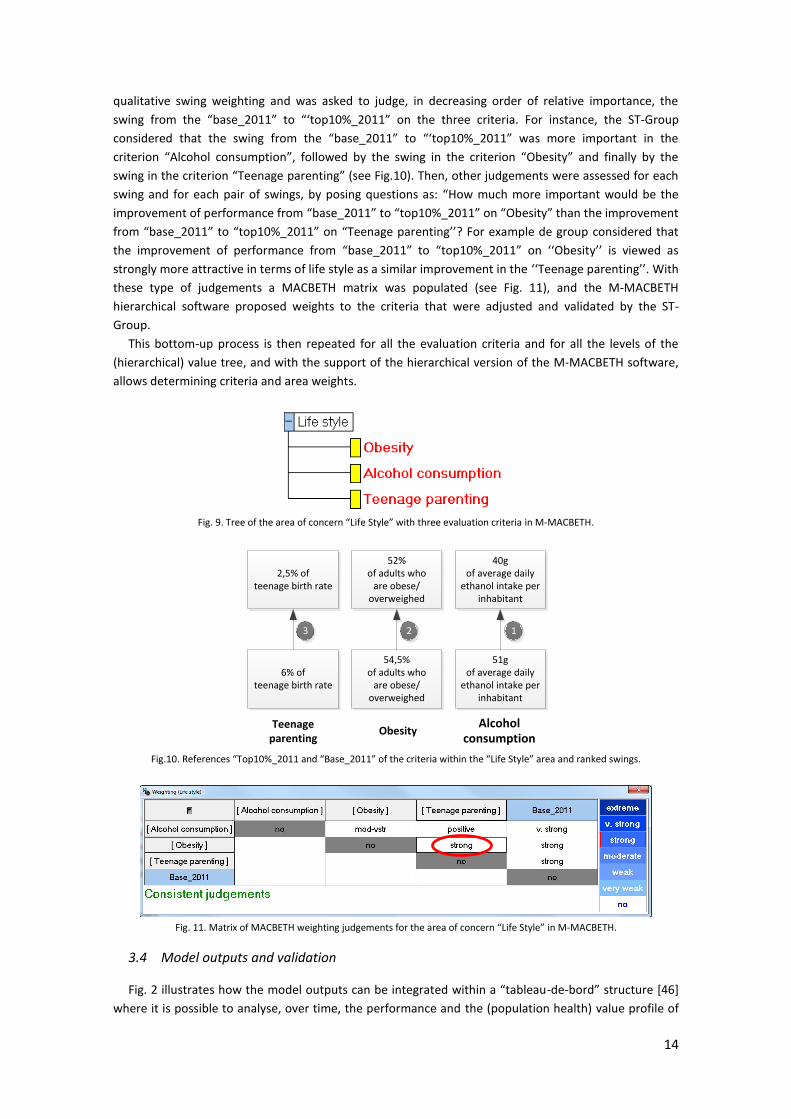
To illustrate the adopted procedure, consider the area of concern Life Style with three evaluation
criteria (see Fig.9). In order to weight these criteria, the ST-Group was introduced to the concept of
14
qualitative swing weighting and was asked to judge, in decreasing order of relative importance, the
s i g f o the ase_ to top %_ o the three criteria. For instance, the ST-Group
o side ed that the s i g f o the ase_ to top %_ as o e i po ta t i the ite io Al ohol o su ptio , follo ed the s i g i the ite io O esit a d fi all the
s i g i the ite io Tee age parenting (see Fig.10). Then, other judgements were assessed for each
swing and for each pair of swings, by posing questions as: How much more important would be the
improvement of performance from base_2011 to top10%_2011 o Obesity than the improvement
f o ase_ to top %_ o Tee age pa e ti g ? For example de group considered that
the improvement of performance from base_2011 to top10%_2011 o O esit is ie ed as strongly more attractive in terms of life style as a similar improvement in the Tee age pa e ti g . With
these type of judgements a MACBETH matrix was populated (see Fig. 11), and the M-MACBETH
hierarchical software proposed weights to the criteria that were adjusted and validated by the ST-
Group.
This bottom-up process is then repeated for all the evaluation criteria and for all the levels of the
(hierarchical) value tree, and with the support of the hierarchical version of the M-MACBETH software,
allows determining criteria and area weights.
Fig. 9. Tree of the area of o e Life “t le ith th ee e aluatio ite ia in M-MACBETH.
2,5% of
teenage birth rate
52%
of adults who
are obese/
overweighed
40g
of average daily
ethanol intake per
inhabitant
6% of
teenage birth rate
54,5%
of adults who
are obese/
overweighed
51g
of average daily
ethanol intake per
inhabitant
3 2 1
Alcohol
consumptionObesity
Teenage
parenting
Fig.10. ‘efe e es Top10%_2011 a d Base_2011 of the ite ia ithi the Life “t le a ea and ranked swings.
Fig. 11. Matrix of MACBETH weighting judge e ts fo the a ea of o e Life “t le in M-MACBETH.
3.4 Model outputs and validation
Fig. 2 illust ates ho the odel outputs a e i teg ated ithi a ta leau-de- o d st u tu e [46]
where it is possible to analyse, over time, the performance and the (population health) value profile of

15
each municipality within and across areas, and the aggregated value of each municipality; this permits to
visualize the areas of concern in which each municipality demands higher attention, to observe the
evolution of population health for each geographic area and across time, as well as to compare in each
year and across time the health of the population of different municipalities. Moreover, the value of
each municipality in each area and in overall terms can be analysed in terms of their distance to the
top % a d the ase efe e es of the espe ti e ea . Fi all , the odel outputs provide an
overall picture of the health of the population in each municipality, allowing health decision-makers and
policy-makers to visualize geographic health inequalities within and across municipalities over time.
According to Kaltenthaler et al. [10] health indexes need to undergo extensive testing, with the aim of
ensuring the validation and reliability of the model outputs. Therefore, to ensure that the model was
e uisite i.e. that ould be satisfactory used to evaluate population health at the municipality level,
the ST-Group extensively analysed the model outputs u i ipalit s populatio health profiles,
disaggregated and aggregated, and over time) for nine representative municipalities and discussed
these outputs in a decision conference. That discussion has led to some model adjustments, and the ST-
Group is now making a final review of the model. At this stage, the members of the SK-Group are also
being consulted to give feedback regarding their views on the model outputs. Analyses of model outputs
are further being enabled by the visualization of results in geographic information system.
4. Results of the application of the multicriteria model to the Portuguese case
This section presents selected features and results of the application of the proposed framework to
build an index to evaluate population health at the municipality level in Portugal over the past twenty
years (in the years of 1991, 2001 and 2011). These are still preliminary results, as the model may still be
subject to some final adjustments.
4.1 Value tree
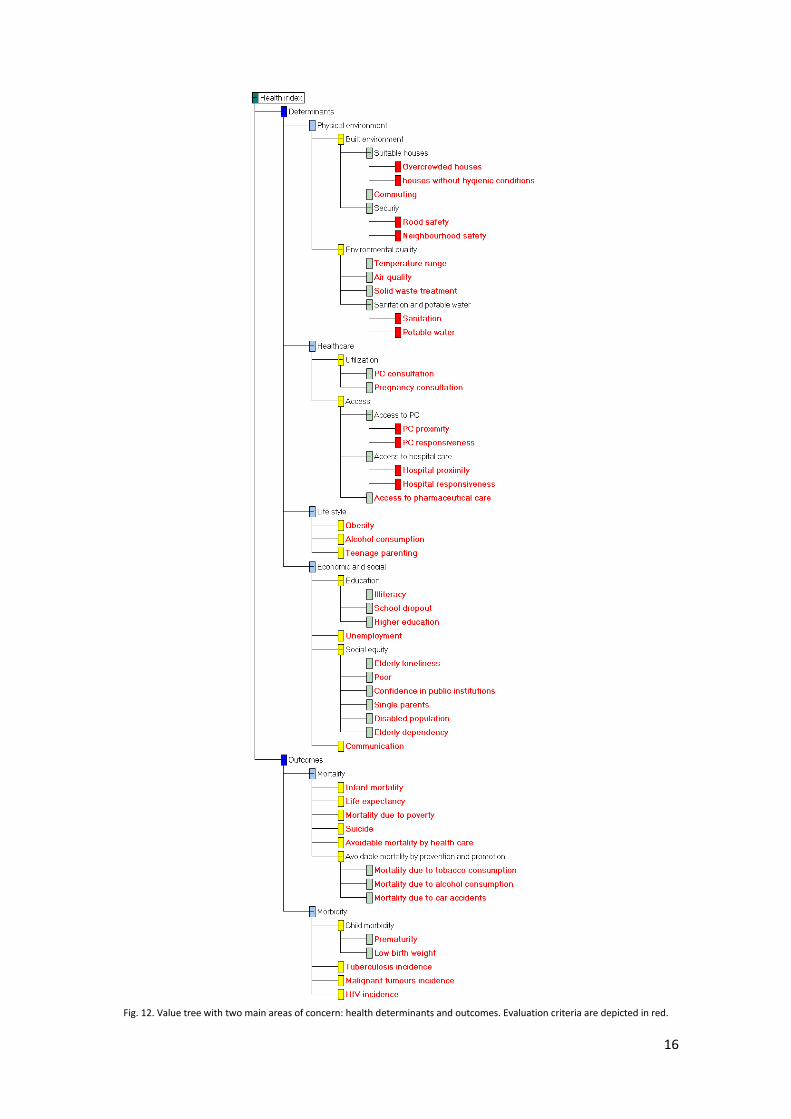
The hierarchical structure of the model adopted to build the health index is depicted in the value
tree of Fig. 12. The areas of concern are specified by a set of 44 evaluation criteria on which the health
of the populatio should e app aised. Fo e a ple, i the Life “t le” area of concern, three criteria
were set. The value tree was considered concise and complete, incorporating all the relevant aspects
that both groups considered important to evaluate population health at the community level.
16
Fig. 12. Value tree with two main areas of concern: health determinants and outcomes. Evaluation criteria are depicted in red.
17
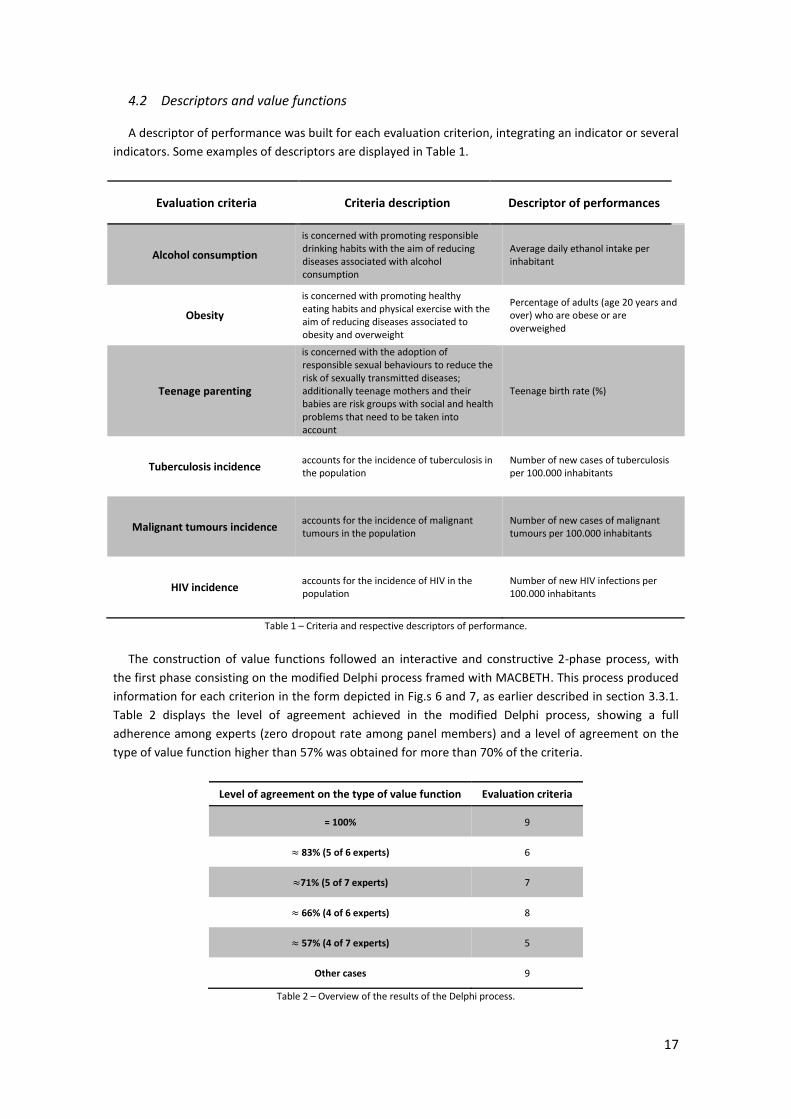
4.2 Descriptors and value functions
A descriptor of performance was built for each evaluation criterion, integrating an indicator or several
indicators. Some examples of descriptors are displayed in Table 1.
Evaluation criteria Criteria description Descriptor of performances
Alcohol consumption
is concerned with promoting responsible
drinking habits with the aim of reducing
diseases associated with alcohol
consumption
Average daily ethanol intake per
inhabitant
Obesity
is concerned with promoting healthy
eating habits and physical exercise with the
aim of reducing diseases associated to
obesity and overweight
Percentage of adults (age 20 years and
over) who are obese or are
overweighed
Teenage parenting
is concerned with the adoption of
responsible sexual behaviours to reduce the
risk of sexually transmitted diseases;
additionally teenage mothers and their
babies are risk groups with social and health
problems that need to be taken into
account
Teenage birth rate (%)
Tuberculosis incidence accounts for the incidence of tuberculosis in
the population
Number of new cases of tuberculosis
per 100.000 inhabitants
Malignant tumours incidence accounts for the incidence of malignant
tumours in the population
Number of new cases of malignant
tumours per 100.000 inhabitants
HIV incidence accounts for the incidence of HIV in the
population
Number of new HIV infections per
100.000 inhabitants
Table 1 – Criteria and respective descriptors of performance.
The construction of value functions followed an interactive and constructive 2-phase process, with
the first phase consisting on the modified Delphi process framed with MACBETH. This process produced
information for each criterion in the form depicted in Fig.s 6 and 7, as earlier described in section 3.3.1.
Table 2 displays the level of agreement achieved in the modified Delphi process, showing a full
adherence among experts (zero dropout rate among panel members) and a level of agreement on the
type of value function higher than 57% was obtained for more than 70% of the criteria.
Level of agreement on the type of value function Evaluation criteria
= 100% 9
83% (5 of 6 experts) 6
71% (5 of 7 experts) 7
66% (4 of 6 experts) 8
57% (4 of 7 experts) 5
Other cases 9
Table 2 – Overview of the results of the Delphi process.
18
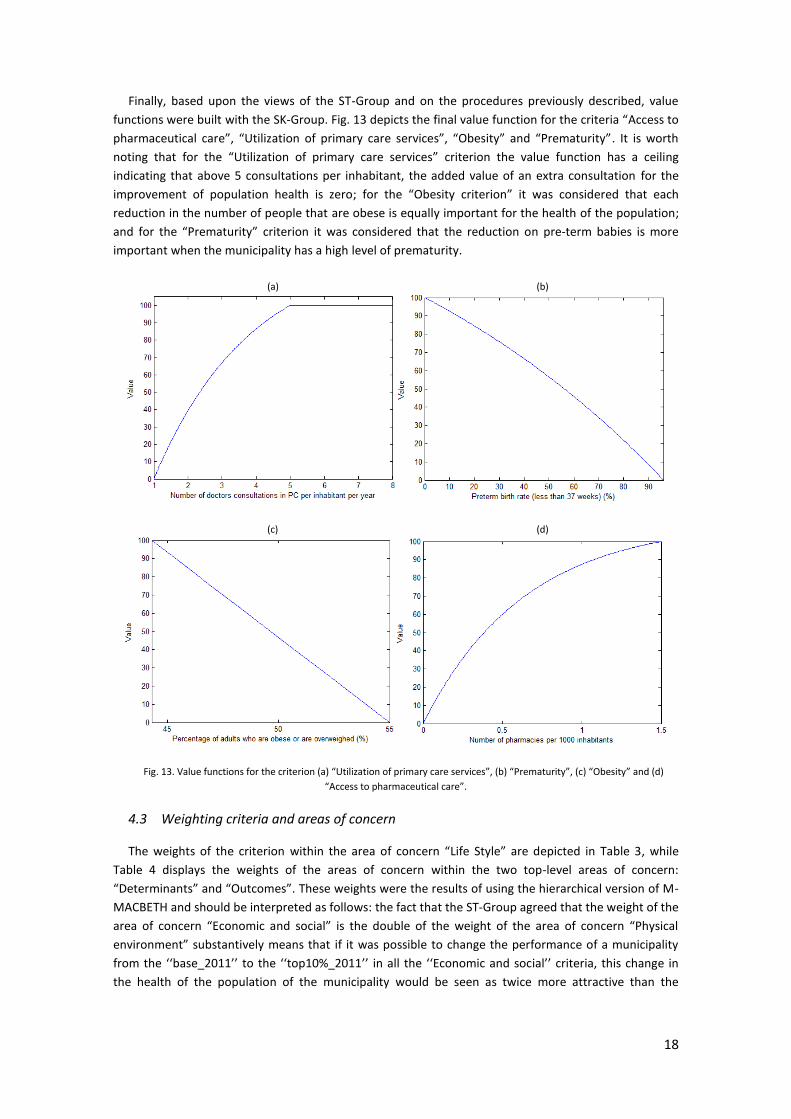
Finally, based upon the views of the ST-Group and on the procedures previously described, value
functions were built with the SK-Group. Fig. 13 depicts the fi al alue fu tio fo the ite ia Access to
pha a euti al a e , Utilizatio of p i a a e se i es , O esit a d P e atu it . It is worth
noting that for the Utilizatio of p i a a e se i es criterion the value function has a ceiling
indicating that above 5 consultations per inhabitant, the added value of an extra consultation for the
improvement of population health is zero; for the O esit ite io it as o side ed that each
reduction in the number of people that are obese is equally important for the health of the population;
and fo the P e atu it criterion it was considered that the reduction on pre-term babies is more
important when the municipality has a high level of prematurity.
(a) (b)
(c) (d)
Fig. 13. Value functions for the criterion (a) Utilizatio of p i a a e se i es , P e atu it , (c) Obesity a d (d)
Access to pharmaceutical care .
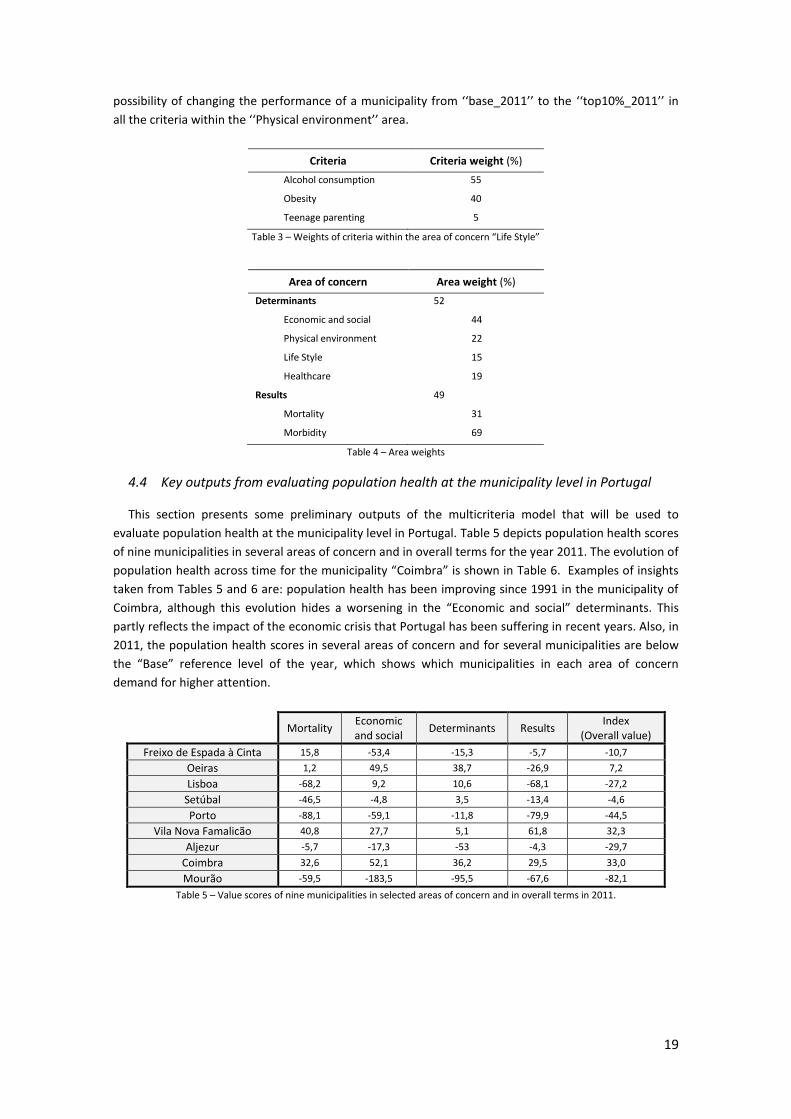
4.3 Weighting criteria and areas of concern
The weights of the criterion within the area of o e Life “t le a e depi ted i Ta le , while
Table 4 displays the weights of the areas of concern within the two top-level areas of concern:
Dete i a ts a d Out o es . These weights were the results of using the hierarchical version of M-
MACBETH and should be interpreted as follows: the fact that the ST-Group agreed that the weight of the
a ea of o e E o o i a d so ial is the dou le of the eight of the a ea of o e Ph si al e i o e t su sta ti el ea s that if it was possible to change the performance of a municipality
from the ase_ to the top %_ i all the E o o i a d so ial ite ia, this ha ge in
the health of the population of the municipality would be seen as twice more attractive than the
19
possi ilit of ha gi g the pe fo a e of a u i ipalit f o ase_ to the top %_ i all the ite ia ithi the Ph si al e i o e t a ea.
Criteria Criteria weight (%)
Alcohol consumption 55
Obesity 40
Teenage parenting 5
Table 3 – Weights of ite ia ithi the a ea of o e Life “t le
Area of concern Area weight (%)
Determinants 52
Economic and social 44
Physical environment 22
Life Style 15
Healthcare 19
Results 49
Mortality 31
Morbidity 69
Table 4 – Area weights
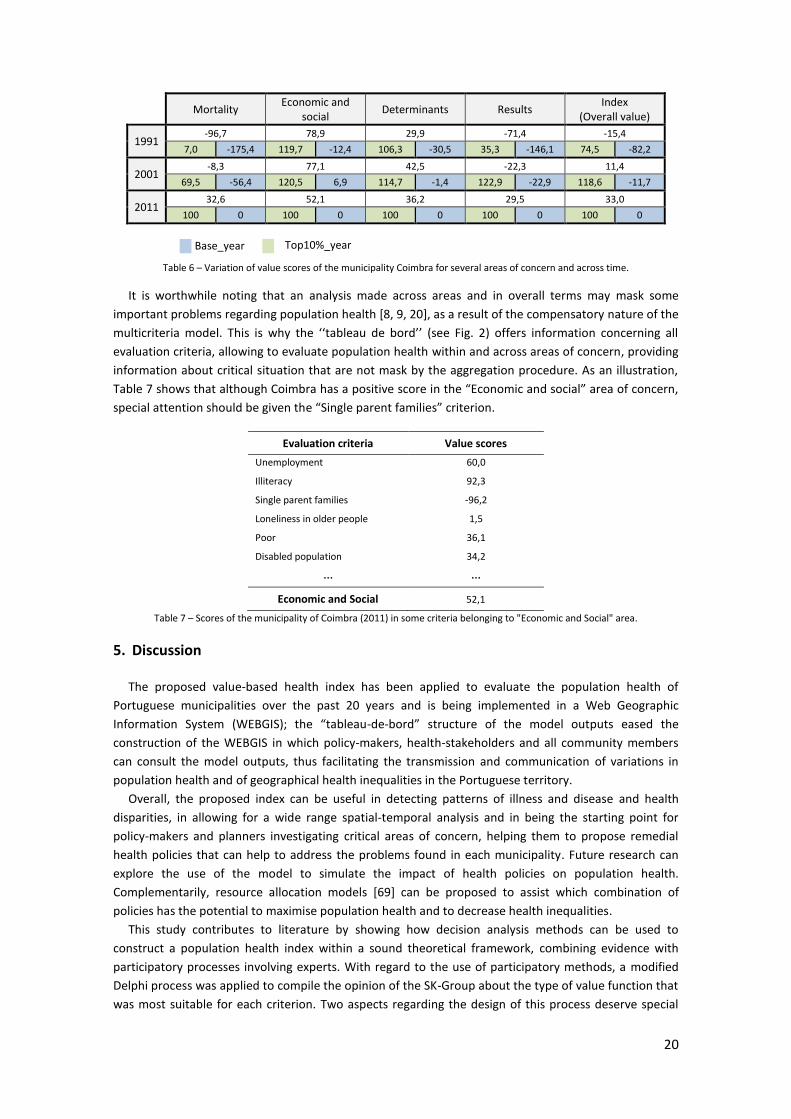
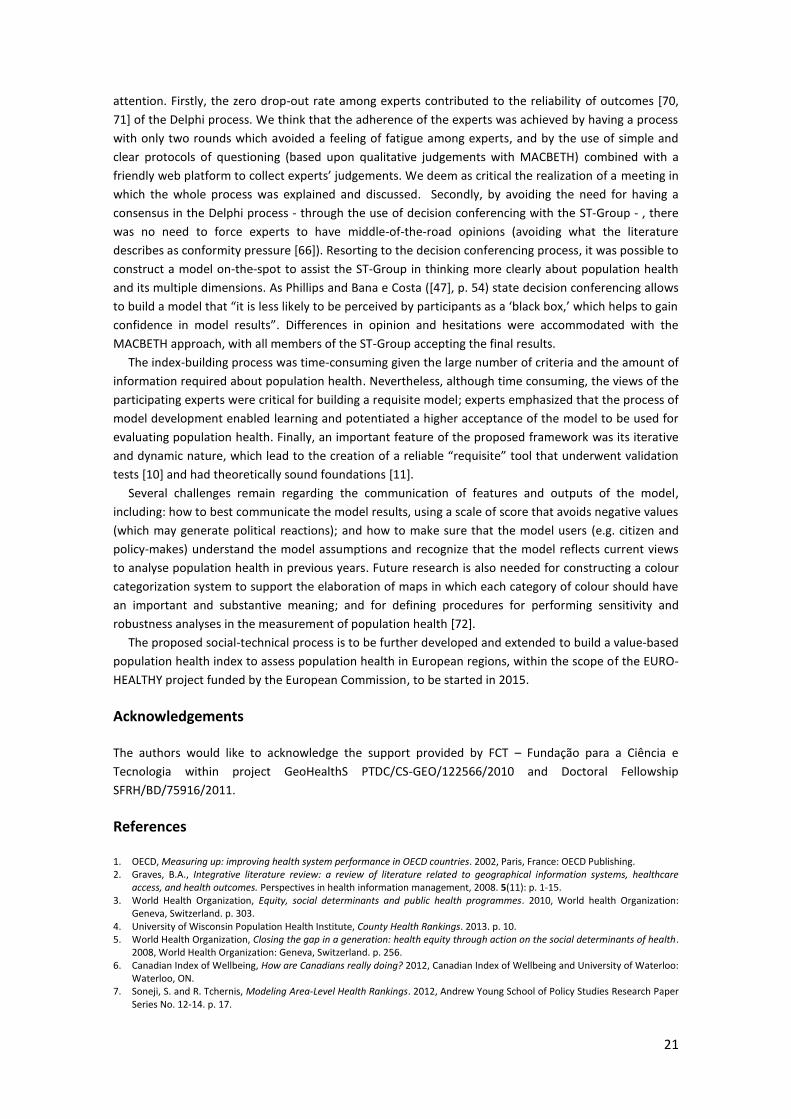
4.4 Key outputs from evaluating population health at the municipality level in Portugal
This section presents some preliminary outputs of the multicriteria model that will be used to
evaluate population health at the municipality level in Portugal. Table 5 depicts population health scores
of nine municipalities in several areas of concern and in overall terms for the year 2011. The evolution of
population health across time fo the u i ipalit Coimbra is shown in Table 6. Examples of insights
taken from Tables 5 and 6 are: population health has been improving since 1991 in the municipality of
Coimbra, although this evolution hides a worsening in the E o o i a d so ial determinants. This
partly reflects the impact of the economic crisis that Portugal has been suffering in recent years. Also, in
2011, the population health scores in several areas of concern and for several municipalities are below
the Base reference level of the year, which shows which municipalities in each area of concern
demand for higher attention.
Mortality
Economic
and social Determinants Results
Index
(Overall value)
Freixo de Espada à Cinta 15,8 -53,4 -15,3 -5,7 -10,7
Oeiras 1,2 49,5 38,7 -26,9 7,2
Lisboa -68,2 9,2 10,6 -68,1 -27,2
Setúbal -46,5 -4,8 3,5 -13,4 -4,6
Porto -88,1 -59,1 -11,8 -79,9 -44,5
Vila Nova Famalicão 40,8 27,7 5,1 61,8 32,3
Aljezur -5,7 -17,3 -53 -4,3 -29,7
Coimbra 32,6 52,1 36,2 29,5 33,0
Mourão -59,5 -183,5 -95,5 -67,6 -82,1
Table 5 – Value scores of nine municipalities in selected areas of concern and in overall terms in 2011.
20
Mortality
Economic and
social Determinants Results
Index
(Overall value)
1991 -96,7 78,9 29,9 -71,4 -15,4
7,0 -175,4 119,7 -12,4 106,3 -30,5 35,3 -146,1 74,5 -82,2
2001 -8,3 77,1 42,5 -22,3 11,4
69,5 -56,4 120,5 6,9 114,7 -1,4 122,9 -22,9 118,6 -11,7
2011 32,6 52,1 36,2 29,5 33,0
100 0 100 0 100 0 100 0 100 0
Table 6 – Variation of value scores of the municipality Coimbra for several areas of concern and across time.
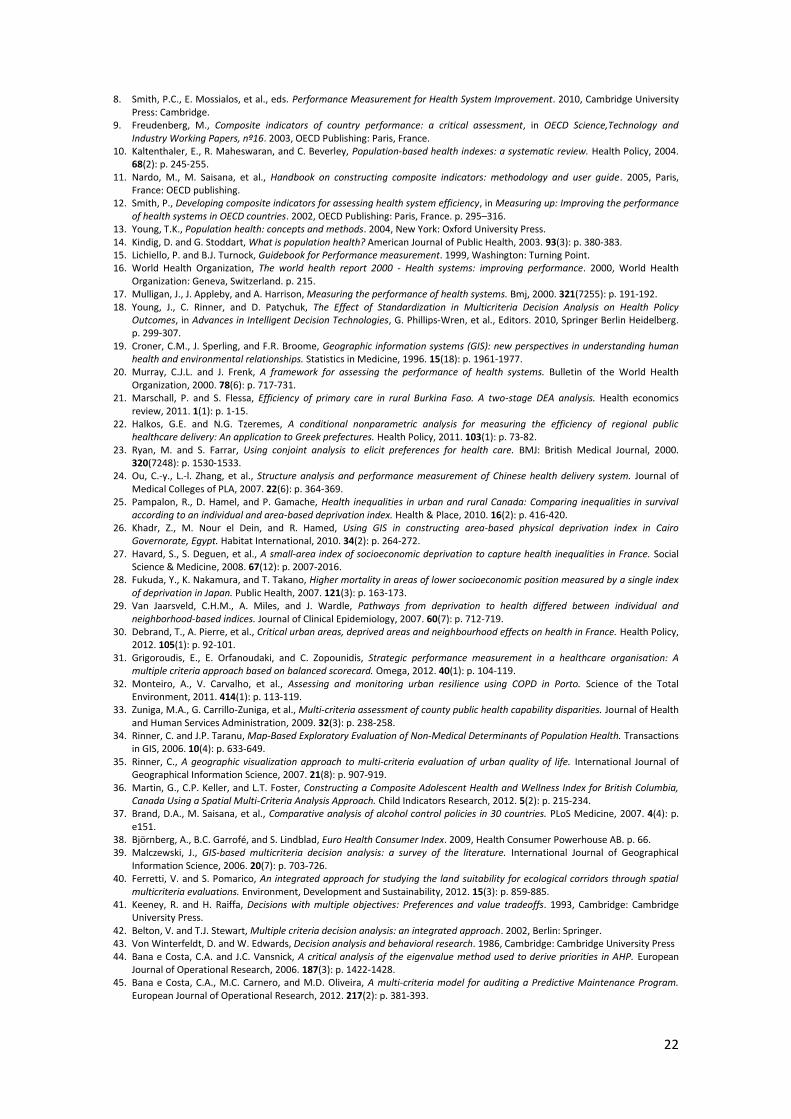
It is worthwhile noting that an analysis made across areas and in overall terms may mask some
important problems regarding population health [8, 9, 20], as a result of the compensatory nature of the
multicriteria model. This is h the ta leau de o d see Fig. offe s i fo atio o e i g all evaluation criteria, allowing to evaluate population health within and across areas of concern, providing
information about critical situation that are not mask by the aggregation procedure. As an illustration,
Table 7 shows that although Coi a has a positi e s o e i the E o o i a d so ial a ea of o e , special attention should be given the “i gle pa e t fa ilies criterion.
Evaluation criteria Value scores
Unemployment 60,0
Illiteracy 92,3
Single parent families -96,2
Loneliness in older people 1,5
Poor 36,1
Disabled population 34,2
… …
Economic and Social 52,1
Table 7 – Scores of the municipality of Coimbra (2011) in some criteria belonging to "Economic and Social" area.
5. Discussion
The proposed value-based health index has been applied to evaluate the population health of
Portuguese municipalities over the past 20 years and is being implemented in a Web Geographic
Information System (WEBGIS); the tableau-de-bord structure of the model outputs eased the
construction of the WEBGIS in which policy-makers, health-stakeholders and all community members
can consult the model outputs, thus facilitating the transmission and communication of variations in
population health and of geographical health inequalities in the Portuguese territory.
Overall, the proposed index can be useful in detecting patterns of illness and disease and health
disparities, in allowing for a wide range spatial-temporal analysis and in being the starting point for
policy-makers and planners investigating critical areas of concern, helping them to propose remedial
health policies that can help to address the problems found in each municipality. Future research can
explore the use of the model to simulate the impact of health policies on population health.
Complementarily, resource allocation models [69] can be proposed to assist which combination of
policies has the potential to maximise population health and to decrease health inequalities.
This study contributes to literature by showing how decision analysis methods can be used to
construct a population health index within a sound theoretical framework, combining evidence with
participatory processes involving experts. With regard to the use of participatory methods, a modified
Delphi process was applied to compile the opinion of the SK-Group about the type of value function that
was most suitable for each criterion. Two aspects regarding the design of this process deserve special
Base_year Top10%_year
21
attention. Firstly, the zero drop-out rate among experts contributed to the reliability of outcomes [70,
71] of the Delphi process. We think that the adherence of the experts was achieved by having a process
with only two rounds which avoided a feeling of fatigue among experts, and by the use of simple and
clear protocols of questioning (based upon qualitative judgements with MACBETH) combined with a
f ie dl e platfo to olle t e pe ts judge e ts. We dee as iti al the ealizatio of a meeting in
which the whole process was explained and discussed. Secondly, by avoiding the need for having a
consensus in the Delphi process - through the use of decision conferencing with the ST-Group - , there
was no need to force experts to have middle-of-the-road opinions (avoiding what the literature
describes as conformity pressure [66]). Resorting to the decision conferencing process, it was possible to
construct a model on-the-spot to assist the ST-Group in thinking more clearly about population health
and its multiple dimensions. As Phillips and Bana e Costa ([47], p. 54) state decision conferencing allows
to uild a odel that it is less likel to e pe ei ed pa ti ipa ts as a la k o , hi h helps to gai o fide e i odel esults . Differences in opinion and hesitations were accommodated with the
MACBETH approach, with all members of the ST-Group accepting the final results.
The index-building process was time-consuming given the large number of criteria and the amount of
information required about population health. Nevertheless, although time consuming, the views of the
participating experts were critical for building a requisite model; experts emphasized that the process of
model development enabled learning and potentiated a higher acceptance of the model to be used for
evaluating population health. Finally, an important feature of the proposed framework was its iterative
and dynamic nature, which lead to the creation of a reliable e uisite tool that underwent validation
tests [10] and had theoretically sound foundations [11].
Several challenges remain regarding the communication of features and outputs of the model,
including: how to best communicate the model results, using a scale of score that avoids negative values
(which may generate political reactions); and how to make sure that the model users (e.g. citizen and
policy-makes) understand the model assumptions and recognize that the model reflects current views
to analyse population health in previous years. Future research is also needed for constructing a colour
categorization system to support the elaboration of maps in which each category of colour should have
an important and substantive meaning; and for defining procedures for performing sensitivity and
robustness analyses in the measurement of population health [72].
The proposed social-technical process is to be further developed and extended to build a value-based
population health index to assess population health in European regions, within the scope of the EURO-
HEALTHY project funded by the European Commission, to be started in 2015.
Acknowledgements
The authors would like to acknowledge the support provided by FCT – Fundação para a Ciência e
Tecnologia within project GeoHealthS PTDC/CS-GEO/122566/2010 and Doctoral Fellowship
SFRH/BD/75916/2011.
References
1. OECD, Measuring up: improving health system performance in OECD countries. 2002, Paris, France: OECD Publishing.
2. Graves, B.A., Integrative literature review: a review of literature related to geographical information systems, healthcare
access, and health outcomes. Perspectives in health information management, 2008. 5(11): p. 1-15.
3. World Health Organization, Equity, social determinants and public health programmes. 2010, World health Organization:
Geneva, Switzerland. p. 303.
4. University of Wisconsin Population Health Institute, County Health Rankings. 2013. p. 10.
5. World Health Organization, Closing the gap in a generation: health equity through action on the social determinants of health.
2008, World Health Organization: Geneva, Switzerland. p. 256.
6. Canadian Index of Wellbeing, How are Canadians really doing? 2012, Canadian Index of Wellbeing and University of Waterloo:
Waterloo, ON.
7. Soneji, S. and R. Tchernis, Modeling Area-Level Health Rankings. 2012, Andrew Young School of Policy Studies Research Paper
Series No. 12-14. p. 17.
22
8. Smith, P.C., E. Mossialos, et al., eds. Performance Measurement for Health System Improvement. 2010, Cambridge University
Press: Cambridge.
9. Freudenberg, M., Composite indicators of country performance: a critical assessment, in OECD Science,Technology and
Industry Working Papers, nº16. 2003, OECD Publishing: Paris, France.
10. Kaltenthaler, E., R. Maheswaran, and C. Beverley, Population-based health indexes: a systematic review. Health Policy, 2004.
68(2): p. 245-255.
11. Nardo, M., M. Saisana, et al., Handbook on constructing composite indicators: methodology and user guide. 2005, Paris,
France: OECD publishing.
12. Smith, P., Developing composite indicators for assessing health system efficiency, in Measuring up: Improving the performance
of health systems in OECD countries. 2002, OECD Publishing: Paris, France. p. 295–316.
13. Young, T.K., Population health: concepts and methods. 2004, New York: Oxford University Press.
14. Kindig, D. and G. Stoddart, What is population health? American Journal of Public Health, 2003. 93(3): p. 380-383.
15. Lichiello, P. and B.J. Turnock, Guidebook for Performance measurement. 1999, Washington: Turning Point.
16. World Health Organization, The world health report 2000 - Health systems: improving performance. 2000, World Health
Organization: Geneva, Switzerland. p. 215.
17. Mulligan, J., J. Appleby, and A. Harrison, Measuring the performance of health systems. Bmj, 2000. 321(7255): p. 191-192.
18. Young, J., C. Rinner, and D. Patychuk, The Effect of Standardization in Multicriteria Decision Analysis on Health Policy
Outcomes, in Advances in Intelligent Decision Technologies, G. Phillips-Wren, et al., Editors. 2010, Springer Berlin Heidelberg.
p. 299-307.
19. Croner, C.M., J. Sperling, and F.R. Broome, Geographic information systems (GIS): new perspectives in understanding human
health and environmental relationships. Statistics in Medicine, 1996. 15(18): p. 1961-1977.
20. Murray, C.J.L. and J. Frenk, A framework for assessing the performance of health systems. Bulletin of the World Health
Organization, 2000. 78(6): p. 717-731.
21. Marschall, P. and S. Flessa, Efficiency of primary care in rural Burkina Faso. A two-stage DEA analysis. Health economics
review, 2011. 1(1): p. 1-15.
22. Halkos, G.E. and N.G. Tzeremes, A conditional nonparametric analysis for measuring the efficiency of regional public
healthcare delivery: An application to Greek prefectures. Health Policy, 2011. 103(1): p. 73-82.
23. Ryan, M. and S. Farrar, Using conjoint analysis to elicit preferences for health care. BMJ: British Medical Journal, 2000.
320(7248): p. 1530-1533.
24. Ou, C.-y., L.-l. Zhang, et al., Structure analysis and performance measurement of Chinese health delivery system. Journal of
Medical Colleges of PLA, 2007. 22(6): p. 364-369.
25. Pampalon, R., D. Hamel, and P. Gamache, Health inequalities in urban and rural Canada: Comparing inequalities in survival
according to an individual and area-based deprivation index. Health & Place, 2010. 16(2): p. 416-420.
26. Khadr, Z., M. Nour el Dein, and R. Hamed, Using GIS in constructing area-based physical deprivation index in Cairo
Governorate, Egypt. Habitat International, 2010. 34(2): p. 264-272.
27. Havard, S., S. Deguen, et al., A small-area index of socioeconomic deprivation to capture health inequalities in France. Social
Science & Medicine, 2008. 67(12): p. 2007-2016.
28. Fukuda, Y., K. Nakamura, and T. Takano, Higher mortality in areas of lower socioeconomic position measured by a single index
of deprivation in Japan. Public Health, 2007. 121(3): p. 163-173.
29. Van Jaarsveld, C.H.M., A. Miles, and J. Wardle, Pathways from deprivation to health differed between individual and
neighborhood-based indices. Journal of Clinical Epidemiology, 2007. 60(7): p. 712-719.
30. Debrand, T., A. Pierre, et al., Critical urban areas, deprived areas and neighbourhood effects on health in France. Health Policy,
2012. 105(1): p. 92-101.
31. Grigoroudis, E., E. Orfanoudaki, and C. Zopounidis, Strategic performance measurement in a healthcare organisation: A
multiple criteria approach based on balanced scorecard. Omega, 2012. 40(1): p. 104-119.
32. Monteiro, A., V. Carvalho, et al., Assessing and monitoring urban resilience using COPD in Porto. Science of the Total
Environment, 2011. 414(1): p. 113-119.
33. Zuniga, M.A., G. Carrillo-Zuniga, et al., Multi-criteria assessment of county public health capability disparities. Journal of Health
and Human Services Administration, 2009. 32(3): p. 238-258.
34. Rinner, C. and J.P. Taranu, Map‐Based E plo ato Evaluatio of No ‐Medi al Dete i a ts of Populatio Health. Transactions
in GIS, 2006. 10(4): p. 633-649.
35. Rinner, C., A geog aphi visualizatio app oa h to ulti‐ ite ia evaluatio of u a ualit of life. International Journal of
Geographical Information Science, 2007. 21(8): p. 907-919.
36. Martin, G., C.P. Keller, and L.T. Foster, Constructing a Composite Adolescent Health and Wellness Index for British Columbia,
Canada Using a Spatial Multi-Criteria Analysis Approach. Child Indicators Research, 2012. 5(2): p. 215-234.
37. Brand, D.A., M. Saisana, et al., Comparative analysis of alcohol control policies in 30 countries. PLoS Medicine, 2007. 4(4): p.
e151.
38. Björnberg, A., B.C. Garrofé, and S. Lindblad, Euro Health Consumer Index. 2009, Health Consumer Powerhouse AB. p. 66.
39. Malczewski, J., GIS‐ ased ulti ite ia de isio a al sis: a su ve of the lite atu e. International Journal of Geographical
Information Science, 2006. 20(7): p. 703-726.
40. Ferretti, V. and S. Pomarico, An integrated approach for studying the land suitability for ecological corridors through spatial
multicriteria evaluations. Environment, Development and Sustainability, 2012. 15(3): p. 859-885.
41. Keeney, R. and H. Raiffa, Decisions with multiple objectives: Preferences and value tradeoffs. 1993, Cambridge: Cambridge
University Press.
42. Belton, V. and T.J. Stewart, Multiple criteria decision analysis: an integrated approach. 2002, Berlin: Springer.
43. Von Winterfeldt, D. and W. Edwards, Decision analysis and behavioral research. 1986, Cambridge: Cambridge University Press
44. Bana e Costa, C.A. and J.C. Vansnick, A critical analysis of the eigenvalue method used to derive priorities in AHP. European
Journal of Operational Research, 2006. 187(3): p. 1422-1428.
45. Bana e Costa, C.A., M.C. Carnero, and M.D. Oliveira, A multi-criteria model for auditing a Predictive Maintenance Program.
European Journal of Operational Research, 2012. 217(2): p. 381-393.
23
46. Epstein, M.J. and J.-F. Manzoni, The Balanced Scorecard and Tableau de Bord: a global perspective on translating strategy into
action. 1997, Fontainebleau, France: Insead Fontainebleau.
47. Phillips, L.D. and C.A. Bana e Costa, Transparent prioritisation, budgeting and resource allocation with multi-criteria decision
analysis and decision conferencing. Annals of Operations Research, 2007. 154(1): p. 51-68.
48. Budescu, D.V. and E. Chen, Identifying Expertise to Extract the Wisdom of Crowds. Management Science, 2014.
http://dx.doi.org/10.1287/mnsc.2014.1909.
49. Tako, A.A. and K. Kotiadis. Facilitated conceptual modelling: practical issues and reflections. in Simulation Conference (WSC),
Proceedings of the 2012 Winter. 2012. Berlin: IEEE.
50. Linstone, H.A., M. Turoff, and O. Helmer, The Delphi method: Techniques and applications. 2002, Reading, MA: Addison-
Wesley.
51. Rodrigues, T.C., C.A. Bana e Costa, and M.D. Oliveira, Multicriteria Cognitive Map: A tool for problem-structuring and
multicriteria evaluation. Working paper 3/2013. 2013, Lisbon: Centre for management studies of IST.
52. Kirkwood, C.W., Strategic decision making: multiobjective decision analysis with spreadsheets. 1997, Belmont,California:
Duxbury Press
53. Bana e Costa, C.A., E.C. Corrêa, et al., Facilitating bid evaluation in public call for tenders: a socio-technical approach. Omega-
Int J Manage Sci, 2002. 30(3): p. 227-242.
54. Bana e Costa, C. and M. Oliveira, A Multicriteria Decision Analysis Model for Faculty Evaluation. Omega-Int J Manage Sci, 2012.
40(4): p. 424-436.
55. Bana e Costa, C.A., J.-M. De Corte, and J.-C. Vansnick, MACBETH. International Journal of Information Technology & Decision
Making, 2012. 11(02): p. 359-387.
56. Bana e Costa, C.A. and M.P. Chagas, A career choice problem: An example of how to use MACBETH to build a quantitative
value model based on qualitative value judgments. European Journal of Operational Research, 2004. 153(2): p. 323-331.
57. Fasolo, B. and C.A. Bana e Costa, Tailoring value elicitation to decision makers' numeracy and fluency: Expressing value
judgments in numbers or words. Omega, 2014. 44: p. 83-90.
58. Bana e Costa, C.A., J.M. De Corte, and J.C. Vansnick, On the mathematical foundations of MACBETH, in Multiple Criteria
Decision Analysis: The State of the Art Surveys, J. Figueira, S. Greco, and M. Ehrgott, Editors. 2005, Springer: New York. p. 409-
442.
59. Bana e Costa, C.A., J.C. Lourenço, et al., A socio-technical approach for group decision support in public strategic planning: The
Pernambuco PPA case. Group Decision and Negotiation, 2014. 23(1): p. 5-29.
60. Bana e Costa, C.A., J.M. de Corte, and J.C. Vansnick, M-MACBETH - User's Guide (version V1.1). 2005, URL: http://www.m-
macbeth.com/downloads.html#guide.
61. Bana Consulting. Wised Decision Support System. 2012 [cited September 2014]; URL:http://wiseds.com/.
62. Phillips, L.D., A theory of requisite decision models. Acta psychologica, 1984. 56(1): p. 29-48.
63. Parnell, G.S., T.A. Bresnick, et al., Handbook of Decision Analysis. 2013, New Jersey: Wiley.
64. Parnell, G.S., P.J. Driscoll, and D.L. Henderson, Decision making in systems engineering and management. Vol. 81. 2011, New
York: Wiley.
65. Geis, J.P., G.S. Parnell, et al., Blue horizons study assesses future capabilities and technologies for the United States Air Force.
Interfaces, 2011. 41(4): p. 338-353.
66. Rowe, G. and G. Wright, The Delphi technique as a forecasting tool: issues and analysis. International journal of forecasting,
1999. 15(4): p. 353-375.
67. Fink, A., J. Kosecoff, et al., Consensus methods: characteristics and guidelines for use. American Journal of Public Health, 1984.
74(9): p. 979-983.
68. Powell, C., The Delphi technique: myths and realities. Journal of Advanced Nursing, 2003. 41(4): p. 376-382.
69. Lourenço, J.C., A. Morton, and C.A. Bana e Costa, PROBE–A multicriteria decision support system for portfolio robustness
evaluation. Decision Support Systems, 2012. 54(1): p. 534-550.
70. Bolger, F. and G. Wright, Improving the Delphi process: lessons from social psychological research. Technological Forecasting
and Social Change, 2011. 78(9): p. 1500-1513.
71. Van Zolingen, S.J. and C.A. Klaassen, Selection processes in a Delphi study about key qualifications in Senior Secondary
Vocational Education. Technological Forecasting and Social Change, 2003. 70(4): p. 317-340.
72. Bana e Costa, C. and P. Vincke, Measuring credibility of compensatory preference statements when trade-offs are interval
determined. Theory and Decision, 1995. 39(2): p. 127-155.