THE LONDON - Knight Frankcontent.knightfrank.com/research/982/documents/en/2016...KNIGHT FRANK: THE...
13
LONDON REPORT THE
Transcript of THE LONDON - Knight Frankcontent.knightfrank.com/research/982/documents/en/2016...KNIGHT FRANK: THE...

LONDONREPORT
THE

5K N I G H T F R A N K : T H E L O N D O N R E P O R T
CONTENTS
4-5 LIVING UP TO A NEW ERA London is transforming, and the real estate market must keep pace with the changes.
6-7 NEW LONDON Changes in occupier demand have taken office rents to new heights.
8-9 RIDING THE GLOBAL TRENDS Three new trends are shaping London’s dynamic economy.
10-11 BRIDGING THE GAP A series of ‘Bridging Points’ are linking up the established and new districts.
12-13 THE FUTURE OFFICE The five key elements of the Activity-Based Working office.
14-15 BUILDING ON LONDON’S SUCCESS To match its growth potential, London needs a new wave of development.
16-17 THE RISKS OF COUNTING CRANES Why counting cranes on the skyline to judge the volume of development activity is a mistake.
18-19 NEW CORE DISTRICTS Six new CBDs being developed in London.
20-21 PRIME LONDON: RESIDENTIAL PERFORMANCE Which London housing markets have seen the highest price and rental growth?
22-23 RESIDENTIAL DEVELOPMENT OPPORTUNITY AREAS Where will homes be built to accommodate London’s new workers?
24 CONTACTS AND CAVEATS See important notice on the back page.
10-11Bridging the Gap - Where the new and the established come together in London
Riding the Global Trends - London’s economy in 2016
18-19
8-9
New Core Districts - The new wave of CBDs
230MILLION SQ FTTHE OFFICE STOCK IN
CENTRAL LONDON – NEARLY THREE TIMES THE SIZE OF SINGAPORE
K N I G H T F R A N K : T H E L O N D O N R E P O R T6 7K N I G H T F R A N K : T H E L O N D O N R E P O R T
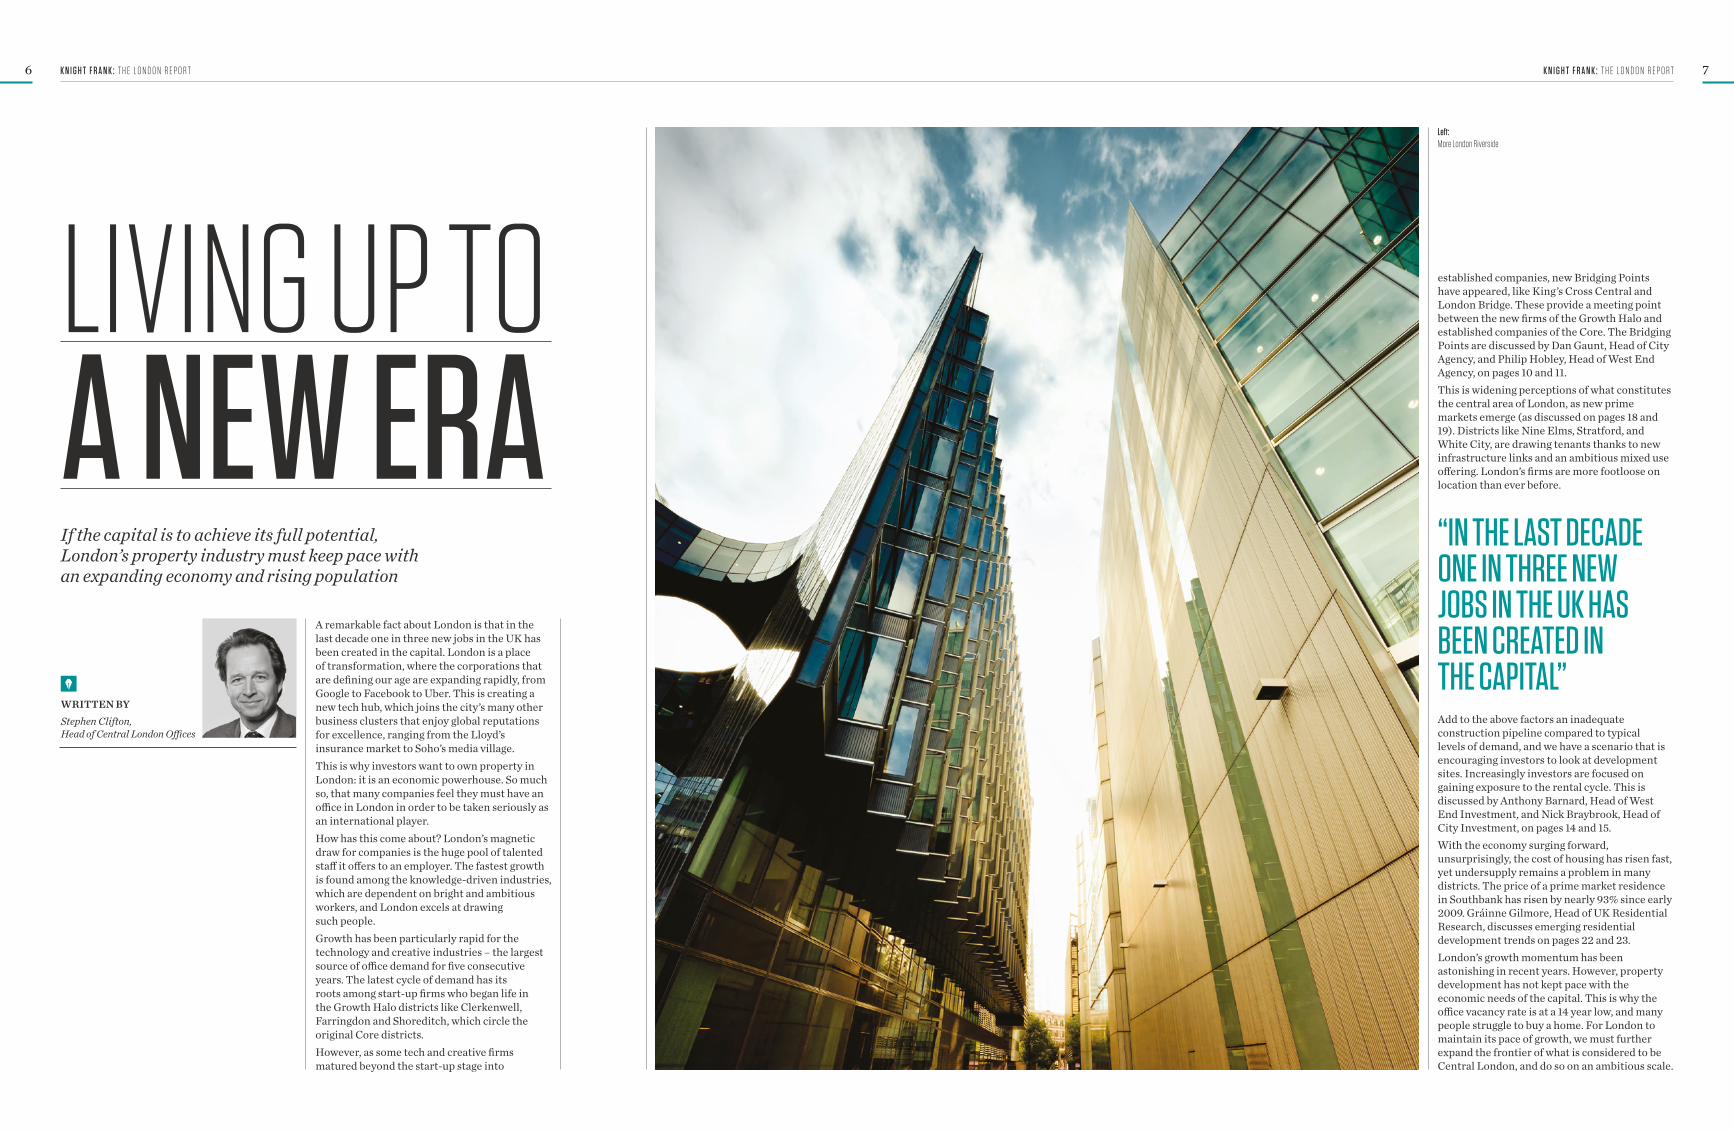
LIVING UP TOA NEW ERAIf the capital is to achieve its full potential, London’s property industry must keep pace with an expanding economy and rising population
A remarkable fact about London is that in the last decade one in three new jobs in the UK has been created in the capital. London is a place of transformation, where the corporations that are defining our age are expanding rapidly, from Google to Facebook to Uber. This is creating a new tech hub, which joins the city’s many other business clusters that enjoy global reputations for excellence, ranging from the Lloyd’s insurance market to Soho’s media village. This is why investors want to own property in London: it is an economic powerhouse. So much so, that many companies feel they must have an office in London in order to be taken seriously as an international player. How has this come about? London’s magnetic draw for companies is the huge pool of talented staff it offers to an employer. The fastest growth is found among the knowledge-driven industries, which are dependent on bright and ambitious workers, and London excels at drawing such people. Growth has been particularly rapid for the technology and creative industries – the largest source of office demand for five consecutive years. The latest cycle of demand has its roots among start-up firms who began life in the Growth Halo districts like Clerkenwell, Farringdon and Shoreditch, which circle the original Core districts. However, as some tech and creative firms matured beyond the start-up stage into
Left: More London Riverside
established companies, new Bridging Points have appeared, like King’s Cross Central and London Bridge. These provide a meeting point between the new firms of the Growth Halo and established companies of the Core. The Bridging Points are discussed by Dan Gaunt, Head of City Agency, and Philip Hobley, Head of West End Agency, on pages 10 and 11. This is widening perceptions of what constitutes the central area of London, as new prime markets emerge (as discussed on pages 18 and 19). Districts like Nine Elms, Stratford, and White City, are drawing tenants thanks to new infrastructure links and an ambitious mixed use offering. London’s firms are more footloose on location than ever before.
Add to the above factors an inadequate construction pipeline compared to typical levels of demand, and we have a scenario that is encouraging investors to look at development sites. Increasingly investors are focused on gaining exposure to the rental cycle. This is discussed by Anthony Barnard, Head of West End Investment, and Nick Braybrook, Head of City Investment, on pages 14 and 15. With the economy surging forward, unsurprisingly, the cost of housing has risen fast, yet undersupply remains a problem in many districts. The price of a prime market residence in Southbank has risen by nearly 93% since early 2009. Gráinne Gilmore, Head of UK Residential Research, discusses emerging residential development trends on pages 22 and 23. London’s growth momentum has been astonishing in recent years. However, property development has not kept pace with the economic needs of the capital. This is why the office vacancy rate is at a 14 year low, and many people struggle to buy a home. For London to maintain its pace of growth, we must further expand the frontier of what is considered to be Central London, and do so on an ambitious scale.
Stephen Clifton, Head of Central London Offices
WRITTEN BY
“IN THE LAST DECADE ONE IN THREE NEW JOBS IN THE UK HAS BEEN CREATED IN THE CAPITAL”

K N I G H T F R A N K : T H E L O N D O N R E P O R T8 9K N I G H T F R A N K : T H E L O N D O N R E P O R T
The third quarter of 2007 was the time that the Global Financial Crisis (GFC) reached London, as confidence in the banking sector slumped. However, eight-and-a-half years later, the office market is thriving. London’s economy is being driven by a new wave of technology and creative firms who are shaping the digital age. The last year has also seen more traditional financial and professional occupiers initiating office searches, which demonstrates broadening demand. Comparing rents today with Q3 2007, the strongest growth has occurred in the areas popular with the technology and creative industries. Noho is a former garments industry district that is now home to many leading creative firms. Prime rents are 48% higher today compared to Q3 2007. Shoreditch, another former industrial area, is a hub for start-up technology firms. Office rents there are 37% above their pre-GFC peak. Infrastructure projects abound in London. The development potential of the Nine Elms corridor is being unlocked thanks to a planned new underground rail line to the Battersea Power Station site. With the Crossrail 1 and Thameslink upgrade railway projects under construction, we are seeing the development of a transport hub running from Tottenham Court Road to Farringdon to King’s Cross. This hub would be boosted further if the proposed Crossrail 2 receives government approval.
HEATHROW AIRPORT
Heathrow is a major business centre as well as a transport hub. There is more office stock in the surrounding area than there is in the CBD of Birmingham, the U.K.’s second largest city.
TRANSPORT HUBS
Crossrail 1 intersects with the Thameslink rail upgrade at Farringdon, creating a new travel hub. Crossrail 2 would meet Crossrail 1 at Tottenham Court Road, then Thameslink at St Pancras, producing two more interchange hot spots.
BATTERSEA & NINE ELMS
Plans for a new U.S. Embassy, extensive mixed-use schemes, a new underground rail line, and redevelopment of the iconic Battersea Power Station site, will transform this former industrial area.
DEVELOPMENT
Since 2000, central London has seen more than 70 million sq ft of new offices built. This is more than the total office stock of Singapore. Yet London’s vacancy rate is falling and at a 14 year low.
CROSSRAIL 1
London’s under construction east-west rail line opens in 2018. We expect a boost for office rents near Crossrail stations in the 2017 to 2019 period, i.e. just before and after services commence.
London is being transformed by a new wave of creative firms and rail links
WRITTEN BYPatrick Scanlon, Central London Research
LONDON
7.0%Mayfair / St James’s
Office rental growthQ3 07 to Q4 15
Source: Knight Frank Research
Marylebone
5.6%Office rental growth
Q3 07 to Q4 15
15.8%Aldgate
Office rental growthQ3 07 to Q4 15
12.5%Holborn
Office rental growthQ3 07 to Q4 15
22.2%Soho
Office rental growthQ3 07 to Q4 15
30.2%Southbank
Office rental growthQ3 07 to Q4 15
10.2%City Core
Office rental growthQ3 07 to Q4 15
Shoreditch
Office rental growthQ3 07 to Q4 15
36.8%Noho
Office rental growth Q3 07 to Q4 15
47.8%Euston
Office rental growthQ3 07 to Q4 15
34.8%NEW
K N I G H T F R A N K : T H E L O N D O N R E P O R T8 9K N I G H T F R A N K : T H E L O N D O N R E P O R T

K N I G H T F R A N K : T H E L O N D O N R E P O R T1 0 1 1K N I G H T F R A N K : T H E L O N D O N R E P O R T
WRITTEN BYJames Roberts,Chief Economist
London’s economy is 18% bigger than it was five years ago, compared to 10% growth in the preceding five years. This is impressive given that the city’s expansion has occurred when growth has proved so elusive elsewhere in the world, particularly in emerging markets. London has shone because it is on the right side of three unfolding trends in the global economy, which will continue to power it forward. These are:
Above: Oxford Circus 02. THE FLIGHT OF CAPITAL FROM EAST TO WEST
The slowdown for emerging markets has displaced capital out of the East in search of safety in the West. That the US is moving ahead with monetary tightening has encouraged this, and QE in the Eurozone has added European money to the Westward migration. Already US funds are looking to exploit the strong dollar, and historically London has served as a base camp for American capital within the EMEA time zones.
There are parallels with 1997-1998, when capital fled emerging markets, arrived in the West looking for opportunities, and focused on the internet sector. We are seeing the same occurring now with the digital revolution as the focal point. London will benefit twofold: as a funnel for US capital and as a hub for the digital economy.
03. ENTRENCHED LOW INFLATION
The slump for commodities has slashed bills for consumers, freeing money to spend elsewhere, and the digital economy is benefiting via app sales and e-commerce. As Asian manufacturers struggle to maintain revenue streams, Western retailers have the whip hand in negotiations, keeping shop prices low. Consequently, it is unlikely UK interest rates will rise soon. This leaves London locked into a low inflation / low yield world; even though its economy is growing apace.
WORLDWIDE DEMAND FOR LONDON OFFICES
These trends are on-going, and suggest that property investors should target development sites and asset management opportunities. Firms from all over the world are eager to access London’s highly educated workforce, to build the value-add industries of the digital economy. Wherever the development pipeline fails to cope with the appearance of new economic hubs, rental growth will occur. In a rapidly changing city, such mismatches of supply and demand will be all too common.
The three key trends shaping the global economy are fuelling London’s growth prospects
01. THE GROWTH FOCUS IS MOVING FROM COMMODITIES AND MANUFACTURING TO TALENT CENTRES
At the time of writing, the price of oil is down 70% on 18 months ago, while many commentators openly question whether China, with its giant manufacturing centres, is achieving the levels of GDP growth that the official statistics claim. Emerging markets driven by manufacturing and commodities are out of fashion with investors. In contrast, western talent centres like San Francisco, Berlin, New York and London, are seeing growth from the new wave of technology and creative companies who are trailblazing the digital age. In the tech world, manufacturing smart phones and tablets is an area of falling margins, but the human talent-driven activities of coding and product development are booming. London is on the human value-add side of this equation, with its talent-rich workforce.
“THERE ARE PARALLELS WITH 1997-1998, WHEN CAPITAL FLED EMERGING MARKETS, AND FOCUSED ON THE INTERNET SECTOR”RIDING
THE GLOBAL TRENDS
K N I G H T F R A N K : T H E L O N D O N R E P O R T1 2 1 3K N I G H T F R A N K : T H E L O N D O N R E P O R T
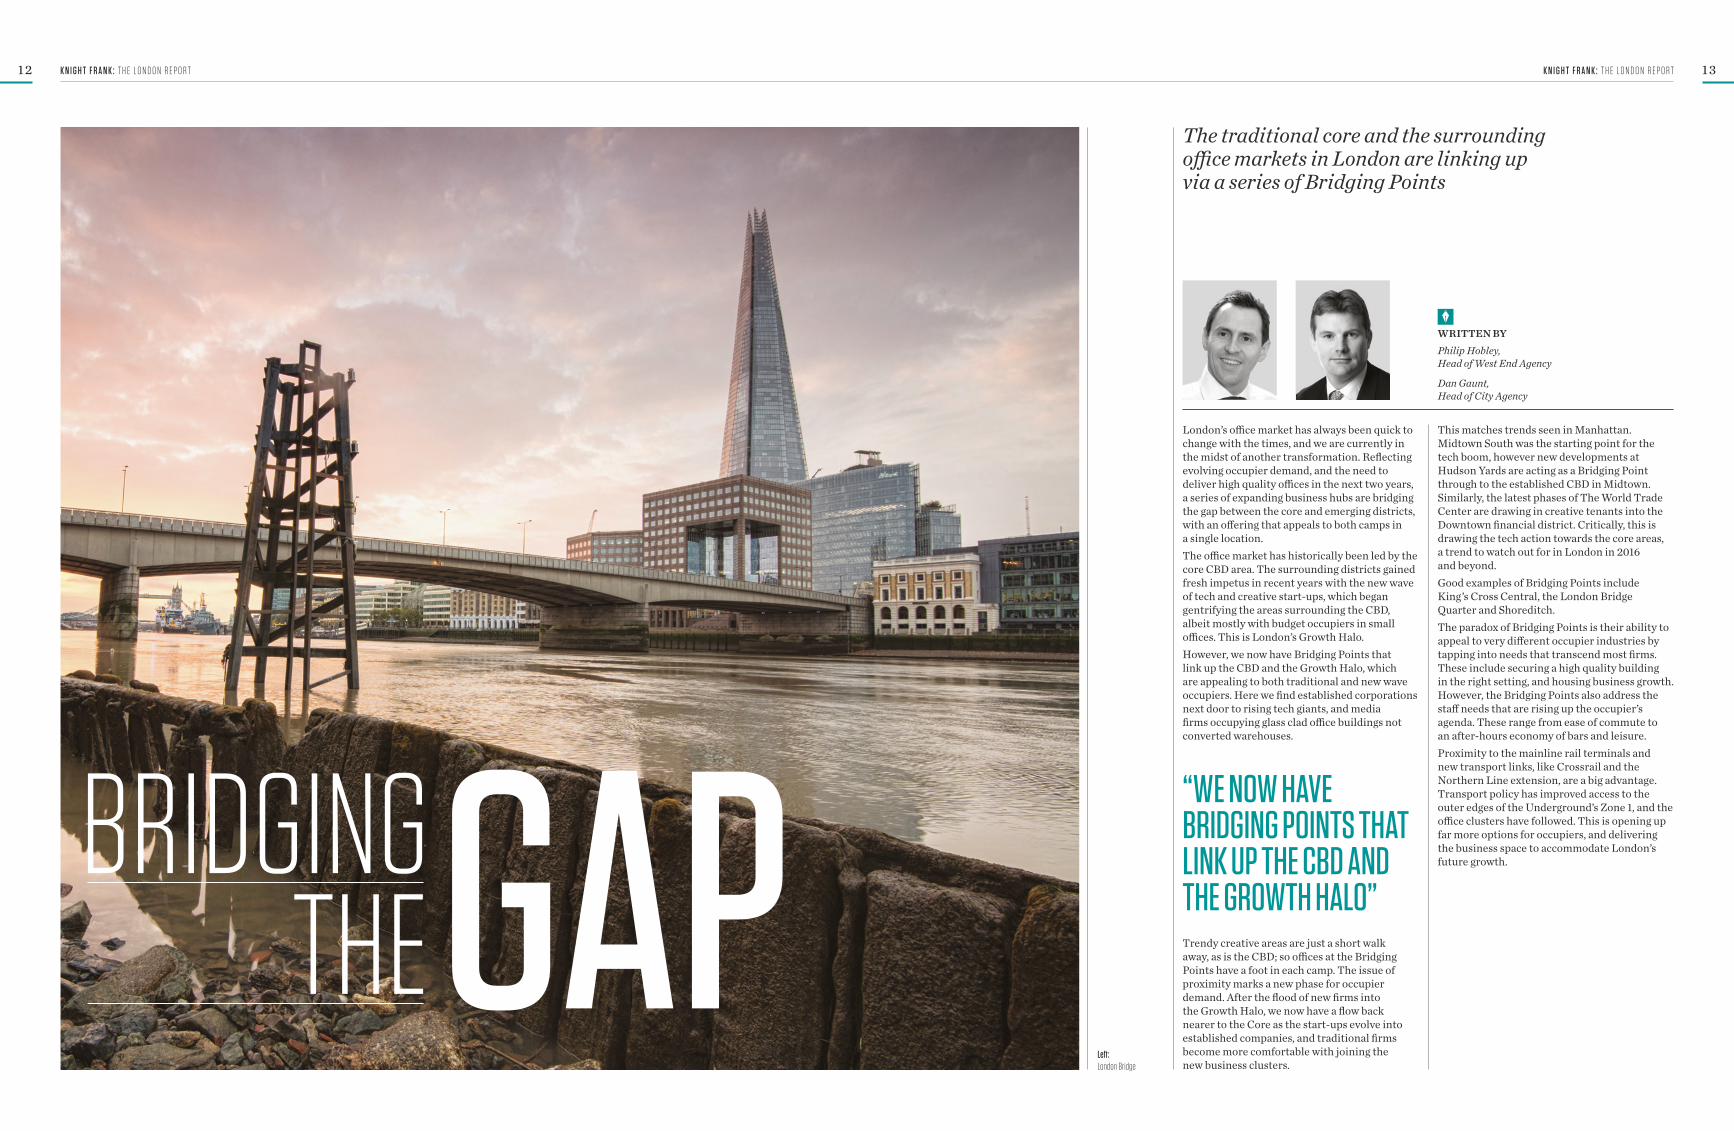
London’s office market has always been quick to change with the times, and we are currently in the midst of another transformation. Reflecting evolving occupier demand, and the need to deliver high quality offices in the next two years, a series of expanding business hubs are bridging the gap between the core and emerging districts, with an offering that appeals to both camps in a single location. The office market has historically been led by the core CBD area. The surrounding districts gained fresh impetus in recent years with the new wave of tech and creative start-ups, which began gentrifying the areas surrounding the CBD, albeit mostly with budget occupiers in small offices. This is London’s Growth Halo. However, we now have Bridging Points that link up the CBD and the Growth Halo, which are appealing to both traditional and new wave occupiers. Here we find established corporations next door to rising tech giants, and media firms occupying glass clad office buildings not converted warehouses.
Trendy creative areas are just a short walk away, as is the CBD; so offices at the Bridging Points have a foot in each camp. The issue of proximity marks a new phase for occupier demand. After the flood of new firms into the Growth Halo, we now have a flow back nearer to the Core as the start-ups evolve into established companies, and traditional firms become more comfortable with joining the new business clusters.
This matches trends seen in Manhattan. Midtown South was the starting point for the tech boom, however new developments at Hudson Yards are acting as a Bridging Point through to the established CBD in Midtown. Similarly, the latest phases of The World Trade Center are drawing in creative tenants into the Downtown financial district. Critically, this is drawing the tech action towards the core areas, a trend to watch out for in London in 2016 and beyond. Good examples of Bridging Points include King’s Cross Central, the London Bridge Quarter and Shoreditch. The paradox of Bridging Points is their ability to appeal to very different occupier industries by tapping into needs that transcend most firms. These include securing a high quality building in the right setting, and housing business growth. However, the Bridging Points also address the staff needs that are rising up the occupier’s agenda. These range from ease of commute to an after-hours economy of bars and leisure. Proximity to the mainline rail terminals and new transport links, like Crossrail and the Northern Line extension, are a big advantage. Transport policy has improved access to the outer edges of the Underground’s Zone 1, and the office clusters have followed. This is opening up far more options for occupiers, and delivering the business space to accommodate London’s future growth.
Left: London Bridge
The traditional core and the surrounding office markets in London are linking up via a series of Bridging Points
GAP
Dan Gaunt, Head of City Agency
Philip Hobley, Head of West End Agency
WRITTEN BY
“WE NOW HAVE BRIDGING POINTS THAT LINK UP THE CBD AND THE GROWTH HALO”
BRIDGINGTHE

K N I G H T F R A N K : T H E L O N D O N R E P O R T14 1 5K N I G H T F R A N K : T H E L O N D O N R E P O R T
THEFUTUREOFFICE Firms from a range of industries are giving their staff an inspiring place to work by introducing activity-based working
As firms relocate to new offices in London, it is increasingly common to introduce Activity-Based Working (ABW) areas. Rather than the office consisting of rows of desks, a range of work zones suited to the task at hand are provided. Staff move fluidly between the different zones, creating efficiency savings for the firm. ABW offices improve staff interaction, which increases knowledge sharing and boosts morale. The office is also turned into a home-away-from-home, which improves quality of life. Here are the five key elements of the ABW office.
WRITTEN BYRichard Proctor, Head of Central London Tenant Representation
ABW offices aim to get natural sunlight to as many people as possible, via atriums and minimising the use of partitions. Internal staircases and the absence of blocking lines of desks encourage people to go speak to colleagues in person rather than sending emails (a common source of miscommunication).
LIGHT AND CIRCULATION
01Often resembling a branch of Starbucks rather than a traditional office, this area reflects the need to dip in and out of interaction with others and screen time. This fit-out increases the likelihood of chance encounters and conversations overheard, promoting knowledge sharing.
INTERACTION AREAS
02
In an office with no fixed desks, a problem can be finding the rest of your team. ABW offices often use decoration or different styles of fit-out to create identifiable locations. A working day may in the future begin with a text from a colleague that says, “We’re all in ‘the garden’, come join us”.
HUDDLE ZONES
03
These range from one-person booths for those with a report to write, to clusters of desks behind glass partitions for a group project with a tight deadline. Also, short-stay mini-pods are dotted around the floor, so people can take that confidential mobile phone call.
QUIET SPACES
04
Free buffets, 1980s-style arcade games, yoga areas, and table football. As the boundary between work and home blurs, firms want their staff to think of work as home and thus provide an office people want to spend more time in. Locker rooms also allow staff to jog or cycle to work, or change before going out in the evening.
HOME-IN-THE-OFFICE
05

K N I G H T F R A N K : T H E L O N D O N R E P O R T1 6 1 7K N I G H T F R A N K : T H E L O N D O N R E P O R T
In 2016, the development site market will be a target for investors
Across Central London, rental growth is now in evidence in every sub-market, and with occupier demand embedded in a cyclical upswing, this is clearly set to continue. As a consequence, 2016 will see development sites a focus for investors. Presently there is 7.1 m sq ft of speculative development under construction, in a city that typically sees 12.9 m sq ft of space let per annum. With on-market supply at a 14-year low, the leasing market is tight, and set to stay that way for years to come. The Central London office market has a stock of over 230 m sq ft. Based on the rule-of-thumb that a building typically has a 25 year lifetime, around 9.0 m sq ft of new or refurbished stock should be delivered each year. In reality the development pipeline has on average delivered half that amount in the last twenty years, so how has the market coped? In part, refurbishments have made up the shortfall, and in part, firms (particularly SMEs) have unhappily made do in sub-standard buildings. However, both options are steadily running into problems due to the march of time. The ‘forest-of-columns’ buildings are becoming steadily less practical for modern use, and the
benchmark level has steadily risen on technical specifications, which again counts against older stock. Also, new districts have emerged that are the focus of London’s rising digital and creative economy. A few years ago, such firms principally wanted cheap offices, so low cost / low quality offices in places like Shoreditch and Clerkenwell were ideal. However, as these firms have expanded and matured, so have their property requirements, and suddenly the new districts have an urgent need for modern office space. Critically, as the new districts have matured, the willingness to pay higher rents has kept pace. Rents in Shoreditch are catching up with the City Core. In the West End, Fitzrovia has proved that districts that were once new frontiers can transform into front office locations. The success of King’s Cross has shown this transformation can be achieved in years not decades. Consequently, places like Whitechapel, Battersea and Nine Elms, Stratford, and White City look well positioned to become future core locations, thanks to new infrastructure projects. This presents fresh opportunities for investors in Central London, where the development route offers exposure to the double-digit rental growth Knight Frank is predicting in most sub-markets over the next five years.
BUILDINGON LONDON’S SUCCESS
Nick Braybrook, Head of City Capital Markets
Anthony Barnard, Head of West End Capital Markets
WRITTEN BY
Right: Stratford
“PLACES LIKE WHITECHAPEL, BATTERSEA AND NINE ELMS, STRATFORD, AND WHITE CITY LOOK WELL POSITIONED TO BECOME FUTURE CORE LOCATIONS”
K N I G H T F R A N K : T H E L O N D O N R E P O R T1 8 1 9K N I G H T F R A N K : T H E L O N D O N R E P O R T
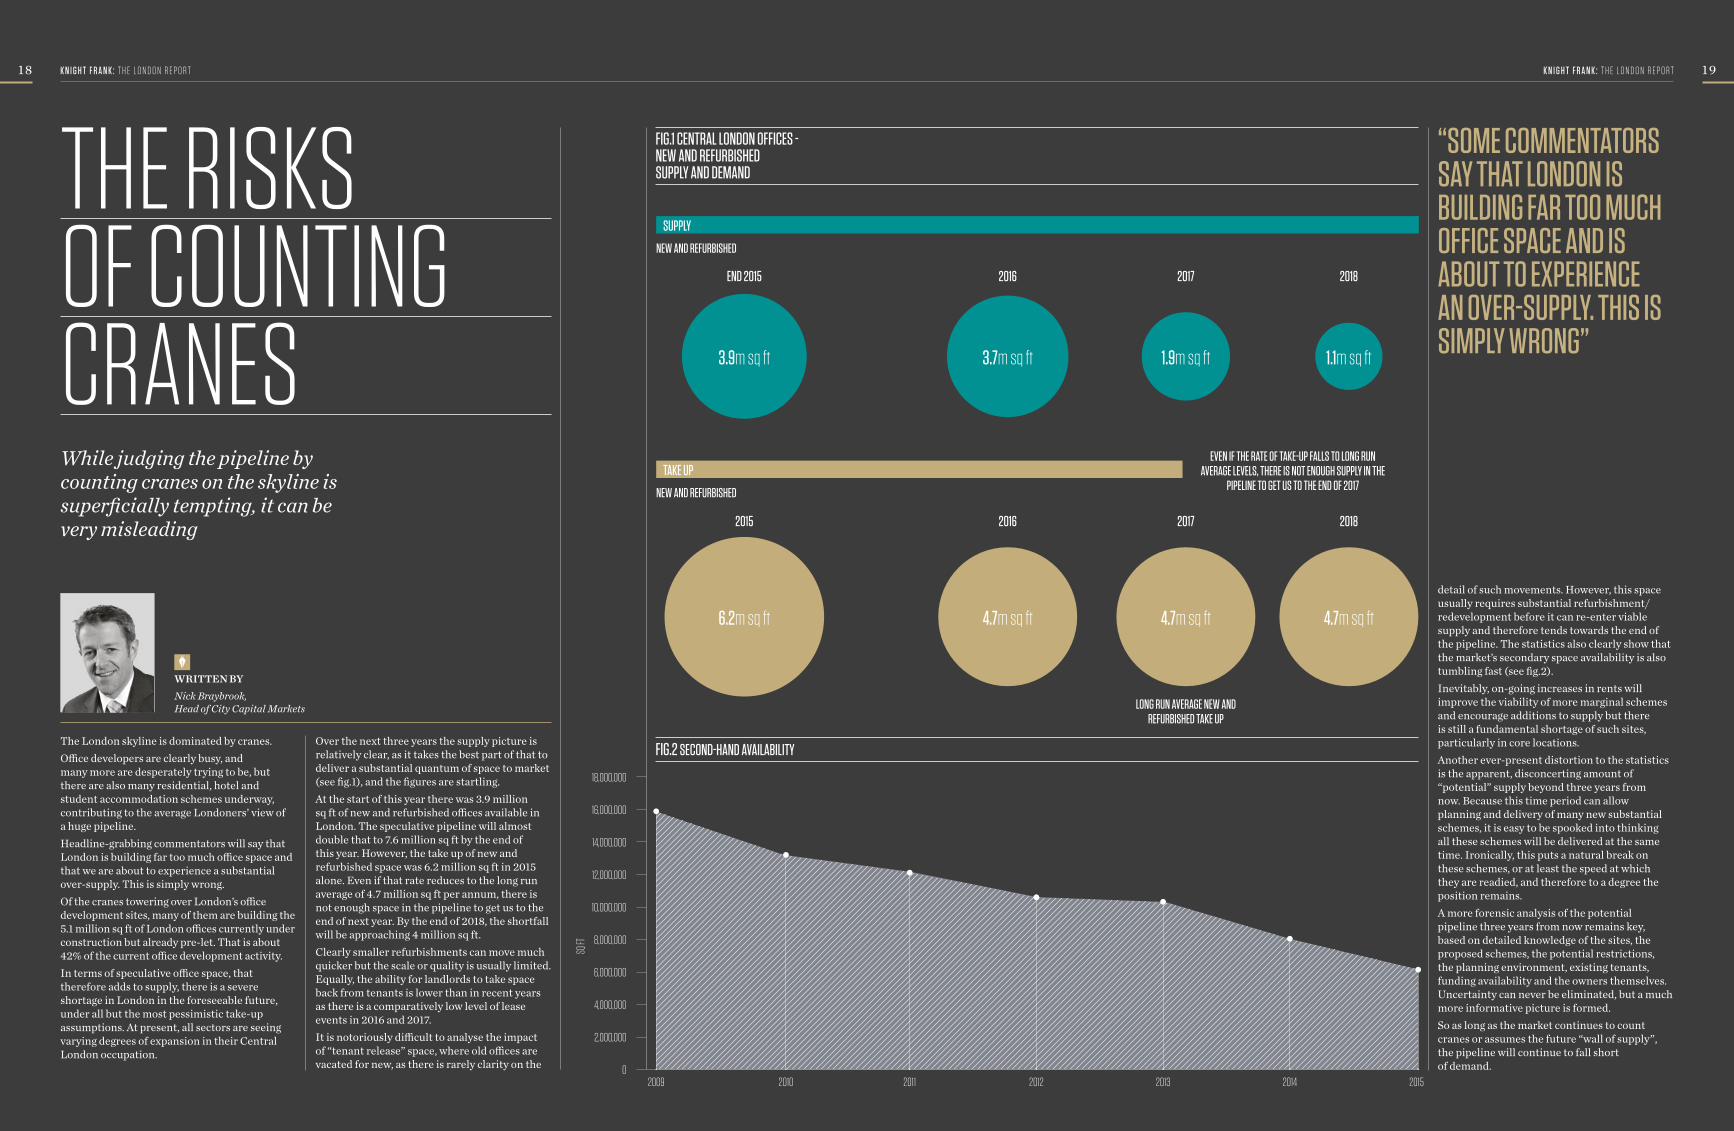
THE RISKSOF COUNTINGCRANESWhile judging the pipeline by counting cranes on the skyline is superficially tempting, it can be very misleading
Nick Braybrook, Head of City Capital Markets
WRITTEN BY
The London skyline is dominated by cranes.Office developers are clearly busy, and many more are desperately trying to be, but there are also many residential, hotel and student accommodation schemes underway, contributing to the average Londoners’ view of a huge pipeline. Headline-grabbing commentators will say that London is building far too much office space and that we are about to experience a substantial over-supply. This is simply wrong.Of the cranes towering over London’s office development sites, many of them are building the 5.1 million sq ft of London offices currently under construction but already pre-let. That is about 42% of the current office development activity.In terms of speculative office space, that therefore adds to supply, there is a severe shortage in London in the foreseeable future, under all but the most pessimistic take-up assumptions. At present, all sectors are seeing varying degrees of expansion in their Central London occupation.
Over the next three years the supply picture is relatively clear, as it takes the best part of that to deliver a substantial quantum of space to market (see fig.1), and the figures are startling. At the start of this year there was 3.9 million sq ft of new and refurbished offices available in London. The speculative pipeline will almost double that to 7.6 million sq ft by the end of this year. However, the take up of new and refurbished space was 6.2 million sq ft in 2015 alone. Even if that rate reduces to the long run average of 4.7 million sq ft per annum, there is not enough space in the pipeline to get us to the end of next year. By the end of 2018, the shortfall will be approaching 4 million sq ft.Clearly smaller refurbishments can move much quicker but the scale or quality is usually limited. Equally, the ability for landlords to take space back from tenants is lower than in recent years as there is a comparatively low level of lease events in 2016 and 2017.It is notoriously difficult to analyse the impact of “tenant release” space, where old offices are vacated for new, as there is rarely clarity on the
detail of such movements. However, this space usually requires substantial refurbishment/redevelopment before it can re-enter viable supply and therefore tends towards the end of the pipeline. The statistics also clearly show that the market’s secondary space availability is also tumbling fast (see fig.2).Inevitably, on-going increases in rents will improve the viability of more marginal schemes and encourage additions to supply but there is still a fundamental shortage of such sites, particularly in core locations. Another ever-present distortion to the statistics is the apparent, disconcerting amount of “potential” supply beyond three years from now. Because this time period can allow planning and delivery of many new substantial schemes, it is easy to be spooked into thinking all these schemes will be delivered at the same time. Ironically, this puts a natural break on these schemes, or at least the speed at which they are readied, and therefore to a degree the position remains.A more forensic analysis of the potential pipeline three years from now remains key, based on detailed knowledge of the sites, the proposed schemes, the potential restrictions, the planning environment, existing tenants, funding availability and the owners themselves. Uncertainty can never be eliminated, but a much more informative picture is formed.So as long as the market continues to count cranes or assumes the future “wall of supply”, the pipeline will continue to fall short of demand.
FIG.1 CENTRAL LONDON OFFICES - NEW AND REFURBISHED SUPPLY AND DEMAND
FIG.2 SECOND-HAND AVAILABILITY
18,000,000
16,000,000
14,000,000
12,000,000
10,000,000
8,000,000
6,000,000
4,000,000
2,000,000
0
LONG RUN AVERAGE NEW AND REFURBISHED TAKE UP
SUPPLY
TAKE UP
2016END 2015
20162015
2017
2017
2018
2018
NEW AND REFURBISHED
NEW AND REFURBISHED
6.2m sq ft 4.7m sq ft 4.7m sq ft 4.7m sq ft
2009
SQ FT
2010 2011 2012 2013 2014 2015
EVEN IF THE RATE OF TAKE-UP FALLS TO LONG RUN AVERAGE LEVELS, THERE IS NOT ENOUGH SUPPLY IN THE
PIPELINE TO GET US TO THE END OF 2017
“SOME COMMENTATORS SAY THAT LONDON IS BUILDING FAR TOO MUCH OFFICE SPACE AND IS ABOUT TO EXPERIENCE AN OVER-SUPPLY. THIS IS SIMPLY WRONG”
3.9m sq ft 3.7m sq ft 1.9m sq ft 1.1m sq ft

K N I G H T F R A N K : T H E L O N D O N R E P O R T2 0 2 1K N I G H T F R A N K : T H E L O N D O N R E P O R T
NEW COREDISTRICTSWith London forecast to become a city of ten million citizens, new mixed-use districts are being developed which extend the boundaries of the central zone
CANARY WHARF – THE NEW PHASE
The site formerly known as Wood Wharf, represents one of Central London’s largest privately owned development sites at 22-acres and will broaden and extend the Canary Wharf Estate. The masterplan includes 3,277 new homes, 1.9m sq ft of office space, and a further 275,000 sq ft of retail and restaurant space. The development will be delivered in phases, with the first to follow the arrival of Crossrail in 2018, and the entire project potentially complete by 2023.
WATERLOO
London’s South Bank is one of the Capital’s best connected areas, with access to four tube lines on the underground and the use of Waterloo train station, the UK’s busiest railway station. Although the area has a great cultural offer, it has lacked high quality residential and commercial space. However, construction is currently underway for Braeburn Estates’ Southbank Place, a 1.5m sq ft mixed-use development which includes the existing Shell Tower and Almacantar’s two new office buildings, One and Two Southbank Place. One and Two Southbank Place will offer 572,000 sq ft of office and retail space. The scheme is expected to complete in 2018. Also in the area is Elizabeth House, where a 750,000 sq ft office and 250,000 sq ft residential scheme by London & Regional and Chelsfield is planned.
STRATFORD
Stratford has become a key London business district with considerable retail and leisure provisions. The area has excellent connectivity, with five railway stations in close proximity. A number of major occupiers have committed to the location, including TfL, FCA, BT Sport, Infinity and the V&A Museum. There is currently limited supply, although space will be released once work is complete at The International Quarter, where TfL and FCA have pre-let a combined 800,000 sq ft. Additionally, Delancey will be releasing 1.1m sq ft at Here East.
WHITE CITY
The ambitious regeneration of White City includes Imperial College London, Westfield London, Berkeley St James, Television Centre and Stanhope, AIMCo, and Mitsui Fudosan’s White City Place. Together, they are implementing a shared vision across 112-acres, including over 2m sq ft of offices, up to 5,000 homes, new public squares and parks, enhancing the shopping offer and a new £3bn hub for academia. The area already boasts excellent transport connections and extensive shopping with Westfield attracting 27.5m visitors a year.
NINE ELMS - BATTERSEA POWER STATION
Nine Elms is one of London’s largest regeneration zones, comprising 227-hectares of former-industrial land in zone one. The area is currently being transformed into over 20 new schemes and will provide 20,000 homes and over 6.5m sq ft of commercial space. This includes redevelopment of the iconic Battersea Power Station and the 42-acre site surrounding, creating 4,000 new homes and 1.25m sq ft of new offices. The area, which already includes the new US Embassy and two of the tallest residential towers in Western Europe, One Nine Elms, will also feature the new Northern Line extension with two new Zone 1 underground stations at Nine Elms and Battersea Power Station completing in 2020.
Left: Two Southbank Place, Waterloo Image Credit: Almacantar
Above: Nine Elms - Battersea Power Station Image Credit: The Nine Elms Vauxhall Partnership
Above: Wood Wharf and Canary Wharf Image Credit: Canary Wharf Group
Victoria Shreeves, Central London Research
WRITTEN BY
CANADA WATER
British Land is working with Southwark Council to bring forward a mixed-use development for Canada Water. The 46-acre site, which is just one tube stop from Canary Wharf, includes redevelopment of the SE16 Printworks site, the Surrey Quays Shopping Centre site and more recently the Surrey Quays Leisure Park site. The masterplan is primarily centred on creating a new town centre for the area, and includes a mix of offices, homes, retail and public spaces. In addition, Notting Hill Housing Group and Sellar are developing the Decathlon site at Canada Water to provide a high-quality mixed use development which will be a key part in the area’s regeneration.

K N I G H T F R A N K : T H E L O N D O N R E P O R T2 2 2 3K N I G H T F R A N K : T H E L O N D O N R E P O R T
Which London housing markets have seen the highest price and rental growth?
WRITTEN BYTom Bill, Head of London Residential Research
The prime London markets have seen considerable price growth since the low point following the global financial crisis in March 2009. In this graphic we show the performance of prices and rents in each key market in the year ending December 2015. The data comes from Knight Frank’s proprietary prime indices which cover rents and prices in key markets across London. The data is based on a monthly repeat valuation index for a fixed basket of properties for each area. Each basket was constructed to be as representative as possible of the individual market in relation to pricing and property type. Repeat valuation-based indexes allow a like-for-like comparison over time and are not distorted by changes in the mix of housing transacted in different periods.The Knight Frank Prime Central London Index (established 1976), and the Knight Frank Prime Rental Index (established 1995) are the longest running and most comprehensive indices covering London’s prime residential markets.
PRIME LONDON RESIDENTIAL PERFORMANCE
01. BARNESSALES
02. BATTERSEA
07. CHISWICK
05. CANARY WHARF
03. BELGRAVIASALES RENTAL
SALES RENTAL SALES RENTAL
SALES RENTAL
SALES RENTAL
SALES RENTAL
SALES RENTAL
SALES RENTAL
SALES RENTAL SALES RENTAL SALES RENTAL
SALES RENTAL
SALES RENTAL
SALES RENTAL
SALES RENTAL
SALES RENTAL
SALES RENTAL
SALES RENTAL SALES RENTAL SALES RENTAL
SALES
SALES RENTAL
SALES RENTAL
SALES RENTALSALES RENTAL
06. CHELSEA
*ALL FIGURES ARE 12 MONTH CHANGE. DECEMBER 2015
08. CITY & FRINGE
04. BELSIZE PARKSALES
PRIME CENTRAL LONDON PRIME OUTER LONDON
4.1% -1.1% -0.2% -0.2% 1.8%
0.3% 10.9% -2.2% -3.5%-2.7%
2% 2.3% 2.3%
28. WAPPING
4.6% 2.3%
27. WANDSWORTH
2.8%
26. TOWER BRIDGERENTAL
1.3%
1.3%
25. ST JOHN’S WOOD
-0.3%
24. SOUTH KENSINGTON
-3.7% -3.0%
22. RICHMONDSALES
4.7%
23. RIVERSIDE
20. NOTTING HILL
-1.8% 1.5%
19. MAYFAIR
3.0% 1.6%
18. MARYLEBONE
4.7% 1.2%
17. KNIGHTSBRIDGE
-2.3%-6.1%
14. ISLINGTON
-0.3%6.4%
15. KENSINGTON
2.5% 0.5%
16. KINGS CROSSRENTAL
3.1%
13. HYDE PARK11. FULHAM
0.8% -1.8% -1.8%
10. DULWICHSALES
09. CLAPHAM
2.2% 4.6%
12. HAMPSTEAD
2.8% 3.0%
21. QUEENS PARK
-0.8%7.5%
29. WIMBLEDON
1.3% 1.4%
1.0% 3.1%0.7% 0.6%
4.0% 4.0%
0.0%4.0%
5.7%

K N I G H T F R A N K : T H E L O N D O N R E P O R T24
WRITTEN BYGráinne Gilmore, Head of UK Residential Research
This map illustrates key residential development hotspots across London, and was originally published in our report “London Hotspots, Residential Development Opportunity Areas 2015”. After several years of strong performance, price growth is showing clear signs of easing in Central London. This fits with the cyclical nature of the market, as well as specific factors currently at play. However the disequilibrium between new housing supply and demand across the Capital shows little sign of being addressed in the short to medium term, and this, coupled with London’s standing as a leading global city, should continue to underpin the market.In 2015 we widened our scope for development hotspots beyond prime central London, which was the focus of our earlier 2011 report. This not only reflects the “ripple” effect of price growth and activity from central London, which we expect to continue in the short-term, but also highlights some of the large-scale placemaking which is already underway or which is planned. This expansion will be reflected in capital values, but these areas are included as values are likely to outperform the wider market in the medium-term – one of the measures for our ‘hotspots’ which were identified by our analysis, alongside the views of our residential development consultancy teams.
“AFTER SEVERAL YEARS OF STRONG PERFORMANCE, PRICE GROWTH IS SHOWING CLEAR SIGNS OF EASING IN CENTRAL LONDON”
Hammersmith and Fulham
Ealing
Richmond upon Thames
LONDON RESIDENTIALDEVELOPMENTOPPORTUNITY AREASLondon’s population is growing, but where will the homes be built to accommodate the new workers?
2 3K N I G H T F R A N K : T H E L O N D O N R E P O R T
HOTSPOTS
1 Acton2 Old Oak Common3 Earls Court4 Bayswater5 Nine Elms6 Victoria7 Mayfair8 Euston9 King’s Cross10 City Fringe11 Dalston & Hackney 12 Olympic Park & Stratford13 Tottenham Hale14 Canary Wharf Estate15 Greenwich16 Royal Docks17 Woolwich
By the end of 2018, Crossrail will be open, dramatically cutting travel times across the capital, and making some of our new hotspots even more attractive. We have examined the effect of Crossrail on property movements in detail in our 2015 Crossrail Report. The landscape for developers has evolved in recent years, not least because of a notable rise in development land values in prime central London as well as sharp increase in material and labour costs. At the same time, the Mayor of London has made more firm commitments to step up housing supply in the Capital, potentially cutting red tape and freeing up more government and brownfield land.
We do not underestimate the risks to the property market posed by affordability issues as well as wider economic and political challenges - we examine these and related issues regularly in our Forecasts and Risk Monitor reports. However within these wider market trends, we expect areas which are set to benefit from regeneration, placemaking and new transport infrastructure, as well as improving retail and public realm - such as those identified in the map - have the potential to outperform wider residential markets.
Hotspots are listed in order from West London to East London. Hotspots not ranked in order of forecast growth.
Wandsworth
Haringey
City of London
Greenwich
Newham

This report is published for general information only and not to be relied upon in any way. Although high standards have been used in the preparation of the information, analysis, views and projections presented in this report, no responsibility or liability whatsoever can be accepted by Knight Frank LLP for any loss or damage resultant from any use of, reliance on or reference to the contents of this document.
As a general report, this material does not necessarily represent the view of Knight Frank LLP in relation to particular properties or projects.
Reproduction of this report in whole or in part is not allowed without prior written approval of Knight Frank LLP to the form and content within which it appears.
Copyright: @ Knight Frank LLP 2016
Knight Frank LLP is a limited liability partnership registered in England with registered number OC305934.
Our registered office is 55 Baker Street, London, W1U 8AN, where you may look at a list of members’ names.
IMPORTANT NOTICE
STEPHEN CLIFTONPARTNER - HEAD OF CENTRAL LONDON OFFICES +44 20 7861 1312 [email protected]
JAMES ROBERTSPARTNER - CHIEF ECONOMIST +44 20 7861 1239 [email protected]
TAMAHRA RISKASSOCIATE- SENIOR MARKETING MANAGER +44 207 861 5267 [email protected]
CONTACTS