The Location Advantages and Persistence of the...
12
International Journal of Business and Management Invention ISSN (Online): 2319 – 8028, ISSN (Print): 2319 – 801X www.ijbmi.org || Volume 6 Issue 9 ||September. 2017 || PP—52-63 www.ijbmi.org 52 | Page The Location Advantages and Persistence of the Performance of the Taiwan Logistic Company: A Case Study Hsiao, Chiu-Ming 1 and Lai, Gin-Yi 2 1 (Department of Finance, National Yunlin University of Science and Technology, Taiwan) 2 (Department of Economics of National Chung Cheng University, Taiwan) Corresponding Author: Hsiao, Chiu-Ming Abstract: This study empirically analyzes the persistence of the performance on the Taiwanese logistic company. It is the first study to address the hot hand effect on the performance of logistic stations. Generally, the well-performed stations (Winner) will still have a better performance in the following time interval; the poor-performed stations (Loser) will stay in the worst group. Moreover, we find there is a strong evidence of location advantage for the business stations which supports the discussion of Hernández and Pedersen (2017). It reveals that a non-metropolitan stations is well-performed than the metropolitan station. Either to increase the number of cargo or to decrease the number of workers will promote the performance of the company. Our empirical results can also be extended to the logistic companies in the emerging markets and transition economies. Policymakers can provide some incentives to make the logistics industry more vigorous development and create economic prosperity. Keywords: Performance Persistence, Location Advantage, Supply Chain Management, Kolmogorov-Smirnov Tests. --------------------------------------------------------------------------------------------------------------------------------------- Date of Submission: 11-07-2017 Date of acceptance: 20-09-2017 --------------------------------------------------------------------------------------------------------------------------------------- I. INTRODUCTION In Mentzer et al. (2002), the managers and researchers pay more and more attention on the return management in the field of supply chain management. For providing a start-point to this, Chen et al. (2017) develops a conceptual return management in logistics by revisiting the managers of the supply chain companies. Grushevska and Notteboom (2014) said that logistics is a key area to improve Ukraine’s competitiveness and to improve the ease of doing business in the country. Choi et al. (2016) discussed the risk management of logistics. Moreover, Yuen and Thai (2017) discussed the difference the performance of product and service supply chain. Moreover, Zaid et al. (2017) developed the value-chain model to increase the sustainable value-added in cocoa oil industry in North Kolaka Regency of Southeast Sulawesi Province, Indonesia. In their model, the need of the marketing chain is an important part. It also needs a well-functional logistic channel to distribute the cocoa oil products. As the openness of international trade, logistic industry is threatened by many types of uncertainties, such as terrorist attacks, major infectious diseases, oil crisis, and financial turmoil. All the kinds of those threats will affect the stability of logistic industry and have some effects on the company’s performances. On the other hand, as shown in Hsiao (2015), global economic growth and cross-border investment in production can also promote the development of the global supply chain for the logistics industry to generate better interests. Furthermore, the e-shopping also grows rapidly in the recent years. Especially in May, the youth always buys gift from e-shopping for their mother on the Mother’s Day. In 2008, the revenues of Chinese logistic industry were about 5.545 trillion yuan (779 billion USD), increased by 16% of 2007. And the total value reached to 89.9 trillion yuan (12.84 trillion USD), increased by 19.5% of last year. The total cargo volumes passed 24 billion tons and the total cargo turnovers to 10.3 trillion ton-kilometers. As Reported by the CNN Money news, from 2013 to 2016, the Singles Day (December 11) sales online summed up 8, 84, 135 and 278 billion USD on the China e-shopping platforms, respectively. On the other hand, it combined only 3 billion USD sold in the U.S. for Black Friday and Cyber Monday, according to the Boston Consulting Group. There are many studies to investigate the factors that affects logistics performance however, it is lack of micro-economic analysis in station- or hub-level of logistics. Therefore, our study try to fill the gap for discussing the logistics performance in economic perspective with location advantage. Moreover, this paper is the first study to address the performance persistent property of logistic business stations. The structure of this paper is as follows. Following the introduction, Section 2 is the literature review. Methodology is in Section 3. Section 4 deals with the empirical data and descriptive statistics. The empirical analysis is also in the Section 4. And then concluding remarks are given in the final section.
Transcript of The Location Advantages and Persistence of the...

International Journal of Business and Management Invention
ISSN (Online): 2319 – 8028, ISSN (Print): 2319 – 801X
www.ijbmi.org || Volume 6 Issue 9 ||September. 2017 || PP—52-63
www.ijbmi.org 52 | Page
The Location Advantages and Persistence of the Performance of
the Taiwan Logistic Company: A Case Study
Hsiao, Chiu-Ming 1 and Lai, Gin-Yi
2
1(Department of Finance, National Yunlin University of Science and Technology, Taiwan)
2(Department of Economics of National Chung Cheng University, Taiwan)
Corresponding Author: Hsiao, Chiu-Ming
Abstract: This study empirically analyzes the persistence of the performance on the Taiwanese logistic
company. It is the first study to address the hot hand effect on the performance of logistic stations. Generally,
the well-performed stations (Winner) will still have a better performance in the following time interval; the
poor-performed stations (Loser) will stay in the worst group. Moreover, we find there is a strong evidence of
location advantage for the business stations which supports the discussion of Hernández and Pedersen (2017).
It reveals that a non-metropolitan stations is well-performed than the metropolitan station. Either to increase
the number of cargo or to decrease the number of workers will promote the performance of the company. Our
empirical results can also be extended to the logistic companies in the emerging markets and transition
economies. Policymakers can provide some incentives to make the logistics industry more vigorous development
and create economic prosperity.
Keywords: Performance Persistence, Location Advantage, Supply Chain Management, Kolmogorov-Smirnov
Tests.
----------------------------------------------------------------------------------------------------------------------------- ----------
Date of Submission: 11-07-2017 Date of acceptance: 20-09-2017
----------------------------------------------------------------------------------------------------------------------------- ----------
I. INTRODUCTION
In Mentzer et al. (2002), the managers and researchers pay more and more attention on the return
management in the field of supply chain management. For providing a start-point to this, Chen et al. (2017)
develops a conceptual return management in logistics by revisiting the managers of the supply chain companies.
Grushevska and Notteboom (2014) said that logistics is a key area to improve Ukraine’s competitiveness and to
improve the ease of doing business in the country. Choi et al. (2016) discussed the risk management of logistics.
Moreover, Yuen and Thai (2017) discussed the difference the performance of product and service supply chain.
Moreover, Zaid et al. (2017) developed the value-chain model to increase the sustainable value-added in cocoa
oil industry in North Kolaka Regency of Southeast Sulawesi Province, Indonesia. In their model, the need of the
marketing chain is an important part. It also needs a well-functional logistic channel to distribute the cocoa oil
products. As the openness of international trade, logistic industry is threatened by many types of uncertainties,
such as terrorist attacks, major infectious diseases, oil crisis, and financial turmoil. All the kinds of those threats
will affect the stability of logistic industry and have some effects on the company’s performances.
On the other hand, as shown in Hsiao (2015), global economic growth and cross-border investment in
production can also promote the development of the global supply chain for the logistics industry to generate
better interests. Furthermore, the e-shopping also grows rapidly in the recent years. Especially in May, the youth
always buys gift from e-shopping for their mother on the Mother’s Day. In 2008, the revenues of Chinese
logistic industry were about 5.545 trillion yuan (779 billion USD), increased by 16% of 2007. And the total
value reached to 89.9 trillion yuan (12.84 trillion USD), increased by 19.5% of last year. The total cargo
volumes passed 24 billion tons and the total cargo turnovers to 10.3 trillion ton-kilometers. As Reported by the
CNN Money news, from 2013 to 2016, the Singles Day (December 11) sales online summed up 8, 84, 135 and
278 billion USD on the China e-shopping platforms, respectively. On the other hand, it combined only 3 billion
USD sold in the U.S. for Black Friday and Cyber Monday, according to the Boston Consulting Group.
There are many studies to investigate the factors that affects logistics performance however, it is lack
of micro-economic analysis in station- or hub-level of logistics. Therefore, our study try to fill the gap for
discussing the logistics performance in economic perspective with location advantage. Moreover, this paper is
the first study to address the performance persistent property of logistic business stations. The structure of this
paper is as follows. Following the introduction, Section 2 is the literature review. Methodology is in Section 3.
Section 4 deals with the empirical data and descriptive statistics. The empirical analysis is also in the Section 4.
And then concluding remarks are given in the final section.

The Location Advantages and Persistence of the Performance of the Taiwan Logistic Company: A
www.ijbmi.org 53 | Page
II. LITERATURE REVIEW
2.1 Location Advantage and Decision of Hubs In Taniguchi et al. (1999), they adopt queuing theory and nonlinear programming techniques to find
the optimal solution in determining the size and location of public logistics terminals. The research from Wang
and Zhang (2002), Shang and Marlow (2007), logistics and supply chain management has been elevated to a
strategic level whereby firms can simultaneously achieve differentiation and low cost for sustained competitive
advantages. Giannakis (2007) tried to establish an analytical and innovative model for assessing the
performance of supplier relationships (SRs). His model can be utilized with qualitative as well as quantitative
data. Blankley (2008) discussed the nexus between supply chain management technologies (SCMT) and
financial performances. He found that the financial performance benefits can be promoted by the investment in
supply chain management technology. To this end, he suggested a model to evaluate it. Shang and Marlow
(2007) has revealed that logistics performance was positively associated with financial performance. Their
findings also implied that logistics competency has an indirect effect on financial performance through logistics
performance.
Besides, Park et al. (2011) developed the models of supply chain security activities and their outcome
by means of using Balanced Scorecard (BCS) which is a well-known performance indicator to identify
relationship between supply chain security activities and their accomplishment. Bae (2012) has empirically
analyzed gaps in performance among development stages of integration in supply chain management (SCM).
Ahn et al. (2013) compared the difference of Korean and Japanese logistic firms. Also, research in Bae (2014)
has proved that the interactive effect of supply chain integration (SCI) on performance and ascertained gaps in
performance among levels of SCI. Managers of the forwarders make strategic decision making on the basis of
their recognition of environment and, as a result, the forwarders enjoy different performance.
First, from Bae et al. (2013), there are three objectives in this research: one is to develop measuring
criteria for ascertaining performance of customs clearance firms, another is to test reliability and validity of the
factors, and the third is to analyze the relationship between customer service and firm performance. According
to the result of the analysis, firms which have discriminative services and a high level of flexibility through
collaboration with customers can achieve high levels of customer performance and financial performance. In
Lee and Lee (2011), they examined the comparative corporate performance of logistics companies in Korea,
China and Japan. By using Data Envelop Analysis (DEA), the primary results regarding corporate efficiency
among Korean, Chinese and Japanese logistic companies are as follows: in the multimodal industries, Japanese
firms have revealed the highest level of efficiency, with Korean firms coming in second and Chinese firms
ranking third with distinctly inferior performance. On the other hand, Park et al. (2011) further indicates that
relationship with partners has more effect on logistics security accomplishment than sharing of logistic
information. Just as relationship between corporations in chain of supply and sharing of information among
them are important elements in management of supply chain, relationship with partners and sharing of logistic
information will have positive effect on supply chain security accomplishment and raise its effectiveness.
Secondly, as discussed in Christopher (2016), the literatures about logistics are always associated with
the supply chain management, logistics performance, and locations of city logistics facilities. For instance,
logistics and supply chain management have been elevated to a strategic level whereby firms can simultaneously
achieve differentiation and low cost for sustained competitive advantage (e.g. Shang and Marlow, 2007; Seo et
al., 2016). And in May et al. (2004), they used the genetic algorithms (GA) to solve the choice of optimal charge
location of a business station. El-Baz (2011) developed an effective decision tool based on fuzzy set theory for
the performance measurement of a supply chain in manufacturing companies. Besides, Bae (2012) had
empirically analyzed gaps in performance among development stages of integration in supply chain
management (SCM). Meanwhile, Church & Murray (2009), Homer (2009), Murray (2009) and Chapman (2009)
discussed the location advantages of business site. Murray (2009) said that location theory is the basis for
examining how and why the arrangement of cities and markets has come to be and provides the rationale for
siting decision making and service allocation. Moreover, according to Li et al. (2011) proposed that the purpose
of adequate location of a logistics hub is to make products available to different markets through the best
possible connections, allowing for a better use of the logistics and transportation infrastructure available.
And, Kuo (2011) indicated that the decision problem of location selection should be complex with
multi-criteria and multi-stage problem. Such that, as stated in Tan et al. (2002), a firm with a good location
management strategy will have the location advantage. Also, from the empirical results of Zhang et al. (2011),
the strategic location of city logistics facilities may help to establish more efficient urban logistics systems, to
reduce social and environmental costs of urban freight transport, and to improve urban traffic conditions. This
paper considers the problem of selecting a location for a city logistics facility while considering linguistic
factors. So, alike to Zhang et al. (2011), our results are expected to help municipal government’s select
appropriate locations for city logistics facilities and quantify the advantages and disadvantages of alternative
locations.

The Location Advantages and Persistence of the Performance of the Taiwan Logistic Company: A
www.ijbmi.org 54 | Page
Furthermore, according to Zhang and Kwon (2010) and Zhang et al. (2011), they used a fuzzy
synthetic evaluation approach to find the best location selection. And in Tolga et al. (2013), it was the first study
that applied a fuzzy real option valuation approach for the retail location selection. Simić et al. (2015)
implemented Analytical Hierarchy Process (AHP) and k-means method to decide the best location for logistics
distribution center. Chang et al. (2015) also adopt an ANP-based TOPSIS approach to investigate the location
selection of Taiwanese service firms. Vieira and Luna (2016) used the both multi-criteria and single-criterion
model to find the best hub location regarding a variety of transportation network designs, such as, road-, rail-
and waterways. Moreover, Gunasekaran et al. (2017) uses information technology (IT) to achieve the
competitive advantages of logistics. Ashenbaum and Maltz (2017) also develops a conceptual framework of
purchasing-logistic integration (PLI) which will be useful and help to promote the performance of suppliers.
Jazairy et al. (2017), Li and Bathelt (2017) investigated the location strategies of Canadian and Chinese MNCs
in international and domestic investment decisions at the metropolitan level. However, there isn’t any
academically economic analysis of logistics researches. Therefore, our study try to fill the gap for discussing the
logistics performance in economic perspective with location advantage.
2.2 Persistence of Performance Next, it is interesting that a well-performed station will be good in the following period. It is called the
“Hot Hand Effect,” which refers to the tendency for people to expect streaks in sports performance to continue.
Gilovich et al. (1985) said that many sports fans, commentators, players, and even coaches share a belief that a
particular player can for some period of time have the hot hand. Moreover, Johnson et al. (2005) discussed the
effect of hot/cold hand and the gambler’s fallacy on the stock markets. And Stöckl et al. (2015) uses
experimental approach to discuss the hot hand effect. In the laboratory experiments, they showed that
communication and group decision making do not impact subjects’ overall proneness to the hot hand fallacy and
to the gambler’s fallacy.
In finance, Jegadeesh and Titman (1993) first documented that strategies which buy stocks that have
performed well in the past and sell stocks that have performed poorly in the past generate significant positive
returns over 3- to 12-month holding periods. And, Hendricks et al. (1993) studied the hot hand effect on mutual
funds. They found that the performance of mutual funds persists for short-term, which is different to the findings
of Grinblatt and Titman (1989), persistence in mutual fund returns over five-year periods. Hereafter, Carhart
(1997) used the “Winners” and “Losers” to stand for well-performed and poor-performed group, respectively.
His great work found that hot hand effect is driven by the momentum effect. Moreover, Islam (2014) presented
the financial performance persistence of banks in Bangladesh. Fu and Liu (2017) investigated the persistence
timing of mutual funds and the ability of timing.
In the field of accounting, the earnings persistence is also an unsolvable anomaly. Sloan (1996) found
that firm’s earnings in the annual report will persist in the following year. Richardson et al. (2005), Dicheva and
Tang (2009), Frankel and Litov (2009), and Chen et al. (2014) extended the results of Sloan (1996) and their
findings indicated that the relation between past earnings volatility and earnings persistence is robust to the
additional controls and to a correction for sampling bias, but that earnings volatility does not predict stock
returns.
This paper is the first study to address the performance persistent property of logistic business stations.
Mimicking to Carhart (1997), we calculate the monthly performance of each station in the first half-year and
take average of the monthly performances. Since the total revenues are correlated to the size of the station, i.e., a
station with higher revenue may result from more workers or more Cargos. Since the value per person is defined
the ratio of total revenue to the employees, which measures the value created by each worker in every station.
Similarly, the value per cargo is defined the ratio of total revenue to the cargos, which measures the value
created by each cargo in every station. Therefore, our measurements are the values created by each person and
each cargo, denoted by VPP and VPC, respectively, to eliminate the size effect of station.
III. METHODOLOGIES
3.1. Comparative tests Following the study of Lee and Lee (2011), Kumari and Priya (2017), we may use the comparative test
to compare the difference of between two or more groups, such as, north versus to south and Winners versus to
Losers, etc. Lee et al. (2011) compared the financial performance of the logistic companies in Korea, Japan and
China. They found that the logistic companies in China are the highest growth than that of Korea and Japan, but
the worst efficiency. Here, we will compare the average performance of each comparative group to distinguish
their difference. And, Kumari and Priya (2017) investigated the factors that affect the managerial employees’
commitment to the bank performance by using comparative analysis of the 633 managers of banking sector
located in Uttar Pradesh, the most populous state in the Republic of India. Using the statistical testing
hypothesis, we may find the performances between groups whether significantly different, or not.
The Location Advantages and Persistence of the Performance of the Taiwan Logistic Company: A
www.ijbmi.org 55 | Page
3.2. Multivariate regression models Beside the comparative test, we also can adopt the multivariate regression analysis to study these
issues. Differently, the comparative test can only find the difference between two groups, but the multivariate
regression analysis will reveal the reasons of the existence of the difference. To investigate the difference, we
will imbed some explanatory variables to the multivariate regression model. After using some categorical
variables (dummy variables), we can classify the data into some groups.
Moreover, the results of the multivariate regression analysis are reasonable and fruitful. In the results of
multivariate regression analysis, we may find the factors that affect the performance of the firm; we also can
evaluate the magnitude of each factor to the firm’s performance. And by the dummy variables, we also can
compare the difference between the groups, difference of performance or the composition of performance.
IV. EMPIRICAL ANALYSIS
4.1 Data and its descriptive statistics Our empirical data is collected from CF Express Co., Ltd., an affiliated company of Taiwan well-
known and branded logistics company. It was established at 1954/12/21 and was a pure domestic logistic
company in Taiwan before 2008/11/21. After that, it becomes a member of the international group in Malaysia.
Its IPO on Taiwan Security Exchange was at 1990/12/20.
The CF Express was established at 1984/12/20 and its service packages includes international express
services encompassing Taiwan, China, and Hong Kong, domestic same-day delivery, air express to and from
Penghu and Kinmen, payment acceptance, and intra-urban express service. We collect the CF Express’s
monthly performance data from 2010 April to 2014 April. There are 49 months data and 2,672 station-months
data. All the summary statistics are listed in the Table 1.
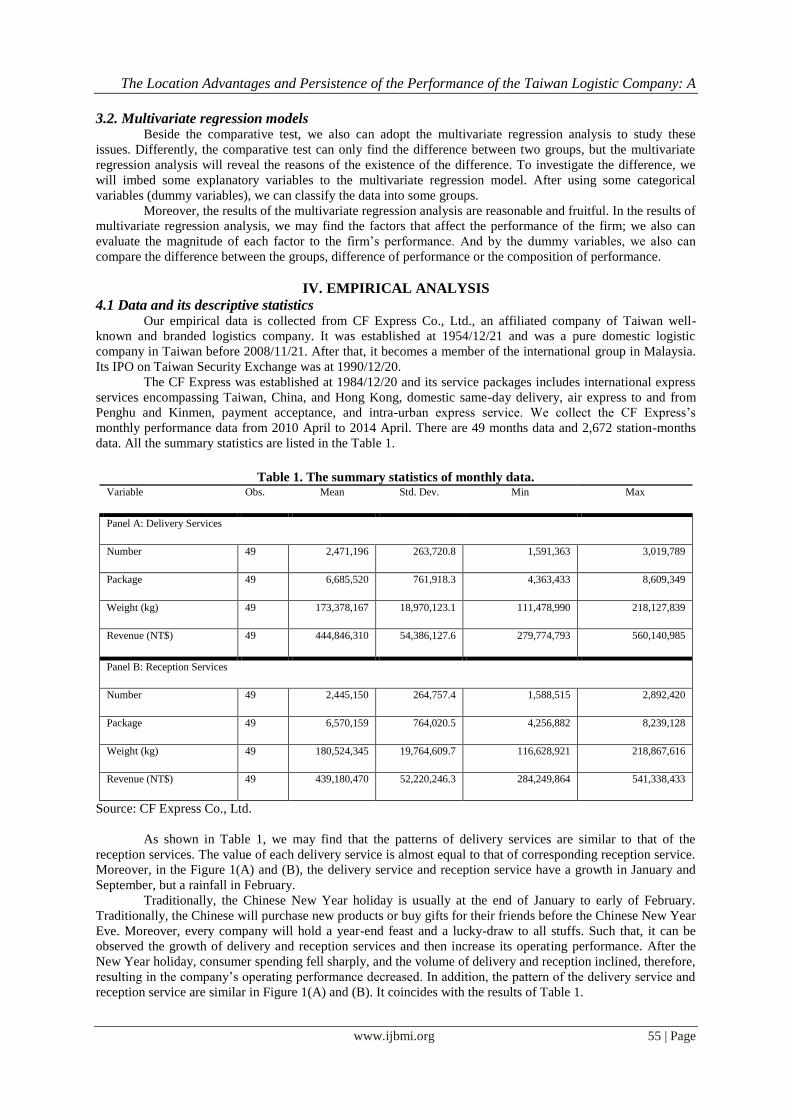
Table 1. The summary statistics of monthly data. Variable Obs. Mean Std. Dev. Min Max
Panel A: Delivery Services
Number 49 2,471,196 263,720.8 1,591,363 3,019,789
Package 49 6,685,520 761,918.3 4,363,433 8,609,349
Weight (kg) 49 173,378,167 18,970,123.1 111,478,990 218,127,839
Revenue (NT$) 49 444,846,310 54,386,127.6 279,774,793 560,140,985
Panel B: Reception Services
Number 49 2,445,150 264,757.4 1,588,515 2,892,420
Package 49 6,570,159 764,020.5 4,256,882 8,239,128
Weight (kg) 49 180,524,345 19,764,609.7 116,628,921 218,867,616
Revenue (NT$) 49 439,180,470 52,220,246.3 284,249,864 541,338,433
Source: CF Express Co., Ltd.
As shown in Table 1, we may find that the patterns of delivery services are similar to that of the
reception services. The value of each delivery service is almost equal to that of corresponding reception service.
Moreover, in the Figure 1(A) and (B), the delivery service and reception service have a growth in January and
September, but a rainfall in February.
Traditionally, the Chinese New Year holiday is usually at the end of January to early of February.
Traditionally, the Chinese will purchase new products or buy gifts for their friends before the Chinese New Year
Eve. Moreover, every company will hold a year-end feast and a lucky-draw to all stuffs. Such that, it can be
observed the growth of delivery and reception services and then increase its operating performance. After the
New Year holiday, consumer spending fell sharply, and the volume of delivery and reception inclined, therefore,
resulting in the company’s operating performance decreased. In addition, the pattern of the delivery service and
reception service are similar in Figure 1(A) and (B). It coincides with the results of Table 1.

The Location Advantages and Persistence of the Performance of the Taiwan Logistic Company: A
www.ijbmi.org 56 | Page
Fig. 1(A). Monthly weight and revenue generated by delivery and reception services.
Source: CF Express Co., Ltd.
Fig. 1(B). Monthly number and package of delivery and reception services.
Source: CF Express Co., Ltd.
4.2. Comparative Tests Here, we want to investigate the station’s performances will vary depending on the business location.
As the discussion in Shukla et al. (2016), a partnership will be a helpful relationship to promote the
development quality agriculture and infrastructure. Such that, the higher the quality of infrastructure, the more
the agribusiness development. It should be the same in the logistic industry.
4.2.1 Performances Persistence
According to Gorane and Kant (2017), they used operational performance, customer satisfaction, and
financial performance to be the proxies of supply chain organization performance. To investigate the
performance persistency, we sort the values per Cargo and per worker, respectively. And find the top-10 stations
to form the “Winners” and the bottom-10 stations to form the “Losers”. Observing the three-year data (six half-
year data), we can find the change of the composition of each group. Figure 2A and 2B show the average values
of “Winners” and “Losers”. The average workers and cargos in the winners group (solid lines) are flatter than
that in the losers group (dashed lines). There is a rainfall of “losers” in the 2012. It might be a layoff of
employees in 2012 result from the China’s economic growth slow. The revenues from delivery services and
reception services also decline in the same period. However, the company recruited number of employees and
purchased cargos in the next year. So the value created by the cargo increased in 2013.

The Location Advantages and Persistence of the Performance of the Taiwan Logistic Company: A
www.ijbmi.org 57 | Page
Fig. 2(A). Average workers and cargos in Winners and Losers, respectively.
Source: CF Express Co., Ltd.
Fig. 2(B). Average value per worker and value per cargo in Winners and Losers, respectively.
Source: CF Express Co., Ltd.
On the other hand, as shown in Figure 2(B), the pattern of average values created by the cargo (VPC) and
values created by the worker (VPP) are different in the two groups (solid lines for the “Winners” and dash lines
for the “Losers”). It is obvious that the average values created by the cargo and values created by the worker of
the “Winners” are higher than that of the “Losers”, respectively. Hence, we want to test the following
hypothesis:
Hypothesis I: The performance will persist, that is, there is a momentum effect of performances.
And the sub-hypotheses can be rewritten as follows:
Hypothesis I (A): The winners are still well-performed.
Hypothesis I (B): The losers are still poor-performed.
Table 2A. The “Winners” of station’s semi-annual performance.
Rank 2011 2nd Half-
year
2012 1st Half-
year
2012 2nd Half-
year
2013 1st Half-
year
2013 2nd Half-
year 2014 1st Half-year
1 Airport Office Airport Office Airport Office Airport Office Airport Office Airport Office
2 Zhongli Dafa Hualien Linkou Hualien Linkou
3 Dafa Linkou Linkou Dafa Linkou Hualien
4 Linkou Zhongli Zhongli Hualien Dafa Guanyin
5 Tainan Tainan Dafa Zhongli Taishan Taishan
6 Hualien Gangshan Gangshan Gangshan Tainan Gangshan
7 Anping Shulin Taishan Tainan Guanyin Beigang

The Location Advantages and Persistence of the Performance of the Taiwan Logistic Company: A
www.ijbmi.org 58 | Page
8 Lukang Lukang Tainan Taishan Gangshan Dafa
9 Taishan Taishan Shulin Beigang Zhongli Tainan
10 Qianzhen Hualien Qianzhen Lukang Shulin Zhongli
Average (1,000NT$)
VPP 126.16 199.92 222.06 208.52 222.08 211.19
VPC 187.84 485.80 459.79 383.14 440.89 461.11
Delivery
Revenue 7,332.32 9,195.08 11,094.04 13,092.92 12,177.04 11,683.66
Reception
Revenue 7,463.03 8,230.69 10,448.91 11,036.40 10,635,688 11,141.58
Workers 49.7 50.5 52.9 51.6 52.5 51.3
Cargos 31.8 32.5 33.6 32.8 31.6 30.9
Source: CF Express Co., Ltd.
Table 2B. The “Losers” of station’s semi-annual performance.
Rank 2011 2nd Half-year 2012 1st Half-year 2012 2nd Half-year 2013 1st Half-year 2013 2nd Half-year 2014 1st Half-
year
1 Songshan Puli Songshan Songshan Penghu Puli
2 Xindian Songshan Chaozhou Penghu Songshan Penghu
3 Kinmen Xindian Taichung Taichung Xindian Sanchong
4 Taichung Kinmen Xindian Xindian Chaozhou Songshan
5 Zhonghe Taichung Puli Chaozhou Taichung Beitou
6 Keelung Zhonghe Kinmen Puli Sanchong Xindian
7 Beitou Penghu Tianzhong Kinmen Puli Zhonghe
8 Xinying Chaozhou Keelung Sanchong Kinmen Taichung
9 Puli Keelung Penghu Zhonghe Tianzhong Chaozhou
10 Sanchong Sanchong Zhonghe Tianzhong Keelung Keelung
Average (1,000NT$)
VPP 130.46 126.16 139.08 133.85 146.17 134.94
VPC 195.19 187.84 212.91 207.38 228.60 206.00
Delivery Revenue 8,901.81 7,332.32 6,612.83 10,196.76 9,462.26 9,950.76
Reception Revenue 9,285.97 7,463.03 7,286.59 9,771.03 9,344.82 10,892.74
Workers 65.7 61.6 50.6 63.1 62.2 67.7
Cargos 43.3 41.3 33.0 40.6 39.0 44.1
Source: CF Express Co., Ltd.

The Location Advantages and Persistence of the Performance of the Taiwan Logistic Company: A
www.ijbmi.org 59 | Page
Applying the Kolmogorov-Smirnov (2-sample) test, we may find the two hypotheses are significant at
10% level. That is, a station which is good performance will be still well-performed in the following year. On
the other hand, a station with poor performance will be still poor-performed in the following year.
4.2.2 Tests for Location Advantages In general, the metropolitan areas, such as Taipei, New Taipei, Taoyuan, Taichung and Kaohsiung,
most of them are located in the north area of Taiwan and are closed to the capital of Taiwan, except Kaohsiung
City. They all have a higher quality of transportation infrastructure than the other cities in Taiwan, such as
Expressway Network, High Speed Railway, and MRT system etc. Besides that, there are higher house prices
and living standard in metropolitan, thereby the costs of living are more expensive and has a higher land tax in
metropolitan. So the business stations in the area will incur a higher operating costs. In addition, traffic in the
metropolitan area is also higher, it will affect the traffic when the drivers either load or unload the bulk of goods,
which may also cause cargo damage or traffic accidences. According to Ghoseiria et al. (2004), they defined
three major problem levels of the station decision: (1) long-run strategic for 5–20 years; (2) a midterm tactical
for 1–5 years, and (3) short-term operational up to only one year. And in Repolho et al. (2016), they applied a
mixed-integer linear programming approach to solve the station location problem under the three different
levels. Since the station location decision is not only a compete strategy, but also affects to the operation
performance of each business station and so to the whole enterprise.
Fig. 3. Map of Taiwan.
Source: Tourism Bureau, Ministry of Transportation and Communications (M.O.C.T.), R.O.C. (Taiwan).
http://eng.taiwan.net.tw/m1.aspx?sNo=00165 90.
According to the above discussion, we found that the performance of each station has different pattern. There
may be some difference of performance in north, central, and south area of Taiwan. Hence, we will test the
following sub-hypothesis:
Hypothesis II (A): The performances of south station are higher than that of north station.
Hypothesis II (B): The performances of metropolitan station are higher than that of non-
metropolitan station.
4.3 Empirical Regression Results Next, we adopt the multivariate regression models to find the factors that affect the station’s
performance. Consider the following regression model:
, (1)
where, y is the performance of station i in month t, here, it stands for the revenue per number and revenue per
package, respectively. X is the explanatory variables vector, i.e.
. (2)
Here, VPP and VPC are the value created by worker and by cargo, respectively; SIZE is the size of each station,
the number of employees and cargos. And the Area_id is a dummy variable that the station locates in which

The Location Advantages and Persistence of the Performance of the Taiwan Logistic Company: A
www.ijbmi.org 60 | Page
area. It ranges from 1(north) to 8(south). We categorize the data into two categories, one is 3-zone dummy (0 for
north, 1 for central and 2 for south and east of Taiwan), and the others are 8-distinct, ranging from north to south
and east of Taiwan. Fee is the revenue generated by delivery services (Feed) and revenue generated by reception
services (Feer). In this study, we take logarithmic value of the revenues to avoid the scale effect.
Table 3A. Regression results of the monthly revenue per number regressing on the explanatory variables.
Variables Model I Model II Model III Model IV Model V Model VI Model VII
Constant 934.32***
(30.97)
942.86***
(29.46)
886.44***
(31.43)
741.70***
(30.09)
757.78***
(30.73)
962.04***
(28.52)
797.36***
(28.14)
LnDelRev -23.8***
(1.91)
-23.8***
(1.91)
-19.5***
(1.99)
-9.83***
(1.91)
-6.57***
(1.98)
-20.08***
(1.98)
-7.84***
(1.97)
LnRecRev -24.2***
(1.07)
-24.2***
(1.07)
-25.0***
(1.06)
-27.0***
(0.99)
-26.9***
(0.99)
-33.07***
(0.97)
-34.14***
(0.90)
VPP
(Value per
Worker)
0.0006****
(0.00004)
0.0004***
(0.0000)
VPC
(Value per
Cargo)
-0.0002***
(0.0000)
-0.0001***
(0.0000)
Workers 0.40***
(0.05)
-1.20***
(0.24)
-1.44***
(0.22)
-1.17***
(0.23)
-0.16
(0.22)
-0.62***
(0.20)
Cargos
0.65***
(0.70)
2.34***
(0.35)
2.68***
(0.32)
2.13***
(0.33)
0.84***
(0.31)
1.39***
(0.29)
Area_id
12.27***
(0.68)
10.62***
(0.62)
North
-52.6***
(2.99)
Central
-45.6***
(3.07)
Adj. 0.33 0.34 0.44 0.44 0.44 0.51 0.58
Obs. 1852 1852 1852 1852 1852 1852 1852
Note: The values in the parentheses are the standard error of each estimate. *** stands for the 5% significant level.

The Location Advantages and Persistence of the Performance of the Taiwan Logistic Company: A
www.ijbmi.org 61 | Page
Table 3B. Regression results of the monthly revenue per package regressing on the explanatory variables.
Variables Model I Model II Model III Model IV Model V Model VI Model VII
Constant
528.5***
(11.67)
514.1***
(11.13)
519.5***
(11.95)
474.2***
(11.76)
462.6***
(11.28)
557.4***
(11.63)
509.5***
(11.93)
LnDelRev
-20.6***
(0.72)
-19.4***
(0.68)
-19.8***
(0.76)
-16.8***
(0.75)
-14.4***
(0.74)
-22.1***
(0.81)
-18.5***
(0.83)
LnRecRev
-9.72***
(0.40)
-9.91***
(0.40)
-9.88***
(0.40)
-10.5***
(0.39)
-10.5***
(0.37)
-11.97***
(0.40)
-12.28***
(0.38)
VPP
(Value per
Worker)
0.0002***
(0.0000)
0.0002****
(0.0000)
VPC
(Value per
Cargo)
-0.00005***
(0.0000)
-0.00005***
(0.0000)
Workers
0.41***
(0.02)
0.11
(0.09)
0.04
(0.09)
0.24***
(0.09)
0.48***
(0.09)
0.34***
(0.09)
Cargos
0.60***
(0.03)
0.44***
(0.13)
0.55***
(.13)
0.16
(0.13)
-0.02***
(0.13)
0.14
(0.12)
Area_id
3.84***
(0.27)
3.10***
(0.26)
North
-19.19***
(1.12)
Central
-21.63***
(11.28)
Adj. 0.47 0.47 0.47 0.53 0.56 0.55 0.58
Obs. 1852 1852 1852 1852 1852 1852 1852
Note: The values in the parentheses are the standard error of each estimate. *** stands for the 5% significant level.
The fruitful regression results are shown in Table 3 (A) and (B). In the tables, we may find that the
revenue per number is increasing as cargo increase, but decreasing as the employee increase. And in panel B,
although the revenue per package is increasing as cargo and employee increase, but employee is partially
insignificant. Such that, increasing of the station size is not necessary to increase the revenue. Moreover, the
revenue per number and revenue per package are positively correlated to the location of the station. We find that
the more southern the stations, the more revenues they generate. These results are consistent to the results by
using the comparative tests.

The Location Advantages and Persistence of the Performance of the Taiwan Logistic Company: A
www.ijbmi.org 62 | Page
V. CONCLUSION With globalization, international trade transactions increasingly warm. The logistics plays an important role to the multinational
enterprises. Our study handy collected the monthly performances from the CF Express Co., Ltd. It is a well-known and branded logistic
company in Taiwan. Our findings are fruitful. Generally, the purchasing power in the metropolitan area should be higher than the non-metropolitan
areas. Infrastructure and transport facilities in the metropolitan area are more hi-tech than that of the non-metropolitan areas. Hence, the
performances of the urban stations are thought to be higher than the performances of the non-metropolitan stations. However, as shown in Table 3, the results are precisely the opposite of this idea. We find that, in Taiwan, the higher the urbanization, the more convenient traffic,
the lower the performance of its business stations. It was consistent to the results in Cepolina and Farina (2015).
On the other hand, we find an interesting result that the persistence of the station’s performance. As the discussion in finance and accounting, applying the Kolmogorov-Smirnov tests, our result (Table 2) shows that the well-performed stations (Winner) will still have a
better performance in the following period; the poor-performed stations (Loser) will stay in the worst group. Analyzing the size of each
station, we find that the more compact operating station, its contribution to the company’s performance higher. Although the larger size stations will make higher revenue, its huge labor costs and maintenance cost of vehicles will erode the revenue. This result coincides to the
conclusion of Lam and Bai (2016). Such that, the executives responds to various business station for proper planning to strike a more
effective operation and performance. Our empirical results can also be extended to the logistic companies in the emerging markets and transition economies. In
addition to providing logistics professionals in the effective management of performance, and can give the country’s policymakers in the
industry promotion a substantive planning direction. Policymakers can provide the logistics industry to set up the stations in the vicinity of the metropolitan areas by improving the infrastructure, modifying the land use policies, setting the supply chain areas, tax incentives.
Furthermore, they can introduce the IT industry and the robots to replace the manpower for reducing company’s personnel costs, can make
the logistics industry more vigorous development and create economic prosperity.
ACKNOWLEDGEMENTS We would like to express my gratitude to all those who helped me during the writing of this study. And we’re grateful for
valuable comments from Editor and the anonymous referee.
Our deepest gratitude goes first and foremost to Dr. Tang Meng-Chi, Associate Professor of Graduate Institute of International Economics of Taiwan National Chung Cheng University, for his constant encouragement and guidance. He has walked us through all the
stages of the writing of this paper. Without his consistent and illuminating instruction, this study could not have reached its present form.
We also owe our sincere gratitude to our friends Ms. Sun Li-Yun and Ms. Tsai Yun-Jean who gave us their help and time in listening to us and helping us work out the problems during the difficult course of this study.
REFERENCES [1] Hernández, V. and T. Pedersen, Global value chain configuration: A review and research agenda, Business Research Quarterly
(BRQ), 20(2), 2017, 137-150. [2] Mentzer, J.T., W. DeWitt, J.S. Keebler, S. Min, N.W. Nix, C.D. Smith, and Z.G. Zacharia, Defining supply chain management,
Journal of Business Logistics, 22(2), 2002, 1–25.
[3] Chen, H.Z., K. Anselmi, M. Falasca, and Y. Tian, Measuring returns management orientation, The International Journal of Logistics Management, 28(2), 2017, 251-265.
[4] Grushevska, K. and T. Notteboom, An Economic and Institutional Analysis of Multi-Port Gateway Regions in the Black Sea Basin,
Journal of International Logistics and Trade, 12, 2014, 3-35.
[5] Choi, T.M., C.H. Chiu, and H.K. Chan, Risk management of logistics systems, Transportation Research Part E: Logistics and
Transportation Review, 90, 2016, 1-6.
[6] Yuen, K.F. and V.V. Thai, The influence of supply chain integration on operational performance: A comparison between product and service supply chains, The International Journal of Logistics Management, 28(2), 2017, 444-463.
[7] Zaid, S., D.T. Syaefuddin, and Halim, The Value Chain Development Model of the Cocoa Oil Industry to Increase Sustainable
Value Added, IOSR Journal of Business and Management, 19(7), 2017, 1-12. [8] Hsiao, C.M., The Asymmetry Effect of Different Conditions of Economic Growth and Logistic Expansion on the Financial
Performance of the Taiwanese Logistic Industry, International Conference on Business and Social Sciences (ICBASS), Osaka,
Japan, 2015, Paper No.: 7374. [9] Taniguchi, E., M. Noritake, T. Yamada, and T. Izumitani, Optimal size and location planning of public logistics terminals,
Transportation Research Part E: Logistics and Transportation Review, 35(3), 1999, 207–222.
[10] Wang, L. and N.T. Zhang, A location management scheme based on pointers strategy in the roaming cluster for the ad-hoc networks, 2002 IEEE International Conference on Personal Wireless Communications, 2002, No. 7742965.
[11] Shang, K.C. and P.B. Marlow, The Effects of Logistics Competency on Performance, Journal of International Logistics and Trade,
5(2), 2007, 45-66. [12] Giannakis, M., Performance measurement of supplier relationships, Supply Chain Management: An International Journal, 12(6),
2007, 400-411.
[13] Blankley, A., A conceptual model for evaluating the financial impact of supply chain management technology investments, The International Journal of Logistics Management, 19(2), 2008, 155-182.
[14] Park, J.Y., J.U. Min, and J.S. Park, Analysis of Causal Relationship between Supply Chain Security and Its Performance Using
Balanced Scorecard Model, Journal of International Logistics and Trade, 9(2), 2011, 99-118. [15] Bae, H.S., An analysis of gaps in performance among development stages of integration in SCM, Journal of International Logistics
and Trade, 10(3), 2012, 85-104.
[16] Ahn, W.C., S. Ishii, and S.B. Ahn, A Comparative Study of Korean and Japanese Logistics Industries’ Market Structures: Focusing on Subsidiary and Third-Party Logistics Companies, The Asian Journal of Shipping and Logistics, 29(3), 2013, 361-376.
[17] Bae, H.S., The Interactive Effect of Supply Chain Integration on Performance of International Freight Forwarders, Journal of
International Logistics and Trade, 12(2), 2014, 97-119. [18] Bae, H.S., W.Y. Lee, and Y.K. Lee, The Effect of Customer Service on Firm Performance: Developing Scales for Performance
Measurement of Customs Clearance Firms, Journal of International Logistics and Trade, 11(2), 2013, 47-70.
[19] Lee, J.Y. and M.H. Lee, Comparative Analysis of Competitiveness of Logistics Companies in Korea, Japan and China, Journal of International Logistics and Trade, 9(1), 2011, 27-42.
[20] Christopher, M., Logistics and Supply Chain Management, 5th Edition (Financial Times/Pearson Education, 2016).

The Location Advantages and Persistence of the Performance of the Taiwan Logistic Company: A
www.ijbmi.org 63 | Page
[21] Seo, Y.J., J. Dinwoodie, and M. Roe, The Influence of Supply Chain Collaboration on Collaborative Advantage and Port
Performance in Maritime Logistics, International Journal of Logistics Research and Applications, 19(6), 2016, 562–582. [22] May, A., S. Shepherd, and A. Sumalee, Optimal Locations and Charges for Cordon Schemes, Research in Transportation
Economics, 9, 2004, 87-105.
[23] El-Baz, M.A., Fuzzy performance measurement of a supply chain in manufacturing companies, Expert Systems with Applications, 38(6), 2011, 6681-6688.
[24] Church, R.L. and A.T. Murray, Business Site Selection, Location Analysis and GIS (John Wiley & Sons, Inc., 2009).
[25] Homer, M.W., Location Analysis, International Encyclopedia of Human Geography, 2009, 263–269. [26] Murray, A.T., Location Theory. International Encyclopedia of Human Geography, 2009, 270-276.
[27] Chapman, K., Industrial Location, International Encyclopedia of Human Geography, 2009, 396–401.
[28] Li, Y., X. Liu, and Y. Chen, Selection of logistics center location using Axiomatic Fuzzy Set and TOPSIS methodology in logistics management, Expert Systems with Applications, 38(6), 2011, 7901-7908.
[29] Kuo, M.S., Optimal location selection for an international distribution center by using a new hybrid method, Expert Systems with
Applications, 38(6), 2011, 7208-7221. [30] Tan, K.C., S.B. Lyman, and J.D. Wisner, Supply chain management: a strategic perspective. International Journal of Operations &
Production Management, 22(6), 2002, 614-631.
[31] Zhang, Y., O.K. Kwon, and H.J. Kim, Selecting a Location for a City Logistics Facility: A Fuzzy Synthetic Evaluation Method, Journal of International Logistics and Trade, 9(1), 2011, 115-132.
[32] Zhang, Y. and O.K. Kwon, Location Decision of City Logistics Facility Based on Fuzzy Synthetic Evaluation, Applied Mechanics
and Materials, 33, 2010, 351-355. [33] Tolga, A.C., F. Tuysuz, and C. Kahraman, A fuzzy multi-criteria decision analysis approach for retail location selection,
International Journal of Information Technology & Decision Making, 12(4), 2013, 729-755.
[34] Simić, D., V. Ilin, I. Tanackov, V. Svirčević, and S. Simić, A Hybrid Analytic Hierarchy Process for Clustering and Ranking Best Location for Logistics Distribution Center, Hybrid Artificial Intelligent Systems (HAIS 2015). Lecture Notes in Computer Science,
121, 2015, 477-488.
[35] Chang, K.L., S.K. Liao, T.W. Tseng, and C.Y. Liao, An ANP based TOPSIS approach for Taiwanese service apartment location Selection, Asia Pacific Management Review, 20(2), 2015, 49-55.
[36] Vieira, C.L.S. and M.M.M. Luna, Models and Methods for Logistics Hub Location: A Review toward Transportation Networks
Design, Pesquisa Operacional, 36(2), 2016, 375-397. [37] Gunasekaran, A., N. Subramanian, and T. Papadopoulos, Information technology for competitive advantage within logistics and
supply chains: A review, Transportation Research Part E: Logistics and Transportation Review, 99, 2017, 14-33.
[38] Ashenbaum, B. and A. Maltz, Purchasing-logistics integration and supplier performance: an information-processing view, The International Journal of Logistics Management, 28(2), 2017, 379 – 397.
[39] Jazairy, A., J. Lenhardt, and R.V. Haartman, Improving logistics performance in cross-border 3PL relationships. International
Journal of Logistics Research and Applications, 20, 2017, 1-23. [40] Li, P.F. and H. Bathelt, Location strategy in cluster networks, Journal of International Business Studies, Forthcoming, 2017, 1–23.
[41] Gilovich, T., R. Vallone, and A. Tversky, The hot hand in basketball: On the misperception of random sequences, Cognitive Psychology, 17(3), 1985, 295-314.
[42] Johnson, J., G.J. Tellis, and D.J. Macinnis, Losers, Winners, and Biased Trades, Journal of Consumer Research, 32(2), 2005, 324–
329. [43] Stöckl, T., J. Huber, M. Kirchler, and F. Lindner, Hot hand and gambler’s fallacy in teams: Evidence from investment experiments,
Journal of Economic Behavior & Organization, 117, 2015, 327-339.
[44] Jegadeesh, N. and S. Titman, Returns to Buying Winners and Selling Losers: Implications for Stock Market Efficiency, The Journal of Finance, 48(1), 1993, 65-91.
[45] Hendricks, D., J. Patel, and R. Zeckhauser, Hot Hands in Mutual Funds: Short-Run Persistence of Relative Performance, 1974-
1988, The Journal of Finance, 48(1), 1993, 93-130. [46] Grinblatt, M. and S. Titman, Mutual Fund Performance: An Analysis of Quarterly Portfolio Holdings, The Journal of Business,
62(3), 1989, 393-416.
[47] Carhart, M.M., On Persistence in Mutual Fund Performance, The Journal of Finance, 52(1), 1997, 57-82. [48] Islam, M. A., An Analysis of the Financial Performance of National Bank Limited Using Financial Ratio, Journal of Behavioural
Economics, Finance, Entrepreneurship, Accounting and Transport, 2(5), 2014, 121-129.
[49] Fu, Y.F. and H.C. Liu, The Performance Persistence of Winner Fund Managers - Evidence from the Timing and Stock Picking Ability, Asian Economic and Financial Review, 7(6), 2017, 611-622.
[50] Sloan, R., Do stock prices fully reflect information in accruals and cash flows about future earnings? The Accounting Review, 71,
1996, 289–315. [51] Richardson, S.A., R.G. Sloan, M.T. Soliman, and I. Tuna, Accrual reliability, earnings persistence and stock prices, Journal of
Accounting and Economics, 39(3), 2005, 437-485.
[52] Dicheva, I.D. and V.W. Tang, Earnings volatility and earnings predictability, Journal of Accounting and Economics, 47(2), 2009, 160-181.
[53] Frankel, R. and L. Litov, Earnings persistence, Journal of Accounting and Economics, 47(2), 2009, 182-190.
[54] Chen, L.H., D.M. Folsom, W.D. Paek, and H. Sami, Accounting Conservatism, Earnings Persistence, and Pricing Multiples on Earnings, Accounting Horizons, 28(2), 2014, 233-260.
[55] Kumari, P. and B. Priya, Organizational Commitment: A Comparative Study of Public and Private Sector Bank Managers,
International Journal of Business and Management Invention, 6(1), 2017, 38-47. [56] Shukla, R., S. Sharma, and V.M. Thumar, Role and importance of public private partnerships in agricultural value chain and
infrastructure, International Journal of Commerce and Business Management, 9(1), 2016, 113-118.
[57] Gorane, S. and R. Kant, Supply chain practices and organizational performance: An empirical investigation of Indian manufacturing organizations, The International Journal of Logistics Management, 28(1), 2017, 75-101.
[58] Ghoseiria, K., F. Szidarovszkya, and M.J. Asgharpour, A multi-objective train scheduling model and solution, Transportation
Research Part B: Methodological, 38(10), 2004, 927–952. [59] Cepolina, E.M. and A. Farina, A new urban freight distribution scheme and an optimization methodology for reducing its overall
cost, European Transport Research Review, 7(1), 2015, 20–30.
[60] Lam, J.S.L. and X.W. Bai, A quality function deployment approach to improve maritime supply chain resilience, Transportation Research Part E: Logistics and Transportation Review, 92, 2016, 16-27.