The Local Costs of Establishing Protected Areas in Low ... · Ranomafana National Park, Madagascar...
37
The Local Costs of Establishing Protected Areas in Low-Income Nations: Ranomafana National Park, Madagascar Environmental Policy Working Paper Series #2001-006 Paul J. Ferraro Department of Economics Andrew Young School of Policy Studies Georgia State University University Plaza Atlanta, GA 30303-3083 (T) 404-651-1372; (F) 404-651-0425 [email protected] * The author gratefully acknowledges the field support of Basile Rakotondrajaona, Lon Kightlinger, Patricia Wright, and UNESCO’s Man and the Biosphere Program. The author also thanks Paul Hanson, Sabrina Hardenbergh, Bruce Johnson, Robert Kellison, Randy Kramer, Robert Healy, Evan Mercer, Joseph and Dai Peters, Daniel Razafimamonjy, Kristin Rowles and Dan Turk for comments on the original survey and earlier versions of this paper. Special thanks to the myriad residents of the Ranomafana region for opening up their homes to incessant questions and observations.
Transcript of The Local Costs of Establishing Protected Areas in Low ... · Ranomafana National Park, Madagascar...

The Local Costs of Establishing Protected Areas in Low-Income Nations:
Ranomafana National Park, Madagascar
Environmental Policy Working Paper Series #2001-006
Paul J. Ferraro
Department of Economics Andrew Young School of Policy Studies
Georgia State University University Plaza
Atlanta, GA 30303-3083 (T) 404-651-1372; (F) 404-651-0425
* The author gratefully acknowledges the field support of Basile Rakotondrajaona, Lon Kightlinger, Patricia Wright, and UNESCO’s Man and the Biosphere Program. The author also thanks Paul Hanson, Sabrina Hardenbergh, Bruce Johnson, Robert Kellison, Randy Kramer, Robert Healy, Evan Mercer, Joseph and Dai Peters, Daniel Razafimamonjy, Kristin Rowles and Dan Turk for comments on the original survey and earlier versions of this paper. Special thanks to the myriad residents of the Ranomafana region for opening up their homes to incessant questions and observations.

Costs of Conservation
iThe Local Costs of Establishing a Protected Area:
Ranomafana National Park, Madagascar Abstract
Over the last twenty years, governments and influential donor organizations have come to
realize that the long-term integrity of protected areas in low-income nations depends critically
upon the support of rural communities that live adjacent to them. Despite the recognized need
for understanding the opportunity costs of conservation borne by rural communities adjacent to
protected areas, there exist few quantitative analyses of the local effects of protected area
establishment. Using a unique household data set from southeastern Madagascar, I estimate the
opportunity costs borne by residents resulting from the establishment of the Ranomafana
National Park in 1991.
I conservatively estimate the present value of the opportunity costs to be $3.37 million.
The costs are not distributed evenly across households around the park. The average present
value of costs per household in four zones around the park ranges from $353 to $1,316. These
values translate into annual costs per average household of $19 to $70 over a sixty-year horizon.
The paper also characterizes other costs that were not amenable to empirical estimation.
Relative to household incomes in the region, the opportunity costs of conservation are
substantial. Relative to the national and global benefits from protecting the rain forests of
Ranomafana, however, the costs are quite small and the analysis offers hope that government
agencies and international donors can design conservation plans that benefit both endangered
ecosystems and the welfare of local communities.
Key Words: Conservation; Opportunity Costs; Protected Area

Costs of Conservation
1
I. Introduction
In the 1980s, governments and influential donor organizations came to realize that the
long-term integrity of protected areas in low-income nations depended critically upon the support
of rural communities that lived adjacent to them (Anderson and Grove, 1987; Kiss, 1990; West
and Brechin, 1991; Brandon and Wells, 1992; Ryan, 1992). Field observations from
conservation projects throughout the developing world suggested that the establishment and
management of protected areas had substantial negative effects on the livelihoods of residents
who lived in and around protected areas and thus undermined local support for conservation
(e.g., West and Brechin, 1991; Hough, 1991; Kiss, 1990; Anderson and Grove, 1987; Sahama,
1984).
Many academics and practitioners have therefore argued that detailed ex ante
assessments of the local impacts of protected area establishment are a critical missing component
in the debate over international conservation policies (Garrat, 1984; Dixon and Sherman, 1990;
Ghimire, 1991; Hough, 1991; Winterbottom 1991; Brown and Wyckoff-Baird, 1992; Geisler,
1993). Without such assessments, it is impossible to discuss the costs and benefits of ecosystem
protection in a global context. As Kramer and Sharma (1997) have noted, just as the failure to
measure the total benefits of biodiversity protection can lead to suboptimal development policies,
the failure to measure the full costs of protection may lead to unworkable conservation strategies.
Scientists and practitioners have written hundreds of articles and books documenting the
costs of environmental regulations in high-income nations (recent examples include Berman and
Bui (2001) and Lovell and Sunding (2001)). In the context of ecosystem protection in low-
income nations, however, relatively little has been written on the nature and magnitude of the
costs of protected area establishment. Most of what has been written has been anecdotal or non-
Costs of Conservation
2
quantitative with an emphasis on social impacts (e.g., Gordon, 1985; Croft, 1991; Agrawal et al.,
1981; Bunting et al., 1991; Schoepf, 1983; Freeman and Frey, 1986; Schelhas, 1991; Payne et al.,
1992; Novellino, 1998). There is a dearth of quantitative data on the costs borne by local
residents when protected areas are established in low-income nations.
Ruitenbeek (1992) used survey data to estimate the opportunity costs to local residents
from the existence of a national park in Cameroon. Azzoni and Isai (1994) used secondary data
sources to estimate the opportunity costs of conservation in Sao Paulo, Brazil over a sixty-year
time horizon. Norton-Griffiths and Southey (1995) used coarse aggregate data to estimate the
opportunity costs of ecosystem conservation in Kenya for a single year. Shyamsundar and
Kramer (1996) used contingent valuation techniques to estimate local resident willingness-to-
accept restricted resource access associated with the establishment of a national park in
Madagascar. Kremen et al. (2000) used simple assumptions (based on extensive practitioner
knowledge) to estimate the opportunity costs of foregoing industrial logging and hillside
agriculture inside a newly designated protected area in Madagascar.
My analysis contributes to this sparse literature in several important ways: (1) I use a
combination of household surveys and semi-structured interviews to acquire detailed data on
resource use and management that existed prior to the establishment of a protected area;1 (2) I
use data on forest use for agriculture and for timber and nontimber forest products (e.g., Norton-
Griffiths and Southey had data on foregone agricultural benefits only); (3) I estimate the
opportunity costs over time, not just for one year; and (4) I characterize costs both quantitatively
and qualitatively.
1 Most protected area impact assessments have been conducted post facto with no “pre-park” baseline data (see Geisler (1993) for survey).
Costs of Conservation
3
The next section describes the study site. Section III describes the data collection
methods. Section IV develops the basic conceptual model that provides the analytical basis for
the quantitative and qualitative analyses of later sections. Section V describes the assumptions
made in the empirical analysis. Section VI presents the results of the empirical analysis. Section
VII describes the other costs, as well as some potential benefits, that I was unable to quantify
given the data available.
II. Study Area
Madagascar provides an appropriate context in which to study the local impacts of
protected area establishment. The country is a high priority for global biodiversity protection
(Mittermeier et al., 1998), it has experienced high rates of deforestation and resource depletion
(Green and Sussman, 1990), and it has recently completed the first two phases of its ambitious
fifteen-year National Environmental Action Plan, which has lead to a substantial increase in the
number of strictly protected areas.2
Biological species diversity in Madagascar is concentrated primarily in the eastern rain
forests (Rakotozafy et al., 1987), of which only one-third of the original area exists (Green and
Sussman, 1990). The human communities of the eastern rain forests are rural and almost
exclusively agricultural. Residents depend upon forest resources for subsistence and commercial
activities. In particular, the forests provide land and biomass for a system of swidden agriculture
called tavy, as well as providing myriad timber and non-timber forest products.
2 Before 1989, there were only two national parks in Madagascar. In 2001, there were twelve. The recent emphasis on “eco-regional conservation” in Madagascar encourages protection of even larger areas from extractive activities (Freudenberger and Freudenberger 2000).

Costs of Conservation
4
Madagascar's Environmental Action Plan gave highest priority to the preservation of the
Ranomafana rain forest along the southeastern escarpment of Madagascar because of the forest’s
exceptionally high level of biological diversity and the immediate threat of human activity. In
May 1991, the Government of Madagascar established the 41,600-hectare Ranomafana National
Park (RNP) in order to conserve the area's ecosystems. The immediate area around the park
(within 5 km) is a mosaic of paddy rice fields, hillside agricultural plots, regenerating forest
fallow, and, in some areas, relatively intact rain forest. At the time of the park’s establishment,
there were about 26,000 people living in over one hundred villages within a five-kilometer radius
of the RNP’s boundaries. About half of the villages were small, containing one-hundred and
fifty people or less.
III. Data Collection3
From September 1990 through March 1991, I collected data on natural resource
exploitation in 22 villages and towns within three kilometers of the proposed borders of the RNP.
A little over 490 households in 17 villages completed an administered questionnaire, while more
than 300 people from the region took part in semi-structured interviews. 4 The household
questionnaire documented forest use, agricultural activities and socio-economic indicators. The
semi-structured interview covered topics such as village history, land tenure, forest use and
agricultural activities, among others. The interview was designed to complement the household
3 More details of the data collection methodology, including copies of the survey instruments, and the results, including household wealth indicators, measures of input and output value, agricultural practices, socio-political institutions, resource tenure and the specific species of flora and fauna used, can be found at http://eppserver.gsu.edu/pferraro. The collection and interpretation of data benefited greatly from the substantial assistance of Basile Rakotondrajaona. 4 The major difference between a semi-structured interview and a formal questionnaire is that the former uses a list of topics rather than a carefully prepared questionnaire (see Fox (1989) or FTTP (1991)).

Costs of Conservation
5
questionnaire by putting the quantitative information from the survey into context. It also served
as a means to examine the variety of opinions across age, gender, power and economic
categories. The total population covered by the questionnaire and interviews was over 2800
individuals. Data collection also included informal discussions with many other residents and
visual observations of natural resources collected and traded in the region.
The household survey was part of a larger health and socio-economic household survey
administered by a trained non-governmental team of nurses, which was overseen by Dr. Lon
Kightlinger, a parasitologist with over twenty years of experience working in Madagascar. In
addition to administering the survey, the team, which also included a medical doctor, provided
health services. The team’s dual role reduced the potential bias in respondent answers that may
have been engendered if residents perceived the survey to be a ploy by the government to restrict
their rights of resource access. The resource use questions were embedded among other
behavioral and consumption questions geared towards health-related research.
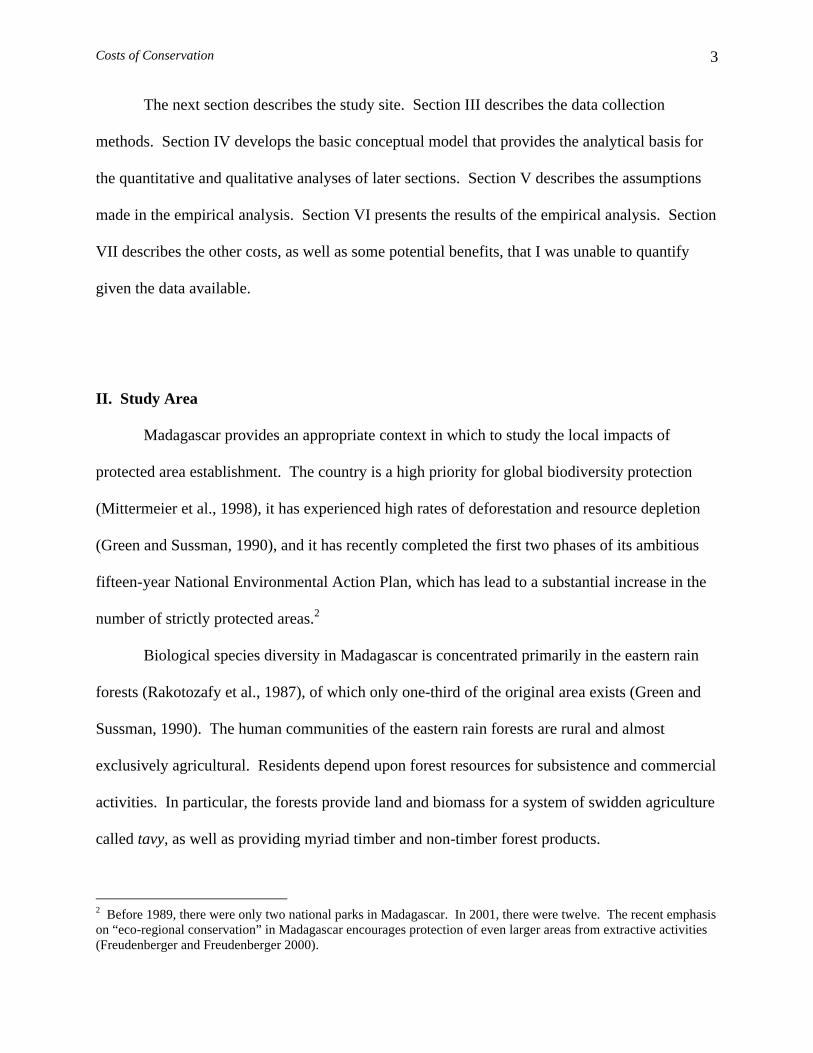
The surveyed region was divided into 4 zones (see Figure 1). These zones were chosen
to include all areas that were inhabited around the park and corresponded to ecological,
economic and cultural divisions in the region. Limited data (one village survey and discussion
with local forestry personnel) concerning the heavily deforested region about forty minutes east
of Ranomafana by car were also collected in order to make inferences about likely resident
responses to resource degradation over time had the park not been established.
IV. Modeling Approach
Farm households in the Ranomafana region combine features of both consumers and
producers. A farm household is assumed to maximize its utility, which is a function of

Costs of Conservation
6
consumption of market-purchased goods not produced by the household, agricultural goods
produced by the household, secondary forest products collected by the households, primary
forest products collected by the household, and leisure (see Ferraro (1994) for formal
mathematical model).
Figure 1 – Ranomafana National Park and Survey Zones (I-IV) (sources: left map, Association de Gestion des Aires Protégées; right map, Center for Conservation Biology, Stanford Univ.).
The RNP’s regulations permit only research and tourism activities within its boundaries
and thus lead to a substantial decrease in the amount of forest accessible to local residents for
productive purposes. The empirical analysis (Section V) estimates changes in full income that
arise because of the RNP’s establishment. Full income is the value of the household's time
endowment plus the value of the household's production (i.e., agriculture, forest product
I
IV
II
III

Costs of Conservation
7
collection) less the value of the variable inputs required for production of outputs (Singh et al.,
1986). Full income is assumed to equal a household’s expenditures on the items it consumes
(expenditures include both explicit and implicit costs). A decrease in the availability of forest (a
fixed input that is combined with labor to produce outputs) will result in lower full income and
hence lower consumption of the variables in the utility function. Lower consumption results in a
loss of utility, which will be perceived as a cost by local residents.
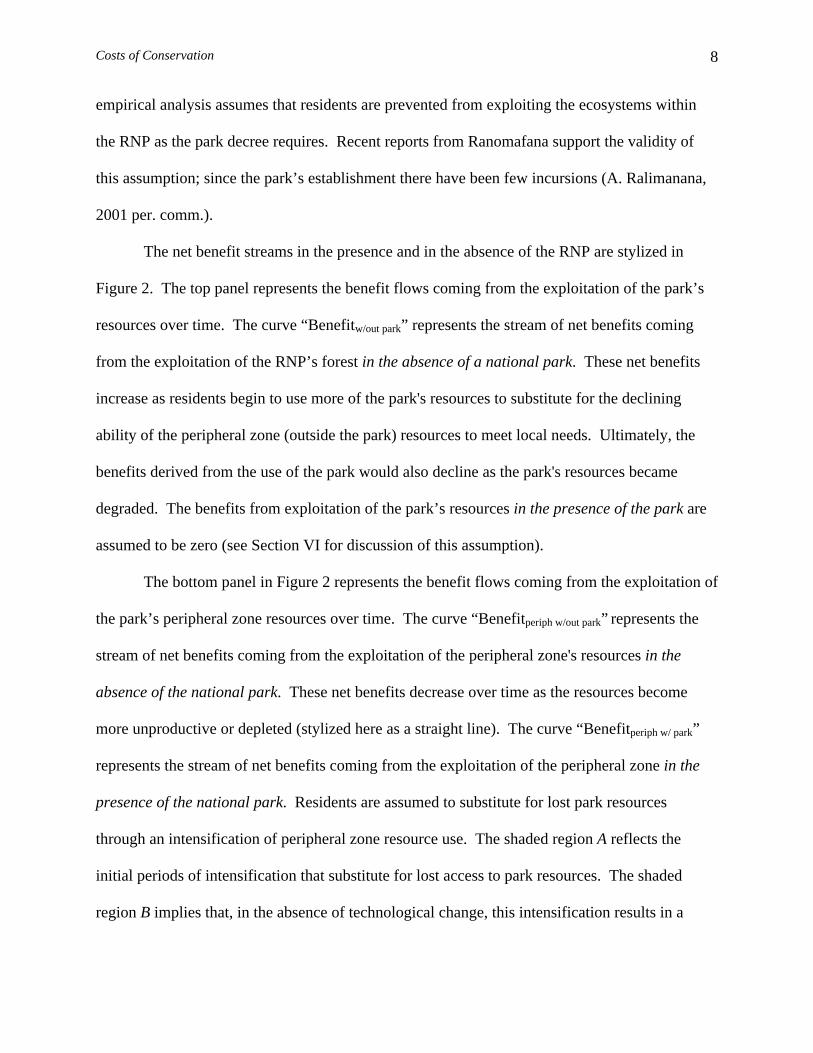
Figure 2 - Net Benefit Flows With and Without the Park
Changes in household full income are approximated indirectly by estimating the foregone
net benefits that the households would have derived had the park not been established.5 The
5 If a well functioning land market existed in the RNP area, the costs to local residents could be approximated using the price of land. However, there is neither a well functioning land market in Ranomafana nor would such a market necessarily capture the total costs to residents. Given the private property rights regime governing agricultural benefit flows and the common property regimes governing forest product collection, land prices would most likely be based solely upon the stream of agricultural benefits from the land, rather than the combined benefits derived from agriculture and forest products.
$ C D 0 0 Time $
0 0 T* Time
A Benefitperiph w/park
Benefitperiph w/out park B
Benefit w/out park
Costs of Conservation
8
empirical analysis assumes that residents are prevented from exploiting the ecosystems within
the RNP as the park decree requires. Recent reports from Ranomafana support the validity of
this assumption; since the park’s establishment there have been few incursions (A. Ralimanana,
2001 per. comm.).
The net benefit streams in the presence and in the absence of the RNP are stylized in
Figure 2. The top panel represents the benefit flows coming from the exploitation of the park’s
resources over time. The curve “Benefitw/out park” represents the stream of net benefits coming
from the exploitation of the RNP’s forest in the absence of a national park. These net benefits
increase as residents begin to use more of the park's resources to substitute for the declining
ability of the peripheral zone (outside the park) resources to meet local needs. Ultimately, the
benefits derived from the use of the park would also decline as the park's resources became
degraded. The benefits from exploitation of the park’s resources in the presence of the park are
assumed to be zero (see Section VI for discussion of this assumption).
The bottom panel in Figure 2 represents the benefit flows coming from the exploitation of
the park’s peripheral zone resources over time. The curve “Benefitperiph w/out park” represents the
stream of net benefits coming from the exploitation of the peripheral zone's resources in the
absence of the national park. These net benefits decrease over time as the resources become
more unproductive or depleted (stylized here as a straight line). The curve “Benefitperiph w/ park”
represents the stream of net benefits coming from the exploitation of the peripheral zone in the
presence of the national park. Residents are assumed to substitute for lost park resources
through an intensification of peripheral zone resource use. The shaded region A reflects the
initial periods of intensification that substitute for lost access to park resources. The shaded
region B implies that, in the absence of technological change, this intensification results in a

Costs of Conservation
9
more rapid decline in fertility and loss of secondary forest products and services compared with
the no-park scenario (i.e., a more rapid approach to a non-productive state). The assumption of
little or no technological change over time is reasonable given: (1) the historically low level of
technological improvement in the RNP area, (2) the low level of technological improvement on
lands further east that have already undergone a rapid degradation of available resources, and (3)
the lack of government extension services in the region. The acceleration of degradation resulting
from intensification of lands formerly covered with rain forest is well documented in eastern
Madagascar (Razafimamonjy, 1987).
Thus, with the establishment of the RNP, the residents lose the shaded areas of B, C, and
D, and gain A in Figure 2. The opportunity costs of establishing the RNP are the present value
of (C + D + B – A), or −+ ∫∫∞ −∞ − dttBenefitedttBenefite parkoutwperiph
tparkoutw
t
0 /0 / )()( δδ
dttBenefite parkwperipht∫
∞ −
0 /)(δ , where δ is the discount rate. The first and second integral can be
estimated with the data available. Estimating only the foregone consumption of resources within
the park (i.e., the first integral) could underestimate or overestimate the total opportunity costs,
depending on the residents' ability to substitute for the lost resources (present value of A) and the
effect that the intensification of resource use has on the longevity of the peripheral zone
resources' productive capacity (present value of B). Estimating the third integral, however, is
more difficult. One must predict how resource use in the peripheral zone would change after the
park is established. In particular, this calculation requires data on the likely substitutions to take
place and the effect that these substitutions will have on the long-term productivity of the
peripheral zone resources. Although it has been 10 years since the RNP was established, there
has been no comprehensive follow-up survey to characterize the changes in resource use since

Costs of Conservation
10
the park’s establishment. The empirical analysis will therefore not attempt to estimate the
second and third integrals. If one were to assume that that the sum of the second two integrals is
greater than or equal to zero, the cost estimates in Section VI are lower-bound estimates.
V. Modeling Assumptions
The data consist of (1) the author's point estimates of resource use during the 1990-91
agricultural calendar based on household questionnaires and semi-structured interviews, (2)
resident-revealed historical trends, (3) observations of resident behavior across varying gradients
of ecosystem disturbance, and (4) observations of residents in areas further east of the RNP that
have already undergone almost complete deforestation. The main parameter values used in the
empirical analysis are summarized in the appendix.
There is much uncertainty regarding future resource use patterns in the absence of the
park. In order to mitigate the effects of uncertainty on the analysis, I use conservative parameter
assumptions that likely result in an underestimation of the true costs. I also analyze the
sensitivity of the results to changes in the assumed parameter values.
The assumed parameter values take resource use in 1990-91 as the point of reference.
During this time, however, much of the forest outside the villages' designated agricultural
perimeter was designated as forêt classée (classified forest) in which agricultural use and timber
harvesting were regulated by a system of permits (the degree to which the regulations were
enforced varied spatially and temporally). Given the existence of forest use regulation prior to
the RNP's establishment, it could be argued that if the purpose of the empirical analysis were to
estimate the full costs of conservation to local residents, then one must also consider the

Costs of Conservation
11
additional costs that were created through the existing system of forest regulation. The empirical
analysis in the next section only measures the costs of changing the status of the regional forest
from forêt classée to national park (i.e., the costs of replacing a system of limited protection with
a system of total protection).
VI. Empirical Results
a. Costs Per Average Household
The cost estimates in Malagasy francs (FMG) and in U.S. dollars ($) for the population in
each zone within a 5 km belt around the RNP are presented in Table I. I assume a 5% discount
rate, a 1900 FMG/$ exchange rate (May 1991 nominal rate), a sixty year time horizon, the
deforestation rates presented in Table A1 in the appendix and a 2.5% population growth rate (see
appendix for justification of these parameter values). The present value of the opportunity costs
to residents around the RNP is estimated at 6.4 billion Malagasy francs, or $3.37 million. The
average costs per household are $39/year.6
Although there is no one item in the forest whose loss would significantly affect the
average household, the sum total of the value of all the products is substantial. Readers from
high-income nations may not consider the costs reported in Table I to be high, but one must view
them in the context of the low incomes in the RNP region. In 1990, the average annual GNP per
capita in Madagascar was $200 (UNICEF, 1992). Historically, the region around the RNP has
had lower than average incomes in comparison with other regions in Madagascar (Francois et al.
1967, cited in Pryor, 1990). If it were assumed that annual full income per capita for the 6 My estimate is close to the $50/year mean willingness-to-accept estimate obtained by Shyamsundar and Kramer (1996) using contingent valuation in communities around a park north of Ranomafana. The 95% confidence interval on their estimate ranged from $10 - $90.

Costs of Conservation
12
average resident in the RNP region was $200, the average annual costs per capita ($6.70)
account for over 3% of the annual full income per capita. The range varies across zones from
1.5% to almost 6%.7 Shyamsundar and Kramer (1996) estimate that annual household full
incomes in an area of rain forest north of Ranomafana were $279, which would imply costs equal
to 14% of household full income on average (range = 7% - 25%).
Samuel and Rambeloson (1991) estimate that annual cash revenues to the average
household in the firaisina (county) of Ranomafana amounted to $50 - $60/ year (1900 FMG/$).
If $50/year were assumed to be the cash revenues for the average household around the park, the
annual opportunity costs for all zones combined, which are full income values, vary from 37% to
7 If an individual were to find full employment at peak wages (2400 FMG/day) in the region, s/he would receive about $325/year (1900 FMG/$). Given that few adults in the region, much less children, could find such steady work, $325 is an upper bound on annual per capita income.
Table I - Total Costs
Zone Population Total NPV (FMG) Total NPV
($)
Annual Costs
Per Household
Western 6879 735,724,880 387,224 $19
Central 5219 1,977,433,762 1,040,755 $64
Southeastern 1858 769,435,924 404,966 $70
Northern 11,646 2,923,696,037 1,538,787 $35
All Zones 25,602 6,406,290,602 3,371,732 $39
• Based on a 5% discount rate, a 60 year time horizon, and a 1900 FMG/$ exchange rate. Figures are rounded up to avoid decimals.

Costs of Conservation
13
139% of total household cash revenues. Thus, it appears that although the costs may be small in
an absolute sense, they are not negligible relative to current incomes in the region. Given that
many residents currently are at or near their minimum full income requirement, and that the costs
in Table I are likely to be underestimates, the RNP is more detrimental to resident welfare than
the values in Table I suggest.
Table I does not include one other quantifiable cost stream that is incurred by local
residents after the establishment of the RNP. The establishment of the RNP resulted in the
cessation of new timber concessions in the park, which caused a loss of future employment
opportunities for residents, estimated at $23,685 in annual salaries.8 The cessation of concessions
also generated a loss of profits to concession owners, many of whom live in the region, estimated
at $842,105.9
The results in Table I indicate that the magnitudes of the opportunity costs vary across
zones. Households in the central and southeastern zones incur more costs than households in the
northern and western zones. The composition of the opportunity costs also varies. In some
zones, like the west, lost forest products make up the majority of the costs. In other zones, like
the southeast, lost access to biomass for tavy makes up most of the costs. Variations across
zones are a function of variations in market and wage opportunities (e.g., good market access in
central zone), access to primary forest (e.g., good access in southeastern zone), ecosystem
characteristics (e.g., lower biomass for tavy in west) and cultural characteristics. Regional
8 Residents were paid approximately 1800 FMG to carry each beam out of the forest. If commercial operations were to cut 500 ha/year, and it is assumed that 50% of the carriers are residents, approximately 50,000 beams would be cut and about 45 million FMG in salary would be paid annually to residents. 9 It is assumed that 10,400 ha of the park (25%) is exploitable. The net benefits per hectare are calculated using a gross benefit per hectare of 1,000,000 FMG for the exploitation of only two genus (Dalbergia spp. and Ocotea spp.; based on documents obtained from the national office of the Departement des Eaux et Forêt). Costs are estimated at 850,000 FMG/ha (an average of costs for regions close to the road and for those far from the road). A 0% discount rate is used because the timing of the exploitation is unknown.
Costs of Conservation
14
differences in opportunity costs and their composition may indicate priorities for internationally-
funded conservation and development activities around the RNP.
b. Sensitivity Analysis
In this section, I examine the degree to which the results presented above are dependent
on the assumptions made. As in most empirical analyses, the choice of the discount rate has an
important effect on the calculated values. Decreasing the discount rate to 3% increases the costs
by 75%. Increasing the discount rate to 8% lowers the costs by 45%. Increasing the discount
rate to 10% lowers the costs by 61%. If one assumed that an appropriate discount rate lies
between 3% and 10%, the total opportunity costs to residents would lie between $1.39 million
and $5.87 million. The discount rate also plays a large role in determining the relative
contributions of forgone tavy benefits and forgone forest product benefits to the total costs. As
the discount rate increases, the relative importance of the foregone net benefits from forest
product collection increases.
The choice of the exchange rate does not affect the value of costs as measured in
Malagasy francs, but it does affect the dollar value of the costs. I chose to use the 1991 nominal
exchange rate of 1900 FMG/$ in order to be able to interpret the results as the actual transfer
necessary to compensate residents in 1991 for their losses. AIRD (1992) used a 2000 FMG/$
exchange rate to approximate the real exchange rate in Madagascar in 1991, which would
decrease costs by only 5%. Kramer et al. (1994) used an exchange rate of 1111.8 FMG/$ based
on a conversion that accounts for differences in the purchasing power of residents in Madagascar
and the U.S. Using the Kramer et al. exchange rate increases the cost in dollars by 71%.

Costs of Conservation
15
Decreasing the population growth rate to 1% decreases costs by 12%. Increasing the
growth rate to 3% increases costs by 10%. Given historical population growth rates and the fact
that more than 50% of the current population is under the age of 18 years old, it is very unlikely
that the annual population growth rate used in this analysis (2.5%) is too low.
Changes in the deforestation rate or the value of net benefits to tavy production affect the
cost estimates in the same way. If the deforestation rates were cut in half, the opportunity costs
for all zones combined would decrease by 34%. If the rates were increased by 50%, the costs
would increase by 26%. Forest product collection levels within the RNP were held constant in
the analysis, but if collection levels were to increase at the rate of population growth, then the
total opportunity costs for all zones combined increases by 27%. If it were assumed that only
the population in a 3 km belt around the RNP (16,839) would be affected by the park's
establishment, the opportunity costs decrease by 29%. Extending the time horizon to 2075 A.D.
increases the total costs by 8%. Reducing the time horizon by 25 years, decrease the total costs
by 19%.
The value of labor was calculated based on the timing of each activity. If one were to
value all labor allocated to tavy agriculture in each zone at the peak wage rate (2400 FMG/day),
the total costs decrease by 26%. If one also were to use peak wages to value the labor allocated
to the collection of forest products, the total costs decrease by another 28%. If one lowered the
wage rate for both tavy and forest production collection to the lowest observed wage of 650
FMG/day, the opportunity costs increase by 32%.
If the estimated crop yield under tavy production were increased or decreased by 25% in
each zone, the opportunity costs would change by 23%. If the estimated quantities of forest
products collected inside the RNP were increased or decreased by 25%, the opportunity costs

Costs of Conservation
16
would change by 11%. If all crop prices were reduced or increased by 25%, the opportunity
costs would change by 23%. If all forest product prices were reduced or increased by 25%, the
total value for all zones combined would change by 18%.
In addition to the sources of error examined above, the manner in which the data were
collected may also have affected the cost estimates. For example, in the northern zone, no
villages less than two kilometers from the park were surveyed. Residents of villages closer to
the park were more likely to use park resources. Given the large number of residents in this zone,
underestimation of these costs may significantly affect the overall results. For example, an
increase of 0.001 ha/capita in the northern zone deforestation rate and a 10% increase in the net
benefits from forest product collection increase the total costs in the northern zone by 21% and the
total costs for all zones combined by 10%. Other sources of bias are described in Ferraro (1994)
and, in general, suggest that the opportunity costs presented in Table I should be interpreted as
underestimates of the true opportunity costs to residents from the establishment of the RNP. The
next section examines potential costs that are more difficult to quantify, but which ought to be
considered when examining the effects of the RNP.
VII. Other Costs and Benefits
a. Distributional Aspects of Costs
The results in Section VI demonstrate that the costs to residents vary across zones.
Residents within these zones, however, are not a homogenous group. Within each zone, there
are variations in resource use and thus, there will be variations in costs. There may be intra-
zone, intra-village and intra-household differences in the costs incurred by residents, and these
Costs of Conservation
17
variations should be noted. For example, there are two villages in the western zone, Vohiparara
and Sahavondronana, whose residents are heavily involved in the commercial sale of crayfish
and eels. The value of their losses is more like that of residents in the central zone than that of
their neighbors in the western zone. The average household in these two villages loses a net
present value of $1,014 or $54/year. The total cost for these two villages is $59,815, 93% of
which is derived from the use of forest products. Thus the values presented in Table I mask
substantial variations in the costs to residents in each zone.
The focus on average households in the analysis also conceals the distributional aspects
of the RNP's effects within villages. Some residents depend substantially on the collection of
forest products from the park area for income generation during the food deficit period. During
this period, households will become more dependent on high-interest consumption loans while
their means to repay the loans declines. The establishment of the RNP will particularly hurt
poorer households and their descendants because they have little or no access to irrigated rice
paddies and hillside land that can substitute for restricted access to park resources. These
households and their descendents depend heavily on the "frontier" outside the agricultural
perimeter for their survival. The household data also suggest that wild sources of food and
income typically account for a larger share of household income among the poor than among
rich.
The costs are also likely to be spread unevenly across age classes. Older residents (50+
years) often prefer to engage in tavy because it involves less labor investment and because the
work effort is not as strenuous as irrigated paddy work. Households led by younger residents
often depend on tavy outside the agricultural perimeter to meet their income need because they

Costs of Conservation
18
have not yet received land through inheritance. Thus even within a village, different groups of
residents will be affected in different ways.
In the empirical analysis, the household is the unit of analysis. However, studies have
shown that, for many decisions, the household should not be treated as a homogenous unit.
Dianzinga and Yambo (1991) have shown that the loss of access to forests affects men and
women in different ways. Few data exist on individual preferences and the allocation of
resources within households in the RNP region. Anecdotal observations, however, suggest that
intra-household effects may be important. For example, men tend to be involved in tavy and
forest product collection deep in the forest. In order to compensate for the loss of access to
forest resources in the park, households will need to invest more in irrigated rice paddies and
gardens near villages and in the production of homemade crafts, activities in which women are
the primary laborers.
b. Health Costs
The establishment of the RNP will affect resident health by affecting the nutritional
composition of their diet. For example, the loss of wild protein sources (e.g., 67% of households
reported collecting crayfish) will affect health negatively since residents already consume
minimal amounts of protein (Hardenbergh, 1993). Samisoa (1992) found that residents in the
Ranomafana region depended on cash income to purchase supplemental staples, oils and fats.
The loss of income from commercial sale of forest products (e.g., 16% of households reported
selling crayfish) will make it more difficult for households to make these purchases.
Changes in cropping patterns in the peripheral zone will also affect nutrition in the area.
First, residents will substitute irrigated rice for tavy rice. This substitution is being encouraged

Costs of Conservation
19
by development initiatives associated with the RNP (RNPP 1996). In Madagascar, Ralambofetra
et al. (1986) and Ralambofetra and Rakotovao (1985) found that hillside rice had more protein
and more calcium than rice from irrigated paddies. Second, intensification without technological
change will lead to fertility decline in the peripheral zone over time. As fertility declines,
households are less likely to plant nutritious, but nutrient-demanding crops such as rice, and
more likely to plant less nutritious, but less nutrient-demanding crops such as manioc or sweet
potato. Hardenbergh (1993) has also found that the quality of the diet deteriorates in the RNP
region when other staples are substituted for rice because of the ways in which residents
traditionally combine foods in meal preparation.
The establishment of the RNP will also affect the residents' health by affecting access to
medicinal plants and health services. Indigenous healers obtain many of their plants inside the
dense forests. The loss of cash income as a result of the RNP reduces a household's ability to
seek medical care from indigenous healers, government clinics and private pharmacies, all of
which require payment. Although most medicinal plants used for self-treatment come from the
secondary forest and scrub, there are some plants that come from dense forest in the park. More
importantly, the intensification of agriculture and forest product collection in the peripheral zone
will tend to increase the scarcity of the desirable medicinal plants for self-treatment.
c. Social and Cultural Costs
Residents in the RNP region are very concerned with the fostering of firaisina (union),
fihavanana (family) and firaisankina (solidarity). Community harmony is extremely important
to because it fosters mutual assistance and security. Any breakdown in social relations can lead
to economic losses if households are no longer able to work together to take advantage of

Costs of Conservation
20
economies of scale or risk-pooling behavior. In some regions of the world, traditional patterns
of authority, reciprocity and social bonds break down in the presence of a protected area that
deprives residents of significant resources (Calhoun, 1991). In semi-structured interviews,
residents noted that such changes were already occurring in some villages before the RNP’s
establishment, and it is likely that the RNP's establishment will only exacerbate the changes
(e.g., frequent borrowing from richer neighbors disrupts community harmony).
The increase in resource scarcity from the RNP's establishment may also affect resource
tenure regimes in the region. Residents manage forest products coming from secondary forests
around the village under a common property rights regime. The establishment of the RNP, and
its concomitant decrease in the supply of forest products, will increase pressure towards the
privatization of secondary forest benefit streams. Such a change in property rights would
negatively impact land-poor households who depend upon the secondary forests of other
households to collect needed forest products. In particular, single women with children in the
RNP region depend upon resources on other residents’ land to meet their income needs.
d. Exposure to Risk
For many residents, intensification on irrigated rice paddies will substitute for foregone
tavy yields in the RNP. However, one of the main resident-revealed advantages of tavy is the
ability to plant several crops with staggered maturation dates in a single parcel. The differences
in maturation dates help residents smooth out their intertemporal income flow. Residents are
unable to do substantial intercropping on irrigated lowlands.
An increase in residents' dependence on rice paddies also exposes risk-averse residents to
greater production risk from cyclones, which affect irrigated rice paddies more than tavy plots.
Costs of Conservation
21
Cyclones not only reduce income by damaging each household's crops, but they can also
negatively impact households by raising prices. Because of the existence of covariate production
risk over the southeastern region, one household's poor harvest would be correlated with
diminished aggregate supply and subsequent higher prices.
Substitution in the peripheral zone will also take place through more extensive use of
hillsides. In the presence of land scarcity, households in southeastern Madagascar use hilltops
for agriculture more frequently. Not only is production lower on these parcels, it is also more
variable because of the parcels' exposure to the elements (especially wind). The decrease in
peripheral zone fertility over time will also increase the demand for planting manioc, which
needs fewer nutrients to grow than most other crops. In some regions, like the eastern central
zone, the planting of large areas of manioc is risky because of likely destruction by bush pigs.
Resident exposure to risk is compounded by restricted forest access. Typically the forest
is a potential resource for substitution when crops fail. The reduction in the regional supply of
forest products will increase the risks associated with crop failures, and for poor households, it
will increase the probability of falling below the minimum income requirement.
e. Benefits to Residents from the RNP
The establishment of the RNP may also result in benefits for resident communities,
including benefits from tourism, watershed protection, and micro-climate control. In the decade
since the park was established, however, the benefits from tourism have proven to be seasonal
and have been captured by a relatively small subset of the population located near the main road,
many of whom were not born in the region. Such outcomes from tourism have been shown to
occur near many protected areas around the world (Olwig, 1980; Wells and Brandon, 1990;

Costs of Conservation
22
Woo, 1991; Lindberg et al. 1996; Wallace and Pierce 1996; Campbell 1999). Sharing the
revenues from park entrance receipts may be one way to more fully distribute benefits from
tourism to residents.10
Even if the benefits from tourism were large and widely distributed, there are also
possible costs associated with tourism. Rao and Geisler (1993) noted that tourism often
encourages migrants to come to the area and out-compete members of the resident population for
jobs. Upreti (1985) and Mishra (1982) have documented costs associated with increases in the
price of market goods in areas frequented by tourists. Most farmers in the RNP region (~70%)
are net buyers of agricultural products and thus price increases are likely to have negative effects
on household welfare.
The ecological benefits to local residents from protection of the RNP’s forest cover are
difficult to quantify. Because many of these benefits are long-term and diffusely distributed,
residents may not recognize them as benefits. Moreover, the acceleration in peripheral zone
degradation resulting from RNP's establishment may result in a number of localized ecological
costs in the region, such as increases in iron toxicity from sediment runoff in irrigated paddies.
Thus, although ecological benefits to local communities from the park’s establishment benefits
should be included in a total cost-benefit analysis, they may not mitigate residents’ perceptions
of their opportunity costs.
One final potential benefit warrants mention. In 1991, the United States Agency for
International Development awarded Duke University and the Government of Madagascar $3.237
million to begin improving the management of natural resources inside and outside of the RNP.
The Government of Madagascar contributed another $29,000 and other participating 10 In 1996 the RNP was one of the most popular parks in Madagascar and received about 6000 tourists (Vieta, 1998), but a majority of visitors were Malagasy nationals who paid less than $1 to enter the park (foreigners paid 50,000 FMG, which was about $12 in 1996).
Costs of Conservation
23
organizations contributed $654,000 (USAID/Madagascar 1991). The goal of the project was to
integrate the economic development of local communities with the conservation of natural
resources inside and outside of the park, thereby engendering local conservation support for the
RNP (Duke University, 1990). If one were to assume that 5% of the funds money would be
spent on administration, $3.724 million dollars would remain to mitigate the negative effects of
the RNP’s establishment. Given the cost estimates in Sections V, the funds available would
seem to be sufficient for engendering local conservation support.
Unfortunately, reviews of the project’s performance do not indicate that the local
population realized large benefits. Joseph Peters, former Conservation Technical Consultant
with the Ranomafana National Park Project, estimated that less than 2% of the Ranomafana
National Park Project’s budget went to rural residents around the park; about 55% went to
administrative (US-based) overhead and expatriate technical consultants and the rest went to
capital expenditures and host-country technical consultants (Peters 1998).
VII. Conclusion
Madagascar’s extraordinary wealth of biodiversity is being liquidated rapidly. Strong
measures are needed to ensure the preservation of this wealth for the future. These measures will
inevitably include the use of protected areas. However, the same ecosystems that are top
priorities for conservation provide adjacent resident communities with many valuable goods and
services on which their lives depend. Without alternative methods of meeting these needs,
restricted access to protected ecosystems will mean diminishing standards of living over time for
communities adjacent to protected areas. Diminishing local welfare may generate serious

Costs of Conservation
24
conflicts between protected area managers and the resident population and thus jeopardize the
long-term conservation goals of protected areas. In order to identify and reduce these conflicts,
the local costs of protected areas must be estimated.
Using data from southeastern Madagascar, I estimate that the present value (1991 dollars)
of opportunity costs to local residents from the establishment of the Ranomafana National Park is
$3.37 million. In addition to these costs, there were other costs that I was unable to quantify,
including health, cultural and social costs. Although I was unable to quantify these additional
costs, there is no reason to believe that they are inconsequential. Relative to household incomes
in the region, the total opportunity costs of local communities from the establishment of the
Ranomafana National Park are substantial.
On a national and global scale, however, the benefits from protecting the Ranomafana
National Park are likely to be far greater than the opportunity costs of local residents. The park
has been characterized as a biological paradise with many endangered and exotic endemic
species. As a tourist site, the park has much potential for generating benefits at the regional,
national and international level. Furthermore, the Ranomafana National Park protects the
watershed of a hydroelectric plant that generates electricity for the entire central southeastern
region, including the provincial capital city. Although the outside conservation funds that were
invested in the Ranomafana region in 1990s ($3.92 million) did not mitigate the opportunity
costs from the park’s establishment, my analysis suggests that, were they appropriately spent,
those funds could have indeed encouraged local conservation support.

Costs of Conservation
25
Appendix
A1. Deforestation Rates
In the absence of the park, the amount of forest cleared for agricultural purposes would
increase over time as the population grows and lands outside the park become less productive.
Some of the forest inside the park had been deforested by 1990, indicating that residents had a
need to begin using the park's ecosystem for agriculture. Moreover, 90% of the surveyed
households believed that they did not have enough land to meet their household needs.
TABLE AI
DEFORESTATION RATES OF THE RNP BY ZONE
Zone Hectares/capita/year Total cut 1991-92
Western 0.001 7 ha
Northern 0.003 36 ha
Southeastern 0.006 11 ha
Central 0.004 21 ha
The deforestation rates for each zone are listed in Table AI. Deforestation rates in the
RNP in the absence of the park’s regulations were estimated from a combination of resident-
revealed information (e.g., area of cultivation, crop varieties planted, historical reconstructions of
agricultural perimeter) and author observation. The details underlying the assumptions of
deforestation rates can be found in Ferraro (1994: Appendix J). The assumed rates are lower
than estimated rates for comparable areas in eastern Madagascar (Green and Sussman, 1990;
Ryan, 1992; Green, 1993; CARE/NYZS, 1993; Kramer et al., 1994).
One could argue that population growth could increase the amount of labor available for
agricultural intensification, thereby decreasing the deforestation rate per capita. However, given
(1) the low labor productivity on existing land, (2) the expected limited rate of technical change

Costs of Conservation
26
over time, and (3) the limited ability of Madagascar's urban and non-farm rural sectors to absorb
labor, population growth is unlikely to decrease the rate of deforestation per capita in the RNP
region. Scientists working in the northeast of Madagascar found that per capita deforestation
rates have been increasing since 1957. Although the annual deforestation rate per capita is held
constant in the analysis, the population in the Ranomafana region is growing at an estimated rate
of 2.5% (based on 1980 and 1990 census data from local firaisina offices).
A2. Tavy (Agriculture) Assumptions
In order to estimate the benefit stream derived from tavy cultivation in the absence of the
park, a typical tavy cycle starting with primary forest is assumed for each zone and the net
present value of the stream of benefits from the use of that piece of land until 2050 A.D. is
estimated (see footnote 3 for details). The net benefits of tavy vary across zones because of
differences in land quality, weather, crops grown and prices of outputs and inputs.
A3. Forest Product Collection Assumptions
In the absence of the park, the demand for forest products, and hence the net benefits,
coming from the park's forests will increase over time because of the increasing scarcity of forest
products in the peripheral zone. This scarcity is already evident in some villages a few
kilometers from the park in the northern zone. On the other hand, increasing levels of tavy in the
park's forest will decrease the net benefits from forest product collection over time by increasing
the costs to obtain products. Given the relative abundance of forest products, historical
movements of settlements following expansion of the agricultural perimeter and the low
opportunity cost of time during the seasons when forest products are most often collected, it is

Costs of Conservation
27
assumed that the net benefits from forest product collection in the park will not begin to decrease
at a noticeable rate until well after the demand for forest products in the park has begun to
increase. Under the deforestation rate assumptions used, only half of the RNP is deforested by
the year 2079 and thus forest products are likely to be available during the time horizon of this
paper’s analysis. Given the great uncertainty over the potential long-term dynamics in forest
product demand and supply, the analysis assumes that the benefits from forest product collection
within the RNP's borders remain constant over the period of analysis.
A4. Time Horizon and Discount Rate
Typical time horizons used for the analysis of projects with long-term effects are thirty to
fifty years (Dixon et al., 1986). At any positive discount rate, the present value of the costs will
be quite small after fifty years. The time horizon used in this analysis is sixty years because even
small present values are significant to individuals with low incomes.
For the purposes of the empirical analysis, I assume that the social discount rate is 5%.
Results from past studies suggest that individuals do not discount at constant rates over different
choices and at different stages in their economic development (Thaler, 1981; Houston, 1983;
Loewenstein, 1988; Thaler and Loewenstein, 1989; Benzion et al., 1989; Lawrance, 1991;
Cropper et al., 1992, Weitzman 2001). Researchers have found discount rates to be a function of
the type of choice proposed, the magnitude of the values involved, the time horizon of the
choice, and whether a cost or a benefit is being discounted. In order to derive the appropriate
social discount rate, the context of the RNP's establishment from the point of view of the
residents must be examined.

Costs of Conservation
28
Thaler (1981), Cropper et al. (1992) and others have found a negative relationship
between the discount rate and the length of waiting time and the magnitude of the future value.
The greater the time horizon and the greater the magnitude of the future value, the lower the
discount rate used by the economic agent making the choice. Given the long-term effects of the
RNP and the potential magnitude of the costs relative to current incomes, it is likely that the rates
of time preference used by residents to discount the opportunity costs of the RNP are lower than
residents' personal rates of time preference.
Changes that have intergenerational impacts are generally discounted at lower rates by
societies. When residents discussed the impacts of the proposed park in the semi-structured
interviews and in public discussions after the park's establishment, they often complained that
the real victims of the park were their children and grandchildren who would not have access to
the resources that they would need. When heads of households were asked how much land they
would need to provide for their families, many responded with figures of about 3 ha of rice paddy
and 10 ha of hillside land. When asked why they needed so much land, most stated that they
needed extra for their descendants. Norgaard and Howarth (1991) have shown that the discount
rate under these circumstances is a function of the way in which current economic agents want to
distribute resource rights between generations. The decision is no longer framed merely in terms
of an investment decision yielding returns to the current generation, but also as a question of
intergenerational equity. In general, if current economic agents believe future economic agents
have significant rights to resources, then any proposed changes that would negatively impact
future generations access to resources would be discounted at a relatively low rate.
The ratio of land rent to land sale price gives one estimate of long-term discount rates
(Cuesta et al., 1993). Limited market data for rice paddies in the western zone suggest that one

Costs of Conservation
29
hectare of irrigated land sells for about 275,000-300,000 FMG while the annual rental rate is
about 20,000 FMG. This would imply a long-term discount rate of 6-7%. However, the few
households that are selling rice paddies are those with immediate cash needs (e.g., a family
illness), and thus the ratio probably overstates the true long-term discount rate. Cuesta et al.
(1993) found that the average rural land rental to price ratio in Costa Rica ranged from 3.95%-
4.99% and the median ranged from 4.76%-6.25%. Moreover, Benzion et al. (1989) found that
the discount rates used for changes in the timing of costs were lower than those used for the
timing of benefits, and psychologists have found that individuals weigh a removal of some part
of what they originally had greater than a gain of equal magnitude (Pearce and Turner, 1990:
129). Other studies have shown that the degree of "voluntariness" or "controllability" plays one
of the most important roles in personal risk experience (Vleck and Stallen, 1980). Holding the
monetary value of the proposed outcome constant, less voluntary or controllable transactions are
less desirable. Several countries have added a premium to market-based compensation awards to
reflect the compulsion in the loss of an asset (Burrows, 1991).
References
Agrawal, B., G. Reddy, and N. Suchaker. 1981. "An experiment in action anthropology: Yanadi action research project in India." Human Organization 40: 87-90. Anderson, D., and R. Grove. 1987. Conservation in Africa: people, policies, and practice. Cambridge, UK: Cambridge University Press. Associates for International Resources and Development (AIRD). 1992. Regional Specialization and Agricultural Growth in Madagascar. Volume I. Draft Report, February. Cambridge, MA: AIRD. Azzoni, C.R. and J.Y. Isai. 1994. Estimating the costs of environmental protection in Brazil. Ecological Economics 11(2): 127-133.

Costs of Conservation
30
Benzion, U., A. Rappoport, and J. Yagil. 1989. "Discount Rate Inferred from Decisions: An experimental study." Management Science 35(3): 270-284. Berman, E., and L. T. M. Bui. 2001. Environmental Regulation and Productivity: Evidence from Oil Refineries. Review of Economics and Statistics 83(3): 498-510 Brandon, K., and M. Wells. 1992. "Planning for people and parks: Design dilemmas." World Development 20(4): 557-570. Brown, M., and B. Wyckoff-Baird. 1992. Designing Conservation and Development Projects. Washington, D.C: Biodiversity Support Program. Bunting, W.B., M.N. Sherpa, and M. Wright. 1991. "Annapurna conservation area: Nepal's new approach to protected area management." In Resident Peoples and National Parks: Social Dilemmas and Strategies in International Conservation, eds. P.C. West and S. Brechin, 160-172. Tucson, AZ: The University of Arizona Press. Burrows, P. 1991. "Compensation for Compulsory Acquisition." Land Economics 67(1): 49-63. Calhoun, J.B. 1991. "The plight of the Ik." In Resident Peoples and National Parks: Social Dilemmas and Strategies in International Conservation, eds. P.C. West and S. Brechin, 55-60. Tucson, AZ: The University of Arizona Press. Campbell, L. M. 1999. Ecotourism in Rural Developing Communities. Annals of Tourism Research 26(3): 534-553. CARE International-Madagascar and The New York Zoological Society/The Wildlife Conservation Society (CARE/NYZS). 1993. Masoala Integrated Conservation and Development Project. Croft, T.A. 1991. "Lake Malawi National Park: A Case Study in Conservation Planning." In Resident Peoples and National Parks: Social Dilemmas and Strategies in International Conservation, eds. P.C. West and S. Brechin, 138-139. Tucson, AZ: The University of Arizona Press. Cropper, M.L., S.K. Aydede, and P.R. Portney. 1992. "Rates of Time Preference for Saving Lives." AEA Papers and Proceedings 82(2): 469-472. Cuesta, M., G.A. Carlson, and E. Lutz. 1993. Time Discount Rates: Measurement Methods and Effects on Soil Erosion Control. Presentation at the Agricultural Economics Workshop, March 23, North Carolina State University. Dianzinga, S. and P. Yambo. 1991. "Les femmes et la forêt: utilisation et conservation des ressources forestières autre que le bois." In Conservation of West and Central African Rainforests, eds. Cleaver et. al, 233-238. Washington, D.C.: World Bank.
Costs of Conservation
31
Dixon, J.A., and P.B. Sherman. 1990. Economics of Protected Areas: A New Look at Benefits and Costs. Washington, D.C.: Island Press. Dixon, J.A., R.A. Carpenter, L.A. Fallon, P.B. Sherman and S. Manopimoke. 1986. Economic Analysis of the Environmental Impacts of Development Projects. London, UK: Earthscan Publications. Duke University. 1992. Ranomafana National Park: Integrating Rainforest Conservation with Sustainable Development in Madagascar. A grant proposal to the USAID mission to Madagascar. Durham, NC: Duke University. Ferraro, P. J. 1994. Natural resource use in the southeastern rain forests of Madagascar and the local impacts of establishing the Ranomafana National Park. Masters Thesis. Duke University, Durham, North Carolina. Forest, Trees, and People Project. 1991. Community Forestry: Participatory Assessment, Monitoring, and Evaluation. Community Forestry Note 2. Rome: FAO. Fox, J.M. 1989. "Diagnostic Tools for Social Forestry," Journal of World Forest Resource Management 4(1): 1-26. Francois, P. J., and Commisariat général au plan, Institut national de la statistique et de la recherche économique. 1967. Budgets et alimentations des ménages ruraux, Rapport de synthèse. Paris: Imprimerie SPIT. Freeman, D.M., and R.S. Frey. 1986. "A Method for assessing the social impacts of natural resource policies." Journal of Environmental Management 23: 229-245. Freudenberger, M. S. and K. S. Freudenberger. 2000. Contradictions in Agricultural Intensification and Improved Natural Resource Management: issues in the Fianarantsoa Forest Corridor of Madagascar. LDI Program Presentation to USAID-Nairobi. Garrat, K. 1984. "The Relationship between Adjacent Lands and Protected Areas: Issues of Concern for the Protected Area Manager." In Conserving the World's Biological Diversity, ed. J. McNeeley, et al., 65-71. Washington, D.C.: IUCN, WRI, CI, WWF-US, and World Bank. Geisler, C.C. 1993. "Rethinking SIA: Why ex ante research isn't enough." Society and Natural Resources 6: 327-338 Ghimire, K.B. 1991. Parks and People: Livelihood Issues in National Parks: Management in Thailand and Madagascar. United Nations Research Institute for Social Development. Discussion Paper. Gordon, R.J. 1985. "Conserving bushmen to extinction in southern Africa." Survival International Annual Review 44: 28-42.

Costs of Conservation
32
Green, G.M. 1993. Remotely Sensed Determination of Deforestation History and Topographic Controls: Mantady National Park and Surroundings. Photocopy. Green, G. and R. Sussman. 1990. Deforestation History of the Eastern Rain Forests of Madagascar from Satellite Images. Science 248: 212-15. Hardenbergh, S.H.B. 1993. Undernutrition, Illness and Children's Work in an Agricultural Rain Forest Community of Madagascar. Ph.D. Diss., University of Massachusetts. Hough, J. 1991. "Social Impact Assessment: Its Role in Protected Area Planning and Management." In Resident Peoples and National Parks: Social Dilemmas and Strategies in International Conservation, eds. P.C. West and S. Brechin, 274-282. Tucson, AZ: The University of Arizona Press. Kiss, A. 1990. Living with Wildlife: Wildlife Resource Management with Local Participation in Africa. Washington, D.C.: World Bank. Kramer, R.A. and N. Sharma. 1997. Tropical Forest Biodiversity Protection: who pays and why. In Last Stand: protected areas and the defense of tropical biodiversity, eds., R. Kramer, C. van Schaik and J. Johnson, 162-186. New York, NY: Oxford University Press. Kramer, R.A., N. Sharma, P. Shyamsundar, and M. Munasinghe. 1994. Cost and Compensation Issues in Protecting Tropical Rainforests: Case Study of Madagascar. Environment Working Paper no. 62. Washington, D.C.: World Bank, Environment Department, Africa Technical Department. Kremen, C., J. O. Niles, M. G. Dalton, G. C. Daily, P. R. Ehrlich, J. P. Fay, D. Grewal, and R. P. Guillery. 2000. Economic Incentives for Rain Forest Conservation Across Scales. Science 288: 1828. Lawrance, E.C. 1991. "Poverty and the Rate of Time Preference: Evidence from Panel Data." Journal of Political Economy 99(1): 54-77. Lindberg, K., J. Enriquez and K. Sproule. 1996. Ecotourism Questioned: case studies from Belize. Annals of Tourism Research 23(3): 543-562. Lovell, S. J., and D. L. Sunding. 2001. Voluntary Development Restrictions and the Cost of Habitat Conservation. Real Estate Economics 29(2): 191-20. Loewenstein, G.L. 1988. "Frames of Mind in Interpersonal Choice." Management Science 34(2): 200-214. Mishra, H.R. 1982. "Balancing Human Needs and Conservation in Nepal's Royal Chitwan Park." Ambio 11(5): 246-251. Mittermeir, R.A., N. Myers, J.B. Thompsen, G.A.B. Fonseca, and S. Olivieri. 1998. Global

Costs of Conservation
33
biodiversity hotspots and major tropical wilderness areas. Conservation Biology 12: 516-520. Norgaard, R.B., and R.B. Howarth. 1991. "Sustainability and Discounting the Future." In Ecological Economics: The Science and Management of Sustainability, ed. R. Constanza, 88-101. New York, NY: Colombia University Press. Norton-Griffiths, M. and C. Southey. 1995. The opportunity costs of biodiversity conservation in Kenya. Ecological Economics 12(2): 125-139. Novellino, D. 1998 "Sacrificing Peoples for the Trees: the cultural cost of forest conservation on Palawan Island (Philippines). Indigenous Affairs 4: 4-14. Olwig, K.F. 1980. "National Parks, Tourism, and Local Development: A West Indian case." Human Organization 39(1):22-31. Payne, R.J., R. Rollins, S. Tamm, and C. Nelson. 1992. "Managing social impacts of parks and protected areas in northern Canada." In Science and the Management of Protected Areas, eds. H.H. Wison et al., 513-518. Amsterdam: Elsevier V Science. Pearce, D.W., and R.K. Turner. 1990. Economics of Natural Resources and the Environment. Baltimore, MD: The John Hopkins University Press. Peters, J. 1998. Transforming the Integrated Conservation and Development Approach: observations from the Ranomafana National Park Project. Journal of Agricultural and Environmental Ethics 11: 17-47. Pryor, F. L. 1990. The Political Economy of Poverty, Equity, and Growth: Malawi and Madagascar. Oxford: Oxford University Press. Rakotozafy, A., L. Dorr, and A. Gentry. 1987. "La biodiversité à Madagascar." In Priorites en Matiere de Conservation des Especes a Madagascar, eds. R.A. Mittermier et al., 127-130. Gland, Switzerland: International Union for Conservation of Nature and Natural Resources. Ralambofetra, E., and L.H. Rakotovao. 1985. "Étude de la valeur nutrionelle de different variétés de riz de Madagascar - Les proteines du riz." Recherche pour le développement. Serie Sciences biologiques, no.2, deuxième semestre, MRSTD: 141-155. Ralambofetra, E., L.H. Rakotovao, and G. Bayomoue. 1986. "Étude de la valeur nutrionelle de different variétés de riz de Madagascar - Les éléments minéraux du riz: Teneur en éléments mineraux." Recherche pour le développement. Serie Sciences biologiques, no.3, MRSTD: 115-135. Rao, K., and C. Geisler. 1993. "The Social Consequences of Protected Areas Development for Resident Populations." Society and Natural Resources 3: 19-32. Razafimamonjy, D. 1987. Contribution à l'étude de la dynamique du savoka dans la région de
Costs of Conservation
34
Ranomafana-Ifanadiana. Mémoire de diplôme d'études approfondies de sciences biologiques appliquées. Université de Madagascar, Antananarivo, Madagascar. Ruitenbeek, H.J. 1992. "The rainforest supply price: a tool for evaluating rainforest conservation expenditures." Ecological Economics 6: 57-78. Ryan, J.C. 1992. Life Support: Conserving Biological Diversity. Worldwatch Paper 108. Washington, D.C.: Worldwatch Institute. Sahama, V.B. 1984. "Human Dimensions in Wildlife Management: The Indian Experience." In Conserving the World's Biological Diversity, eds. J. McNeeley et al., 190-196. Washington, D.C.: IUCN, WRI, CI, WWF-US, and World Bank. Samuel, R., and M. Rambeloson. 1991. Résultats enquête socio-economique. Firaisina de Ranomafana. Program d'actions integrées pour la suivie et le développement de l'enfant. UNICEF. Schelhas, J.W., Jr. 1991. Socioeconomic and biological aspects of land use adjacent to Braulio Carrillo National Park, Costa Rica. Ph.D. Diss., University of Arizona, Tucson (School of Natural Resources). Schoepf, B.G. 1983. "Unintended consequences and structural predictability: Man and biosphere in Zaire's Lufira Valley." Human Organization 42: 361-367. Shyamsundar, Priya; Kramer, Randall A. 1996. Tropical Forest Protection: An Empirical Analysis of the Costs Borne by Local People. Journal of Environmental Economics and Management 31(2): 129-44. Singh, I., L. Squire, and J. Strauss, eds. 1986. "The Basic Model: Theory, Empirical Results, and Policy Conclusions." In Agricultural Household Models: Extensions, Applications, and Policy, eds. Singh et al., 17-47. Baltimore, MD: The John Hopkins University Press. Thaler, R.H. 1981. "Some Empirical Evidence on Dynamic Inconsistency." Economic Letters 8(3): 201-207. Thaler, R., and G.L. Loewenstein. 1989. "Intertemporal Choice." Journal of Economic Perspectives 3: 181-93. UNICEF. 1992. State of the World's Children. Oxford, UK: Oxford University Press. United States Agency for International Development (USAID-Madagascar). 1991. USAID/Madagascar Environment Program. Antananarivo, Madagascar. Upreti, B. N. 1985. The park-people interface in Nepal: problems and new directions. In People and protected areas in the Hindu Kush-Himalaya: proceedings of the International Workshop on the Management of National Parks and Protected Areas in the Hindu Kush-Himalaya held on 6-

Costs of Conservation
35
11 May 1985 at Kathmandu, Nepal. McNeely, J. A.; Thorsell, J. W.; Chalise, S. R. ed., 19-24, Kathmandu, King Mahendra Trust for Nature Conservation and the International Centre for Integrated Mountain Development. Vieta, F. 1998. Ecotourism Propels Development but Social Acceptance Depends on Economic Opportunities for Local Communities. Africa Recovery 13(1): 1-2. Vleck, C., and P. Stallen. 1980. "Rational and Personal Aspects of Risk." Acta Psychologica 45:273-300. Wallace, G. N. and S. M. Pierce. 1996. An Evaluation of Ecotourism in Amazonas, Brazil. Annals of Tourism Research 23(4): 843-873. Weitzman, M.L. 2001. Gamma Discounting. American Economic Review 91(1): 260-271. Wells, M., and K. Brandon, with L. Hannah. 1990. People and Parks: Linking Protected Area Management with Local Communities. Washington, D.C.: World Bank, World Wildlife Fund, and USAID. West, P.C., and S.R. Brechin, eds. 1991. Resident Peoples and National Parks: Social Dilemmas and Strategies in International Conservation. Tucson, AZ: The University of Arizona Press. White, F. 1983. The Vegetation of Africa: A descriptive memoir to accompany the UNESCO/AETFAT/UNSO Vegetation Map of Africa. Natural Resources Research 20. Paris: UNESCO. Winterbottom, R. 1991. "Tropical Forestry Action Plans and Indigenous People: the case of Cameroon." In Conservation of West and Central African Rainforests, eds. K. Cleaver, et al., 222-228. Washington, D.C.: World Bank. Woo, H. T. 1991. An Assessment of Tourism Development in the National Parks of South Korea. In Resident Peoples and National Parks: Social Dilemmas and Strategies in International Conservation, eds. P.C. West and S. Brechin, 200-205. Tucson, AZ: The University of Arizona Press.