THE LION’S SHARE: EVIDENCE FROM FEDERAL CONTRACTS ON THE VALUE OF POLITICAL CONNECTIONS Şenay...
31
THE LION’S SHARE: EVIDENCE FROM FEDERAL CONTRACTS ON THE VALUE OF POLITICAL CONNECTIONS Şenay Ağca, GWU Deniz Igan, IMF September 8, 2015
-
Upload
nicholas-burns -
Category
Documents
-
view
217 -
download
1
Transcript of THE LION’S SHARE: EVIDENCE FROM FEDERAL CONTRACTS ON THE VALUE OF POLITICAL CONNECTIONS Şenay...

THE LION’S SHARE: EVIDENCE FROM FEDERAL CONTRACTS ON THE VALUE OF POLITICAL CONNECTIONS
Şenay Ağca, GWU Deniz Igan, IMF
September 8, 2015


Motivation
Value of political connections Long-standing question Empirically challenging to establish the
direction of causality An exogenous shock
September 11 and the start of the war in Afghanistan on October 7, 2001 Direct impact on defense spending Nondefense spending treated as control case

Outline
Some background Brief literature Federal budget and procurement processes
Empirical set-up Measuring political connections Research design
Findings Interpretation

LiteratureBudget and Procurement
Background

Are political connections valuable…
Important question for welfare and policy setting, with macroeconomic implications Engagement and policy stability,
adaptability, and coordination (long list) Evidence on politically connected firms
Better economic performance and stock market value (Fisman 2001, Faccio 2006, Goldman et al 2009, Cooper et al 2010)

…and why?
Reverse causality is a problem, so is the channel Quid-pro-quo?
Preferential access to finance (Khwaja and Mian 2005, Claessens et al 2008)
Bailout (Faccio et al 2006, Duchin and Sosyura 2012) Contracts (Goldman et al 2013, Tahoun 2014)
Access? Whom you know or what you know (Bertrand et al
2014) Losing congressional connection means losing
revenue (Blanes-Vidal et al 2012)

Our contribution
Direction is from political connections to contracts Address reverse causality / endogeneity
issues from contracts to political connections
Channel can be quid-pro-quo or access Put a number on the value of
connections Compare different ways to establish
connections

Budget process
Agencies submit their requests to the Office of Management and Budget (OMB) between September and December (e.g. September-December 2001)
The President submits the budget to Congress in February (e.g. February 2002)
Congress passes a budget resolution and approves funding for discretionary spending – fiscal year starting in October (e.g. October 2002)

Procurement process
Budget formulati
on
Legislative action
Actual execution

Procurement process
Pentagon covered by: DoD Appropriations Bill Military Construction Appropriations Bill
Acquisition personnel post solicitation on FedBizOpps and evaluate the offers in accordance with Federal Acquisition Regulation
All awards reported for public transparency on Federal Procurement Data System

DataDesign
Empirical set-up

Data
Federal contracts Center for Effective Government (an OMB watchdog) Focus on DoD versus other (Agriculture, Energy, Health, etc) Only corporations and awards > $200K
Political connections Lobbying
Senate Office of Public Records Semiannual reports
Campaign contributions Federal Election Commission PAC contributions to winning candidates
Board connections Boardex Connections to armed forces

Research design
Pre-event period
• Budget request: Sep–Dec 1999
• Approved funds for: Oct 2000–Sep 2001
• Lobbying in: Jan–Dec 1999
• Campaign in: 1998 election cycle
Event period
• Budget request: Sep–Dec 2000
• Approved funds for: Oct 2001–Sep 2002
• Lobbying in: Jan–Dec 2000
• Campaign in: 2000 election cycle
Post-event period
• Budget request: Sep–Dec 2001
• Approved funds for: Oct 2002–Sep 2003
• Lobbying in: Jan–Dec 2001
• Campaign in: 2000 election cycle

Differences in differences
Main question: Do politically connected firms get larger
contracts when available funding increases? Two treatment effects
Defense versus nondefense contracts Politically connected versus unconnected
Regressions:(1) Contractit= β1*Connectionit + β2*Connectionit*Posteventt + ni + yt + εit
(2) Contractit= β1*Connectionit + β2*Defenseit + β3*Connectionit *Posteventt + β4*Defenseit*Posteventt + β5*Defenseit*Connectionit + β6*Defenseit*Connectionit *Posteventt + ni + yt + εit

Main resultsInterpretation
Findings
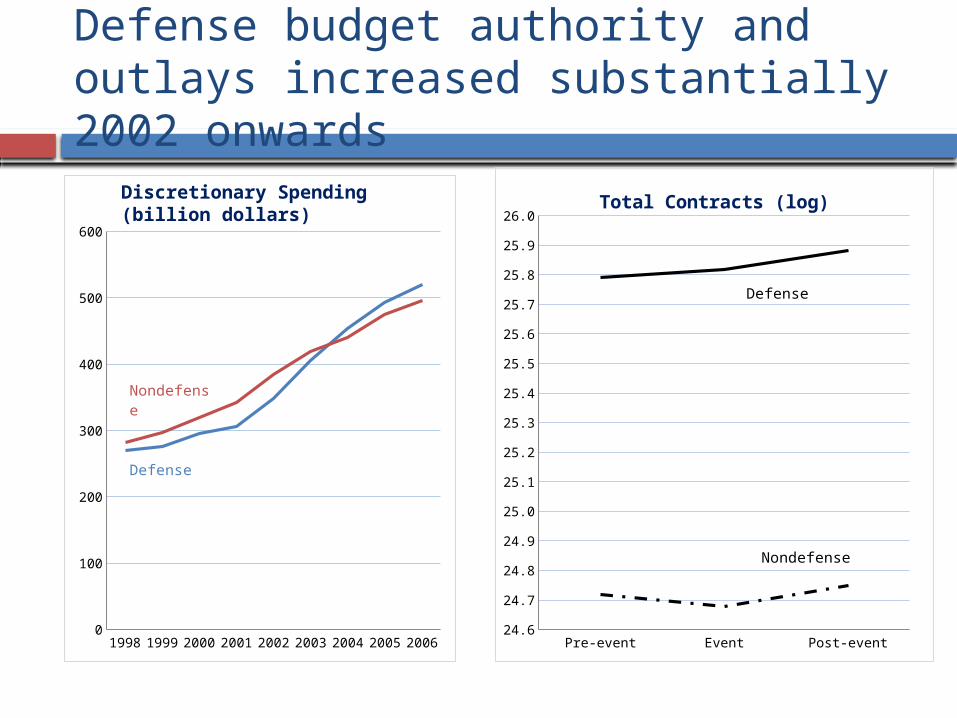
Defense budget authority and outlays increased substantially 2002 onwards
Pre-event Event Post-event24.6
24.7
24.8
24.9
25.0
25.1
25.2
25.3
25.4
25.5
25.6
25.7
25.8
25.9
26.0Total Contracts (log)
Defense
Nondefense
1998 1999 2000 2001 2002 2003 2004 2005 20060
100
200
300
400
500
600
Defense
Nonde-fense
Discretionary Spending(billion dollars)

Both defense and nondefense firms somewhat intensified political activities
LOBBYING Pre-event Post-event Difference
Defense 0.50 0.55 0.05
Nondefense 0.24 0.28 0.04**
Difference 0.26*** 0.27*** 0.01
CAMPAIGN CONTRIBUTIONS
Pre-event Post-event Difference
Defense 0.15 0.16 0.01
Nondefense 0.05 0.06 0.01
Difference 0.10 0.11 0.00

Average defense contract size increased substantially more for lobbying firms
Defense firms
Pre-event
Post-event
Diff.
Lobbying 16.35 17.98 1.63***
Non-lobbying
15.47 15.58 0.11***
Difference 0.88***
2.40***
1.52***
Pre event Event Post event12
13
14
15
16
17
18
19
20
Average Contract Size for Defense Firms
Log(c
ontr
act
am
ount) Lobbying
Non-lobbying

The difference is economically meaningful
Lobbying firms receive 92 percent larger defense contracts after the event than firms that are not lobbying
For defense firms, spending an extra $1 for lobbying brings in $2.5 in contracts after the event
Defense only Nondefense only
Pooled
Lobbying -0.0012 -0.0224* 0.0095 0.0118 0.0115
Postevent*Lobbying
0.0496*** -0.0050 -0.0051
Defense*Lobbying
-0.0334**
Postevent*Defense
0.0618***
Postevent*Lobbying*Defense
0.0547***

Similar picture for campaign contributions
Pre-event
Post-event
Diff.
Contributing 17.68 18.40 0.72
Non-contributing
15.48 15.65 0.17
Difference 2.20***
2.75***
0.55**
Contributing
Non-contributing
Pre event Event Post event13
14
15
16
17
18
19
20
Average Contract Size for Defense Firms
Log(C
ontr
act
siz
e)

but not significant in regression analysis
Defense only Nondefense only
Pooled
Campaign 0.0445 0.0459 -0.0131 0.0122 0.0123
Postevent*Campaign -0.00204 -0.0308* -0.0311*
Defense*Campaign 0.0880***
Postevent*Defense 0.0336
Postevent*Campaign*Defense 0.0292 Firm fixed effects take away the difference

Board connections significant, statistically…
Pre-event
Post-event
Diff.
Connected board
16.29 17.35 1.08**
Unconnected board
15.51 15.68 0.17***
Difference 0.78**
1.42***
0.91***
Connected board
Unconnected board
Pre event Event Post event15.0
15.5
16.0
16.5
17.0
17.5
18.0
Average Contract Size for Defense Firms
Log (
Contr
act
siz
e)

…and economically
Median defense contract size is $1.3 million Firms with connected boards get $2.5 million after the event Firms with no board connections get $1.36 million
Defense only
Board connection
0.0517 -0.1310
Postevent 0.0423***
Postevent*Boardconnection
0.6170**

Joint specification
DefenseNondefens
e Pooled
Lobbying -0.0366** 0.0140* 0.0137*
Post-event*Lobbying 0.0641*** 0.000393 0.000368
Campaign 0.0484 -0.0368 -0.0384
Post-event*Campaign -0.0609*** -0.0222 -0.0221
Board connection -0.0788 -0.0771Post-event*Board connection 0.505* 0.506*
Lobbying*Defense -0.0499***Post-event*Lobbying*Defense 0.0637***
Campaign*Defense 0.0883*Post-event*Campaign*Defense -0.0388
Post-event*Defense 0.0591*** Lobbying and board connections continue to have a
positive effect on the contracts granted when considered jointly – they are compliments (not substitutes)

Defense contracts - excluding top 10 contractors
Results are not driven solely by top contractors
Lobbying Campaign Board connection
Lobbying -0.0322**
Post-event*Lobbying 0.0528***
Campaign 0.0460
Post-event*Campaign 0.00154
Board connection -0.131Post-event*BoardConnection 0.631**

Placebo period
October 2004-September 2007 Iraq war has started in March 2003 – increased
defense spending has been ongoing during this period
No additional major event that should affect defense contracts October 2004-September 2005 -- pre-event October 2005-September 2006 – event October 2006-September 2007 -- post-event
No robust and significant effects of political activism

Checks
Using indicators instead of amounts – results are robust
Comparing defense to nondefense Controls for any trends in connections and contracts Visually no difference in pre- and post-
event contract amounts for nondefense Coefficients on Postevent*Connection are
insignificant in nondefense only sample Coefficients on Postevent*Connection*Defense
are significant in the pooled sample

Summary and interpretation
Exploit September 11 as an exogenous event that increased available government funding Political connections (through lobbying and
connected board members) help secure a larger share
Address the reverse causality / endogeneity problem, put a value to political connections, and compare alternative political connections Channel can be quid pro quo or access – we
cannot differentiate between these two channels

Further work
Connections to legislators? Differentiate between connection and
expertise?

Questions, comments welcome.
Thank you.