“The Leader in Power Monitoring and Control”® 1262 / 1272 High Performance Socket and...
212
“The Leader in Power Monitoring and Control” “The Leader in Power Monitoring and Control”
Transcript of “The Leader in Power Monitoring and Control”® 1262 / 1272 High Performance Socket and...

“The Leader in Power Monitoring and Control”“The Leader in Power Monitoring and Control”


Nexus®1262 / 1272
High Performance Socket and Switchboard Meters
Electro Industries/GaugeTech
Installation & Operation ManualVersion 1.10
August 5, 2008
Doc #: E151701 V1.10
1800 Shames DriveWestbury, New York 11590
Tel: 516-334-0870 Fax: [email protected] www.electroind.com
“The Leader in Power Monitoring and Control”

Electro Industries/GaugeTech Doc # E151701

Nexus® 1262 / 1272 MeterInstallation and Operation ManualVersion 1.10
Published by:Electro Industries/GaugeTech1800 Shames DriveWestbury, NY 11590
All rights reserved. No part of thispublication may be reproduced ortransmitted in any form or by anymeans, electronic or mechanical,including photocopying, recording,or information storage or retrievalsystems or any future forms of duplication, for any purpose otherthan the purchaser’s use, without the expressed written permission ofElectro Industries/GaugeTech.
© 2008Electro Industries/GaugeTech
Nexus® is a registered trademark ofElectro Industries/Gauge Tech.
Printed in the United States ofAmerica.
e Electro Industries/GaugeTech Doc # E151701 i

e Electro Industries/GaugeTech Doc # E151701 ii
Customer Service and SupportCustomer support is available 9:00 am to 4:30 pm, eastern standard time, Monday through Friday.Please have the model, serial number and a detailed problem description available. If the problem concerns a particular reading, please have all meter readings available. When returning any merchandiseto EIG, a return materials authorization number is required. For customer or technical assistance, repairor calibration, phone 516-334-0870 or fax 516-338-4741.
Product WarrantyElectro Industries/GaugeTech warrants all products to be free from defects in material and workmanshipfor a period of four years from the date of shipment. During the warranty period, we will, at our option,either repair or replace any product that proves to be defective.
To exercise this warranty, fax or call our customer-support department. You will receive prompt assistance and return instructions. Send the instrument, transportation prepaid, to EIG at 1800 ShamesDrive, Westbury, NY 11590. Repairs will be made and the instrument will be returned.
Limitation of WarrantyThis warranty does not apply to defects resulting from unauthorized modification, misuse, or use for anyreason other than electrical power monitoring. The Nexus Monitor is not a user-serviceable product.
Our products are not to be used for primary over-current protection. Any protection feature in our products is to be used for alarm or secondary protection only.
THIS WARRANTY IS IN LIEU OF ALL OTHER WARRANTIES, EXPRESSED OR IMPLIED,INCLUDING ANY IMPLIED WARRANTY OF MERCHANTABILITY OR FITNESS FOR APARTICULAR PURPOSE. ELECTRO INDUSTRIES/GAUGETECH SHALL NOT BE LIABLE FORANY INDIRECT, SPECIAL OR CONSEQUENTIAL DAMAGES ARISING FROM ANY AUTHO-RIZED OR UNAUTHORIZED USE OF ANY ELECTRO INDUSTRIES/GAUGETECH PRODUCT.LIABILITY SHALL BE LIMITED TO THE ORIGINAL COST OF THE PRODUCT SOLD.
Statement of CalibrationOur instruments are inspected and tested in accordance with specifications published by ElectroIndustries/GaugeTech. The accuracy and a calibration of our instruments are traceable to the NationalInstitute of Standards and Technology through equipment that is calibrated at planned intervals by comparison to certified standards.
DisclaimerThe information presented in this publication has been carefully checked for reliability; however, noresponsibility is assumed for inaccuracies. The information contained in this document is subject tochange without notice.
This symbol indicates that the operator must refer to an explanation in the operatinginstructions. Please see Chapter 3, Hardware Installation, for important safetyinformation regarding installation and hookup of the Nexus® 1262/1272 meter.

e Electro Industries/GaugeTech Doc # E151701 iii
About Electro Industries/GaugeTech
HistoryFounded in 1973 by engineer and inventor Dr. Samuel Kagan, Electro Industries/GaugeTech changed theface of power monitoring forever with its first breakthrough innovation: an affordable, easy-to-use ACpower meter. A few of our many Technology Firsts include:
1978: First microprocessor-based power monitor1986: First PC-based power monitoring software for plant-wide power distribution analysis1994: First 1 Meg Memory high performance power monitor for data analysis and recording1999: Nexus® series generation power monitoring with industry-leading accuracy2000: First low profile socket meter with advanced features for utility deregulation
TodayOver thirty years later, Electro Industries/GaugeTech, the leader in Web-Accessed Power Monitoring,continues to revolutionize the industry with the highest quality, cutting edge power monitoring and control technology on the market today. An ISO 9001:2000 certified company, EIG sets the standard forweb-accessed power monitoring, advanced power quality, revenue metering, artificial intelligence reporting, industrial submetering and substation data acquisition and control. EIG’s products can befound on site at virtually all of today’s leading manufacturers, industrial giants and utilities.
World LeaderIn fact, EIG products are used globally and EIG is accepted as the world leader in power monitoring andmetering technology. With direct offices in the United States, Turkey, Brazil, Mexico, Guatemala,Croatia and the Phillipines, EIG support is available in most regions around the world. Our worldwidesupport, advanced technology and quality manufacturing standards make EIG the superior choice whendependable, reliable service is paramount..
In recent years, General Electric has become the single largest corporate shareholder, with a 30+% shareof EIG corporate holdings. All EIG products are designed, manufactured, tested and calibrated at ourfacility in Westbury, New York.
Applications:
Multifunction power monitoringSingle and multifunction power monitoringPower quality monitoringOn board data logging for trending power usage and qualityDisturbance analysis
Portable Analyzers:
Power quality analysisEnergy analysis

e Electro Industries/GaugeTech Doc # E151701 iv

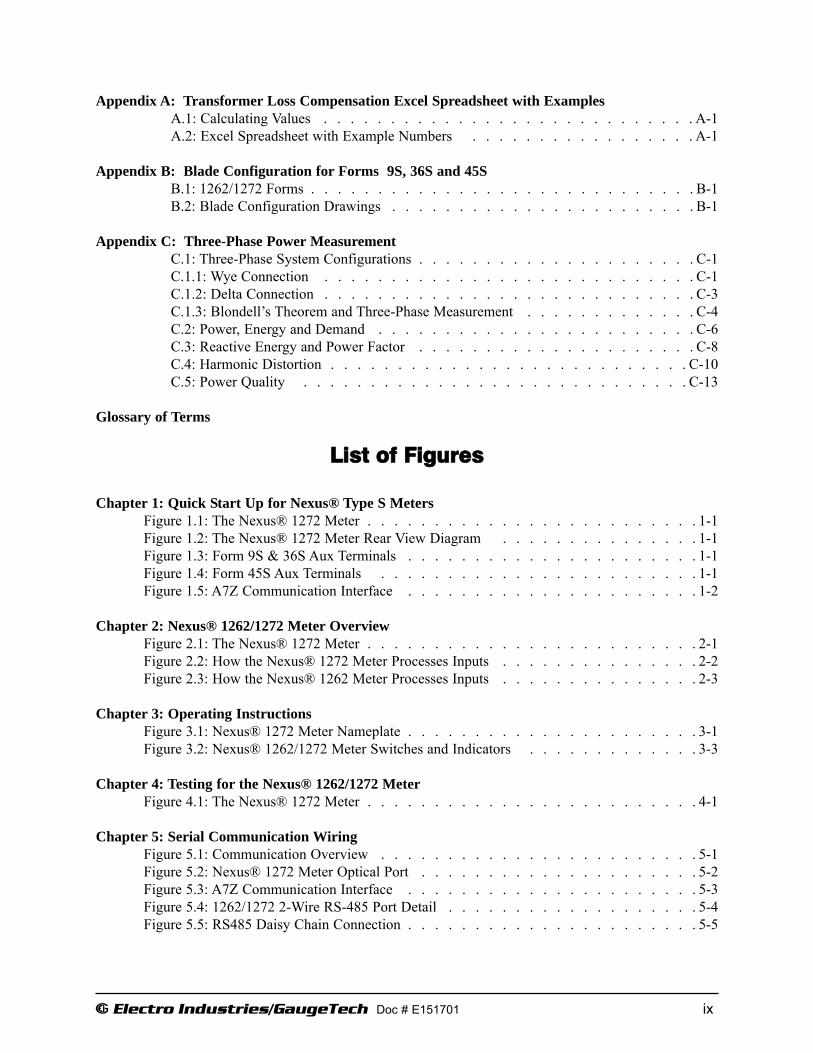
Table of Contents
Quick Start Guide for Nexus® Type S Meters Q-1
Chapter 1: Quick Start Up for Nexus® S Type Meters1.1: Start-Up and Bench Check . . . . . . . . . . . . . . . . . . . . . . . . 1-11.1.1: Meters with Auxiliary Power . . . . . . . . . . . . . . . . . . . . . . . 1-11.1.2: Meters without Auxiliary Power . . . . . . . . . . . . . . . . . . . . . . 1-11.2: PC to Nexus® Meter Serial Communications . . . . . . . . . . . . . . . . 1-21.2.1: Optical Port . . . . . . . . . . . . . . . . . . . . . . . . . . . . . . 1-21.2.2: Serial Communications . . . . . . . . . . . . . . . . . . . . . . . . . . 1-21.3: Program the Nexus® Meter . . . . . . . . . . . . . . . . . . . . . . . . 1-21.3.1: Install Communicator EXT Software & Connect . . . . . . . . . . . . . . . 1-21.4: Configure Programmable Settings . . . . . . . . . . . . . . . . . . . . . 1-31.5: Device Profile Screens . . . . . . . . . . . . . . . . . . . . . . . . . . 1-31.5.1: Save the New Program . . . . . . . . . . . . . . . . . . . . . . . . . . 1-61.6: Field Installation . . . . . . . . . . . . . . . . . . . . . . . . . . . . 1-6
Chapter 2: Nexus® 1262/1272 Meter Overview2.1: The Nexus® 1262/1272 Multiparameter Power Meter . . . . . . . . . . . . 2-12.2: Accu-MeasureTM Technology - Theory of Operation . . . . . . . . . . . . . 2-12.3: Advanced Measurement Functionality . . . . . . . . . . . . . . . . . . . 2-42.3.1: Advanced Revenue Billing Capability . . . . . . . . . . . . . . . . . . . 2-42.3.2: Advanced Communications and I/O Capabilities . . . . . . . . . . . . . . . 2-52.3.3: EN50160 Flicker . . . . . . . . . . . . . . . . . . . . . . . . . . . . 2-62.3.4: Display Screens . . . . . . . . . . . . . . . . . . . . . . . . . . . . . 2-62.3.5: Additional Switches . . . . . . . . . . . . . . . . . . . . . . . . . . . 2-62.3.6: Nexus® External Output Modules . . . . . . . . . . . . . . . . . . . . . 2-62.3.6.1: Optional P40N, P41N and P43N LED Remote Displays . . . . . . . . . . . 2-62.3.6.2: Optional P60N Touch Screen Remote Display . . . . . . . . . . . . . . . 2-62.4: Nexus® 1262/1272 Meter Forms . . . . . . . . . . . . . . . . . . . . . . 2-72.5: Nexus® 1262/1272 Meter Specifications Overview . . . . . . . . . . . . . . 2-82.6: Nexus® 1262/1272 Meter Logging Specifications . . . . . . . . . . . . . . 2-102.7: DNP V3.00 Level 2 . . . . . . . . . . . . . . . . . . . . . . . . . . . 2-10
Chapter 3: Operating Instructions for the Nexus® 1262/1272 Meter3.1: Nameplate Information . . . . . . . . . . . . . . . . . . . . . . . . . . 3-13.2: Basic Operations . . . . . . . . . . . . . . . . . . . . . . . . . . . . . 3-33.3: Display Information . . . . . . . . . . . . . . . . . . . . . . . . . . . . 3-43.4: Nexus® 1262/1272 Programmable Display Navigation Map . . . . . . . . . . 3-53.5: Programmable Display Overview . . . . . . . . . . . . . . . . . . . . . . 3-63.6: Programmable Display Setup . . . . . . . . . . . . . . . . . . . . . . . . 3-73.7: Programmable Display Screens . . . . . . . . . . . . . . . . . . . . . . . 3-9
Chapter 4: Testing for the Nexus® 1262/1272 Meter4.1: Testing Tools . . . . . . . . . . . . . . . . . . . . . . . . . . . . . . . 4-14.1.1: Test Pulse LED . . . . . . . . . . . . . . . . . . . . . . . . . . . . . 4-1
e Electro Industries/GaugeTech Doc # E151701 v

4.1.2: LCD Display . . . . . . . . . . . . . . . . . . . . . . . . . . . . . . 4-24.2: Test Mode . . . . . . . . . . . . . . . . . . . . . . . . . . . . . . . . 4-24.2.1: Entering Test Mode . . . . . . . . . . . . . . . . . . . . . . . . . . . 4-24.2.2: Using Test Mode . . . . . . . . . . . . . . . . . . . . . . . . . . . . 4-44.2.3: Test Mode Preset Accumulators . . . . . . . . . . . . . . . . . . . . . . 4-54.2.4: Exiting Test Mode . . . . . . . . . . . . . . . . . . . . . . . . . . . . 4-6
Chapter 5: Serial Communication Wiring5.1: Communication Overview . . . . . . . . . . . . . . . . . . . . . . . . . 5-15.2: Communicating to the Nexus® meter through the ANSI Type II Optical Port . . . 5-25.3: RS485 Serial Communication . . . . . . . . . . . . . . . . . . . . . . . . 5-35.3.1: RS485 Wiring Fundamentals (Port 1 & Port 4) . . . . . . . . . . . . . . . 5-35.3.2: Using the Unicom 2500 . . . . . . . . . . . . . . . . . . . . . . . . . 5-75.3.3: RS485 Connection - Meter to a Computer or PLC . . . . . . . . . . . . . . 5-85.3.4: RJ-11 (Telephone Line) Connection- Meter with INP2 Option to PC . . . . . . 5-85.3.5: RJ-45 Connection- Meter with INP200 (10/100BaseT) Option . . . . . . . . . 5-85.3.6: Modem/Ethernet Connection- Meter with INP202 (Combo Card) Option . . . . 5-85.3.7: RS485 Connection- Meter to the P40N, P41N or P43N LED Display . . . . . . 5-95.3.8: RS485 Connection- Meter to the P60N Touch Screen External Display . . . . 5-105.3.9: Communication Ports on the Output Modules . . . . . . . . . . . . . . . 5-115.3.10: RS485 Connection—Meter to Output Modules . . . . . . . . . . . . . . 5-125.3.11: Steps to Determine Power Needed . . . . . . . . . . . . . . . . . . . . 5-135.3.12: Output Modules’ Factory Settings and VA Ratings . . . . . . . . . . . . . 5-135.3.13: Remote Communication Over Telephone Lines Using the RS485 Port . . . . 5-145.3.14: Programming Modems for Remote Communication . . . . . . . . . . . . 5-165.3.15: Selected Modem Strings . . . . . . . . . . . . . . . . . . . . . . . . 5-175.3.16: High Speed Inputs Connection . . . . . . . . . . . . . . . . . . . . . 5-175.3.17: IRIG-B Connections . . . . . . . . . . . . . . . . . . . . . . . . . . 5-185.3.18: Time Synchronization Alternatives . . . . . . . . . . . . . . . . . . . . 5-195.4: INP2 Internal Modem with Dial In/Dial Out Option5.4.1: Hardware Overview . . . . . . . . . . . . . . . . . . . . . . . . . . 5-205.4.2: Hardware Connection . . . . . . . . . . . . . . . . . . . . . . . . . . 5-205.4.3: Dial-In Function . . . . . . . . . . . . . . . . . . . . . . . . . . . . 5-205.4.4: Dial-Out Function . . . . . . . . . . . . . . . . . . . . . . . . . . . 5-215.5: INP200 Onboard Ethernet5.5.1: Hardware Overview . . . . . . . . . . . . . . . . . . . . . . . . . . 5-225.5.2: Hardware Connection . . . . . . . . . . . . . . . . . . . . . . . . . . 5-225.6: INP202 Ethernet/Modem Combination5.6.1: Hardware Overview . . . . . . . . . . . . . . . . . . . . . . . . . . 5-235.6.2: Hardware Connection . . . . . . . . . . . . . . . . . . . . . . . . . . 5-24
Chapter 6: Hardware Installation6.1: Mounting the Nexus® Socket Meter . . . . . . . . . . . . . . . . . . . . . 6-16.1.1: Cable Color Key . . . . . . . . . . . . . . . . . . . . . . . . . . . . 6-46.2: Internal Battery Installation and Maintenance . . . . . . . . . . . . . . . . . 6-56.2.1: Battery Holder Detail . . . . . . . . . . . . . . . . . . . . . . . . . . 6-66.2.2: Battery Safety and Disposal . . . . . . . . . . . . . . . . . . . . . . . . 6-66.3: Mounting the Optional Nexus® P40N, P41N or P43N LED External Display . . . 6-7
e Electro Industries/GaugeTech Doc # E151701 vi

6.4: Mounting the Optional Nexus® P60N Touch Screen External Display . . . . . . 6-86.5: Daisy Chain Meters with the P60N . . . . . . . . . . . . . . . . . . . . . 6-96.6: Mounting the Nexus® External Output Modules . . . . . . . . . . . . . . . 6-10
Chapter 7: Nexus® Meter’s Time of Use Feature7.1: Introduction . . . . . . . . . . . . . . . . . . . . . . . . . . . . . . . 7-17.2: The Nexus® Meter’s TOU Calendar . . . . . . . . . . . . . . . . . . . . . 7-17.3: TOU Frozen & Active Registers . . . . . . . . . . . . . . . . . . . . . . 7-27.4: Updating, Retrieving and Replacing TOU Calendars . . . . . . . . . . . . . . 7-27.5: Daylight Savings and Demand . . . . . . . . . . . . . . . . . . . . . . . 7-2
Chapter 8: Transformer Loss Compensation8.1: Introduction . . . . . . . . . . . . . . . . . . . . . . . . . . . . . . . 8-18.2: Nexus® 1262/1272 Meter’s Transformer Loss Compensation . . . . . . . . . . 8-38.2.1: Loss Compensation in Three Element Installations . . . . . . . . . . . . . . 8-48.2.1.1: Three Element Loss Compensation Worksheet . . . . . . . . . . . . . . . 8-5
Chapter 9: Using the Nexus® External Displays9.1: Overview . . . . . . . . . . . . . . . . . . . . . . . . . . . . . . . . 9-19.2: Nexus® P40N, P41N and P43N LED External Displays . . . . . . . . . . . . 9-19.2.1: Connect Multiple Displays . . . . . . . . . . . . . . . . . . . . . . . . 9-29.2.2: Nexus® P40N Display Modes . . . . . . . . . . . . . . . . . . . . . . 9-29.3: Dynamic Readings Mode . . . . . . . . . . . . . . . . . . . . . . . . . 9-39.4: Navigational Map of Dynamic Readings Mode . . . . . . . . . . . . . . . . 9-59.5: Nexus® Information Mode . . . . . . . . . . . . . . . . . . . . . . . . . 9-69.6: Navigational Map of Nexus® Information Mode . . . . . . . . . . . . . . . 9-79.7: Display Features Mode . . . . . . . . . . . . . . . . . . . . . . . . . . 9-89.8: Navigational Map of Display Features Mode . . . . . . . . . . . . . . . . . 9-99.9: Nexus® P60N Touch Screen External Display and Screens . . . . . . . . . . 9-109.10: Navigational Map for P60N Touch Screen External Display . . . . . . . . . 9-189.11: Optional P40N, P41N, P43N LED External Display Specifications . . . . . . 9-199.12: Optional P60N Touch Screen Remote Display Specifications . . . . . . . . . 9-19
Chapter 10: Nexus® External Output Modules 10.1: Hardware Overview . . . . . . . . . . . . . . . . . . . . . . . . . . 10-110.1.1: Port Overview . . . . . . . . . . . . . . . . . . . . . . . . . . . . 10-210.2: Installing Nexus® External Output Modules . . . . . . . . . . . . . . . . 10-310.2.1: Power Source for Output Modules . . . . . . . . . . . . . . . . . . . 10-410.3: Using Multiple Output Modules . . . . . . . . . . . . . . . . . . . . . 10-510.3.1: Steps for Attaching Multiple Output Modules . . . . . . . . . . . . . . . 10-510.4: Factory Settings and Reset Button . . . . . . . . . . . . . . . . . . . . 10-610.5: Analog Transducer Signal Output Modules . . . . . . . . . . . . . . . . . 10-710.5.1: Overview . . . . . . . . . . . . . . . . . . . . . . . . . . . . . . 10-710.5.2: Normal Mode . . . . . . . . . . . . . . . . . . . . . . . . . . . . 10-8
e Electro Industries/GaugeTech Doc # E151701 vii

e Electro Industries/GaugeTech Doc # E151701 viii
10.6: Digital Dry Contact Relay Output (Form C) Module . . . . . . . . . . . . 10-910.6.1: Overview . . . . . . . . . . . . . . . . . . . . . . . . . . . . . . 10-910.6.2: Communication . . . . . . . . . . . . . . . . . . . . . . . . . . . 10-1010.6.3: Normal Mode . . . . . . . . . . . . . . . . . . . . . . . . . . . . 10-1010.7: Digital Solid State Pulse Output (KYZ) Module . . . . . . . . . . . . . . 10-1110.7.1: Overview . . . . . . . . . . . . . . . . . . . . . . . . . . . . . . 10-1110.7.2: Communication . . . . . . . . . . . . . . . . . . . . . . . . . . . 10-1210.7.3: Normal Mode . . . . . . . . . . . . . . . . . . . . . . . . . . . . 10-1210.8: Specifications . . . . . . . . . . . . . . . . . . . . . . . . . . . . . 10-14
Chapter 11: Electrical Installation for Nexus® 1262/1272 Meter (Type S)11.1: Wiring Diagrams (Forms 9S, 36S and 45S) . . . . . . . . . . . . . . . . 11-111.2: 9S Meter Mounted in S/A Adapter . . . . . . . . . . . . . . . . . . . . 11-19
Chapter 12: Nexus® 1262/1272 Switchboard Meter (Type Z)12.1: Introduction . . . . . . . . . . . . . . . . . . . . . . . . . . . . . . 12-112.2: Labels . . . . . . . . . . . . . . . . . . . . . . . . . . . . . . . . 12-212.3: Specifications and Dimensions . . . . . . . . . . . . . . . . . . . . . . 12-312.4: Installation . . . . . . . . . . . . . . . . . . . . . . . . . . . . . . 12-612.5: Wiring Diagrams (Forms 9Z and 36Z) . . . . . . . . . . . . . . . . . . . 12-7
Chapter 13: Nexus® Meter Calculations13.1: Measurements and Calculations . . . . . . . . . . . . . . . . . . . . . 13-113.2: Demand Integrators . . . . . . . . . . . . . . . . . . . . . . . . . . . 13-6
Chapter 14: EN50160 Flicker14.1: Overview . . . . . . . . . . . . . . . . . . . . . . . . . . . . . . . 14-114.2: Theory of Operation . . . . . . . . . . . . . . . . . . . . . . . . . . 14-114.3: Setup . . . . . . . . . . . . . . . . . . . . . . . . . . . . . . . . . 14-314.4: Software - User Interface . . . . . . . . . . . . . . . . . . . . . . . . 14-414.5: Logging . . . . . . . . . . . . . . . . . . . . . . . . . . . . . . . . 14-714.6: Polling . . . . . . . . . . . . . . . . . . . . . . . . . . . . . . . . 14-714.7: Log Viewer . . . . . . . . . . . . . . . . . . . . . . . . . . . . . . 14-714.8: Performance Notes . . . . . . . . . . . . . . . . . . . . . . . . . . . 14-8
e Electro Industries/GaugeTech Doc # E151701 ix
Appendix A: Transformer Loss Compensation Excel Spreadsheet with ExamplesA.1: Calculating Values . . . . . . . . . . . . . . . . . . . . . . . . . . . . A-1A.2: Excel Spreadsheet with Example Numbers . . . . . . . . . . . . . . . . . A-1
Appendix B: Blade Configuration for Forms 9S, 36S and 45SB.1: 1262/1272 Forms . . . . . . . . . . . . . . . . . . . . . . . . . . . . . B-1B.2: Blade Configuration Drawings . . . . . . . . . . . . . . . . . . . . . . . B-1
Appendix C: Three-Phase Power MeasurementC.1: Three-Phase System Configurations . . . . . . . . . . . . . . . . . . . . . C-1C.1.1: Wye Connection . . . . . . . . . . . . . . . . . . . . . . . . . . . . C-1C.1.2: Delta Connection . . . . . . . . . . . . . . . . . . . . . . . . . . . . C-3C.1.3: Blondell’s Theorem and Three-Phase Measurement . . . . . . . . . . . . . C-4C.2: Power, Energy and Demand . . . . . . . . . . . . . . . . . . . . . . . . C-6C.3: Reactive Energy and Power Factor . . . . . . . . . . . . . . . . . . . . . C-8C.4: Harmonic Distortion . . . . . . . . . . . . . . . . . . . . . . . . . . . C-10C.5: Power Quality . . . . . . . . . . . . . . . . . . . . . . . . . . . . . C-13
Glossary of Terms
List of Figures
Chapter 1: Quick Start Up for Nexus® Type S MetersFigure 1.1: The Nexus® 1272 Meter . . . . . . . . . . . . . . . . . . . . . . . . . 1-1Figure 1.2: The Nexus® 1272 Meter Rear View Diagram . . . . . . . . . . . . . . . 1-1Figure 1.3: Form 9S & 36S Aux Terminals . . . . . . . . . . . . . . . . . . . . . . 1-1Figure 1.4: Form 45S Aux Terminals . . . . . . . . . . . . . . . . . . . . . . . . 1-1Figure 1.5: A7Z Communication Interface . . . . . . . . . . . . . . . . . . . . . . 1-2
Chapter 2: Nexus® 1262/1272 Meter OverviewFigure 2.1: The Nexus® 1272 Meter . . . . . . . . . . . . . . . . . . . . . . . . . 2-1Figure 2.2: How the Nexus® 1272 Meter Processes Inputs . . . . . . . . . . . . . . . 2-2Figure 2.3: How the Nexus® 1262 Meter Processes Inputs . . . . . . . . . . . . . . . 2-3
Chapter 3: Operating InstructionsFigure 3.1: Nexus® 1272 Meter Nameplate . . . . . . . . . . . . . . . . . . . . . . 3-1Figure 3.2: Nexus® 1262/1272 Meter Switches and Indicators . . . . . . . . . . . . . 3-3
Chapter 4: Testing for the Nexus® 1262/1272 MeterFigure 4.1: The Nexus® 1272 Meter . . . . . . . . . . . . . . . . . . . . . . . . . 4-1
Chapter 5: Serial Communication WiringFigure 5.1: Communication Overview . . . . . . . . . . . . . . . . . . . . . . . . 5-1Figure 5.2: Nexus® 1272 Meter Optical Port . . . . . . . . . . . . . . . . . . . . . 5-2Figure 5.3: A7Z Communication Interface . . . . . . . . . . . . . . . . . . . . . . 5-3Figure 5.4: 1262/1272 2-Wire RS-485 Port Detail . . . . . . . . . . . . . . . . . . . 5-4Figure 5.5: RS485 Daisy Chain Connection . . . . . . . . . . . . . . . . . . . . . . 5-5

Figure 5.6: Incorrect “T” and “Star” Topologies . . . . . . . . . . . . . . . . . . . . 5-6Figure 5.7: Unicom 2500 with Connections . . . . . . . . . . . . . . . . . . . . . . 5-7Figure 5.8: Detail of “Jumpers” . . . . . . . . . . . . . . . . . . . . . . . . . . . 5-7Figure 5.9: Meter Connected to P40N, P41N or P43N LED External Display . . . . . . . 5-9Figure 5.10: P60N Touch Screen Display Port . . . . . . . . . . . . . . . . . . . . 5-10Figure 5.11: Communication Ports on the I/O Modules . . . . . . . . . . . . . . . . 5-11Figure 5.12: Meter Connected to I/O Module . . . . . . . . . . . . . . . . . . . . 5-12Figure 5.13: Remote Connections-RS485 . . . . . . . . . . . . . . . . . . . . . . 5-14Figure 5.14: High Speed Inputs Connection . . . . . . . . . . . . . . . . . . . . . 5-17Figure 5.15: IRIG-B Connection . . . . . . . . . . . . . . . . . . . . . . . . . . 5-18
Chapter 6: Hardware InstallationFigure 6.1: Nexus® 1262/1272 Meter Mounting Dimensions . . . . . . . . . . . . . . 6-1Figure 6.2: Nexus® 1272 Meter Rear View Diagram . . . . . . . . . . . . . . . . . . 6-2Figure 6.3: Nexus® 1262/1272 MeterMounted in A-Base Bottom . . . . . . . . . . . . 6-3Figure 6.4: Nexus® 1262/1272 Meter Mounted (Side View) . . . . . . . . . . . . . . 6-3Figure 6.5: Nexus® 1272 Meter without Internal Shroud . . . . . . . . . . . . . . . . 6-5Figure 6.6: Battery Holder Detail . . . . . . . . . . . . . . . . . . . . . . . . . . 6-6Figure 6.7: Nexus® P40N, P41N and P43N LED External Display Mounting Diagrams . . 6-7Figure 6.8: Nexus® P60N Touch Screen Display Mounting Diagram . . . . . . . . . . . 6-8Figure 6.9: Nexus® P60N Display Back Detail . . . . . . . . . . . . . . . . . . . . 6-8Figure 6.10: Cutout for Nexus® P60N Touch Screen Display . . . . . . . . . . . . . . 6-9Figure 6.11: Daisy Chain Meters with the P60N Touch Screen Display . . . . . . . . . . 6-9Figure 6.12: Nexus® Output Modules Mounting Diagram, Overhead View . . . . . . . 6-10Figure 6.13: Nexus® Output Module Communication Ports . . . . . . . . . . . . . . 6-10Figure 6.14: Nexus® Output Modules Mounting Diagram, Front View . . . . . . . . . 6-11Figure 6.15: Nexus® Output Modules with PSIO Mounting Diagram . . . . . . . . . . 6-11Figure 6.16: Output Wiring Detail . . . . . . . . . . . . . . . . . . . . . . . . . 6-12
Chapter 8: Transformer Loss CompensationFigure 8.1: Low Voltage Metering Installation Requiring Loss Compensation . . . . . . . 8-1Figure 8.2: Joint Ownership Line Metering Requiring Loss Compensation . . . . . . . . 8-1
Chapter 9: Using the Nexus® External DisplaysFigure 9.1: Nexus® P40N LED External Display . . . . . . . . . . . . . . . . . . . 9-1Figure 9.2: Nexus® P40N Display Daisy Chain . . . . . . . . . . . . . . . . . . . . 9-2Figure 9.3: Nexus® P41N LED External Display . . . . . . . . . . . . . . . . . . . 9-2Figure 9.4: Nexus® P43N LED External Display . . . . . . . . . . . . . . . . . . . 9-2Figure 9.5: Nexus® P60N Touch Screen External Display . . . . . . . . . . . . . . . 9-10
Screen Captures for All Readings . . . . . . . . . . . . . . . 9 - 1 0 - 9-17
Chapter 10: Nexus® External Output ModulesFigure 10.1: Output Module Components . . . . . . . . . . . . . . . . . . . . . . 10-1Figure 10.2: Nexus® Meter Connected to Output Module . . . . . . . . . . . . . . . 10-3Figure 10.3: PSIO Power Source (Side View) . . . . . . . . . . . . . . . . . . . . 10-4Figure 10.4: Power flow from PSIO to Output Module . . . . . . . . . . . . . . . . 10-4Figure 10.5: Labels for the PSIO Power Source . . . . . . . . . . . . . . . . . . . 10-4Figure 10.6: Multiple Output Modules . . . . . . . . . . . . . . . . . . . . . . . 10-5
e Electro Industries/GaugeTech Doc # E151701 x

Chapter 11: Electrical InstallationFigure 11.1: Form 9S Wye, no PTs, 3 CTs . . . . . . . . . . . . . . . . . . . . . . 11-3Figure 11.2: Form 9S Wye, 3 PTs, 3 CTs . . . . . . . . . . . . . . . . . . . . . . 11-4Figure 11.3: Form 9S 4-Wire Delta, no PTs, 3 CTs . . . . . . . . . . . . . . . . . . 11-5Figure 11.4: Form 9S 4-Wire Delta, 3 PTs, 3 CTs . . . . . . . . . . . . . . . . . . 11-6Figure 11.5: Form 9S 4-Wire Delta, no PTs, 2 CTs . . . . . . . . . . . . . . . . . . 11-7Figure 11.6: Form 9S 4-Wire Delta, 2 PTs, 2 CTs . . . . . . . . . . . . . . . . . . 11-8Figure 11.7: Form 9S 3-Wire Delta, no PTs, 2 CTs . . . . . . . . . . . . . . . . . . 11-9Figure 11.8: Form 9S 3-Wire Delta, 2 PTs, 2 CTs . . . . . . . . . . . . . . . . . . 11-10Figure 11.9: Form 36S 2.5 Element Wye, no PTs, 3 CTs . . . . . . . . . . . . . . . 11-11Figure 11.10: Form 36S 2.5 Element Wye, 2 PTs, 3 CTs . . . . . . . . . . . . . . . 11-12Figure 11.11: Form 45S Wye, no PTs, 3 CTs . . . . . . . . . . . . . . . . . . . . 11-13Figure 11.12: Form 45S Wye, 2 PTs, 3 CTs . . . . . . . . . . . . . . . . . . . . 11-14Figure 11.13: Form 45S 3-Wire Delta, no PTs, 2 CTs . . . . . . . . . . . . . . . . 11-15Figure 11.14: Form 45S 3-Wire Delta, 2 PTs, 2 CTs . . . . . . . . . . . . . . . . . 11-16Figure 11.15: Form 45S 4-Wire Delta, no PTs, 2 CTs . . . . . . . . . . . . . . . . 11-17Figure 11.16: Form 45S 4-Wire Delta, 2 PTs, 2 CTs . . . . . . . . . . . . . . . . . 11-18Figure 11.17: Form 9S mounted in an S/A Adapter . . . . . . . . . . . . . . . . . 11-19
Chapter 12: Nexus® 1262/1272 Meter Switchboard MeterFigure 12.1: 1262/1272 Switchboard Meter, Front View . . . . . . . . . . . . . . . 12-1Figure 12.2: Front View of the 1262/1272 Switchboard Meter . . . . . . . . . . . . . 12-2Figure 12.3: Options Label for the 1262/1272 Switchboard Meter . . . . . . . . . . . 12-2Figure 12.4: Switchboard Meter, Back View . . . . . . . . . . . . . . . . . . . . . 12-3Figure 12.5: Switchboard Meter, Side View . . . . . . . . . . . . . . . . . . . . . 12-4Figure 12.6: Switchboard Meter Cutout with Tolerance . . . . . . . . . . . . . . . . 12-5Figure 12.7: Front Case showing Built-In Screws . . . . . . . . . . . . . . . . . . 12-6Figure 12.8: Back Angle View of Switchboard Meter . . . . . . . . . . . . . . . . . 12-7Figure 12.9: Form 9Z Wye, no PTs, 3 CTs . . . . . . . . . . . . . . . . . . . . . 12-8Figure 12.10: Form 9Z Wye, 3 PTs, 3 CTs . . . . . . . . . . . . . . . . . . . . . 12-9Figure 12.11: Form 9Z 4-Wire Delta, no PTs, 3 CTs . . . . . . . . . . . . . . . . . 12-10Figure 12.12: Form 9Z 4-Wire Delta, 3 PTs, 3 CTs . . . . . . . . . . . . . . . . . 12-11Figure 12.13: Form 9Z 4-Wire Delta, no PTs, 2 CTs . . . . . . . . . . . . . . . . . 12-12Figure 12.14: Form 9Z 4-Wire Delta, 2 PTs, 2 CTs . . . . . . . . . . . . . . . . . 12-13Figure 12.15: Form 9Z 3-Wire Delta, no PTs, 2 CTs . . . . . . . . . . . . . . . . . 12-14Figure 12.16: Form 9Z 3-Wire Delta, 2 PTs, 2 CTs . . . . . . . . . . . . . . . . . 12-15Figure 12.17: Form 36Z 2.5 Element Wye, no PTs, 3 CTs . . . . . . . . . . . . . . 12-16Figure 12.18: Form 36Z 2.5 Element Wye, 2 PTs, 3 CTs . . . . . . . . . . . . . . . 12-17
Chapter 14: FlickerFigure 14.1: Simulation of Eye Brain Response . . . . . . . . . . . . . . . . . . . 14-3
e Electro Industries/GaugeTech Doc # E151701 xi

e Electro Industries/GaugeTech Doc # E151701 xii
Appendix B: Blade ConfigurationFigure B.1: Form 9S & 36S Base with Knock Out Holes . . . . . . . . . . . . . . . B-2Figure B.2: Form 45S Base with Knock Out Holes . . . . . . . . . . . . . . . . . . B-2
Appendix C: Three-Phase Power MeasurementFigure C.1: Three-Phase Wye Winding . . . . . . . . . . . . . . . . . . . . . . . C-1Figure C.2: Phasor diagram showing Three-phase Voltages and Currents . . . . . . . . . C-2Figure C.3: Three-Phase Delta Winding Relationship . . . . . . . . . . . . . . . . . C-3Figure C.4: Phasor diagram showing Three-phase Voltages, Currents, Delta Connected . . C-3Figure C.5: Phasor diagram showing Three-phase, 4-wire Delta Connected System . . . . C-4Figure D.6: Three-Phase Wye Load . . . . . . . . . . . . . . . . . . . . . . . . . C-5Figure C.7: Power Use Over Time . . . . . . . . . . . . . . . . . . . . . . . . . C-6Figure C.8: Energy Use and Demand . . . . . . . . . . . . . . . . . . . . . . . . C-8Figure C.9: Voltage and Complex Current . . . . . . . . . . . . . . . . . . . . . . C-9Figure C.10: Nondistorted Current Waveform . . . . . . . . . . . . . . . . . . . . C-10Figure C.11: Distorted current wave . . . . . . . . . . . . . . . . . . . . . . . . C-11Figure C.12: Waveforms of the Harmonics . . . . . . . . . . . . . . . . . . . . . C-11
Tables
Table 6.1: Cable Color Key . . . . . . . . . . . . . . . . . . . . . . . . . . . . 6-4Table 11.1: Nexus® 1262/1272 Meter Forms (Type S) . . . . . . . . . . . . . . . . 11-1Table 12.1: 1262/1272 Switchboard Meter Forms (Type Z) . . . . . . . . . . . . . . 12-7Table C.1: Common Phase Voltages on Wye Services . . . . . . . . . . . . . . . . . C-2Table C.2: Power and Energy Relationship Over Time . . . . . . . . . . . . . . . . C-7Table C.3: Typical Power Quality Problems and Sources . . . . . . . . . . . . . . . C-13

Electro Industries/Gauge Tech Doc # E151701 Q-1
Quick Start Guide for Nexus® Type S Meters
Q.1: Bench Check Bench Check saves field time.
Q.1.1: Meters with Auxiliary Power Apply appropriate power to Auxiliary power cable. Display information scrolls. See Fig. 1.2.
Q.1.2: Meters without Auxiliary Power Apply appropriate power to voltage terminals. Terminals are determined by Meter Form (on the front plate of the meter). For Forms 9S and 36S, connect power source to one of the three left most and to the right most voltage terminals (center row of smaller terminals). See Fig. 1.3 & 1.4.
Q.2: PC to Meter CommunicationsQ.2.1: Optical Port
Connect with Modbus RTU, 9600.Connect SC-3 Smart Coupler (RS232) from Nexus®
meter’s Optical Port to a PC’s (9- or 25-pin) serial port (or)
Q.2.2: Serial CommunicationsConnect with Modbus RTU, 57600.Connect meter’s Port 1 (or 4) (RS485) to PC's RS232 serial port via a Unicom RS485/ RS232 Converter.
Q.3: Install Communicator EXT Software & ConnectEthernet: Connect with Network, Modbus TCP, 57600.Modem: Connection Manager, Modbus ASCII, 57600.
Q.4: Configure Programmable SettingsFrom Main Screen, click the Profile Icon. Communicator EXTdisplays the Meter's Initial Profile for editing.
Before making changes, click SAVE to Save the Initial Settingsas Initial Settings.NPS* on hard drive.
Click on the (+/-) icon, double-click on the selected parameter. The screen appears. Make changes. Click OK. Then use buttons at the bottom of the screen to UPDATE DEVICE, SAVE, LOAD, print a REPORT or CANCEL. Section 1.5 reviews screens.
SAVE the new NPS File as Modified Settings.NPS or as a uniqueidentifying name (Example: Unique System ID or Customer’s Name).
To implement changes, click UPDATE DEVICE.To LOAD a new or different file, select a file name.RESET ALL LOGS in Communicator EXT Main screen > Tools > Reset.
Q.5: Device Profile ScreensGeneral SettingsSite Information (CT, PT Ratios)If you are using Block Demand, Transformer Loss Compensation, other than 15 minute demand, or Load Profile Recording (Trending in Communicator EXT)the Initial Settings should be changed. NOTE: Any change to CT settings will automatically update the corresponding Full Scale value in the Limit and Waveform Full Scales settings and will effect all other settings. NOTE: Make sure settings are correct for installation site.
OptionalAuxPowerCable
Fig. Q.1: The Nexus® 1272 Meter Fig. Q.2: 1272 Rear Diagram
Fig. Q.3: 9S, 36S Aux Terminals Fig. Q.4: 45S Aux Terminals
Fig. Q.5: 1262/1272 Device Profile
Fig. Q.6: CT & PT Settings
VoltageTerminals
Common
Modem/Ethernet
Hanger
Electro Industries/Gauge Tech Doc # E151701 Q-2
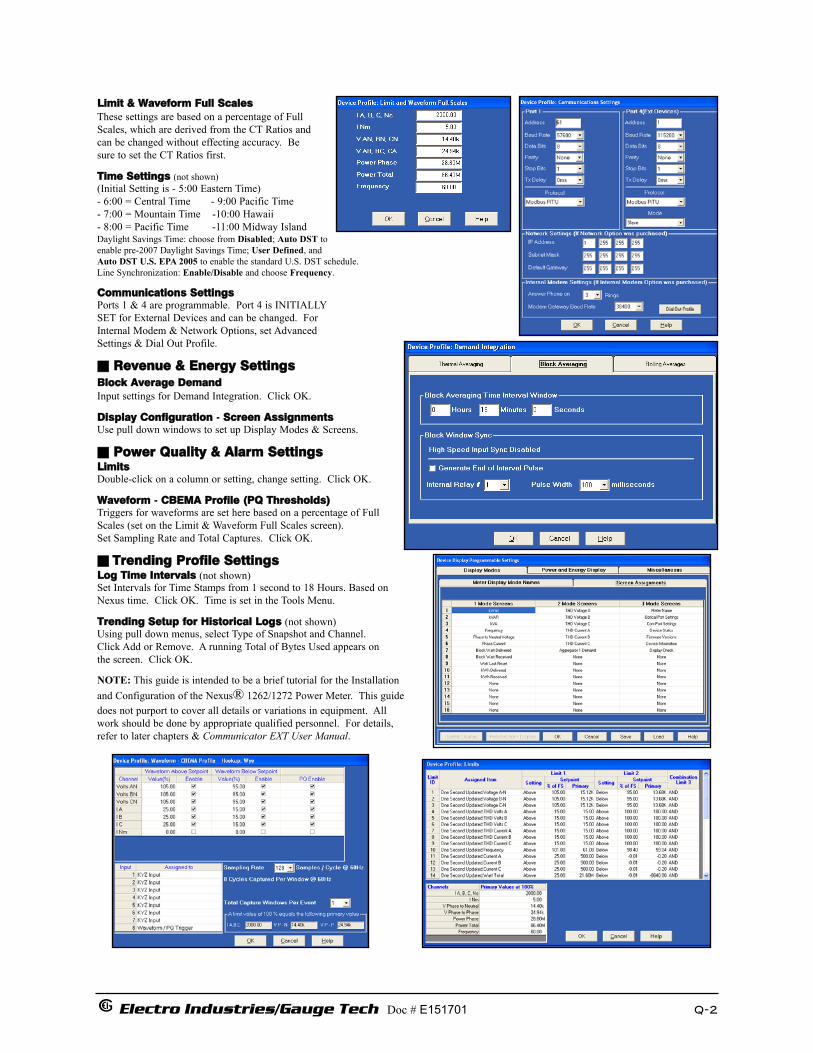
Limit & Waveform Full ScalesThese settings are based on a percentage of Full Scales, which are derived from the CT Ratios andcan be changed without effecting accuracy. Be sure to set the CT Ratios first.
Time Settings (not shown)(Initial Setting is - 5:00 Eastern Time)- 6:00 = Central Time - 9:00 Pacific Time- 7:00 = Mountain Time -10:00 Hawaii- 8:00 = Pacific Time -11:00 Midway IslandDaylight Savings Time: choose from Disabled; Auto DST toenable pre-2007 Daylight Savings Time; User Defined, and Auto DST U.S. EPA 2005 to enable the standard U.S. DST schedule.Line Synchronization: Enable/Disable and choose Frequency.
Communications SettingsPorts 1 & 4 are programmable. Port 4 is INITIALLYSET for External Devices and can be changed. For Internal Modem & Network Options, set Advanced Settings & Dial Out Profile.
Revenue & Energy SettingsBlock Average DemandInput settings for Demand Integration. Click OK.
Display Configuration - Screen AssignmentsUse pull down windows to set up Display Modes & Screens.
Power Quality & Alarm SettingsLimitsDouble-click on a column or setting, change setting. Click OK.
Waveform - CBEMA Profile (PQ Thresholds)Triggers for waveforms are set here based on a percentage of Full Scales (set on the Limit & Waveform Full Scales screen).Set Sampling Rate and Total Captures. Click OK.
Trending Profile SettingsLog Time Intervals (not shown)Set Intervals for Time Stamps from 1 second to 18 Hours. Based on Nexus time. Click OK. Time is set in the Tools Menu.
Trending Setup for Historical Logs (not shown)Using pull down menus, select Type of Snapshot and Channel. Click Add or Remove. A running Total of Bytes Used appears on the screen. Click OK.
NOTE: This guide is intended to be a brief tutorial for the Installation and Configuration of the Nexus® 1262/1272 Power Meter. This guide does not purport to cover all details or variations in equipment. All work should be done by appropriate qualified personnel. For details, refer to later chapters & Communicator EXT User Manual.

Electro Industries/Gauge Tech Doc # E151701 1-1
Chapter 1Quick Start Up for Nexus®Type S Meters
The Nexus® 1262/1272 Multiparameter Socket Meter can be installed in three ways: Type S Meter, Type A Meter (on an A Base) and Type Z Meter (in a Switchboard case). This Quick Start Guide is meant to give the field technician the basic steps for installation of the Type S Meter. Steps are detailed in later chapters of this manual.
1.1: Start-UUp and Bench CheckPower Up and Bench Check saves field time.
1.1.1: Meters with Auxiliary Power If the meter has an Auxiliary Power cable(Fig. 1.2), apply appropriate power to the 2 leads of the power cable. Meter information scrolls on the display.
1.1.2: Meters without Auxiliary Power To energize meters without Auxiliary Power,apply appropriate power to the voltage terminals of the meter. Terminals vary by Meter Form. The Nexus® 1272 Meter Form (FM 9S, 36S, 39S or 45S) is shown in the white block under the display (Fig. 1.1). See Figures 1.3 & 1.4 to determine terminals.
For Form 9S, 36S and 39S meters, connect appropriate power to the one of the threeleft most and to the right most voltage terminals (center row of smaller terminals).They are small, bold terminals in Figure 1.3.(The large terminals are current terminals for these Forms.) NOTE: Form 39S uses the same voltage terminals but the current terminals differ.Form 45S uses large terminals.
When the meter is energized, the display lights up and meter information scrolls on the display. This completes a 95% test of meter functionality.
OptionalAuxPowerCable
Cable 1Port 1Port 4IRIG-B
Cable 3Optional KYZ Cable
Cable 2Cable to High SpeedInputs
RJ-45 Ethernet
ModemCable 4RS-485 GatewayCable 5RJ-11 ModemCable 7Battery
EthernetCable 6RJ-45 Ethernet
OPTIONAL COMMUNICATIONCombo Modem / Ethernet
Cable 4RS-485 GatewayCable 5RJ-11 ModemCable 6
Figure 1.1: The Nexus® 1272 Meter
Figure 1.2: The Nexus® 1272 Meter Rear View Diagram
Fig 1.3: Form 9S & 36S Aux Terminals Fig 1.4: Form 45S Aux Terminals
VoltageTerminals
Common
Electro Industries/Gauge Tech Doc # E151701 1-2
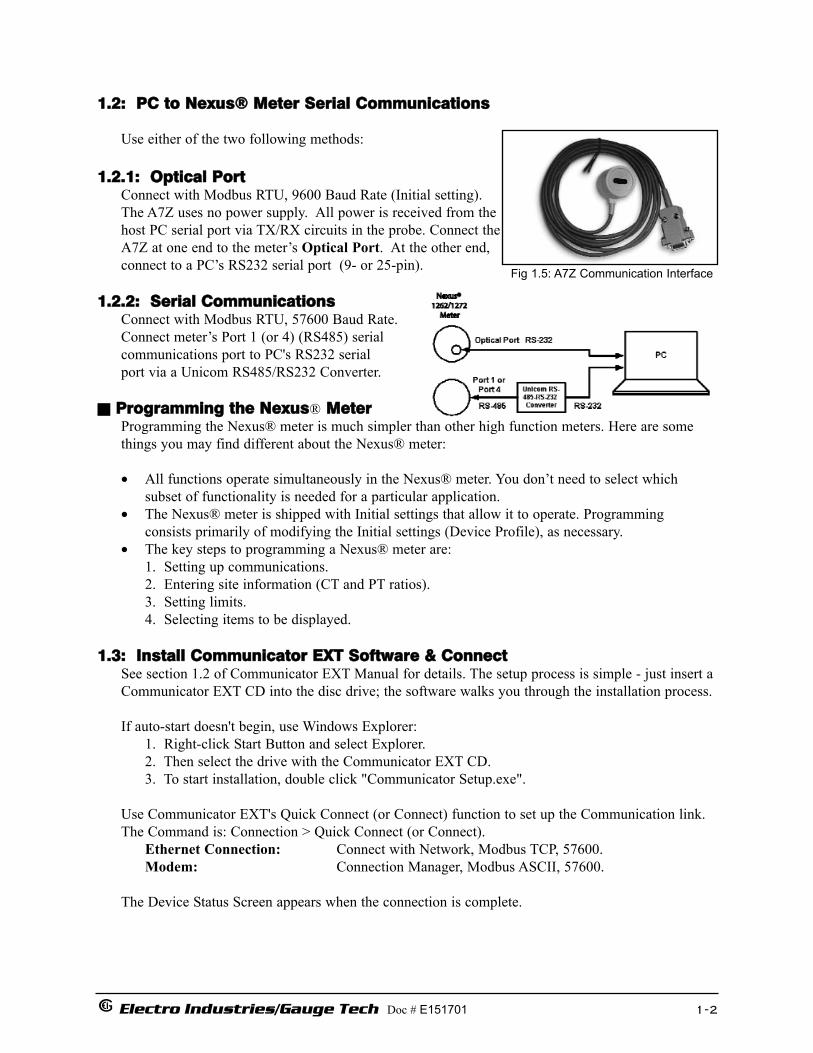
1.2: PC to Nexus® Meter Serial Communications
Use either of the two following methods:
1.2.1: Optical PortConnect with Modbus RTU, 9600 Baud Rate (Initial setting).The A7Z uses no power supply. All power is received from thehost PC serial port via TX/RX circuits in the probe. Connect theA7Z at one end to the meter’s Optical Port. At the other end,connect to a PC’s RS232 serial port (9- or 25-pin).
1.2.2: Serial CommunicationsConnect with Modbus RTU, 57600 Baud Rate.Connect meter’s Port 1 (or 4) (RS485) serial communications port to PC's RS232 serial port via a Unicom RS485/RS232 Converter.
Programming the Nexus® MeterProgramming the Nexus® meter is much simpler than other high function meters. Here are somethings you may find different about the Nexus® meter:
• All functions operate simultaneously in the Nexus® meter. You don’t need to select which subset of functionality is needed for a particular application.
• The Nexus® meter is shipped with Initial settings that allow it to operate. Programming consists primarily of modifying the Initial settings (Device Profile), as necessary.
• The key steps to programming a Nexus® meter are:1. Setting up communications.2. Entering site information (CT and PT ratios).3. Setting limits.4. Selecting items to be displayed.
1.3: Install Communicator EXT Software & ConnectSee section 1.2 of Communicator EXT Manual for details. The setup process is simple - just insert a Communicator EXT CD into the disc drive; the software walks you through the installation process.
If auto-start doesn't begin, use Windows Explorer:1. Right-click Start Button and select Explorer. 2. Then select the drive with the Communicator EXT CD. 3. To start installation, double click "Communicator Setup.exe".
Use Communicator EXT's Quick Connect (or Connect) function to set up the Communication link.The Command is: Connection > Quick Connect (or Connect).
Ethernet Connection: Connect with Network, Modbus TCP, 57600.Modem: Connection Manager, Modbus ASCII, 57600.
The Device Status Screen appears when the connection is complete.
Fig 1.5: A7Z Communication Interface

Electro Industries/Gauge Tech Doc # E151701 1-3
1.4: Configure Programmable Settings
• From the Communicator EXT Main screen, click the Profile Icon on the Tool Bar. Communicator EXT will copy the meter's initial profile into computer memory and display it for editing.
NOTE: You have now completed a 98% verification of Meter Function.
• Before making changes, Save the Initial Settings as Initial Settings.NPS* on the hard drive by clicking Save.
• Click on the Group (+/-) icon, e.g., General Settings; thendouble-click the parameter you want to set. The setting screen for the parameter opens. Make changes as needed. Click OK. Then use the buttons at the bottom of the screen to UPDATE DEVICE, SAVE, LOAD, print a REPORTor CANCEL. Section 1.5 details the primary Device Profilescreens.
• SAVE the new NPS File as Modified Settings.NPSor as a unique name to identify the file (Unique System ID or Customer’s Name, for example).
• To implement changes, click UPDATE DEVICE.• To LOAD a new or different file, select a file name.• RESET ALL LOGS in Main screen>Tools >Reset.
1.5: Device Profile Screens
General Settings
• CT and PT Ratios and System HookupAny change to CT settings will automaticallyupdate the corresponding Full Scale value in the Limit and Waveform Full Scales settings and will effect all other settings.
NOTE: Chapter 4 of the Communicator EXT UserManual contains detailed instructions for programming options the Nexus® 1262/1272 meter.
If you are using Block Demand, Transformer Loss Compensation, other than 15 minute demand or Load Profile Recording (Trending) the default values should be changed.
NOTE: Be sure to set the CT and VT ratios to values that are correct for the installation site.
Electro Industries/Gauge Tech Doc # E151701 1-4
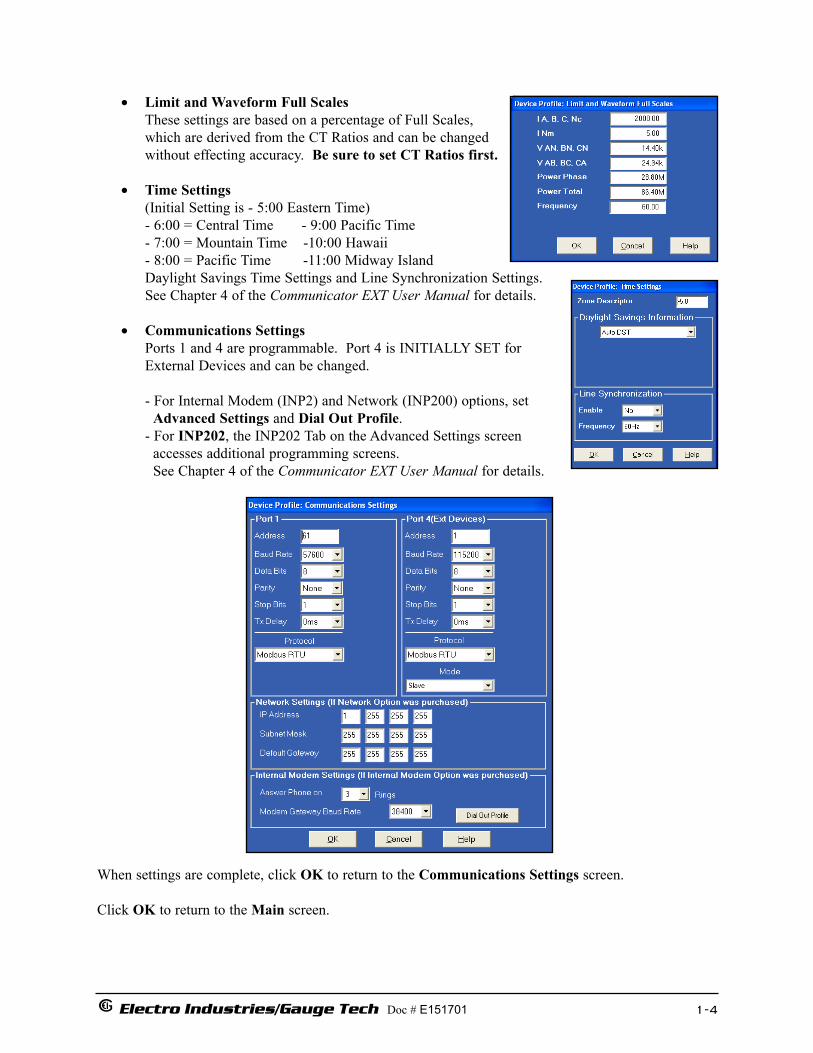
• Limit and Waveform Full Scales These settings are based on a percentage of Full Scales, which are derived from the CT Ratios and can be changed without effecting accuracy. Be sure to set CT Ratios first.
• Time Settings(Initial Setting is - 5:00 Eastern Time)- 6:00 = Central Time - 9:00 Pacific Time- 7:00 = Mountain Time -10:00 Hawaii- 8:00 = Pacific Time -11:00 Midway IslandDaylight Savings Time Settings and Line Synchronization Settings. See Chapter 4 of the Communicator EXT User Manual for details.
• Communications SettingsPorts 1 and 4 are programmable. Port 4 is INITIALLY SET forExternal Devices and can be changed.
- For Internal Modem (INP2) and Network (INP200) options, set Advanced Settings and Dial Out Profile.
- For INP202, the INP202 Tab on the Advanced Settings screen accesses additional programming screens. See Chapter 4 of the Communicator EXT User Manual for details.
When settings are complete, click OK to return to the Communications Settings screen.
Click OK to return to the Main screen.

Electro Industries/Gauge Tech Doc # E151701 1-5
Revenue & Energy Settings
• Block Average DemandInput settings for Demand Integration. Click OK.
• Display Configuration - Assign Screens Use pull down windows to set up Display Modes & Screens.
Power Quality & Alarm Settings
• LimitsDouble-click on a column or setting, change setting. Click OK.
• Waveform - CBEMA ProfileTriggers for waveforms are set here based on a percentage of Full Scales (set on the Limit &Waveform Full Scales screen).
Set Sampling Rate and Total Captures.
Click OK.

Electro Industries/Gauge Tech Doc # E151701 1-6
Trending Profile Settings
• Trending Log Time IntervalsSet Intervals for Time Stamps from 1 second to 18 Hours (based on Device time). Click OK. Device Time is set in the Tools Menu.
• Trending Setup for Historical LogsUsing drop-down menus, select Type of Snapshot and Channel. Click Add or Remove.
A running Total of Bytes Used appears on the screen.
Click OK.
See Chapter 4 of the CommunicatorEXT User Manual for details.
1.5.1: Save the New ProgramClick the SAVE Button on the Device Profile screen and give your new program an identifiablename.
1.6: Field InstallationYou now have a tested meter with a program for the site where it will be installed. Meter installationis like any other meter of that Form. See Chapter 11 of this manual for Wiring Diagrams.

Electro Industries/GaugeTech Doc # E151701 2-1
Chapter 2Nexus®1262/1272 Meter Overview
Figure 2.1: The Nexus® 1272 Meter
2.1: The Nexus® 1262/1272 Multiparameter Power Meter
The Nexus® 1262/1272 transformer-rated, polyphase meter is a unique collection of metering technolo-gies to fulfill advanced metering requirements. It provides high-accuracy power and energy measure-ments of voltage, current and all power values, data logging and power quality recording. The unitmakes the data available through the display, connected systems and historic logs.
2.2: Accu-MMeasureTM Technology - Theory of Operation
The advanced metering capability of the Nexus® 1262/1272 device is a result of EIG’s Accu-MeasureTM
Digital Sensing Technology. Accu-MeasureTM technology is a combination of high-speed sampling,high-resolution measurement and high-speed calculation. All voltage and current waveforms are sam-pled and RMS values calculated continuously every cycle. Values of voltage, current and power are pro-duced every three cycles and every second.
Figure 2.2 illustrates the key processes operating within the Nexus® 1272 meter. The meter allows forfour types of inputs and can provide outputs to an integrated display, pulse outputs and several communication ports. Nexus® 1262 meter processses are illustrated in Figure 2.3.
Voltage and current signals enter the meter and are sampled at up to 256 samples per cycle. Each sampleis resolved to a digital value using 16-bit analog-to-digital converters. Two 16-bit A/D converters areused for the 1272 (one for 1262). The first is for the real-time measurements. The second is for thewaveform recorder. The use of two A/D converters ensures that both signals have maximum resolution,accuracy and integrity. The second also isolates energy sampling and calculations from the waveformfault recording requirements. This provides both advanced energy and advanced waveform analysis.
Mode (Reed)Switch
Infrared TestPulse
Reset Switch
Form FactorDiagram
ExampleScreen
Bar Code
Optical Port
Test ButtonUnder Cover

Electro Industries/GaugeTech Doc # E151701 2-2
Figure 2.2: How the Nexus® 1272 Meter Processes Inputs
The digitized signals are then passed to the appropriate processor. Real-time measurements are calculated in one processor and made available for meter readings and historical logs. A separateprocessor performs waveform recording. Calculated data and logs are stored in memory for delivery todisplays, external systems and download processes.
The meter includes a time synchronizing input port that accepts an industry standard IRIG-B signal tosynchronize meter time to standard universal time. If there is no IRIG-B signal, the meter uses a timesynchronizing input port that uses line frequency to synchronize meter time to standard universal time.The Line Synchronization Feature may be Enabled or Disabled. If it is not Enabled, the Internal Clockprovides time sychronization. All readings and logs are time stamped to the nearest millisecond.
Eight status channels provide input of status or pulse signals. Status inputs are date/time stamped to thenearest millisecond and placed in the event log. Pulse inputs are multiplied by a user-supplied factorand accumulated in reading registers. These accumulated values can also be totalized. This featuremakes the Nexus® 1272 meter a good fit in universal metering applications. Any one input channel canbe selected to accept an End of Interval pulse from another meter.
Meter set-up parameters and all historical log data are stored in nonvolatile RAM. The user has multiplelog functionality. Data is made available through the onboard display. Display screens are described inSection 2.3.3. Several additional communication channels operate simultaneously, including the option-al Ethernet/Modem Combo Card.. External systems can be connected to either of the RS485 ports orthe Ethernet/Modem port. Stored data can be downloaded through the RS485 ports, theEthernet/Modem port or the IR port.

Electro Industries/GaugeTech Doc # E151701 2-3
Figure 2.3: How the Nexus® 1262 Meter Processes Inputs
Voltage and current signals enter the meter and are sampled at up to 256 samples per cycle. Each sample is resolved to a digital value using a 16-bit analog-to-digital converters. The 16-bit A/D converter is for the real-time measurements. The Nexus® 1262 meter does not have a second converterfor ITIC/CBEMA Log or Waveform recording.
The meter includes a time synchronizing input port that accepts an industry standard IRIG-B signal tosynchronize meter time to standard universal time. If there is no IRIG-B signal, the meter uses a time-synchronizing input port that uses line frequency to synchronize the meter time to standard universaltime. The Line Synchronization Feature may be Enabled or Disabled. If this feature is not Enabled, theInternal Clock provides the time sychronization. All readings and logs are time stamped to the nearestmillisecond.
Meter setup parameters and all historical log data are stored in nonvolatile RAM. The user has multiplelog functionality. Data is made available through the onboard display. Display screens are described inSection 2.3.4. Several additional communication channels operate simultaneously, including the option-al Ethernet/Modem Combo Card (separate connections that can be used simultaneously). External sys-tems can be connected to either of the RS485 ports or the Ethernet/Modem port. Stored data can be downloaded through the RS485 ports, the Ethernet/Modem port or the IR port.

Electro Industries/GaugeTech Doc # E151701 2-4
2.3: Advanced Measurement Functionality
2.3.1: Advanced Revenue Billing Capability
The Nexus® 1262/1272 device is a full four-quadrant power meter with accuracy of within 0.06% ofreading. Energy measurements include: kWh Delivered & Received, kVARh Delivered & Received,kVAh, kVARh, kWh in each quadrant and Total kVAh. The meter measures instantaneous power andprovides multiple, simultaneous demand measurements, including time-stamped maximum and mini-mum readings.
Time of UseThe Nexus® meter’s Time of Use functionality offers the following standard capabilities:
• 8 TOU Schedules• Bidirectional Consumption and Demand• 4 Seasons/Year• 20 Year Calendar• Prior Month and Prior Season Readings for each Schedule• Present Month and Present Season Readings for each Schedule• Total to Date Readings for each Month• Total to Date Readings for each Season• Cumulative and Continuous Cumulative Demand
Load Aggregation/ Universal MeteringUsing standard pulse inputs, the Nexus® 1262/1272 meter can count pulses from external meters and accumulate usage. The pulse inputs can be used to totalize electrical usage and utility values,such as water or gas use data. Readings include:
• 8 Pulse Inputs• Individual Accumulating Registers• 4 Totalizing Registers• Totalize with Nexus® meter kWh Readings
Multiple Demand WindowsThe Nexus® 1262/1272 meter simultaneously monitors four demand structures. The unit offers:
• Block Window Demand• Rolling Window Demand• Predictive Demand• Thermal Demand• Interval Length from 1 second to many hours• Up to 15 Sub-Intervals• End of Interval Pulse Output (with Optional 4IPO Internal KYZ capability)• End of Interval Pulse Input
Time Stamped Max/Min DemandsThe unit gathers Time Stamped Max/Min Demands for all power values. Each of the following values is date/time stamped:
• kW Demand, Delivered & Received, Max/Min• kVAR Demand, Delivered & Received, Max/Min• kVAR Coincident with kW Demand• kVA Demand, Max/Min• Amps Demand, Max/Min• Voltage Demand Max/Min

Electro Industries/GaugeTech Doc # E151701 2-5
Transformer Loss CompensationTransformer Loss Compensation adjusts for both copper and iron losses with a simple user setup.
2.3.2: Advanced Communications and I/O Capabilities
The Nexus® 1262/1272 meter features advanced communication which utilizes multiple com portsusing open protocols. The meter’s multi-port design allows multiple communication connections simul-taneously. The Nexus® 1262/1272 system provides a direct digital link to your customer, allowingselected data to be gathered without affecting the meter or your data. All of the advanced features of the1262/1272 are made available through industry-standard Modbus and DNP 3.0 protocols. No propri-etary or closed protocols are used.
Standard Communications• ANSI Type 2 Optical Port (IR Port)• 2 RS485 Serial Ports• Modbus RTU/ASCII Protocol• DNP 3.0 Level 2 + Protocol• Speeds up to 115k bps
Optional CommunicaionsThe Nexus® 1262/1272 meter allows you to select an additional port for one of the following uses:
• INP2: Internal 56k Modem with noise rejection• INP200: Internal Ethernet TCP/IP (10/100BaseT) with multiple sockets and Modbus TCP.• INP202: Combination 56k Modem and Internal Ethernet TCP/IP (10/100BaseT)
Standard Internal I/OExtensive I/O capability is available in conjunction with all metering functions.
• IRIG-B Time Synchronizing to GPS to 1 millisecond resolution.• 8 High-Speed Status Inputs for status detect or of load aggregation/universal metering
inputs.• Line Frequency Time Synchronization
Internal I/OThe meter offers four optional KYZ Pulse Outputs which can be programmed to pulse for any accumulated reading. One of the pulse outputs can also be set for an End-of-Interval Sync Pulse.Upgradeable External Output ModulesThe user can select from the following optional Output Modules for enhanced capability.
• Analog Outputs• KYZ Outputs• Relay/ Alarm Outputs
Control Options• ElectroLogicTM provides user-definable control outputs.• Action and/or alarm on Abnormal Condition.• Action on Boolean Logic Combinations.

Electro Industries/GaugeTech Doc # E151701 2-6
2.3.3: EN 50160 Flicker
The Nexus® 1272 meter provides EN50160 Flicker evaluation in Instantaneous, Short Term and LongTerm forms. For a detailed explanation of Flicker, see Chapter 14 of this manual.
2.3.4: Display Screens
The Nexus® 1262/1272 meter features a built-in graphical back-lit FSTN LCD display with extended temperature voltage compensa-tion. This allows you to view energy data and to gather circuit diag-nostic data such as voltage, current, harmonics and phasor informa-tion. This display is easily programmable. An example of a pro-grammed screen is shown here. The Programmable Display is covered in detail in Chapter 3 of this manual.
2.3.5: Additional Switches
The Nexus® 1262/1272 meter has additional switches & signals that help in using the unit (Fig. 2.1).• The Infrared Test Pulse can be set to pulse for +Watt-hour, -Watt-hour, +VAR-hour,
-VAR-hour and VA-hour. The pulse uses a time-modulated pulse integration which allows the pulse to be accurate during short duration pulse tests. The pulse integration uses industry-accepted reference standards.
• The Mode Switch (magnetic reed switch) uses a magnet to switch operating modes.• The Test Button.• The Reset Button.
2.3.6: Nexus® External Output Modules
A variety of optional analog or digital Output modules mount externally to the Nexus® 1262/1272Socket Meter. The Nexus® 1262/1272 Unit DOES NOT SUPPLY POWER TO Output Modules.Use a power supply, such as EIG PSIO, to power optional Output Modules. See Chapter 10 for detailson installation and use of the Nexus® External Output Modules.
2.3.6.1: Optional P40N, P41N and P43N LED Remote Displays
The Nexus® 1262/1272 Socket Meter features a back-lit LCD display built into the face of the meter.In addition, Electro Industries offers four optional external displays, each powered by a power supply(such as the PSIO). The P40N, P41N and P43N are LED displays which provide easy-to-use access toinformation stored in the meter when an additional display is required for remote access. See Chapter 9for further details.
2.3.6.2: Optional P60N Touch Screen Remote Display
The P60N is the Touch Screen Display which also provides easy access to meter readings and data whenan additional display is required. The P60N presents this data on a graphical touch screen.The P60Nrequires an additional power source, such as the PSIO. See Chapter 9 for further details.

Electro Industries/GaugeTech Doc # E151701 2-7
2.4: Nexus® 1262/1272 Meter Forms
The Nexus® 1262/1272 Socket Meter offers three supported S-Based Meter Forms based on the rated voltage and hookup required by the user. Below are the form specifications. Form 9S can be ordered in an A-Base (Order Form 9A). See Chapter 11 for corresponding Wiring diagrams and Appendix B for Blade configurations. The Switchboard Meter offers two supported Z-Based Forms, 9Z and 36Z (see Chapter 12).
NOTE: Form 45S replaces Form 5S and may also be used in 4-wire circuits.
Nexus® 1262/1272 Meter Forms
NOTE: See Section 2.5 for Rated Voltages.
Nexus® 1262/1272 Meter Accuracy
Form Hookup
9S 3E Wye or Delta
36S 2 1/2E Wye
45S 2 1/2E Wye or 4W Delta
Value Accuracy
Voltage 0.02%
Current 0.05%
Frequency 0.001Hz
kW 0.06%
[email protected] 0.06%
[email protected] 0.10%
kVAR 0.10%
kVA 0.10%
PF 0.10%

Electro Industries/GaugeTech Doc # E151701 2-8
2.5: Nexus® 1262/1272 Meter Specifications Overview
Sense Input Voltage• Rated 0 to 332 Volts line-to-neutral; 0 to 480 Volts line-to-line.• Operating 96 to 332 Volts line-to-neutral; 155 to 576 Volts line-to-line.Input Voltage - Self-Powered Option Power Supply• Rated 96 to 332 Volts line-to-neutral; 155 to 576 Volts line-to-line.Input Voltage - Low Voltage Power Supply• Rated 30 to 90 Volts line-to-neutral; 52 to 155 Volts line-to-line.Input Current• Transformer Rated Continuous 120% of meter class.• Defined as Class 20 (Class 2 and Class 10 Available).• Nominal current rating: 5A for Class 20 and 10 meters; 1A for Class 2 meters.• Overload 500% for 1 second, non-recurring.• Three or four current inputs depending on form (IA, IB, IC and IN).Frequency• 45-62 Hz.Burden (Sense Inputs)• Voltage Inputs: 0.33VA@576V.• Current Inputs: [email protected]• All inputs and outputs isolated to 2500 Volts. • Com Ports isolated from each other to 1000 Volts.Sensing• Accu-MeasureTM Technology.• 2x16-bit A/D converter (1272). 1x16-bit A/D Converter (1262).• True RMS.• 8-Channel Sample and Hold.Memory• All meter setup parameters, measurements and logs contained in nonvolatile RAM.Compliance• ANSI C12.20 Class 0.2 and IEC60687 (Accuracy).• ANSI C37.90.1 (Surge Withstand).• ANSI C62.41 (Surge Immunity).• ANSI C12.18 (Optical Port).• IEC 61000-4-15 (Flicker) (1272).Standard Communications• LCD Display.• ANSI Type 2 Optical Port (IR Port).• Two RS485 Serial Ports.• Modbus RTU, Modbus ASCII and DNP 3.0 protocols.• Data Speeds of up to 115k bps.Optional Communications• INP2: Internal Modem with data buffering for faster downloads and noise rejection.Connect
speeds of 300 to 56k bps.• INP200: Internal 10Mbit Ethernet.• INP202: Ethernet (INP200) / Modem (INP2) Combination
Electro Industries/GaugeTech Doc # E151701 2-9
Internal 8-Channel Digital KYZ Pulse/Status Inputs• Type: Self-excited, for dry contacts only.• Wetting Voltage: 12Vdc typical.Internal 4-Channel KYZ Outputs• Type: Form C.• On Resistance: 23-35Ω.• Peak Voltage: 350Vdc.• Continuous Load Current: 120mA.• Peak Load Current: 350mA (10ms).• Off-State Leakage Current @350Vdc: 1 µA.• Opto Isolation: 3750Vrms (60 Hz, 1 min.).Timing• IRIG-B input for synchronizing to external GPS clock signal.• Line Frequency Synchronization.• Internal Clock.Environmental• Operating Temperature: (-40 to +85)°C.• Display Operating Temperature: (-20 to +70)°C.• Humidity: 95% non-condensing.• Storage Temperature: (-40 to +85)°C.• Lexan Cover.Power Supply (Unit is powered by 3-Phase Voltage Sense Inputs.)• (96 to 550)Vac 50/60Hz (576Vac absolute maximum), Autoranging 3-Phase Power Supply.
Meter power requirement 3VA/Phase @ 120Vac worst case.• Meter power provided by any of the 3-Phase voltage sources being monitored.Aux Power Supply Option (Unit is powered by Aux Pigtail Wire.)• Select Power Supply Option “SE” in ordering information.• Input Voltage: 102 to 270V AC/DC 50/60Hz • Maximum Power Consumption: [email protected]• Hardware lock secures meter settings.• Two 10-character passwords.• One password controls access to read meter digitally.• Separate password controls access to program meter.Internal Battery• Panasonic BR2032 3V Lithium Battery (or equivalent) maintains NVRAM and time during
outages.Modem Battery• 3V Lithium Battery with custom leads and velcro mounting maintains Dial-Back Feature during
outages. Call factory for replacement battery.
Electro Industries/GaugeTech Doc # E151701 2-10
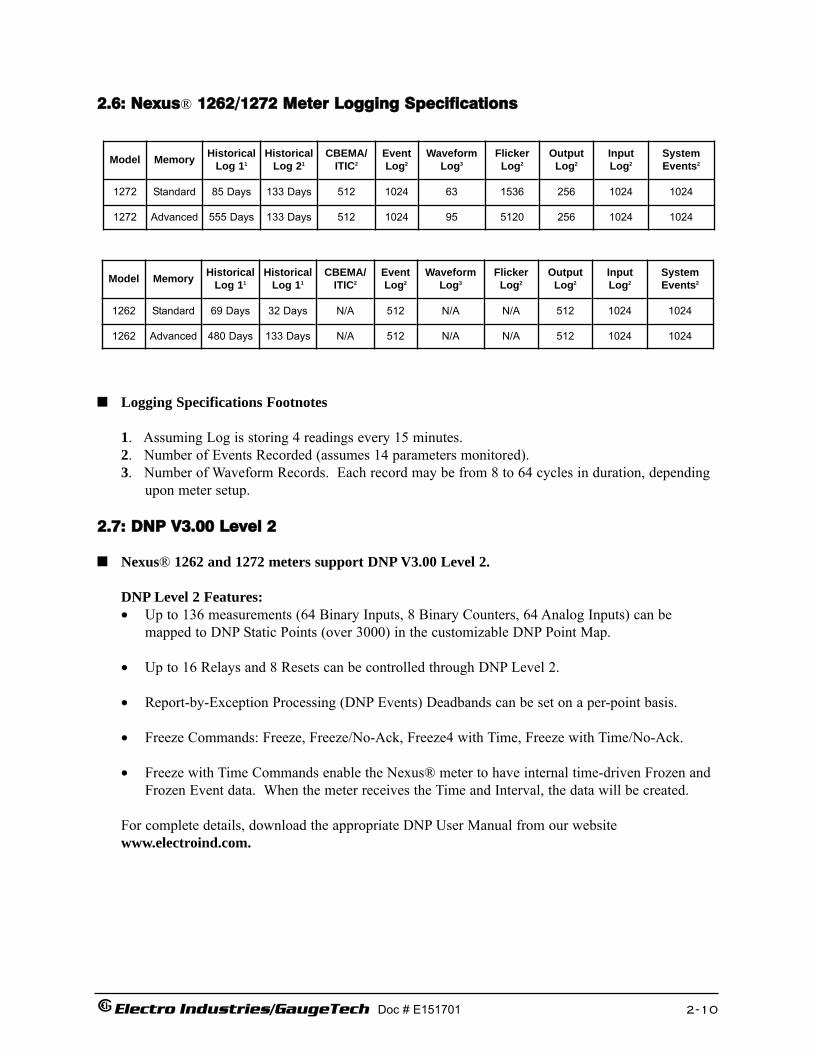
2.6: Nexus® 1262/1272 Meter Logging Specifications
Logging Specifications Footnotes
1. Assuming Log is storing 4 readings every 15 minutes.2. Number of Events Recorded (assumes 14 parameters monitored).3. Number of Waveform Records. Each record may be from 8 to 64 cycles in duration, depending
upon meter setup.
2.7: DNP V3.00 Level 2
Nexus® 1262 and 1272 meters support DNP V3.00 Level 2.
DNP Level 2 Features:• Up to 136 measurements (64 Binary Inputs, 8 Binary Counters, 64 Analog Inputs) can be
mapped to DNP Static Points (over 3000) in the customizable DNP Point Map.
• Up to 16 Relays and 8 Resets can be controlled through DNP Level 2.
• Report-by-Exception Processing (DNP Events) Deadbands can be set on a per-point basis.
• Freeze Commands: Freeze, Freeze/No-Ack, Freeze4 with Time, Freeze with Time/No-Ack.
• Freeze with Time Commands enable the Nexus® meter to have internal time-driven Frozen and Frozen Event data. When the meter receives the Time and Interval, the data will be created.
For complete details, download the appropriate DNP User Manual from our website www.electroind.com.
Model Memory HistoricalLog 11
HistoricalLog 21
CBEMA/ITIC2
EventLog2
WaveformLog3
OutputLog2
InputLog2
1272 Standard 85 Days 133 Days 512 1024 63 256 1024
1272 Advanced 555 Days 133 Days 512 1024 95 256 1024
FlickerLog2
1536
5120
SystemEvents2
1024
1024
Model Memory HistoricalLog 11
HistoricalLog 11
CBEMA/ITIC2
EventLog2
WaveformLog3
FlickerLog2
OutputLog2
InputLog2
SystemEvents2
1262
1262
Standard
Advanced
69 Days
480 Days
32 Days
133 Days
N/A
N/A
512
512
512
512
1024
1024
1024
1024
N/A
N/A
N/A
N/A
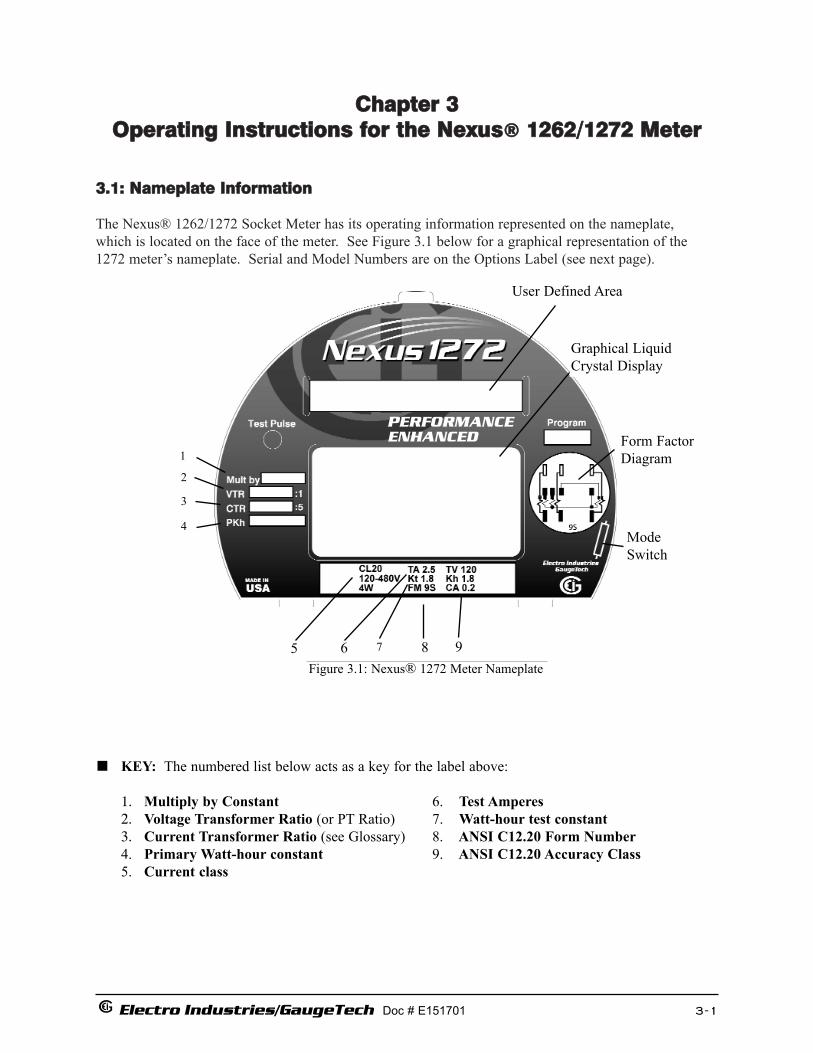
Chapter 3Operating Instructions for the Nexus®® 1262/1272 Meter
3.1: Nameplate Information
The Nexus® 1262/1272 Socket Meter has its operating information represented on the nameplate, which is located on the face of the meter. See Figure 3.1 below for a graphical representation of the 1272 meter’s nameplate. Serial and Model Numbers are on the Options Label (see next page).
Electro Industries/GaugeTech Doc # E151701 3-1
Figure 3.1: Nexus® 1272 Meter Nameplate
KEY: The numbered list below acts as a key for the label above:
1. Multiply by Constant 6. Test Amperes2. Voltage Transformer Ratio (or PT Ratio) 7. Watt-hour test constant3. Current Transformer Ratio (see Glossary) 8. ANSI C12.20 Form Number4. Primary Watt-hour constant 9. ANSI C12.20 Accuracy Class5. Current class
5 6 8 9
1
2
3
4
7
Graphical LiquidCrystal Display
Form FactorDiagram
ModeSwitch
User Defined Area
PERFORMANCEENHANCED

The Options Label is located on the outside of the internal shroud. It is prepared specifically foreach meter and shows the ordered options that are included in the meter. An example of a typicallabel is shown above. Below is a list of options available for the meter:
• Memory (1272): Memory (1262):
S (Standard) 2M of RAM S (Standard) 512K of RAM
A (Advanced) 4M of RAM A (Advanced). 2M of RAM
• Output Modules:
1mAON4 4 Analog Outputs, 0-1mA1mAON8 8 Analog Outputs, 0-1mA20mAON4 4 Analog Outputs, 4-20mA20mAON8 8 Analog Outputs, 4-20mA4RO1 4 Relay Outputs4PO1 4 Solid State Pulse Outputs
• Communication Options:
INP2 - Dial Out OptionINP200 - Ethernet 10/100BaseTINP202 - Ethernet/Modem Combination
• EIG Number: Model Number plus Option Numbers: (Example below)
Model - Memory - Form - Freq - Power Supply - Outputs - Communication1272 - A - 9S - 60Hz - S - 4PO1 - INP200
Electro Industries/GaugeTech Doc # E151701 3-2

Electro Industries/GaugeTech Doc # E151701 3-3
3.2: Basic Operations
Figure 3.2: Nexus® 1262/1272 Meter Switches and Indicators
Switches and Indicators
There are two switches accessible from outside the meter cover.
1. The Mode Switch (also called a Reed Switch) is used to switch from Normal Mode toCircuit Diagnostic Mode or Time of Use Mode.
2. The Reset Switch is used to reset demand.
A third switch, the Test Button, is accessible only when the cover has been removed. The TestButton switches the meter from one of the operational modes to Test Mode and back to NormalMode. The Test Button is also used to access Display Adjustments Mode during Powerup Mode.The Display Adjustments Mode is discussed in Section 3.5.
The Optical Port is on the lower left side of the face. The Optical Port facilitates infrared communication with the meter. Using an A7Z Communication Interface (or other ANSI C12.13Type II magnetic optical Communications coupler) and an RS232 cable from the A7Z to a PC, youcan program the meter with Communicator EXT software.
An Infrared Test Pulse is located on the upper left side of the face. Energy pulsing applications canbe configured using Communicator EXT software.
A Phase Indicator is located on the lower right side of the face. “ABC” will stay illuminated if allthree phases of voltage and current are present. “ACB” indicates reversed phase sequence. It willblink A, B or C if one phase is not present. If all phases are not present, the meter will turn off(unless you have an Aux pigtail connected to a power source).
Mode (Reed)Switch
Activate Mode(Reed) Switchwith a Magnetswiped on theside of themeter.
Test ButtonUnder Cover
Reset Switch
InfraredTest Pulse
Optical Port

3.3: Display Information
The Nexus® 1262/1272 meter uses a graphical back-lit FSTN LCD Programmable Display with extend-ed temperature voltage compensation. This allows you to view energy data and to gather circuit diagnos-tic data such as voltage, current, harmonics and phasor information.
A wide range of values can be defined for display using the User Modes and screens in theProgrammable Display and Communicator EXT software. Three View Modes, plus Test Mode and aSelect Compensation Screen allow tremendous flexibility in setting up the Display modes and thescreens within the modes. View Modes are user created with up to 16 screens each, which display inauto sequence every 7 seconds. Most of the screens have a Status Bar across the bottom which displaysthe date, time and phase (if there are inputs). View Mode 1 is the primary mode. The other modes willautomatically return to View Mode 1 after a user-set amount of time from last user action.
Low Battery• Lo Batt - NVRam (Internal Battery) or Lo Batt - Modem (Modem Battery) will flash on
the screen being displayed every 10-15 seconds ONLY when the Internal (or Modem) Battery is running low or when it is not “clicked” into place properly. If the batteries are not low, NO INDICATOR will appear.See installation instructions in sections 6.2 and 6.2.1.
Test Mode• Wh Test - Same as kWh screen, except in Wh instead of kWh• VARh Test - Same as kVAR screen, except in VARh (Quadrants)• VAh Test - Same as kVAh screen,except in VAh (Quadrants)• Watt Rolling Demand Test (Delivered and Received)• Watt Block Demand Test (Delivered and Received)
Initial Display ScreensThe Nexus® 1262/1272 meter is shipped with Initial Display Screens, which will scroll on the display as soon as you power up the meter. The Initial Display Screens are a sampling of the manyscreens available for the Programmable Display, which is detailed in sections 3.4 to 3.7.
Typical Initial Display Screens:Meter Data, including Boot, Run, DSP Boot, DSP Run, Serial Number, Protect Enabled, Baud
Wh Delivered Wh ReceivedkVARh per Quadrant kVAh per QuadrantRolling W Demand Delivered Rolling W Demand ReceivedBlock W Demand Delivered Block W Demand ReceivedW Demand Last Reset Cumulative W Demand
BacklightThe Backlight cannot be set to stay on indefinitely. It will turn off after the amount of time selected.One hour is the maximum setting. If the backlight has timed out and is off, you need to hit the Mode Switch once to turn on the backlight and redirect the screen automatically.
Electro Industries/GaugeTech Doc # E151701 3-4
Electro Industries/GaugeTech Doc # E151701 3-5
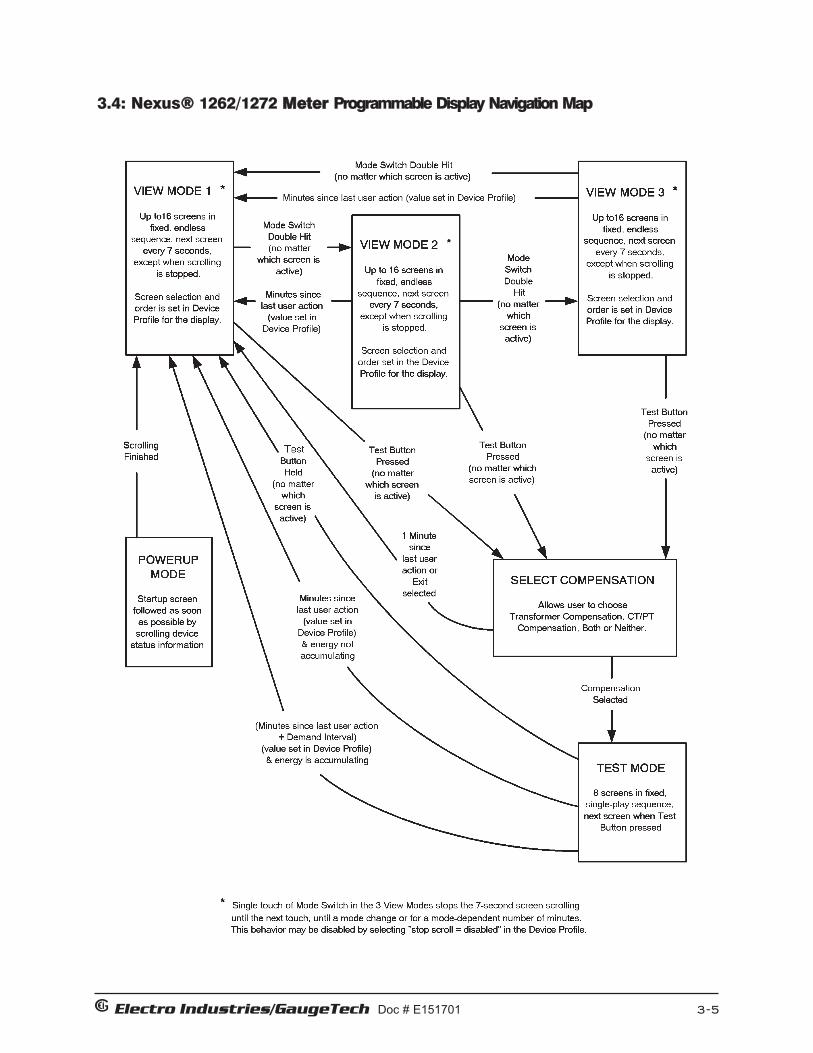
3.4: Nexus® 1262/1272 Meter Programmable Display NavigationMap

e Electro Industries/GaugeTech Doc # E151701 3-6
3.5: Programmable Display Overview
The Programmable Display has three configurable modes with up to 16 screens each. The threemodes are displayed in auto sequence every 7 seconds. Using Communicator EXT, you can assignup to 16 screens to each mode: any of the available screens can be used in any mode. You can alsoassign a three-digit label to the mode. The three modes are:
•• Configurable View Mode 1 - Replacing Normal Mode•• Configurable View Mode 2 - Replacing Circuit Diagnostic Mode•• Configurable View Mode 3 - Replacing Time of Use Mode
This feature allows you to determine what data will be displayed and in what order on the display.Larger (.56”) digits are displayed on many of the screens so that data is much easier to read.
View Mode 1 is the primary mode. The other modes, View Mode 2 and View Mode 3 are accessed by swiping the Mode Switch twice. Test Mode is accessed by removing the cover(POWER MUST BE OFF), powering up the meter and pushing the Test Button at any time.
View Mode 2 and View Mode 3 will automatically return to View Mode 1 after a user-set amount of time without any action. Test Mode will automatically return to View Mode 1 after an amount of time since the last user action with no energy accumulation (or) an amount of time since the last user action plus the demand interval with energy accumulation. The values for the amount of time since the last user action are set in the Miscellaneous screen of the User Inactivity Time Outs section.
The Programmable Display can be edited through Communicator EXT even if the meter is not connected to the computer. Refer to the next section (Section 3.6) for instructions.
See the Communicator EXT User Manual for additional details on programming and polling theNexus® 1262/1272 meter.

eElectro Industries/GaugeTech Doc # E151701 3-7
3.6: LCD Programmable Display Setup
1. From the Communicator EXT Mainscreen, click Tools>Edit LCD Programmable Settings.
2. You will see the screen shown on the.right.Use the tabs at the top of the screen to navigate to different setting screens.
3. Click the Meter Display Mode Names tab.a. Enter a three-letter label for each
of the three View Modes.b. Enter a description for each mode
using the Line 1 and Line 2 Description fields.
4. Click the Screen Assignments tab.
a. Double-click on the screen youwant to change.
b. Enter up to 16 screens under each mode on the screen. Your Label for each mode will appear at the top of each column.
5. Click the Power and Energy Display tab.
Enter settings for Power and Energy:
Number of Digits: 4 - 9 (Primary Power).Decimal Point Location:0 - 3 (Primary Power)Display Leading Zeroes:check if desired.Energy Display: Select the Multiply by Constant value. Check Apply to the Demand Registers as Well if desired.
A Preview appears at the bottom of the screen.

eElectro Industries/GaugeTech Doc # E151701 3-8
NOTES:
• Settings on this screen control the display of energy related numbers. Care should be given to match the values on the display with those in the historical logs. These settings apply to VA-hours,watt-hours(+/-), VAR-hours (+/-) and VAR-hours (each quadrant) in the meter.
• This Number of Digits setting controls the display and storage of all digits displayed on the screen, and it sets the Register Rollover for all energy-type registers.
6. Click the Miscellaneous tab. The Screen settings replace Adjustments Mode in the default Device profile.
. a. Enter settings in the Miscellaneousscreen:
Screen Settings:Back Light Level: 0-Off to 4-BrightestBack Light Time (Back Light shuts off): 00min, 30sec - 60min,00secContrast: 0 - Highest to 7 - LowestScroll Stop: Enabled or DisabledPhasor Rotation: Clockwise or CounterclockwiseDemand Shown: Cumulative or Continuous CumulativeTime of Use Demand:Block/Rolling or Cumulative Date Format: Month/Day/Year or Day/Month/Year
Optical Port Settings:Baud Rate: 1200, 2400, 4800, 9600, 19200, 38400 or 57600Optical Receive: Non-Inverted or Inverted
User Inactivity Time Outs (number of minutes since last user action when Mode reverts to View Mode 1) (Settings are 5 to 60 minutes with 1 minute intervals.):Leave Test Mode After _ Minutes: Reverts with or without energy accumulation.Leave View Mode 2 After _ Minutes: Reverts automatically.Leave View Mode 3 After _ Minutes: Reverts automatically.
7. Use Buttons for Functions below:Update Display: Click to send the new settings to the display.
(After settings have been updated, View Mode 1 is displayed.)Retrieve from Display: Click to Retrieve existing settings.Cancel: Click to Cancel any new settings, return to Communicator EXT Main screen.Save: Click to Save new settings to a file.
9. When you have finished making any changes, click Update Display to send the new settings to the display. Pop-up windows will tell you that the changes have been made and you will return to the Communicator EXT Main screen.

eElectro Industries/GaugeTech Doc # E151701 3-9
3.7: Programmable Display Screens
The Nexus® Programmable Display screens have some features that make them very user friendly:
1. Many of the screens have larger digits (.56”) which are more legible. 2. There are more screens from which to format your data. 3. The Polling Indicator in the right corner of the Status Line provides two functions:
A. A blinking indicator shows that the display is receiving data from the meter.B. Power Flow is displayed by different shaped icons.
1. When no power is flowing, a solid block is displayed.2. An animated arrow pointing RIGHT indicates positive power flow.3. An animated arrow pointing LEFT indicates negative power flow.
4. Modifiers enhance the flexibility of some screens. See section 3.7.1.
Below is a list of available screens with some example screens:
Screen ScreenNumber Name
1 Wh Delivered2 Wh Received3 +VARh4 -VARh5 VAh11 Rolling W Demand Del12 Rolling W Demand Rec13 Block W Demand Del14 Block W Demand Rec15 W Demand Last Reset16 Phase to Neutral Voltage17 Phase Current18 Phasors20 VAR, PF, Frequency21 Va, Vab Harmonics22 Vb, Vbc Harmonics23 Vc/Vca Harmonics24 Ia Harmonics25 Ib Harmonics26 Ic Harmonics45 Totalizer 146 Totalizer 247 Totalizer 3

eElectro Industries/GaugeTech Doc # E151701 3-10
48 Totalizer 449 Totalizer 1 Demand50 Totalizer 2 Demand51 Totalizer 3 Demand52 Totalizer 4 Demand53 Cumulative Demand, Del & Rec54 Phase to Phase Voltage55 W56 VAR57 PF58 VA59 Frequency60 Segment Check61 Q63 Meter Name64 Optical Port65 Com Port Settings66 Nexus Ststus67 Firmware Versions68 Nexus Info69 Average PF Received (Modifier 7)70 Average PF Delivered (Modifier 7)71 VARh per Quadrant (Modifier 1)72 VAh per Quadrant (Modifier 1)73 Wh per Quadrant (Modifier 1)74 Qh (Modifier 3)75 Cumulative Demand (Modifier 2)76 Rolling Window Demand (Modifier 4)77 Block Window Demand (Modifier 4)78 Power Factor per Phase (Modifier 6)79 Power Factor per Quadrant80 TOU Wh, Rec (Modifier 5)81 TOU VAh, Q1 (Modifier 5)82 TOU VARh, Q1 (Modifier 5)83 TOU VAh, Q4 (Modifier 5)84 TOU VARh, Q4 (Modifier 5)85 TOU Wh, Del (Modifier 5)86 TOU VAh, Q2 (Modifier 5)87 TOU VARh, Q2 (Modifier 5)88 TOU VAh, Q3 (Modifier 5)89 TOU VARh, Q3 (Modifier 5)90 TOU W Demand, Rec (Modifier 5)91 TOU W Demand, Del (Modifier 5) 92 TOU + VAR Demand (Modifier 5) 93 TOU-VAR Demand (Modifier 5)

e Electro Industries/GaugeTech Doc # E151701 4-1
Chapter 4Testing for the Nexus®® 1262/1272 Meter
WARNING!The information contained within this chapter is intended to be an aid to qualified metering personnel. It is not intended to replace the extensive training necessary to install or remove metersfrom service. Any work on or near energized meters, meter sockets or other metering equipmentpresents the danger of electrical shock, personal injury or death. All work on these products mustbe performed by qualified industrial electricians and metering specialists ONLY.All work must be done in accordance with local utility safety practices and the procedures outlinedin the current edition of the Handbook for Electricity Metering. The handbook is available from the Edison Electric Institute, 701 Pennsylvania Avenue N.W., Washington D.C. 20004-2696.
4.1: Testing Tools
The Nexus® 1262 and 1272 meters are equipped with a light-emitting diode (LED) for calibrationand a liquid crystal display with test screens. These two standard features provide user interface andequipment interface points for meter testing.
4.1.1: Test Pulse LED
The Test Pulse LED is located in the upper left-hand portion of the meter face as shown in Figure4.1. The Test Pulse LED continuously emits calibration pulses (infrared light). This LED can beused for a variety of pulses including: Individual quadrants for Watthour, VAhour, VARhour andWatt Demand pulses. Each calibration pulse is equal to the value assigned to Kt (Watthours perpulse) in the meter’s Device Profile. The millisecond duration of each output pulse is also programmable in the meter’s Device Profile.
Test ButtonUnder Cover
Reset Switch
InfraredTest Pulse
Optical Port
Figure 4.1: The Nexus® 1272 Meter
e Electro Industries/GaugeTech Doc # E151701 4-2
To program the Test Pulse LED, from the Device Profile menu in Communicator EXT, first clickon KYZ Outputs, then click on any of the Test LED pull-down menus to configure the following settings:
1. Assigned Channel - choose from settings.2. Watthour per Pulse - enter the value in the secondary.3. Pulse Width - can be set from 5ms to 635ms.4. Mode - can be enabled or disabled.5. Form - can be selected between Form A and Form C.
Click OK. Then click Update Device to send the new settings to the meter.
The unit for the calibration pulses is Watthours. The initial value of each pulse (Kt) is 1.800 secondary Watthours per pulse.
4.1.2: LCD Display
In Test Mode, the LCD display provides user access to accumulated real, reactive and apparent energy as well as block demand for real power. There are eight screens in Test Mode: Wh - Del,Wh - Rec, VARh - Q1 & Q2, VARh - Q3 & Q4, VAh - Q1 & Q4, VAh - Q2 & Q3, Watt DemandTest Rolling and Watt Demand Test Block. See section 4.2.2 for more detail.
The LCD display also includes three phase voltage annunciators. These annunciators are labeled A,B and C to indicate the presence of voltage on the indicated phase. If voltage is not present on onephase, its indicator will not be displayed. These indicators also show whether current is flowing onthe indicated phase. If no current is flowing on a phase, the annunciator will blink. When current isflowing, it will show a continuously illuminated digit. This annunciator indicates phase sequence.
4.2: Test Mode
Test Mode allows the meter to be tested without disturbing billing data or setting a new maximum demand. Test Mode performs the same function as setting the pointers back on anelectromechanical meter after testing.
While operating in Test Mode, the meter uses the same measurement and calculation processes thatare used in Normal Mode. The only difference is that the billing numbers stored in the meter are notupdated with the real-time reading. This preserves the billing numbers while testing is performed.
4.2.1: Entering Test Mode
To enter Test Mode, you must pass the meter’s security system. In most instances, this requires youto remove power from the meter, break the meter seal and remove the Lexan cover, and then repower the meter.

e Electro Industries/GaugeTech Doc # E151701 4-3
The Test Button is one of two push buttons in the lower right hand quadrant of the meter face.
Press the Test Button (on the right). The Select Transformer Loss screen appears on the display.
Press the Test Button again to scroll through the following Transformer Loss screens:
Transformer Loss OnlyBoth CTPT and Transformer LossNo CompensationCTPT OnlyExit - Do Not Enter Test Mode
Stop on the desired screen. Then, push the Test Button for 2 - 3 seconds.The Test Mode screens appear, unless you selected Exit.
“Test” will now appear in the upper right corner of the display.
Upon entering Test Mode:
1. All energy, demand and TOU values are stored in the meter’s nonvolatile memory.2. Meter log recording is suspended, except for historical logging, which continues. Entries
to the historical logs during testing, will reflect that Test Mode was in effect.
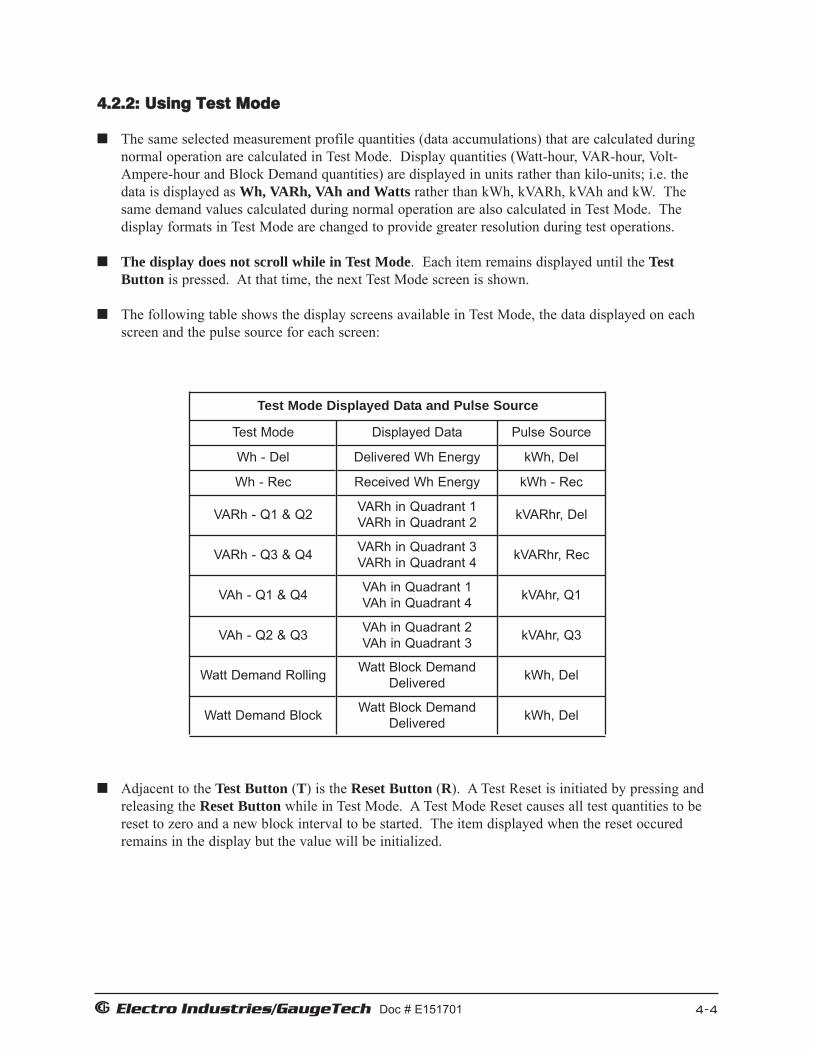
e Electro Industries/GaugeTech Doc # E151701 4-4
4.2.2: Using Test Mode
The same selected measurement profile quantities (data accumulations) that are calculated duringnormal operation are calculated in Test Mode. Display quantities (Watt-hour, VAR-hour, Volt-Ampere-hour and Block Demand quantities) are displayed in units rather than kilo-units; i.e. thedata is displayed as Wh, VARh, VAh and Watts rather than kWh, kVARh, kVAh and kW. Thesame demand values calculated during normal operation are also calculated in Test Mode. The display formats in Test Mode are changed to provide greater resolution during test operations.
The display does not scroll while in Test Mode. Each item remains displayed until the TestButton is pressed. At that time, the next Test Mode screen is shown.
The following table shows the display screens available in Test Mode, the data displayed on eachscreen and the pulse source for each screen:
Adjacent to the Test Button (T) is the Reset Button (R). A Test Reset is initiated by pressing andreleasing the Reset Button while in Test Mode. A Test Mode Reset causes all test quantities to bereset to zero and a new block interval to be started. The item displayed when the reset occuredremains in the display but the value will be initialized.
VARh - Q1 & Q2 VARh in Quadrant 1VARh in Quadrant 2
VARh - Q3 & Q4 VARh in Quadrant 3VARh in Quadrant 4
VAh - Q1 & Q4 VAh in Quadrant 1VAh in Quadrant 4
VAh - Q2 & Q3 VAh in Quadrant 2VAh in Quadrant 3
Watt Demand Rolling Watt Block DemandDelivered
Test Mode Displayed Data and Pulse Source
Test Mode Displayed Data Pulse Source
kVARhr, Del
kVARhr, Rec
kVAhr, Q1
kVAhr, Q3
kWh, Del
Wh - Rec
Wh - Del Delivered Wh Energy kWh, Del
Received Wh Energy kWh - Rec
Watt Demand Block Watt Block DemandDelivered kWh, Del

e Electro Industries/GaugeTech Doc # E151701 4-5
While in Test Mode, the Test Pulse LED will pulse at the rate programmed for the meter. The valueof the pulse is set in the meter’s Device Profile>Internal KYZ Outputs (see Chapter 4 of theCommunicator EXT User Manual for instructions). The meter quantity assigned to the Test PulseLED changes as the user moves from one test screen to another. The assigned values are defined inthe Pulse Source column of the table on the previous page.
Individual quadrant tests for VAR-hours can be completed by proper test design. To test strictlyVAR-hours, limit the test parameters to one quadrant during testing.
In the event of a power outage, data for Test Mode Energy, Demand and Power Factor are not saved.Upon power up, the meter returns to Normal Mode. The test data is lost and all registers arerestored to their pretest values.
While in Test Mode, the IR Port and Communications Port 1 are available for communicationwith the meter.
In Test Mode, you can preset the values of the energy readings that will be restored to the meterwhen Test Mode is exited,using Communicator EXT (see following section 4.2.4 or Chapter 4 of theCommunicator EXT User Manual for instructions).
4.2.3: Test Mode Preset Accumulators
There are two reasons to use the Preset Accumulators screens:
1. A monitor in Test Mode is out of service and is therefore not monitoring accumulations. The NewValue field can be used to adjust for the values not monitored while in Test Mode.
2. When replacing an old meter that has accumulations with a new meter that has no accumulations,the New Value field can be set to the value of the existing accumulations.
Setting Test Mode Preset Accumulators
From Communicator EXT’s Main screen, selectTools>Test Mode>Preset Accumulators. Youwill see the screen shown on the right.
• Click Tabs at the top of the screens to access the individual screens.
• Each screen has a Current Value, New Valueand Preset Box for each accumulator.
• A new meter has zeros for Current Values.

e Electro Industries/GaugeTech Doc # E151701 4-6
Settings can be preset for the following sets of values: Primary Energy, Secondary Energy, Primary Energy (Quadrants), Secondary Energy (Quadrants), Internal Input Accumulators, KYZ Output Accumulators, Q Hours, I & VSquared T Accumulators, Cumulative Demand (Secondary) and Uncompensated Energy.
Examples of some of the screens are shown here.
1. Click the Preset Boxes for the values you want to set.
2. Click Set to save your entries or Cancel to exit the screen without saving any changes.
4.2.4: Exiting Test Mode
Exit Test Mode in one of the following three ways:
1. Pressing and holding the Test Button for more than 3 seconds.2. By the Test Mode Time-Out Timer, if no load is present.3. By the Extended Test Mode Time-Out Timer, if load is present.These options are explained further in the following sections.
Pressing the Test Mode Button for more than three seconds ends Test Mode and returns the meterto Normal Mode.
The Test Mode Time-Out Timer has two modes of operation, depending on whether the meter seesmeasurable load.
If the meter does not recognize measureable load:
The meter watches for user interaction by monitoring activity on the Test Button and the ResetButton. If neither button is pushed within the programmed Exit Delay time, the meter

e Electro Industries/GaugeTech Doc # E151701 4-7
exits Test Mode and returns to Normal Mode. Each time the Test or Reset Button is pressed, themeter starts the Exit Delay Timer again. The Exit Delay time is programmed in the meter’s DeviceProfile.
If the Meter recognizes measurable load:
The meter watches the Test and Reset Buttons for activity, using an extended time limit consistingof the Exit Delay time plus the programmed Block Interval Time. This insures that the meter cancomplete a full block demand test without interruption.
All Test Mode data is lost when Test Mode is exited. Upon exiting Test Mode, a new (possiblypartial) demand interval and subinterval are started. The past subinterval as well as the currentsubinterval are zeroed. Upon returning to Normal operating mode, a TOU meter or demand meterwith load profiling will complete the time remaining in the current partial subinterval so that subsequent subintervals will be synchronized with the hourly boundary.
Maximum demand values for each demand integration type are not modified while in Test Mode.The previously recorded maximums are restored when Test Mode is exited. If you choose to resetdemand data during testing operations, this action can be completed after Test Mode is exited bypressing the Reset Button after the meter has returned to Normal Mode.
NOTE: Normal billing and historical log data accumulation is suspended during Test Mode operation. Upon exiting Test Mode, accumulation of billing and historical log quantities:
1. Resume from the values in place when Test Mode was entered, or2. Continue from the Test Mode Preset values (see Section 4.2.4).

e Electro Industries/GaugeTech Doc # E151701 4-8

Figure 5.1: Communication Overview
e Electro Industries/GaugeTech Doc # E151701 5-1
Chapter 5Serial Communication Wiring
5.1: Communication Overview
RS232 communication is used to connect a single Nexus® 1262/1272 meter with another device,such as a computer, RTU or PLC. The link is viable for up to 50 feet (15.2 m) and is available onlythrough the meter’s Optical Port with a communication interface (Optical Port to RS232 Converter)(Figures 5.2 and 5.3).
RS485 communication allows multiple meters to communicate with another device at a local orremote site. The Output modules and external displays use RS485 to communicate with the meter.All RS485 links are viable for up to 4000 feet (1220 m). The Nexus® Socket Meter’s Ports 1 and 4are two-wire, RS485 connections (up to 115,200 baud). Optional Communication Connections forINP2 (Internal Modem with Dial In/Dial Out), INP200 (10/100BaseT connection) or INP202(Combination Modem and Ethernet) are cables with appropriate connectors (Fig. 6.2).
RS232
RS232
RS485/232Converter
(Unicom 2500)
Optical Port to RS232Communication Interface
(A7Z)
Telephone Line,Fiber Optic Link or
Radio LinkRS485/232 Converter(Modem Manager)
RS485MODEMRS232
OpticalPort
RS485
Meter
Meter
Meter
4000 Feet 50 Feet
50 Feet
50 Feet4000 Feet

e Electro Industries/Gauge Tech Doc # E151701 5-2
Figure 5.2: Nexus® 1272 Meter Optical Port
Optical Port
5.2: Communicating to the Meter through the ANSI Type II Optical Port
Use the ANSI Type II Optical Port on the face of the Nexus® 1262/1272 Socket Meter for RS232communication. The Optical Port is compatible with the A7Z Communication Interface and similarANSI Type II Magnetic Communication Interfaces. See Figure 5.3.
One end of the magnetic interface simply snaps onto the optical port; the magnet keeps it in place.The other end is an RS232 connection. Insert that end into a 9-pin serial port on a computer orother device. The A7Z requires no power supply. All power is received from the host computerserial port using transmitteer and receiver circuits within the probe.
The RS232 standard limits the cable length to 50 feet (15.2m).

e Electro Industries/Gauge Tech Doc # E151701 5-3
Figure 5.3: A7Z Communiation Interface
5.3: RS485 Serial Communication
5.3.1: RS485 Wiring Fundamentals - (Port 1 and Port 4)
S Shield: It is not an earth-ground connection. You must also connect the shield to earth-ground at one point. Do not connect the shield to ground at multiple points; it will inter-fere with communication.
A(+)/B(-) Two-wire, RS485 communication terminals: Connect the A(+) terminal of the MeterPort to the (+) terminal of the device. Connect the B(-) terminal of the Meter Port to the(-) terminal of the device.
RS232ConnectionMagnetic
Coupler

e Electro Industries/Gauge Tech Doc # E151701 5-4
For All RS485 Connections:
Use a shielded twisted pair cable 22 AWG (0.33 mm2 ) or larger, grounding the shield at one endonly.
Establish point-to-point configurations for each device on a RS485 bus: Connect (+) terminals to(+) terminals; connect (-) terminals to (-) terminals.
Protect cables from sources of electrical noise.
Avoid both “star” and “tee” connections (see Figure 5.6).
No more than two cables should be connected at any one point on an RS485 network, whether theconnections are for devices, converters or terminal strips.
Include all segments when calculating the total cable length of a network. If you are not using anRS485 repeater, the maximum length for cable connecting all devices is 4000 feet (1219 meters).
For an RS485 Daisy Chain connection, in which you link multiple devices in a series, connectshield to RS485 Master and individual devices as shown in Figure 5.5. You may also connect theshield to earth-ground at one point.
RS485 communication allows multiple devices to communicate on a bus. The Meter’s Port 1 andPort 4 are RS485 terminals, viable for a distance of up to 4000 feet (1219 m). Below is a detail of a2-wire RS485 port.
Figure 5.4: 1262/1272 2-Wire RS485 Port Detail
Meter2-wire RS485 Port
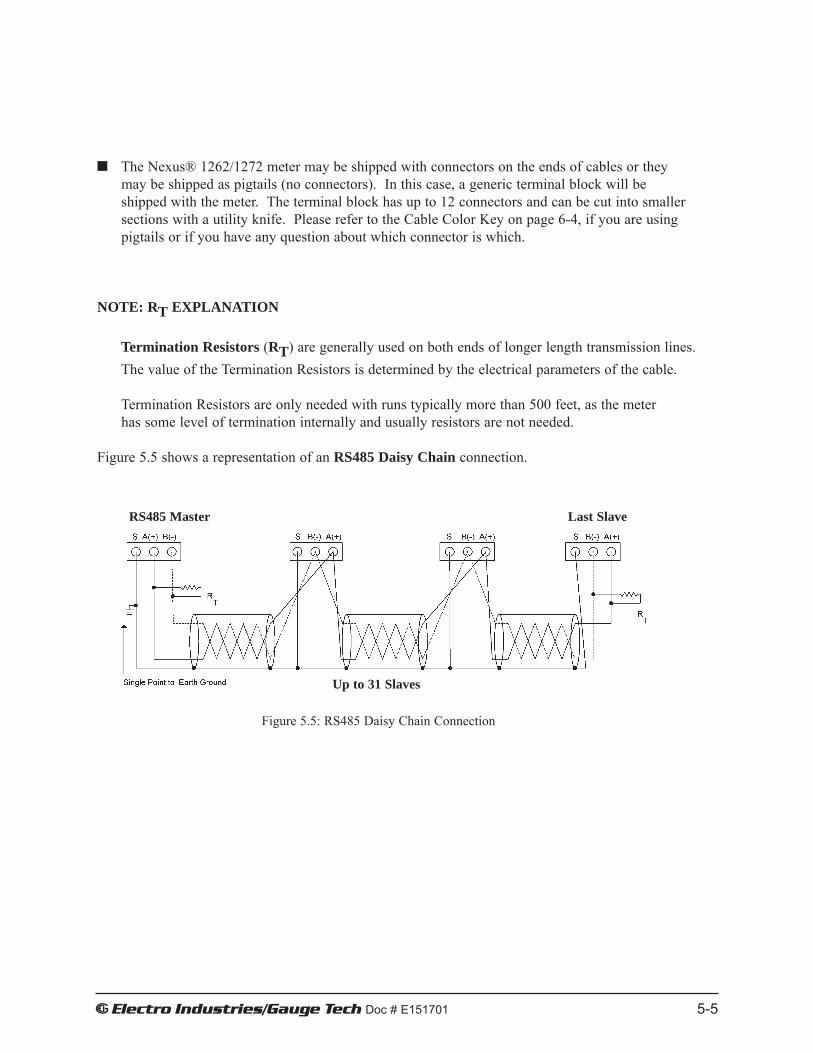
e Electro Industries/Gauge Tech Doc # E151701 5-5
The Nexus® 1262/1272 meter may be shipped with connectors on the ends of cables or they may be shipped as pigtails (no connectors). In this case, a generic terminal block will beshipped with the meter. The terminal block has up to 12 connectors and can be cut into smallersections with a utility knife. Please refer to the Cable Color Key on page 6-4, if you are using pigtails or if you have any question about which connector is which.
NOTE: RT EXPLANATION
Termination Resistors (RT) are generally used on both ends of longer length transmission lines. The value of the Termination Resistors is determined by the electrical parameters of the cable.
Termination Resistors are only needed with runs typically more than 500 feet, as the meter has some level of termination internally and usually resistors are not needed.
Figure 5.5 shows a representation of an RS485 Daisy Chain connection.
Figure 5.5: RS485 Daisy Chain Connection
RS485 Master Last Slave
Up to 31 Slaves

e Electro Industries/Gauge Tech Doc # E151701 5-6
Incorrect Connection: “T”
Figure 5.6: Incorrect “T” and “Star” Topologies
Incorrect Connection: “Star”
“Star” Connection Incorrect!
The three wires connected in a“Star” shape on both the (+)and (-) terminals will causeinterference problems.
RS485 Ports
RS485 Port
“Tee” Connection Incorrect!
The three wires connected in a“T” shape on both the (+) and(-) terminals will cause interfer-ence problems.

e Electro Industries/GaugeTech Doc #: E151701 5-7
5.3.2: Using the Unicom 2500
The Unicom 2500 provides RS485/RS232 conversion. In doing so it allows the Nexus® meter to communicate with a PC or other device. See the Unicom 2500 Installation and Operation Manualfor additional information.
Figure 5.7 illustrates the Unicom 2500 connections for RS485.
Figure 5.8:Detail of “Jumpers”
Figure 5.7: Unicom 2500 with Connections
The Unicom 2500 can be configured for either 4-wire or 2-wire RS485 connections. Since theNexus® meter uses a 2-wire connection, you need to add jumper wires to convert the Unicom 2500to the 2-wire configuration.
As shown in Figure 5.8, you connect the "RX-" and "TX-" terminals with a jumper wire to make the "-" terminal, and connect the "RX+" and "TX+" terminals with a jumper wire to make the "+"terminal

e Electro Industries/Gauge Tech Doc # E151701 5-8
5.3.3: RS485 Connection—Meter to a Computer or PLC
Use Port 1 or Port 4. For information on connecting the Meter to a modem, see Section 5.3.13 ofthis manual.
The link using RS485 is viable for up to 4000 feet (1219 meters). You may need to use an RS485 toRS232 converter.
5.3.4: RJ-111 (Telephone Line) Connection—Meter with INP2 (Internal Modem with Dial In/Dial Out Option) to a PC
Use RJ-11 Standard Telephone Line to connect with the Meter. The RJ-11 line is connected to Cable5 from the back of the Meter with Internal Modem Option. The RJ-11 connector is supplied.
The length of the connection using RJ-11 into the Meter is virtually unlimited. To connect withother meters in either local or remote locations, you MUST use Cable 5.
For more information on the meter with the INP2 Option, see Section 5.4.
5.3.5: RJ-445 Connection—Meter with INP200 (10/100BaseT) Option
The INP200 Option conforms to the IEEE 802.3, 10/100BaseT specification using unshielded twisted pair (UTP) wiring. This allows the use of inexpensive RJ-45 connectors and CAT 3 or bettercabling. The RJ-45 connector is supplied with the meter (Cable 6).
Using this LAN connection allows multiple PC’s to access the meter concurrently. The RJ-45 line isinserted into the RJ-45 connector on Cable 6 coming from the back of the meter with the EthernetOption. The connection using RJ-45 into the meter connects the meter to a network usingModbus/TCP protocol over Ethernet.
For more information on a meter with the INP200 Onboard Ethernet (10/100BaseT), see Section 5.5.
5.3.6: Modem/Ethernet Connection—Meter with INP202 (Combo Card) Option
The INP202 is an extension of INP200. It has all the features of INP200 plus a built-in Modem.Modem and Ethernet capabilities can be used simultaneously.
The communication protocol supported by the modem is Modbus ASCII. The Communication protocol supported by the Ethernet/Modem is Modbus RTU. INP102 converts all incoming modemModbus ASCII requests to Modbus RTU for internal and gateway communication. It then convertsall response Modbus RTU messages into Modbus ASCII protocol before it sends the responses to themodem.
Some of the fixed parameters for the Ethernet/Modem are: 8 Data Bits, Even Parity, 1 Stop Bit. The Ethernet/Modem’s Gateway’s Baud Rate and Delay Time are configurable.
For more information on a meter with the INP202 Modem/Ethernet Combo Card, see Section 5.6.
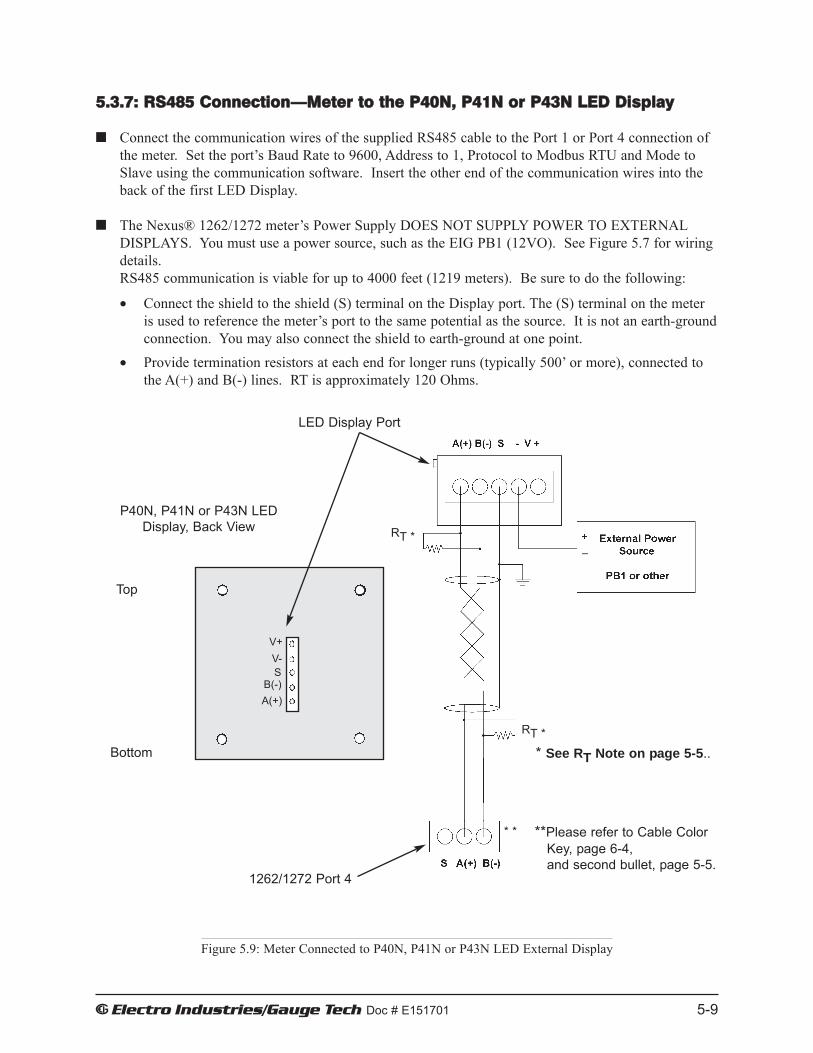
P40N, P41N or P43N LEDDisplay, Back View
e Electro Industries/Gauge Tech Doc # E151701 5-9
5.3.7: RS485 Connection—Meter to the P40N, P41N or P43N LED Display
Connect the communication wires of the supplied RS485 cable to the Port 1 or Port 4 connection ofthe meter. Set the port’s Baud Rate to 9600, Address to 1, Protocol to Modbus RTU and Mode toSlave using the communication software. Insert the other end of the communication wires into theback of the first LED Display.
The Nexus® 1262/1272 meter’s Power Supply DOES NOT SUPPLY POWER TO EXTERNALDISPLAYS. You must use a power source, such as the EIG PB1 (12VO). See Figure 5.7 for wiringdetails. RS485 communication is viable for up to 4000 feet (1219 meters). Be sure to do the following:
• Connect the shield to the shield (S) terminal on the Display port. The (S) terminal on the meteris used to reference the meter’s port to the same potential as the source. It is not an earth-ground connection. You may also connect the shield to earth-ground at one point.
• Provide termination resistors at each end for longer runs (typically 500’ or more), connected tothe A(+) and B(-) lines. RT is approximately 120 Ohms.
Figure 5.9: Meter Connected to P40N, P41N or P43N LED External Display
LED Display Port
1262/1272 Port 4
RT *
RT *
* *
V+V-S
B(-)A(+)
Top
Bottom
**Please refer to Cable Color Key, page 6-4, and second bullet, page 5-5.
* See RT Note on page 5-5..
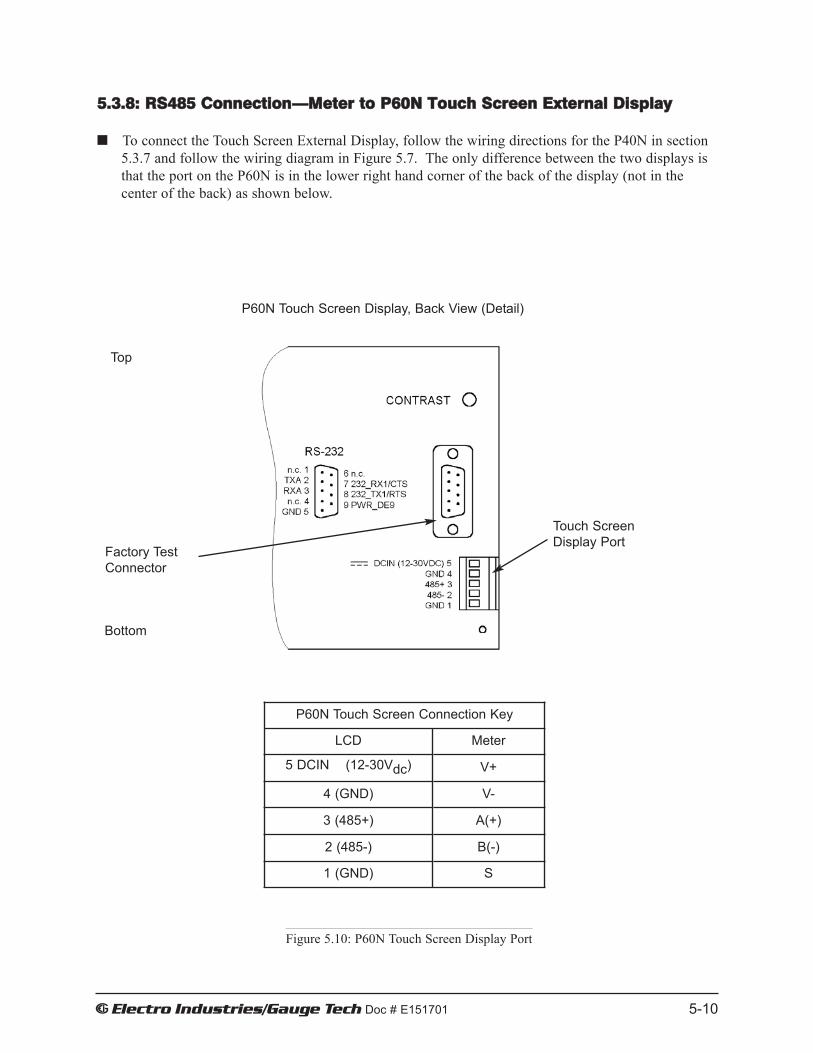
e Electro Industries/Gauge Tech Doc # E151701 5-10
P60N Touch Screen Display, Back View (Detail)
Top
Bottom
5.3.8: RS485 Connection—Meter to P60N Touch Screen External Display
To connect the Touch Screen External Display, follow the wiring directions for the P40N in section 5.3.7 and follow the wiring diagram in Figure 5.7. The only difference between the two displays is that the port on the P60N is in the lower right hand corner of the back of the display (not in the center of the back) as shown below.
Touch ScreenDisplay Port
Figure 5.10: P60N Touch Screen Display Port
P60N Touch Screen Connection Key
LCD Meter
5 DCIN (12-30Vdc)
4 (GND)
V+
V-
3 (485+) A(+)
2 (485-) B(-)
1 (GND) S
Factory TestConnector

e Electro Industries/Gauge Tech Doc # E151701 5-11
5.3.9: Communication Ports on the Output Modules
Female RS485 Side Port: use to connect to another module’s male RS485 side port.
Male RS485 Side Port: use to connect to the meter’s Port 4 (see section 5.3.6) or to connect toanother module’s female RS485 side port.
Output Port: use for functions specific to the type of module; size and pin configuration varies depending on type of module. For more detail, refer below to Section 5.3.10 and to Chapter 10 ofthis manual.
Figure 5.11: Communication Ports on the Output Modules
Output Port(Size and pin
configuration vary)
Female RS485 Side Port
Male RS485 Side Port
Mounting Brackets
LEDs

e Electro Industries/Gauge Tech Doc # E151701 5-12
5.3.10: RS485 Connection—Meter to Output Modules
An RS485 cable harness is supplied with the purchase of MBIO (mounting brackets). Wire one endof the cable into Port 4 of the meter.
Insert the other end of the cable into the communication pins of the Output module’s male RS485side port (see Figure 5.9). See Section 10.3 for details on using multiple Output modules.
The Nexus® 1262/1272 meter’s Power Supply WILL NOT SUPPLY POWER TO THE OUTPUTMODULES. You must use a power source, such as the EIG PSIO or PB1 (12V). RS485 communi-cation is viable for up to 4000 feet (1219 meters). (See Section 10.2.1 for PSIO details.)
Follow the wiring diagram below and be sure to:
• Connect the A(+) and B(-) terminals on the meter to the A(+) and B(-) terminals of the femaleRS485 port. Connect the shield to the shield (S) terminal. The (S) terminal on the meter is usedto reference the meter’s port to the same potential as the source. It is not an earth-ground connection. You may also connect the shield to earth-ground at one point.
• Provide termination resistors at each end for longer runs (typically more than 500’), connected tothe A(+) and B(-) lines. RT is approximately 120 Ohms.
NOTE: The meter has some level of termination internally and usually resistors are not needed.
Figure 5.12: Meter Connected to Output Module
RT *
RT *
* *
Male Side Port onOutput Module
1262/1272 Port 4
**Please refer to Cable Color Key, page 6-4, and second bullet, page 5-5.
*See RT Note on page 5-5.
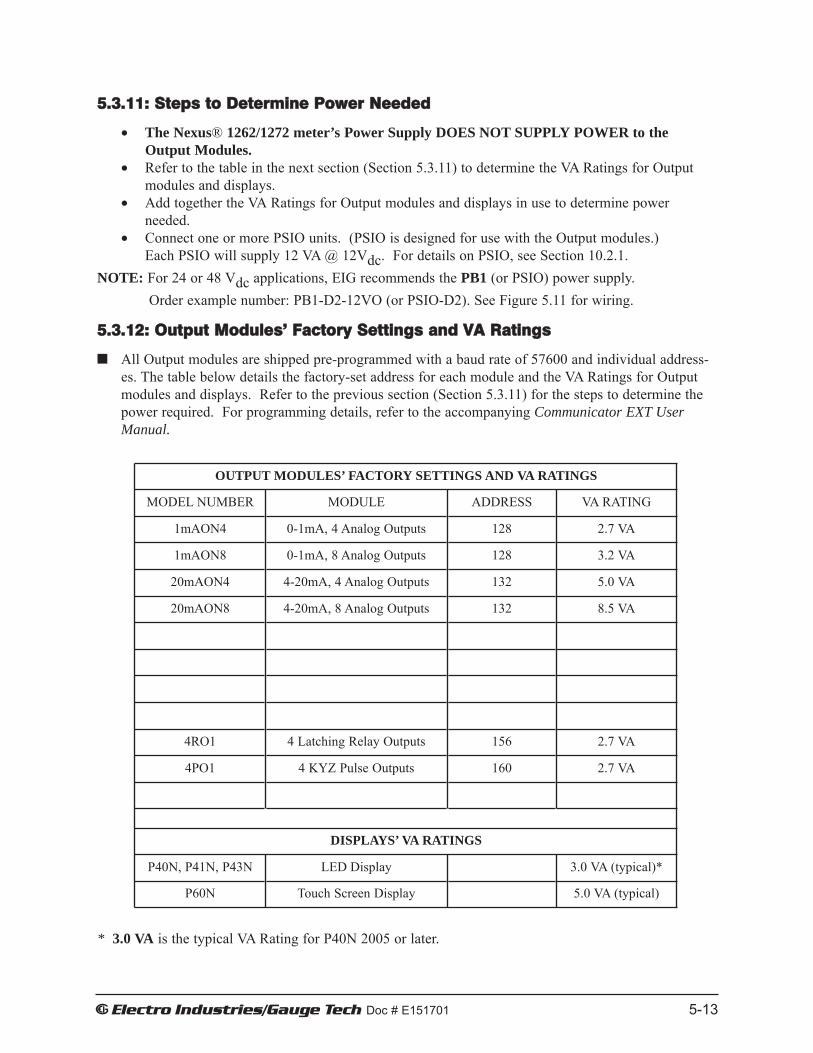
e Electro Industries/Gauge Tech Doc # E151701 5-13
5.3.11: Steps to Determine Power Needed
• The Nexus® 1262/1272 meter’s Power Supply DOES NOT SUPPLY POWER to the Output Modules.
• Refer to the table in the next section (Section 5.3.11) to determine the VA Ratings for Outputmodules and displays.
• Add together the VA Ratings for Output modules and displays in use to determine powerneeded.
• Connect one or more PSIO units. (PSIO is designed for use with the Output modules.) Each PSIO will supply 12 VA @ 12Vdc. For details on PSIO, see Section 10.2.1.
NOTE: For 24 or 48 Vdc applications, EIG recommends the PB1 (or PSIO) power supply. Order example number: PB1-D2-12VO (or PSIO-D2). See Figure 5.11 for wiring.
5.3.12: Output Modules’ Factory Settings and VA Ratings
All Output modules are shipped pre-programmed with a baud rate of 57600 and individual address-es. The table below details the factory-set address for each module and the VA Ratings for Outputmodules and displays. Refer to the previous section (Section 5.3.11) for the steps to determine thepower required. For programming details, refer to the accompanying Communicator EXT UserManual.
* 3.0 VA is the typical VA Rating for P40N 2005 or later.
OUTPUT MODULES’ FACTORY SETTINGS AND VA RATINGS
MODEL NUMBER
1mAON4
1mAON8
20mAON4
20mAON8
4RO1
4PO1
MODULE
0-1mA, 4 Analog Outputs
0-1mA, 8 Analog Outputs
4-20mA, 4 Analog Outputs
4-20mA, 8 Analog Outputs
4 Latching Relay Outputs
4 KYZ Pulse Outputs
DISPLAYS’ VA RATINGS
ADDRESS VA RATING
128 2.7 VA
128 3.2 VA
132 5.0 VA
132 8.5 VA
156 2.7 VA
160 2.7 VA
P40N, P41N, P43N
P60N
LED Display
Touch Screen Display
3.0 VA (typical)*
5.0 VA (typical)

e Electro Industries/Gauge Tech Doc # E151701 5-14
Telephone Line Remote Modem
NULL Modem Adapter(Not required if Modem Manager is used)
RS-
OriginateModem
RS232 to RS485Converter
(Modem ManagerRecommended)
Nexus® 1262/1272 MeterPC at office
Figure 5.13: Remote Connections—RS485
5.3.13: Remote Communication Over Telephone Lines Using the RS485 Port
Use modems (dedicated or dial-up) when devices are at great distances. We recommend using RS485 wiring with a Modem Manager.
Remote Connection—RS485

e Electro Industries/Gauge Tech Doc # E151701 5-15
Use Port 1 or Port 4 for RS-485 communication. The link using RS485 is viable for up to 4000 feet(1219 meters).
Use Communicator EXT software to set the port’s baud rate to the appropriate speed for your hardware and/or network and enable Modbus ASCII protocol. See the Communicator EXT UserManual for instructions.
You must use an RS485 to RS232 converter and a Null Modem. EIG recommends using its ModemManager. This converter has a built-in null modem and also provides line data buffering, makingthe telephone line communication reliable; most commercial modems do not. For this reason, EIG recommends the Modem Manager to alleviate any communication line errors that mightoccur.
Using the Modem Manager also eliminates the need to program default settings into the modem.This makes installation simpler.

e Electro Industries/Gauge Tech Doc # E151701 5-16
5.3.14: Programming Modems for Remote Communication
When a modem speaks to most RS485 or RS232-based devices, it must be programmed to certain settings for the communication to work. This task is often quite complicated. Modem Manager wasdesigned to eliminate this step.
If you are not using a Modem Manager device, you must follow the steps below to communicate withthe remote meter(s). Consult your modem’s manual for the proper string settings or see Section 5.3.16for a list of selected modem strings.
Modem Connected to a Computer (the Originate Modem):
• Restore modem to factory settings. This erases all previously programmed settings.
• Set modem to display Result Codes. The computer will use the result codes.
• Set modem to Verbal Result Codes. The computer will use the verbal result codes.
• Set modem to use DTR Signal. This is necessary for the computer to ensure connection with theoriginate modem.
• Set modem to enable Flow Control. This is necessary to communicate with remote modem connected to the Meter.
• Tell modem to write the new settings to activate profile. This places these settings into nonvolatile memory; the setting will take effect after the modem powers up.
Modem Connected to the meter (the Remote Modem):
• Restore modem to factory settings. This erases all previously programmed settings.
• Set modem to auto answer on n rings. This sets the remote modem to answer the call after nrings.
• Set modem to ignore DTR Signal. This is necessary for the Meter to ensure connection withoriginate modem.
• Set modem to disable Flow Control. RS232 communication does not support this feature.
• Tell modem to write the new settings to activate profile. This places these settings into nonvolatile memory; the setting will take effect after the modem powers up.
• When programming the remote modem with a terminal program, make sure the baud rate of theterminal program matches the meter’s baud rate.

e EElleeccttrroo IInndduussttrriieess//GGaauuggee TTeecchh Doc # E151701 5-17
5.3.15: Selected Modem Strings
Modem String/SettingCardinal modem: AT&FE0F8&K0N0S37=9Zoom/Faxmodem VFX V.32BIS(14.4K): AT&F0&K0S0=1&W0&Y0Zoom/Faxmodem 56Kx Dual Mode: AT&F0&K0&C0S0=1&W0&Y0USRobotics Sportster 33.6 Faxmodem: AT&F0&N6&W0Y0 (for 9600 baud)
DIP switch setting: Up Up Down Down Up Up Up DownUSRobotics Sportster 56K Faxmodem: AT&F0&W0Y0
DIP switch setting: Up Up Down Down Up Up Up Down
5.3.16: High Speed Inputs Connection
The High Speed Inputs can be used in multiple ways:
1. Attach the KYZ pulse outputs from other meters for pulse counting and totalizing.2. Attach status contacts from relays, breakers or other devices for status or waveform initiation.
Refer to the Communicator EXT User Manual for information on programming the High SpeedInputs.
Figure 5.14: High Speed Inputs Connection
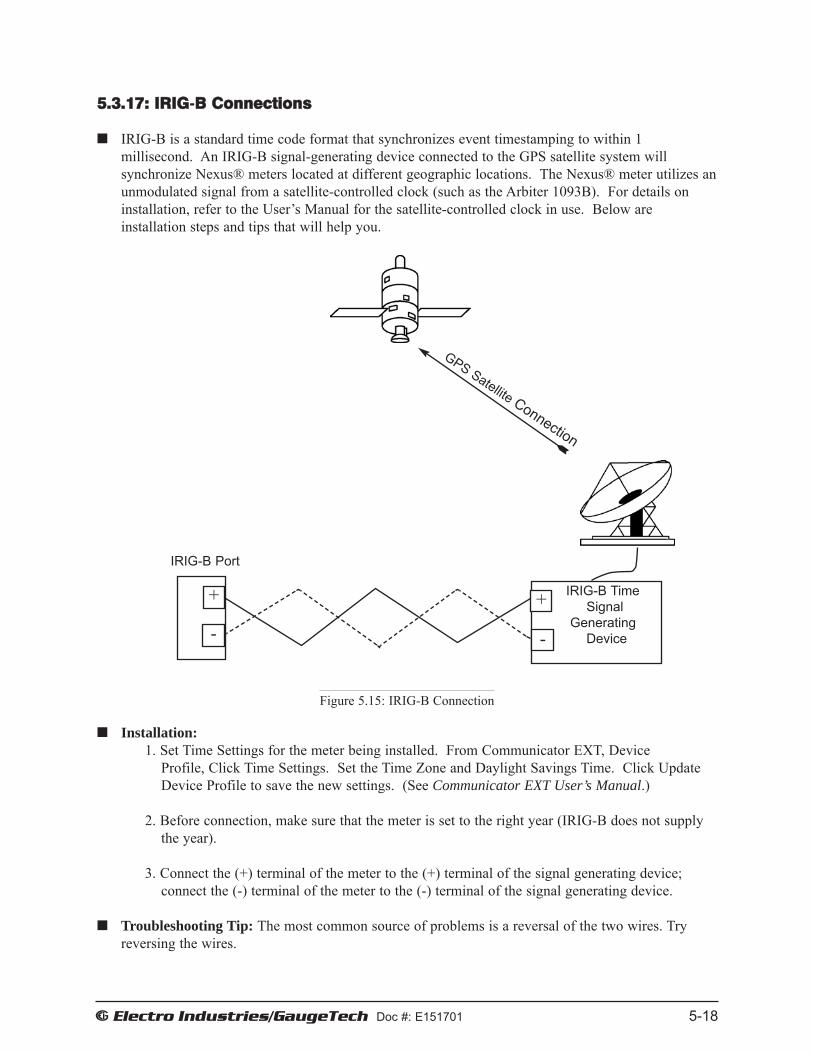
e Electro Industries/GaugeTech Doc #: E151701 5-18
5.3.17: IRIG-BB Connections
IRIG-B is a standard time code format that synchronizes event timestamping to within 1millisecond. An IRIG-B signal-generating device connected to the GPS satellite system willsynchronize Nexus® meters located at different geographic locations. The Nexus® meter utilizes anunmodulated signal from a satellite-controlled clock (such as the Arbiter 1093B). For details oninstallation, refer to the User’s Manual for the satellite-controlled clock in use. Below areinstallation steps and tips that will help you.
Figure 5.15: IRIG-B Connection
Installation:1. Set Time Settings for the meter being installed. From Communicator EXT, Device
Profile, Click Time Settings. Set the Time Zone and Daylight Savings Time. Click Update Device Profile to save the new settings. (See Communicator EXT User’s Manual.)
2. Before connection, make sure that the meter is set to the right year (IRIG-B does not supply the year).
3. Connect the (+) terminal of the meter to the (+) terminal of the signal generating device; connect the (-) terminal of the meter to the (-) terminal of the signal generating device.
Troubleshooting Tip: The most common source of problems is a reversal of the two wires. Tryreversing the wires.
GPS Satellite Connection
+
IRIG-B Port
+
-
IRIG-B TimeSignal
GeneratingDevice-

e Electro Industries/GaugeTech Doc # E151701 5-19
5.3.18: Time Synchronization Alternatives(See Communicator EXT User’s Manual for details.)
IRIG-B:All Nexus® 1262/1272 meters are equipped to use IRIG-B for Time Sychronization. If IRIG-B is connected, this form of Time Synchronization takes precedence over the InternalClock. If the GPS Signal is lost, the Internal Clock takes over time keeping at the precise moment the signal is lost.
Line Synchronization:All Nexus® meters are equipped with Line Synchronization, which may be Enabled or Disabled for use instead of IRIG-B. If Line Synchronization is Enabled and power is lost, the Internal Clock takes over at the precise moment power is lost.
Internal Clock:All Nexus® meters are equipped with Internal Clocks, which can be used if IRIG-B is not connected and/or Line Sync is not Enabled. If either of the above Time Sync Tools fails, the Internal Clock will take over at the precise moment the synchronization tool in use fails.
Time Setting Tools:
1. Tools, Set Device Time: For manual or PC Time Setting.
2. Script & Scheduler: Time Stamps Retrieved Logs and Data.
3. MV90: Can synchronize time on retrievals in the form of a Time Stamp.Refer to the Communicator EXT User Manual (HHF Converter) for more MV-90 details.

e Electro Industries/GaugeTech Doc # E151701 5-20
5.4: INP2 Internal Modem with Dial-IIn In/Dial-OOut Option
5.4.1: Hardware Overview
The INP2 Option for the Nexus® 1262/1272 meter provides a direct connection to a standard telephone line. No additional hardware is required to establish a communication connection betweenthe meter and a remote computer.
The modem operates at up to 56k baud. The internal connection between the modem and the meterincludes a memory buffer. This enables the modem to connect to the phone line at any speed and tochange speed during the communication connection to the remote PC. The buffer between the meterand the modem allows the meter to communicate into the modem at a constant speed while themodem telephone line speed can vary. This eliminates the synchronizing problems that are commonwith other devices. It also increases the effective throughput of the communication channel. This, inturn, decreases connection time and connection costs.
The modem supports both incoming calls (from a remote computer) and automatic dial-out callswhen a defined event must be automatically reported.
5.4.2: Hardware Connection
When the INP2 Option is ordered, there are two RJ-11 jacks that pigtail from the back of the meter (1. Line connection for the outside line 2. Phone connection for your phone). A standard telephone RJ-11 plug can connect the meter to a standard PSTN (Public Switched Telephone Network). The phone jack is the override of the modem function when the phone is in use.
With the device configured with the INP2 Option, the meter has dial-in capability and providesremote access to other Modbus-based serial devices via the meter’s RS485 Gateway over your phone line. The meter will recognize and respond to a Modbus Address of 1. With any other address, the command will pass through the gateway and become a virtual connection between the Remote Modbus Master and any Modbus Slave connected to the RS485 Gateway.
5.4.3: Dial-IIn Function
The modem continuously monitors the telephone line to detect an incoming call. When an incomingcall is detected, the modem will wait a user-set number of rings and answer the call.
The modem can be programmed to check for a password on an incoming call. If the correct password is not provided the modem will hang up on the incoming call. If several unsuccessfulincoming call attempts are received in a set time period, the modem will lock out future incomingcalls for a user-set number of hours.
When an incoming call is successfully connected, the control of communications is passed to thecalling software program. The modem will respond to computer commands to download data orother actions authorized by the meter passwords.
Refer to the Communicator EXT User Manual for instructions on programming the modem.

e Electro Industries/GaugeTech Doc # E151701 5-21
5.4.4: Dial-OOut Function
The Dial-Out Function (INP2) is intended to allow the meter to automatically report certain conditions without user intervention. The modem is normally polling the meter to determine if anyabnormal or reportable conditions exist. The modem checks the following meter conditions and programmed events (set in Communicator EXT) to determine if a call should be placed.
• Are any meter set-point limits exceeded?• Has status of high-speed inputs changed?• Has waveform been recorded?• Has power quality event been recorded?• Has a control output changed?• Has meter experienced a loss of control power?• Is either history log approaching a full condition?• Is the event log approaching a full condition?• Is any other log approaching a full condition?• Has the modem password failed?• Has communication with the meter failed?
If any of the monitored events exist, the modem will automatically initiate a call to a specified location to make a report or perform some other function. For log full conditions, the meter willautomatically download the log(s) that are nearing the full state. The modem can be programmed tocall two different numbers to make the required reports, Primary and Backup.
The modem can be programmed with an ASCII string for identification purposes. If this string inpresent the modem will play the string to the host computer upon connection to identify the meter tothe host software. Refer to the Communicator EXT User Manual for programming details.
The modem includes a connection for an external 3V Lithium Battery (with custom leads and velcromounting) to power the modem if the meter loses control power. Using the battery, the modem willbe able to complete a reporting call even if power to the meter has been disconnected. This featureallows the meter to report power outage conditions. Under normal conditions, the battery shouldprovide in excess of 10 years of service during storage conditions (disconnected from terminals) orwhen properly installed in an energized meter. The battery should provide more than one year ofservice during outage conditions (on battery backup). A LOW BATTERY indicator will appear onthe display screen (ONLY when there is a low battery). Call the factory for a replacement battery.
Replacement of the battery is simple. The battery is attached to a cable (if ordered) which pigtails from the back of the meter with a connector (see NOTE below and Fig. 6.2 and Table 6.1). Installation steps:
1. Remove the old battery by disconnecting it at the connector.2. Install the new battery by snapping it into the connector.3. Peel and stick the velcro adhesive somewhere outside the meter (or use the old adhesive to fasten
the battery in place).
NOTE: Custom leads and Velcro mounting are not included in some earlier versions of the SwitchboardMeter. Call the factory for installation/replacement part BATT4384.

e Electro Industries/GaugeTech Doc # E151701 5-22
5.5: INP200 Onboard Ethernet
Using Electro Industries’ Rapid ResponseTM technology, the INP200 Ethernet card offers 100BaseTdesign optimized for downloads and data collection. The unit equips a Nexus® meter with ModbusTCP and DNP over Ethernet communication. The module opeates at speeds up to 100BaseT.
5.5.1: Hardware Overview
A Nexus® 1262/1272 meter with the 10/100BaseT Ethernet Option (INP200) has all the compo-nents of the standard Nexus® meter PLUS the capability of connection to a network through anEthernet LAN.
The Internal Network Option of the Nexus® meter is an extremely versatile communication tool. It:· Adheres to IEEE 802.3 Ethernet standard using TCP/IP.
· Utilizes simple and inexpensive 100BaseT wiring and connections.
· Plugs right into your network using the built-in RJ-45 jack.
· Communicates using the industry standard Modbus/TCP protocol.
5.5.2: Hardware Connection
Use Standard RJ-45 10/100BaseT cable to connect with the Nexus® meter. The RJ-45 line is inserted into the RJ-45 Port coming from the back of the meter with the INP200 Ethernet Option.
To configure the Network settings, use the following steps.
1. Using Port 1, Port 4 (RS485 connection), or the optical port connect a PC to the meter. An RS232/RS485 Converter may be required (Example: Electro Industries Unicom 2500).
2. Double click on Communicator EXT Software to open it.
3. Click the Quick Connect or the Connection Manager icon in the icon tool bar. Click the Serial Port button. Make sure data matches the meter, then click Connect.
Set the Network using the following steps: (Refer to Section 4.3.5 of the Communicator EXT User Manual for more details).
1. From the Device Profile menu, click General Settings>Communications>one of the ports. You will see the Device Profile Communications Settings screen.
2. In the Network Settings section, enter data provided by your systems manager:
IP Address: 10.0.01 (Example)Subnet Mask: 255.255.255.0 (Example)Default Gateway: 0.0.0.0 (Example)Computer Name: NETWORK (Example)

e Electro Industries/GaugeTech Doc # E151701 5-23
After the Network parameters are set, Communicator EXT will connect to the meter via theNetwork using a Device Address of “1” and the assigned IP Address. Follow these steps:
1. Double click on the Communicator EXT icon to open the software.
2. Click the Connect icon in the icon tool bar. You will see the Connect screen.
3. Click the Network button at the top of the screen. The screen will change to one requesting the following information:
Device Address: 1Host: IP Address (per your network administrator).
Example: 10.0.0.1Network Port: 502Protocol: Modbus TCP
4. Click the Connect button at the bottom of the screen. Communicator EXT connects to the meter via the Network.
NOTE: Communicator EXT always communicates Modbus TCP which is the default protocolfor Nexus® meters.
NOTE: Nexus® meters do not support web pages, email, FTP, or DHCP communication.
5.6: INP202 Ethernet/Modem Combination
The INP202 Option is an extension of INP200. It has all the features of INP200 plus a built-in modem. The communication protocol supported by the modem is Modbus ASCII. The communication protocol supported by the RS485 Ethernet/Modem Gateway is Modbus RTU. INP202 converts all incoming Modem Modbus ASCII requests to Modbus RTU for internal and gateway communication. It then converts all response Modbus RTU messages into Modbus ASCII and sends the responses to the modem.
5.6.1: Hardware Overview
The Nexus® 1262/1272 meter with the INP202 Option has all the components of an INP200 Nexus® meter plus a built-in modem. It has the capability of connecting to a network through an Ethernet LAN and with other devices via modem.

e Electro Industries/GaugeTech Doc # E151701 5-24
5.6.2: Hardware Connection
There are three cables to connect for the INP202 Option. An RS485 Gateway cable, an RJ-45 Ethernet cable and an RJ-11 Modem cable are inserted into the cables coming from the back of the Nexus® meter with the INP202 Ethernet/Modem Option. Refer to Figure 6.2 for details on cables.
To make the software connection, use the following steps.
1. Using Port 1 or Port 4 (RS485 connection), connect a PC to the meter. An RS232/RS485 Converter may be required (Example: Electro Industries’ Unicom 2500).
2. Double click on Communicator EXT Software to open it.
3. Click the Quick Connect or the Connection Manager icon in the icon tool bar. Click the Serial Port button. Make sure data matches the meter, then click Connect.
Set the Network Settings using the following steps: (Refer to Section 4.3.5 of the Communicator EXT User Manual for more details).
1. From the Device Profile menu, click General Settings>Communications>one of the ports. You will see the Device Profile Communications Settings screen.
2. In the Network Settings section, enter data provided by your systems manager:
IP Address: 10.0.01 (Example)Subnet Mask: 255.255.255.0 (Example)Default Gateway: 0.0.0.0 (Example)Computer Name: NETWORK (Example)
After the Network parameters are set, Communicator EXT will connect to the meter via theNetwork using a Device Address of “1” and the assigned IP Address. Follow these steps:
1. Double click on the Communicator EXT icon to open the software.
2. Click the Connect icon in the icon tool bar. You will see the Connect screen.
3. Click the Network button at the top of the screen. The screen will change to one requesting the following information:
Device Address: 1Host: IP Address (per your network administrator).
Example: 10.0.0.1Network Port: 502Protocol: Modbus TCP
4. Click the Connect button at the bottom of the screen. Communicator EXT connects to the meter via the Network.
3. For the Modem connection, follow the instructions in Section 5.4.
NOTE: Nexus® meters do not support web pages, email, FTP, or DHCP communication.

Chapter 6Hardware Installation
6.1: Mounting the Nexus® Socket Meter
The Nexus® 1262/1272 Socket meter is designed to mount into a standard meter socket. Follow theInstallation Summary below or follow the installation instructions on the meter socket to ensure thatthe unit is installed securely. The Nexus® Socket meter can be mounted outside or in an enclosedand protected environment, such as in a switchgear cabinet. You may install a switch or circuitbreaker nearby and label it clearly as the monitor’s disconnecting mechanism.
e Electro Industries/GaugeTech Doc # E151701 6-1
Figure 6.1: Nexus® 1262/1272 Mounting Dimensions
Installation Summary
• Examine the labels to verify that the meter you are installing is, in fact, the correct form factorand service type. Make sure that the socket and meter current class ratings are compatible.
• Make sure that all communication and auxiliary power wiring is accessible in case disconnection is required for any reason.
• Before applying power to the meter, install batteries if not installed at the factory and checkthe connections if they are installed. POWER MUST BE OFF TO INSTALL THEINTERNAL BATTERY! To install the Internal Battery, remove the Internal Shroud and placethe battery into the battery compartment with the + facing UP. Replace the Internal Shroud. Toinstall the Modem Battery, with the Outer Shroud on the meter, locate the battery cable at theback of the meter and insert the cable connector into the cable. Use the velcro (peel and stick)to attach the battery somewhere outside of the meter. See Figure 6.6.
Output ModulesSide ViewFront View

e Electro Industries/GaugeTech Doc # E151701 6-2
• Measure the enclosure to make sure it accomodates the meter. (If it is standard size, that won’tbe necessary.)
• Make sure that any communications wiring from the back of the meter is fed through the appropriate openings in your socket to allow for clean connections with external devices.
• Insert the meter into the socket, making sure that the unit blades are firmly within the jaws ofthe socket.
• Connect external devices to the appropriate communications wiring. See Figure 6.2 and Table6.1, Cable Color Key, below for communications wiring details. RJ-11 and RJ-45 connectorswill be supplied. All Nexus® Socket meters are wired like the meter pictured below.
• Make sure the meter is functioning properly by running it through a test circuit.
• The Nexus® Socket meter has its own display built into the face of the meter. However, youmay want to install additional displays in remote locations. Following are installation proce-dures for the Nexus® P40N, P41N, P43N and P60N displays. Installation Procedures forNexus® Output Modules are also provided in this chapter.
Figure 6.2: Nexus® 1272 Rear View Diagram
Cable 2Cable to High- Speed Inputs
Cable 3Optional KYZ Cable
Cable 1Port 1 Port 4 IRIG-B
Cable 8OptionalAuxPower Cable OPTIONAL
COMMUNICATION
Combo Modem/EthernetCable 4RS485 Cable 5RJ-11 ModemCable 6RJ-45 Ethernet
Modem Cable 4RS485 Cable 5RJ-11 Modem Cable 7Battery
EthernetCable 6RJ-45 Ethernet

e Electro Industries/GaugeTech Doc # E151701 6-3
Figure 6.3: Nexus® 1262/1272 Meter Mounted in A-Base Bottom
Figure 6.4: Nexus® 1262/1272 Meter A Base Side View
4.57” 116.1 mm)
6.84””(173.7mm)
10.4”(264.2mm)
0.87”(22.1mm)
2.02”(51.3mm)
6.60”(167.6mm)

6.1.1: Cable Color Key
e Electro Industries/GaugeTech Doc # E151701 6-4
CABLE
PORT 4 Wiring (RS485)
Yellow
Green
COLOR
Blue
Black
Brown
Red
Orange
Yellow
Green
Blue
Gray
Purple
Black
Brown
Red
Orange
Yellow
Green
Blue
Purple
Gray
Light Green
Pink
White
IMPORTANT NOTE: Cable colors are subject to change without notice in this manual. Refer to CABLE LABELS for color code verification.
Table 6.1: Nexus® 1262/1272 Meter Cable Color Key
Cable 2
Cable 3
NORMALLY OPEN 3
NORMALLY CLOSED 4
COMMON
NORMALLY OPEN 4
COMMON
NORMALLY CLOSED 3
NORMALLY OPEN 2
COMMON
NORMALLY CLOSED 2
NORMALLY OPEN 1
COMMON
NORMALLY CLOSED 1
Optional KYZ Output
COMMON
INPUT 1
INPUT 2
INPUT 3
INPUT 4
INPUT 5
INPUT 6
INPUT 7
INPUT 8
HIGH SPEED INPUTS
+
IRIG-B
Tx/Rx -
Tx/Rx +
SIGNAL NAMEPORT 1 Wiring (RS485)
SHIELD
Tx/Rx +
COLORCABLE SIGNAL
Cable 4
RS485
SHIELD
Tx/Rx+
Blue
Tx/Rx-
Green
Red
Cable 5
Cable 6
Cable 7
RJ-11 Modem
RJ-45 Ethernet
Battery
Blue
BlueLabel attached
Label attached
BlackLabel attached
Black
Tx/Rx -
Brown
Red
Cable 1
Purple-
SHIELD Orange
Cable 8
Aux Power
Brown
Blue
Positive
Neutral/Negative
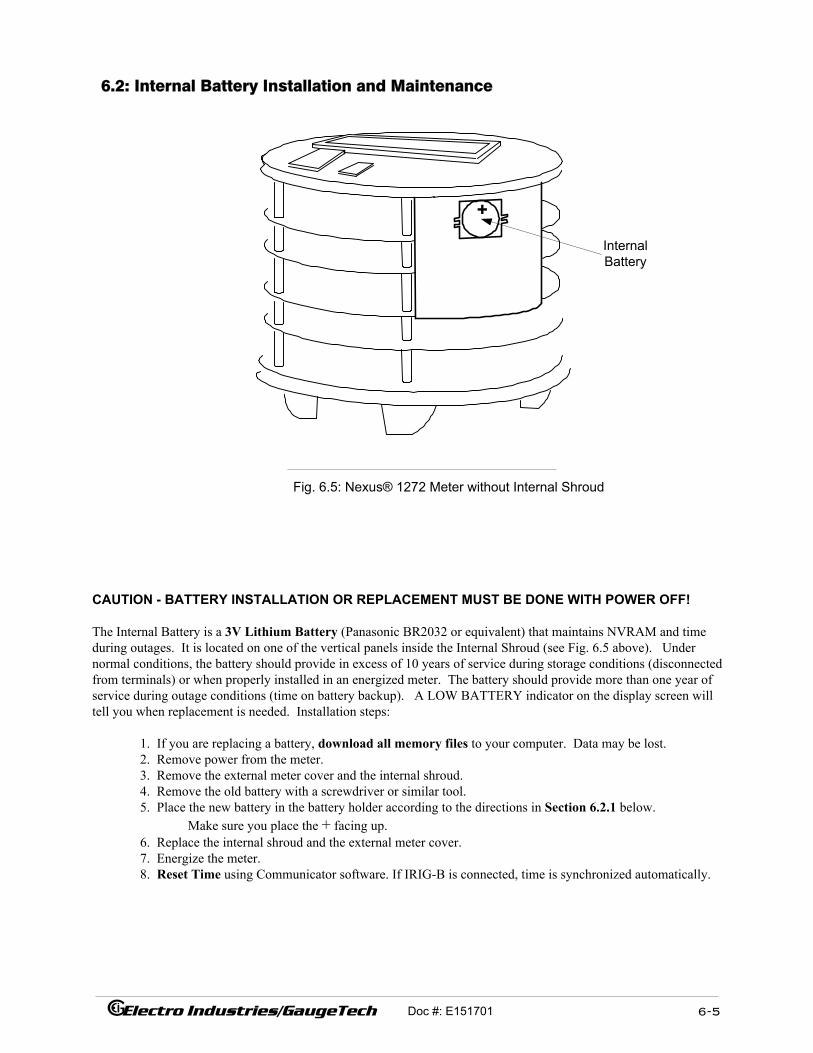
+
Doc #: E151701 Electro Industries/GaugeTech
InternalBattery
Fig. 6.5: Nexus® 1272 Meter without Internal Shroud
6-5
CAUTION - BATTERY INSTALLATION OR REPLACEMENT MUST BE DONE WITH POWER OFF!
The Internal Battery is a 3V Lithium Battery (Panasonic BR2032 or equivalent) that maintains NVRAM and timeduring outages. It is located on one of the vertical panels inside the Internal Shroud (see Fig. 6.5 above). Undernormal conditions, the battery should provide in excess of 10 years of service during storage conditions (disconnectedfrom terminals) or when properly installed in an energized meter. The battery should provide more than one year ofservice during outage conditions (time on battery backup). A LOW BATTERY indicator on the display screen willtell you when replacement is needed. Installation steps:
1. If you are replacing a battery, download all memory files to your computer. Data may be lost.2. Remove power from the meter.3. Remove the external meter cover and the internal shroud.4. Remove the old battery with a screwdriver or similar tool.5. Place the new battery in the battery holder according to the directions in Section 6.2.1 below.
Make sure you place the + facing up.6. Replace the internal shroud and the external meter cover.7. Energize the meter.8. Reset Time using Communicator software. If IRIG-B is connected, time is synchronized automatically.
6.2: Internal Battery Installation and Maintenance

6.2.1: Battery Holder Detail
NOTE: It is very important to insert the replacement battery into the holdercorrectly. Otherwise proper contact will not be achieved and the meter maylose log memory and time functions.
Figure 6.6: Battery Holder Detail
• STEP A: Make sure the + on the battery is facing UP and toward you.Insert the RIGHT SIDE of the battery UNDER the 2 clips on the right side of the holder whilegently pushing the battery against the INSIDE RIGHT WALL of the battery holder (Arrow A).
• STEP B: Gently push the LEFT SIDE of the battery in until it snaps into place (Arrow B).
6.2.2: Battery Safety and Disposal
• Do not expose battery to temperatures above 100 degrees C. Do not incinerate, puncture, crush,recharge, short-circuit or over-discharge battery.
• Do not expose contents of battery to water or to high humidity for extended periods of time.
• Dispose of batteries in accordance with local, state and federal hazardous waste regulations.
NOTE: The replacement of the Modem Battery is detailed in section 5.4.4.
e Electro Industries/GaugeTech Doc # E151701 6-6

e Electro Industries/GaugeTech Doc # E151701 6-7
6.3: Mounting the Optional Nexus® P40N, P41N, P43N LED External Display
The Nexus® 1262/1272 meter has its own LCD Display on the meter face. The optional Nexus®LED Displays: P40N, P41N and P43N, may be used where additional displays are desired. The display mounts using a standard ANSI C39.1 drill plan. Secure the four mounting studs to the backof the panel with the supplied hardware. See Chapter 9 for details on External Displays.
Six feet of RS485 communication/power cable harness is supplied. Allow for at least a 1.25-inch(3.17cm) diameter hole in the mounting panel for the cable harness.
The display is powered by an external power source, such as the PSIO, which supplies 12 VDC.Each display requires 3 VA (typical). The P40N can draw up to 500 mA in display test mode. See Figure 5.9 for wiring detail (wiring is the same as for the P60N display and Output Modules).
Figure 6.7: Nexus® P40N, P41N, P43N LED External Display Mounting Diagrams
Nexus® P40N Display, Front View Nexus® P40N Display, Side View
+
3.38” (8.58cm) Sq.
1.687” (14.28cm)
4 X 0.198” (5.02mm)
4.00” (10.16cm)
4.38”Sq.(11.12cm)
1.438”(3.65cm)
.75” (19.05mm)
ANSI C39.1 Drill Plan

e Electro Industries/GaugeTech Doc # E151701 6-8
6.4: Mounting the Optional Nexus® P60N Touch Screen External Display
The P60N Touch Screen Display mounts easily, using these diagrams. A bezel and a gasket areincluded with the P60N. Since the P60N employs an LCD display, the viewing angle must be con-sidered when mounting. The P60N is powered by an external power source, such as the PSIO. SeeFigure 5.10 for wiring. NOTE: The P60N WILL NOT display TOU Data.
For optimum performance, maintain the following conditions where the Touch Screen Display is mounted:
• Operating Temperature: (0 to+50)°C / (+32 to +122)°F
• Storage Temperature: (-20 to +70)°C / (-36 to +158)°F
• Relative Humidity: (25 to 65)% non-condensing
NOTE: One of the display-mounting studs MUST be grounded (automatic ifmounted in a metal grounded panel).
Figure 6.8: Nexus® P60N Touch Screen Display Mounting Diagram
Figure 6.9: Nexus® P60N Back Detail
Meter to 485+,485- and GND
Factory Test Connector
Aux Power(PSIO) to pins 4, 5

Figure 6.10: Cutout for Nexus® P60N Touch Screen Display
e Electro Industries/GaugeTech Doc # E151701 6-9
To mount the P60N, cut an opening in the mounting panel. Follow above cutout dimensions. Carefully “drop in” the P60N with bezel and gasket attached. See the above figure for details.Fasten the unit securely with the eight nuts supplied with the display.
6.5: Daisy Chain Meters with the P60N
Data from up to 8 meters can be accessed with one P60N Display using the steps below:1. Connect up to 8 meters to one P60N as shown in Figure 6.11 below.2. Using the P60N face, touch the SETTINGS Button > NEXT > LINK SETTINGS.3. Touch UP (on the LINK SETTINGS screen) to add an Address. Each slave device in the chain
MUST be assigned a UNIQUE ADDRESS. A SAVE Button will appear.4. Touch the SAVE Button to Save the New Address.5. Select the Address for the meter from which you want to access data.
Chapter 10 details the screens and the Navigational Map for the P60N Display.6. Click NEXT to select a screen from which you want to retrieve data.
Figure 6.11: Daisy Chain Meters with the P60N Touch Screen Display

Electro Industries/GaugeTech Doc # E151701 6-10
6.6: Mounting the Nexus® External Output Modules
Connect multiple Output modules by inserting male RS485 side ports.into female ports, then using aflathead screwdriver, screw each module into the next. Work from left to right.
If multiple modules are connected together, as shown in Figure 6.15, (or an individual module isused) secure the mounting brackets to both ends of the group (or individual module) using thescrews supplied (#440 pan-head screws). Next, secure the brackets to a flat surface using a #8 screwwith a lock washer.
The Nexus® 1262/1272 meter will NOT supply power for the Output modules. You must use anexternal power supply, such as the EIG PSIO (12V Output). Figure 6.12 shows the modulesmounted without a PSIO Power Supply; Figure 6.15 shows mounting with the PSIO.
Figure 6.12: Nexus® Output Modules Mounting Diagram, Overhead View
Mounting Bracket
Mounting Bracket
Figure 6.13: Nexus® Output Module Communication Ports
Female RS-485 Side Port
Output Port
Mounting Brackets (MBIO)
0.015” (0.37mm)
1.13” (28.57mm)3 x 1.32” (33.27mm)
4.1” (104.14mm)
Male RS-485 Side Port
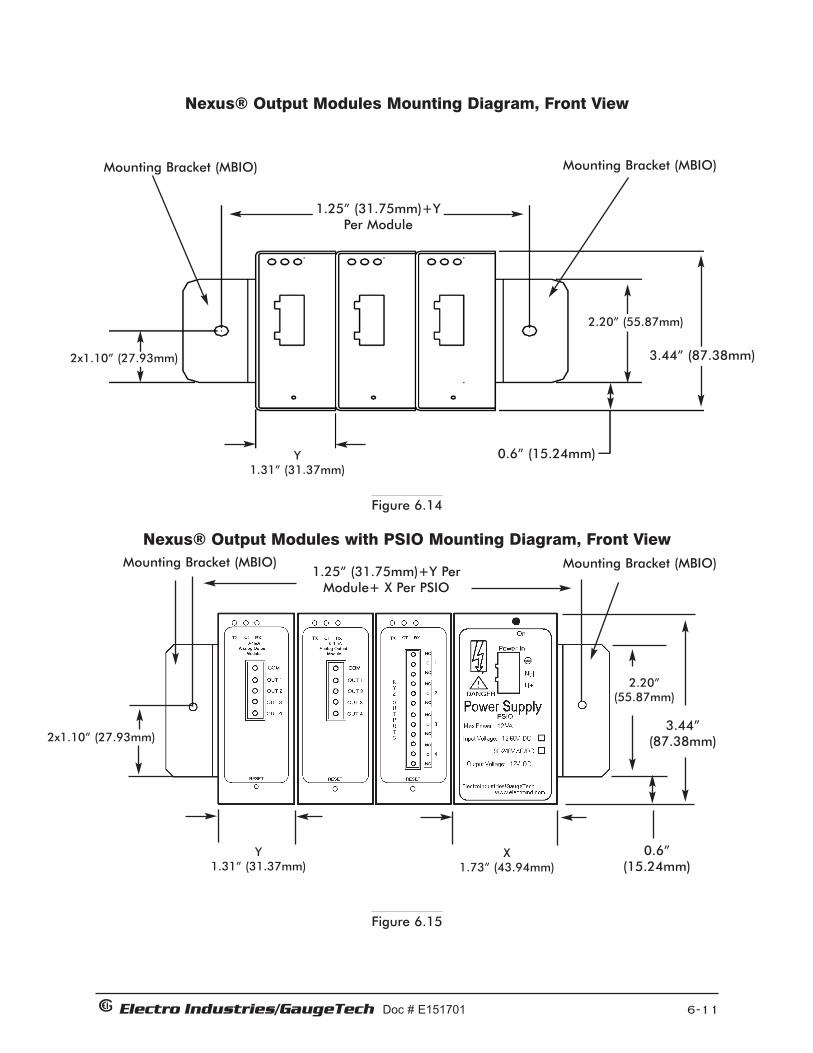
Electro Industries/GaugeTech Doc # E151701 6-11
Figure 6.14
Figure 6.15
Mounting Bracket (MBIO) Mounting Bracket (MBIO)
0.6” (15.24mm)
2x1.10” (27.93mm)
Y 1.31” (31.37mm)
1.25” (31.75mm)+YPer Module
3.44” (87.38mm)
2.20” (55.87mm)
Nexus® Output Modules Mounting Diagram, Front View
Nexus® Output Modules with PSIO Mounting Diagram, Front View
Y 1.31” (31.37mm)
X 1.73” (43.94mm)
0.6” (15.24mm)
3.44” (87.38mm)2x1.10” (27.93mm)
2.20”(55.87mm)
Mounting Bracket (MBIO)Mounting Bracket (MBIO)1.25” (31.75mm)+Y Per
Module+ X Per PSIO

Electro Industries/GaugeTech Doc # E151701 6-12
Figure 6.16: Output Module Wiring Detail
The Nexus® 1262/1272 meter will NOT supply power for the optional external displays or theOutput modules. You must use an additional power supply, such as the EIG PSIO. The wiring isthe same for all the units. The only difference between the Output modules and the displays is thatthe port is on the side of the Output module (see Figure 6.13), while the displays have the port onthe back.
See Chapter 5 for communication details. See Figure 5.11 for wiring details.
Nexus® Output Modules Wiring Diagram
Auxiliary Power (PSIO) issupplied through pins 4 & 5
Connection throughSHIELD, B- & A+ to Nexus® 1262/1272 Meter’sPort 4
(Detail) Output Port

Electro Industries/GaugeTech Doc # E151701 7-1
Chapter 7Nexus® Meter’s Time-oof-UUse Function
7.1: Introduction
A Time-of-Use (TOU) usage structure takes into account the quantity of energy used and the time atwhich it was consumed. The Nexus® 1262/1272 meter’s TOU function, available with theCommunicator EXT software, is designed to accommodate a variety of programmable rate struc-tures. The TOU function accumulates data based on the time-scheme programmed into the Nexus®meter.
See the Communicator EXT User Manual for details on programming the Nexus® 1262/1272meter’s TOU calendar and retrieving TOU data.
7.2: The Nexus® Meter’s TOU Calendar
A Nexus® meter’s TOU calendar sets the parameters for TOU data accumulation. You may store upto twenty calendars in the Nexus® meter and an unlimited amount of calendar files on your computer.
The TOU calendar profile allows you to assign a programmable usage schedule—eg, “Weekday,”“Weekend,” “Holiday”—to each day of the calendar year. You may create up to 16 different TOUschedules.
Each TOU schedule divides the 24-hour day into fifteen-minute intervals from 00:00:00 to 23:59:59.You may apply one of eight different programmable registers—eg “Peak,” “Off Peak,” “ShoulderPeak”— to each fifteen-minute interval.
The Nexus® meter stores:
• accumulations on a seasonal basis, up to four seasons per year;
• accumulations on a monthly basis.
Seasonal and monthly accumulations may span one year into the next. Each season and month isdefined by a programmable start/billing date, which is also the end-date of the prior season or month.
• A season ends at midnight of the day before the start of the next season.
• A month ends at midnight of the month’s billing day.
If the year ends and there is no new calendar, TOU accumulations will stop. If a calendar is presentfor the following year, TOU accumulations continue until the next monthly bill date or next start-of-season is reached. Accumulation can span into the following year.
If no following year is present, the last accumulation for the year will end on 12:31:23:59:59.
Electro Industries/GaugeTech Doc #: E151701 7-2
7.3: TOU Frozen and Active Registers
The Nexus® meter stores accumulations for the prior time periods. When the end of a billing periodis reached, the Active period of time becomes stored as Frozen. The registers are then cleared andaccumulations resume, using the next set of TOU schedules and register assignments from the storedcalendar.
Frozen and Active Accumulations are always available.
7.4: Updating, Retrieving and Replacing TOU Calendars
Communicator EXT software retrieves TOU calendars from the Nexus® meter or from the computer’s hard drive for review and edit.
Up to a maximum of twenty yearly calendars can be stored in the Nexus® meter at any given time.You may retrieve them one at a time; a new calendar can be stored while a current calendar is in use.
Accumulations do not stop during calendar updates. If a calendar is replaced while in use, the accumulations for the current period will continue until the set end date. At that point, the currenttime will become the new start time and the settings of the new calendar will be used.
Reset the current accumulations, if you replace a calendar in use. A reset clears only the currentaccumulation registers. This causes the current accumulations to use the present date as the start andaccumulate to the next new end date, which will be taken from the new calendar. Once stored, prioraccumulations are always available and cannot be reset. See the Communicator EXT User Manualfor instructions on resetting current TOU accumulations.
At the end of a defined period, current accumulations are stored, the registers are cleared and accumulations for the next period begin. When the year boundary is crossed, the second calendar, ifpresent, is used. To retain continuity, you have up to one year to replace the old calendar with onefor the following year.
7.5: Daylight Savings and Demand
To use Daylight Savings Time, you must enable it in the Nexus® meter’s Device Profile, TimeSettings. Click Auto DST, which sets Daylight Savings Time automatically (for the United StatesONLY). You can also select User Defined and enter the desired dates for Daylight Savings Time.See the Communicator EXT User Manual for details.
To set Demand Intervals, from the Device Profile select Revenue & Energy Settings > DemandIntegration Intervals and set the desired intervals. Click OK.
To set Cumulative Demand Type, from the Device Profile click Revenue & Energy Settings >Cumulative Demand Type and select Block or Rolling Window. Click OK.

Electro Industries/GaugeTech Doc # E151701 8-1
Chapter 8Transformer Loss Compensation
8.1: Introduction
The Edison Electric Institute’s Handbook for Electricity Metering, Ninth Edition defines LossCompensation as:
A means for correcting the reading of a meter when the metering point and point of service arephysically separated, resulting in measurable losses including I
2R losses in conductors and
transformers and iron-core losses. These losses may be added to or subtracted from the meterregistration.
Loss compensation may be used in any instance where the physical location of the meter does notmatch the electrical location where change of ownership occurs. Most often this appears whenmeters are connected on the low voltage side of power transformers when the actual ownershipchange occurs on the high side of the transformer. This condition is shown pictorially in Figure 8.1.
It is generally less expensive to install metering equipment on the low voltage side of a transformerand in some conditions other limitations may also impose the requirement of low-side metering eventhough the actual ownership change occurs on the high-voltage side.
The need for loss compensated metering may also exist when the ownership changes several milesalong a transmission line where it is simply impractical to install metering equipment. Ownershipmay change at the midway point of a transmission line where there are no substation facilities. Inthis case, power metering must again be compensated. This condition is shown in Figure 8.2.
M
Figure 9.1: Low Voltage Metering Installation Requiring Loss Compensation
Ownership Change
Figure 9.2: Joint Ownership Line Metering Requiring Loss Compensation
M
Point of Ownership Change
Figure 8.1: Low Voltage Metering Installation Requiring Loss Compensation
Figure 8.2: Joint Ownership Line Metering Requiring Loss Compensation

Electro Industries/GaugeTech Doc # E151701 8-2
A single meter cannot measure the losses in a transformer or transmission line directly. It can however, include computational corrections to calculate the losses and add or subtract those losses tothe power flow measured at the meter location. This is the method used for loss compensation in theNexus® meter.
The computational corrections used for transformer and transmission line loss compensation are similar. Generically, no-load losses and full-load losses are evaluated and a correction factor for eachloss level is calculated. However, the calculation of the correction factors that must be programmedinto the meter differ for the two different applications. For this reason, the two methodologies will betreated separately in this chapter.
In the Nexus® meter, Loss Compensation is a technique that computationally accounts for active andreactive power losses. The meter calculations are based on the formulas below. These equationsdescribe the amount of active (Watts) and reactive (VARs) power lost due to both iron and coppereffects (reflected to the secondary of the instrument transformers).
Total Secondary Watt Loss =(((Measured Voltage/Cal point Voltage)
2x %LWFE) + ((Measured Current/Cal Point Current)2
x %LWCU)) x Full-scale Secondary VA
Total Secondary VAR Loss =(((Measured Voltage/Cal point Voltage)4 x %LVFE) + ((Measured Current/Cal Point Current)2
x %LVCU)) x Full-scale Secondary VA
The Values for %LWFE, %LWCU, %LVFE, %LVCU are derived from the transformer and meterinformation, as demonstrated in following sections.
The calculated loss compensation values are added to or subtracted from the measured Watts andVARs. The selection of adding or subtracting losses is made through the meter profile when programming the meter. The meter uses the combination of the add/subtract setting and the directional definition of power flow (also in the profile) to determine how to handle the losses.Losses will be "added to" or "subtracted from" (depending on whether add or subtract is selected)the Received Power flow. For example, if losses are set to "Add to" and received power equals 2000kW and losses are equal to 20kW then the total metered value with loss compensation would be2020 kW; for these same settings if the meter measured 2000 kW of delivered power the totalmetered value with loss compensation would be 1980 kW.
Since transformer loss compensation is the more common loss compensation method, the meter hasbeen designed for this application. Line loss compensation is calculated in the meter using the sameterms but the percent values are calculated by a different methodology as described in a subsequentsection below.
Nexus® 1262/1272 Meter Transformer Loss Compensation:• Performs calculations on each phase of the meter for every measurement taken. Unbalanced
loads are accurately handled.• Calculates numerically, eliminating the environmental affects that cause inaccuracies in
electromechanical compensators.

Electro Industries/GaugeTech Doc # E151701 8-3
• Performs Bidirectional Loss Compensation.• Requires no additional wiring; the compensation occurs internally.• Imposes no additional electrical burden when performing Loss Compensation.
Loss Compensation is applied to 1 second per phase Watt/VAR readings and, because of that, affectsall subsequent readings based on 1 second per phase Watt/VAR readings. This method results in losscompensation be applied to the following quantities:• Total Power.• Demands, per phase and Total (Thermal, Block (Fixed) Window, Rolling (Sliding) Window and
Predictive Window).• Maximum and Minimum Demands.• Energy Accumulations.• KYZ Output of Energy Accumulations.
NOTE: Loss Compensation is disabled when the meter is placed in Test Mode.
8.2: Nexus® 1262/1272 Meter Transformer Loss Compensation
The Nexus® meter provides compensation for active and reactive power quantities by performingthe numerical calculations using factors derived by clicking the TLC Calculator button on theTransformer Loss screen of the Device Profile or by manually figuring values in section 8.2.1,Calculating Transformer Loss Compensation Percentages (Work Sheet). Enter the derived values inthe Device Profile screen of the Communicator EXT software (values will automatically be enteredfrom the TLC Calculator button).
The Communicator EXT software allows you to enable Transformer Loss Compensation for Lossesdue to Copper and Iron, individually or simultaneously. Losses can either be added to or subtractedfrom measured readings.
Loss compensation values must be calculated based on the meter installation. As a result transformerloss values must be normalized to the meter by converting the base voltage and current and takinginto account the number of elements used in the metering installation. For three element meters, theinstallation must be normalized to the phase-to-neutral voltage and the phase current; in two elementmeters the installation must be normalized to the phase-to-phase voltage and the phase current. Thisprocess is described in the following sections.

Electro Industries/GaugeTech Doc # E151701 8-4
8.2.1: Loss Compensation in Three Element Installations
Loss compensation is based on the loss and impedance values provided on the transformer manufacturer’s test report. A typical test report will include at least the following information:• Manufacturer• Unit Serial Number• Transformer MVA Rating (Self-Cooled)• Test Voltage• No Load Loss Watts• Load Loss Watts (or Full Load Loss Watts)• % Exciting Current @ 100% voltage• % Impedance
The transformer MVA rating is generally the lowest MVA rating (the self-cooled or OA rating) of thetransformer winding. The test voltage is generally the nominal voltage of the secondary or lowvoltage winding. For three phase transformers these values will typically be the three-phase ratingand the phase-to-phase voltage. All of the test measurements are based on these two numbers. Part ofthe process of calculating the loss compensation percentages is converting the transformer lossvalues based on the transformer ratings to the base used by the meter.
Correct calculation of loss compensation also requires knowledge of the meter installation. In orderto calculate the loss compensation settings you will need the following information regarding themeter and the installation:• Number of meter elements• Potential Transformer Ratio (PTR)• Current Transformer Ratio (CTR)• Meter Base Voltage • Meter Base Current
This section is limited to application of Nexus® meters to three-element metering installations. As aresult, we know that:
• Number of metering elements = 3• Meter Base Voltage = 120 Volts• Meter Base Current = 5 amps
The loss compensation values can be calculated by clicking the TLC Calculator button on theTransformer Loss screen of the Nexus® meter’s Device Profile (MS Excel Spreadsheet) or by com-pleting the worksheet “Three Element Loss Compensation Worksheet” below. In order to activatethe Excel Spreadsheet, you must have MS Excel installed on your computer.
NOTE: A copy of the Excel Spreadsheet with Example Numbers can be found in Appendix A of this manual.

Electro Industries/GaugeTech Doc # E151701 8-5
8.2.1.1: Three Element Loss Compensation Worksheet
Transformer Data (from Transformer Manufacturer’s Test Sheet)
Enter 3-Phase or 1-Phase values. If 3-Phase values are entered, calculate 1-Phase values by dividing 3-Phase values by three. Convert 1-Phase Loss Watts to 1-Phase kW by dividing 1-Phase Loss Watts by1000.
Enter 3-Phase or 1-Phase values. If 3-Phase values are entered, calculate 1-Phase values by dividing 3-Phase values by three. Convert 1-Phase Self-Cooled MVA to 1-Phase kVA by multiplying by 1000.
Test Voltage is generally Phase-to-Phase for three-phase transformers. Calculate Phase-to-Neutral Voltage by dividing Phase-to-Phase Voltage by √3. Calculate Full Load Current by dividing the (1-PhasekW Self-Cooled Rating) by the (Phase-to-Neutral Voltage) and multiplying by 1000.
Company
Date
Trf Manf
Calculation by
Station Name
Trf Bank No.
Trf Serial No.
ConnectionWinding Voltage MVA
HV - High ∆ - Y
Xv - Low
YV - Tertiary
∆ - Y
∆ - Y
Watts Loss
1-Phase3-Phase 1-Phase kWValue
No-Load Loss
Load Loss
Value 3-Phase MVA 1-Phase MVA 1-Phase kVA
Self-Cooled Rating
% Exciting Current
% Impedance
Value Phase-to-Phase Phase-to-Neutral
Test Voltage (volts)
Full Load Current (Amps)

Electro Industries/GaugeTech Doc # E151701 8-6
Meter/Installation Data
Enter the Numerator and Denominator for each instrument transformer. For example, a PT with a ratioof 7200/120 has a numerator or 7200, a denominator or 120 and a multiplier of 60 ( 7200/120 = 60/1).
Base Conversion Factors
For Transformer Voltage, enter the Phase-to-Neutral value of Test Voltage previously calculated. For Transformer Current, enter the Full-Load Current previously calculated. For Multipliers, enter the PTand CT multipliers previously calculated. TrfIT Secondary is the Base Value of Voltage and Current at the Instrument Transformer Secondary of the Power Transformer. These numbers are obtained by dividing the Transformer Voltage and Current by their respective Multipliers. The Meter/Trf values for Voltage and Current are obtained by dividing the Meter Base values by the TrfIT Secondary values.
Load Loss at TransformerNo-Load Loss Watts (kW) = 1-Phase kW No-Load Loss = ______________
No-Load Loss VA (kVA) = (%Exciting Current) * (1-Phase kVA Self-Cooled Rating) / 100
= (______________) * (________________) / 100
= _______________ kVA
No-Load Loss VAR (kVAR) = SQRT((No-Load Loss kVA)2 - (No-Load Loss kW)2)
= SQRT((_________________)2 - (________________)2)
= SQRT((__________________) - (_________________))
= SQRT (_________________)
= ____________________
Instrument Transformers Numerator Denominator Multiplier
Potential Transformer
Current Transformer
Power Multiplier [(PT Multiplier) times (CT Multiplier)]
Meter Secondary Voltage (volts) 120
Meter Secondary Current (amps) 5
Quantity
Voltage
Current
Transformer Multiplier Trf IT Sec Meter Base Meter/Trf
120
5

Electro Industries/GaugeTech Doc # E151701 8-7
Full-Load Loss Watts (kW) = 1-Phase Kw Load Loss = ______________
Full-Load Loss VA (kVA) = (%Impedance) * (1-Phase kVA Self-Cooled Rating) / 100
= (______________) * (________________) / 100
= _______________ kVA
Full-Load Loss VAR (kVAR) = SQRT((Full-Load Loss kVA)2 - (Full-Load Loss kW)2)
= SQRT((_________________)2 - (________________)2)
= SQRT((__________________) - (_________________))
= SQRT (_________________)
= _________________
Normalize Losses to Meter Base
Enter Value at Transformer Base for each quantity from calculations above. Enter Meter/Trf Factorvalue from Base Conversion Factor calculations above. Calculate M/T Factor with Exponent by raisingthe M/T Factor to the power indicated in the “Exp” (or Exponent) column. Calculate the “Value at Meter Base” by multiplying the (M/T Factor w/ Exp) times the (Value at TrfBase).
Loss Watts Percentage ValuesMeter Base kVA = 600 * (PT Multiplier) * (CT Multiplier) / 1000
= 600 * (____________) * (___________) / 1000
= ________________
Quantity
No-Load Loss kW
Value at TrfBase
M/TFactor
M/T FactorValue
V
V
I
I
Exp M/T Factor w/Exp
Value atMeter Base
No-Load Loss kVAR
Load Loss kW
Load Loss kVAR
∧2∧4∧2∧2
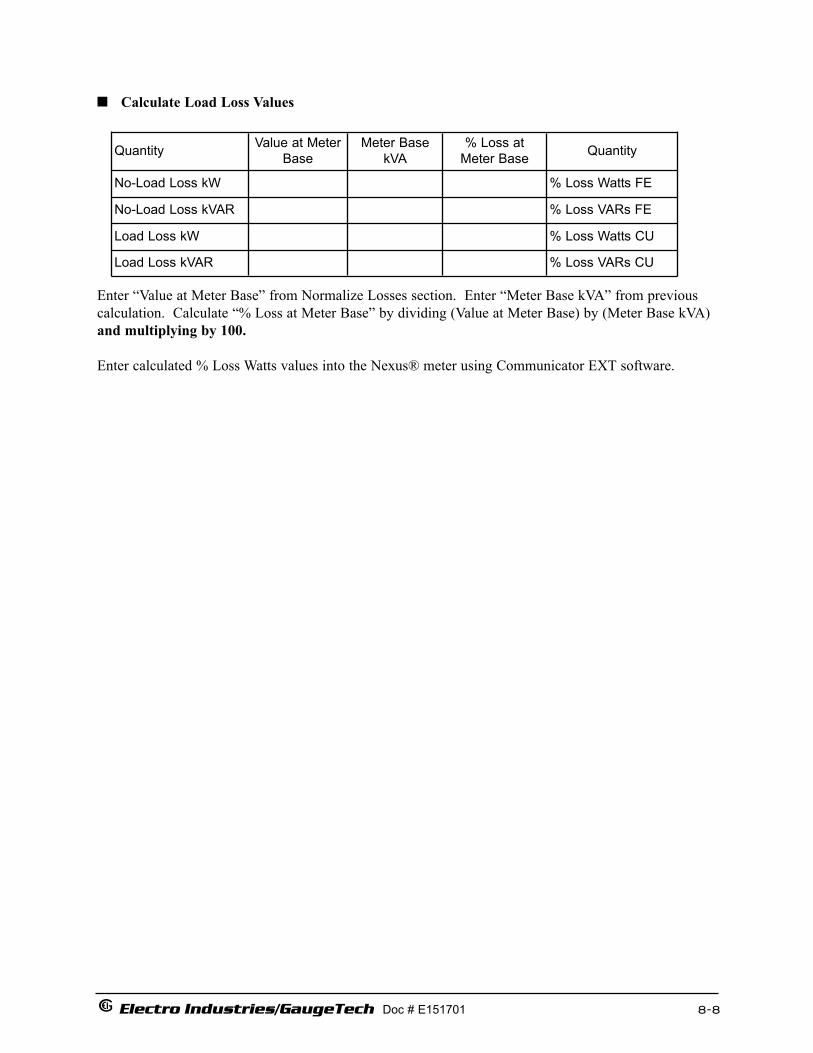
Electro Industries/GaugeTech Doc # E151701 8-8
Calculate Load Loss Values
Enter “Value at Meter Base” from Normalize Losses section. Enter “Meter Base kVA” from previous calculation. Calculate “% Loss at Meter Base” by dividing (Value at Meter Base) by (Meter Base kVA)and multiplying by 100.
Enter calculated % Loss Watts values into the Nexus® meter using Communicator EXT software.
Quantity Value at MeterBase
Meter BasekVA
% Loss atMeter Base Quantity
% Loss Watts FE
% Loss VARs FE
% Loss Watts CU
% Loss VARs CU
No-Load Loss kW
No-Load Loss kVAR
Load Loss kW
Load Loss kVAR

Chapter 9Using the Nexus® External Displays
9.1: Overview
The Nexus® 1262/1272 Socket Meters have a backlit LCD display built into the meter. In addition,Electro Industries offers two optional external displays, each powered by an additional power supply(such as PSIO). The P40N is our LED display, which provides easy-to-use access to the informationstored in the Nexus® meter. The P60N is our Touch Screen Display, which provides easy access toNexus® meter readings and information combined with a graphical touch screen presentation.
Plug one of the Nexus® External Displays into the Port 1 or Port 4 wiring connection using the RS485 cable supplied (see Figure 6.11 for wiring details). The Displays operate at 9600 baud. To usethe Displays on another port, configure that port to operate at 9600 baud, using the CommunicatorEXT Software; see the Communicator EXT User Manual.
9.2: Nexus® P40N LED External Display
The Nexus® P40N LED External Display has three modes:
• Dynamic Readings Mode (sections 9.3 and 9.4)• Nexus® Information Mode (sections 9.5 and 9.6)• Display Features Mode (sections 9.7 and 9.8)
Each Mode is divided into Groups. Most Groups are further broken down into Readings.
• Use the MODE button to scroll between Modes.• Use the UP/DOWN arrows to scroll from Group to Group within each Mode.• Use the LEFT/RIGHT arrows to scroll from Reading to Reading within each Group.
Use Communicator EXT software to Flash Update the P40N External Display. VA Rating is 5.
e Electro Industries/GaugeTech Doc # E151701 9-1
LED Display
Up/Down Arrows
Mode Button
Left/Right Arrows
Figure 9.1: Nexus® P40N LED External Display
e Electro Industries/GaugeTech Doc # E151701 9-2
9.3: Dynamic Readings Mode
The External Display puts itself in the Dynamic Readings Mode upon power-up. Use the MODEbutton to access the Dynamic Readings from other Modes. Use the UP/DOWN arrows to navigatefrom Group to Group within this Mode. See section 9.4 for a navigational map of the DynamicReadings Mode.
Group 1: Phase to Neutral Voltages (Use the LEFT/RIGHT arrows to access the following readings, in order.)
• Volts AN/BN/CN• Maximum Volts AN/BN/CN• Minimum Volts AN/BN/CN• Volts AN/BN/CN %THD• Volts AN/BN/CN Maximum %THD• Volts AN/BN/CN Minimum %THD
Group 2: Phase to Phase Voltages (Use the LEFT/RIGHT arrows to access the following readings,in order.)
• Volts AB/BC/CA• Maximum Volts AB/BC/CA• Minimum Volts AB/BC/CA
Group 3: Current (Use the LEFT/RIGHT arrows to access the following readings, in order.)
• Current A/B/C• Maximum Current• Minimum Current• Current %THD• Current Maximum %THD• Current Minimum %THD• Current Calculated N/Measured N• Maximum Current Calculated N/Measured N
Group 4: Watt/VAR (Use the LEFT/RIGHT arrows to access the following readings, in order.)
• kWatt/kVAR• Maximum +kWatt/+kVAR/CoIn kVAR• Maximum -kWatt/-kVAR/CoIn kVAR• Fixed (Block) Window Average Maximum +kWatt/+kVAR/CoIn kVAR• Predictive Sliding (Rolling) Window Maximum +kWatt/+kVAR/CoIn kVAR
Group 5:VA/PF/Frequency (Use the LEFT/RIGHT arrows to access the following readings, inorder.)
• kVA/PF lag/Hz• Maximum kVA/Hz• Minimum kVA/Hz

• Maximum Quadrant 1 Total PF• Minimum Quadrant 1 Total PF• Maximum Quadrant 2 Total PF• Minimum Quadrant 2 Total PF• Maximum Quadrant 3 Total PF• Minimum Quadrant 3 Total PF• Maximum Quadrant 4 Total PF• Minimum Quadrant 4 Total PF
Group 6: Delivered Energy (Use the LEFT/RIGHT arrows to access the following readings, inorder.)
• +kWatthr Quadrant 1+Quadrant 4 (Primary)• +kVAhr Quadrant 1 (Primary)• +kVARhr Quadrant 1 (Primary)• +kVAhr Quadrant 4 (Primary)• -kVARhr Quadrant 4 (Primary)
Group 7: Received Energy (Use the LEFT/RIGHT arrows to access the following readings, inorder.)
• -kWatthr Quadrant 2+Quadrant 3 (Primary)• +kVAhr Quadrant 2 (Primary)• +kVARhr Quadrant 2 (Primary)• +kVAhr Quadrant 3 (Primary)• -kVARhr Quadrant 3 (Primary)
Group 8: Accumulations (Use the LEFT/RIGHT arrows to access the following readings, in order.)
• kI2t A
• kI2t B
• kI2t C
• kV2t A
• kV2t B
• kV2t C
Group 9: Phase Angles (Use the LEFT/RIGHT arrows to access the following readings, in order.)
• Phase Angle Van/bn/cn• Phase Angle Ia/b/c• Phase Angle Vab/bc/ca• Phase Sequence
e Electro Industries/GaugeTech Doc # E151701 9-3

1 Second VoltsAN,BN,CN
Maximum VoltsAN,BN,CN
Maximum VoltsAB,BC,CA
Minimum VoltsAB,BC,CA
Minimum VoltsAN,BN,CN
%THD VoltsAN,BN,CN
Max %THDVolts
AN,BN,CN
Min %THDVolts
AN,BN,CN
Return toFirst
Reading
Return toFirst
Reading
Return toFirst
Reading
Return toFirst
Reading
Return toFirst
Reading
Return toFirst
Reading
Return toFirst
Reading
Return to FirstReading
Return toFirst
Reading
1 Second VoltsAB,BC,CA
1 SecondkWatt, kVAR
+Max kWatt,+kVAR,CoIn
kVAR
-Max kWatt,-kVAR,CoIn
kVAR
Block WinAvg Max+kWatt,
+kVAR,CoIn kVAR
Pred Roll Win Avg+kWatt,
+kVAR,CoIn kVAR
1 SecondIA,IB,IC
MaximumIA,IB,IC
MinimumIA,IB,IC
%THDIA,IB,IC
Max %THDIA,IB,IC
Min %THDIA,IB,IC
1 SecondINc,INm
1 SecondkVA, PF
lag,Frequency
MaxkVA,Freq
MinkVA,Freq
Max Q1,Total PF
Min Q1,Total PF
Max Q2,Total PF
Min Q2,Total PF
Max Q3,Total PF
Min Q3,Total PF
Min Q4,Total PF
Min Q4,Total PF
PositivekWatthour
Q1+Q4
PositivekVAhr
Q1
PositivekVAhr
Q2
PositivekVARhr
Q1
PositivekVARhr
Q2
PositivekVAhr
Q4
PositivekVAhr
Q3
NegativekVARhr
Q4
NegativekVARhr
Q3
kI2t A kI
2t B kI
2t C kV
2t A kV
2t B kV
2t C
Phase Angles VAN,BN,CN
Phase Angles IA,B,C
Phase Angles VAB,BC,CA
PhaseSequence
Groups
9.4: Navigational Map of Dynamic Readings Mode
Use LEFT/RIGHT arrow keys to navigate Readings
Use UP/DOWN arrows to scroll between groups.
Electro Industries/GaugeTech Doc # E151701 9-4
Negative kWatthrQ2+Q3

9.5: Nexus® Information Mode
Use the MODE button to access the Nexus® Information Mode from other Modes. Use theUP/DOWN arrows to navigate from Group to Group within this Mode. See Section 9.6 for a navigational map of the Nexus® Information Mode.
Group 1: Device Time
• Meter Time
Group 2: Communication Settings (Use the LEFT/RIGHT arrows to access the following readings,in order.)
• Communication Settings Port 1: Baud/Addr/Protocol• Communication Settings Port 2: Baud/Addr/Protocol• Communication Settings Port 3: Baud/Addr/Protocol• Communication Settings Port 4: Baud/Addr/Protocol
Group 3: PT, CT Ratios (Use the LEFT/RIGHT arrows to access the following readings, in order.)
• PT Ratio• CT Ratio
Group 4: External Display Units
• Primary/Secondary
• Select either Primary or Secondary units for the External Display using the Communicator EXTsoftware (see the Communicator EXT User Manual).When Primary is selected, the Displayshows all readings in Primary units based on the user programmed PT and CT Ratios. WhenSecondary is selected, the Display shows all readings in Secondary units.
Group 5: Firmware Versions and Serial Numbers (Use the LEFT/RIGHT arrows to access thefollowing readings, in order.)
• RunTime External Display/RunTime DSP/RunTime Comm• Boot External Display/Boot DSP/Boot Comm• Serial Number External Display; Serial Number Nexus Meter
e Electro Industries/GaugeTech Doc # E151701 9-5

Meter Time
DisplayPrimary/Secondary
CT RatioPT Ratio
Serial #Display, Serial
# Monitor
BootDisplay,
DSP, Comm
Run-timeDisplay,
DSP, Comm
Groups
Readings
Return To
First Reading
Return To
FirstReading
9.6: Navigational Map of Information Mode
Use UP/DOWN arrows to scroll between groups.
Use LEFT/RIGHT arrows to scroll between readings.
Electro Industries/GaugeTech Doc # E151701 9- 6
Return To
First Reading
CommSettingsPort 4
CommSettingsPort 3
Comm SettingsPort 2
CommSettingsPort 1

9.7: Display Features Mode
Use the MODE button to access the Display Features Mode from other Modes. Use the UP/DOWNarrows to navigate from Group to Group within this Mode. See section 9.8 for a navigational map ofthe Display Features Mode.
Group 1: Reset Max/Min
• Note: If the password protection feature has been enabled with the Communicator EXTsoftware, you will need to enter a password to reset the max/min readings. To do this, first pressthe Enter button. Then enter the password, one character at a time, by pressing on the UP orDOWN arrows. Each password character begins as an “A”. Press the UP arrow to increment thecharacter from “A–Z” and then from “0–9”. Press the DOWN arrow to decrement the characterfrom “A” to “9–0” and then from “Z–A”. Press SET to enter each character the password. Whenthe entire password is shown on the Display screen, press ENTER. If the password is correct youmay then press Enter again to Reset the Energy readings.
• Press the Enter button to reset the Max and Min values.
Group 2: Reset Energy
• Note: If the password protection feature has been enabled with the Communicator EXTsoftware, you will need to enter a password to reset the energy. To do this, first press the Enterbutton. Then enter the password, one character at a time, by pressing on the UP or DOWNarrows. Each password character begins as an “A”. Press the UP arrow to increment the character from “A–Z” and then from “0–9”. Press the DOWN arrow to decrement the characterfrom “A” to “9–0” and then from “Z–A”. Press SET to enter each character the password. Whenthe entire password is shown on the Display screen, press ENTER. If the password is correct youmay then press Enter again to Reset the Energy readings.
• Press Enter button to reset the Max and Min values.
Group 3: Display Baud Rate/Address
Group 4: Display Communication Protocol
Group 5: EIG Use Only
Group 6: EIG Use Only
Group 7: Lamp Test
• Press Enter to conduct an LED test.
Group 8: Display Scroll ON/OFF
• Press Enter to turn the scroll feature on or off. When the scroll feature is on, the P40N ExternalDisplay will scroll through the first reading of each group in the Dynamic Readings Mode. If abutton is pressed during the scroll, scrolling pauses for one minute.
e Electro Industries/GaugeTech Doc # E151701 9-7

Reset Max/Min
Reset Energy
CommunicationProtocol
BaudRate/Address
EIG Use Only
EIG Use Only
Display ScrollOn/Off
Groups
9.8: Navigational Map of Display Features Mode
Use UP/DOWN arrows to scroll between groups.
Electro Industries/GaugeTech Doc # E151701 9-8
Lamp Test

9.9: Nexus ® P60N Touch Screen External Display
The P60N Touch Screen External Display is ready to use upon power-up. Touching the “buttons” atthe top of the screen will take you to the Groups of Readings listed below. With the “buttons” atthe bottom of the screen, you can use the touch screen to review Limits and review and/or changeSettings on the Display and the Nexus® Monitor. Also, you can Reset Max/Min and Demand, Hour,I2T and V2T Counters, All Logs and TOU for Current Session and Month using the Reset Button.The P60N has a VA Rating of 5 and is powered by an external power source, such as the PSIO. SeeFigures 6.9 and 6.11 for wiring detail.
All screens have a Main button that will take you back to the Main screen. All screens also have aNext button that will take you to the next group of readings. Some of the screens have additionalnavigation buttons to take you to complimentary readings. See section 9.10 for a navigational map.
GENERAL PAGE: Overview of Real TimeReadings
• Volts AN/BN/CN/AB/BC/CA• Amps A/B/C • Watts• VARS• VA• FREQ• PF
Electro Industries/GaugeTech Doc # E151701 9-9
General Page
Groups of Readings
Reset Button
View Limits View / Change Settings
Figure 9.5: Nexus® P60N Touch Screen External Display

VOLTS: Voltage Readings Details
• Real Time Volts AN/BN/CN/AB/BC/CA• Maximum Volts AN/BN/CN/AB/BC/CA• Minimum Volts AN/BN/CN/AB/BC/CA
Touch PH-N or PH-PH to view details of Phase-to-Neutral or Phase-to-Phase Readings.
VOLTS: Voltage Readings PH-N
• Volts AN/BN/CN
Touch BACK to return to the Volts main screen.
VOLTS: Voltage Readings PH-PH
• Volts AB/BC/CA
Touch BACK to return to the Volts main screen.
AMPS: Current Readings Details
• Real Time Current A/B/C• Maximum Current A/B/C• Minimum Current A/B/C• Current Calculated N/Measured N• Maximum Current Calculated N/
Measured N
Touch A-B-C to view Current Detail.
Electro Industries/GaugeTech Doc #: E151701 9-10

AMPS: Current Readings A-B-C
• Real Time Current A/B/C
Touch BACK to view the Amps main screen.
REAL TIME POWER: Real Time PowerReadings Details (Demand button goes toDemand Power screen.)
• Instant Watt/VAR/VA/PF• Average Watt/VAR/VA/PF• Predicted Watt/VAR/VA/PF
Touch the DEMAND button to go to the Demand Power screen (shown below).
DEMAND POWER: Demand Power ReadingsDetails
• Thermal Window Average Maximum+kWatt/+kVAR/CoIn kVAR
• Block (Fixed) Window Average Maximum+kWatt/+kVAR/CoIn kVAR
• Predictive Rolling (Sliding) Window Maximum+kWatt/+kVAR/CoIn kVAR
Touch R/T button to view Real Time Power screen.
ENERGY: Accumulated Energy Information
• -Watthr Quadrant 2+Quadrant 3 (Primary)• +VAhr Quadrant 2 (Primary)• +VARhr Quadrant 2 (Primary)• +VAhr Quadrant 3 (Primary)• -VARhr Quadrant 3 (Primary)• +Watthr Quadrant 1+Quadrant 4 (Primary)• +VAhr for all Quadrants (Primary)
Touch TOU button to view TOU Register Accumulations screen.
Electro Industries/GaugeTech Doc # E151701 9-11

TOU: Accumulations
• -Watthr Quadrant 2+Quadrant 3 (Primary)• +VAhr Quadrant 2 (Primary)• +VARhr Quadrant 2 (Primary)• +VAhr Quadrant 3 (Primary)• -VARhr Quadrant 3 (Primary)• +Watthr Quadrant 1+Quadrant 4 (Primary)• +VAhr Quadrants 1 & 4 (Primary)• -VARhr Quadrant 4 (Primary)
Touch DEMAND to view Register Demand screen.Touch Next Reg to scroll Registers 1-8 and Totals.Touch Next Group to scroll Prior Season, Prior Month, Current Season, Current Month.
TOU: Register Demand
• Block (Fixed) Window +kWatth, +kVARh, -kWatth, -kVARh, Coin +kVARh, Coin -kVARh
Touch ACCUM to view TOU Accumulations.Touch Next Reg to scrol Registers 1-8 and Totals.Touch Next Group to scroll Prior Season, Prior Month, Current Season, Current Month.
FLICKER - INSTANTANEOUS:
• Time Start/Reset, Stop, Current, Next PST, PLT• Status (Active or Stopped)• Frequency• Base Voltage
Touch SHORT TERM or LONG TERM to view other Flicker screens.START or STOP will appear, depending on Status.
FLICKER - SHORT TERM:
• Volts A/B/C• Max Volts A/B/C• Min Volts A/B/C
Touch INST or LONG TERM to view screens.START or STOP will appear, depending on Status.
Electro Industries/GaugeTech Doc # E151701 9-12

FLICKER - LONG TERM:
• Volts A/B/C• Max Volts A/B/C• Min Volts A/B/C
Touch INST or SHORT TERM to view screens.START or STOP will appear, depending on Status.
LIMITS: Limit Status. Current Limits Settings for Nexus® Meters ID 1-32. For each ID number, the Type of Reading, Value,Status (In or Out of Limit) and Setting is shown. The first screen displays the settings for Meters ID 1 to 8.
Touch NEXT GROUP to scroll to the next screen,which displays the settings for Meters ID 9 to 16.Touch NEXT GROUP again to view settings forMeters ID 17 to 24 and 25 to 32.
PHASORS: Phasor AnalysisPhase Angles for Form shown at top right of screen.
• Phase • Phase Angle Van/bn/cn• Phase Angle Ia/b/c• Phase Angle Vab/bc/ca
WAVEFORM: Real Time Waveform Graph
• Channel Va/b/c• Channel Ia/b/c• % THD, KFactor, Frequency for
selected channel
Touch CHANNEL button to scroll through channels.
Electro Industries/GaugeTech Doc #: E151701 9-13

SPECTRUM: Harmonic Spectrum Analysis. Select a Channel by touching the CHANNELbutton. Graphs and readings appear for the selected channel.
Zoom In or Out for detail by touching IN or OUT.
REAL TIME TRENDING ANALYSIS:Select a Channel by touching the CHANNELbutton. The Channel Selector screen (shown below)appears. Select a Channel and touch OK to select aChannel and return to this screen. Trending for theSelected Channel will begin on this screen.
To see a Detail of logs for the Selected Channel, touch the DETAIL button. A Table of Logs for theSelected Channel appears (Volts AN shown below).Touch PREVIOUS LOGS to view other logs.
REAL TIME TRENDING CHANNEL SELECTOR: Select Channel by touching a CHANNEL button.The Active Channel appears at the lower right. Data from the previously Active Channel will be lost if the Channel is changed.
The Time Interval for Trending appears at the bottom of the screen. To increse the Interval, touch the UP button. To decrease the Interval, touch DN (Down).
Touch OK to return to Trending Analysis screen.
REAL TIME TRENDING DETAIL:A Table of Logs for the Selected Channel (Volts AN shown here).Touch BACK to return to the Trending Analysis screen. Touch PREVIOUS LOGS to view other logs.
Electro Industries/GaugeTech Doc # E151701 9-14

LOG STATUS: Logging StatisticsAn Overview of the Logs for the Primary Meter.
The Number of Records and Memory Used are listed for each log.
RESET: Meter Reset Commands.
WARNING! RESETS cause data to be lost.Touch the window for the Reset you want to perform.“Don’t Reset” changes to “Reset”. Touch RESET NOW button. OK will appear. Touch OK to refresh screen (go back to original screen).
• Max/Min and Demand.• Hour, I2T and V2T Counters.• All Logs.• TOU for Current Season and Month.
SETTINGS:
LCD Screen Settings: Contrast. Touch Up/Down buttons toincrease/decrease settings. Number 37 is optimum setting.Backlight Off Delay (number of seconds after use that backlight turns off).(A setting of 0 keeps the Back Light ON). Touch Up/Down buttons to increase/decrease settings.
NEXUS® LINK SETTINGS:Nexus® Address (000 - 255).Touch Up/Down buttons to increase/decrease settings. Protocol (selected).Baud (selected).
To Add an Address: Click UP to Add an Address.SAVE Button will appear.Click SAVE to Save the New Address.
Electro Industries/GaugeTech Doc #: E151701 9-15

• Nexus® Meter Port Settings: Port 1 (Baud and Protocol selected).Port 2 (Baud and Protocol selected).Port 3 (Baud and Protocol selected).Port 4 (Baud and Protocol selected).
• Nexus® Meter Status:Device Type: Nexus® 1262 meterSerial Number (10 digit number)Comm State: Healthy or UnhealthyNv Ram: 4 MBDSP State: Healthy or UnhealthyProtection: Password Enabled or DisabledOn Time: Current Date and Time
• Firmware Versions:Nexus® 1262 meter
Boot: Run-time: DSP Boot: DSP Run-time:
LCD Display:
This screen displays the current firmware version for the Nexus® meter and the display.
Electro Industries/GaugeTech Doc # E151701 9-16

9.10: Navigational Map for P60N Touch Screen External Display
Electro Industries/GaugeTech Doc # E151701 9-17
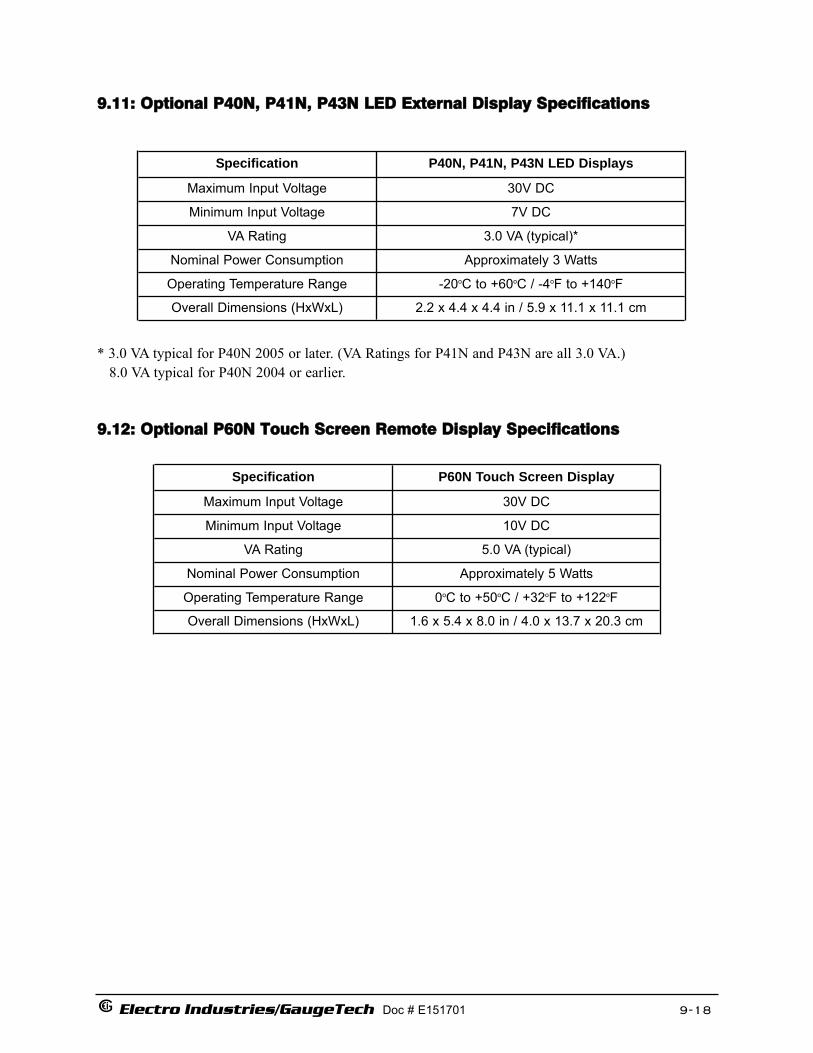
9.11: Optional P40N, P41N, P43N LED External Display Specifications
* 3.0 VA typical for P40N 2005 or later. (VA Ratings for P41N and P43N are all 3.0 VA.)8.0 VA typical for P40N 2004 or earlier.
9.12: Optional P60N Touch Screen Remote Display Specifications
Electro Industries/GaugeTech Doc # E151701 9-18
Specification P40N, P41N, P43N LED Displays
Maximum Input Voltage 30V DC
Minimum Input Voltage 7V DC
VA Rating 3.0 VA (typical)*
Nominal Power Consumption Approximately 3 Watts
Operating Temperature Range -20oC to +60oC / -4oF to +140oF
Overall Dimensions (HxWxL) 2.2 x 4.4 x 4.4 in / 5.9 x 11.1 x 11.1 cm
P60N Touch Screen DisplaySpecification
Maximum Input Voltage
Minimum Input Voltage
VA Rating
Nominal Power Consumption
Operating Temperature Range
Overall Dimensions (HxWxL)
30V DC
10V DC
5.0 VA (typical)
Approximately 5 Watts
0oC to +50oC / +32oF to +122oF
1.6 x 5.4 x 8.0 in / 4.0 x 13.7 x 20.3 cm

Electro Industries/GaugeTech Doc # E151701 10-1
Chapter 10Nexus® External Output Modules
10.1: Hardware Overview
All Nexus® External Output modules have the following components:
•• Female RS485 Side Port: use to connect to another module’s male RS485 side port.
•• Male RS485 Side Port: use to connect to the Nexus® meter’s Port 4 or to another module’sfemale RS485 side port. See Figure 10.2 for wiring detail.
•• Output Port: used for functions specific to the type of module; size and pin configuration varydepending on type of module.
•• Reset Button: Press and hold for three seconds to reset the module’s baud rate to 57600 and itsaddress to 247 for 30 seconds.
•• LEDs: when flashing, signal that the module is functioning.
•• Mounting Brackets (MBIO): used to secure one or more modules to a flat surface.
Output Port(Size and pin
configuration vary)
Female RS485 Side Port
Male RS485 Side Port
Integrated Fastening System
Mounting Brackets (MBIO)
LEDs
Reset Button
Figure 10.1: Output Module Components

Electro Industries/GaugeTech Doc # E151701 10-2
10.1.1: Port Overview
All Electro Industries Output Modules have ports through which they interface with other devices.
The port configurations are variations of the three types shown below.
Four Analog Outputs Eight Analog Outputs Four Relay Outputs (0-11mA and 4-220mA) (0-11mA and 4-220mA) or Four KYZ Pulse Outputs
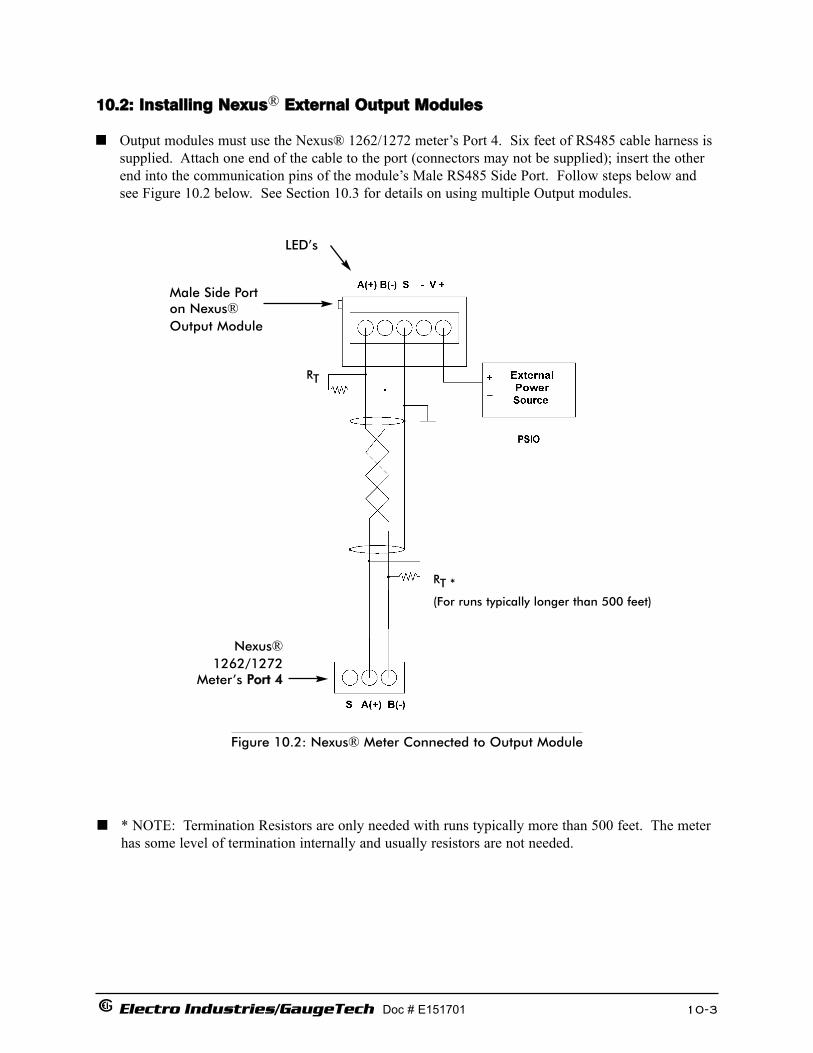
Electro Industries/GaugeTech Doc # E151701 10-3
10.2: Installing Nexus® External Output Modules
Output modules must use the Nexus® 1262/1272 meter’s Port 4. Six feet of RS485 cable harness is supplied. Attach one end of the cable to the port (connectors may not be supplied); insert the otherend into the communication pins of the module’s Male RS485 Side Port. Follow steps below andsee Figure 10.2 below. See Section 10.3 for details on using multiple Output modules.
Figure 10.2: Nexus® Meter Connected to Output Module
RT
RT *
(For runs typically longer than 500 feet)
Male Side Porton Nexus®Output Module
Nexus®1262/1272
Meter’s Port 4
LED’s
* NOTE: Termination Resistors are only needed with runs typically more than 500 feet. The meterhas some level of termination internally and usually resistors are not needed.

Electro Industries/GaugeTech Doc # E151701 10-4
10.2.1: Power Source for Output Modules
The Nexus® 1262/1272 meter will not supply power to the Output modules. You must use anexternal power source, such as the PSIO (12V) (or PB1). Refer to sections 5.3.11 and 5.3.12 todetermine power needed. RS485 communication is viable for up to 4000 feet (1219 meters).
You must also do the following:
1. Connect the A(+) and B(-) terminals on the meter to the A(+) and B(-) terminals of the maleRS485 port. Connect the shield to the shield (S) terminal. The (S) terminal on the meter is usedto reference the meter’s port to the same potential as the source. It is not an earth ground connection. You may also connect the shield to earth-ground at one point.
2. Put termination resistors at each end, connected to the A(+) and B(-) lines. RT is ~120 Ohms.3. Connect a power source to the front of the module. (Refer to Section 5.3 for RT Explanation.)
Figure 10.5: Labels for thePSIO Power Source
(Labels are Red & White.)
Figure 10.3: The PSIO Power Source (Side View) showing Male RS485 Side Port
Figure 10.4: Power flow from PSIO to Output Module
SIDE LABEL
TOP LABEL
1.72”
4.08” 3.42”

Electro Industries/GaugeTech Doc # E151701 10-5
Mounting Bracket
CommunicationONLY A+, B-and Shield
ControlPower
FemaleRS485
Side Port
LEDs
Output Port (Size and pin configuration vary)
Reset Button
10.3: Using Multiple Output Modules
10.3.1: Steps for Attaching Multiple Output Modules
1. Each Output module in a group must be assigned a unique address. See the Communicator EXTUser Manual for details on configuring and programming the Output Modules.
2. Determine how many power sources (such as PSIO) are needed for the number of modules in use.See Section 5.3.11 for details.
Figure 10.6: Multiple Output Modules
Output Modules must use the Nexus® 1262/1272Meter’s Port 4.Set the port to 57600 Baud, Output Module.
RS485 Cable
Addr160
Addr128
Addr156
PSIO12VA
Group of 3Output Modules
ExternalPowerSource

Electro Industries/GaugeTech Doc # E151701 10-6
3. Starting with the left module and using a slotted screw driver, fasten the first Output Module to the left Mounting Bracket. The left Mounting Bracket is the one with the PEM. Fasten the internal screw tightly into the left Mounting Bracket.
4. Next, slide the female RS485 port into the male RS485 side port to connect the next Output module to the left module. Fasten together enough to grab but do not tighten.One by one combine the modules together using the Integrated Fastening System (Fig. 10.1). If you require an additional power supply, attach a PSIO (power supply) to the right of each group of 4 Output modules (see Section 10.3).
NOTE: The PB1 can also be used for a Low Voltage Power Supply. It must be mounted separately.
5. Once you have combined all the Output modules together for the group, fasten tightly. This final tightening will lock the whole group together as a unit.
6. Attach the right Mounting Bracket to the right side of the group using the small phillips head screws provided.
7. Then, mount the group of modules on a secure, flat surface. This procedure will ensure that all modules stay securely connected.
10.4: Factory Settings and Reset Button
Factory Settings:All Nexus® Output modules are shipped with a preset address and a baud rate of 57600. See the listshown below, for module addresses.
Reset Button:If there is a communication problem or if you are unsure of a module’s address and baud rate, pressand hold the RESET button for 3 seconds. The module will reset to a default address of 247 at57600 baud rate for 30-seconds. This will enable you to interrogate the module using theCommunicator EXT software; see the Modbus Communicating Output Modules User Manual.
Model # Module Factory-Set Address
1mAON4 0±1mA, 4-Channel Analog Output 1281mAON8 0±1mA, 8-Channel Analog Output 12820mAON4 4–20mA, 4-Channel Analog Output 13220mAON8 4–20mA, 8-Channel Analog Output 132
4RO1 4 Latching Relay Outputs 1564PO1 4 KYZ Pulse Outputs 160

Electro Industries/GaugeTech Doc # E151701 10-7
10.5: Analog Transducer Signal Output Modules
10.5.1: Overview
The Analog Transducer Signal Output Modules (0±1mA or 4–20mA) are available in either a 4- or8-channel configuration. Maximum registers per request, read or write, is 17 registers.
The Nexus® 1262/1272 unit does not supply power for the Analog Output modules. See Section 10.2 for power and communication details.
All outputs share a single common point. This is also an isolated connection (from ground).
Analog Transducer Signal Output Modules Specifications
Accuracy
Communication
Power Requirement
Operating Temperature
Maximum Load Impedance
RS485, Modbus RTU
15–20Vdc at 50–200mA;Nexus® 1262/1272 Unit's Power Supply
DOES NOT Support Output Modules
(-20 to 79)°C / (-4 to +158)°F
0±1mA: 10k Ω; 4–20mA: 500 Ω
Model Numbers
1mAON4: 4-Channel Analog Output, 0±1mA
1mAON8: 8-Channel Analog Output, 0±1mA
20mAON4: 4-Channel Analog Output, 4–20mA
20mAON8: 8-Channel Analog Output, 4–20mA
Factory Settings
Modbus Address:1mAON4, 0-1mA: 128 1mAON8, 0-1mA: 128
20mAON4, 4–20mA: 132, 20mAON8, 4-20mA: 132
Baud Rate: 57600
Default Settings(Reset Button)
Modbus Address: 247
Baud Rate: 57600
Programmable Baud Rates: 4800, 9600, 19200, 57500
0.1% of Full Scale
Scaling Programmable
Transmit Delay Time: 0
Transmit Delay Time: 20 csec

Electro Industries/GaugeTech Doc # E151701 10-8
The Modbus Map for the Analog Output Module (and operating details) can be found in the ModbusCommunicating Output Modules Manual.
10.5.2: Normal Mode
Normal Mode is the same for the 0-1mA and the 4-20mA Analog Output Modules except for thenumber of processes performed by the modules.
Both devices:
1. Accept new values through communication.2. Output current loops scaled from previously accepted values.
The 0-1mA module includes one more process in its Normal Mode:
3. Read and average the A/D and adjust values for Process 2 above..
The device will operate with the following default parameters:
Address 247 (F7H)Baud Rate 57600 BaudTransmit Delay Time 0
Normal Operation is prevented by a number of occurrences. See Section 10.4.1 for details.

Electro Industries/GaugeTech Doc # E151701 10-9
10.6: Digital Dry Contact Relay Output (Form C) Module
Digital Dry Contact Relay Output (Form C) Module Specifications
Model Number
Communication
Power Requirement
Operating Temperature
Maximum Load Impedance
4RO1: 4 Latching Relay Outputs
RS485, Modbus RTU
Programmable Baud Rates: 4800, 9600, 19200, 57600
15–20Vdc at 50–200 mA;Nexus® 1262/1272 Unit's Power Supply
DOES NOT Support Output Modules
(-20 to 79)°C / (-4 to +158)°F
0-1mA: 10k Ω; 4-20mA: 500 Ω
Factory Settings
Modbus Address: 156
Baud Rate: 57600
Default Settings(Reset Button)
Modbus Address: 247
Baud Rate: 57600
10.6.1: Overview
The Relay Output Module consists of four Latching Relay Outputs. In Normal Mode, the deviceaccepts commands to control the relays. Relay output modules are triggered by limits programmedwith the Communicator EXT software. See the Communicator EXT User Manual for details on programming limits.
The Nexus® 1262/1272 unit does not supply power for the Relay Output modules. A power sourceis required. See Section 10.2 for power and communication details.
The Modbus Map for the Relay Output Module (and operating details) can be found in the ModbusCommunicating Output Modules Manual.
Each latching relay will hold its state in the event of a power loss.
Transmit Delay Time: 0
Transmit Delay Time: 20 csec
Programmable
Accuracy
Scaling
0.1% of Full Scale

Electro Industries/GaugeTech Doc # E151701 10-10
10.6.2: Communication
Maximum registers per request, read or write, is 4 registers.orm
The device will operate with the following Default Parameters:Address 247 (F7H)Baud Rate 57600 BaudTransmit Delay Time 20 csec
Some situations will cause the device to operate with the above Default Parameters. See Section10.4.1 for details of Default Mode.
10.6.3: Normal Mode
Normal Mode consists of one process:
1. The device accepts new commands to control the relays.

Electro Industries/GaugeTech Doc # E151701 10-11
10.7: Digital Solid State Pulse Output (KYZ) Module
Digital Solid State Pulse Output (KYZ) Module Specifications
Model Number
Communication
Power Requirement
Operating Temperature
Memory
Factory Settings
Default Settings(Reset Button)
4PO1
RS485, Modbus RTU
Programmable Baud Rates: 4800, 9600, 19200, 57600
(-20 to 79)°C / (-4 to +158)°F
15–20Vdc at 50–200 mA;Nexus® 1262/1272 Unit's Power Supply
DOES NOT Support Output Modules
256 byte I2C EEPROM
for storage of Programmable Settings and Nonvolatile Memory
Modbus Address: 160
Baud Rate: 57600
Modbus Address: 247
Baud Rate: 57600
10.7.1: Overview
The KYZ Pulse Output Modules have 4 KYZ Pulse Outputs and accept Read and Write Commandswith at least 4 registers of data per command. Digital Solid State Pulse Output (KYZ) Modules areuser programmed to reflect VAR-hours, WATT-hours, or VA-hours. See the Modbus CommunicatingOutput Modules User Manual for details on programming the module.
The Nexus® 1262/1272 unit does not supply power for the KYZ Pulse Output modules. A powersource is required. See Section 10.2 for power and communication details.
The Modbus Map for the KYZ Pulse Output Module (and operating details) can be found in theModbus Communicating Output Modules Manual.
NC = Normally Closed; NO = Normally Open; C = Common.
Transmit Delay Time: 0
Voltage Rating Up to 300VdcCommands Accepted Read and Write with at least 4 registers of data per command
Transmit Delay Time: 20 csec

Electro Industries/GaugeTech Doc # E151701 10-12
10.7.2: Communication
Maximum registers per request, read or write, is 4 registers.orm
The device will operate with the following Default Mode Parameters. See Section 10.4.1 for details.Address 247 (F7H)Baud Rate 57600 BaudTransmit Delay Time 20 csec
10.7.3: Normal Mode
Energy readings are given to the device frequently. The device generates a pulse at each channelafter a certain energy increase.
Normal Operation consists of three processes:
1. The first process accepts writes to registers 04097 - 04112. Writes can be up to four registers long and should end on the fourth register of a group (register 04100, or registers 04103-04112 or registers 04109-04112). These writes can be interpreted as two-byte, four-byte, six-byte or eight-byte energy readings. The reception of the first value for a given channel provides theinitial value for that channel. Subsequent writes will increment the Residual for that channel by the difference of the old value and the new value. The previous value is then replaced with the new value. Attempting to write a value greater than the programmed Rollover Value for a given channel is completely ignored and no registers are modified. If the difference is greater than halfof the programmed Rollover Value for a given channel, the write does not increment the Residualbut does update the Last Value. Overflow of the Residual is not prevented.
2. The second process occurs in the main loop and attempts to decrement the Residual by the Programmed Energy/Pulse Value. If the Residual is greater than the Programmed Energy/Pulse Value and the Pending Pulses Value for that channel is not maxed, then Residual is decremented appropriately and the Pending Pulses is incremented by two, signifying two more transitions and one more pulse.
3. The third process runs from a timer which counts off pulse widths from the Programmable Minimum Pulse Width Values. If there are Pulses Pending for a channel and the delay has passed, then the Pulses Pending is decremented for that channel and the Output Relay is toggled.
Operation Indicator (0000H = OK, 1000H = Problem):Bit 1: 1 = EEPROM FailureBit 2: 1 = Checksum for Communications Settings badBit 3: 1 = Checksum for Programmable Settings badBit 4: 1 = 1 or mor Communications Settings are invalidBit 5: 1 = 1 or more Programmable Settings are invalidBit 6: 1 = 1 or more Programmable Settings have been modifiedBit 7: 1 = Forced Default by Reset Value
Bit 15: 1 = Normal Operation of the device is disabled

Electro Industries/GaugeTech Doc # E151701 10-13
10.8: Specifications
The following multiple analog or digital Output modules mount externally to the Nexus® Socketmeter. The Nexus® 1262 and 1272 Units do not supply power for Output modules. Use an addi-tional power supply, such as PSIO, to provide Output capability. See Chapter 6 for mounting dia-grams.
Analog Transducer Signal Outputs (Up to two modules can be used with the meter.)1mAON4: 4 Analog Outputs, scalable, bidirectional.1mAON8: 8 Analog Outputs, scalable, bidirectional.20mAON4: 4 Analog Outputs, scalable.20mAON8: 8 Analog Outputs, scalable.
Digital Dry Contact Relay Outputs (Multiple modules can be used.)4RO1: 4 Relay Outputs 10 Amps, 125Vac, 30Vdc, Form C.
Digital Solid State Pulse Outputs (Multiple modules can be used.)4PO1: 4 Solid State Pulse Outputs, Form A KYZ pulses.
Other Output Module AccessoriesPSIO: External Power Supply which is necessary if you are connecting Output modules to a
Nexus® 1262 or 1272 Socket Meter.MBIO: Bracket for surface-mounting Output modules to any enclosure.

Electro Industries/GaugeTech Doc # E151701 10-14

Electro Industries/GaugeTech Doc # E151701 11-1
11.1: Wiring Diagrams
Choose from three supported meter forms based on the rated voltage and hookup required for your application. Corresponding wiring diagrams appear on the following pages. If the connection diagramyou need is not listed, contact EIG for a custom connection diagram. NOTE: Form 45S replaces Form5S and may also be used in 4-wire circuits.
Form Description
Wye, 3 PTs, 3 CTs
3-Wire Delta, no PTs, 2 CTs
9S
Wye, no PTs, 3 CTs
Nexus® Meter Forms and Associated Application Diagrams
3-Wire Delta, 2 PTs, 2 CTs2.5 EL Wye, no PTs, 3 CTs
Chapter 11Electrical Installation for Nexus® 1262/1272 Meter
Table 11.1: Nexus® 1262/1272 Meter Forms
36S
Wye, no PTs, 3 CTs2.5 EL Wye, 2 PTs, 3 CTs
4-Wire Delta, 3 PTs, 3 CTs4-Wire Delta, no PTs, 3 CTs
4-Wire Delta, no PTs, 2 CTs4-Wire Delta, 2 PTs, 2 CTs
Wye, 2 PTs, 3 CTs
45S3-Wire Delta, no PTs, 2 CTs
4-Wire Delta, 2 PTs, 2 CTs4-Wire Delta, no PTs, 2 CTs3-Wire Delta, 2 PTs, 2 CTs
Form 9S mounted in S/A Adapter (showing connectors)
11.1
Fig #
11.211.311.411.511.611.711.811.911.1011.1111.1211.1311.1411.1511.1611.179S in S/A

GROUNDING: Industrial meters are typically grounded at the service entrance (not the meter) per NEC (1999) Section 250-24(5) and 250-26.
AUXILIARY POWER: Meters may be externally powered using a (120 to 230)V AC or(125 to 400)V DC power supply.
NOTE: For forms not on the above list, contact the factory and let us know your requirements.
Electro Industries/GaugeTech Doc # E151701 11-2

Electro Industries/GaugeTech Doc # E151701 11-3
Fig 11.1: Form 9S Wye, no PTs, 3 CTs

Fig 11.2: Form 9S Wye, 3 PTs, 3 CTs
Electro Industries/GaugeTech Doc # E151701 11-4
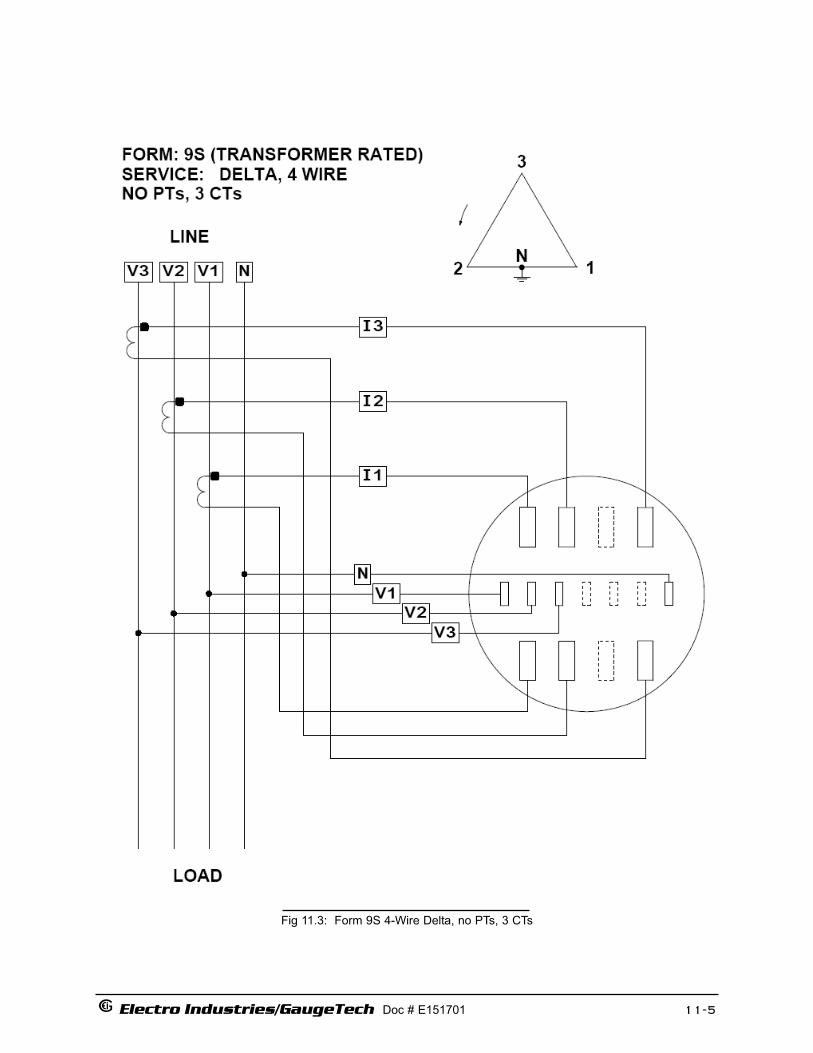
Electro Industries/GaugeTech Doc # E151701 11-5
Fig 11.3: Form 9S 4-Wire Delta, no PTs, 3 CTs
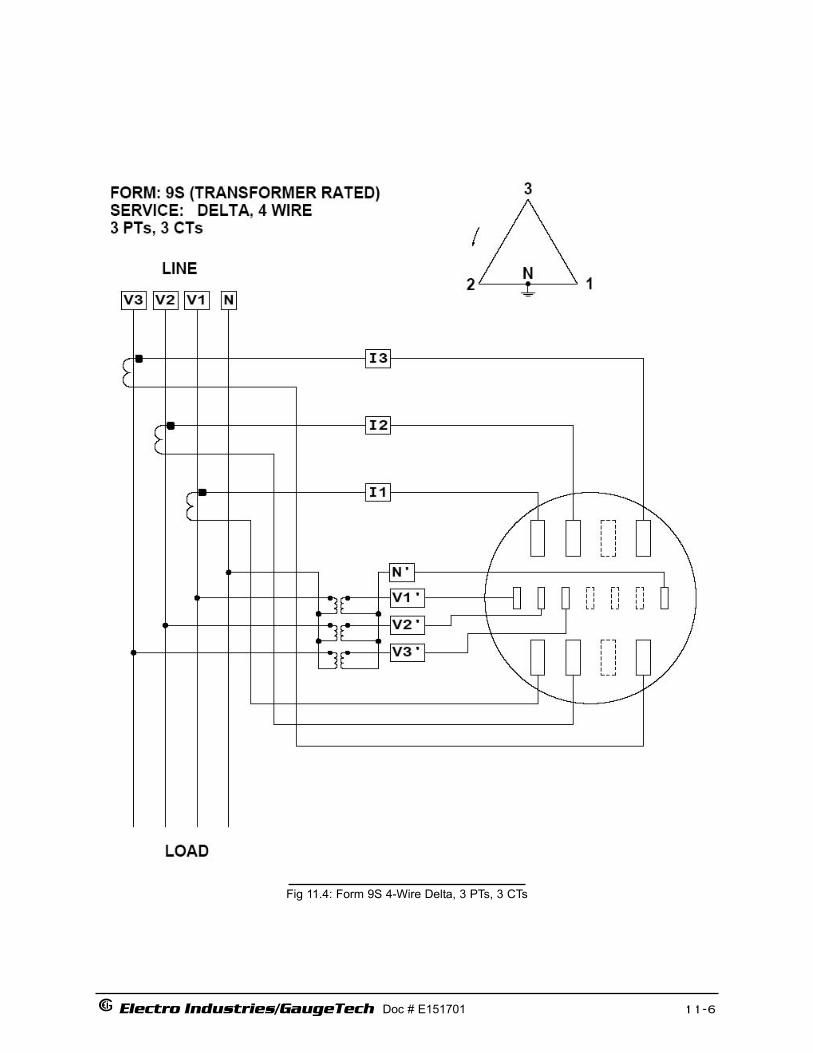
Fig 11.4: Form 9S 4-Wire Delta, 3 PTs, 3 CTs
Electro Industries/GaugeTech Doc # E151701 11-6

Fig 11.5: Form 9S 4-Wire Delta, no PTs, 2 CTs(Neutral is not shown for simplicity)
Electro Industries/GaugeTech Doc # E1151701 11-7

Fig 11.6: Form 9S 4-Wire Delta, 2 PTs, 2 CTs(Neutral is not shown for simplicity)
Electro Industries/GaugeTech Doc # E151701 11-8

Fig 11.7: Form 9S 3-Wire Delta, no PTs, 2 CTs
Electro Industries/GaugeTech Doc # E151701 11-9

Fig 11.8: Form 9S 3-Wire Delta, 2 PTs, 2 CTs
Electro Industries/GaugeTech Doc # E151701 11-10
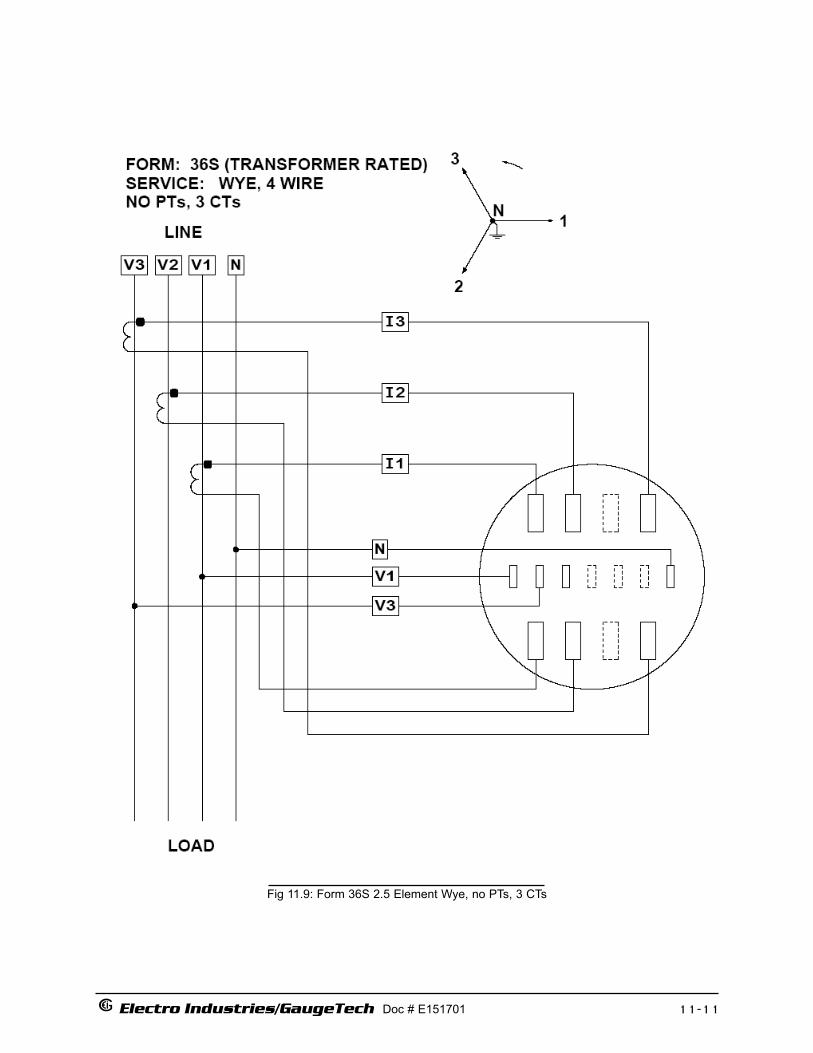
Fig 11.9: Form 36S 2.5 Element Wye, no PTs, 3 CTs
Electro Industries/GaugeTech Doc # E151701 11-11

Fig 11.10: Form 36S 2.5 Element Wye, 2 PTs, 3 CTs
Electro Industries/GaugeTech Doc # E151701 11-12
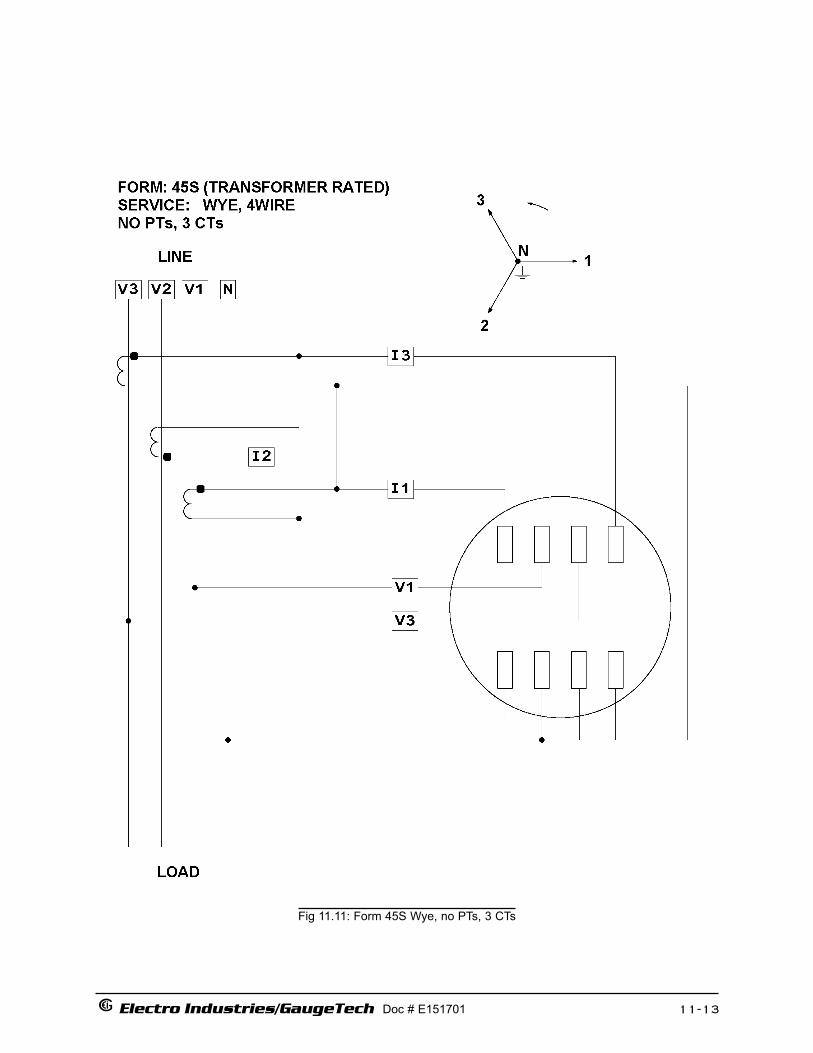
Fig 11.11: Form 45S Wye, no PTs, 3 CTs
Electro Industries/GaugeTech Doc # E151701 11-13

Fig 11.12: Form 45S Wye, 2 PTs, 3 CTs
Electro Industries/GaugeTech Doc #: E151701 11-14

Fig 11.13: Form 45S 3-Wire Delta, no PTs, 2 CTs
Electro Industries/GaugeTech Doc # E151701 11-15

Fig 11.14: Form 45S 3-Wire Delta, 2 PTs, 2 CTs
Electro Industries/GaugeTech Doc # E151701 11-16

Fig 11.15: Form 45S 4-Wire Delta, no PTs, 2 CTs(Neutral is not shown for simplicity)
Electro Industries/GaugeTech Doc # E151701 11-17
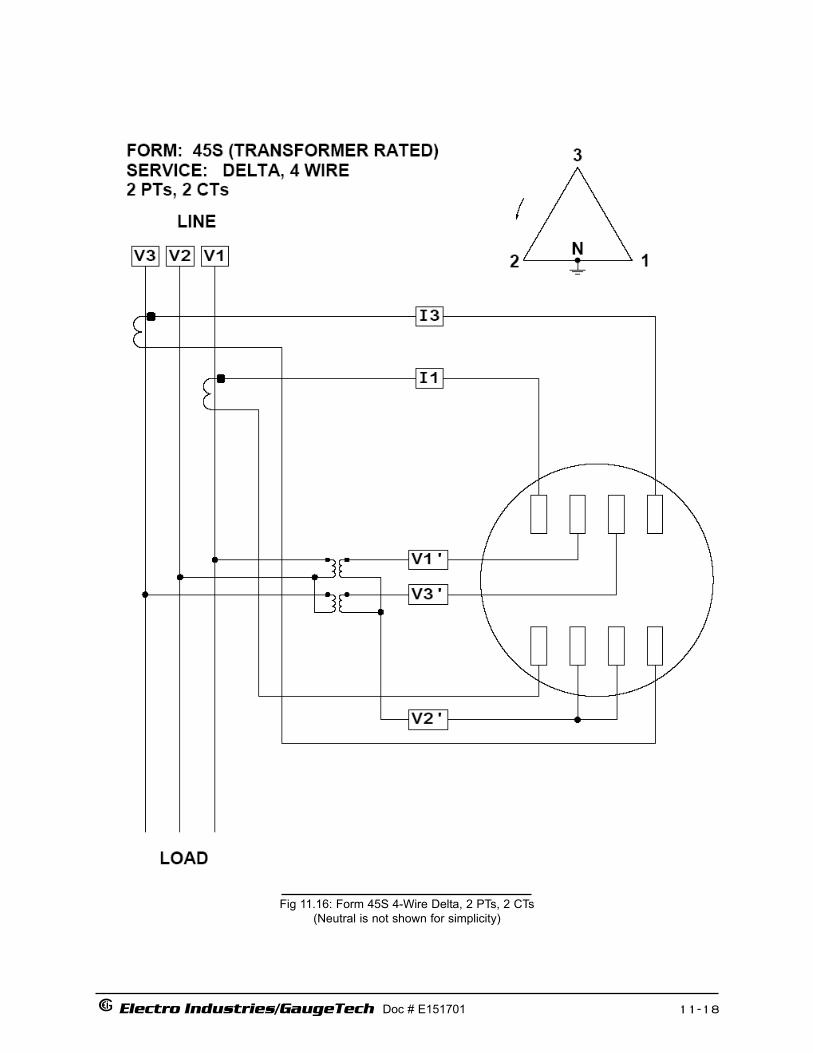
Fig 11.16: Form 45S 4-Wire Delta, 2 PTs, 2 CTs(Neutral is not shown for simplicity)
Electro Industries/GaugeTech Doc # E151701 11-18

11.2: Nexus® 1262/1272 Meter Mounted in S/A Adapter
Any of the 9S Forms can be mounted in an S/A Adapter, such as the one shown below. The socketmeter is “pushed” into the S/A Adapter until the meter “snaps” into place. The blades on the back of thesocket meter make the proper connection. See section 11.1 for the 9S Form wiring diagrams.
Fig 11.17: Form 9S Mounted in an S/A Adapter (Front Terminal Cover Removed)
Electro Industries/GaugeTech Doc # E151701 11-19

Electro Industries/GaugeTech Doc # E151701 11-20

Electro Industries/GaugeTech Doc # E151701 12-1
Chapter 12Nexus® 1262/1272 Switchboard Meter
12.1: Introduction
This chapter gives you a brief overview of the Nexus® 1262/1272 Switchboard Option. The Nexus® Switchboard Meter gives you all the features of the Nexus® Socket Meter in a compact case. Easyinstallation or disconnection is the primary benefit of choosing this option. The Switchboard Systemlets you install or “rack out” the meter in two easy steps. Minimal manual wiring is required to con-nect or disconnect the meter.
The Nexus® Switchboard Meter works just like the Nexus® 1262/1272 Socket Meter. For a complete summary of all the features, see Chapter 2 of this manual. For details on any of the many features,see the Table of Contents for the desired feature.
The differences are few: The labels on the face and the shroud of the meter will be slightly different,depending on options selected (see Section 12.2 for label detail); the wiring Forms are 9Z and 36Zand the wiring is different (see Section 12.5); dimensions are obviously different (see Section 12.3);installation is different and easy (see Section 12.4).
Caution: The Power Supply Input on 1262/1272 units is configured differently. Please check wiring carefully.
Fig. 12.1: 1262/1272 Switchboard Meter, Front View
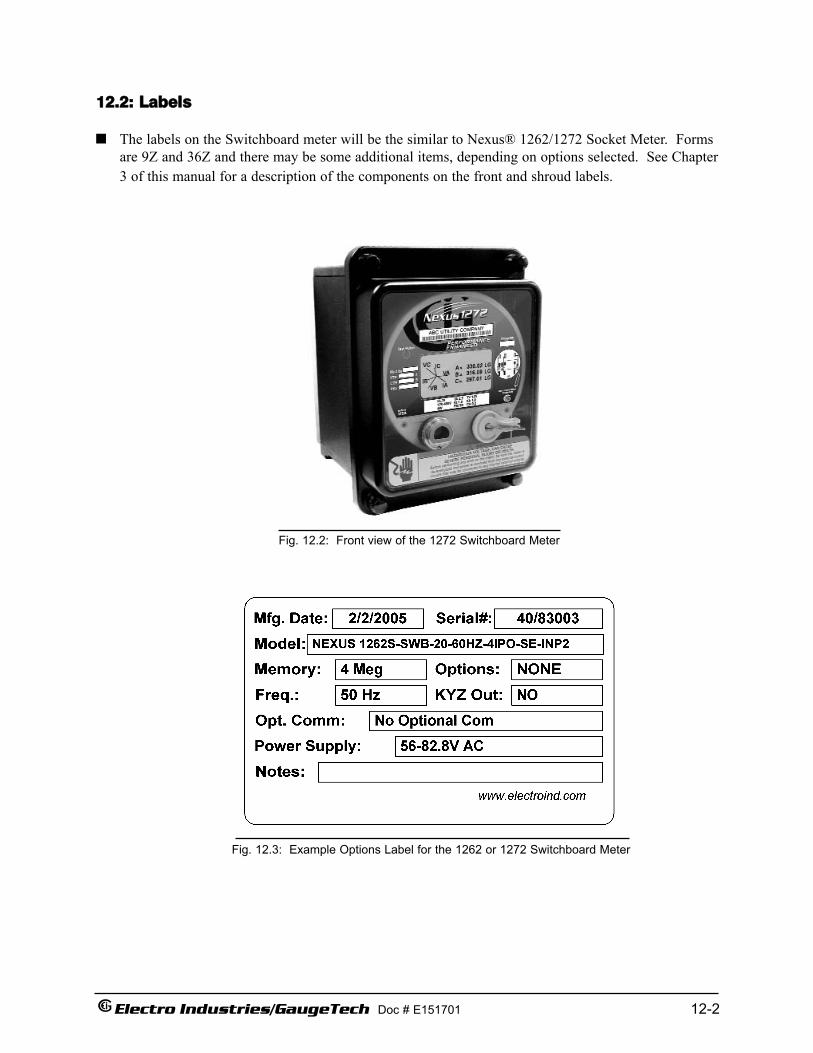
Electro Industries/GaugeTech Doc # E151701 12-2
12.2: Labels
The labels on the Switchboard meter will be the similar to Nexus® 1262/1272 Socket Meter. Formsare 9Z and 36Z and there may be some additional items, depending on options selected. See Chapter3 of this manual for a description of the components on the front and shroud labels.
Fig. 12.2: Front view of the 1272 Switchboard Meter
Fig. 12.3: Example Options Label for the 1262 or 1272 Switchboard Meter

Electro Industries/GaugeTech Doc # E151701 12-3
12.3: Specifications and Dimensions
The Nexus® 1262/1272 Switchboard Meter specifications are the same as for the Nexus® 1262/1272Socket Meter, except for the following:
The dimensions are detailed below.
The specifications are detailed in Chapter 2 of this manual.
The Nexus® Switchboard Meter is essentially the socket meter in an optional oblong case. Thedimensions are detailed in Figures 12.1 (Front View), 12.4 (Back View) and 12.5 (Side View).
Caution: Power In on new units is configured differently. Please check wiring carefully.
Fig. 12.4: Switchboard Meter, Back View
Electro Industries/GaugeTechwww.electroind.com

Electro Industries/GaugeTech Doc # E151701 12-4
Fig. 12.5: Switchboard Meter, Side View

Electro Industries/GaugeTech Doc # E151701 12-5
NOTE: When the Switchboard cases are built, they are not exact. They are welded together and have slight variations. For that reason we add Tolerance to the above Cutout Diagram (Fig. 12.6).
The dimensions shown are the exact measurements of boxes we have on hand that have been measured. We added 1/16 “ (+1.5875mm) for the cutout.
Please check DRILL HOLES for the mounting screw you are using. Check to see that the mounting screw fits the box tightly enough to hold the box in place. You can use a washer for a slightly smaller mounting screw.
Fig. 12.6: Switchboard Meter Cutout with Tolerance
∅ ∅
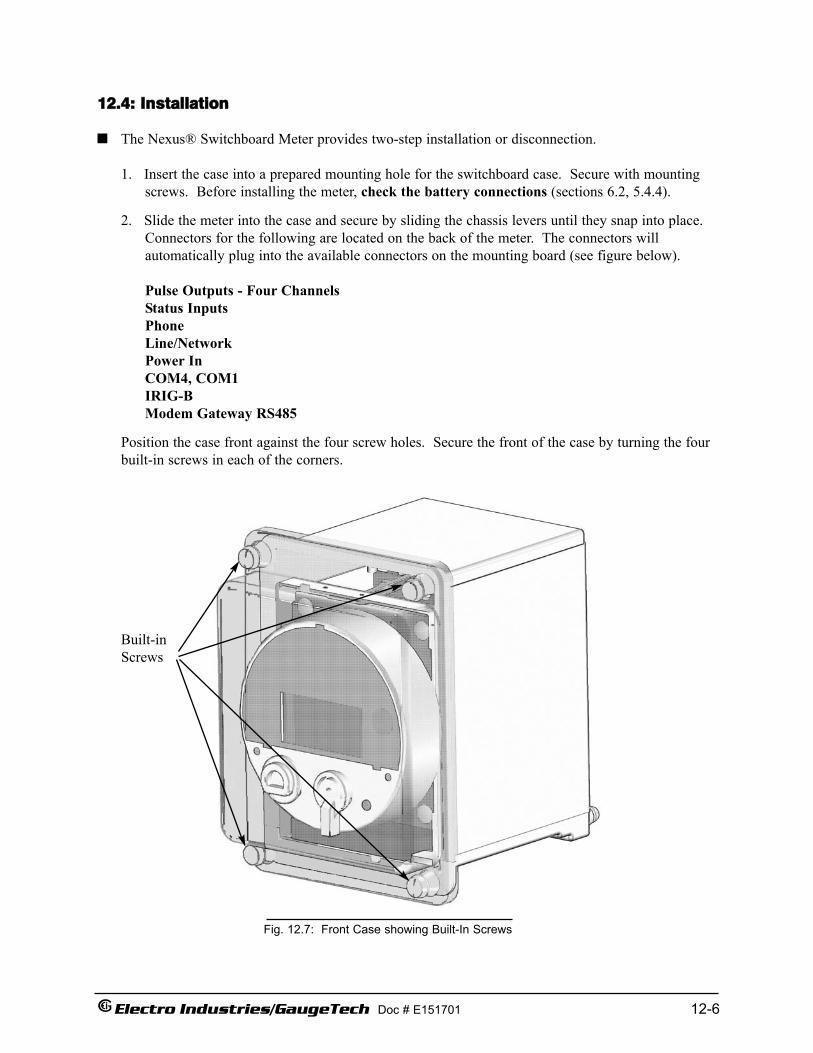
Electro Industries/GaugeTech Doc # E151701 12-6
12.4: Installation
The Nexus® Switchboard Meter provides two-step installation or disconnection.
1. Insert the case into a prepared mounting hole for the switchboard case. Secure with mounting screws. Before installing the meter, check the battery connections (sections 6.2, 5.4.4).
2. Slide the meter into the case and secure by sliding the chassis levers until they snap into place. Connectors for the following are located on the back of the meter. The connectors will automatically plug into the available connectors on the mounting board (see figure below).
Pulse Outputs - Four ChannelsStatus InputsPhoneLine/NetworkPower InCOM4, COM1IRIG-B Modem Gateway RS485
Position the case front against the four screw holes. Secure the front of the case by turning the fourbuilt-in screws in each of the corners.
Fig. 12.7: Front Case showing Built-In Screws
Built-inScrews

Electro Industries/GaugeTech Doc # E151701 12-7
12.5: Wiring Diagrams
The wiring of the Nexus® 1262/1272 Switchboard Meter is similar to that of the Nexus® Socket Meter.
The meter snaps into place and is securedwith levers and screws. All input andoutput connections are made automaticallyas the meter is installed. Note the view ofthe meter case in Fig. 12.7.
Wiring options are detailed in Figures 12.8through 12.17.
NOTE: For special requirements, contactour service department. All wiring shouldbe done by a licensed professional. Actual installation procedures, materials,equipment and connections must conform to applicable codes and standards.
Fig. 12.8: Back Angle View of Switchboard Meter
Form Description
9Z
Wye, no PTs, 3 CTs
Wye, 3 PTs, 3 CTs
Table 12.1: Switchboard Meter Configurations
4-Wire Delta, no PTs, 3 CTs
1262/1272 Switchboard Meter Forms and Associated Application Diagrams
Figure #
12.9
12.10
12.11
4-Wire Delta, 3 PTs, 3 CTs 12.12
12.13
12.14
12.15
12.16
4-Wire Delta, no PTs, 2 CTs
4-Wire Delta, 2 PTs, 2 CTs
3-Wire Delta, no PTs, 2 CTs
3-Wire Delta, 2 PTs, 2 CTs
36Z12.17
12.18
2.5 EL Wye, no PTs, 3 CTs
2.5 EL Wye, 2 PTs, 3 CTs

Electro Industries/GaugeTech Doc # E151701 12-8
Fig. 12.9: 9Z Transformer Rated Wye, no PTs, 3 CTs.
Caution: Power Supply Inputon new units is configured differently. Please check wiring carefully.

Electro Industries/GaugeTech Doc # E151701 12-9
Fig. 12.10: 9Z Transformer Rated Wye, 3 PTs, 3 CTs.
Caution: Power Supply Inputon new units is configured differently. Please check wiring carefully.
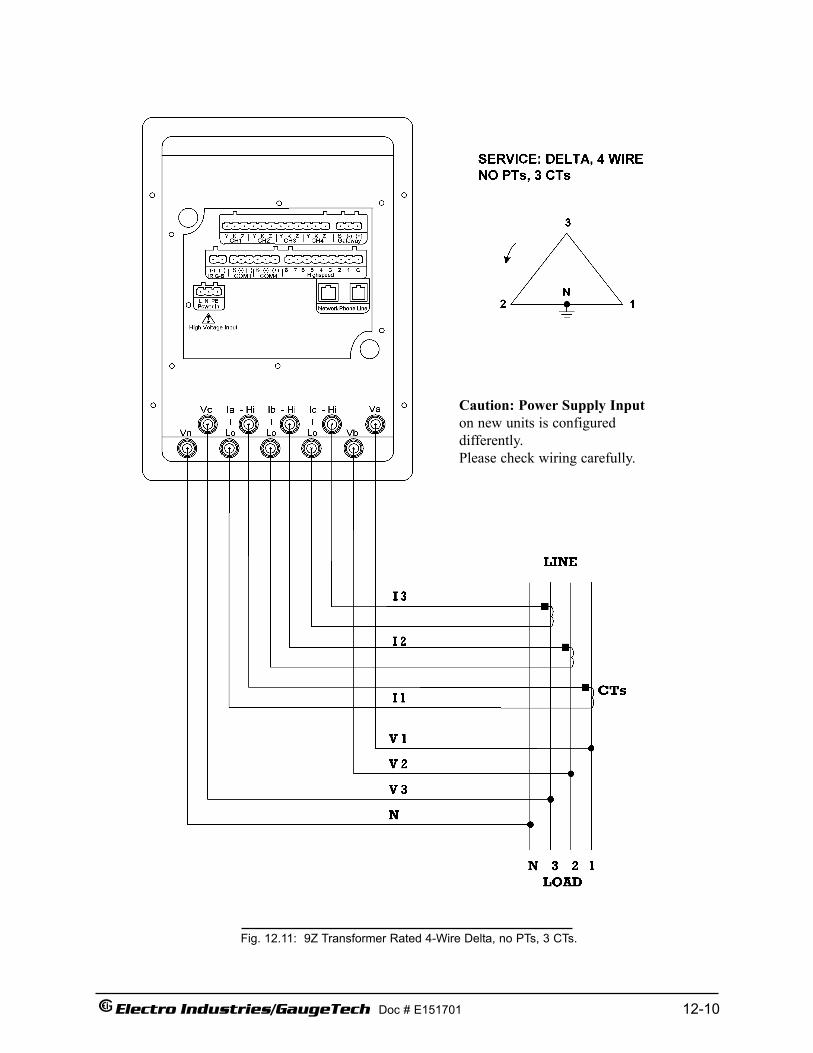
Electro Industries/GaugeTech Doc # E151701 12-10
Fig. 12.11: 9Z Transformer Rated 4-Wire Delta, no PTs, 3 CTs.
Caution: Power Supply Inputon new units is configured differently. Please check wiring carefully.

Electro Industries/GaugeTech Doc # E151701 12-11
Fig. 12.12: 9Z Transformer Rated 4-Wire Delta, 3 PTs, 3 CTs.
Caution: Power Supply Inputon new units is configured differently. Please check wiring carefully.

Electro Industries/GaugeTech Doc # E151701 12-12
Fig. 12.13: 9Z Transformer Rated 4-Wire Delta, no PTs, 2 CTs.
Caution: Power Supply Inputon new units is configured differently. Please check wiring carefully.

Electro Industries/GaugeTech Doc # E151701 12-13
Fig. 12.14: 9Z Transformer Rated 4-Wire Delta, 2 PTs, 2 CTs.
Caution: Power Supply Inputon new units is configured differently. Please check wiring carefully.

Electro Industries/GaugeTech Doc # E151701 12-14
Fig. 12.15: 9Z Transformer Rated 3-Wire Delta, no PTs, 2 CTs.
Caution: Power Supply Inputon new units is configured differently. Please check wiring carefully.
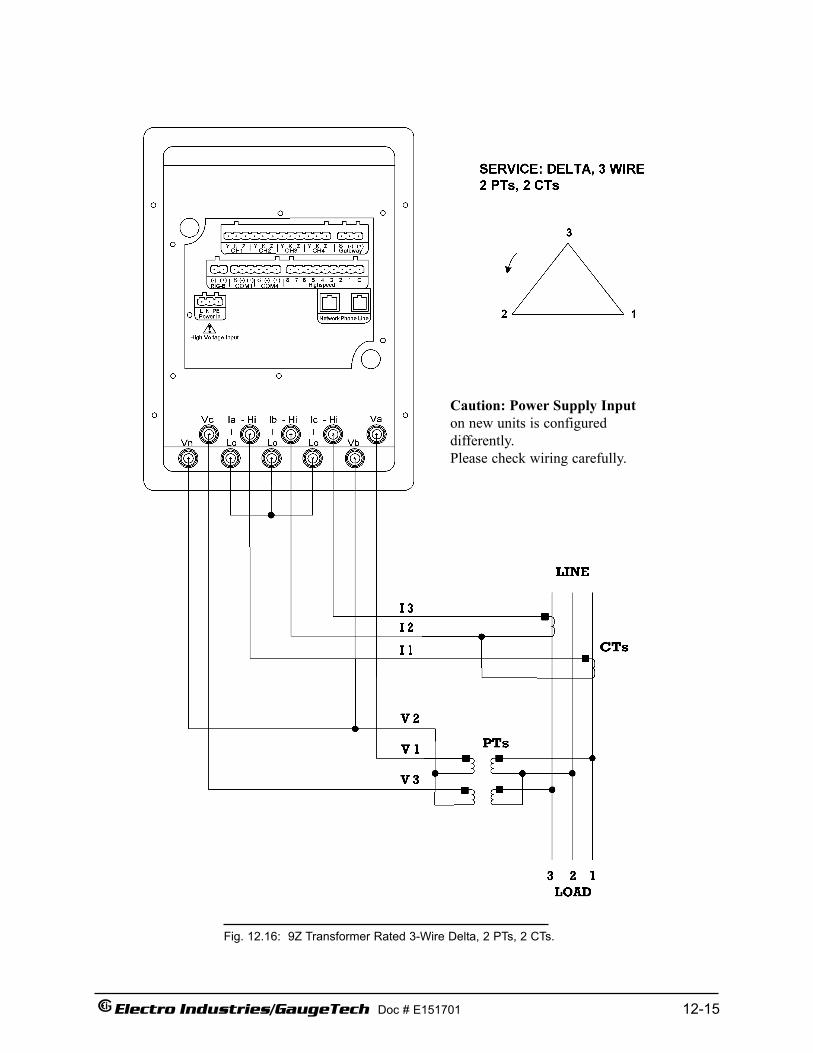
Electro Industries/GaugeTech Doc # E151701 12-15
Fig. 12.16: 9Z Transformer Rated 3-Wire Delta, 2 PTs, 2 CTs.
Caution: Power Supply Inputon new units is configured differently. Please check wiring carefully.
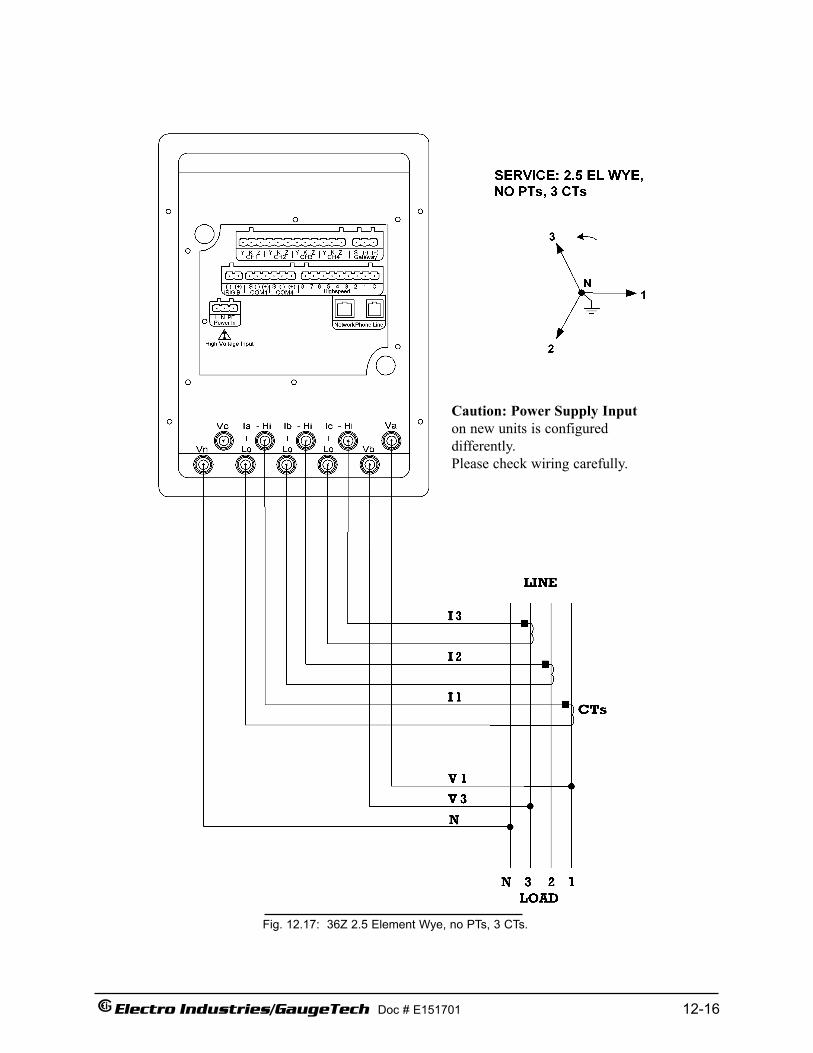
Electro Industries/GaugeTech Doc # E151701 12-16
Fig. 12.17: 36Z 2.5 Element Wye, no PTs, 3 CTs.
Caution: Power Supply Inputon new units is configured differently. Please check wiring carefully.

Electro Industries/GaugeTech Doc # E151701 12-17
Fig. 12.18: 36Z 2.5 Element Wye, 2 PTs, 3 CTs.
Caution: Power Supply Inputon new units is configured differently. Please check wiring carefully.

Electro Industries/GaugeTech Doc # E151701 12-18

Electro Industries/GaugeTech Doc # E151701 13-1
Chapter 13Nexus® Meter Calculations
13.1: Measurements and Calculations
The Nexus® 1262/1272 meter measures many different power parameters. The following is a listof the formulas used to conduct calculations with samples for Wye and Delta services.
Samples for Wye: van , vbn , vcn , ia , ib , ic , in Samples for Delta: vab , vbc , vca , ia , ib , ic
Root Mean Square (RMS) of Phase to Neutral Voltages: n = number of samples.
For Wye: x = an, bn, cn
Root Mean Square (RMS) of Currents: n = number of samples
For Wye: x = a, b, c, nFor Delta: x = a, b, c
Root Mean Square (RMS) of Phase to Phase Voltages: n = number of samples
For Wye: x,y = an, bn or bn, cn or cn, an
2( )
1X
n
x tt
RMS
v
nV ==∑
2( )
1X
n
x tt
RMS
i
nI ==∑
( )2( ) ( )1
XY
n
x t y tt
RMS
v v
nI =
−=∑

Electro Industries/GaugeTech Doc # E151701 13-2
For Delta: xy = ab, bc, ca
Power (Watts) per phase:
For Wye: x = a, b, c
Apparent Power (VA) per phase:
For Wye: X = A, B, C
Reactive Power (VAR) per phase:
For Wye: X = A, B, C
Q per phase:
For Wye: X = A, B, C
For Delta: unused
XXN RMSX RMSVA V I= •
( ) ( )1
n
xn t x tt
x
v i
nW =
•=∑
2( )
1XY
n
xy tt
RMS
v
nV ==∑
2 2
X X XVAR VA W= −
32
X XX
VAR WQ +=

Electro Industries/GaugeTech Doc # E151701 13-3
Power (Watts) Total:
For Wye:
For Delta:
Reactive Power (VAR) Total:
For Wye:
For Delta:
Apparent Power (VA) Total:
For Wye:
For Delta:
T A B CW W W W= + +
( ) ( ) ( ) ( )1
( )n
ab t a t bc t c tt
T
v i v i
nW =
• − •=∑
T A B CVAR VAR VAR VAR= + +
( )2
( ) ( )21
AAB
n
ab t a tt
RMST RMS
v i
nVAR V I =
⎛ ⎞•⎜ ⎟⎜ ⎟= • −⎜ ⎟⎜ ⎟⎝ ⎠
∑
( )2
( ) ( )21
CBC
n
bc t c tt
RMSRMS
v
n
iV I =
⎛ ⎞•⎜ ⎟⎜ ⎟• −⎜ ⎟⎜ ⎟⎝ ⎠
∑
+
2 2
T T TVA W VAR= +
T A B CVA VA VA VA= + +

Electro Industries/GaugeTech Doc # E151701 13-4
Total Q:
For Wye:
For Delta:
Total Energy:
X = WT, VART, VAT, QT
Power Factor (PF):
For Wye: X = A, B, C, TFor Delta: X = T
Total Average Power Factor:
X = Quadrants 1 & 4 (positive Wh), Quadrants 2 & 3 (negative Wh)
XX
X
WPF VA=
_ X
XTotal Ave
X
WhPFVAh
=
3600X
Xh = ∑
T A B CQ Q Q Q= + +
23 TT
T
WVARQ =+

Electro Industries/GaugeTech Doc # E151701 13-5
Phase Angles:X = A, B, C
% Total Harmonic Distortion (%THD):
For Wye: X = VAN, VBN, VCN, IA, IB, ICFor Delta: X = IA, IB, IC, VAB, VBC, VCA
K Factor:
X = IA, IB, IC
Voltage Imbalance:
Current Imbalance:
( )( )
127 2
1127 2
1
h
h
Xh
X
Xh
h RMSKFactor
RMS=
=
=∑
∑
i
( )1
127 2
2hX
hX
X
RMSTHD RMS
==∑
( )2
VImbAN BN CN
an bn cn
V V V
nn
v v v
RMS RMS RMS
+ +
=+ +
∑
IImb CalcN
A B C
I
I I I
RMSRMS RMS RMS
=+ +
( )1cosX XPF−=∠

Electro Industries/GaugeTech Doc # E151701 13-6
13.2: Demand Integrators
Power utilities take into account both energy consumption and peak demand when billing customers.Peak demand, expressed in kilowatts (kW), is the highest level of demand recorded during a set periodof time, called the interval. The Nexus® 1262/1272 meter supports the following most popular conventions for averaging demand and peak demand: Thermal Demand, Block Window Demand, Rolling WindowDemand and Predictive Window Demand. You may program and access all conventions concurrentlywith the Communicator EXT software (see the Communicator EXT User Manual).
Thermal Demand: Traditional analog watt-hour (WH) meters use heat-sensitive elements to measure temperature rises produced by an increase in current flowing through the meter. A pointermoves in proportion to the temperature change, providing a record of demand. The pointer remainsat peak level until a subsequent increase in demand moves it again, or until it is manually reset. TheNexus® meter mimics traditional meters to provide Thermal Demand readings.
Each second, as a new power level is computed, a recurrence relation formula is applied. This formula recomputes the thermal demand by averaging a small portion of the new power value with a large portion of the previous thermal demand value. The proportioning of new to previous isprogrammable, set by an averaging interval. The averaging interval represents a 90% change in thermal demand to a step change in power.
Block (Fixed) Window Demand: Fixed Window Demand produces an average (arithmetic mean) ofpower readings over a programmed interval.
Example: A typical setting of 15 minutes produces an average value every 15 minutes (at 12:00,12:15, 12:30, etc.) for power readings over the previous fifteen minute interval (11:45-12:00, 12:00-12:15, 12:15-12:30, etc.)
Rolling (Sliding) Window Demand: Rolling Window Demand functions like multiple, overlappingBlock Window Demands. The programmable settings provided are the number and length ofdemand subintervals. Every subinterval, an average (arithmetic mean) of power readings over thesubinterval is internally calculated. This new subinterval average is then averaged (arithmetic mean)with as many previous subinterval averages as programmed, to produce the Rolling WindowDemand.
Example: With settings of 3 five minute subintervals, subinterval averages are computed every 5minutes (12:00, 12:05, 12:10, 12:15. etc.) for power readings over the previous five minute interval(11:55-12:00, 12:00-12:05, 12:05-12:10, 12:10-12:15, etc.). Further, every 5 minutes, the subintervalaverages are averaged in groups of 3 (12:00, 12:05, 12:10; 12:05, 12:10, 12:15. etc.) to produce a fifteen (5*3) minute average every 5 minutes (rolling (sliding) every 5 minutes) (11:55-12:10, 12:-12:15, etc.).
Predictive Window Demand: Predictive Window Demand expands on the above Rolling WindowDemand. Rolling Window Demand waits until the end of a subinterval to update the demand.Predictive Window Demand uses the average of the previously completed subinterval, weighted by aprogrammable factor, to guess at the average of the upcoming subinteval During the nextsubinterval, as actual power readings occur, the value for the subinterval consists of the portionactually mesured plus a predicted guess, prorated to the subinterval time remaining.

Electro Industries/GaugeTech Doc # E151701 13-7
Example: Using the previous settings of 3 five minute intervals, and a new setting of 120%prediction factor, the working of the Predictive Window Demand could be described as follows:At 12:10, we have the average of the subintervals from 11:55-12:00, 12:00-12:05 and 12:05-12:10.In five minutes, we will have an average of the subintervals 12:00-12:05 and 12:05-12:10 (which weknow) and 12:10-12:15, which we do not yet know. As a guess, we will use the last subinterval(12:05-12:10), as an approximation for the next subinterval (12:10-12:15). As a further refinement,we will assume that the next subinterval might have a higher average (120%) than the lastsubinterval. As we progress into the subinterval, (for example, up to 12:11), the Predictive WindowDemand will be the average of the first two subintervals (12:00-12:05, 12:05-12:10), the actualvalues of the current subinterval (12:10-12:11) and the prediction for the remainder of thesubinterval, 4/5 of 120% of the 12:05-12:10 subinterval.
# of Subintervals = nSubinterval Length = LenPartial Subinterval Length = CntPrediction Factor = Pct
PartialSubn ... Sub1 Sub0 Predict
Len Len Len Cnt Len
1
0
Len
ii
ValueSub
Len
−
==∑
1
0
Cnt
ii
ValuePartial
Cnt
−
==∑
2
0 1
n
ii
ValueLen CntPartial xPct
n Len
−
=
⎡ ⎤⎢ ⎥ ⎡ ⎤⎡ ⎤−⎡ ⎤⎢ ⎥+ + −⎢ ⎥⎢ ⎥⎢ ⎥⎣ ⎦⎢ ⎥ ⎣ ⎦⎣ ⎦⎢ ⎥⎣ ⎦
∑
2
0 0 1
1 2 ( 1)
n
ii n
SubSub Sub Len Cntx xPct
n x n Len
−
= −
⎡ ⎤⎢ ⎥ ⎡ ⎤− −⎡ ⎤⎢ ⎥+ + ⎢ ⎥⎢ ⎥− − ⎣ ⎦⎢ ⎥ ⎣ ⎦⎢ ⎥⎣ ⎦
∑

Electro Industries/GaugeTech Doc #: E151701 13-8

Chapter 14EN 50160 Flicker
14.1: Overview
Flicker is the sensation that is experienced by the human visual system when it is subjected tochanges occurring in the illumination intensity of light sources. The primary effects of flicker areheadaches, irritability and sometimes epilepsy.
IEC 61000-4-15 and former IEC 868 describe the methods used to determine flicker severity. Thisphenomenon is strictly related to the sensitivity and the reaction of individuals. It can only be studied on a statistical basis by setting up suitable experiments among people.
14.2: Theory of Operation
Flicker can be caused by voltage variations which are caused by variable loads, such as arc furnaces,laser printers and microwave ovens. In order to model the eye brain change, which is a complex physiological process, the signal from the power network has to be processed while conforming withFigure 14.1 below.
• Block 1 consists of scaling circuitry and an automatic gain control function that normalizes inputvoltages to Blocks 2, 3 and 4. For the specified 50 Hz operation, the voltage standard is 230 VRMS.
• Block 2 recovers the voltage fluctuation by squaring the input voltage scaled to the referencelevel. This simulates the behavior of a lamp.
• Block 3 is composed of a cascade of two filters and a measuring range selector. In this implementation, a log classifier covers the full scale in use so the gain selection is automatic andnot shown here. The first filter eliminates the DC component and the double mains frequencycomponents of the demodulated output.
The configuration consists of a .05 Hz Low High Pass filter and a 6 Pole Butterworth Low Passfilter located at 35 Hz. The second filter is a weighting filter that simulates the response of thehuman visual system to sinusoidal voltage fluctuations of a coiled filament, gas-filled lamp (60W - 230 V). The filter implementation of this function is as specified in IEC 61000-4-15.
• Block 4 is composed of a squaring multiplier and a Low Pass filter. The Human FlickerSensation via lamp, eye and brain is simulated by the combined non-linear response of Blocks 2,3 and 4.
• Block 5 performs an online statistical cumulative probability analysis of the flicker level. Block5 allows direct calculation of the evaluation parameters Pst and Plt.
Flicker is computed using the three phase-to-neutral voltages in WYE configurations and the threephase-to-phase voltages when in DELTA. Evaluation occurs in the following forms: Instantaneous,Short Term or Long Term. Each form is detailed below:
Electro Industries/GaugeTech Doc # E151701 14-1

• Instantaneous Flicker EvaluationAn output of 1.00 from Block 4 corresponds to the Reference Human Flicker PerceptibilityThreshold for 50% of the population. This value is measured in Perceptibility Units (PU) and islabeled Pinst. This ia a real time value and it is continuously updated.
• Short Term Flicker EvaluationAn output of 1.00 from Block 5 (corresponding to the Pst value) corresponds to the conventionalthreshold of irritability per IEC 1000-3-3. In order to evaluate flicker severity, two parametershave been defined: one for the short term called Pst (defined in this section) and one for the longterm called Plt (defined in the next section).
The standard measurement time for Pst is 10 minutes. Pst is derived from the time at level statistics obtained from the level classifier in Block 5 of the flicker meter. The following formula is used:
Where the percentiles P(0.1), P(1), P(3), P(10), P(50) are the flicker levels exceeded for 0.1, 1, 2,20 and 50% of the time during the observation period. The suffix S in the formula indicates thatthe smoothed value should be used. The smoothed values are obtained using the following formulas:
P(1s) = (P(.7) + P(1) + P(1.5))/3P(3s) = (P(2.2) + P(3) + P(4))/3P(10s) = (P(6) + P(8) + P(10) + P(13) + P(17))/5P(50s) = (P(30) + P(50) + P(80))/3
The .3-second memory time constant in the flicker meter ensures that P(0.1) cannot changeabruptly and no smoothing is needed for this percentile.
• Long Term Flicker EvaluationThe 10-minute period on which the short-term flicker severity is based is suitable for short dutycycle disturbances. For flicker sources with long and variable duty cycles (e.g. arc furnaces) it isnecessary to provide criteria for long-term assessment. For this purpose, the long-term Plt isderived from the short-term values over an appropriate period. By definition, this is 12 short-term values of 10 minutes each over a period of 2 hours. The following formula is used:
Where Psti (i = 1, 2, 3, ...) are consecutive readings of the short-term severity Pst.
SummaryFlicker = Changes in the illumination of light sources due to cyclical voltage variations.Pinst = Instantaneous flicker values in Perceptibility Units (PU).Pst = Value based on 10-minute analysis.Plt = Value based on 12 Pst values.
Electro Industries/GaugeTech Doc # E151701 14-2
ssssst PPPPPP 5010311.0 08.028.00657.00525.00314.0 ++++=
3 1
3
N
PP
N
isti
lt
∑==
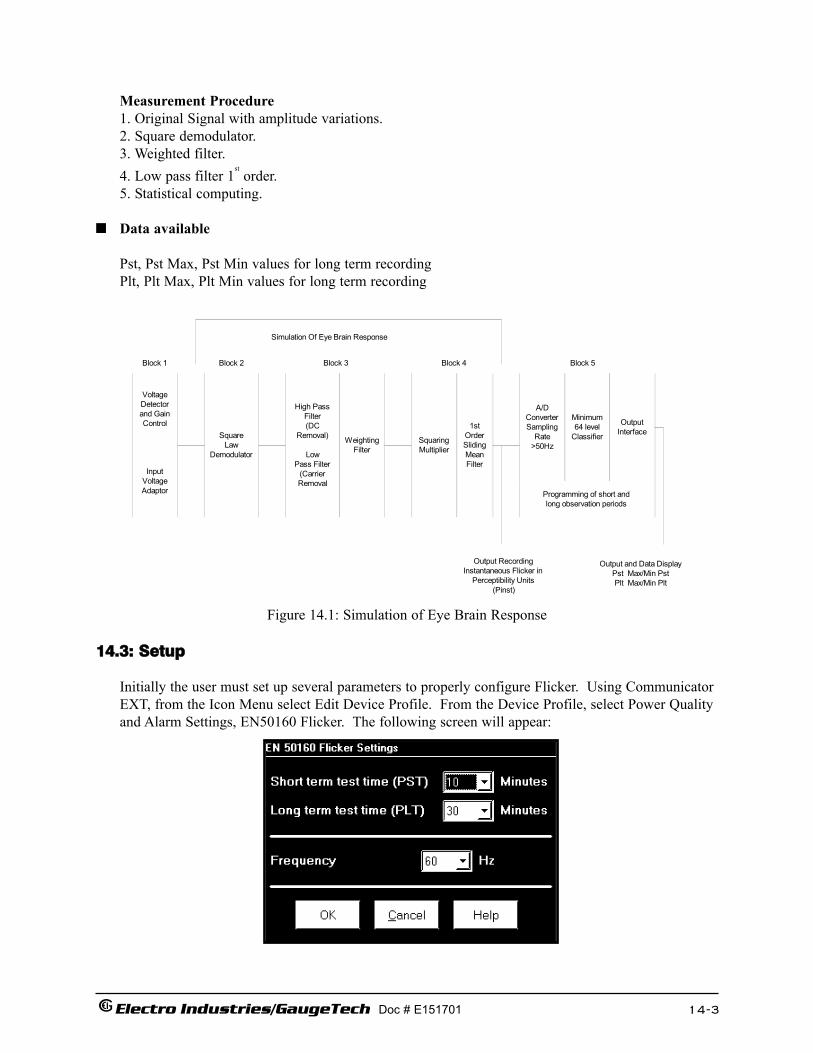
Measurement Procedure1. Original Signal with amplitude variations.2. Square demodulator.3. Weighted filter.4. Low pass filter 1
storder.
5. Statistical computing.
Data available
Pst, Pst Max, Pst Min values for long term recordingPlt, Plt Max, Plt Min values for long term recording
Figure 14.1: Simulation of Eye Brain Response
14.3: Setup
Initially the user must set up several parameters to properly configure Flicker. Using CommunicatorEXT, from the Icon Menu select Edit Device Profile. From the Device Profile, select Power Qualityand Alarm Settings, EN50160 Flicker. The following screen will appear:
Electro Industries/GaugeTech Doc # E151701 14-3
Block 1 Block 2 Block 3
VoltageDetectorand GainControl
InputVoltageAdaptor
SquareLaw
Demodulator
High PassFilter(DC
Removal)
LowPass Filter
(CarrierRemoval
WeightingFilter
SquaringMultiplier
1stOrderSlidingMeanFilter
A/DConverterSampling
Rate>50Hz
Minimum64 level
Classifier
OutputInterface
Programming of short andlong observation periods
Block 4 Block 5
Simulation Of Eye Brain Response
Output RecordingInstantaneous Flicker in
Perceptibility Units(Pinst)
Output and Data DisplayPst Max/Min PstPlt Max/Min Plt

• Select a Pst time range from 1 to 10 minutes. The standard measurement period is nominally 10minutes.
• Select a Plt time range from 1 to 240 minutes. The standard measurement is nominally 12 Pstperiods (120 minutes). Plt time must always be equal to or great than and a multiple of Pst time.This is reflected in the selections available to the user.
• Select the frequency of operation. 50 Hz is the approved frequency according to Flicker standards. A 60 Hz implementation is available and can be selected. This implementation is theproposed 60 Hz standard that is still in the approval process.
Remember the voltage is normalized. For 50 Hz, the normalized voltage is 230 V and for 60 Hz,the normalized voltage is 120 V.
Press OK when you are finished.
Press Help for more information on this topic.
14.4: Software - User Interface
Main screenFrom the Communicator EXT Icon Menu select Real Time Poll, Flicker. The following screenappears:
This section describes the Main Screen functions. The available values (Instantaneous, Short Term,Long Term) will be described below.
Electro Industries/GaugeTech Doc # E151701 14-4

TimeStart/Reset is the time when Flicker was started or reset. A Reset of Flicker causes the Max/Min
values to be cleared and restarts the Flicker Pst and Plt timers. A Start of Flicker is also equivalent to a Reset in that the PST and PLT are restarted and the Max/Min Values are cleared.
Stop corresponds to the time when Flicker is turned off.Current is the current clock time.Next Pst is the countdown time to when the next Pst value is available.Next Plt is the countdown time to when the next Plt value is available.
StatusIndicates the current status. Active = On. Stopped = Off.
FrequencyBase is the current operating frequency selected by the user (50 or 60 Hz).Current is the real time frequency measurement of the applied voltage.Base Voltage is the normalized voltage for the selected frequency (230 V for 50 Hz or 120 V for
60 Hz).
Flicker MonitoringClicking on Stop causes Flicker to stop being processed and freezes all the current values. Stop
Time is recorded and clears the current Max/Min ValuesClicking on Start starts Flicker processing. Start Time is recorded.Clicking on Reset causes the Max/Min values to be cleared and restarts the Flicker Pst and Plt
timers.Click OK to exit the Flicker screen.Click Help for more information on this topic.
Instantaneous ReadingsRefer to the Instantaneous section of the Main screen above. If you are on the Short or Long Termscreens, click on the Instantaneous tab to display the Instantaneous screen. The PU values, Pinst forVoltage Inputs Va, Vb and Vc are displayed here and are continuously updated. The correspondingCurrent Voltage values for each channel are displayed for reference.
Electro Industries/GaugeTech Doc # E151701 14-5

Short Term ReadingsClick on the Short Term tab to access the screen containing three groups of Pst readings.
Pst Readings Displayed• Current Pst values for Va, Vb and Vc and the time of computation.• Current Pst Max values for Va, Vb and Vc since the last reset and the time of the last reset.• Current Pst Min values for Va, Vb and Vc since the last reset and the time of the last reset.
The following screen is displayed:
Long Term ReadingsClick on the Long Term tab to access the Plt readings. The screen below displays three groups ofPlt values.
Plt Readings Displayed• Current Plt values for Va, Vb and Vc and the time of computation.• Current Plt Max values for Va, Vb and Vc since the last reset and the time of the last reset.• Current Plt Min values for Va, Vb and Vc since the last reset and the time of the last reset.
Electro Industries/GaugeTech Doc # E151701 14-6

14.5: Logging
The Nexus® meter is capable of logging Flicker values in an independent log. When Flicker is on, entries are made into the log in accordance with the times that associated values occur. Pst, Pst Max,Pst Min, Plt, Plt Max, Plt Min, Start/Reset and Stop times are all recorded. All values can be down-loaded to the Log Viewer where they are available for graphing or export to another program, suchas Excel. All Flicker values are predefined and cannot be changed.
14.6: Polling
The Pinst, Pst, Pst Max, Pst Min, Plt, Plt Max, Plt Min values are all capable of being polledthrough the Communications Port. Refer to the Nexus® meter Modbus and DNP Mappings forregister assignments and data definitions.
14.7: Log Viewer
From the Communicator EXT Log Viewer screen, using the menus at the top of the Log Viewerscreen, select a meter, time ranges and values to access. Select Flicker.
The values and the associated time stamps (when the values occurred) are displayed in a grid box.Use the buttons at the bottom of the screen to create a graph or export the data to another program.Max and Min values are only displayed; they cannot be graphed. But, Max and Min values areavailable for export.
Graphed values include Pst and Plt Va, Vb and Vc.Displayed values include Pst and Plt Max and Min for Va, Vb and Vc.
Electro Industries/GaugeTech Doc # E151701 14-7

14.8: Performance Notes
Pst and Plt average time are synchronized to the clock (e.g. for a 10 minute average, the times willoccur at 0, 10, 20, etc.). The actual time of the first average can be less than the selected period toallow for initial clock synchronization.
If the wrong frequency is chosen (e.g. 50Hz selection for a system operating at 60Hz), Flicker willstill operate but the values computed will not be valid. Select carefully.
User settings are stored. If Flicker is on and power is removed from the meter, Flicker will still beon when power returns. This can cause data gaps in the logged data.
The Max and Min values are stored and are not lost if the unit is powered down.
Flicker meets the requirements of IEC 61000-4-15 and former IEC 868. Refer to those specifications for more details, if needed.
Operation is at 230V for 50Hz and 120V for 60Hz as per specification. If the input voltage is different, the system will normalize it to 230V or 120V for computational purposes.
Electro Industries/GaugeTech Doc # E151701 14-8

Electro Industries/GaugeTech Doc # E151701 A-1
Appendix ATransformer Loss Compensation Excel Spreadsheet
with Examples
A.1: Calculating Values
Transformer Loss Compensation is discussed in Chapter 8 of this manual. Values for three elementinstallations can be calculated in two ways:
• Click the TLC Calculator button on the Transformer Loss screen of the Nexus® meter's Device Profile. The TLC Calculator button activates an Excel Spreadsheet, ONLY if you have MS Excel installed on your computer. A copy of the Excel Spreadsheet is offered on the following pages with example numbers.
1. Enter the required data into the Excel Spreadsheet. The Excel program will calculate the values needed for the Transformer Loss screen of the Device Profile.
2. Enter the values into the Device Profile.
• Use the worksheet found in Chapter 8, “Three Element Loss Compensation Worksheet” to calculate the values by hand. Notes under each section will assist you.
1. Enter values based on the tranformer manufacturer’s test report. The worksheet is progressive and notes under each section will guide you to the next section.
2. Enter the values into the Device Profile.
A.2: Excel Spreadsheet with Example Numbers
If you have MS Excel installed in your computer, use the TLC Calculator button on the TransformerLoss screen of the Device Profile. The copy of the Spreadsheet with Example Numbers found on thefollowing pages will assist you.
Important! Refer to Appendix B of the Communicator EXT User Manual for additional instructionsand information on the Transformer Line Loss application.

Electro Industries/GaugeTech Doc # E151701 A-2

Electro Industries/GaugeTech Doc # E151701 A-3
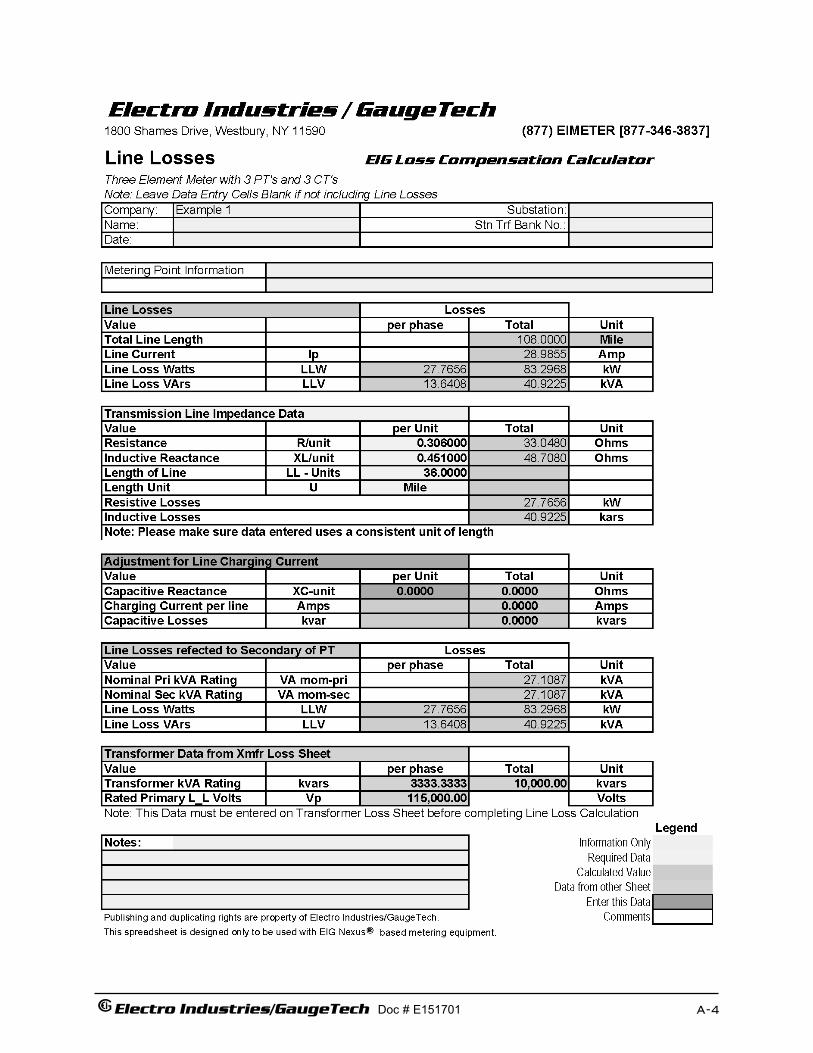
Electro Industries/GaugeTech Doc # E151701 A-4

Electro Industries/GaugeTech Doc # E151701 A-5

Electro Industries/GaugeTech Doc # E151701 A-6
Electro Industries/GaugeTech Doc # E151701 B-1
Appendix BBlade Configuration
for Forms 9S, 36S and 45S
B.1: 1262/1272 Forms
Four supported forms for the Nexus® 1262/1272 Socket Meters with their wiring configurations aredetailed in Chapter 11 of this manual. Those forms are based on the rated voltage and hookuprequired for your application. (Custom forms and configurations are also available from EIG.
The three supported forms with wiring configurations for the Nexus® 1262/1272 Socket Meters arelisted below:
• 9SWye, no PTs or 3 PTs, 3CTs 3-Wire Delta, no PTs or 2 PTs, 2 CTs2.5EL Wye, no PTs or 2 PTs, 3 CTs 4-Wire Delta, no PTs or 2 PTs, 2 CTs
4-Wire Delta, no PTs or 3 PTs, 3 CTs
• 36S2.5EL Wye, no PTs or 2 PTs, 3 CTs
• 45SWye, no PTs or 2 PTs, 3 CTs 3-Wire Delta, no PTs or 2 PTs, 2 CTs
4-Wire Delta, no PTs or 2 PTs, 2 CTs
B.2: Blade Configuration Drawings
Detail drawings of the Blade Configurations are offered on the following pages. There are two configurations because the 9S and the 36S are the same. There is a drawing showing the knockoutholes for each configuration.
Note: The forms referred to in this chapter comply with ANSI forms 9S, 36S and 45S.

Electro Industries/GaugeTech Doc # E151701 B-2
Fig. B.1: Form 9S & 36S Base with Knock Out Holes
Fig. B.2: Form 45S Base with Knock Out Holes
Note: The forms referred to on this page comply with ANSI forms 9S, 36S and 45S.
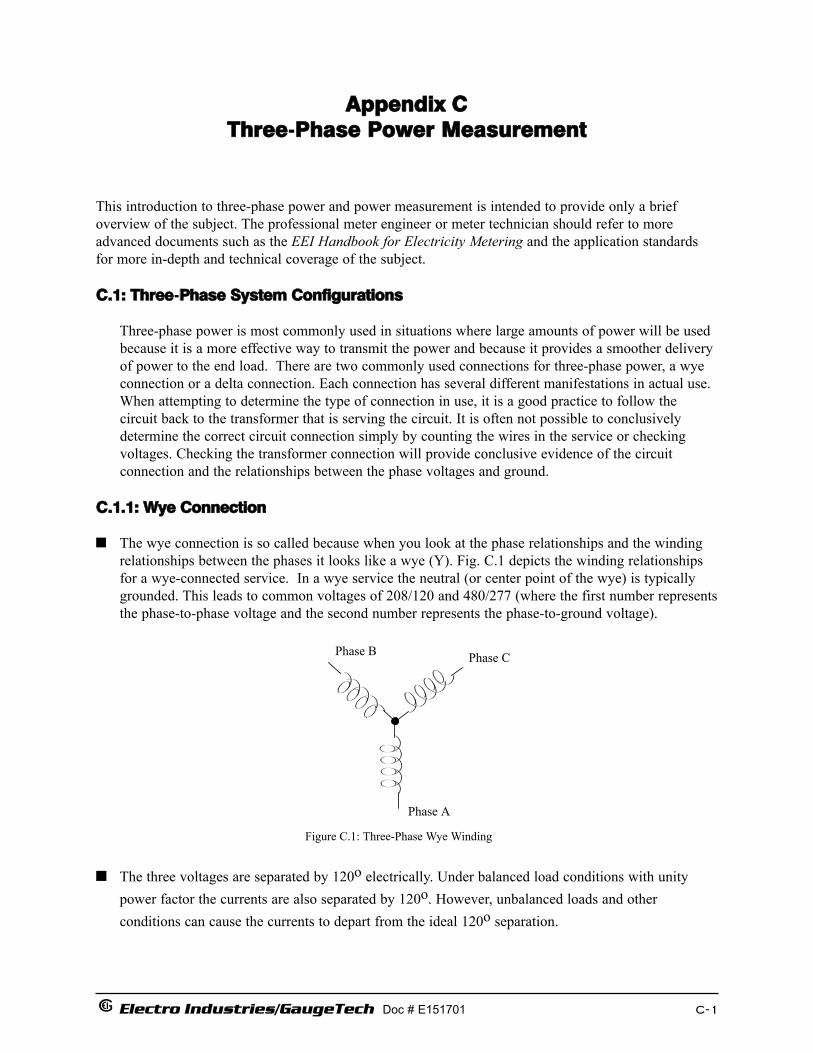
Electro Industries/GaugeTech Doc # E151701 C-1
Appendix CThree-PPhase Power Measurement
This introduction to three-phase power and power measurement is intended to provide only a briefoverview of the subject. The professional meter engineer or meter technician should refer to moreadvanced documents such as the EEI Handbook for Electricity Metering and the application standardsfor more in-depth and technical coverage of the subject.
C.1: Three-PPhase System Configurations
Three-phase power is most commonly used in situations where large amounts of power will be used because it is a more effective way to transmit the power and because it provides a smoother delivery of power to the end load. There are two commonly used connections for three-phase power, a wye connection or a delta connection. Each connection has several different manifestations in actual use. When attempting to determine the type of connection in use, it is a good practice to follow the circuit back to the transformer that is serving the circuit. It is often not possible to conclusively determine the correct circuit connection simply by counting the wires in the service or checking voltages. Checking the transformer connection will provide conclusive evidence of the circuit connection and the relationships between the phase voltages and ground.
C.1.1: Wye Connection
The wye connection is so called because when you look at the phase relationships and the windingrelationships between the phases it looks like a wye (Y). Fig. C.1 depicts the winding relationshipsfor a wye-connected service. In a wye service the neutral (or center point of the wye) is typicallygrounded. This leads to common voltages of 208/120 and 480/277 (where the first number representsthe phase-to-phase voltage and the second number represents the phase-to-ground voltage).
The three voltages are separated by 120o electrically. Under balanced load conditions with unitypower factor the currents are also separated by 120o. However, unbalanced loads and other conditions can cause the currents to depart from the ideal 120o separation.
Phase A
Phase B Phase C
Figure 1.1: Three-Phase Wye Winding Figure C.1: Three-Phase Wye Winding
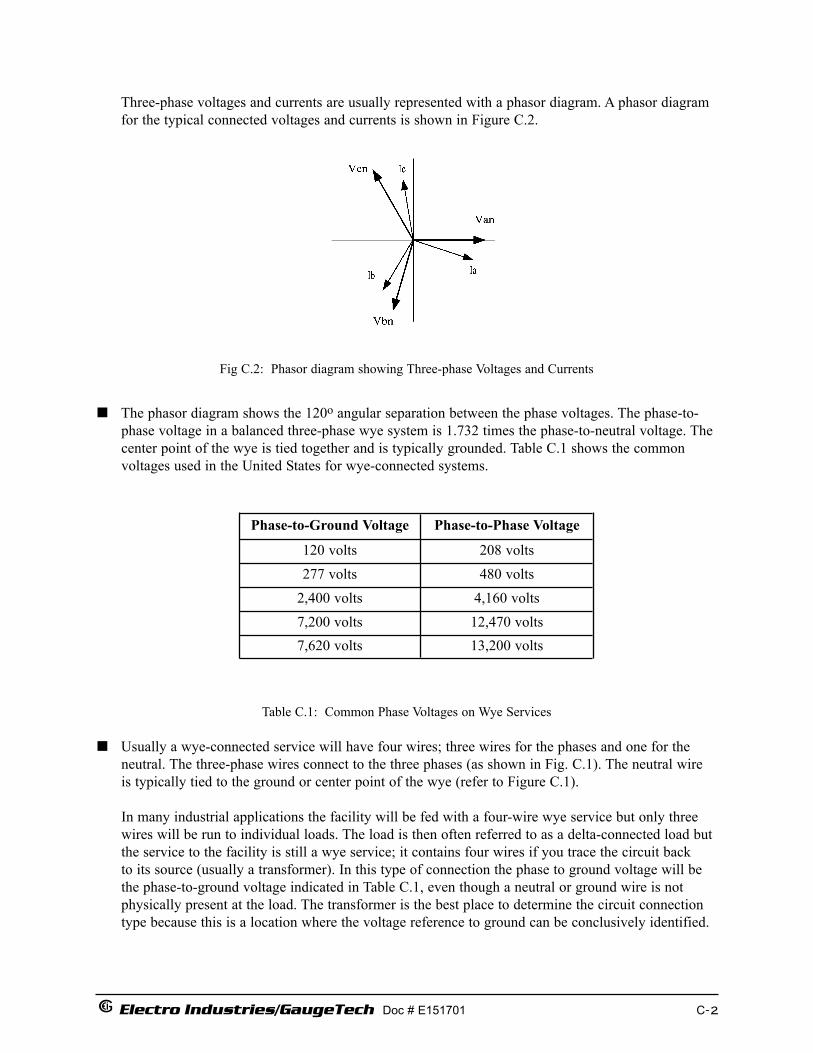
Electro Industries/GaugeTech Doc # E151701 C-2
Fig C.2: Phasor diagram showing Three-phase Voltages and Currents
The phasor diagram shows the 120o angular separation between the phase voltages. The phase-to-phase voltage in a balanced three-phase wye system is 1.732 times the phase-to-neutral voltage. The center point of the wye is tied together and is typically grounded. Table C.1 shows the common voltages used in the United States for wye-connected systems.
Table C.1: Common Phase Voltages on Wye Services
Usually a wye-connected service will have four wires; three wires for the phases and one for the neutral. The three-phase wires connect to the three phases (as shown in Fig. C.1). The neutral wire is typically tied to the ground or center point of the wye (refer to Figure C.1).
In many industrial applications the facility will be fed with a four-wire wye service but only three wires will be run to individual loads. The load is then often referred to as a delta-connected load but the service to the facility is still a wye service; it contains four wires if you trace the circuit back to its source (usually a transformer). In this type of connection the phase to ground voltage will be the phase-to-ground voltage indicated in Table C.1, even though a neutral or ground wire is not physically present at the load. The transformer is the best place to determine the circuit connection type because this is a location where the voltage reference to ground can be conclusively identified.
Three-phase voltages and currents are usually represented with a phasor diagram. A phasor diagramfor the typical connected voltages and currents is shown in Figure C.2.
Phase-to-Ground Voltage Phase-to-Phase Voltage
120 volts277 volts
2,400 volts7,200 volts
208 volts480 volts
4,160 volts12,470 volts
7,620 volts 13,200 volts

C.1.2: Delta Connection
Delta connected services may be fed with either three wires or four wires. In a three-phase deltaservice the load windings are connected from phase-to-phase rather than from phase-to-ground.Figure C.3 shows the physical load connections for a delta service.
In this example of a delta service, three wires will transmit the power to the load. In a true delta service, the phase-to-ground voltage will usually not be balanced because the ground is not at the center of the delta.
Fig. C.4 shows the phasor relationships between voltage and current on a three-phase delta circuit.
In many delta services, one corner of the delta is grounded. This means the phase to ground voltage will be zero for one phase and will be full phase-to-phase voltage for the other two phases. This is done for protective purposes.
Another common delta connection is the four-wire, grounded delta used for lighting loads. In thisconnection the center point of one winding is grounded. On a 120/240 volt, four-wire, groundeddelta service the phase-to-ground voltage would be 120 volts on two phases and 208 volts on thethird phase. Figure C.5 shows the phasor diagram for the voltages in a three-phase, four-wire deltasystem.
Electro Industries/GaugeTech Doc # E151701 C-3
Phase A Phase B
Phase C
Figure 1.3: Three-Phase Delta Winding Relationship
Vab
Vbc
Vca
Ia
Ib
Ic
Figure 1.4: Phasor diagram showing three-phase voltages, currents delta connected.
Figure C.3: Three-Phase Delta Winding Relationship
Figure C.4: Phasor diagram showing Three-Phase Voltages, Currents, Dela Connected

Fig C.5: Phasor diagram showing Three-phase, Four-wire Delta Connected System
C.1.3: Blondell’s Theorem and Three Phase Measurement
In 1893 an engineer and mathematician named Andre E. Blondell set forth the first scientific basis for poly phase metering. His theorem states:
If energy is supplied to any system of conductors through N wires, the total power in the system isgiven by the algebraic sum of the readings of N wattmeters so arranged that each of the N wires contains one current coil, the corresponding potential coil being connected between that wire andsome common point. If this common point is on one of the N wires, the measurement may be madeby the use of N-1 wattmeters.
The theorem may be stated more simply, in modern language:
In a system of N conductors, N-1 meter elements will measure the power or energy taken providedthat all the potential coils have a common tie to the conductor in which there is no current coil.
Three-phase power measurement is accomplished by measuring the three individual phases andadding them together to obtain the total three phase value. In older analog meters, this measurement was accomplished using up to three separate elements. Each element combined the single-phase voltage and current to produce a torque on the meter disk. All three elements werearranged around the disk so that the disk was subjected to the combined torque of the three elements.As a result the disk would turn at a higher speed and register power supplied by each of the threewires.
According to Blondell's Theorem, it was possible to reduce the number of elements under certainconditions. For example, a three-phase, three-wire delta system could be correctly measured withtwo elements (two potential coils and two current coils) if the potential coils were connectedbetween the three phases with one phase in common.
In a three-phase, four-wire wye system it is necessary to use three elements. Three voltage coils are connected between the three phases and the common neutral conductor. A current coil is required ineach of the three phases.
In modern digital meters, Blondell's Theorem is still applied to obtain proper metering. The difference in modern meters is that the digital meter measures each phase voltage and current andcalculates the single-phase power for each phase. The meter then sums the three phase powers to a
Electro Industries/GaugeTech Doc # E151701 C-4

single three-phase reading.
Some digital meters calculate the individual phase power values one phase at a time. This means themeter samples the voltage and current on one phase and calculates a power value. Then it samples thesecond phase and calculates the power for the second phase. Finally, it samples the third phase and calculates that phase power. After sampling all three phases, the meter combines the three readings tocreate the equivalent three-phase power value. Using mathematical averaging techniques, this methodcan derive a quite accurate measurement of three-phase power.
More advanced meters actually sample all three phases of voltage and current simultaneously and calculate the individual phase and three-phase power values. The advantage of simultaneous samplingis the reduction of error introduced due to the difference in time when the samples were taken.
Blondell's Theorem is a derivation that results from Kirchhoff's Law. Kirchhoff's Law states that thesum of the currents into a node is zero. Another way of stating the same thing is that the current into anode (connection point) must equal the current out of the node. The law can be applied to measuringthree-phase loads. Figure C.6 shows a typical connection of a three-phase load applied to a three-phase, four-wire service. Krichhoff's Laws hold that the sum of currents A, B, C and N must equal zeroor that the sum of currents into Node "n" must equal zero.
If we measure the currents in wires A, B and C, we then know the current in wire N by Kirchhoff'sLaw and it is not necessary to measure it. This fact leads us to the conclusion of Blondell's Theoremthat we only need to measure the power in three of the four wires if they are connected by a commonnode. In the circuit of Figure C.6 we must measure the power flow in three wires. This will requirethree voltage coils and three current coils (a three element meter). Similar figures and conclusionscould be reached for other circuit configurations involving delta-connected loads.
Electro Industries/GaugeTech Doc # E151701 C-5
Phase A
Phase B Phase C
Figure 1.6: Three-Phase Wye Load illustrating Kirchhoff’s Law and Blondell’s Theorem
Node “n”
A
B
N
C
Figure C.6: Three-Phase Wye Load Illustrating Kirchoff’s Lawand Blondell’s Theorem
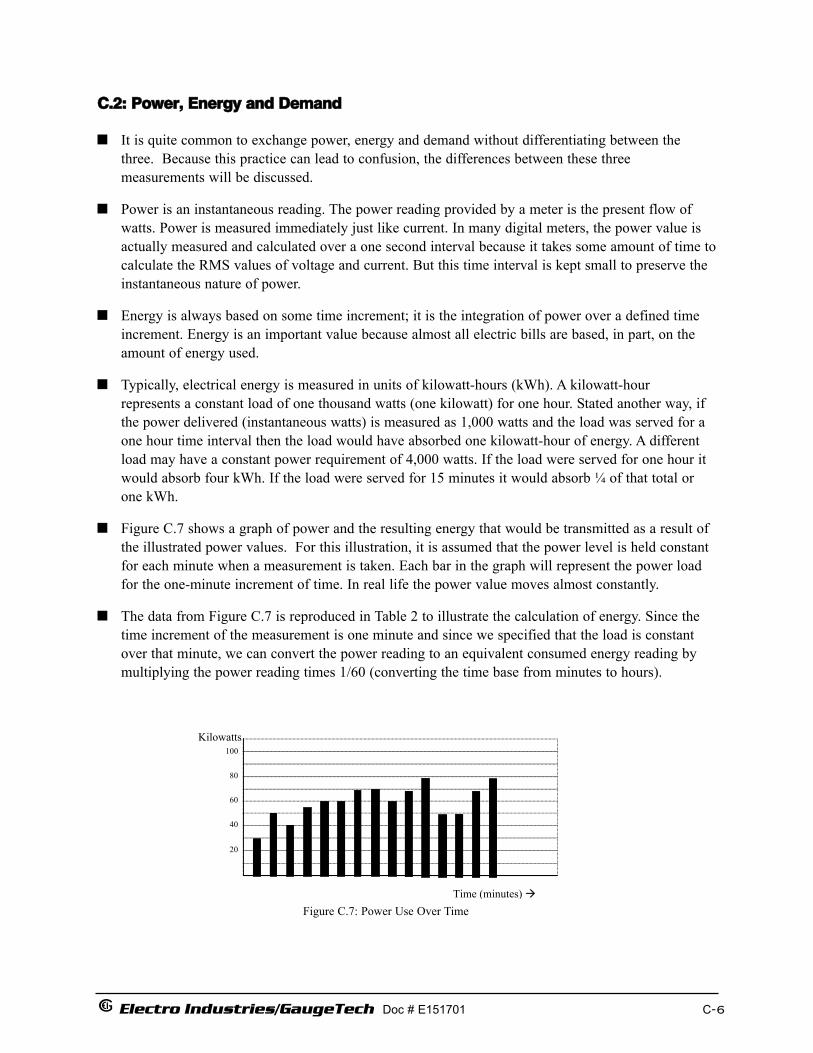
C.2: Power, Energy and Demand
It is quite common to exchange power, energy and demand without differentiating between thethree. Because this practice can lead to confusion, the differences between these three measurements will be discussed.
Power is an instantaneous reading. The power reading provided by a meter is the present flow ofwatts. Power is measured immediately just like current. In many digital meters, the power value isactually measured and calculated over a one second interval because it takes some amount of time tocalculate the RMS values of voltage and current. But this time interval is kept small to preserve theinstantaneous nature of power.
Energy is always based on some time increment; it is the integration of power over a defined timeincrement. Energy is an important value because almost all electric bills are based, in part, on theamount of energy used.
Typically, electrical energy is measured in units of kilowatt-hours (kWh). A kilowatt-hour represents a constant load of one thousand watts (one kilowatt) for one hour. Stated another way, ifthe power delivered (instantaneous watts) is measured as 1,000 watts and the load was served for aone hour time interval then the load would have absorbed one kilowatt-hour of energy. A differentload may have a constant power requirement of 4,000 watts. If the load were served for one hour itwould absorb four kWh. If the load were served for 15 minutes it would absorb 1⁄4 of that total orone kWh.
Figure C.7 shows a graph of power and the resulting energy that would be transmitted as a result ofthe illustrated power values. For this illustration, it is assumed that the power level is held constantfor each minute when a measurement is taken. Each bar in the graph will represent the power loadfor the one-minute increment of time. In real life the power value moves almost constantly.
The data from Figure C.7 is reproduced in Table 2 to illustrate the calculation of energy. Since thetime increment of the measurement is one minute and since we specified that the load is constantover that minute, we can convert the power reading to an equivalent consumed energy reading bymultiplying the power reading times 1/60 (converting the time base from minutes to hours).
Electro Industries/GaugeTech Doc # E151701 C-6
Time (minutes)
Kilowatts
20
40
60
80
100
Figure .7: Power use over time Figure C.7: Power Use Over Time

Table C.2: Power and energy relationship over time
As in Table C.2, the accumulated energy for the power load profile of Figure D.7 is 14.92 kWh.
Demand is also a time-based value. The demand is the average rate of energy use over time. Theactual label for demand is kilowatt-hours/hour but this is normally reduced to kilowatts. This makesit easy to confuse demand with power. But demand is not an instantaneous value. To calculatedemand it is necessary to accumulate the energy readings (as illustrated in Figure C.7) and adjustthe energy reading to an hourly value that constitutes the demand.
In the example, the accumulated energy is 14.92 kWh. But this measurement was made over a 15-minute interval. To convert the reading to a demand value, it must be normalized to a 60-minute interval. If the pattern were repeated for an additional three 15-minute intervals the total energy would be four times the measured value or 59.68 kWh. The same process is applied to calculate the 15-minute demand value. The demand value associated with the example load is 59.68 kWh/hr or 59.68 kWd. Note that the peak instantaneous value of power is 80 kW, significantly more than thedemand value.
Electro Industries/GaugeTech Doc # E151701 C-7
Time Interval(Minute) Power (kW) Energy (kWh) Accumulated
Energy (kWh)
1 30 0.50 0.502 50 0.83 1.333 40 0.67 2.004 55 0.92 2.925 60 1.00 3.926 60 1.00 4.927 70 1.17 6.098 70 1.17 7.269 60 1.00 8.26
10 70 1.17 9.4311 80 1.33 10.7612 50 0.83 12.4213 50 0.83 12.4214 70 1.17 13.5915 80 1.33 14.92

Figure C.8 shows another example of energy and demand. In this case, each bar represents the energy consumed in a 15-minute interval. The energy use in each interval typically falls between 50and 70 kWh. However, during two intervals the energy rises sharply and peaks at 100 kWh in interval number 7. This peak of usage will result in setting a high demand reading. For each intervalshown the demand value would be four times the indicated energy reading. So interval 1 would havean associated demand of 240 kWh/hr. Interval 7 will have a demand value of 400 kWh/hr. In thedata shown, this is the peak demand value and would be the number that would set the demandcharge on the utility bill.
As can be seen from this example, it is important to recognize the relationships between power, energy and demand in order to control loads effectively or to monitor use correctly.
C.3: Reactive Energy and Power Factor
The real power and energy measurements discussed in the previous section relate to the quantitiesthat are most used in electrical systems. But it is often not sufficient to only measure real power andenergy. Reactive power is a critical component of the total power picture because almost all real-lifeapplications have an impact on reactive power. Reactive power and power factor concepts relate toboth load and generation applications. However, this discussion will be limited to analysis of reactive power and power factor as they relate to loads. To simplify the discussion, generation willnot be considered.
Real power (and energy) is the component of power that is the combination of the voltage and thevalue of corresponding current that is directly in phase with the voltage. However, in actual practicethe total current is almost never in phase with the voltage. Since the current is not in phase with thevoltage, it is necessary to consider both the inphase component and the component that is at quadrature (angularly rotated 90o or perpendicular) to the voltage. Figure C.9 shows a single-phasevoltage and current and breaks the current into its in-phase and quadrature components.
Electro Industries/GaugeTech Doc # E151701 C-8
Intervals
Kilowatt-hours
20
40
60
80
100
Figure 1.8: Energy use and demand Figure C.8: Energy Use and Demand

The voltage (V) and the total current (I) can be combined to calculate the apparent power or VA.The voltage and the in-phase current (IR) are combined to produce the real power or watts. The volt-age and the quadrature current (IX) are combined to calculate the reactive power.
The quadrature current may be lagging the voltage (as shown in Figure C.9) or it may lead the voltage. When the quadrature current lags the voltage the load is requiring both real power (watts)and reactive power (VARs). When the quadrature current leads the voltage the load is requiring realpower (watts) but is delivering reactive power (VARs) back into the system; that is VARs are flowing in the opposite direction of the real power flow.
Reactive power (VARs) is required in all power systems. Any equipment that uses magnetization tooperate requires VARs. Usually the magnitude of VARs is relatively low compared to the real powerquantities. Utilities have an interest in maintaining VAR requirements at the customer to a low valuein order to maximize the return on plant invested to deliver energy. When lines are carrying VARs,they cannot carry as many watts. So keeping the VAR content low allows a line to carry its fullcapacity of watts. In order to encourage customers to keep VAR requirements low, most utilitiesimpose a penalty if the VAR content of the load rises above a specified value.
A common method of measuring reactive power requirements is power factor. Power factor can bedefined in two different ways. The more common method of calculating power factor is the ratio ofthe real power to the apparent power. This relationship is expressed in the following formula:
Total PF = real power / apparent power = watts/VA
This formula calculates a power factor quantity known as Total Power Factor. It is called Total PFbecause it is based on the ratios of the power delivered. The delivered power quantities will includethe impacts of any existing harmonic content. If the voltage or current includes high levels of harmonic distortion the power values will be affected. By calculating power factor from the powervalues, the power factor will include the impact of harmonic distortion. In many cases this is thepreferred method of calculation because the entire impact of the actual voltage and current areincluded.
A second type of power factor is Displacement Power Factor. Displacement PF is based on theangular relationship between the voltage and current. Displacement power factor does not considerthe magnitudes of voltage, current or power. It is solely based on the phase angle differences. As a
Electro Industries/GaugeTech Doc # E151701 C-9
V
I
IR
IX
Figure 1.9: Voltage and complex current
Angle θ
Figure C.9: Voltage and Complex Current
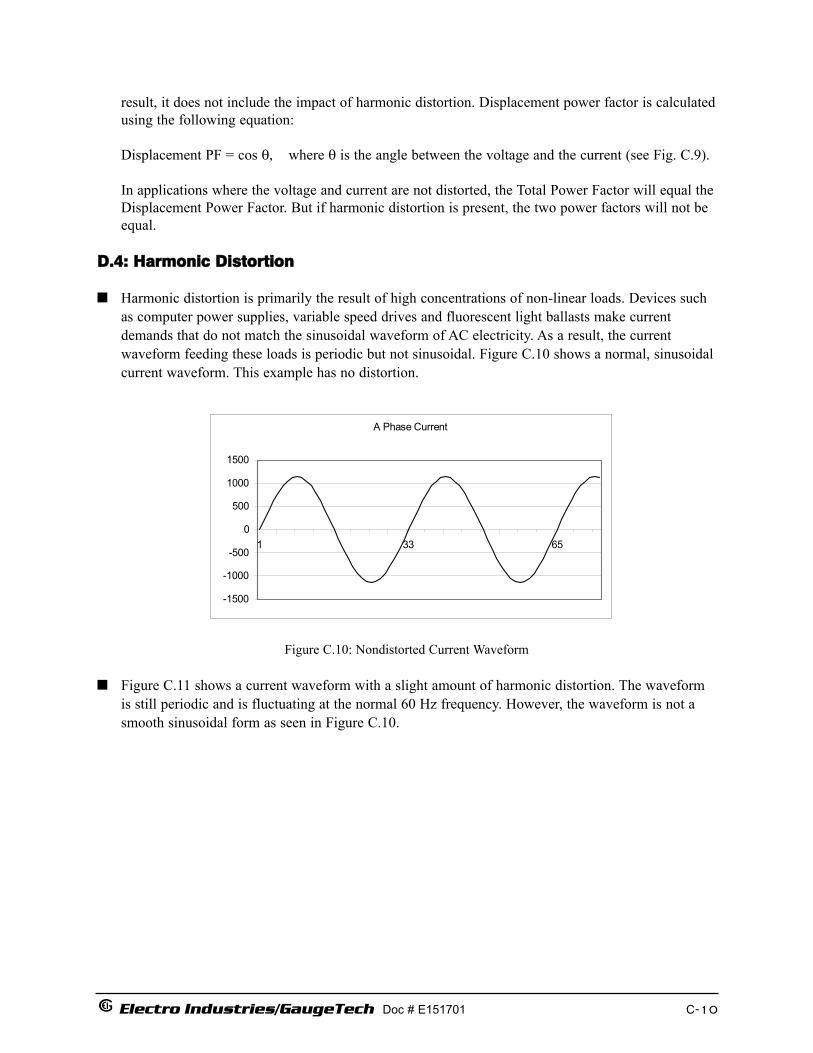
result, it does not include the impact of harmonic distortion. Displacement power factor is calculatedusing the following equation:
Displacement PF = cos θ, where θ is the angle between the voltage and the current (see Fig. C.9).
In applications where the voltage and current are not distorted, the Total Power Factor will equal theDisplacement Power Factor. But if harmonic distortion is present, the two power factors will not beequal.
D.4: Harmonic Distortion
Harmonic distortion is primarily the result of high concentrations of non-linear loads. Devices suchas computer power supplies, variable speed drives and fluorescent light ballasts make currentdemands that do not match the sinusoidal waveform of AC electricity. As a result, the current waveform feeding these loads is periodic but not sinusoidal. Figure C.10 shows a normal, sinusoidalcurrent waveform. This example has no distortion.
Figure C.10: Nondistorted Current Waveform
Figure C.11 shows a current waveform with a slight amount of harmonic distortion. The waveformis still periodic and is fluctuating at the normal 60 Hz frequency. However, the waveform is not asmooth sinusoidal form as seen in Figure C.10.
Electro Industries/GaugeTech Doc # E151701 C-10
A Phase Current
-1500
-1000
-500
0
500
1000
1500
1 33 65

Figure C.11: Distorted current wave
The distortion observed in Figure C.11 can be modeled as the sum of several sinusoidal waveformsof frequencies that are multiples of the fundamental 60 Hz frequency. This modeling is performedby mathematically disassembling the distorted waveform into a collection of higher frequency waveforms. These higher frequency waveforms are referred to as harmonics. Figure C.12 shows thecontent of the harmonic frequencies that make up the distortion portion of the waveform in FigureC.11.
Figure C.12: Waveforms of the Harmonics
The waveforms shown in Figure C.12 are not smoothed but do provide an indication of the impactof combining multiple harmonic frequencies together.
When harmonics are present it is important to remember that these quantities are operating at higherfrequencies. Therefore, they do not always respond in the same manner as 60 Hz values.
Electro Industries/GaugeTech Doc # E151701 C-11
Total A Phase Current with Harmonics
-1500
-1000
-500
0
500
1000
1500
1 33 65
Expanded Harmonic Currents
-250
-200
-150
-100
-50
0
50
100
150
200
250
1 3 5 7 9 11 13 15 17 19 21 23 25 27 29 31 33 35 37 39Am
ps
2 Harmonic Current 3 Harmonic Current 5 Harmonic Current
7 Harmonic Current A Current Total Hrm

Inductive and capacitive impedance are present in all power systems. We are accustomed to thinkingabout these impedances as they perform at 60 Hz. However, these impedances are subject to frequency variation.
XL = jωL and
XC = 1/jωC
At 60 Hz, ω = 377; but at 300 Hz (5th harmonic) ω = 1,885. As frequency changes impedancechanges and system impedance characteristics that are normal at 60 Hz may behave entirely different in presence of higher order harmonic waveforms.
Traditionally, the most common harmonics have been the low order, odd frequencies, such as the3rd, 5th, 7th, and 9th. However newer, new-linear loads are introducing significant quantities of higher order harmonics.
Since much voltage monitoring and almost all current monitoring is performed using instrumenttransformers, the higher order harmonics are often not visible. Instrument transformers are designedto pass 60 Hz quantities with high accuracy. These devices, when designed for accuracy at low frequency, do not pass high frequencies with high accuracy; at frequencies above about 1200 Hzthey pass almost no information. So when instrument transformers are used, they effectively filterout higher frequency harmonic distortion making it impossible to see.
However, when monitors can be connected directly to the measured circuit (such as direct connection to 480 volt bus) the user may often see higher order harmonic distortion. An importantrule in any harmonics study is to evaluate the type of equipment and connections before drawing aconclusion. Not being able to see harmonic distortion is not the same as not having harmonic distortion.
It is common in advanced meters to perform a function commonly referred to as waveform capture.Waveform capture is the ability of a meter to capture a present picture of the voltage or currentwaveform for viewing and harmonic analysis. Typically a waveform capture will be one or twocycles in duration and can be viewed as the actual waveform, as a spectral view of the harmoniccontent, or a tabular view showing the magnitude and phase shift of each harmonic value. Data collected with waveform capture is typically not saved to memory. Waveform capture is a real-timedata collection event.
Waveform capture should not be confused with waveform recording that is used to record multiplecycles of all voltage and current waveforms in response to a transient condition.
Electro Industries/GaugeTech Doc # E151701 C-12

C.5: Power Quality
Power quality can mean several different things. The terms ‘power quality’ and ‘power quality problem’ have been applied to all types of conditions. A simple definition of ‘power quality problem’ is any voltage, current or frequency deviation that results in mis-operation or failure ofcustomer equipment or systems. The causes of power quality problems vary widely and may originate in the customer equipment, in an adjacent customer facility or with the utility.
In his book “Power Quality Primer”, Barry Kennedy provided information on different types ofpower quality problems. Some of that information is summarized in Table C.3 below.
Table C.3: Typical power quality problems and sources
It is often assumed that power quality problems originate with the utility. While it is true that maypower quality problems can originate with the utility system, many problems originate with customer equipment. Customer-caused problems may manifest themselves inside the customer location or they may be transported by the utility system to another adjacent customer. Often, equipment that is sensitive to power quality problems may in fact also be the cause of the problem.
If a power quality problem is suspected, it is generally wise to consult a power quality professionalfor assistance in defining the cause and possible solutions to the problem.
Electro Industries/GaugeTech Doc # E151701 C-13
Cause Disturbance Type Source
Impulse Transient Transient voltage disturbance,sub-cycle duration
Oscillatory transientwith decay
LightningElectrostatic dischargeLoad switchingCapacitor switching
Sag / swell
Interruptions
Undervoltage /Overvoltage
Voltage flicker
Harmonic distortion
Transient voltage, sub-cycleduration
RMS voltage, multiple cycleduration
RMS voltage, multiple second orlonger duration
RMS voltage, steady state,multiple second or longerduration
RMS voltage, steady state,repetitive condition
Steady state current or voltage,long term duration
Line/cable switchingCapacitor switchingLoad switching
Remote system faults
System protectionCircuit breakersFusesMaintenanceMotor startingLoad variationsLoad dropping
Intermittent loadsMotor startingArc furnaces
Non-linear loadsSystem resonance

Electro Industries/GaugeTech Doc # E151701 C-14

Electro Industries/Gauge Tech Doc # E151701 Glossary-1
Glossary
0.1 Second Values: These values are the RMS values of the indicated quantity as calculated after approximately 50 milliseconds (3 cycles) of sampling.
1 Second Values: These values are the RMS values of the indicated quantity as calculated after one second (60 cycles) of sampling.
Alarm: An event or condition in a meter that can cause a trigger or call-back to occur.
Annunciator: A short label that identifies particular quantities or values displayed, for examplekWh.
Average (Current): When applied to current values (amps) the average is a calculated value that corresponds to the thermal average over a specified time interval. The interval is specified by the user in the meter profile. The interval is typically 15 minutes.So, Average Amps is the thermal average of amps over the previous 15-minute interval. The thermal average rises to 90% of the actual value in each time interval. For example, if a constant 100amp load is applied, the thermal average will indicate 90 amps after one time interval, 99 amps after two time intervals and 99.9 amps after three time intervals.
Average (Input Pulse When applied to Input Pulse Accumulations, the “Average” refers to the block Accumulations): (fixed) window average value of the input pulses.
Average (Power): When applied to power values (watts, VARs, VA), the average is a calculated value that corresponds to the thermal average over a specified time interval. Theinterval is specified by the user in the meter profile. The interval is typically 15 minutes. So, the Average Watts is the thermal average of watts over the previous 15-minute interval. The thermal average rises to 90% of the actual value in each time interval. For example, if a constant 100kW load is applied, the thermal average will indicate 90kW after one time interval, 99kW after two time intervals and 99.9kW after three time intervals.
Bit: A unit of computer information equivalent to the result of a choice between two alternatives (Yes/No, On/Off, for example).Or, the physical representation of a bit by an electrical pulse whose presence or absence indicates data.
Binary: Relating to a system of numbers having 2 as its base (digits 0 and 1).
Block Window Avg: The Block (Fixed) Window Average is the average power calculated over a (Power) user-set time interval, typically 15 minutes. This calculated average corresponds
to the demand calculations performed by most electric utilities in monitoring user power demand. (See Rolling Window Average.)

Electro Industries/Gauge Tech Doc # E151701 Glossary-2
Byte: A group of 8 binary digits processed as a unit by a computer (or device) and used especially to represent an alphanumeric character.
CBEMA Curve: A voltage quality curve established originally by the Computer Business Equipment Manufacturers Association. The CBEMA Curve defines voltage disturbances that could cause malfunction or damage in microprocessor devices.The curve is characterized by voltage magnitude and the duration which the voltage is outside of tolerance. (See ITIC Curve.)
Channel: The storage of a single value in each interval in a load profile.
Cold Load Pickup This value is the delay from the time control power is restored to the time whenthe useer wants to resume demand accumulation.
CRC Field: Cyclic Redundancy Check Field (Modbus communication) is an error checksum calculation that enables a Slave device to determine if a request packet from a Master device has been corrupted during transmission. If the calculated value does not match the value in the request packet, the Slave ignores the request.
CT (Current) Ratio: A Current Transformer Ratio is used to scale the value of the current from a secondary value up to the primary side of an instrument tranformer.
Cumulative Demand: The sum of the previous billing period maximum demand readings at the time of billing period reset. The maximum demand for the most recent billing periodis added to the previously accumulated total of the maximum demands.
Demand: The average value of power or a similar quantity over a specified period of time.
Demand Interval: A specified time over which demand is calculated.
Display: User-configurable visual indication of data in a meter.
DNP 3.0: A robust, non-proprietary protocol based on existing open standards. DNP 3.0 is used to operate between various systems in electric and other utility industries and SCADA networks.
EEPROM: Nonvolatile memory. Electrically Erasable Programmable Read Only Memory that retains its data during a power outage without need for a battery. Also refers to meter’s FLASH memory.
Energy Register: Programmable record that monitors any energy quantity. Example: Watthours, VARhours, VAhours.
Ethernet: A type of LAN network connection that connects two or more devices on a common communications backbone. An Ethernet LAN consists of at least one hub device (the network backbone) with multiple devices connected to it in a star configuration. The most common versions of Ethernet in use are 10BaseT

Electro Industries/Gauge Tech Doc # E151701 Glossary-3
or 100BaseT as defined in IEEE 802.3 standards. However, several other versions of Ethernet are also available.
Exception Response: Error Code (Modbus communication) transmitted in a packet from the Slave to the Master if the Slave has encountered an invalid command or other problem.
Flicker: The sensation experienced by the human visual system when it is subjected to changes occurring in the illumination intensity of light sources. IEC 61000-4-15 and former IEC 868 describe the methods used to determine Flicker severity.
Form: Wiring and Hookup configuration for the Nexus® 1260/1262 & 1270/1272 meter.
Harmonics: Measuring values of the fundamental current and voltage and percent of the fundamental.
Heartbeat Pulse: Energy indicator on the face of the Nexus® 1250/1252 meter; pulses are generated per the programmed Ke value.
I2T Threshold: Data will not accumulate until current reaches programmed level.
Infrared Test Pulse: Energy indicator located on the upper left side of the face of the Nexus® 1260/ 1262 & 1270/1272 meters; pulses are generated per the programmed Ke value.
Integer: Any of the natural numbers, the negatives of those numbers or zero.
Internal Modem: An optional modem within the meter’s enclosure that connects to the RJ-11 telephone connector.
Invalid Register: In the Nexus® meter Modbus Map there are gaps between Registers. For example, the next Register after 08320 is 34817. Any unmapped Register stores no information and is said to be invalid.
ITIC Curve: An updated version of the CBEMA Curve that reflects further study into the performance of microprocessor devices. The curve consists of a series of steps but still defines combinations of voltage magnitude and duration that will cause malfunction or damage.
Ke: kWh per pulse; i.e. the energy.
kWh: kilowatt hours; kW x demand interval in hours.
KYZ Output: Output where the rate of changes between 1 and 0 reflects the magnitude of a metered quantity.
LCD: Liquid Crystal Display.
LED: Light Emitting Diode.

Electro Industries/Gauge Tech Doc # E151701 Glossary-4
Master Device: In Modbus communication, a Master Device initiates and controls all information transfer in the form of a Request Packet to a Slave Device. The Slave reponds to each request.
Maximum Demand: The largest demand calculated during any interval over a billing period.
Modbus ASCII: Alternate version of the Modbus protocol that utilizes a different data transfer format. This version is not dependent upon strict timing, as is the RTU version. This is the best choice for telecommunications applications (via modems).
Modbus RTU: The most common form of Modbus protocol. Modbus RTU is an open protocolspoken by many field devices to enable devices from multiple vendors to communicate in a common language. Data is transmitted in a timed binary format, providing increased throughput and therefore, increased performance.
Network: A communications connection between two or more devices to enable those devices to send and receive data to one another. In most applications, the network will be either a serial type or a LAN type.
NVRAM: Nonvolatile Random Access Memory is able to keep the stored values in memory even during the loss of circuit or control power. High speed NVRAM is used in the Nexus® meter to gather measured information and to insure that no information is lost.
Optical Port: A port that facilitates infrared communication with a (1260/1262 or 1270/1272) meter. Using an ANSI C12.13 Type II magnetic optical communications coupler and an RS232 cable from the coupler to a PC, the meter can be programmed with Communicator EXT software.
Packet: A short fixed-length section of data that is transmitted as a unit. Example: a serial string of 8-bit bytes.
Percent (%) THD: Percent Total Harmonic Distortion.
Protocol: A language that will be spoken between two or more devices connected on a network.
PT Ratio: Potential Transformer Ratio used to scale the value of the voltage to the primary side of an instrument transformer. Also referred to as VT Ratio.
Pulse: The closing and opening of the circuit of a two-wire pulse system or the alternate closing and opening of one side and then the other of a three-wire system (which is equal to two pulses).
Q Readings: Q is the quantity obtained by lagging the applied voltage to a wattmeter by 60 degrees. Values are displayed on the Uncompensated Power & Q Readings screen.
Electro Industries/Gauge Tech Doc # E151701 Glossary-5
Quadrant: Watt and VAR flow is typically represented usng an X-Y coordinate system. (Programmable The four corners of the X-Y plane are referred to as quadrants. Most power Values and Factors applications label the right hand corner as the first quadrant and number the on the Nexus® Meter) remaining quadrants in a counter-clockwise rotation. Following are the
positions of the quadrants: 1st - upper right, 2nd - upper left, 3rd - lower left and 4th - lower right. Power flow is generally positive in quadrants 1 and 4. VAR flow is positive in quadrants 1 and 2. The most common load conditions are: Quadrant 1 - power flow positive, VAR flow positive, inductive load, lagging or positive power factor; Quadrant 2 - power flow negative, VAR flow positive, capacitive load, leading or negative power factor.
RAM: Random Access Memory
Register: An entry or record that stores a small amount of data.
Register Rollover: A point at which a Register reaches its maximum value and rolls over to zero.
Reset: Logs are cleared or new (or default) values are sent to counters or timers.
Rolling Window The Rolling (Sliding) Window Average is the average power calculated over a Average (Power): user-set time interval that is derived from a specified number of sub-intervals,
each of a specified time. For example, the average is calculated over a 15-minute interval by calculating the sum of the average of three consecutive 5-minute intervals. This demand calculation methodology has been adopted by several utilities to prevent customer manipulation of kW demand by simply spreading peak demand across two intervals.
RS232: A type of serial network connection that connects two devices to enable communication between devices. An RS232 connection connects only two points. Distance between devices is typically limited to fairly short runs. Current standards recommend a maximum of 50 feet but some users have had success with runs up to 100 feet. Communications speed is typically in the range of 1200 bits per second to 57,600 bits per second. RS232 communication can be accomplished using the Optical port on the face of the Nexus® 1260/1262 or 1270/1272 meter.
RS485: A type of serial network connection that connects two or more devices to enable communication between the devices. An RS485 connection will allow multi-drop communication from one to many points. Distance between devices is typically limited to around 2,000 to 3,000 wire feet. Communications speed is typically in the range of 120 bits per second to 115,000 bits per second.
RTC: Real Time Clock
Sag: A voltage quality event during which the RMS voltage is lower than normal for a period of time, typically from 1/2 cycle to 1 minute.
Secondary Rated: Any Register or pulse output that does not use any CT or VT Ratio.

Electro Industries/Gauge Tech Doc # E151701 Glossary-6
Serial Port: The type of port used to directly interface with a PC.
Slave Device: In Modbus communication, a Slave Device only receives a Request Packet from a Master Device and responds to the request. A Slave Device cannot initiate communication.
Swell: A voltage quality event during which the RMS voltage is higher than normal for a period of time, typically from 1/2 cycle to 1 minute.
THD: Total Harmonic Distortion is the combined effect of all harmonics measured in avoltage or current. The THD number is expressed as a percent of the fundamental. For example, a 3% THD indicates that the magnitude of all harmonic distortion measured equals 3% of the magnitude of the fundamental 60Hz quantity.
Time Stamp: A stored representation of the time of an event. Time Stamp can include year, month, day, hour, minute and second and Daylight Savings Time indication.
TOU: Time of Use.
Uncompensated Power: VA, Watt and VAR readings not adjusted by Transformer Loss Compensation.
V2T Threshold: Data will stop accumulating when voltage falls below programmed level.
Voltage Imbalance: The ratio of the voltage on a phase to the average voltage on all phases.
Voltage Quality Event: An instance of abnormal voltage on a phase. The events the meter will track include sags, swells, interruptions and imbalances.
VT Ratio: The Voltage Transformer Ratio is used to scale the value of the voltage to the primary side of an instrument transformer. Also referred to as PT Ratio.
Voltage, Vab: Vab, Vbc, Vca are all Phase-to-Phase voltage measurements. These voltages aremeasured between the three phase voltage inputs to the meter.
Voltage, Van: Van, Vbn, Vcn are all Phase-to-Neutral voltages applied to the monitor. These voltages are measured between the phase voltage inputs and Vn input to the meter. Technologically, these voltages can be “measured” even when the meter is in a Delta configuration and there is no connection to the Vn input. However,in this configuration, these voltages have limited meaning and are typically not reported.
Voltage, Vaux This is the fourth voltage input measured from between the Vaux and Vref inputs. This input can be scaled to any value. However, the actual input voltage to the meter should be of the same magnitude as the voltages applied to the Va, Vb and Vc terminals.