The Latest M&A Outlook & Business Value Drivers · Type of Business Industry Segment Service...
72
The Latest M&A Outlook & Business Value Drivers Anthony M. Giordano BKD Corporate Finance [email protected] Daniel A. Boarder BKD, LLP [email protected]
Transcript of The Latest M&A Outlook & Business Value Drivers · Type of Business Industry Segment Service...

The Latest M&A Outlook & Business Value Drivers
Anthony M. Giordano
BKD Corporate Finance
Daniel A. Boarder
BKD, LLP

• Participate in entire webinar • Answer polls when they are provided
• If you are viewing this webinar in a group o Complete group attendance form with
Title & date of live webinar Your company name Your printed name, signature & email address
o All group attendance sheets must be submitted to [email protected] within 24 hours of live webinar
o Answer polls when they are provided
• If all eligibility requirements are met, each participant will be emailed their CPE certificates within 15 business days of live webinar
To Receive CPE Credit

The Latest M&A Outlook & Business Value Drivers
Anthony M. Giordano
BKD Corporate Finance
Daniel A. Boarder
BKD, LLP

• Subsidiary of BKD, LLP
• 17-year history
• Member of FINRA & SIPC
• Professional team includes
o Investment bankers
o Financial analysts
o Market analysts
BKD Corporate Finance Profile

BKD, LLP–Breadth & Depth of Resources
• 30 offices in 12 states
• Approximately 250 partners
• More than 2,000 employees
• Six industry niche groups
o Health Care, Financial Services, Construction & Real Estate, Manufacturing & Distribution, Not-for-Profit, and Energy
• Clients in all 50 states & internationally
• End-to-end client service proposition

Services

• Joined BKDCF in 2007
• More than 25 years of financial advisory services experience
• Managed investment & commercial banking transactions totaling over $1 billion
• Experience in many industries, including M&D, food & beverage, technology, telecom, media, retail, hospitality, construction, real estate, health care & insurance
Tony Giordano Biography

• More than 15 years of professional experience in variety of industries & roles
• Member of BKD’s transaction services team
• Provides essential consulting service by assisting private equity firms & corporate buyers in evaluating potential acquisition targets
• Provides consulting services to sellers looking to improve value through the due diligence process
• In charge of over 100 engagements with transaction values ranging from $7 million to over $750 million
• Consulting experience includes providing evaluations of post-transaction matters such as purchase accounting, working capital analysis & related negotiations to variety of industries
Daniel Boarder Biography

Completed Engagements Since May 2009
• 33 client engagements closed since May ’09
Type of Business Industry Segment Service ProvidedEnviromental Consulting Firm Con/Eng Sell-sideQuarry & Landfill Con/Eng Sell-side
Commerical Bank FS Sell-sideTrust Company FS Sell-sideCommunity Bank FS Sell-side
Skilled Nursing & Assisted Living HC Sell-sideSkilled Nursing Facility HC Sell-sideOpen MRI Facility HC Sell-sideSkilled Nursing & Assisted Living HC Sell-sideMedical Laboratory HC Sell-sideDME Store HC Buy-sideHospital / DME Store HC ConsultingLong Term Acute Care Hospital HC ConsultingCritical Access Hospital HC ConsultingLong Term Acute Care Hospital HC FinancingMedical Supplies Distributor HC Financing/Consulting
Explosives Components M&D Sell-sideChemical Distribution M&D Sell-sideBankruptcy Software Developer M&D Sell-sideIndustrial Equipment & Supplies M&D Sell-sideMachine Tool Manufacturer M&D Sell-sideMfg. of School Supplies M&D Buy-sideWireless Electronics Company M&D ConsultingHealthcare Supply Chain Management M&D ConsultingMfg. of Pressure Vessels M&D ConsultingMfg of Welded Stainless Steel Tubing M&D ConsultingMfg of Water Control Values M&D ConsultingMfg. of Light Metal Products M&D ConsultingProduct Marking Company M&D FinancingSteel Service Center M&D FinancingFull Service Steel Products Manufacturer M&D Financing
Presort Mail Service Other Sell-sideSEO / Internet Marketing Other Consulting

CURRENT M&A & CAPITAL MARKET CONDITIONS
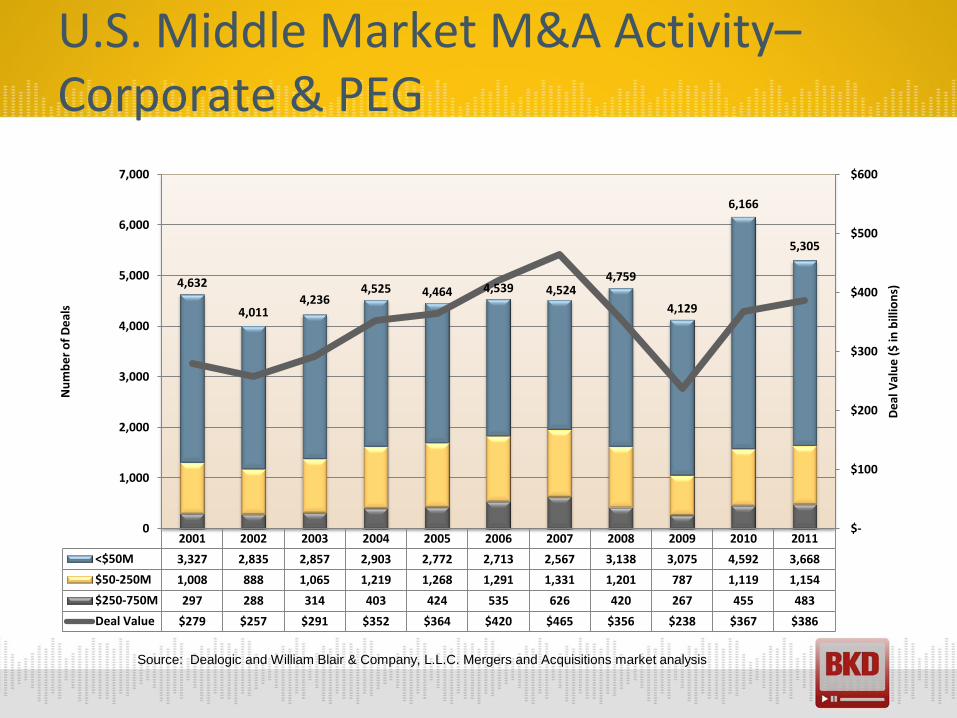
U.S. Middle Market M&A Activity– Corporate & PEG
2001 2002 2003 2004 2005 2006 2007 2008 2009 2010 2011
<$50M 3,327 2,835 2,857 2,903 2,772 2,713 2,567 3,138 3,075 4,592 3,668
$50-250M 1,008 888 1,065 1,219 1,268 1,291 1,331 1,201 787 1,119 1,154
$250-750M 297 288 314 403 424 535 626 420 267 455 483
Deal Value $279 $257 $291 $352 $364 $420 $465 $356 $238 $367 $386
4,632
4,011 4,236
4,525 4,464 4,539 4,524 4,759
4,129
6,166
5,305
$-
$100
$200
$300
$400
$500
$600
0
1,000
2,000
3,000
4,000
5,000
6,000
7,000
De
al V
alu
e (
$ in
bill
ion
s)
Nu
mb
er
of
De
als
Source: Dealogic and William Blair & Company, L.L.C. Mergers and Acquisitions market analysis

M&A Deal Volume
Total middle market deal value for 2011 was approximately $386B
Number of Deals Deal Value
2009 2010 2011 % Chg. '11
vs. '10 2009 2010 2011 % Chg. '11
vs. '10
< $50M 3,075 4,592 3,668 -20% $ 38,357 $ 45,922 $ 44,830 -2.4%
$50M-$250M
787 1,119 1,154 3% $ 89,582 $ 128,704 $ 135,499 5.3%
$250M-$750M
267
455
483 6% $ 109,644 $ 192,284 $ 205,436 6.8%
Total Middle Market 4,129 6,166 5,305 -14% $ 237,583 $ 366,910 $ 385,765 5.1%
> $750M
156
285
269 -6% $ 647,486 $ 674,147 $ 818,823 21.5%
Undisclosed 5,024 6,108 7,561 24% - - - -
Total Deals 9,309 12,559 13,135 5% $ 885,069 $ 1,041,056 $ 1,204,588 15.7%
Source: Dealogic and William Blair & Company, L.L.C. Mergers and Acquisitions market analysis
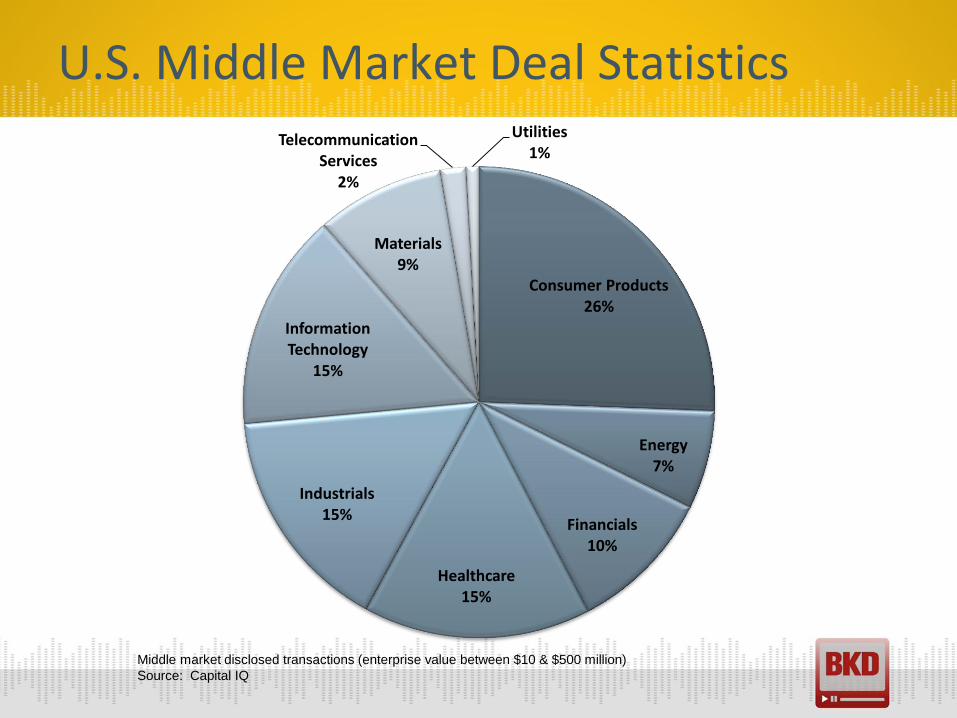
Consumer Products 26%
Energy 7%
Financials 10%
Healthcare 15%
Industrials 15%
Information Technology
15%
Materials 9%
Telecommunication Services
2%
Utilities 1%
U.S. Middle Market Deal Statistics
Middle market disclosed transactions (enterprise value between $10 & $500 million)
Source: Capital IQ
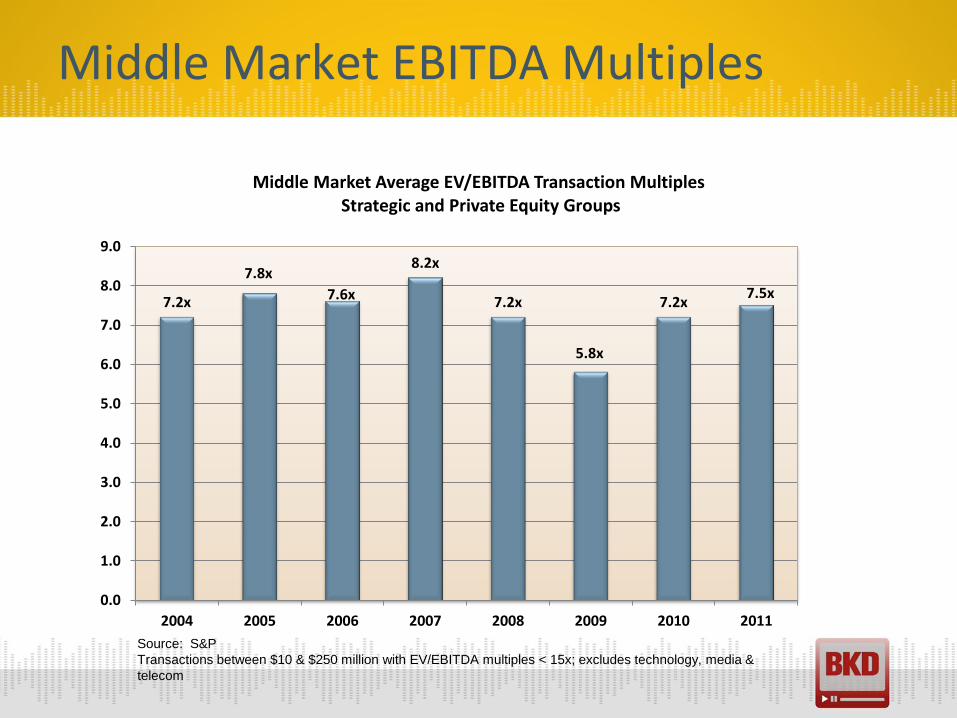
Middle Market EBITDA Multiples
7.2x
7.8x
7.6x
8.2x
7.2x
5.8x
7.2x 7.5x
0.0
1.0
2.0
3.0
4.0
5.0
6.0
7.0
8.0
9.0
2004 2005 2006 2007 2008 2009 2010 2011
Middle Market Average EV/EBITDA Transaction Multiples Strategic and Private Equity Groups
Source: S&P
Transactions between $10 & $250 million with EV/EBITDA multiples < 15x; excludes technology, media &
telecom

Private Equity EBITDA Multiples
Source: GF Data Resources
5.9x
6.0x 6.0x
6.2x 6.2x
6.0x
5.9x 5.9x
6.1x
5.0
5.5
6.0
6.5
2003 2004 2005 2006 2007 2008 2009 2010 2011
U.S. PEG Middle Market Deal Statistics
GF Data Resources is subscription database that tracks deal activity for
approximately 185 middle market private equity firms

U.S. PEG Middle Market Deal Statistics
Source: GF Data Resources
5.4x 5.5x 4.7x
5.5x 5.5x
6.3x 6.0x 6.3x 6.4x 6.1x
6.8x
6.5x 6.5x 6.7x
7.4x 7.4x
5.6x
8.8x
5.2x
8.2x
0
1
2
3
4
5
6
7
8
9
10
2007 2008 2009 2010 2011
U.S. PEG Middle Market Deal Statistics
$10 - $25 MM $25 - $50 MM $50 - $100 MM $100 - $250 MM

GF Data Market Update–TEV/EBITDA
INDUSTRY 2003-06 2007 2008 2009 2010 2011 Total N =
Manufacturing 5.8 6.2 5.9 5.8 5.9 6.0 5.9 575
Business Services 6.1 6.3 6.2 5.9 5.9 6.6 6.1 234
Health Care Services 6.7 6.6 6.8 6.3 6.6 7.3 6.7 125
Retail 6.5 6.6 6.4 5.2 6.1 6.7 6.5 44
Distribution 5.8 6.0 6.3 5.5 5.3 6.0 5.9 135
Publishing/Media 7.4 7.7 6.1 7.4 4.2 6.1 7.2 31
Technology 5.6 5.2 6.5 6.6 5.7 4.6 5.9 25
Other 5.9 5.7 5.4 6.4 5.6 5.0 5.7 163
N = 553 218 160 87 169 145 1332
Source: GF Data Resources

M&D Market Update
• GDP grew at 3% annual rate in Q4 of 2011, fastest growth since Q2 of 2010
• According to Manufacturing ISM Report On Business:
o Economic activity in manufacturing sector expanded in January for 30th consecutive month
o Overall economy grew for 32nd consecutive month
o New Orders Index increased in January, reflecting 33rd consecutive month of growth in new orders

Historical Manufacturing Valuations
TOTAL ENTERPRISE VALUE (TEV)/EBITDA—Manufacturing
TEV 2003-06 2007 2008 2009 2010 2011 Total N =
10-25 5.3 5.7 5.4 5.7 5.4 5.5 5.5 231
25-50 6.1 6.1 5.6 5.8 5.9 5.1 5.9 182
50-100 6.3 6.5 6.6 5.2 6.5 6.8 6.4 122
100-250 N/A N/A 6.6 7.4 6.0 8.7 7.2 40
Total 5.8 6.2 5.9 5.8 5.9 6 5.9
N = 263 89 73 30 61 59 575
Source: GF Data Resources
* Based on Private Equity transactions

TOTAL ENTERPRISE VALUE (TEV)/EBITDA—DISTRIBUTION
TEV 2003-06 2007 2008 2009 2010 2011 Total N =
10-25 5.5 5.6 5.4 5.3 4.9 5.0 5.3 49
25-50 5.9 6.2 6.9 5.8 5.1 6.1 6.1 51
50-100 5.8 6.5 5.9 N/A 6.4 6.2 6.0 26
100-250 7.1 6.3 N/A N/A 6.8 8.7 7.3 9
Total 5.8 6 6.3 5.5 5.3 6 5.9
N = 58 21 13 4 19 19 135
Historical Distribution Valuations
Source: GF Data Resources
* Based on Private Equity transactions

CAPITAL MARKETS

Financing Sources & Transaction Structures
• Cash on balance sheets of nonfinancial S&P 500 companies ($1.1 trillion)
• Private equity capital
• Debt financing (senior & subordinated)
• Alternative funding sources
o BDCs, SBICs, hedge funds, etc.
• Other financing structures
o Earn-outs
o Seller notes
o Royalties

Private Equity Group Fundraising
$137,973
$215,854
$307,188 $311,122
$142,401
$88,763 $102,928
$0
$50,000
$100,000
$150,000
$200,000
$250,000
$300,000
$350,000
2005 2006 2007 2008 2009 2010 2011
$ in
mill
ion
s
Source: Pitchbook, 2012 Report

PE Investors Sitting on $425B of Dry Powder
$24.22
$77.64
$114.98
$67.80 $63.46
$76.11
$0
$100
$200
$300
$400
$500
$600
$0
$20
$40
$60
$80
$100
$120
$140
2006 2007 2008 2009 2010 2011
$ in
bill
ion
s
Cumulative Overhang Under $100M $100M-$250M $250M-$500M $500M-$1B $1B-$5B $5B+
$425 Billion
Source: Pitchbook, 2012 Report
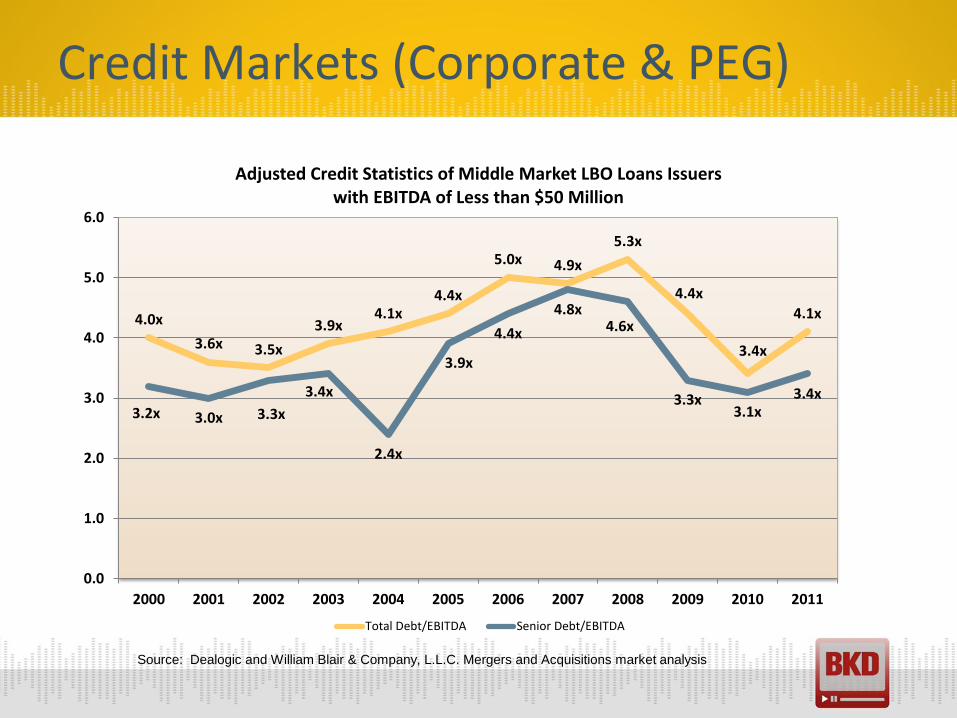
Credit Markets (Corporate & PEG)
4.0x
3.6x 3.5x
3.9x 4.1x
4.4x
5.0x 4.9x
5.3x
4.4x
3.4x
4.1x
3.2x 3.0x 3.3x
3.4x
2.4x
3.9x
4.4x
4.8x 4.6x
3.3x 3.1x
3.4x
0.0
1.0
2.0
3.0
4.0
5.0
6.0
2000 2001 2002 2003 2004 2005 2006 2007 2008 2009 2010 2011
Adjusted Credit Statistics of Middle Market LBO Loans Issuers with EBITDA of Less than $50 Million
Total Debt/EBITDA Senior Debt/EBITDA
Source: Dealogic and William Blair & Company, L.L.C. Mergers and Acquisitions market analysis

Source: GF Data Resources
0.9x 1.0x 1.0x 0.7x
0.9x
2.8x 2.3x
1.8x 2.2x
2.4x
3.7x
3.3x
2.8x 2.9x
3.3x
0.0
0.5
1.0
1.5
2.0
2.5
3.0
3.5
4.0
0.0
0.5
1.0
1.5
2.0
2.5
3.0
3.5
4.0
2007 2008 2009 2010 2011
Historical Leverage Multiples
Sub Debt/EBITDA Sr Debt/EBITDA
Credit Markets (PEG only)

Credit Markets (PEG only)
13.6% 16.6% 17.4% 12.1% 14.5%
43.9% 37.5% 29.4% 36.8% 37.4%
42.1% 46.0% 53.1% 51.1% 48.2%
0.0%
20.0%
40.0%
60.0%
80.0%
100.0%
120.0%
2007 2008 2009 2010 2011
Equity & Debt Contributions
Sub Debt Senior Debt Equity
Source: GF Data Resources

Bank Term Sheet Comparison (Oct. ‘11)
Bank 1 Bank 2 Bank 3 Bank 4
CREDIT FACILITY
REVOLVER 25,000,000$ 25,000,000$ 30,000,000$ 1,500,000$
TERM -$ -$ -$ 12,000,000$
TOTAL 25,000,000$ 25,000,000$ 30,000,000$ 13,500,000$
Estimated Borrowing Base at Close 15,900,000$ 16,500,000$ 17,000,000$ 13,500,000$
INTEREST RATES Various
LIBOR LIBOR LIBOR LIBOR No
RATE PLUS (LIBOR) 2.75% 4.00% 2.75% 0.00%
Base Rate Prime Prime NA PRIME
RATE PLUS 1.50% 3.00% NA 0.00%
TERM/AMORT. (IN MONTHS)
REVOLVER 36 36 48 Annual
BORROWING BASE %
A/R 85.00% 85.00% 85.00% 80.00%
INVENTORY 65.00% Various 65.00% NA
OTHER
PREPAYMENT PENALTY (%) 3%-2%-1% 1% None 3%-2%-1%-0.5%-
CLOSING FEES -
CLOSING FEE % of Revolver Commitment 1.00% 1.50% 0.75% 1.00%
COVENANTS
MINIMUN NET WORTH UNKNOWN NO NO YES
MINIMUN DEBT SERVICE COVERAGE UNKNOWN YES YES YES
SENIOR FUNDED DEBT TO EBITDA No 3.00 No 2.75
Total FUNDED DEBT TO EBITDA No 0.00 No 3.50
DEBT SERVICE (INT & PRINC) 1.1-1.00 1.1-1.00 1.125-1.0 1.25-1.00
Manufacturing Company Term Sheet

Bank Term Sheet Comparison (July ’11)
Bank 1 Bank 2
CREDIT FACILITY
REVOLVER 3,000,000$ 3,000,000$
LETTER OF CREDIT -$ -$
ENTERPRISE VALUE TERM LOAN 1,500,000$ 1,500,000$
REAL ESTATE 200,000$ -$
EQUIP & REAL ESTATE 1,500,000$ 1,500,000$
CAP EXP - EQUIP -$ -$
TOTAL 6,200,000$ 6,000,000$
INTEREST RATES
REVOLVER - LIBOR LIBOR LIBOR
RATE PLUS (LIBOR) 0.00% 0.00%
REVOLVER - BEGIN. RATE (LIBOR) 0.00% 0.00%
Base Rate Prime Prime
RATE PLUS 0.50% 1.25%
RATE PLUS (Floor) Prime 4.50% NA
EV - Term Loan
Term-Loan - LIBOR LIBOR Prime
RATE PLUS (LIBOR) 5.50% 3.00%
FLOOR 6.50% No
FIXED RATE OPTION-TERM Yes No
Fixed Rate 7.00% 0.00%
Metal & Plastics Fabrication - Term Sheet Summary

Bank Term Sheet Comparison
Bank 1 Bank 2
TERM/AMORT. (IN MONTHS)
REVOLVER 36 36
TERM (ENTERPRISE VALUE LOAN) 48 36
BORROWING BASE %
A/R 85.00% 85.00%
INVENTORY 60.00% 60.00%
OTHER
PREPAYMENT PENALTY (%) 2%-1%-0.5% 3%-2%-1.0%
CLOSING FEES
CLOSING FEE 15,000$ 45,000
COVENANTS
MINIMUN NET WORTH TBD TBD
MINIMUM TANGIBLE CAPITAL FUNDS UNKNOWN TBD
MINIMUN DEBT SERVICE COVERAGE UNKNOWN YES
SENIOR FUNDED DEBT TO EBITDA 4.00 TBD
DEBT SERVICE (INT & PRINC) 1.25-1.00 TBD
CAPITAL EXPENDITURES LIMIT Yes Yes
Excess Cash Flow recapture No Yes
Metal & Plastics Fabrication - Term Sheet Summary

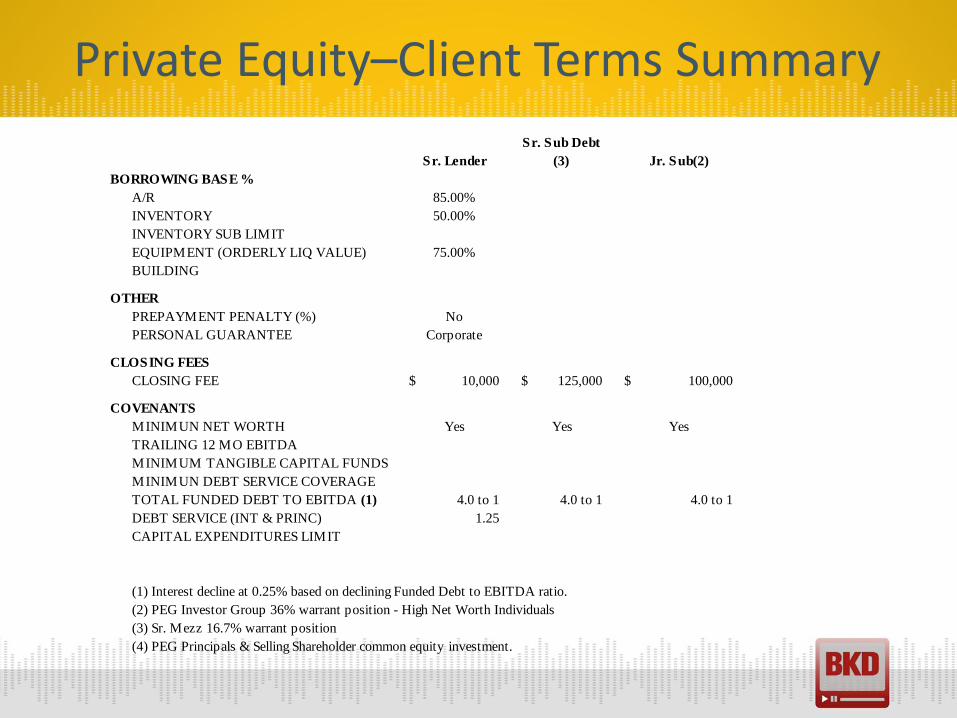
Private Equity–Client Terms Summary (Sept ‘11)
Sr. Lender
Sr. Sub Debt
(3) Jr. Sub(2) Equity (4)
CREDIT FACILITY
REVOLVER 2,000,000$
Term Loan 5,000,000$ 2,373,000$
CAP EXP - EQUIP
Common Equity 51,665$
Security Senior 2nd Lien Unsecured
TOTAL
INTEREST RATES
LIBOR OR PRIME Prime
RATE PLUS (LIBOR-PRIME)* 0.50%
REVOLVER - BEGIN. RATE 4.00%
Mezz Lenders 13.00% 10.00%
UNUSED LINE FEE (%) 0.25%
DEFAULT RATE 2.00% 5.00%
TERM/AMORT. (IN MONTHS)
MATURITY DATE
REVOLVER/Mezz 3 Year
Term Mezz 5 Year 7 Year
Sr. Lender
Sr. Sub Debt
(3) Jr. Sub(2)
BORROWING BASE %
A/R 85.00%
INVENTORY 50.00%
INVENTORY SUB LIMIT
EQUIPMENT (ORDERLY LIQ VALUE) 75.00%
BUILDING
OTHER
PREPAYMENT PENALTY (%) No
PERSONAL GUARANTEE Corporate
CLOSING FEES
CLOSING FEE 10,000$ 125,000$ 100,000$
COVENANTS
MINIMUN NET WORTH Yes Yes Yes
TRAILING 12 MO EBITDA
MINIMUM TANGIBLE CAPITAL FUNDS
MINIMUN DEBT SERVICE COVERAGE
TOTAL FUNDED DEBT TO EBITDA (1) 4.0 to 1 4.0 to 1 4.0 to 1
DEBT SERVICE (INT & PRINC) 1.25
CAPITAL EXPENDITURES LIMIT
(1) Interest decline at 0.25% based on declining Funded Debt to EBITDA ratio.
(2) PEG Investor Group 36% warrant position - High Net Worth Individuals
(3) Sr. Mezz 16.7% warrant position
(4) PEG Principals & Selling Shareholder common equity investment.
Private Equity–Client Terms Summary
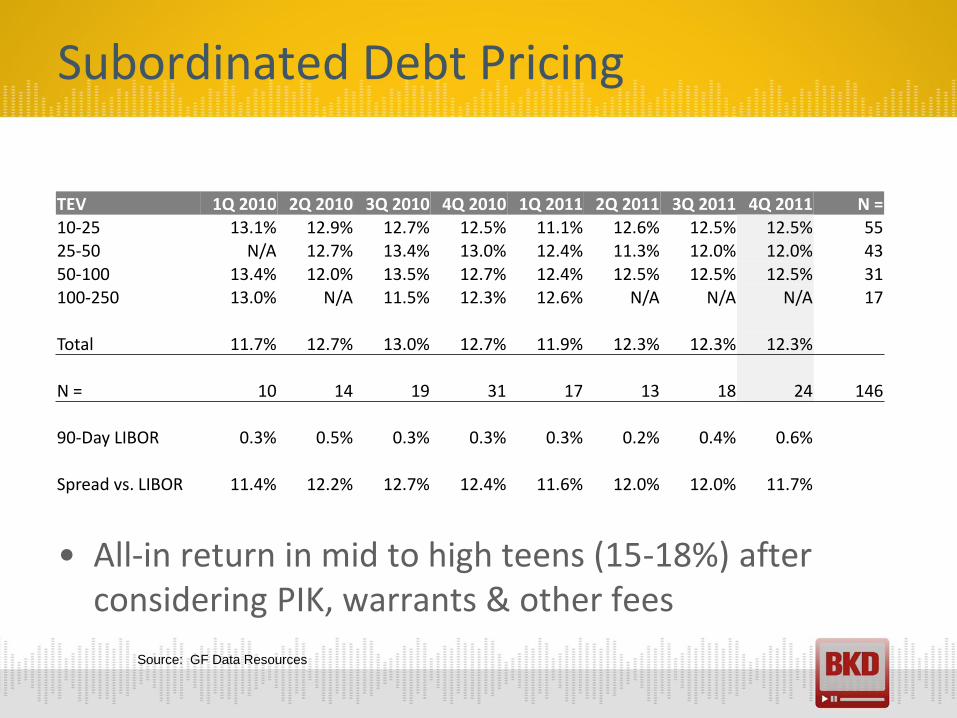
Subordinated Debt Pricing
• All-in return in mid to high teens (15-18%) after considering PIK, warrants & other fees
TEV 1Q 2010 2Q 2010 3Q 2010 4Q 2010 1Q 2011 2Q 2011 3Q 2011 4Q 2011 N = 10-25 13.1% 12.9% 12.7% 12.5% 11.1% 12.6% 12.5% 12.5% 55 25-50 N/A 12.7% 13.4% 13.0% 12.4% 11.3% 12.0% 12.0% 43
50-100 13.4% 12.0% 13.5% 12.7% 12.4% 12.5% 12.5% 12.5% 31 100-250 13.0% N/A 11.5% 12.3% 12.6% N/A N/A N/A 17
Total 11.7% 12.7% 13.0% 12.7% 11.9% 12.3% 12.3% 12.3%
N = 10 14 19 31 17 13 18 24 146
90-Day LIBOR 0.3% 0.5% 0.3% 0.3% 0.3% 0.2% 0.4% 0.6%
Spread vs. LIBOR 11.4% 12.2% 12.7% 12.4% 11.6% 12.0% 12.0% 11.7%
Source: GF Data Resources
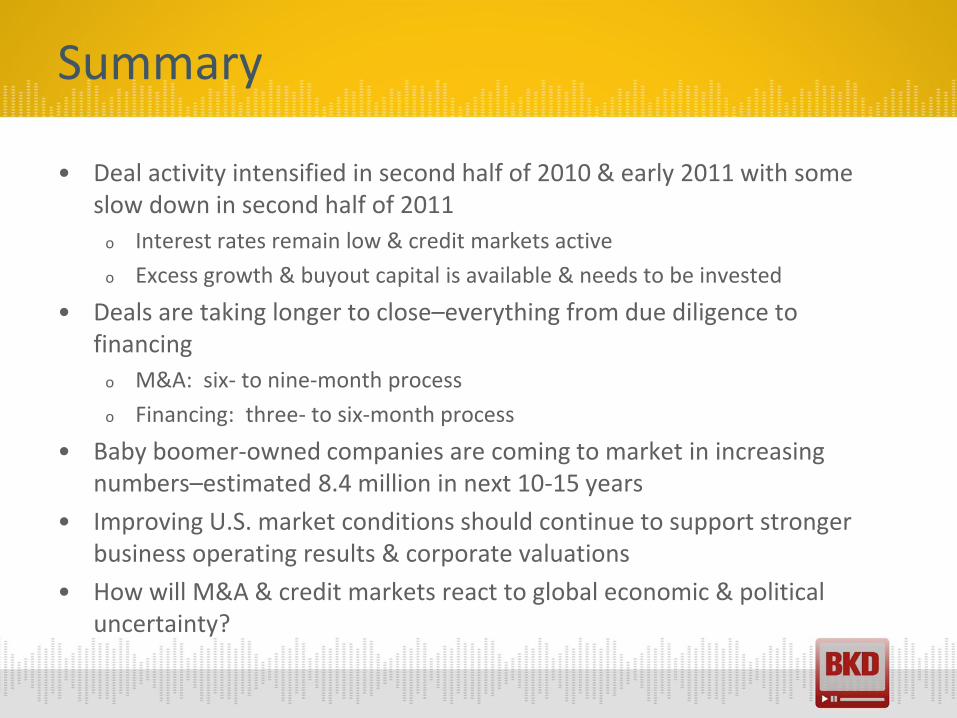
Summary
• Deal activity intensified in second half of 2010 & early 2011 with some slow down in second half of 2011
o Interest rates remain low & credit markets active
o Excess growth & buyout capital is available & needs to be invested
• Deals are taking longer to close–everything from due diligence to financing
o M&A: six- to nine-month process
o Financing: three- to six-month process
• Baby boomer-owned companies are coming to market in increasing numbers–estimated 8.4 million in next 10-15 years
• Improving U.S. market conditions should continue to support stronger business operating results & corporate valuations
• How will M&A & credit markets react to global economic & political uncertainty?

• Extension of Bush tax laws gave owners two year window to plan & complete sale or recap (sell minority or majority stake, dividend recap)
o Still nine months to complete transaction
• Excess investment capital will support active M&A market & attractive valuations for remainder of 2012 & into 2013
• Downside risk in forefront of buyers’ minds—attempting to alleviate downside risk through
o More meticulous due diligence
o Structuring of deals—more recaps, earn-outs, seller notes & other deferred comp.
• Credit markets could potentially tighten due to global uncertainly, impacting number of transactions & their valuations
What to Expect
TOOLS FOR BUILDING VALUE

• Identify goals of ownership, management &/or corporate board
o Retain some ownership while having continued involvement in business operations–majority sale/recap
o Sell 100% & help assist with ownership transition
o No involvement after sale
o Transition company to family members or employees
Identify Stakeholder Goals
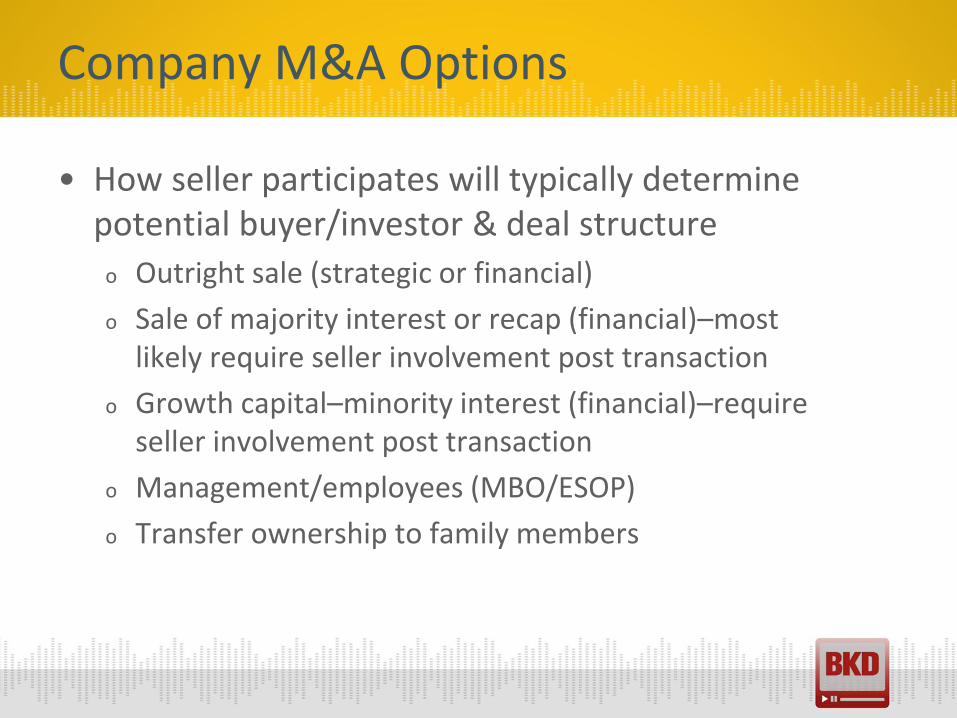
• How seller participates will typically determine potential buyer/investor & deal structure
o Outright sale (strategic or financial)
o Sale of majority interest or recap (financial)–most likely require seller involvement post transaction
o Growth capital–minority interest (financial)–require seller involvement post transaction
o Management/employees (MBO/ESOP)
o Transfer ownership to family members
Company M&A Options

• CPA, financial planner, M&A experienced attorney, investment banker, business consultant
• Help minimize taxes, ensure coverage of legal & transaction issues
• A competitive process can lead to higher valuation, favorable deal structure & terms
• Sell on your terms, not buyer’s terms
• Net proceeds from transaction that meets your objectives
• Early planning with your advisors can cover all your bases
Team of Advisors

• Mold strong management team
• Business plan
• Financial statements
• Invest in the future
• Improve margins & profitability
• Customer concentration
• Balance sheet
• Controlled ownership
• Pre-due diligence/ sell-side diligence
• Timing
Tools for Building Value–Plans to Accelerate Value
* See appendix for additional information on the above

IMPROVING COMPANY VALUE
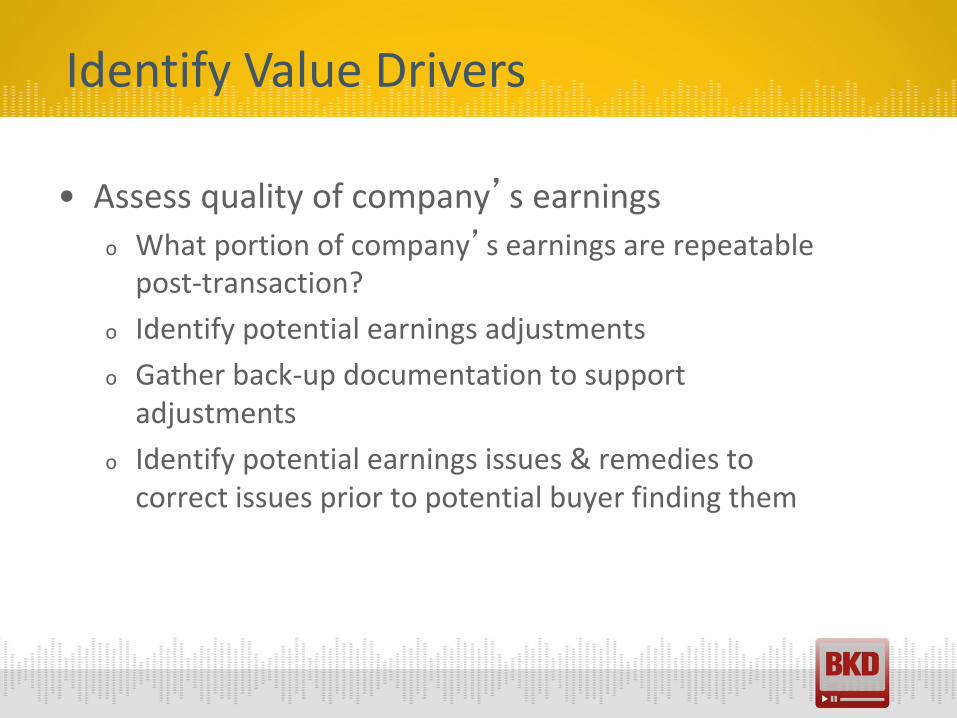
• Assess quality of company’s earnings
o What portion of company’s earnings are repeatable post-transaction?
o Identify potential earnings adjustments
o Gather back-up documentation to support adjustments
o Identify potential earnings issues & remedies to correct issues prior to potential buyer finding them
Identify Value Drivers
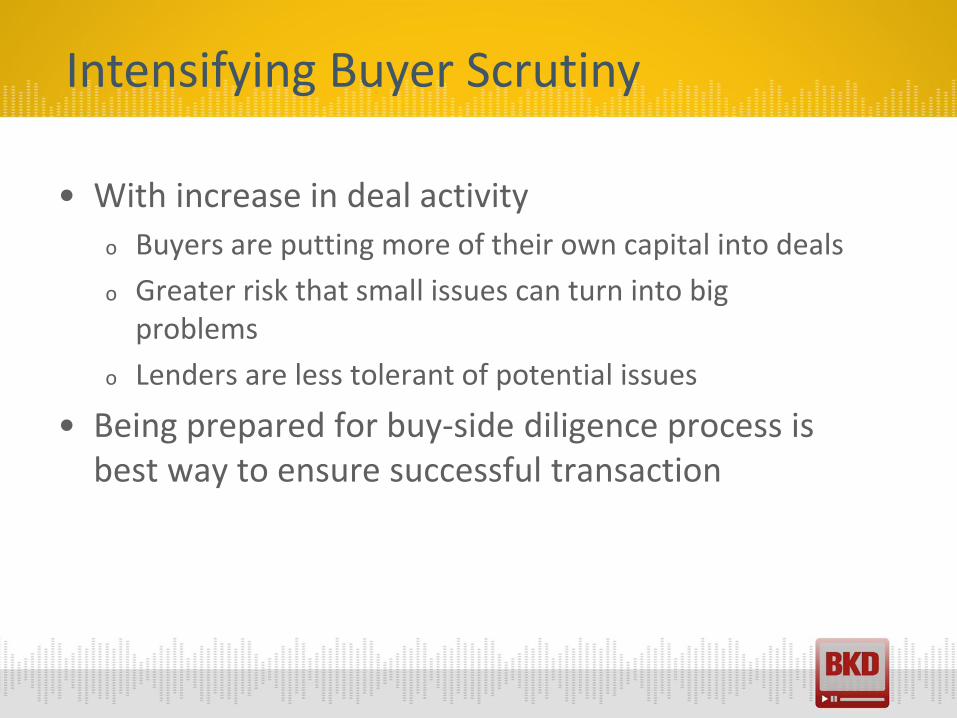
• With increase in deal activity
o Buyers are putting more of their own capital into deals
o Greater risk that small issues can turn into big problems
o Lenders are less tolerant of potential issues
• Being prepared for buy-side diligence process is best way to ensure successful transaction
Intensifying Buyer Scrutiny

• Could impact deal EBITDA
• Could impact deal multiple
• Could reduce deal fatigue by shortening buyer’s due diligence process
• Could attract more/different types of potential buyers
• Could identify tax strategies that are mutually beneficial
• Could support internal resources so they can focus on running business
Seller Benefits

• Drafting Letter of Intent
• Deal Structure–Asset vs. Stock, etc.
• Working Capital Trends
• Income Statement
o Revenue trends
o Margin trends
o Gaining new or losing customers–earnings impact?
o Vendor accessibility & availability
o Related-party transactions
Other Important Due Diligence Focus Points

• Balance sheet exposure areas
o Assets included/excluded
o Appropriateness of reserves
o Inventory requirements
o Liabilities assumed/excluded
• Tax exposure areas
o State & local taxes
o Federal tax successor liability
Other Important Due Diligence Focus Points

• Information Technology
o Does it produce reliable data?
o Is it compatible?
o Is it scalable?
• Operations
o What efficiencies can be developed?
o What synergies can be leveraged?
Other Important Due Diligence Focus Points

• Smooth out deal process
• Prepares buyer for “what’s to come” with buy-side diligence
• Reduce number of “surprises” at negotiation table
• Lower hold-backs
• Gives sense of security, credibility
Overall Benefits We Have Seen

Recent Examples
• Identified risks relating to budgeting process of target company in construction industry
• Budgets provided by management included
o Numerous clerical errors
o Aggressive bookings assumptions
o Assumptions that recent unfavorable trends would somehow “be recovered” with no supporting detail
• Takeaway–Get in front of issue & take time to complete accurate & reasonable budgets
Recent Examples
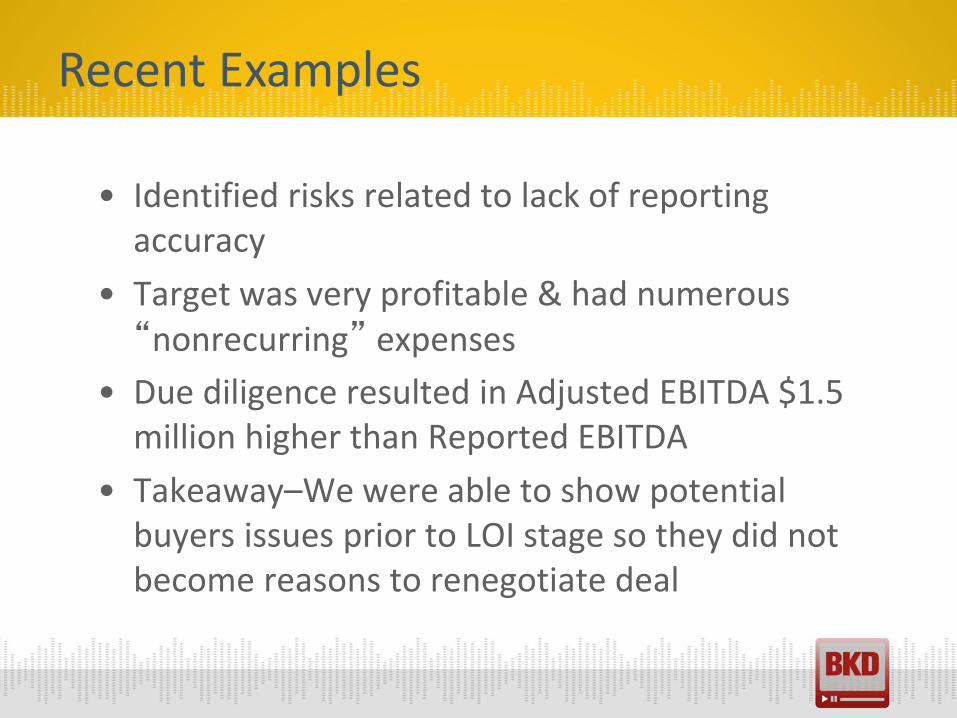
• Identified risks related to lack of reporting accuracy
• Target was very profitable & had numerous “nonrecurring” expenses
• Due diligence resulted in Adjusted EBITDA $1.5 million higher than Reported EBITDA
• Takeaway–We were able to show potential buyers issues prior to LOI stage so they did not become reasons to renegotiate deal

Recent Examples
• Identified risks related to seasonality of target company in manufacturing industry
• Target experienced high volumes during summer months & low volumes during winter months
• NWC target was based on TTM average & closing was expected during down time, resulting in reduced purchase price
• Takeaway–Utilize clear wording in purchase agreement & consider all factors that may influence purchase price

• Multidisciplinary buy-side diligence
o Financial
o Federal, state & local tax
o Information technology
o Operational
o Incentives
• Sell-side diligence preparation
• Business & tax structuring
• Working capital reviews
• Audits of beginning & ending balance sheets
BKD Transaction Services Overview

POLLING QUESTIONS

Polling Question 1
• Example? *Note: questions can only have 126 total characters in them
o Yes *Note: answers can only have 60 total characters
o No
o Unsure
54

Polling Question 2
55
• Example? *Note: questions can only have 126 total characters in them
o Yes *Note: answers can only have 60 total characters
o No
o Unsure
Polling Question 3
56
• Example? *Note: questions can only have 126 total characters in them
o Yes *Note: answers can only have 60 total characters
o No
o Unsure

Polling Question 4
57
• Example? *Note: questions can only have 126 total characters in them
o Yes *Note: answers can only have 60 total characters
o No
o Unsure

58 58
• Up to 1 CPE credit will be awarded upon verification of participant attendance; however, credits may vary depending on state guidelines
• For questions, complaints or comments regarding CPE credit, please email BKD Learning & Development department at [email protected]
CPE Credit

APPENDIX

• Success of company should depend on entire organization, not a few people
• Loss of one or two key personnel should not negatively affect company
• Need strong second-in-command & junior-level management
Mold a Strong Management Team

• Develop business plan–reasonable & attainable assumptions
• Clearly define internal & external growth opportunities
• Identify & explain operation or margin improvements (investment in technology, improved supplier terms)
• Identify capital expenditures
• Capital requirement (internal CF, outside capital)
• Hit your numbers
Business Plan
• Effective financial controls
o Audited or reviewed financial statements
o GAAP internal financial statements
o Dependable accounting department
• Gives sense of security, credibility
• Lowers due diligence costs
• Lowers holdbacks
Financial Statements

• Putting off needed expenses may not add value
• Review & address operational processes
• Ensure systems & controls are in place
• Investment in technology or equipment
• Give best appearance possible
• Also applies to investment in human capital
o Management
o Other personnel
Invest in the Future

• Eliminate unprofitable products &/or customers
• Examine expenses (excessive, personal/family related, nonrecurring expenses)
• Review & improve supplier contracts
• Sell divisions or locations if they significantly lower earnings & are not strategic
• Manage working capital
Improve Margins & Profitability

• Too much revenue with too few customers can give appearance that business may be risky
• Improve quality (profitability) & diversification of customers
• Attempt to get sales contracts or agreements
• Be prepared for holdbacks in transaction
Customer Concentration

• Clean up
o Manage working capital
o Obsolete inventory
o Loans to shareholders
• Will clarify assets & liabilities in transaction
Balance Sheet

• Different owners = different objectives
• Beneficial to buy out minority shareholders
• Can ensure smoother transaction & may increase value
Controlled Ownership

• Litigation
• Corporate records
• Contracts
• Financial records
• Allow time to fix what might impact value
Pre-Due Diligence

• If selling your company is your exit plan, timing can be single most important factor to consider
• Buy low, sell high applies to business sales as well
• Sell on your own terms
• In difficult market, deal structure & partner going forward critical
• Don’t be a Lone Ranger
Timing

Anthony Giordano | Vice President | 303.837.3562 | [email protected]
Daniel Boarder | Supervising Consultant | 816.221.6300 or 972.702.8262 |

71 71
Continuing Professional Education (CPE) Credits
BKD, LLP is registered with the National Association of State Boards of Accountancy (NASBA) as a sponsor of continuing professional education on the National Registry of CPE Sponsors. State boards of accountancy have final authority on the acceptance of individual courses for CPE credit. Complaints regarding registered sponsors may be submitted to the National Registry of CPE Sponsors through its website: www.learningmarket.org.
The information in BKD webinars is presented by BKD professionals, but applying specific information to your
situation requires careful consideration of facts & circumstances. Consult your BKD advisor before acting
on any matters covered in these webinars.

72 72
CPE Credit
• Up to 1 CPE credit will be awarded upon verification of participant attendance; however, credits may vary depending on state guidelines
• For questions, complaints or comments regarding CPE credit, please email the BKD Learning & Development Department at [email protected]