The Lancet Proposed title - discovery.ucl.ac.ukdiscovery.ucl.ac.uk/1478888/1/Lublin et al 2016 Oral...
33
Page 1 of 33 The Lancet Proposed title: Oral fingolimod versus placebo in primary progressive multiple sclerosis: results of a large phase III, randomised trial Authors: Lublin F 1 and Miller DH 2 (co-primary), Freedman MS 3 Cree BAC 4 , Wolinsky JS 5 , Weiner H 6 , Lubetzki C 7 , Hartung H-P 8 , Montalban X 9 , Uitdehaag BMJ 10 , Merschhemke M 11 , Li B 12 , Putzki N 11 , Liu FC 12 , Häring DA 11 , Kappos L 13 Author affiliations: 1. Icahn School of Medicine at Mount Sinai, New York, NY 2. Queen Square MS Centre, UCL Institute of Neurology, UK 3. The Ottawa Hospital Research Institute, University of Ottawa, Ottawa, Ontario, Canada 4. Multiple Sclerosis Center, University of California San Francisco, USA 5. University of Texas Health Science Center at Houston, Houston, Texas, USA 6. Brigham and Women’s Hospital, Harvard Medical School, Boston, MA, USA 7. University Paris 6, Salpêtriére Hospital APHP, Paris, France 8. Heinrich-Heine University, Medical Faculty, Department of Neurology, Düsseldorf, Germany 9. Hospital Universitari Vall d’Hebron, Barcelona, Spain 10. VU University Medical Center, Amsterdam, The Netherlands 11. Novartis Pharma AG, Basel, Switzerland 12. Novartis Pharmaceuticals Corporation, East Hanover, NJ, USA 13. University Hospital, Neurology, Departments of Medicine, Clinical Research, Biomedicine and Biomedical Engineering, University of Basel, Switzerland Corresponding co-primary authors: Fred D. Lublin, MD, FAAN, FANA David H. Miller, MBChB, MD, FRCP, Saunders Family Professor of Neurology Director, The Corinne Goldsmith Dickinson Center for Multiple Sclerosis Icahn School of Medicine at Mount Sinai 5 East 98th Street; Box 1138 New York, NY 10029-6574 Email: [email protected] Telephone: (212) 241-6854 Professor of Clinical Neurology National Hospital for Neurology and Neurosurgery UCL Institute of Neurology London UK Email: [email protected] Telephone: +44 (0) 20 78298771
Transcript of The Lancet Proposed title - discovery.ucl.ac.ukdiscovery.ucl.ac.uk/1478888/1/Lublin et al 2016 Oral...
Page 1 of 33
The Lancet
Proposed title: Oral fingolimod versus placebo in primary progressive multiple sclerosis: results
of a large phase III, randomised trial
Authors: Lublin F1 and Miller DH2 (co-primary), Freedman MS3 Cree BAC4, Wolinsky JS5,
Weiner H6, Lubetzki C7, Hartung H-P8, Montalban X9, Uitdehaag BMJ10, Merschhemke M11, Li
B12, Putzki N11, Liu FC12, Häring DA11, Kappos L13
Author affiliations:
1. Icahn School of Medicine at Mount Sinai, New York, NY 2. Queen Square MS Centre, UCL Institute of Neurology, UK 3. The Ottawa Hospital Research Institute, University of Ottawa, Ottawa, Ontario, Canada 4. Multiple Sclerosis Center, University of California San Francisco, USA 5. University of Texas Health Science Center at Houston, Houston, Texas, USA 6. Brigham and Women’s Hospital, Harvard Medical School, Boston, MA, USA 7. University Paris 6, Salpêtriére Hospital APHP, Paris, France 8. Heinrich-Heine University, Medical Faculty, Department of Neurology, Düsseldorf, Germany 9. Hospital Universitari Vall d’Hebron, Barcelona, Spain 10. VU University Medical Center, Amsterdam, The Netherlands 11. Novartis Pharma AG, Basel, Switzerland 12. Novartis Pharmaceuticals Corporation, East Hanover, NJ, USA 13. University Hospital, Neurology, Departments of Medicine, Clinical Research, Biomedicine and
Biomedical Engineering, University of Basel, Switzerland
Corresponding co-primary authors:
Fred D. Lublin, MD, FAAN, FANA David H. Miller, MBChB, MD, FRCP,
FRACP Saunders Family Professor of Neurology
Director, The Corinne Goldsmith Dickinson
Center for Multiple Sclerosis
Icahn School of Medicine at Mount Sinai
5 East 98th Street; Box 1138
New York, NY 10029-6574
Email: [email protected]
Telephone: (212) 241-6854
Professor of Clinical Neurology
National Hospital for Neurology and
Neurosurgery
UCL Institute of Neurology
London
UK
Email: [email protected]
Telephone: +44 (0) 20 78298771

Page 2 of 33
Abstract
Background: There is no approved treatment for primary progressive multiple sclerosis (PPMS).
Fingolimod, an oral sphingosine 1-phosphate receptor modulator, has significant benefits in relapsing
MS (RMS), but has not been assessed in PPMS.
Methods: This randomised, double-blind trial (ClinicalTrials.gov, NCT00731692) evaluated fingolimod
0.5 mg versus placebo on disability progression in patients with PPMS treated for at least 3 years. Key
inclusion criteria: clinical diagnosis of PPMS; disease duration 2–10 years and objective evidence of
disability progression in the previous 2 years. A novel primary composite endpoint, based on change
from baseline in Expanded Disability Status Scale (EDSS), 25’ Timed-Walk Test or 9-Hole Peg Test, was
used to assess time to 3-month confirmed disability progression (3M-CDP). Key secondary endpoints:
disability progression assessed by EDSS and percent brain volume change (PBVC).
Findings: The efficacy analysis set (N=823) comprised 336 and 487 patients randomised to fingolimod
0.5 mg and placebo, respectively. Baseline characteristics were similar across groups and representative
of a progressive population (48.4% women; mean age 48.5±8.4 years, mean EDSS=4.67±1.03, 87% free
of Gadolinium-enhancing lesions). By end of the study, 3M-CDP (composite primary endpoint; Kaplan-
Meier estimate, 95% confidence interval) occurred in 77.2% (71.87%; 82.51%) versus 80.3% (73.31%;
87.25%) of fingolimod versus placebo patients. Neither the primary composite (risk reduction [RR]
5.05%; p=0.544), nor EDSS (RR 11.99%; p=0.217) endpoints were met. PBVC was not different between
the fingolimod and placebo groups (‒1.49 and ‒1.53; p=0.673). There were fewer Gd+ and new T2
lesions in the fingolimod arm (78% and 73% reduction; both p<0.001), although overall MRI lesion
activity was low. Safety results were generally consistent with fingolimod RMS trials.
Interpretation: The anti-inflammatory effects of fingolimod did not slow disease progression or brain
volume loss in PPMS. Therapeutic strategies for PPMS may require different approaches than utilised for
RMS.
Funding: Novartis Pharma AG (Word count: 300 [limit 300])

Page 3 of 33
Panel: Research in context
Systematic review
We searched PubMed on July 8, 2015, with no restriction on language or publication date, using the
search term “primary progressive multiple sclerosis”. We identified 324 articles, of which 4 were
primary reports of results from randomised, blinded, placebo-controlled clinical trials. Of these, 2 were
large-scale, phase III trials: the PROMiSE trial, in which the active comparator was glatiramer acetate,
was designed as a 3-year trial, but was terminated early; and the 2-year OLYMPUS trial in which
rituximab was the active comparator. Both studies used the EDSS as the primary outcome measure and
were negative in terms of a treatment benefit on disability progression and BVL, despite effects on some
MRI parameters. Subsequent discussion on these studies included the influence of the patient
populations recruited, the duration,30 and the endpoints used on the ability of PPMS trials to detect
treatment differences.
Interpretation
INFORMS addressed the important limitations of previous studies in PPMS. INFORMS was adequately
designed with a novel composite endpoint and patients were exposed to study drug for at least 3 years.
Furthermore, the study was powered to 90% for the detection of a clinically meaningful treatment
effect on disability progression. INFORMS successfully recruited a primary progressive MS population
with very low inflammatory activity (few relapses and low number of Gd-enhancing lesions at baseline
and throughout the study). Despite the adequate design and a worsening trial population, INFORMS did
not show a benefit for fingolimod versus placebo in terms of disability progression or BVL in patients
with PPMS. Furthermore, the finding that the pharmacodynamic effects of fingolimod did not impact
disability progression or BVL, despite effects on MRI-detected inflammatory lesion activity that were
consistent with results in RMS, add to the important discussion on the pathophysiology of progressive
phase MS and will guide future research.
Page 4 of 33
Introduction
Multiple sclerosis (MS) is a chronic, autoimmune and neurodegenerative disorder of the central nervous
system (CNS).1 While relapsing MS (RMS, encompassing relapsing-remitting and secondary progressive
MS) is the most frequent form, 10‒15% of MS patients exhibit a progressive disability from onset with
no, or very infrequent superimposed relapses and remissions (primary progressive MS or PPMS).2,3
Although part of the MS disease spectrum,4 PPMS differs from RMS in several ways. The inflammatory
component, as measured by the development of gadolinium (Gd)-enhancing MRI lesions, is less
prominent than in RMS.2,5-Men and women are equally affected, in contrast to the higher frequency of
women in RMS.3,6 Patients with PPMS are generally about 10 years older at diagnosis compared with
RMS patients (mean age around 40 years for PPMS versus 30 years for RMS).2,6 Moreover, disability
progresses more rapidly in PPMS such that the severity of disability according to age is similar to that in
RMS.7
Despite the range of effective options available for RMS, to date, no treatment has been shown to
change the disease course in PPMS. 8,9 Fingolimod (FTY720; GILENYATM, Novartis Pharma AG, Basel,
Switzerland) is an oral sphingosine 1-phosphate (S1P) receptor modulator that, by downregulation of
the S1P1 receptor subtype, prevents lymphocyte egress from lymphoid tissues into the circulation. In
RMS, fingolimod reduces the frequency of relapses, delays disability progression and reduces magnetic
resonance imaging (MRI) lesion activity versus placebo; and decreases the frequency of relapses and
active MRI lesions versus interferon (IFN) β-1a IM.10-12 Furthermore, fingolimod significantly limits brain
volume loss (BVL) in RMS compared with both placebo and IFN-β1a IM12,13, a measure that correlates
with disability progression.14,15

Page 5 of 33
In addition to preventing lymphocyte egress from lymphoid tissues, fingolimod can cross the
blood‒brain barrier and bind to S1P1, S1P3, and S1P5 receptors located on neural cells.16 Therefore,
part of its therapeutic action may be independent of its effect on peripheral macrophages. It is known
that S1P1 and S1P3 receptors are strongly expressed within MS lesions and this expression has been
associated with astrogliosis, a key pathological feature of MS lesions.17 In vitro and in vivo data suggest
that fingolimod can directly inhibit neurodegeneration. Fingolimod treatment of isolated human
astrocytes desensitised the S1P receptor-mediated neuroinflammatory pathways resulting in reduced
astrogliosis and neurodegeneration.17 Animal models of MS have demonstrated that fingolimod
treatment can result in reduced neuroinflammatory disease and improved CNS tissue integrity.18,19 This
ability of fingolimod to reduce inflammatory infiltrates into the CNS, coupled with the potential effects
on intrinsic mechanisms within the brain resulting in reduced neurodegeneration, provided the rationale
for the INvestigating FTY720 ORal in Primary Progressive MS (INFORMS) trial (NCT00731692). In this
study, a novel composite endpoint was devised, including the 25’ Timed Walk Test (25’TWT)20 and the
Nine-Hole Peg Test (9-HPT)20,21 as additional components to the expanded disability status scale
(EDSS),22 to provide a more sensitive and comprehensive assessment of disability than the EDSS alone.
Methods
Study Design
This multicentre, double-blind, placebo-controlled, parallel-group study was conducted in accordance
with the International Conference on Harmonization Guidelines for Good Clinical Practice23 and the
Declaration of Helsinki.24 The protocol was approved by each site’s institutional review board; patients
gave written informed consent. A Steering Committee (for membership see the Supplementary
Appendix) oversaw the study.

Page 6 of 33
Randomization and masking
The randomization sequence was automatically generated by a validated system under the
responsibility of Novartis Drug Supply Management. The randomization occurred in blocks of 4 within
centre in a 1:1 ratio to fingolimod or placebo. All randomised drug assignments remained blinded for the
entire double-blind treatment period. Treatment codes were accessible only to members of the data
and safety monitoring board (DSMB) which was independent of Novartis and not otherwise involved in
the conduct of the study. Masking (blinding) was achieved by using identical packaging, and identical
capsule colour and size for active treatment and placebo.
Patients were initially randomised to receive fingolimod 1.25 mg/day or matching placebo in a 1:1 ratio.
Following a 2009 protocol amendment after the decision to select the 0.5 mg dose of fingolimod for
submission to regulatory authorities for RMS and to discontinue development of fingolimod 1.25 mg
randomization into this initial cohort of patients was stopped. Patients randomised up to the release of
this amendment were labelled as ‘Cohort 1’ with those originally randomised to fingolimod 1.25 mg
switched in a blinded fashion to fingolimod 0.5 mg and those on placebo continued on matching
placebo.
From this time point in 2009 onwards, patients were randomised into a new cohort (‘Cohort 2’), which
included patients who were recruited after the release of the amendment and were randomised in a 1:1
ratio to receive fingolimod 0.5 mg/day or placebo.
Heart rate reduction is a known pharmacologic effect of fingolimod that can potentially unblind study
participants. To maintain blinding, an independent first dose administrator performed pulse rate
monitoring after the first dose of study drug. Employees of the sponsor who were independent of the
study team monitored first dose safety in a blinded fashion.

Page 7 of 33
Patients
Key eligibility criteria were age of 25‒65 years with a clinical diagnosis of PPMS according to the 2005
revised McDonald criteria.25 Patients had to have demonstrated ≥1 year of disease progression plus two
of the following three criteria: positive brain MRI; positive spinal cord MRI and/or positive cerebrospinal
fluid (CSF). Central review to confirm that the diagnostic criteria for PPMS were met was required for all
patients prior to randomization.
Additional inclusion criteria included time from first reported symptoms of 2–10 years prior to study
entry; evidence of disability progression documented by an increase in the EDSS score ≥0.5 points in the
past 2 years; objective evidence of disability measured by EDSS score of 3.5‒6; pyramidal functional
system score ≥2; and a 25’TWT <30 seconds was required. Exclusion criteria were similar to previous
RMS trials (for complete details, see Supplementary Appendix).10-12
Study Procedures
Clinical assessments were performed at screening and at randomization (baseline) and at study visits
that included safety assessments at 2 weeks and 1, 2, 3, 6, 9, 12 months during the first year after
randomization and then every 3 months until month 36.
All efficacy assessments were performed by an independent specially trained and certified26 evaluating
physician. MRI scans were analysed at a central MRI centre by trained staff blinded to the study-group
assignments. EDSS assessments were scheduled at screening, baseline and then every 3 months during
the double-blind treatment period, at the end of treatment and at the 3-month follow-up visit. In the
case of MS relapse, EDSS assessment by the independent physician was required at an unscheduled visit
to confirm relapse. The 25’TWT and 9-HPT were assessed at baseline and every 3 months throughout
the double-blind treatment period, at the end of treatment and at the 3-month follow-up visit.

Page 8 of 33
Specifications of the adverse event (AE) monitoring procedure, as defined in the study protocol, are
detailed in the Supplementary Appendix, which also provides other methodologic details, the list of
members of the independent DSMB, and the members of the independent diagnosis adjudication board.
Objectives and End Points
The primary objective was to evaluate the effect of fingolimod versus placebo on delaying the time to
confirmed disability progression (CDP). CDP was defined as the first occurrence of a progression
according to at least one of the following 3 criteria: increase from baseline in the EDSS score by 1 point
in patients with baseline EDSS score ≤5.0 or 0.5 point in patients with baseline EDSS score ≥5.5; increase
of at least 20% from baseline in the 25’TWT; increase of at least 20% from baseline in time taken to
complete the 9-HPT. Progression in at least one of the three components had to be sustained and
confirmed at least 3 months later at a scheduled visit.
Protocol-defined key secondary objectives: 1) effect of fingolimod 0.5 mg versus placebo on delaying the
time to 3-month CDP as measured by the EDSS; 2) effect of fingolimod 0.5 mg versus placebo on percent
brain volume change (PBVC) as a measure of BVL. PBVC was measured using SIENA applied to T1-
weighted images.27
Statistical Analysis
The study was powered to 90% to detect a reduction between fingolimod and placebo in the time to 3-
month CDP based on the composite endpoint in a log-rank test at a two-sided significance level of 5%: a
sample size of 654 patients (327 in each group) was needed to detect a 3-year event rate reduction in
the fingolimod 0.5 mg group of 25% (50% event rate on placebo versus 37.5% on fingolimod).
The primary efficacy analysis population comprised all patients randomised to fingolimod 0.5 mg or
placebo (Cohort 2) and all patients randomised to placebo in Cohort 1. Patients had to have taken at
Page 9 of 33
least one dose of study drug to be included (modified ITT principle). The decision to use the placebo
patients from Cohort 1 in the primary analysis population was made after a blinded review of the
baseline data that revealed no apparent differences between patients in Cohort 1 and 2. Cohort 1 and 2
were also analysed separately (see Supplementary Appendix). All efficacy results, unless otherwise
specified, are based on the primary efficacy analysis set. The safety analysis population comprised all
patients from Cohorts 1 and 2.
The primary analysis used a Cox proportional hazards model to test for differences between fingolimod
and placebo in the time to 3-month CDP based on the composite endpoint, with region, age, baseline
EDSS, baseline 25’TWT and baseline 9-HPT as covariates.
The key secondary analysis of time to 3-month CDP based on EDSS was performed as for the primary
efficacy endpoint, but only disability progressions based on the EDSS were analysed and baseline
25’TWT and baseline 9-HPT were not included as covariates in the Cox proportional hazards model.
PBVC was analysed using a random coefficients model including treatment and region as fixed effects,
and time, number of Gd-enhancing lesions at baseline, baseline T2 lesion volume and normalised brain
volume at baseline as continuous covariates.
To control the type-I error rate, the primary and key secondary efficacy hypotheses were tested in
sequential order in a hierarchical step down procedure.
Role of the funding source
The study sponsor participated in the design of the study, conduct of the study, data collection, data
management, data analysis and interpretation, and preparation, review and approval of the paper. All
authors had access to the data. All authors, including those employed by Novartis, were involved in
manuscript preparation and had control over the content, for which they take full responsibility and

Page 10 of 33
have given final approval for submission for publication.
Page 11 of 33
Results
Enrolment was between July 2008 and August 2011. Patients were accrued across 148 centres in 18
countries (see the Supplementary Appendix for a list of the centres and principal investigators). In total,
1520 patients were screened with 970 randomised (280 patients were randomised (1:1) to fingolimod
1.25 mg or placebo in Cohort 1 and 690 patients were randomised (1:1) to receive either fingolimod 0.5
mg or placebo in Cohort 2).
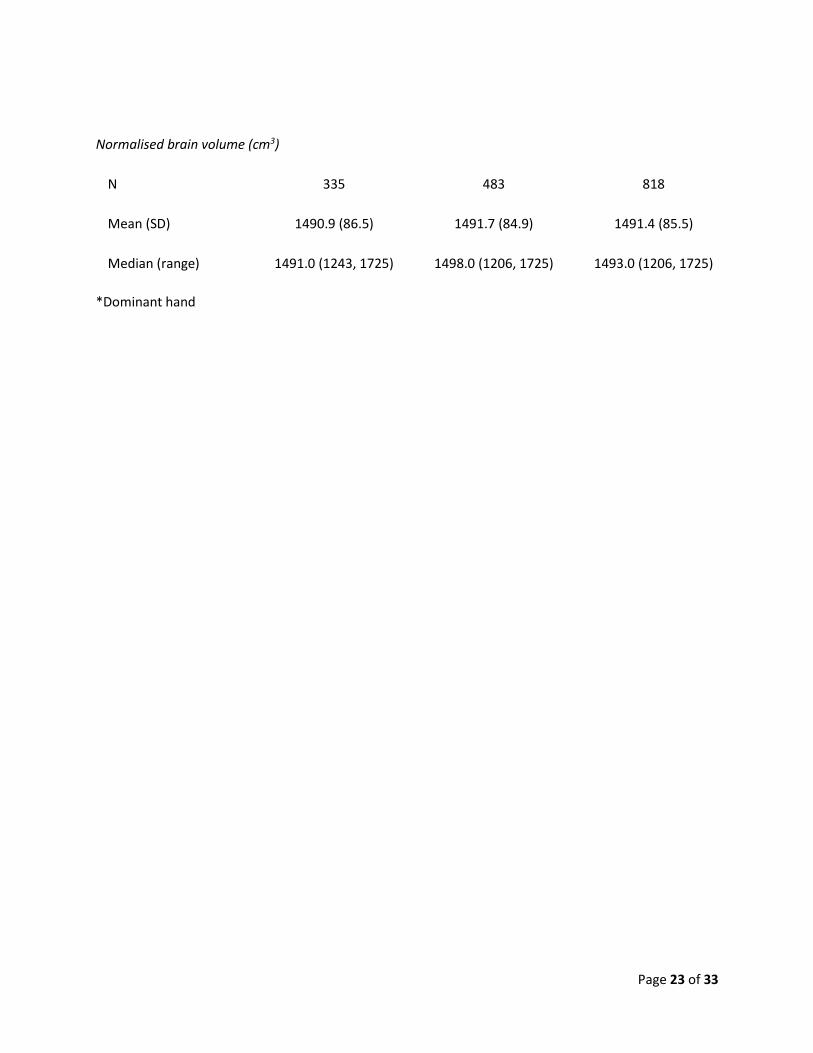
Patient disposition is summarised in Figure 1. Table 1 presents the baseline characteristics of the efficacy
analysis set, which were similar across treatment groups (Supplementary Appendix presents the
baseline characteristics for the entire INFORMS patient population [Cohorts 1 and 2]).
The composite primary efficacy endpoint was not met (Table 2, Figure 2A): fingolimod demonstrated no
difference compared with placebo (p=0.544) in the time to 3-month CDP. There was also no difference
in the time to 3-month CDP based on EDSS alone (Table 2, Figure 2B). Efficacy by Cohort is presented in
the Supplementary Appendix. No significant treatment effect was observed in either cohort.
A similar analysis for 6-month CDP was conducted and the conclusions were consistent with that of the
primary endpoint (data not shown). Subgroup analyses by sex, age (≤40 vs. 41‒55 vs. >55 years), EDSS at
baseline (≤5 vs. >5), Gd lesion status at baseline and age/Gd status at baseline (≤50 and Gd+ ≥1 vs. >50
and Gd+ < 1) yielded similar results and did not alter the conclusion of a lack of efficacy of fingolimod in
patients with PPMS (data not shown).
PBVC was also similar in patients treated with fingolimod 0.5 mg compared with placebo
(Table 2). However, fingolimod reduced the number of new/newly enlarging T2 lesions by 73% and of
Gd-enhancing T1 lesions by 78% (Table 2). A majority of patients remained free of new/newly enlarging
Page 12 of 33
T2 lesions through the end of the study in both treatment arms (mean number of new/newly enlarging
T2 lesions of 0.5 versus 0.13 lesions per year in the placebo and fingolimod arms, respectively; Table 2).
Confirmed relapses were reported for 6 (1.8%) and 41 (8.4%) patients in the fingolimod 0.5 mg and
placebo groups, respectively.
As shown in Table 3, the incidence of AEs in the efficacy analysis set was generally comparable between
groups (Supplementary Appendix provides a summary of AEs for the entire safety analysis set) and the
overall AE profile was similar to trials of fingolimod for RMS.10,12 The events were mild or moderate in
severity in 74.1% of those receiving fingolimod versus 75.2% for placebo.
AEs that led to discontinuation of the study medication (including abnormal laboratory test results) were
more common with fingolimod than with placebo (Table 3). Serious AEs were reported for 25.0% in
patients receiving fingolimod and 24.0% for placebo.
Five deaths occurred during the study. Two in the group originally randomised to fingolimod 1.25 mg
(1.4%; single cases of respiratory tract infection and aspiration pneumonia); 1 (0.3%) randomised to
fingolimod 0.5 mg in the efficacy analysis set (metastatic lung cancer); and 2 (0.4%) in the combined
placebo group (single cases of convulsion and pulmonary embolism).
AEs of special interest, such as cardiac conduction abnormalities, macular oedema, infections and
neoplasms were in keeping with previous observations from RMS trials.

Page 13 of 33
Discussion
In PPMS patients, fingolimod treatment did not decrease the risk of progression of disability versus
placebo. There was also no difference between fingolimod and placebo on BVL. In both treatment
groups, BVL was approximately 0.5% per year and the majority of patients progressed in their disability
status, irrespective of treatment. The effects of fingolimod on MRI measures of lesion activity and
clinical relapses (although very few in number) were consistent with results from RMS studies.10-12
INFORMS is the first large, prospective MS study that used a composite of three major domains of MS-
associated disability as the primary endpoint. This composite endpoint yielded more progression events
than its components of which the highest event rate was recorded for the 25’TWT. The outcomes of all
measures included were consistent, supporting the potential usefulness of the composite endpoint in
future PPMS trials.
Despite the inclusion of patients with a higher age and more advanced disability, the safety and
tolerability results for fingolimod 0.5 mg in INFORMS were in keeping with RMS trials, including the rates
of AEs of special interest such as cardiac conduction at first dose and infections.
Based on the event rates of both the composite primary disability endpoint and its components,
including the traditional EDSS endpoint, the study was adequately powered to detect a treatment effect.
The trial recruited a large, well-defined worsening population of PPMS patients who progressed
substantially during the course of the study. A total of 80% of placebo treated patients demonstrated
CDP according to the primary composite and 59% according to the EDSS endpoint. Event rates according
to the EDSS were higher than those observed in the placebo arms of two other large phase III trials. In
PROMiSe,9 in which the active comparator was glatiramer acetate, the placebo arm event rate was
45.2%, while in the OLYMPUS rituximab trial,8 the placebo rate was 38.5%. Interestingly more than 30%
of the CDP events by the primary outcome occurred within the first 26 weeks after randomization. In

Page 14 of 33
line with most previous PPMS cohorts,8,9 the INFORMS population showed a low rate of active
inflammatory MRI lesions (<15% positive for Gd-enhancing lesions at baseline) and a moderate T2 lesion
burden. Together, these data suggest that the inclusion criteria of INFORMS succeeded in recruiting a
characteristic progressing PPMS population.4
The rate of discontinuations in INFORMS was in line with previous PPMS trials,8,9 which were of shorter
duration, and also consistent with fingolimod trials in RMS where an approximate attrition rate of 10%
per annum was observed.10-12 Indeed, this rate of attrition was factored into the sample size calculations
to ensure an ability to detect a treatment difference at the end of the trial.
As with RMS, the rate of BVL in these PPMS patients substantially exceeded that observed in individuals
without MS.28 In RMS, fingolimod showed a consistent and robust effect on BVL 12,13 that was not seen in
this PPMS trial. In RMS the effect of fingolimod on BVL is associated with a reduction in inflammatory
Gd-enhancing and new/enlarging T2 lesions, 15,29 but has also been attributed to additional actions
independent of its anti-inflammatory effects. In PPMS, the effect of fingolimod on lesion activity (Gd-
enhancing and new/enlarging T2 lesions) was consistent with that seen in RMS, although relatively
fewer PPMS patients had lesion activity (Gd-enhancing or new/newly enlarging T2 lesions). These
observations suggest that although fingolimod has an impact on inflammatory disease activity, it had
little effect on the process that leads to BVL and disability progression in PPMS. Similarly, in the
PROMiSe and the OLYMPUS trial, there was no effect of the active compound on BVL despite an effect
on Gd-enhancing activity and T2 lesion burden at some timepoints.8,9
Unlike RMS, the inflammatory infiltrate within the CNS is not only less prominent in PPMS but also
differs in its cellular composition.2,5 It is probable that the pathophysiologic mechanisms that drive BVL
differ, at least partially, in these two MS phenotypes and neurodegenerative processes may play a more
prominent role in PPMS. The results of INFORMS suggest that anti-neuroinflammatory strategies

Page 15 of 33
currently applied in RMS are unlikely to be beneficial in PPMS, and that novel approaches may be
required to treat patients with PPMS.
Word count: 3,412 (including panel and acknowledgements; limit 4,500)
Contributors
All of the authors contributed to data interpretation, co-wrote the first draft, and reviewed and edited
subsequent drafts. FL, DHM, MSF, BACC, JSW, HW, CL, H-PH, XM, BMJU, MM, BL, NP, DAH, and LK were
members of the Steering Committee and contributed to study design. DAH and BL were the study
statisticians. Editorial support was provided by Katy Demery (Novartis employee) and Paul Coyle
(Western Edge Medical Communications Ltd.). Editorial support was funded by Novartis.
Acknowledgements
The study was supported by Novartis Pharma AG, Basel, Switzerland. Central MRI Analysis was
performed at the Queen Square MS Centre, UCL Institute of Neurology, London. Members of the central
MRI analysis team were: DG MacManus, TA Yousry, CAM Wheeler-Kingshott, O Yaldizli, J Stutters, CM
Dalton, V Santana, A Garcia-Gomez, C Crespo, DH Miller. The Queen Square MS Centre is supported by
the UK MS Society and the UCL-UCLH joint Biomedical Research Centre. We thank the patients who
participated in the study; the study-site personnel; Ana de Vera, Goeril Karlsson and the Novartis clinical
team; and Katy Demery (Novartis) and Paul Coyle (Western Edge Medical Communications Ltd.) for
editorial assistance.

Page 16 of 33
Disclosures
Dr. Lublin reports grants from Novartis, during the conduct of the study; personal fees from Bayer
Healthcare, grants and personal fees from Biogen Idec, personal fees from EMD Serono, grants and
personal fees from Novartis, grants and personal fees from Teva Neuroscience, personal fees from
Actelion, grants and personal fees from Sanofi/Genzyme, personal fees from Acorda, personal fees from
Questcor/Malinckrodt, personal fees from Roche/Genentech, grants and personal fees from Celgene,
personal fees from Medimmune, personal fees from Osmotica, from Xenoport, personal fees from
Receptos, personal fees from Forward pharma, personal fees from BBB Technologies, personal fees from
Akros, personal fees from TG therapeutics, personal fees from Abbvie, grants from Transparency Life
Sciences, outside the submitted work; Dr. Miller reports grants and personal fees from Novartis, during
the conduct of the study; grants and personal fees from Biogen Idec, personal fees from Misubishi
Pharma Europe, personal fees from BayerSchering, grants from Apitope, personal fees from Chugai,
outside the submitted work; Dr. Freedman reports personal fees from Genzyme, personal fees from
Merck Serono, personal fees from Bayer, personal fees from Biogen Idec, personal fees from Teva
Canada Innovation, personal fees from Opexa, personal fees from Novartis, personal fees from Chugai,
outside the submitted work; Dr. Cree reports personal fees from Biogen Idec, personal fees from EMD
Serono, personal fees from MedImmune, personal fees from Novartis, grants from Hoffman La Roche,
personal fees from Teva Neurosciences, personal fees from Genzyme/sanofi aventis, personal fees from
Abvie, during the conduct of the study; Dr. Wolinsky reports personal fees from Novartis
Pharmaceuticals, during the conduct of the study; personal fees from Sanofi Aventis, personal fees from
Teva Pharmaceuticals, personal fees from Genzyme, personal fees from Actelion, personal fees from
Hoffman LaRoche, personal fees from AbbVie, personal fees from Athersys, Inc., personal fees from
Xenoport, personal fees from EMD Serono, personal fees from Alkermes, personal fees from Forward
Pharma A/S, grants from National Institutes of Health, grants from Sanofi Aventis, grants from National
Institutes of Health/NINDS, grants from Genzyme, personal fees from Consortium MS Centers, personal
fees from University of Kansas, personal fees from Wayne State University, personal fees from ACTRIMS,
other from Millipore (Chemicon Intl) Corp, outside the submitted work; Dr. Weiner has nothing to
disclose; Dr Lubetzki reports personal fees from Biogen, personal fees from Roche, personal fees from
Novartis, personal fees and other from Vertex, personal fees from Genzyme, outside of the submitted
work; Dr. Hartung reports personal fees from Biogen Idec, personal fees from Genzyme, personal fees
from TEVA, personal fees from Roche, personal fees from Novartis, personal fees from MedImmune,
outside the submitted work; Dr. MONTALBAN reports personal fees from ACTELION, personal fees from
ALMIRALL, personal fees from BAYER, personal fees from BIOGEN, personal fees from GENZYME,
personal fees from MERCK, personal fees from NOVARTIS, personal fees from OCTAPHARMA, personal
fees from RECEPTOS, personal fees from ROCHE, personal fees from SANOFI, personal fees from TEVA,
personal fees from TROPHOS, outside the submitted work; Dr. Uitdehaag reports personal fees from
Novartis, during the conduct of the study; personal fees from Biogen Idec, personal fees from Genzyme,
personal fees from Merck Serono, personal fees from Novartis, personal fees from Roche, personal fees
from TEVA, outside the submitted work; Drs Merschhemke, Li, Putzki, Liu, and Häring are employees of
Novartis; Dr. Kappos' Institution (University Hospital Basel) received in the last 3 years and used

Page 17 of 33
exclusively for research support: steering committee, advisory board and consultancy fees (Actelion,
Addex, Bayer Health Care, Biogen, Biotica, Genzyme, Lilly, Merck, Mitsubishi, Novartis, Ono Pharma,
Pfizer, Receptos, Sanofi-Aventis, Santhera, Siemens, Teva, UCB, Xenoport); speaker fees (Bayer Health
Care, Biogen, Merck, Novartis, Sanofi-Aventis, Teva ); support of educational activities (Bayer Health
Care, Biogen, CSL Behring, Genzyme, Merck, Novartis, Sanofi, Teva); royalties (Neurostatus Systems
GmbH); grants (Bayer Health Care, Biogen, Merck, Novartis, Roche, Swiss MS Society, the Swiss National
Research Foundation, the European Union, Roche Research Foundations).

Page 18 of 33
References
1. Noseworthy JH, Lucchinetti C, Rodriguez M, Weinshenker BG. Multiple sclerosis. The New England journal of medicine 2000; 343(13): 938-52. 2. Antel J, Antel S, Caramanos Z, Arnold DL, Kuhlmann T. Primary progressive multiple sclerosis: part of the MS disease spectrum or separate disease entity? Acta neuropathologica 2012; 123(5): 627-38. 3. Koch M, Kingwell E, Rieckmann P, Tremlett H. The natural history of primary progressive multiple sclerosis. Neurology 2009; 73(23): 1996-2002. 4. Lublin FD, Reingold SC, Cohen JA, et al. Defining the clinical course of multiple sclerosis: the 2013 revisions. Neurology 2014; 83(3): 278-86. 5. Mahad DH, Trapp BD, Lassmann H. Pathological mechanisms in progressive multiple sclerosis. The Lancet Neurology 2015; 14(2): 183-93. 6. Tremlett H, Paty D, Devonshire V. The natural history of primary progressive MS in British Columbia, Canada. Neurology 2005; 65(12): 1919-23. 7. Confavreux C, Vukusic S. Age at disability milestones in multiple sclerosis. Brain : a journal of neurology 2006; 129(Pt 3): 595-605. 8. Hawker K, O'Connor P, Freedman MS, et al. Rituximab in patients with primary progressive multiple sclerosis: results of a randomized double-blind placebo-controlled multicenter trial. Annals of neurology 2009; 66(4): 460-71. 9. Wolinsky JS, Narayana PA, O'Connor P, et al. Glatiramer acetate in primary progressive multiple sclerosis: results of a multinational, multicenter, double-blind, placebo-controlled trial. Annals of neurology 2007; 61(1): 14-24. 10. Cohen JA, Barkhof F, Comi G, et al. Oral fingolimod or intramuscular interferon for relapsing multiple sclerosis. The New England journal of medicine 2010; 362(5): 402-15. 11. Calabresi PA, Radue EW, Goodin D, et al. Safety and efficacy of fingolimod in patients with relapsing-remitting multiple sclerosis (FREEDOMS II): a double-blind, randomised, placebo-controlled, phase 3 trial. The Lancet Neurology 2014; 13(6): 545-56. 12. Kappos L, Radue EW, O'Connor P, et al. A placebo-controlled trial of oral fingolimod in relapsing multiple sclerosis. The New England journal of medicine 2010; 362(5): 387-401. 13. Barkhof F, de Jong R, Sfikas N, et al. The influence of patient demographics, disease characteristics and treatment on brain volume loss in Trial Assessing Injectable Interferon vs FTY720 Oral in Relapsing-Remitting Multiple Sclerosis (TRANSFORMS), a phase 3 study of fingolimod in multiple sclerosis. Multiple sclerosis 2014; 20(13): 1704-13. 14. Jacobsen C, Hagemeier J, Myhr KM, et al. Brain atrophy and disability progression in multiple sclerosis patients: a 10-year follow-up study. Journal of neurology, neurosurgery, and psychiatry 2014; 85(10): 1109-15. 15. Radue EW, Barkhof F, Kappos L, et al. Correlation between brain volume loss and clinical and MRI outcomes in multiple sclerosis. Neurology 2015; 84(8): 784-93. 16. Miron VE, Ludwin SK, Darlington PJ, et al. Fingolimod (FTY720) enhances remyelination following demyelination of organotypic cerebellar slices. The American journal of pathology 2010; 176(6): 2682-94. 17. Colombo E, Di Dario M, Capitolo E, et al. Fingolimod may support neuroprotection via blockade of astrocyte nitric oxide. Annals of neurology 2014; 76(3): 325-37. 18. Choi JW, Gardell SE, Herr DR, et al. FTY720 (fingolimod) efficacy in an animal model of multiple sclerosis requires astrocyte sphingosine 1-phosphate receptor 1 (S1P1) modulation. Proceedings of the National Academy of Sciences of the United States of America 2011; 108(2): 751-6. 19. Foster CA, Mechtcheriakova D, Storch MK, et al. FTY720 rescue therapy in the dark agouti rat model of experimental autoimmune encephalomyelitis: expression of central nervous system genes and reversal of blood-brain-barrier damage. Brain pathology 2009; 19(2): 254-66. 20. Schwid SR, Goodman AD, McDermott MP, Bever CF, Cook SD. Quantitative functional measures in MS: what is a reliable change? Neurology 2002; 58(8): 1294-6.

Page 19 of 33
21. Mathiowetz V, Volland G, Kashman N, Weber K. Adult norms for the Box and Block Test of manual dexterity. The American journal of occupational therapy : official publication of the American Occupational Therapy Association 1985; 39(6): 386-91. 22. Kurtzke JF. Rating neurologic impairment in multiple sclerosis: an expanded disability status scale (EDSS). Neurology 1983; 33(11): 1444-52. 23. ICH harmonised tripartite guideline — guideline for good clinical practice: E6(R1). Geneva: International Conference on Harmonisation of Technical Requirements for Registration of Pharmaceuticals for Human Use, June 10, 1996. http://www.ich.org/products/guidelines/efficacy/efficacy-single/article/good-clinical-practice.html Accessed Octobe 5, 2014. 24. Declaration of Helsinki: ethical principles for medical research involving human subjects. http://www.wma.net/en/30publications/10policies/b3/index.html. Accessed August 21, 2015. 25. Polman CH, Reingold SC, Edan G, et al. Diagnostic criteria for multiple sclerosis: 2005 revisions to the "McDonald Criteria". Annals of neurology 2005; 58(6): 840-6. 26. Neurostatus training and documentation DVD for a standardized neurological examination and assessment of Kurtzke’s functional systems and Expanded Disability Status Scale for MS patients. Basel, Switzerland: Neurostatus, 2007. (Available at: http://www.neurostatus.net). 27. Smith SM, Zhang Y, Jenkinson M, et al. Accurate, robust, and automated longitudinal and cross-sectional brain change analysis. NeuroImage 2002; 17(1): 479-89. 28. Hedman AM, van Haren NE, Schnack HG, Kahn RS, Hulshoff Pol HE. Human brain changes across the life span: a review of 56 longitudinal magnetic resonance imaging studies. Human brain mapping 2012; 33(8): 1987-2002. 29. Sormani M, De Stefano N, Francis G, et al. Fingolimod effect on brain volume loss independently contributes to its effect on disability. Multiple sclerosis 2015; 21(7): 916-24. 30. Hartung HP, Aktas O. Bleak prospects for primary progressive multiple sclerosis therapy: downs and downs, but a glimmer of hope. Annals of neurology 2009;66(4):429-32.

Page 20 of 33
Table 1. Baseline characteristics of the patients, according to study group
Characteristic
Fingolimod 0.5 mg
(N=336)
Placebo
(N=487)
Total
(N=823)
Demographics
Sex, n (%)
Male 173 (51.5%) 252 (51.7%) 425 (51.6%)
Female 163 (48.5%) 235 (48.3%) 398 (48.4%)
Age (years)
Median (range) 49.0 (24, 65) 49.0 (27, 65) 49.0 (24, 65)
Mean (SD) 48.5 (8.6) 48.5 (8.3) 48.5 (8.4)
Age distribution (years), n (%)
18–30 6 (1.8%) 4 (0.8%) 10 (1.2%)
31–40 60 (17.9%) 90 (18.5%) 150 (18.2%)
41–50 127 (37.8%) 194 (39.8%) 321 (39.0%)
>50 143 (42.6%) 199 (40.9%) 342 (41.6%)
Race, n (%)
Caucasian 324 (96.4%) 467 (95.9%) 791 (96.1%)
Black 7 (2.1%) 6 (1.2%) 13 (1.6%)
Asian 0 (0%) 4 (0.8%) 4 (0.5%)
Other 5 (1.5%) 10 (2.1%) 15 (1.8%)

Page 21 of 33
Clinical characteristics
Disease duration since diagnosis, years
Mean (SD) 2.80 (2.6) 2.91 (2.3) 2.87 (2.4)
Median (range) 1.98 (0.1, 20.1) 2.35 (0.1, 10.4) 2.14 (0.1, 20.1)
Disease duration since onset of symptoms , years
Mean (SD) 5.8 (2.5) 5.9 (2.4) 5.8 (2.4)
Median (range) 5.4 (1, 20) 5.7 (2, 15) 5.6 (1, 20)
EDSS score
Mean (SD) 4.70 (1.03) 4.66 (1.03) 4.67 (1.03)
Median (range) 4.50 (2.0, 6.5) 4.50 (2.0, 6.5) 4.50 (2.0, 6.5)
25’TWT score (seconds)
Mean (SD) 9.05 (5.61) 9.09 (7.62) 9.08 (6.87)
Median (range) 7.23
(3.7, 41.0)
6.90
(3.1, 117.7)
7.05
(3.1, 117.7)
9-HPT score *(seconds)
Mean (SD) 28.44 (11.47) 28.79 (16.45) 28.65 (14.62)
Median (range)
25.26
(17.2, 115.8)
25.33
(13.9, 218.3)
25.28
(13.9, 218.3)
PASAT 3 score
Mean (SD) 44.3 (13.0) 45.0 (12.5)

Page 22 of 33
Median (range) 48.0 (4, 60) 48.0 (0, 60)
History of DMT use, n (%)
Treatment naïve 272 (81.0%) 372 (76.4%) 644 (78.3%)
Any IFN β 36 (10.7%) 66 (13.6%) 102 (12.4%)
Natalizumab 3 (0.9%) 2 (0.4%) 5 (0.6%)
Glatiramer acetate 26 (7.7%) 33 (6.8%) 59 (7.2%)
Other MS medicines 19 (5.7%) 36 (7.4%) 54 (6.7%)
MRI characteristics
Number of Gd-enhancing lesions
N 336 484 820
Mean (SD) 0.3 (1.10) 0.3 (1.03) 0.3 (1.06)
Median (range) 0 (0, 10) 0 (0, 14) 0 (0, 14)
n, (%) free of Gd+ 290 (86.3) 423 (87.4) 713 (87.0)
Total volume of T2 lesions (mm3)
N 336 485 821
Mean (SD) 9442.7
(10179.7)
10038.2
(13030.9)
9794.5 (11943.5)
Median (range) 6109.5
(145, 52484)
5271.0
(44, 91964)
5705.0
(44, 91964 )
Page 23 of 33
*Dominant hand
Normalised brain volume (cm3)
N 335 483 818
Mean (SD) 1490.9 (86.5) 1491.7 (84.9) 1491.4 (85.5)
Median (range) 1491.0 (1243, 1725) 1498.0 (1206, 1725) 1493.0 (1206, 1725)

Page 24 of 33
Table 2. Efficacy analysis for primary and secondary endpoints
Primary endpoint: 3-month confirmed disability progression (composite)
% progression
(95% CI)*
% risk
reduction
Hazard ratio
(95% CI)†
p-value
Fingolimod 0.5 mg
(n=336)
77.2%
(71.87, 82.51)
5.05% 0.95 (0.80, 1.12) 0.544 Placebo
(n=487)
80.3%
(73.31, 87.25)
3-month confirmed disability progression (EDSS)
% progression
(95% CI)*
% risk
reduction
Hazard ratio
(95% CI)†
p-value
Fingolimod 0.5 mg
(n=336)
54.3%
(47.16, 61.45)
11.99% 0.88 (0.72, 1.08) 0.217 Placebo
(n=487)
58.7%
(53.30, 64.18)
3-month confirmed disability progression (9-HPT)
% progression
(95% CI)*
% risk
reduction
Hazard ratio
(95% CI)†
p-value
Fingolimod 0.5 mg
(n=336)
33.6%
(26.11, 41.08)
6.94% 0.93 (0.71, 1.22) 0.607 Placebo
(n=487)
41.3%
(32.10, 50.55)

Page 25 of 33
3-month confirmed disability progression (25’TWT)
% progression
(95% CI)*
% risk
reduction
Hazard ratio
(95% CI)†
p-value
Fingolimod 0.5 mg
(n=336)
62.9%
(57.10, 68.62) 5.59% 0.94 (0.78, 1.14) 0.546
Placebo
(n=487)
70.0%
(61.78, 78.21)
Percent change in brain volume to Month 36
Adjusted mean
(95% CI)
Adjusted mean difference
(95% CI) ‡
p-value
Fingolimod 0.5 mg
(n=293)
‒1.49
(‒1.64, ‒1.35) 0.04
(‒0.15, 0.23) 0.673
Placebo
(n=421)
‒1.53
(‒1.65, ‒1.41)
Number of new/newly enlarged T2 lesions to Month 36
Adjusted mean
(95% CI)§
Rate reduction
(%)
Rate ratio
(95% CI)§
p-value
Fingolimod 0.5 mg
(n=298)
0.13/year
(0.10, 0.18) 73.3 0.267
(0.185, 0.386) <0.001
Placebo 0.50/year

Page 26 of 33
(n=431) (0.40, 0.61)
Proportion of patients free of new/newly enlarging T2 lesions to end of study
Proportion Odds ratio (95% CI)†† p-value
Fingolimod 0.5 mg
(n=298) 79.9%
2.79 (1.95, 4.00) <0.001 Placebo
(n=431) 60.3%
Number of Gd-enhancing T1 lesions at Month 36
Adjusted mean
(95% CI)§
Rate reduction
(%)
Rate ratio
(95% CI)§
p-value
Fingolimod 0.5 mg
(n=223)
0.05
(0.02, 0.09)
78.3% 0.217
(0.102, 0.463) <0.001
Placebo
(n=320)
0.21
(0.15, 0.30)
Proportion of patients free of Gd-enhancing T1 lesions to end of study
Proportion Odds ratio (95% CI)¶ p-value
Fingolimod 0.5 mg
(n=299) 87.0%
2.15 (1.39, 3.33) <0.001 Placebo
(n=432) 77.5%
CI: confidence interval; n=total number of patients included in the analysis. *Estimated from Kaplan-Meier analysis (for the end of study). †Time to event using a Cox regression model adjusted for treatment, region, baseline EDSS, baseline 25’TWT, baseline 9-HPT for the composite endpoint (baseline EDSS, baseline 9-HPT and baseline 25’TWT for these respective parameters) and age.

Page 27 of 33
‡ Obtained from fitting a random coefficients model with treatment and region as fixed effects; and time, baseline number of Gd-enhancing T1 lesions, baseline T2 volume, and baseline normalised brain volume as continuous covariates. §Obtained from fitting a negative binomial regression model adjusted for treatment, region, baseline number of Gd-enhanced T1 lesions, and age. ††Obtained from fitting a logistic regression model adjusted for treatment, region, baseline number of
Gd-enhanced T1 lesions and age. ¶Obtained from fitting a logistic regression model adjusted for treatment, region, and age.

Page 28 of 33
Table 3. Adverse events, according to study group.
Event
Fingolimod
0.5 mg
(N=336)
Placebo
(N=487)
All events, n (%)
At least one adverse event 324 (96.4%) 463 (95.1%)
Any adverse event leading to discontinuation of study
drug*
52 (15.5%) 36 (7.4%)
Any serious adverse event 84 (25.0%) 117 (24.0%)
Abnormal laboratory value leading to discontinuation
of study drug
27 (8.0%) 6 (1.2%)
Death 1 (0.3%) 2 (0.4%)
Most common AEs (≥5% in any group, preferred term), n (%)
Nasopharyngitis 78 (23.2%) 135 (27.7%)
Headache 56 (16.7%) 77 (15.8%)
Urinary tract infection 50 (14.9%) 79 (16.2%)
Fall 47 (14.0%) 94 (19.3%)
Hypertension 43 (12.8%) 28 (5.7%)
Alanine aminotransferase increased 39 (11.6%) 9 (1.8%)
Back pain 37 (11.0%) 75 (15.4%)
Upper respiratory tract infection 37 (11.0%) 58 (11.9%)

Page 29 of 33
Gamma-glutamyltransferase increased 31 (9.2%) 3 (0.6%)
Arthralgia 30 (8.9%) 49 (10.1%)
Constipation 29 (8.6%) 36 (7.4%)
Influenza 29 (8.6%) 43 (8.8%)
Cough 28 (8.3%) 34 (7.0%)
Fatigue 25 (7.4%) 44 (9.0%)
Nausea 21 (6.3%) 19 (3.9%)
Pain in extremity 21 (6.3%) 36 (7.4%)
Dizziness 19 (5.7%) 29 (6.0%)
Lymphopenia 19 (5.7%) 0 (0.0%)
Pyrexia 18 (5.4%) 21 (4.3%)
Abdominal pain upper 17 (5.1%) 12 (2.5%)
Melanocytic naevus 16 (4.8%) 31 (6.4%)
Depression 15 (4.5%) 39 (8.0%)
Insomnia 12 (3.6%) 29 (6.0%)
Adverse events of special interest, n (%)
Cardiovascular disorders
Bradycardia 5 (1.5%) 1 (0.2%)
Sinus Bradycardia 0 0
AV block first degree 3 (0.9%) 6 (1.2%)
AV block second degree 1 (0.3%) 0
Myocardial infarction 1 (0.3%) 0

Page 30 of 33
Myocardial ischemia 1 (0.3%) 0
Angina pectoris 1 (0.3%) 3 (0.6%)
Hypertensive crisis 0 1 (0.2%)
Secondary hypertension 1 (0.3%) 0
Hypotension 2 (0.6%) 5 (1.0%)
Syncope / Presyncope 7 (2.1%) 9 (1.8%)
Macular Oedema
Macular Oedema 6 (1.8%) 6 (1.2%)
Cystoid ME 1 (0.3%) 1 (0.2%)
Infection and Infestations
Bronchitis 16 (4.8%) 21 (4.3%)
Cystitis/bacterial 9 (2.7%) 19 (3.9%)
Tinea versicolour 6 (1.8%) 8 (1.6%)
Pneumonia/Bronchopneumonia 6 (1.8%) 8 (1.6%)
Rare Infection and Infestations
Meningitis 0 1 (0.2%)
Systemic mycosis 1 (0.3%) 0
Pulmonary sepsis 0 1 (0.2%)
Urosepsis 0 2 (0.4%)
Serratia sepsis 0 1 (0.2%)
Herpes zoster/VZV
Herpes Zoster 10 (3.0%) 9 (1.8%)
Herpes Zoster meningomyelitis 1 (0.3%) 0
Herpes zoster neurological 0 1 (0.2%)
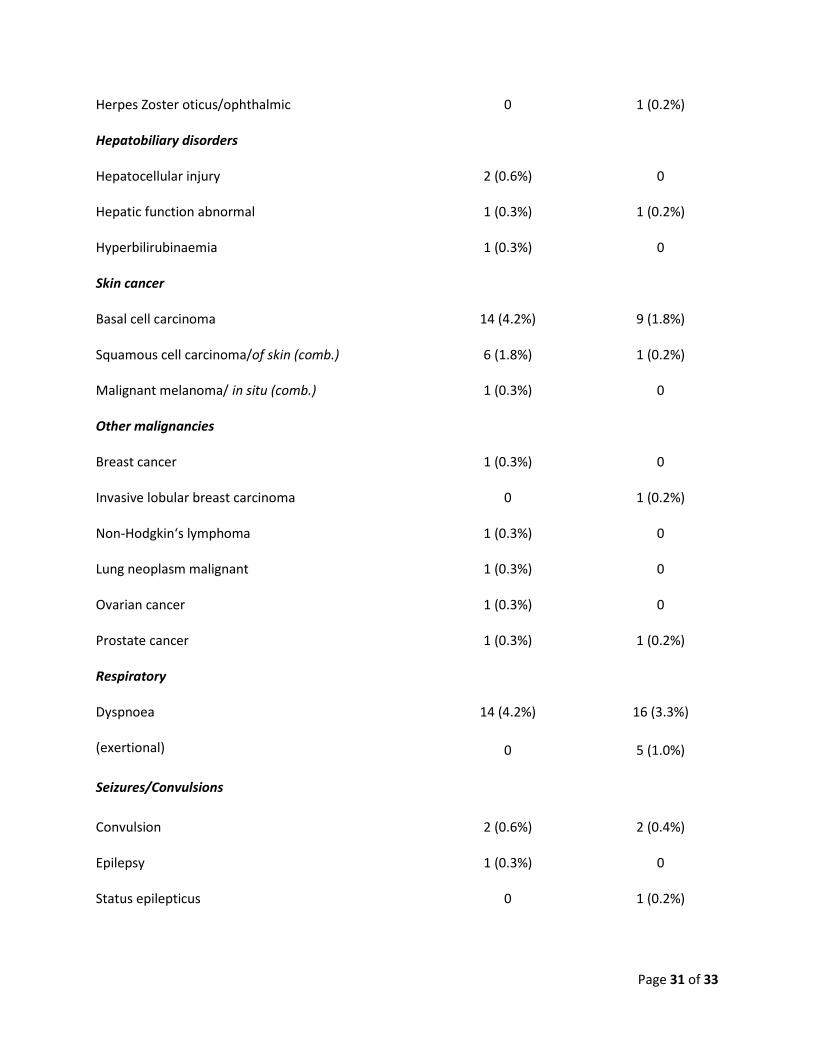
Page 31 of 33
Herpes Zoster oticus/ophthalmic 0 1 (0.2%)
Hepatobiliary disorders
Hepatocellular injury 2 (0.6%) 0
Hepatic function abnormal 1 (0.3%) 1 (0.2%)
Hyperbilirubinaemia 1 (0.3%) 0
Skin cancer
Basal cell carcinoma 14 (4.2%) 9 (1.8%)
Squamous cell carcinoma/of skin (comb.) 6 (1.8%) 1 (0.2%)
Malignant melanoma/ in situ (comb.) 1 (0.3%) 0
Other malignancies
Breast cancer 1 (0.3%) 0
Invasive lobular breast carcinoma 0 1 (0.2%)
Non-Hodgkin‘s lymphoma 1 (0.3%) 0
Lung neoplasm malignant 1 (0.3%) 0
Ovarian cancer 1 (0.3%) 0
Prostate cancer 1 (0.3%) 1 (0.2%)
Respiratory
Dyspnoea 14 (4.2%) 16 (3.3%)
(exertional) 0 5 (1.0%)
Seizures/Convulsions
Convulsion 2 (0.6%) 2 (0.4%)
Epilepsy 1 (0.3%) 0
Status epilepticus 0 1 (0.2%)

Page 32 of 33
Investigations
Blood cholesterol increased 15 (4.5%) 16 (3.3%)
Blood triglycerides increased 9 (2.7%) 9 (1.8%)
Low density lipoprotein increased 7 (2.1%) 3 (0.6%)
Weight increased 5 (1.5%) 1 (0.2%)
Carbon monoxide diffusing capacity decreased 7 (2.1%) 8 (1.6%)
*Any adverse event leading to discontinuation of the study drug includes events occurring in patients whose primary or secondary reason for discontinuing the study drug was an adverse event (including abnormal laboratory findings).

Page 33 of 33
Figure legends
Figure 1. Enrolment, randomization, and follow-up
AE, adverse event
Figure 2. Time to 3-month confirmed disability progression: (A) primary composite endpoint; (B) EDSS
(key secondary endpoint)
HR: hazard ratio; CI: confidence interval