The Labor Market in Romania and Interregional...
19
ISSN 1849-5664 (online)http://researchleap.com/category/international-journal-of-management-science-and-business-administration ISSN 1849-5419 (print) International Journal of Management Science and Business Administration Vol. 2, No. 6, May 2016, pp. 7-25 7 International Journal of Management Science and Business Administration Volume 2, Issue 6, May 2016, Pages 7-25 The Labor Market in Romania and Interregional Disparities Nela Steliac “Babes-Bolyai” University of Cluj-Napoca, Romania Abstract: The decrease of regional disparities represents one of the fundamental objectives of the regional development policy promoted by the EU; furthermore, the waves of enlargement of the EU deepened these differences even more. As a member state of the EU, Romania is actively involved in reducing the economic gaps by applying some regional development strategies and policies. The aim of this paper is to present the results of the labor market analysis from the perspective of the regional gaps, carried out based on some of its specific indicators. The sinuous evolution of the standard deviation for the analyzed indicators (except for the net average salary the standard deviation of which was permanently growing) revealed increase or decrease of the regional disparities for the entire period. However, in comparison to 1998, the regional gaps increased in 2013. The regional poles on the labor market have been as following: Bucharest-Ilfov region for the best values of the studied indicators, and Northeast region and Southwest Oltenia region for the lowest values. Keywords: Labor market, Interregional disparities, Convergence, Divergence 1. Introduction By the Treaty of Rome (Title XVII, article 158) the legal basis of the regional development policy (RDP) was established at the European Economic Community (EEC) level, which aimed at ‘reducing disparities between the development levels of different regions and the shortfall of disadvantaged regions or islands, including rural areas’ (www.europarl.europa.eu, 2015). Until the 1970s the problem of international disparities was among the priorities of the national governments of EEC. Starting from the middle of the 1970s the foundations of RDP were laid down at community level (Lu܊a ܈& Câlea, 2005, p.99). The successive rounds of enlargement of the EU deepened the regional disparities in the Community even more. Currently, the objectives of RDP aim at three different territorial levels: EU level; member state level; territorial unit level which include more states. As a member state of the EU, Romania is also engaged in reducing disparities and strengthening the economic and social cohesion at regional level. If before 1989 interregional disparities had a relatively low level compared to Western European economies (Zaman et al., 2013, p.21) or to other former communist countries from Eastern Europe (Diaconu, 2014, p.77), after the abandonment of the communist regime the disparities deepened. The causes are manifold. Among them we can mention the following: different natural and human resources (O܊il & Părean, 2010, p.267; Goschin et al., 2008, p.82), economic structure of regions (Antonescu, 2012, p.9; Cârnu, 2010, p.77), Romania’s reduced capacity to absorb structural funds for regional development (Zaman et al., 2013, p.21), different regional attraction of capital in general and direct foreign investments in particular (Zaman et al., 2011, p.14; Nistor, 2012, p.742; Zaman et al., 2013, p.21), with negative effects on economic disparities, advantageous geographic location compared to other EU member states for some regions (Diaconu, 2014, p.78), differences in infrastructure (Russu, 2014, p.27), etc. This paper aims at analyzing the labor market in Romania from the perspective of interregional disparities. In this sense, we processed some INSSSE and EUROSTAT statistical data, which relate to this type of market. In their analysis we mainly used the method of dispersion. In order to estimate the level of territorial concentration, we calculated the Gini-Struck concentration coefficient, and in order to identify the types of positive/negative influences of the national, sectorial and regional factors upon the employed population and the number of employees, we applied the Shift-Share method. For this latter method TEMPO-ONLINE regional statistical data on employed population and
Transcript of The Labor Market in Romania and Interregional...
ISSN 1849-5664 (online)http://researchleap.com/category/international-journal-of-management-science-and-business-administration ISSN 1849-5419 (print) International Journal of Management Science and Business Administration Vol. 2, No. 6, May 2016, pp. 7-25
7
International Journal of Management Science and
Business Administration
Volume 2, Issue 6, May 2016, Pages 7-25
The Labor Market in Romania and Interregional Disparities
Nela Steliac
“Babes-Bolyai” University of Cluj-Napoca, Romania
Abstract: The decrease of regional disparities represents one of the fundamental objectives of the regional
development policy promoted by the EU; furthermore, the waves of enlargement of the EU deepened these differences
even more. As a member state of the EU, Romania is actively involved in reducing the economic gaps by applying
some regional development strategies and policies. The aim of this paper is to present the results of the labor market
analysis from the perspective of the regional gaps, carried out based on some of its specific indicators. The sinuous
evolution of the standard deviation for the analyzed indicators (except for the net average salary the standard deviation
of which was permanently growing) revealed increase or decrease of the regional disparities for the entire period.
However, in comparison to 1998, the regional gaps increased in 2013. The regional poles on the labor market have
been as following: Bucharest-Ilfov region for the best values of the studied indicators, and Northeast region and
Southwest Oltenia region for the lowest values.
Keywords: Labor market, Interregional disparities, Convergence, Divergence
1. Introduction By the Treaty of Rome (Title XVII, article 158) the legal basis of the regional development policy (RDP) was
established at the European Economic Community (EEC) level, which aimed at ‘reducing disparities between the
development levels of different regions and the shortfall of disadvantaged regions or islands, including rural areas’ (www.europarl.europa.eu, 2015). Until the 1970s the problem of international disparities was among the priorities of
the national governments of EEC. Starting from the middle of the 1970s the foundations of RDP were laid down at
community level (Lu a & Câlea, 2005, p.99). The successive rounds of enlargement of the EU deepened the regional
disparities in the Community even more. Currently, the objectives of RDP aim at three different territorial levels: EU
level; member state level; territorial unit level which include more states. As a member state of the EU, Romania is also
engaged in reducing disparities and strengthening the economic and social cohesion at regional level.
If before 1989 interregional disparities had a relatively low level compared to Western European economies (Zaman et
al., 2013, p.21) or to other former communist countries from Eastern Europe (Diaconu, 2014, p.77), after the
abandonment of the communist regime the disparities deepened. The causes are manifold. Among them we can
mention the following: different natural and human resources (O il & Părean, 2010, p.267; Goschin et al., 2008, p.82),
economic structure of regions (Antonescu, 2012, p.9; Cârnu, 2010, p.77), Romania’s reduced capacity to absorb
structural funds for regional development (Zaman et al., 2013, p.21), different regional attraction of capital in general
and direct foreign investments in particular (Zaman et al., 2011, p.14; Nistor, 2012, p.742; Zaman et al., 2013, p.21),
with negative effects on economic disparities, advantageous geographic location compared to other EU member states
for some regions (Diaconu, 2014, p.78), differences in infrastructure (Russu, 2014, p.27), etc.
This paper aims at analyzing the labor market in Romania from the perspective of interregional disparities. In this
sense, we processed some INSSSE and EUROSTAT statistical data, which relate to this type of market. In their
analysis we mainly used the method of dispersion. In order to estimate the level of territorial concentration, we
calculated the Gini-Struck concentration coefficient, and in order to identify the types of positive/negative influences of
the national, sectorial and regional factors upon the employed population and the number of employees, we applied the
Shift-Share method. For this latter method TEMPO-ONLINE regional statistical data on employed population and

Nela Steliac
The Labor Market in Romania and Interregional Disparities
8 ISSN 1849-5664 (online)http://researchleap.com/category/international-journal-of-management-science-and-business-administration ISSN 1849-5419 (print) International Journal of Management Science and Business Administration Vol. 2, No. 6, May 2016, pp. 7–25
number of employees were used for the three large economic sectors: agriculture, industry and constructions, and total
services, of the year 2013 in comparison to 1998.
The indicators monitored in the paper were the following: GDP/inhabitant, employed population, number of active
enterprises, number of employees, activity ratio, unemployment ratio, job vacancy ratio, average monthly net salary.
The analyzed period included the years between 1998 and 2013. This period was chosen for two reasons. Firstly, as
1998 is the year when Law 151 on regional development in Romania (replaced since 2004 by Law 315) was adopted,
by which the establishment of development regions was decided. Secondly, a longer period of time can offer a better
and more complete image on the evolution of regional gaps.
2. Short Review of Domestic Literature The problem of economic and social gaps was tackled by a series of specialists. Foreign and domestic literature is
extremely numerous and varied in this kind of papers. The papers published by Romanian authors dealt with this topic
separately or simultaneously at EU level or/and national level. Similarly, some of the authors addressed this subject
matter as a whole at the level of all regions or at the level of 1-2 regions of the country. The period to which reference
is made in the majority of domestic papers is the period following the years 2007/2008 and less the previous period.
In the following report we will mention only a few of those which caught our attention in a special way, without any
claim to cover all the papers published lately in the field.
For instance, Goschin et al. (2008) built a composite index for the analysis of interregional disparities taking into
account the following: GDP/inhabitants, net monthly average income and unemployment rate. In his paper, Pintilescu
(2011) explains the regional disparities in Romania for the period 1990-2008 and identifies the economic profile of the
regions. The same scientific approach is adopted by Jaba (2009), that is, the identification of regional profile takes into
consideration statistical data from 2005. In his paper, Dimian (2012) supports that between the imbalances of the labor
market and regional disparities there is a biunique relation. He analyses the way in which the imbalances of the labor
market influence the future development of the regions, while the period studied was 2000-2008.
According to Russu (2014), regional disparities are given as well as by the existing lacunae in different fields: energy,
transport and communication infrastructure, education, science and technology, tourist attraction etc. Barabaş (2014)
manages to determine the defining characteristics of the Romanian counties, classifies them depending on their
economic performances and uses indicators such as GDP, population employment and labor force rate, average salary,
unemployment expenses.
Simionescu (2014) carries out the analysis of beta convergence for the period 2001-2012 in order to highlight regional
disparities within EU28. In European as well as national context the problem of regional disparities is dealt with by
Antonescu (2012) and Chirilă & Chirilă (2014). Antonescu carries out the analysis of regional disparities with the
method of dispersion and Lorenz-Gini curve for the period 1999-2008 using a series of economic, demographic and
social indicators. Chirilă & Chirilă study (for the end of 2006 and 2009) the evolution of regional disparities based on
multivariable analysis of data using as variables: incomes of private households, population employment rate, human
resources, GDP and unemployment rate.
Moisescu (2015) studied the degree of regional convergence/divergence of Romania for the period 2000-2010 is by
means of sigma convergence and beta convergence. Stanef (2014) analysed a more current period (2007-2010) of
interregional disparities by for urban and rural environment. Comparative analyses of interregional disparities between
two regions were carried out by authors such as Diaconu (2014) and Rotaru (2014). Diaconu focuses his attention on
NE and W regions for the period 2007-2012. Rotaru carries out an empirical study on factors influencing employment
rate of the same regions. He underlines that there are significant discrepancies between the two regions in terms of
GDP/inhabitant, income and employment rate. He states that the productivity of work is directly related to employment
rate while household income is positively correlated with the employment level of regions.
Nela Steliac
The Labor Market in Romania and Interregional Disparities
9 ISSN 1849-5664 (online)http://researchleap.com/category/international-journal-of-management-science-and-business-administration ISSN 1849-5419 (print) International Journal of Management Science and Business Administration Vol. 2, No. 6, May 2016, pp. 7–25
3. A General View on Interregional Disparities in Terms of
GDP/Inhabitant The most relevant indicator in estimating the interregional disparities is GDP per capita. If we relate to the EU27
average, then we must say that only Bucharest-Ilfov (BI) region managed to rank above the average starting from 2008,
reaching values up to +22% in 2011. All other regions registered values far below the European average, 6 out of 8
being ranked, from this point of view, among the last 20 regions within EU in 2008 (Albu et al., 2011, p.27). The BI
region is followed at a significant distance, however, by West region, with values up to 54% of the European average.
The lowest GDP/inhabitants. Values in PPS compared to the average EU27 were registered in 2007 in the NE region,
26% of the average.
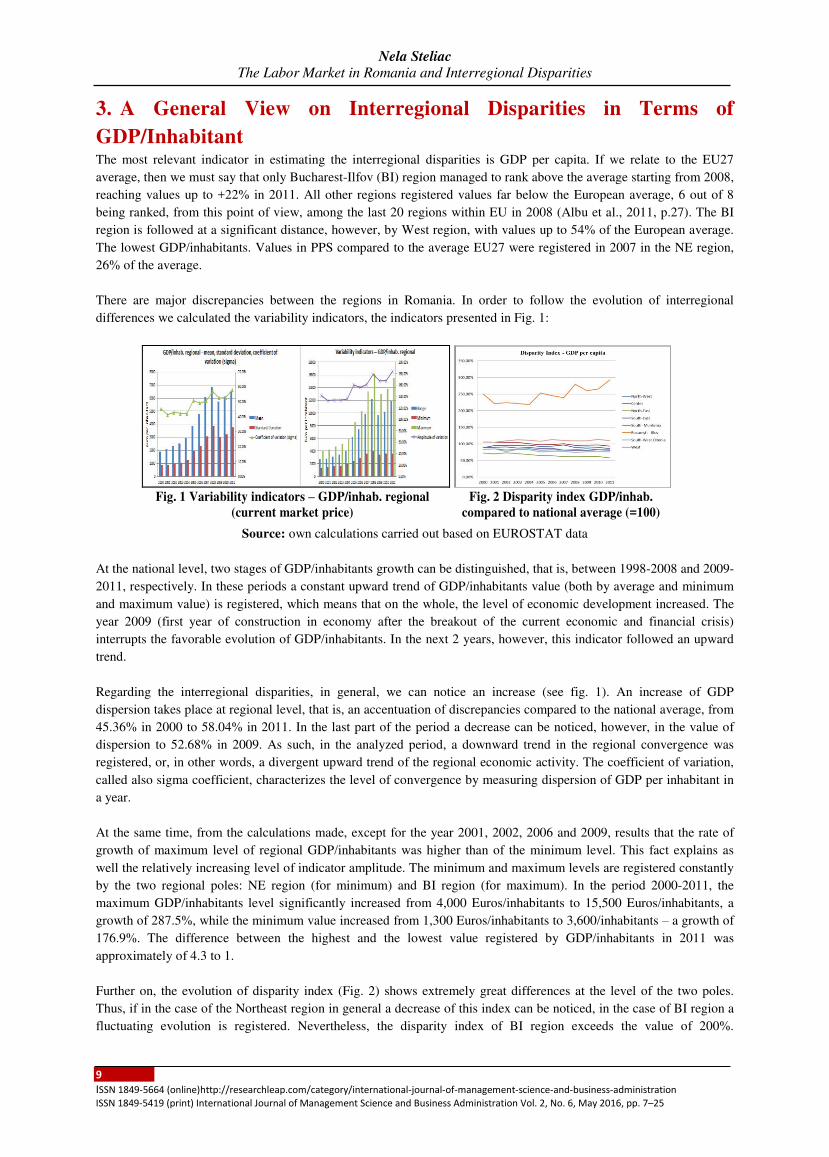
There are major discrepancies between the regions in Romania. In order to follow the evolution of interregional
differences we calculated the variability indicators, the indicators presented in Fig. 1:
Source: own calculations carried out based on EUROSTAT data
At the national level, two stages of GDP/inhabitants growth can be distinguished, that is, between 1998-2008 and 2009-
2011, respectively. In these periods a constant upward trend of GDP/inhabitants value (both by average and minimum
and maximum value) is registered, which means that on the whole, the level of economic development increased. The
year 2009 (first year of construction in economy after the breakout of the current economic and financial crisis)
interrupts the favorable evolution of GDP/inhabitants. In the next 2 years, however, this indicator followed an upward
trend.
Regarding the interregional disparities, in general, we can notice an increase (see fig. 1). An increase of GDP
dispersion takes place at regional level, that is, an accentuation of discrepancies compared to the national average, from
45.36% in 2000 to 58.04% in 2011. In the last part of the period a decrease can be noticed, however, in the value of
dispersion to 52.68% in 2009. As such, in the analyzed period, a downward trend in the regional convergence was
registered, or, in other words, a divergent upward trend of the regional economic activity. The coefficient of variation,
called also sigma coefficient, characterizes the level of convergence by measuring dispersion of GDP per inhabitant in
a year.
At the same time, from the calculations made, except for the year 2001, 2002, 2006 and 2009, results that the rate of
growth of maximum level of regional GDP/inhabitants was higher than of the minimum level. This fact explains as
well the relatively increasing level of indicator amplitude. The minimum and maximum levels are registered constantly
by the two regional poles: NE region (for minimum) and BI region (for maximum). In the period 2000-2011, the
maximum GDP/inhabitants level significantly increased from 4,000 Euros/inhabitants to 15,500 Euros/inhabitants, a
growth of 287.5%, while the minimum value increased from 1,300 Euros/inhabitants to 3,600/inhabitants – a growth of
176.9%. The difference between the highest and the lowest value registered by GDP/inhabitants in 2011 was
approximately of 4.3 to 1.
Further on, the evolution of disparity index (Fig. 2) shows extremely great differences at the level of the two poles.
Thus, if in the case of the Northeast region in general a decrease of this index can be noticed, in the case of BI region a
fluctuating evolution is registered. Nevertheless, the disparity index of BI region exceeds the value of 200%.
Fig. 1 Variability indicators – GDP/inhab. regional
(current market price) Fig. 2 Disparity index GDP/inhab.
compared to national average (=100)
Nela Steliac
The Labor Market in Romania and Interregional Disparities
10 ISSN 1849-5664 (online)http://researchleap.com/category/international-journal-of-management-science-and-business-administration ISSN 1849-5419 (print) International Journal of Management Science and Business Administration Vol. 2, No. 6, May 2016, pp. 7–25
Noteworthy is also the decrease of the disparity index compared to the first year of the period studied (except for the W
and BI regions).
4. The Labor Market in Romania – Convergence or Divergence The 1990s bring significant changes in the volume and structure of the main indicators of the labor market in Romania
(Stanef, 2014, p. 62). In order to follow these changes, which can highlight regional convergence/divergence, in the
following we analyses the following indicators:
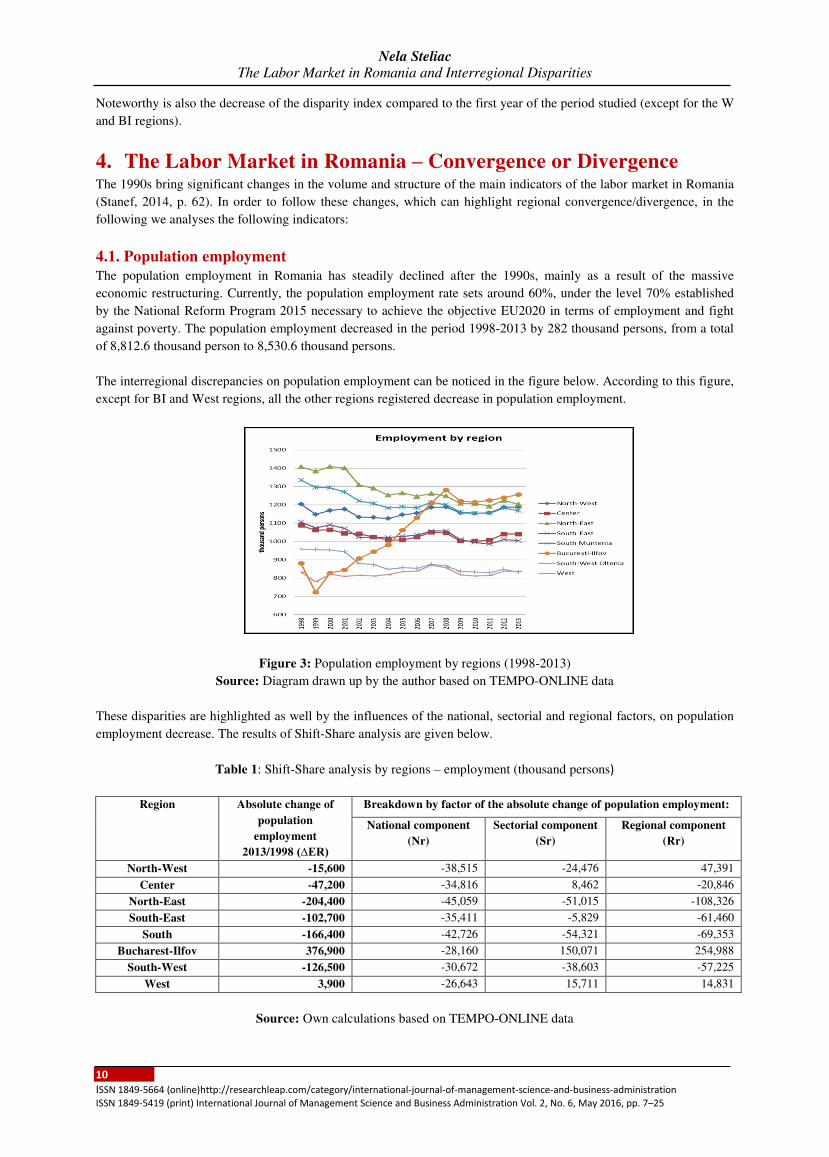
4.1. Population employment The population employment in Romania has steadily declined after the 1990s, mainly as a result of the massive
economic restructuring. Currently, the population employment rate sets around 60%, under the level 70% established
by the National Reform Program 2015 necessary to achieve the objective EU2020 in terms of employment and fight
against poverty. The population employment decreased in the period 1998-2013 by 282 thousand persons, from a total
of 8,812.6 thousand person to 8,530.6 thousand persons.
The interregional discrepancies on population employment can be noticed in the figure below. According to this figure,
except for BI and West regions, all the other regions registered decrease in population employment.
Figure 3: Population employment by regions (1998-2013)
Source: Diagram drawn up by the author based on TEMPO-ONLINE data
These disparities are highlighted as well by the influences of the national, sectorial and regional factors, on population
employment decrease. The results of Shift-Share analysis are given below.
Table 1: Shift-Share analysis by regions – employment (thousand persons)
Region Absolute change of
population
employment
2013/1998 (∆ER)
Breakdown by factor of the absolute change of population employment:
National component
(Nr)
Sectorial component
(Sr)
Regional component
(Rr)
North-West -15,600 -38,515 -24,476 47,391
Center -47,200 -34,816 8,462 -20,846
North-East -204,400 -45,059 -51,015 -108,326
South-East -102,700 -35,411 -5,829 -61,460
South -166,400 -42,726 -54,321 -69,353
Bucharest-Ilfov 376,900 -28,160 150,071 254,988
South-West -126,500 -30,672 -38,603 -57,225
West 3,900 -26,643 15,711 14,831
Source: Own calculations based on TEMPO-ONLINE data
Nela Steliac
The Labor Market in Romania and Interregional Disparities
11 ISSN 1849-5664 (online)http://researchleap.com/category/international-journal-of-management-science-and-business-administration ISSN 1849-5419 (print) International Journal of Management Science and Business Administration Vol. 2, No. 6, May 2016, pp. 7–25
The data presented in the table above indicate a decrease in population employment in 2013 compared to 1998 in the
majority of the regions. Only Bucharest-Ilfov and West regions make an exception. The highest decrease was
registered in Northeast region (the poorest region in the country), over 204 thousand people, and the lowest decrease in
the Northwest region, over 15 thousand individuals. BI region has the highest growth rate, with over 376 thousand
people. The national component affected negatively the absolute change of population employment in the period
2013/1998 for all of 8 regions. The sectorial component determined decrease in employment in Northwest, Northeast,
Southeast, South, Southwest regions and growth for the other three regions (Centre, Bucharest-Ilfov, West). The last
three regions are specialized in branches of economy with rapid growth, and this is because the value of Sr is positive.
The highest positive sectorial influence can be noticed in the case of BI region. The regional component determined
decrease in population employment for C, NE, SE, S, SW regions. NW, BI and W regions have a positive regional
component combined either with a negative sectorial component (NW region), or a positive sectorial component (BI
and W regions).
Interregional disparities exist as well in terms of population employment structure in the three big sectors: agriculture,
industry and constructions, and services. From this point of view important changes in this structure (see Table 2) can
be noticed. The first remark would be related to the reconfiguration of the economic profile of regions from the
perspective of population employment. In this sense, a reorientation of the population employment from agricultural
sector, predominantly in 1998 in the majority of the regions (except for Central and BI regions) can be noticed towards
the services sector. From this point of view the percentage decrease of population employment in the agricultural sector
is significant for some regions. Thus, NW region, predominantly agricultural, becomes a region with population
predominantly employed in the services sector. The same happens in the case of SE and West regions. The Central
region is transformed from an industrial area into an area dominated by services. However, NE and SW regions still
remain regions where more than 1/3 of population employment belongs to agriculture. As such, NE, SW regions and as
well BI region continue to keep the economic profile. In BI region the majority of the population employment can be
found in the services sector, a sector which attracts in 2013 a greater part of the population (over 71% in 2013
compared to approximately 55% in 1998).
The second conclusion is related, on one hand, to the downward trend of population employment in the agricultural and
constructions sector, and on the other hand, to the upward trend of population employment in the services sector.
At BI level both the greatest decrease of population employment (in industry and constructions: -13.52%) and the
greatest increase (services sector: 16.25%) were registered.
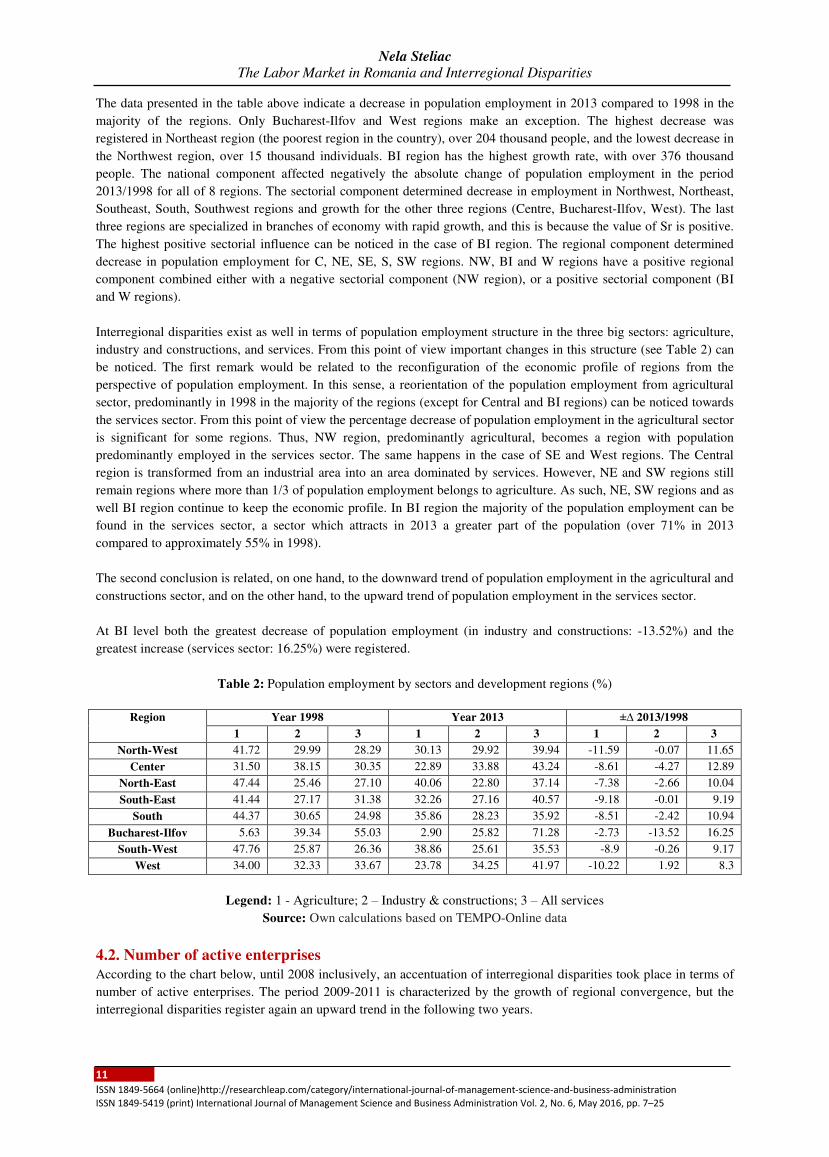
Table 2: Population employment by sectors and development regions (%)
Region Year 1998 Year 2013 ±∆ 2013/1998
1 2 3 1 2 3 1 2 3
North-West 41.72 29.99 28.29 30.13 29.92 39.94 -11.59 -0.07 11.65
Center 31.50 38.15 30.35 22.89 33.88 43.24 -8.61 -4.27 12.89
North-East 47.44 25.46 27.10 40.06 22.80 37.14 -7.38 -2.66 10.04
South-East 41.44 27.17 31.38 32.26 27.16 40.57 -9.18 -0.01 9.19
South 44.37 30.65 24.98 35.86 28.23 35.92 -8.51 -2.42 10.94
Bucharest-Ilfov 5.63 39.34 55.03 2.90 25.82 71.28 -2.73 -13.52 16.25
South-West 47.76 25.87 26.36 38.86 25.61 35.53 -8.9 -0.26 9.17
West 34.00 32.33 33.67 23.78 34.25 41.97 -10.22 1.92 8.3
Legend: 1 - Agriculture; 2 – Industry & constructions; 3 – All services
Source: Own calculations based on TEMPO-Online data
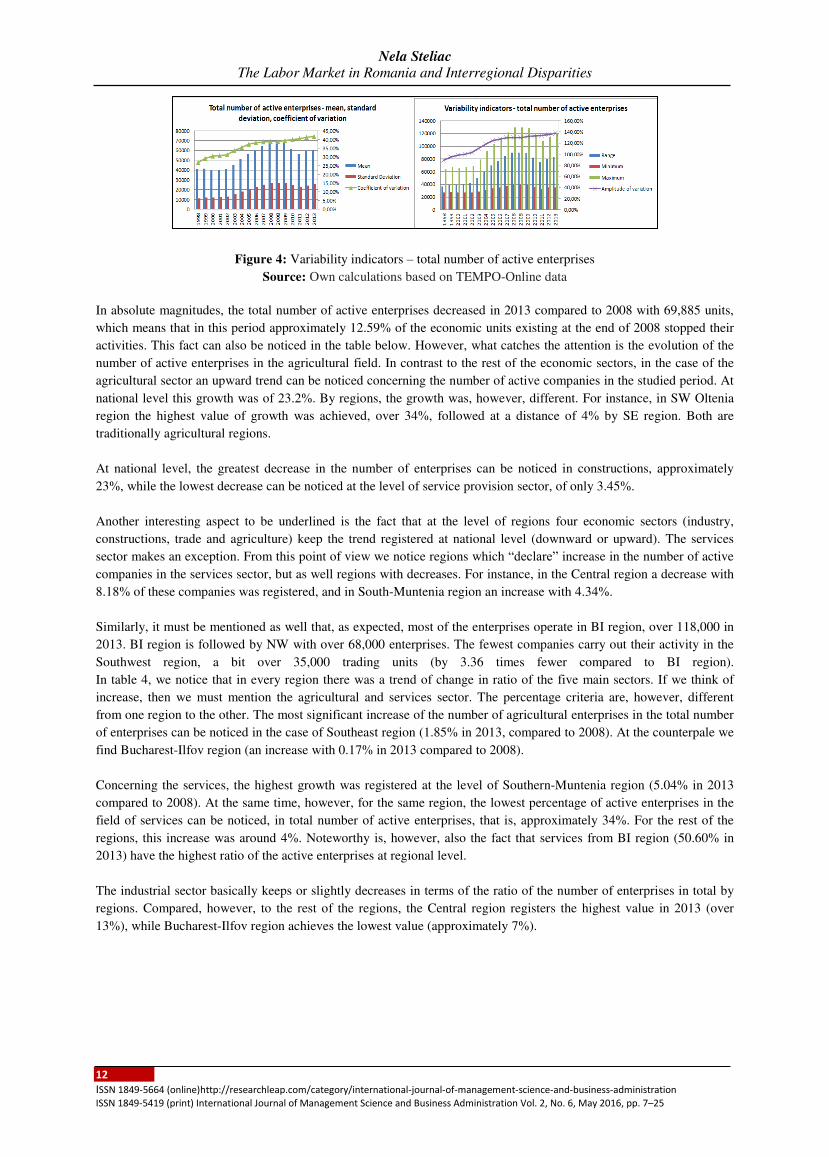
4.2. Number of active enterprises According to the chart below, until 2008 inclusively, an accentuation of interregional disparities took place in terms of
number of active enterprises. The period 2009-2011 is characterized by the growth of regional convergence, but the
interregional disparities register again an upward trend in the following two years.
Nela Steliac
The Labor Market in Romania and Interregional Disparities
12 ISSN 1849-5664 (online)http://researchleap.com/category/international-journal-of-management-science-and-business-administration ISSN 1849-5419 (print) International Journal of Management Science and Business Administration Vol. 2, No. 6, May 2016, pp. 7–25
Figure 4: Variability indicators – total number of active enterprises
Source: Own calculations based on TEMPO-Online data
In absolute magnitudes, the total number of active enterprises decreased in 2013 compared to 2008 with 69,885 units,
which means that in this period approximately 12.59% of the economic units existing at the end of 2008 stopped their
activities. This fact can also be noticed in the table below. However, what catches the attention is the evolution of the
number of active enterprises in the agricultural field. In contrast to the rest of the economic sectors, in the case of the
agricultural sector an upward trend can be noticed concerning the number of active companies in the studied period. At
national level this growth was of 23.2%. By regions, the growth was, however, different. For instance, in SW Oltenia
region the highest value of growth was achieved, over 34%, followed at a distance of 4% by SE region. Both are
traditionally agricultural regions.
At national level, the greatest decrease in the number of enterprises can be noticed in constructions, approximately
23%, while the lowest decrease can be noticed at the level of service provision sector, of only 3.45%.
Another interesting aspect to be underlined is the fact that at the level of regions four economic sectors (industry,
constructions, trade and agriculture) keep the trend registered at national level (downward or upward). The services
sector makes an exception. From this point of view we notice regions which “declare” increase in the number of active
companies in the services sector, but as well regions with decreases. For instance, in the Central region a decrease with
8.18% of these companies was registered, and in South-Muntenia region an increase with 4.34%.
Similarly, it must be mentioned as well that, as expected, most of the enterprises operate in BI region, over 118,000 in
2013. BI region is followed by NW with over 68,000 enterprises. The fewest companies carry out their activity in the
Southwest region, a bit over 35,000 trading units (by 3.36 times fewer compared to BI region).
In table 4, we notice that in every region there was a trend of change in ratio of the five main sectors. If we think of
increase, then we must mention the agricultural and services sector. The percentage criteria are, however, different
from one region to the other. The most significant increase of the number of agricultural enterprises in the total number
of enterprises can be noticed in the case of Southeast region (1.85% in 2013, compared to 2008). At the counterpale we
find Bucharest-Ilfov region (an increase with 0.17% in 2013 compared to 2008).
Concerning the services, the highest growth was registered at the level of Southern-Muntenia region (5.04% in 2013
compared to 2008). At the same time, however, for the same region, the lowest percentage of active enterprises in the
field of services can be noticed, in total number of active enterprises, that is, approximately 34%. For the rest of the
regions, this increase was around 4%. Noteworthy is, however, also the fact that services from BI region (50.60% in
2013) have the highest ratio of the active enterprises at regional level.
The industrial sector basically keeps or slightly decreases in terms of the ratio of the number of enterprises in total by
regions. Compared, however, to the rest of the regions, the Central region registers the highest value in 2013 (over
13%), while Bucharest-Ilfov region achieves the lowest value (approximately 7%).
Nela Steliac
The Labor Market in Romania and Interregional Disparities
13 ISSN 1849-5664 (online)http://researchleap.com/category/international-journal-of-management-science-and-business-administration ISSN 1849-5419 (print) International Journal of Management Science and Business Administration Vol. 2, No. 6, May 2016, pp. 7–25
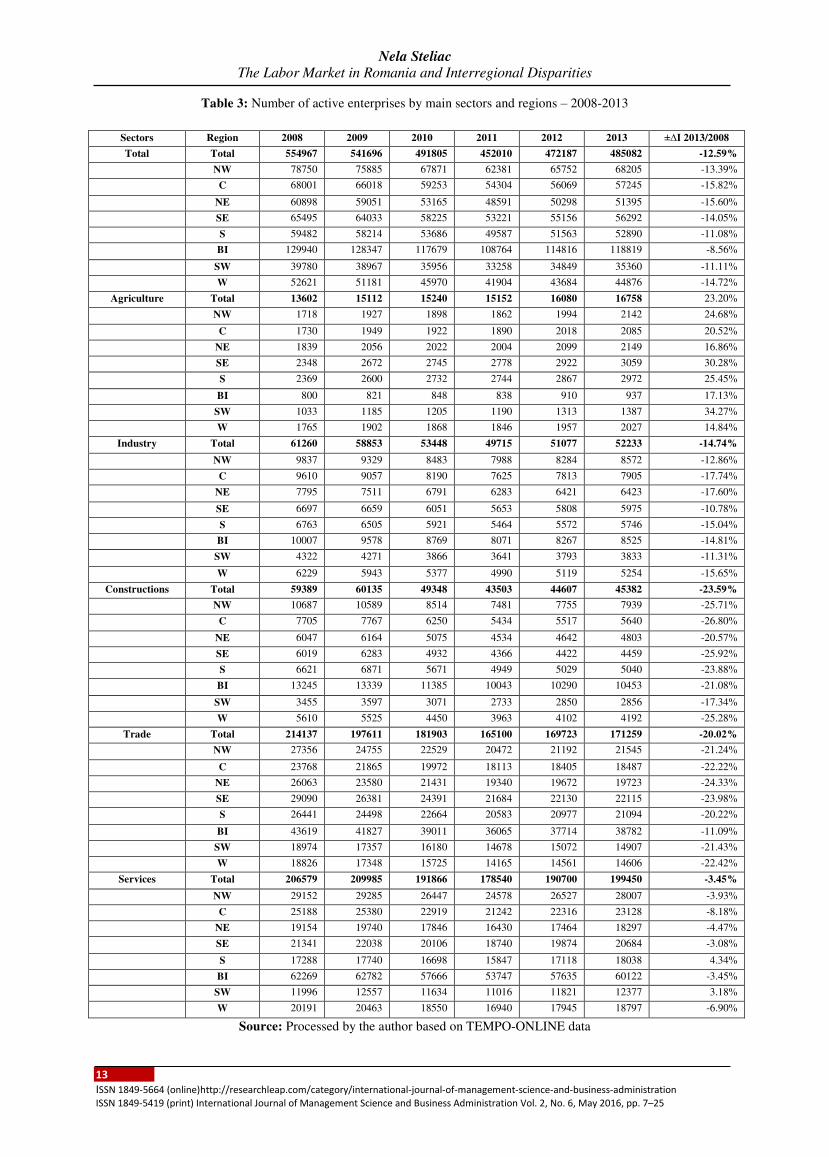
Table 3: Number of active enterprises by main sectors and regions – 2008-2013
Sectors Region 2008 2009 2010 2011 2012 2013 ±∆I 2013/2008
Total Total 554967 541696 491805 452010 472187 485082 -12.59%
NW 78750 75885 67871 62381 65752 68205 -13.39%
C 68001 66018 59253 54304 56069 57245 -15.82%
NE 60898 59051 53165 48591 50298 51395 -15.60%
SE 65495 64033 58225 53221 55156 56292 -14.05%
S 59482 58214 53686 49587 51563 52890 -11.08%
BI 129940 128347 117679 108764 114816 118819 -8.56%
SW 39780 38967 35956 33258 34849 35360 -11.11%
W 52621 51181 45970 41904 43684 44876 -14.72%
Agriculture Total 13602 15112 15240 15152 16080 16758 23.20%
NW 1718 1927 1898 1862 1994 2142 24.68%
C 1730 1949 1922 1890 2018 2085 20.52%
NE 1839 2056 2022 2004 2099 2149 16.86%
SE 2348 2672 2745 2778 2922 3059 30.28%
S 2369 2600 2732 2744 2867 2972 25.45%
BI 800 821 848 838 910 937 17.13%
SW 1033 1185 1205 1190 1313 1387 34.27%
W 1765 1902 1868 1846 1957 2027 14.84%
Industry Total 61260 58853 53448 49715 51077 52233 -14.74%
NW 9837 9329 8483 7988 8284 8572 -12.86%
C 9610 9057 8190 7625 7813 7905 -17.74%
NE 7795 7511 6791 6283 6421 6423 -17.60%
SE 6697 6659 6051 5653 5808 5975 -10.78%
S 6763 6505 5921 5464 5572 5746 -15.04%
BI 10007 9578 8769 8071 8267 8525 -14.81%
SW 4322 4271 3866 3641 3793 3833 -11.31%
W 6229 5943 5377 4990 5119 5254 -15.65%
Constructions Total 59389 60135 49348 43503 44607 45382 -23.59%
NW 10687 10589 8514 7481 7755 7939 -25.71%
C 7705 7767 6250 5434 5517 5640 -26.80%
NE 6047 6164 5075 4534 4642 4803 -20.57%
SE 6019 6283 4932 4366 4422 4459 -25.92%
S 6621 6871 5671 4949 5029 5040 -23.88%
BI 13245 13339 11385 10043 10290 10453 -21.08%
SW 3455 3597 3071 2733 2850 2856 -17.34%
W 5610 5525 4450 3963 4102 4192 -25.28%
Trade Total 214137 197611 181903 165100 169723 171259 -20.02%
NW 27356 24755 22529 20472 21192 21545 -21.24%
C 23768 21865 19972 18113 18405 18487 -22.22%
NE 26063 23580 21431 19340 19672 19723 -24.33%
SE 29090 26381 24391 21684 22130 22115 -23.98%
S 26441 24498 22664 20583 20977 21094 -20.22%
BI 43619 41827 39011 36065 37714 38782 -11.09%
SW 18974 17357 16180 14678 15072 14907 -21.43%
W 18826 17348 15725 14165 14561 14606 -22.42%
Services Total 206579 209985 191866 178540 190700 199450 -3.45%
NW 29152 29285 26447 24578 26527 28007 -3.93%
C 25188 25380 22919 21242 22316 23128 -8.18%
NE 19154 19740 17846 16430 17464 18297 -4.47%
SE 21341 22038 20106 18740 19874 20684 -3.08%
S 17288 17740 16698 15847 17118 18038 4.34%
BI 62269 62782 57666 53747 57635 60122 -3.45%
SW 11996 12557 11634 11016 11821 12377 3.18%
W 20191 20463 18550 16940 17945 18797 -6.90%
Source: Processed by the author based on TEMPO-ONLINE data
Nela Steliac
The Labor Market in Romania and Interregional Disparities
14 ISSN 1849-5664 (online)http://researchleap.com/category/international-journal-of-management-science-and-business-administration ISSN 1849-5419 (print) International Journal of Management Science and Business Administration Vol. 2, No. 6, May 2016, pp. 7–25
The constructions and trade registered decrease in value of the ratio of companies which operate in the regions.
Explanations are given mainly by the dramatic decrease of the population’s income in the immediate period following
the outbreak of the economic and financial crisis. Practically, in the period 2008-2013 a reorientation of the economic
operators towards the services and agricultural sector took place.
In the Southeast region, in 2013, only 7.92% of the companies operated in the constructions sector, in contrast to
11.64% in the Northwest region. The South Oltenia region shows the highest figure of the trade sector (42.16% in
2013), while the Northwest region the lowest value (31.59% in 2013).
Table 4: Active enterprises by sectors and regions 2008-2013 (% in total region)
Legend: 1 – Agriculture; 2 – Industry; 3 – Constructions; 4 – Trade; 5 – Services
Source: Own calculations based on TEMPO-ONLINE data
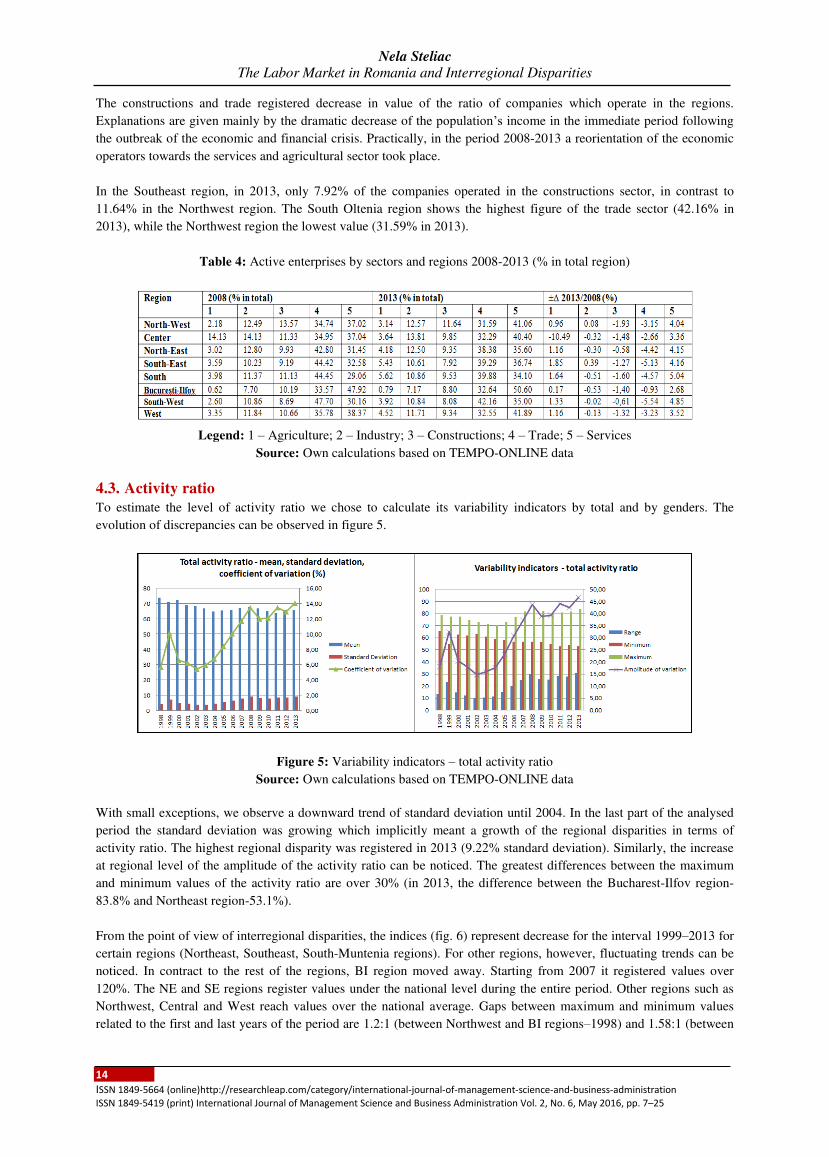
4.3. Activity ratio To estimate the level of activity ratio we chose to calculate its variability indicators by total and by genders. The
evolution of discrepancies can be observed in figure 5.
Figure 5: Variability indicators – total activity ratio
Source: Own calculations based on TEMPO-ONLINE data
With small exceptions, we observe a downward trend of standard deviation until 2004. In the last part of the analysed
period the standard deviation was growing which implicitly meant a growth of the regional disparities in terms of
activity ratio. The highest regional disparity was registered in 2013 (9.22% standard deviation). Similarly, the increase
at regional level of the amplitude of the activity ratio can be noticed. The greatest differences between the maximum
and minimum values of the activity ratio are over 30% (in 2013, the difference between the Bucharest-Ilfov region-
83.8% and Northeast region-53.1%).
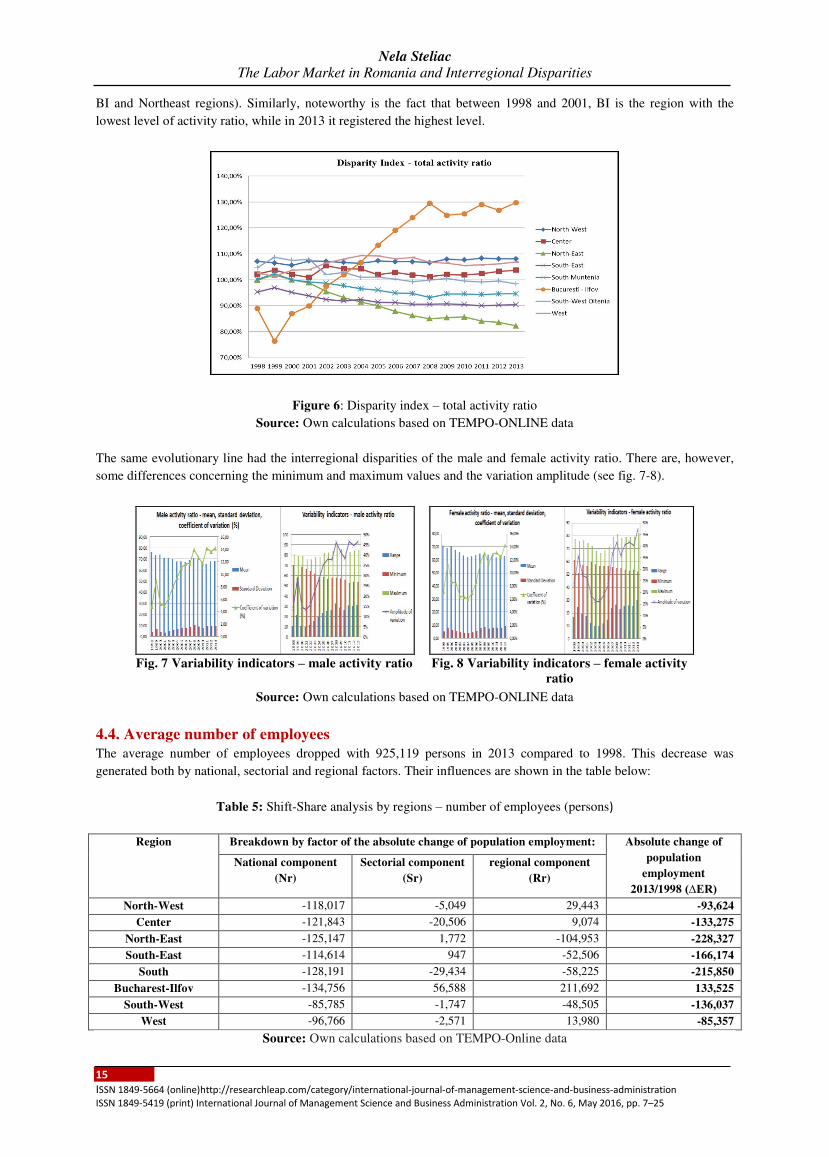
From the point of view of interregional disparities, the indices (fig. 6) represent decrease for the interval 1999–2013 for
certain regions (Northeast, Southeast, South-Muntenia regions). For other regions, however, fluctuating trends can be
noticed. In contract to the rest of the regions, BI region moved away. Starting from 2007 it registered values over
120%. The NE and SE regions register values under the national level during the entire period. Other regions such as
Northwest, Central and West reach values over the national average. Gaps between maximum and minimum values
related to the first and last years of the period are 1.2:1 (between Northwest and BI regions–1998) and 1.58:1 (between
Nela Steliac
The Labor Market in Romania and Interregional Disparities
15 ISSN 1849-5664 (online)http://researchleap.com/category/international-journal-of-management-science-and-business-administration ISSN 1849-5419 (print) International Journal of Management Science and Business Administration Vol. 2, No. 6, May 2016, pp. 7–25
BI and Northeast regions). Similarly, noteworthy is the fact that between 1998 and 2001, BI is the region with the
lowest level of activity ratio, while in 2013 it registered the highest level.
Figure 6: Disparity index – total activity ratio
Source: Own calculations based on TEMPO-ONLINE data
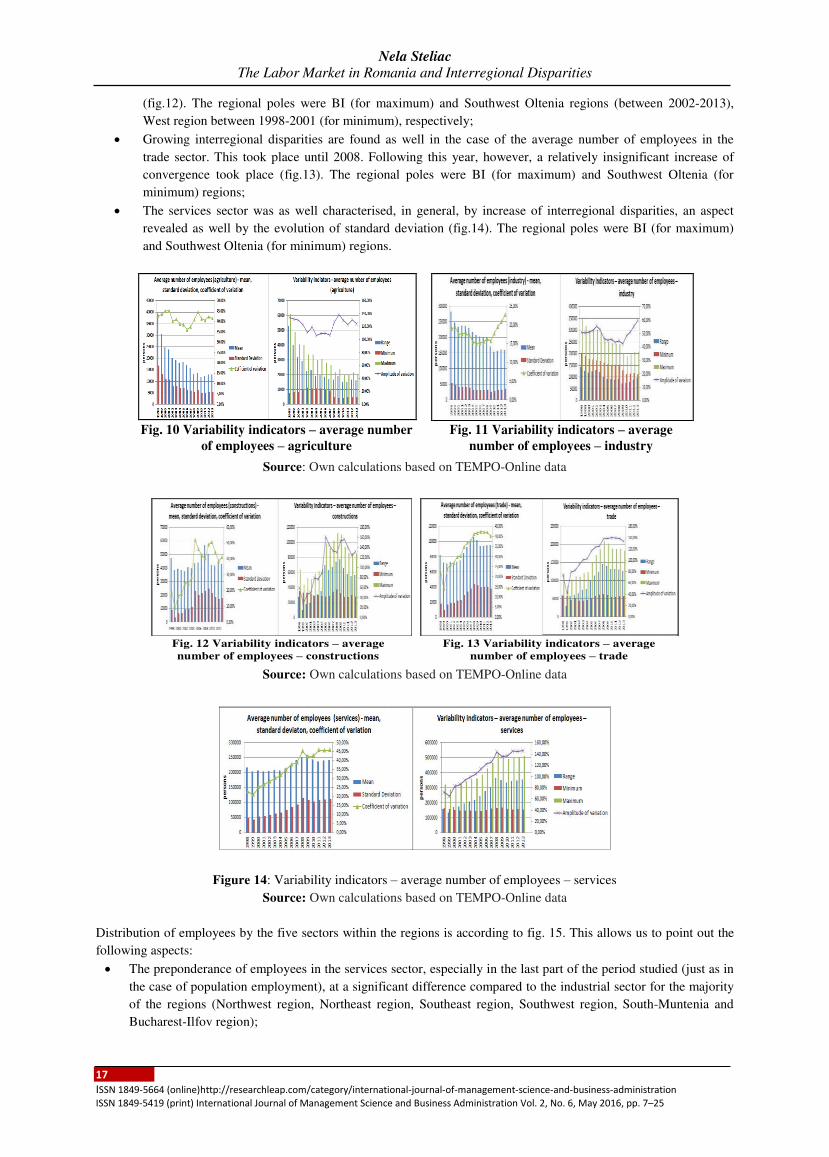
The same evolutionary line had the interregional disparities of the male and female activity ratio. There are, however,
some differences concerning the minimum and maximum values and the variation amplitude (see fig. 7-8).
Source: Own calculations based on TEMPO-ONLINE data
4.4. Average number of employees The average number of employees dropped with 925,119 persons in 2013 compared to 1998. This decrease was
generated both by national, sectorial and regional factors. Their influences are shown in the table below:
Table 5: Shift-Share analysis by regions – number of employees (persons)
Region Breakdown by factor of the absolute change of population employment: Absolute change of
population
employment
2013/1998 (∆ER)
National component
(Nr)
Sectorial component
(Sr)
regional component
(Rr)
North-West -118,017 -5,049 29,443 -93,624
Center -121,843 -20,506 9,074 -133,275
North-East -125,147 1,772 -104,953 -228,327
South-East -114,614 947 -52,506 -166,174
South -128,191 -29,434 -58,225 -215,850
Bucharest-Ilfov -134,756 56,588 211,692 133,525
South-West -85,785 -1,747 -48,505 -136,037
West -96,766 -2,571 13,980 -85,357
Source: Own calculations based on TEMPO-Online data
Fig. 7 Variability indicators – male activity ratio Fig. 8 Variability indicators – female activity
ratio

Nela Steliac
The Labor Market in Romania and Interregional Disparities
16 ISSN 1849-5664 (online)http://researchleap.com/category/international-journal-of-management-science-and-business-administration ISSN 1849-5419 (print) International Journal of Management Science and Business Administration Vol. 2, No. 6, May 2016, pp. 7–25
According to the data included in the table above, except for BI region, decrease in the number of employment took
place all over the places. The highest decrease was registered in the case of NE region, over 228 thousand persons,
while the lowest decrease in West region, 85,357 persons. The national component affected negatively the number of
employees in every region. The most significant decrease was registered in BI region. The sectorial component
influenced negatively five regions (NW, C, S, SW and W), while NE, SE and BI regions registered increase of
employees as a result of the influence of sectorial factors. NW, C, BI and W regions show regional advantages thus
determining growth in the number of employees. As is can be noticed as well in the results of the Shift-Share analysis,
BI region significantly moves away both in terms of sector and region.
The interregional disparities in terms of average number of employees can be noted based as well on variability
indicators.
Figure 9: Variability indicators – total number of employees
Source: Own calculations based on TEMPO-Online data
The chart above indicates the fluctuating trend of the indicator (both by the average value and by the maximum and
minimum value). In general, between 1998 and 2008 the standard deviation was increasing, which meant a downward
trend of regional convergence in terms of number of employees. After 2008, a relatively insignificant growth of
convergence was registered. The regional poles in terms of number of employees were Southwest Oltenia (the lowest
number) and BI (the highest number) region. The gaps between these ranged from 1.33 in 1999 (the lowest) to 2.53
(the highest). The evolution of these gaps was increasing.
Based on the analysis of the variability indicator of the average number of employees by the five sectors (agriculture,
industry, constructions, trade and services) we can state that:
x Southwest Oltenia region registered the lowest values of this indicator in the entire period for the sectors:
industry, trade and services. This is, in fact, the region with the lowest total number of employees;
x BI region has the highest number of employees in the fields: constructions, trade and services. At the same
time this is the region with the lowest number of employees in the agricultural sector. Such a situation can be
explained as a result of the extremely reduced agricultural land compared to other regions;
x South Muntenia region, a region considered as well being predominantly agricultural, registered the highest
number of employees in the field of agriculture;
x Regarding the interregional disparities of the number of employees by sectors the following aspects must also
be mentioned:
x In agriculture, with small exceptions (2009, 2012), the regional disparities gradually decreased (increase of
regional convergence took place (see fig. 10). The regional poles were South Muntenia (for maximum) and BI
(for minimum) regions;
x The phenomenon of increase of regional convergence can be noted as well in the case of the industrial sector,
however, in some intervals of the studied period. The standard deviation decreases between 1998 and 2000,
2001-2006, 2008-2009. For the rest of the years analysed, a downward trend of the regional convergence was
found (increase of disparities) (fig.11). The regional poles were the Central (for maximum) and Southwest
Oltenia (for minimum) regions;
x In the case of constructions, the periods between 1999-2005, and 2006-2009, respectively, are characterized
by growing regional disparities. The regional convergence increases, however, between 2009 and 2012
Nela Steliac
The Labor Market in Romania and Interregional Disparities
17 ISSN 1849-5664 (online)http://researchleap.com/category/international-journal-of-management-science-and-business-administration ISSN 1849-5419 (print) International Journal of Management Science and Business Administration Vol. 2, No. 6, May 2016, pp. 7–25
(fig.12). The regional poles were BI (for maximum) and Southwest Oltenia regions (between 2002-2013),
West region between 1998-2001 (for minimum), respectively;
x Growing interregional disparities are found as well in the case of the average number of employees in the
trade sector. This took place until 2008. Following this year, however, a relatively insignificant increase of
convergence took place (fig.13). The regional poles were BI (for maximum) and Southwest Oltenia (for
minimum) regions;
x The services sector was as well characterised, in general, by increase of interregional disparities, an aspect
revealed as well by the evolution of standard deviation (fig.14). The regional poles were BI (for maximum)
and Southwest Oltenia (for minimum) regions.
Source: Own calculations based on TEMPO-Online data
Source: Own calculations based on TEMPO-Online data
Figure 14: Variability indicators – average number of employees – services
Source: Own calculations based on TEMPO-Online data
Distribution of employees by the five sectors within the regions is according to fig. 15. This allows us to point out the
following aspects:
x The preponderance of employees in the services sector, especially in the last part of the period studied (just as in
the case of population employment), at a significant difference compared to the industrial sector for the majority
of the regions (Northwest region, Northeast region, Southeast region, Southwest region, South-Muntenia and
Bucharest-Ilfov region);
Fig. 10 Variability indicators – average number
of employees – agriculture Fig. 11 Variability indicators – average
number of employees – industry
Fig. 12 Variability indicators – average number of employees – constructions
Fig. 13 Variability indicators – average number of employees – trade

Nela Steliac
The Labor Market in Romania and Interregional Disparities
18 ISSN 1849-5664 (online)http://researchleap.com/category/international-journal-of-management-science-and-business-administration ISSN 1849-5419 (print) International Journal of Management Science and Business Administration Vol. 2, No. 6, May 2016, pp. 7–25
x Employees massive orientation towards the field of services in the case of Bucharest-Ilfov region and limitation
of weight in the industrial sector (specialization of region in the field of services-over 55% of the employees in
2013);
x Specialization of the Central and West region in the field of industry;
x Significant limitation of industrial activity in certain regions (NE, BI);
Figure 15: Distribution of employees by sectors and regions
Source: Calculations and charts drawn up by the author based on TEMPO-ONLINE data
If we call into question the regional concentration level of the average number of employees in the five sectors, then we
can say that there is no such regional concentration. The value of Gini-Struck coefficient is lower than 0.3, which
allows us to state that there is no significant level of regional concentration of employees. Nonetheless, we must point
out the fact that it registered an upward trend in the entire period studied, in the case of every sector. The most
significant values belong to the services sector, and the lowest values correspond to the industrial sector.

Nela Steliac
The Labor Market in Romania and Interregional Disparities
19 ISSN 1849-5664 (online)http://researchleap.com/category/international-journal-of-management-science-and-business-administration ISSN 1849-5419 (print) International Journal of Management Science and Business Administration Vol. 2, No. 6, May 2016, pp. 7–25
Table 6: GINI-STRUCK coefficient – employees by sectors
Year Agriculture Industry Construction Trade Services
1998 0.1507 0.0674 0.0685 0.0766 0.0805
1999 0.1539 0.0688 0.0323 0.0500 0.0743
2000 0.1591 0,0616 0.0586 0.0840 0.0898
2001 0.1600 0.0626 0.0639 0.0924 0.0947
2002 0.1418 0.0629 0.0887 0.0951 0.1004
2003 0.1452 0.0609 0.0860 0.1060 0.1067
2004 0.1377 0.0548 0.1004 0.1077 0.1130
2005 0.1362 0.0533 0.1851 0.1229 0.1237
2006 0.1274 0.0540 0.1636 0.1306 0.1340
2007 0.1324 0.0551 0.1497 0.1345 0.1381
2008 0.1444 0.0576 0.1428 0.1460 0.1603
2009 0.1577 0.0558 0,1738 0.1476 0.1493
2010 0.1463 0.0632 0,1799 0.1499 0.1512
2011 0.1433 0.0695 0,1567 0.1491 0.1620
2012 0.1497 0.0737 0,1372 0.1488 0.1619
2013 0.1466 0.08063 0,1460 0.1418 0.1624
Source: Own calculations based on TEMPO-Online data
4.5. Job vacancy rate In case of job vacancy rate the period analysed included years 2005-2013, explained by the lack of statistical data.
Fluctuating evolution of the rate (average, minimum and maximum values) can be noticed. Until 2008 inclusively, the
regional convergence shows a decrease and increase the following 4 years. The last 2 years are characterized by the
increase of interregional discrepancies from the perspective of job vacancies in economy. The regional poles are
different from one year to the other. In general, these are the following: Southwest Oltenia, Northwest, and Southeast
(for the lowest rates of job vacancies) regions and for the highest rates: BI and Northeast, West (in some years).
In terms of disparity index we can notice the same regional discrepancies. All regions show fluctuating evolutions.
Nonetheless, there are regions of which disparity index exceed, in general, 100% (BI, Northeast, West, South
Muntenia), and others with values under 100% (Southwest Oltenia, Central, Northwest, Southeast). Extreme values are
registered in 2010: 52.54% (Southeast region) and 179.66% (Northeast region).
Fig. 16 Variability indicators – job vacancy rate Fig. 17 Disparity index – compared to the national average (=100)
Source: Own calculations based on TEMPO-Online data
At the same time, the interregional differences in terms of job vacancies can be highlighted as well in the chart below:

Nela Steliac
The Labor Market in Romania and Interregional Disparities
20 ISSN 1849-5664 (online)http://researchleap.com/category/international-journal-of-management-science-and-business-administration ISSN 1849-5419 (print) International Journal of Management Science and Business Administration Vol. 2, No. 6, May 2016, pp. 7–25
Figure 18: Job vacancies by regions (2005-2014)
Source: Chart drawn up by the author based on TEMPO-ONLINE data
As it can be noted, BI region significantly moves away from the rest of the regions in terms of the total number of job
vacancies. At the opposite pole we find SW Oltenia region. The ratio between the two poles increased from 3.76:1 in
2005 to 5.82:1 in 2014.
The job vacancies were distributed by the three sectors according to the data in the table below:
Table 7: Job vacancies by sectors (2005-2013)
Sectors 2005 2006 2007 2008 2009 2010 2011 2012 2013 2014
Agri-
culture
2,593 2,507 2,489 1,585 1,126 629 618 273 299 382
Industry
& con-
structions
30,677 29,955 34,332 29,594 10,396 9,445 11,025 9,879 11,751 12,860
Services 40,118 48,095 59,151 61,043 27,103 14,165 14,414 14,673 18,593 25,281
Total 73,380 80,557 95,972 92,222 38,625 24,239 26,057 24,825 30,643 38,523
Source: Own calculations based on TEMPO-Online data
We note that the peak economic years ensured the most job vacancies, up to approximately 96,000 jobs. Most of them
were offered in the services sector and the fewest in the agricultural sector.
The situation by regions and sectors of job vacancies was according to fig. 19. In agriculture the most job vacancies
were offered until 2009 inclusively, in the Central region, and then the most jobs were offered in Northeast region. In
the industry and constructions sector Northwest, Northeast, Bucharest-Ilfov or West regions dominated successively.
The fewest jobs in this sector were found in South West Oltenia region. Taken as a whole, services dominated the job
vacancy market. By regions, Bucharest-Ilfov significantly moved away from the rest, and in some years, at national
level offered approximately 1/3 of the total job vacancies in services and sometimes even up to approximately 38% (in
2012) of this total.
Figure 19: Job vacancies by sectors and regions
Source: Calculations and charts drawn up by the author based on TEMPO-ONLINE data
0100002000030000
2005
2007
2009
2011
2013
nu
mb
er
Years
Job vacancies by region
North-West
Center
North-East
Nela Steliac
The Labor Market in Romania and Interregional Disparities
21 ISSN 1849-5664 (online)http://researchleap.com/category/international-journal-of-management-science-and-business-administration ISSN 1849-5419 (print) International Journal of Management Science and Business Administration Vol. 2, No. 6, May 2016, pp. 7–25
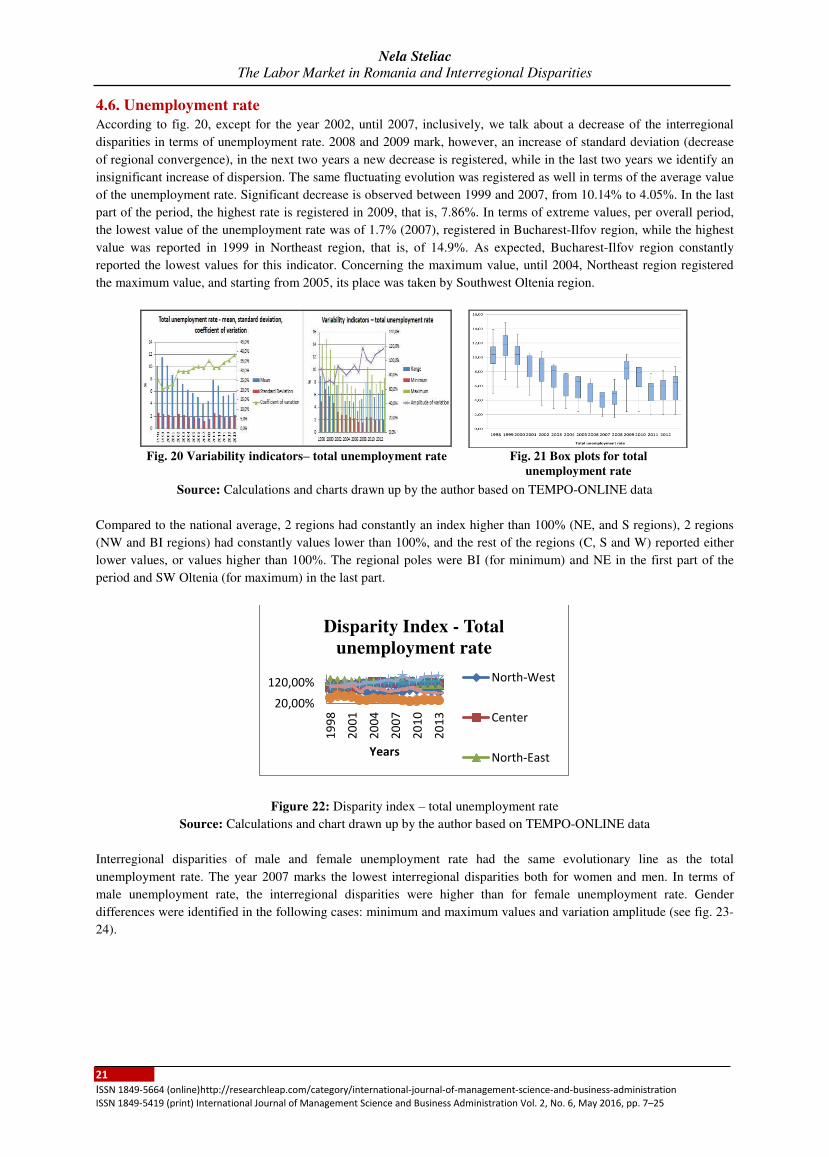
4.6. Unemployment rate According to fig. 20, except for the year 2002, until 2007, inclusively, we talk about a decrease of the interregional
disparities in terms of unemployment rate. 2008 and 2009 mark, however, an increase of standard deviation (decrease
of regional convergence), in the next two years a new decrease is registered, while in the last two years we identify an
insignificant increase of dispersion. The same fluctuating evolution was registered as well in terms of the average value
of the unemployment rate. Significant decrease is observed between 1999 and 2007, from 10.14% to 4.05%. In the last
part of the period, the highest rate is registered in 2009, that is, 7.86%. In terms of extreme values, per overall period,
the lowest value of the unemployment rate was of 1.7% (2007), registered in Bucharest-Ilfov region, while the highest
value was reported in 1999 in Northeast region, that is, of 14.9%. As expected, Bucharest-Ilfov region constantly
reported the lowest values for this indicator. Concerning the maximum value, until 2004, Northeast region registered
the maximum value, and starting from 2005, its place was taken by Southwest Oltenia region.
Source: Calculations and charts drawn up by the author based on TEMPO-ONLINE data
Compared to the national average, 2 regions had constantly an index higher than 100% (NE, and S regions), 2 regions
(NW and BI regions) had constantly values lower than 100%, and the rest of the regions (C, S and W) reported either
lower values, or values higher than 100%. The regional poles were BI (for minimum) and NE in the first part of the
period and SW Oltenia (for maximum) in the last part.
Figure 22: Disparity index – total unemployment rate
Source: Calculations and chart drawn up by the author based on TEMPO-ONLINE data
Interregional disparities of male and female unemployment rate had the same evolutionary line as the total
unemployment rate. The year 2007 marks the lowest interregional disparities both for women and men. In terms of
male unemployment rate, the interregional disparities were higher than for female unemployment rate. Gender
differences were identified in the following cases: minimum and maximum values and variation amplitude (see fig. 23-
24).
Fig. 20 Variability indicators– total unemployment rate Fig. 21 Box plots for total unemployment rate
20,00%120,00%
1998
2001
2004
2007
2010
2013
Years
Disparity Index - Total unemployment rate
North-West
Center
North-East
Nela Steliac
The Labor Market in Romania and Interregional Disparities
22 ISSN 1849-5664 (online)http://researchleap.com/category/international-journal-of-management-science-and-business-administration ISSN 1849-5419 (print) International Journal of Management Science and Business Administration Vol. 2, No. 6, May 2016, pp. 7–25
Source: Own calculations based on TEMPO-ONLINE data
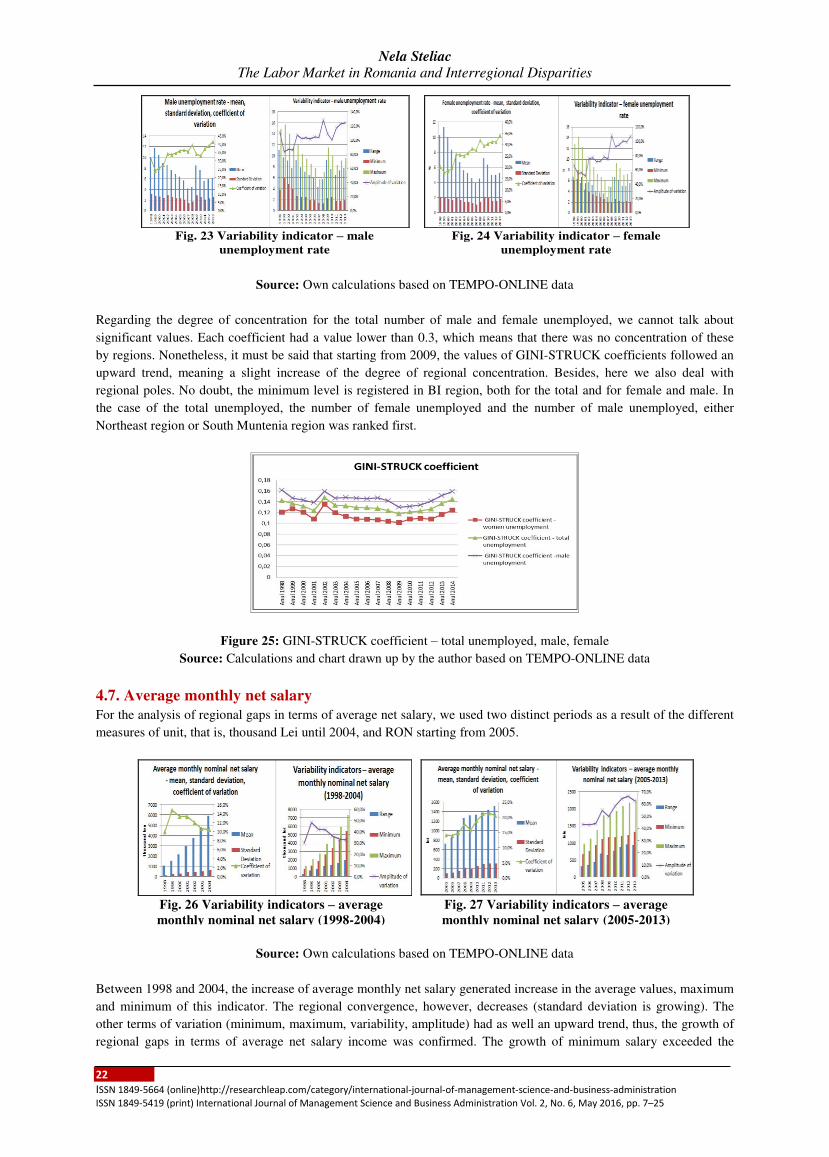
Regarding the degree of concentration for the total number of male and female unemployed, we cannot talk about
significant values. Each coefficient had a value lower than 0.3, which means that there was no concentration of these
by regions. Nonetheless, it must be said that starting from 2009, the values of GINI-STRUCK coefficients followed an
upward trend, meaning a slight increase of the degree of regional concentration. Besides, here we also deal with
regional poles. No doubt, the minimum level is registered in BI region, both for the total and for female and male. In
the case of the total unemployed, the number of female unemployed and the number of male unemployed, either
Northeast region or South Muntenia region was ranked first.
Figure 25: GINI-STRUCK coefficient – total unemployed, male, female
Source: Calculations and chart drawn up by the author based on TEMPO-ONLINE data
4.7. Average monthly net salary For the analysis of regional gaps in terms of average net salary, we used two distinct periods as a result of the different
measures of unit, that is, thousand Lei until 2004, and RON starting from 2005.
Source: Own calculations based on TEMPO-ONLINE data
Between 1998 and 2004, the increase of average monthly net salary generated increase in the average values, maximum
and minimum of this indicator. The regional convergence, however, decreases (standard deviation is growing). The
other terms of variation (minimum, maximum, variability, amplitude) had as well an upward trend, thus, the growth of
regional gaps in terms of average net salary income was confirmed. The growth of minimum salary exceeded the
Fig. 23 Variability indicator – male
unemployment rate Fig. 24 Variability indicator – female
unemployment rate
Fig. 26 Variability indicators – average monthly nominal net salary (1998-2004)
Fig. 27 Variability indicators – average monthly nominal net salary (2005-2013)

Nela Steliac
The Labor Market in Romania and Interregional Disparities
23 ISSN 1849-5664 (online)http://researchleap.com/category/international-journal-of-management-science-and-business-administration ISSN 1849-5419 (print) International Journal of Management Science and Business Administration Vol. 2, No. 6, May 2016, pp. 7–25
growth of maximum salary. The regional poles were this time as well BI (maximum) region and NE (minimum) region.
The ratio between the lowest value and the highest value achieved the figure 1.55:1 in 1999. In the period 2005-2013,
we witness the decrease of regional convergence (standard deviation increases) up until 2008. The year 2009 marks a
decrease in interregional disparities, while in the next years the standard deviation registers an upward trend. The
regional poles stay basically the same. Only that for the minimum, we talk either about NE region or NW region. The
difference between the maximum and minimum value increases, however, up to the value of 1.78:1 in 2012. The
increase of the minimum level does not exceed, however, all the time the growth of maximum level.
BI region is the only region of the country which exceeds the national average in terms of average net salary income
during the entire period (1998-2013). Other two regions ranked above the national average only in the first period
(1998-2004), that is, SE and SW Oltenia region. The rest of the regions registered increase in salary under the national
average. The year 2012 brings to the fore the lowest value of the disparity index for the total period, at the level of NE
region, that is, 81.55% of the national average.
Figure 28: Disparity index – average monthly net salary compared to the national average (=100)
Source: Own calculations based on TEMPO-ONLINE data
From the calculations made results the fact that the highest annual percentage increase of the average monthly net
salary was registered in BI region. Thus, in the first period, the average monthly net salary was 64% higher (1999
compared to 1998), while the second period only 31% (2008 compared to 2007). Further on, in the first period the
lowest percentage increase was of approximately 20% (2004 compared to 2003) in SW region. For the second period
we talk, however, about salary decrease of up to -1.67% in 2010 compared to the previous year. This is the case of SE
region.
5. Conclusions The results of the calculations allow us to conclude that the evolution of regional gaps was in general a sinuous one,
marked by decrease and then, by increase. The only indicator at the level of which an upward trend was observed for
the entire studied period was the average monthly net salary. What catches attention is, however, the fact that in 2013
the interregional discrepancies were more or less high compared to 1998. As such, we talk in this case about the
decrease of regional convergence in the Romanian labor market.
Another aspect which must be pointed out is related to the regional poles. For the best situations, for most of the time,
Bucharest-Ilfov region moved away from the rest of the regions. This region occupied in general the best place. There
were, however, situations when it ranked at the opposite pole for: population employment and activity ratio. Interesting
is also the fact that in the case of population employment, NE region occupied the best place for a long period of time.
In the case of the lowest values, however, there were more poles. It is mainly the case of NE region (GDP/inhabitants,
activity rate, unemployment rate, average net salary) and SW Oltenia region (number of active enterprises, number of
employees, job vacancy rate, and unemployment rate).
We found out, furthermore, the significant orientation of the population employment and the number of employees
towards the services sector determining this way changes of the economic profile for some regions. Gini-Struck
Nela Steliac
The Labor Market in Romania and Interregional Disparities
24 ISSN 1849-5664 (online)http://researchleap.com/category/international-journal-of-management-science-and-business-administration ISSN 1849-5419 (print) International Journal of Management Science and Business Administration Vol. 2, No. 6, May 2016, pp. 7–25
coefficients allowed us to establish that there is no degree of significant concentration on the labor market in Romania.
Nevertheless, a slight upward trend in their value was observed.
The results of Shift-Share analysis for population employment and average number of employees pointed out the fact
that BI region registered the best evolution in terms of these indicators. Even if the national component influenced
negatively their change, the sectorial and regional factors exercised a positive influence. Other regions which benefited
from regional advantages apart from BI were NW, C and W.
References x Albu, L.L., Ghizdeanu, I., Iordan, M., apu, D.I., 2011. Structura ocupa ională şi reflectarea acesteia în veniturile şi
cheltuielile popula iei din Regiunea Sud-Est - prezent şi perspective, Institutul de Prognoză Economică, Academia Română, Bucureşti, [online] Available at: <http://www.stpse.ro/atasamente/359_Structura%20ocupationala%20si%20reflectarea%20acesteia%20in%20veniturile
%20si%20cheltuielile%20populatiei%20din%20Regiunea%20Sud%20Est.pdf> [Accessed 25 August 2015].
x Antonescu, D., 2010. The Analysis of Regional Disparities in Romania with Gini/Struck Coefficients of Concentration,
Romanian Journal of Economics, Institute of National Economy, vol 31, pp.160-183
x Antonescu, D., 2012. Identificarea disparită ilor i convergen ei economice regionale în Uniunea Europeana i în România, Revista Studii economice, Academia Română-Institutul Na ional de Cercetări Economice, [online] Available at: <http://www.studii-economice.ro/2012/seince120528.pdf> [Accessed 10 September 2015].
x Antonescu, D., 2013. Politica de dezvoltare regional a României în etapa postaderare, Institutul de Prognoză Economică, Academia Română, Bucureşti, [online] Available at: Ţ http://www.studii-economice.ro/2013/seince130516.pdf >
[Accessed 15 August 2015].
x Cârnu, D., 2010. Particularită i ale dezvoltării regionale şi cauze specific, Analele Universită ii "Constantin Brâncuşi" din Târgu Jiu, Seria Economie, Nr. 3, pp. 75-86.
x Chirilă, V., Chirilă, C., 2014. The impact of economic and financial crisis on the regional disparities in Romania and European Union, Procedia-Social and Behavioral Sciences, 109, pp. 502–506, [online] Available at: <
http://www.sciencedirect.com/science/article/pii/S187704281305129X > [Accessed 28 August 2015].
x Diaconu (Maxim), L., 2014. Regional Economic Disparities in Romania. Comparative Analysis of the North-East and
West Development Regions, The USV Annals of Economics and Public Administration, vol.14, issue 2920), pp. 75-82.
x Dimian, G.C., 2012. The impact of labor market imbalances on regional disparities in the post-crisis context, Theoretical
and Applied Economics, Volume XIX, No. 9(574), pp. 37-48.
x Goschin, Z., et al., 2008. The current state and dynamics of regional disparities in Romania, Romanian Journal of
Regional Science, vol. 2, no.2, pp. 80-105
x Goschin, Z., et al., 2010, Impactul regional al crizei economice din perspectiva ocupării for ei de muncă, Studii i Cercetări de Calcul Economic i Cibernetică Economică, [online] Available at: Ţhttp://www.revcib.ase.ro/bd-
pdf%20elsevier/3-4rom%20pdf/Zizi%20Goschin.pdf> [Accessed 10 September 2015].
x Jaba, E., 2009. The evaluation of the regional profile of the economic development in Romania, Analele tiinłifice ale Universită ii Alexandru Ioan Cuza" din Ia i, Tomul LVI tiin e Economice, p. 537-549
x Lu a , M., Câlea, S., 2005. Economie europeană, Ed. Imprimeria Ardealul, Cluj-Napoca.
x Moisescu, E., R., (2015), Regional convergence. Case of Romania, Theoretical and Applied Economics, Volume XXII,
No. 2(603), pp. 183-188
x Nistor, P., 2012. FDI and regional disparities growth in Romania, Procedia Economics and Finance, no. 3, pp. 740 – 745.
x Orboi, M.D., Băne , A., 2012. The Evolution of the Labour Market in Romania's South-East Region, Scientific Papers:
Animal Science and Biotechnologies, 45(1), [online] Available at: < http://www.usab-
tm.ro/utilizatori/ZOOTEHNIE/file/simpozion%202012/Vol%201/Management/Dora.pdf> [Accessed 10 September
2015].
x Parlamentul European. (2016). Parlamentul European. [online] Available at: <http://www.europarl.europa.eu/portal/ro>
[Accessed 1 Jul. 2015].
x Pecican, E. ., 2009. Indicatori privind convergen a reală şi aplica iile acestora, [online] Available at: <ftp://ftp.repec.org/opt/ReDIF/RePEc/ror/ror_pdf/seince091004.pdf> [Accessed 1 September 2015].
x Pintilescu, C., 2011. Regional economic disparities in Romania, Recent Researches in Applied Economics, [online]
Available at: <http://www.wseas.us/e-library/conferences/2011/Iasi/AEBD/AEBD-06.pdf S1877042813052774 >
[Accessed 1 September 2015].
x Rotaru, P.C., 2014, Empirical study on regional employment rate in Romania, Procedia - Social and Behavioral Sciences
109, pp. 1365–1369, [online] Available at: < http://www.sciencedirect.com/science/article/pii/S1877042813052774 >
[Accessed 15 September 2015].

Nela Steliac
The Labor Market in Romania and Interregional Disparities
25 ISSN 1849-5664 (online)http://researchleap.com/category/international-journal-of-management-science-and-business-administration ISSN 1849-5419 (print) International Journal of Management Science and Business Administration Vol. 2, No. 6, May 2016, pp. 7–25
x Russu, C., 2014. Aspects of Regional Development in Romania, Economic Insights – trends and Challenges, Vol.III
(LXVI) No. 4/2014, pp. 25-32
x Săvoiu, G., Crăciuneanu, V., aicu, M., 2010. A new method of statistical analysis of markets' concentration or
diversification, Revista Română de Statistică nr. 2, [online] Available at: <http://www.revistadestatistica.ro/Articole/2010/A3en_2-2010.pdf> [Accessed 1 September 2015].
x Simionescu, M., 2014. The Beta-convergence Analysis and Regional Disparities in EU-28, ACTA VŠFS, 2/2014, vol. 8, p.167-177, [online] Available at: < http://www.vsfs.cz/periodika/acta-2014-02.pdf > [Accessed 17 September 2015].
x Stanef, M.R., 2014. Economic disparities between urban and rural Romanian labor market, Theoretical and Applied
Economics, Volume XXI, No. 9(598), pp. 61-70
x Zaman Gh., Vasile V., Matei M, Croitoru C., Enescu G., 2011. Aspecte ale impactului ISD din România asupra
exporturilor si dezvoltarii durabile, Romanian Journal of Economics, Institute of National Economy, vol. 33(2(42)), pp.
1-60.
x Zaman, Gh., Goschin, Z., Vasile, V., 2013. Evolu ia dezechilibrelor teritoriale din România în contextul crizei economice, Romanian Journal of Economics, vol. 37, issue 2(46), pp. 20-39.