The Kroger Co. 2014 Proxy Statement and 2013 Annual Report
152
N OTICE OF A NNUAL M EETING OF S HAREHOLDERS P ROXY S TATEMENT AND 2013 A NNUAL R EPORT
Transcript of The Kroger Co. 2014 Proxy Statement and 2013 Annual Report

N o t i c e o f A N N u A l M e e t i N g o f S h A r e h o l d e r S
P r o x y S t A t e M e N t
A N d
2 0 1 3 A N N u A l r e P o r t

Kroger
Convenience Stores
Jewelry Stores
Services
Bring it all home.
COVER PRINTED ON RECYCLED PAPER

1
F e l l o w S h a r e h o l d e r S :
Kroger achieved another outstanding year of performance for shareholders in 2013.
We are a company with many strengths, among them:
• Strongandconsistentreturnstoshareholders,
• Anaggressivestrategicplanthatdeliversreliablegrowthandfinancialperformance,and
• Deeplyloyalcustomerswhoarethebasisforourbroadandgrowingmarketshare.
Our Company’s most enduring strength is our people — our more than 375,000 associates who strive tomakeeverycustomer’sdayalittlebettereachtimetheyvisitoneofourstores.
Our foundational approach is called Customer 1st. It simply means that the needs and wants of our customersareattheheartofeverydecisionwemake—inourstores,plants,offices,andfacilities.ItisourassociateswhobringCustomer1st to life. From product and technology innovation to improvements in the shoppingexperience,weare inspiredby theever-changingneedsandwantsofcustomers.Our greatest strategic advantage is our Customer 1st culture.
Weareproudtobebothlargeandsmall.Asoneoftheworld’slargestretailers,weleverageeconomiesofscaleinwaysthatmakeadifferenceforourcustomersintheirdailylives.Forexample,weimplementedaninnovative,fastercheckoutapproachthatsavesminutesforeachcustomereverytimetheyshop.Wealsoleverageoursizetooffergreatvalueoneverydayitemsandweeklyspecials,andthenprovideapersonalizedmobile app—one of themost popular in that crowded space—that highlights the deals thatmatch eachshopper’s list.
Inthisletter,Iwillprovidemoredetailbehindouroutstandingresultsin2013andexplainthebasisofour firm conviction that there is much more to come for shareholders, associates and customers.
Fiscal 2013 Results – Delivering Growth That Investors Can Count On
At our October 2012 investor meeting, we announced aggressive growth plans that expand our Customer 1st Strategybyacceleratinggrowth inourcorebusinessand improvingourconnectionwithallcustomers,expandingourpresenceinnewandexistingmarkets,andinvestingtocreateuniquecompetitivepositioningfortodayandthefuture.Asaresult,weexpecttoachievealong-term,net-earnings-per-diluted-sharegrowthrateof8-11%andanincreasingdividendovertime.
We committed to four key performance indicators to measure our progress at that meeting as well:
• Positiveidenticalsupermarketsales;
• SlightlyexpandingFIFOoperatingmarginonarollingfourquartersbasis,excludingfuel;
• Improvingreturnoninvestedcapital;and
• Growingmarketshare.
In 2013, the first full fiscal year executing our aggressive growth plan, Kroger delivered on all four indicators. We achieved an unparalleled 41st consecutive quarter of positive identical supermarket sales;expanded FIFOoperatingmargin on a rolling four quarters and adjusted basis, excluding fuel; improvedreturnoninvestedcapital,evenasweincreasedcapital investments;andgrewmarketsharefortheninthconsecutive year.
Kroger’s consistent and reliable performancedeliverslong-termgrowth investors can count on. And2013wasanotheryearofsteadygrowth.Totalsaleswere$98.4billioninfiscal2013,anincreaseof3.9%afteradjustingforthe53rdweekinfiscal2012.Netearningswere$1.52billion,or$2.90perdilutedshare.Onanadjustedbasis,netearningsgrew13percentoverlastyear’sadjustedamount.WecontinuetolowerKroger’scostsofdoingbusiness–achievingourninthconsecutiveyearofreducingoperatingexpensesasarateofsales–andtoreinvestthesesavingsinlowerpricesforourcustomers.
2
We are using free cash flow to reward shareholders. Since January 2000,Kroger has returnednearly$10billiontoshareholdersthroughsharerepurchases.Since2006,Krogerhaspaidnearly$1.9billionindividendstoshareholders,whilemaintainingourinvestment-gradecreditrating.In2013,weincreasedourannual dividend for the seventh consecutive year and returned more than $928 million to shareholders through dividendsandstockbuybacks.Ifyouhadinvested$100inKrogerstockonJanuary31,2000,andreinvestedalldividendsissued,yourinvestmentwouldhavebeenworth$235onJanuary31,2014,andKroger’sTotalShareholderReturninthatsameperiodis125.8%.InMarch2014,Kroger’sBoardofDirectorsapproveda$1billionsharerepurchaseprogram,underscoringourcommitmenttodelivercashtoshareholders.
Welcoming Harris Teeter to the Kroger family
Oneofourplatformsforgrowthisexpandingintonewmarkets.Weareproudandexcitedtowarmly welcome Harris Teeter to the Kroger family of stores.WecompletedourmergerinJanuary2014andintegrationiswellunderway.Thisexceptional54-year-oldregionalchainreceivesveryhighmarksfromtheircustomersforservice,selection,meal-timesolutions,andfreshness.The230HarrisTeeterstoresarelocatedinthehighlyattractivemid-AtlanticmarketsandexpandKroger’snationalfootprint.WehavelongrespectedtheHarrisTeetermanagementteamandtheiroperations,andwelookforwardtobringingthebestofHarrisTeeter and Kroger to our customers and shareholders.
Deeply loyal customers, creating strong market share
We have the privilege of serving eight million customers each day.Everyoneofthemhasuniqueinterestsandcomestoourstoreswiththebeliefwewillbothmeettheirneeds–theirtastes,budget,andlifestyle–and delight them with the unexpected.
Wecontinuetocreateinnovativewaysthatallowustoknowourcustomersbetterthananyoneelseandtopersonalizetheirexperiencewithus.We’vebeenmining“bigdata”foralongtime,alwayswiththesinglefocus on Customer 1st–bringingtoeachcustomerwhatismostrelevanttothem.
Wehaveinvestedinpriceeveryyearfortenconsecutiveyears,savingourcustomersmorethan$3billionannually in the process.
We have rewarded customers with fuel savings through our popular fuel rewards program at more than 1,240convenient supermarket fuel center locations in 2013.And, customerswith aKrogerRewardsVisacredit card earned more than $33 million in free groceries last year.
We have partneredwith customers to support the community organizations they care aboutmost,returning$46millionannuallytolocalorganizationsthatcustomersselectthroughourCommunityRewardsprogram.
Ourapproachhasresultedingrowingbothmarketshareandshareofloyalty.
And we are not done!
Customer 1st innovation is giving us new and varied ways of connecting with and deepening our relationship with our customers. We are growing our digital offering to deliver value to our customers through the communication channels they prefer, and customers are responding. In fact, our customers have downloadedmorethan1billiondigitalcouponssincewebeganofferingtheminlate2009.
WeareinnovatingupanddownoursupplychainsothatKrogermilkstaysfresher,longerincustomers’refrigerators.Throughprocessimprovements,ourdairysuppliers,milkplants,logisticsoperation,andstoresworkedtogethersothatwecanpromiseourcustomersthatKroger’s milk is among the freshest in the industry.
Andwecontinuetobuildourbest-in-class Corporate Brands portfoliobyprovidingchoicestoourcustomersthroughamulti-tierofferingofpricepointsandproductexperiences.WeexpectSimple Truth and Simple Truth Organictojoinourpremiumtier,Private Selection,asa“BillionDollarBrand”bytheendoffiscal2014asthosebrandsareincreasinglysoughtbyshoppersfocusedonnaturalandorganicfoods.OurBanner Brand continuestoprovidegreatqualitywithawidebreadthofproducts,andourValuebrandofferscustomersthechoiceofqualityproductsthatarepricedtofittheirbudget.

3
The Kroger Difference
Kroger’scultureanddeeply-rootedvaluesarealsoreflectedinhowweserveourfriendsandneighborsinlocalcommunities,andhowwetakecareofeachother.
Westrivetobeconnectedtoandresponsivetothelocalcommunitiesweserveby:
• Deliveringtheequivalentofmore than 200 million meals to more than 100 local Feeding America foodbanksin2013.
• Engagingvendorsandcustomerstodonatemore than $6 million in 2013 in support of women’s health and breast cancer awareness programs.
• Contributing$3.3 million to the USO in2013tohelpsupportthemilitaryandtheirfamilies.Since2010,Krogerhasdonated$8.5milliontotheUSO–thelargest cumulative gift to the USO in that organization’s history.
•Hiring more than 22,456 veterans since 2009,andhelpingthe“100,000JobsMission”–acoalitionof more than 130 companies with the common goal of hiring more than 100,000 transitioning service membersandmilitaryveteransby2020–surpassitsoriginalgoalinJanuary,sevenyearsearly.
• Supportingmore than30,000 schools and local organizationswith $46million in 2013 throughour Community Rewards program that delivers personalized, customer-driven donations based ontotal purchases.
• Contributinganadditional$9.1milliontolocalorganizationsin2013throughTheKrogerCo.Foundation.In the past five years, our foundation has donated nearly $40 million.
Let’srememberthatwemaketheseinvestmentsbecauseourcustomerstellusthesecausesareimportanttothem,andbecausetheystrengthenthecommunitieswecallhome.Whenyoucombinethecash,foodandproduct we donate to a variety of causes and programs, Kroger contributed more than $250 million to our local communities in 2013.
We also make a difference in the lives of our associates, customers and communities through ourcommitmentstosafety,sustainability,supplierdiversityandjobgrowth.
Kroger is one of the safest companies in our industry. Associate engagement in innovative safety programshasreducedaccidentrates inourstoresandmanufacturingplantsby77percentsince1995. In2013,831retail locations, threemanufacturingplants,and threedistributioncenterswent theentireyearwithoutarecordableaccident.
One of Kroger’s key sustainability priorities is moving our retail stores and facilities toward “zerowaste”.Ourstoresaresendinglesswastetolandfillsandincineratorsthroughavarietyofefforts,includingcomposting and our innovative Perishable Donations Program – aprocess to rescue safe, edible freshproductsanddonatethemquicklytolocalfoodbanks.ThissystemhasbeenreplicatedbyotherretailersandtodayfreshproductsmakeupmorethanhalfofthefooddistributednationwidebyFeedingAmerica.Ourmanufacturing facilities continue to lead waste reduction. Today, 26 of our 38 manufacturing plants are designated as “zero waste” facilities.
You can learn more about our sustainability initiatives by reading our annual sustainability report,availableonourwebsitesustainability.kroger.com.
Kroger is a leader in supplier diversity, spending nearly $2 billion annually with women- andminority-ownedbusinesses.WeproudlyremainamemberoftheBillionDollarRoundtableandtheUnitedStatesHispanicChamberofCommerceMillionDollarClub.
Kroger is doing our part to create jobs and opportunity.Weemploy7,000moreassociatestodaythanwedidlastyear,andnearly90percentofthosenewjobsareinoursupermarketdivisions.Overthelastsixyears,Krogerhascreatedmorethan40,000newjobsinthelocalcommunitiesweserve.

4
Leadership
Webelievewehaveoneof thestrongestmanagement teams in theretail industry.For tenyearsourCompanyhasbeenledbyDaveDillon,whohasbeencalled“thegrocers’grocer.”Dave’sknowledgeofthebusiness,passionforcustomersandassociates,andprincipledanddisciplinedapproachtorunningaworld-classcompanyhasrewardedshareholders,associates,customers,andcommunities.Wethankhimfor thestrong foundationhebuilt and thatwe are inspired tocontinue toexpand.Daveoften refers to retailingasateamsport.Everygreatteam,includingours,needsagreatcoachandleader.Thankyou,Dave,fortenremarkableyearsasChairmanandCEO.
In Memoriam and Retirements
Weweresaddenedbythelossofourfriendandcolleague,JonC.Flora,whopassedawayunexpectedlyinSeptember2013.HewaspresidentofFry’sFoodStoresinArizona.Jonwasacompassionateandhands-onleader. We all miss him deeply.
We extend our appreciation to John LaMacchia, who retired from Kroger’s Board of Directors inDecember2013after24yearsofservice;toPaulHeldman,executivevicepresident,secretaryandgeneralcounsel,whoretiresinMayafter32yearsofservice;andtoRobert“Pete”Williams,seniorvicepresident,whoretiresinMayafter37yearswiththeCompany.OnbehalfofourentireCompany,wethankeachoftheseindividuals for their service and leadership.
Bright Future – More to Come
Kroger’sfutureisbright.WearedifferentiatingourCompanyinthecrowdedfieldofretailersinwaysthatleadtosustainable,reliablegrowth.Andthereisalotmoretocomeforshareholders,associatesandcustomers.
OnbehalfoftheentireKrogerfamily,wethankyouforyourcontinuedsupportandtrust.
W.RodneyMcMullen Chief Executive Officer
5
CongratulationstothewinnersofTheKrogerCo.CommunityServiceAwardfor2013:
2013 Community Service Award Winners
Division RecipientAtlanta EmilyMayCentral SherryMillerCincinnati JeanettaSteelyCityMarket Adilia AsplundColumbus MartiKingDelta DianneScallionsDillonStores JamieTietgenFood 4 Less MarisaRobertsFredMeyer Tracy NicholsFry’s BryanSeppalaJayCStores DonnieRoarkKingSoopers LindaHutsellLouisville JohnOwensMichigan RachelMasonMid-Atlantic RachelStrattonNashville BrysonHigginsQFC KathyButcherRalphs MichaelVuSmith’s April WilsonSouthwest Aaron Calvert / Phillip Ingram______
Tara Foods MonaMcCoyKBSpecialtyFoods Laurie FosterPace Crawfordsville Kevin FroedgeWinchester Farms Dairy RitaAkersLaHabraBakery BerthaGuzman______
CStores Aiesha Little______
Corporate Tricia FettersLogistics Patty Freeman

6
N o t i c e o F a N N u a l M e e t i N g o F S h a r e h o l d e r S
Cincinnati,Ohio,May14,2014
ToAllShareholdersofTheKrogerCo.:
YouareinvitedtoourannualmeetingofshareholdersofTheKrogerCo.whichwillbeheldattheMUSICHALLBALLROOM,MUSICHALL,1241ElmStreet,Cincinnati,Ohio45202,onJune26,2014,at11a.m.,easterntime, for the following purposes:
1. Toelectthirteendirectorsfortheensuingyear;
2. Toconsiderandactuponaproposaltoapprovethe2014Long-TermIncentiveandCashBonusPlan;
3. Toconsiderandactuponanadvisoryvotetoapproveexecutivecompensation;
4. To consider and act upon a proposal to ratify the selection of independent registered publicaccountantsfortheyear2014;
5. Toactupontwoshareholderproposals,ifproperlypresentedattheannualmeeting;and
6. Totransactsuchotherbusinessasmayproperlybebroughtbeforethemeeting;
HoldersofcommonsharesofrecordatthecloseofbusinessonApril29,2014,willbeentitledtonoticeof and to vote at the meeting.
a t t e N d a N c e
Only shareholders and persons holding proxies from shareholders may attend the meeting. If you are attending the meeting, please bring the notice of the meeting that was separately mailed to you or the top portion of your proxy card, either of which will serve as your admission ticket.
YOUR MANAGEMENT DESIRES TO HAVE A LARGE NUMBER OF SHAREHOLDERS REPRESENTEDATTHEMEETING, INPERSONORBYPROXY.PLEASEVOTEYOURPROXYELECTRONICALLYVIATHEINTERNETORBYTELEPHONE.IFYOUHAVEELECTEDTORECEIVEPRINTEDMATERIALS,YOUMAYSIGNANDDATETHEPROXYANDMAILITINTHESELF-ADDRESSEDENVELOPEPROVIDED.NOPOSTAGEISREQUIREDIFMAILEDWITHINTHEUNITEDSTATES.
Ifyouareunabletoattendtheannualmeeting,youmaylistentoalivewebcastofthemeeting,whichwillbeaccessiblethroughourwebsite,ir.kroger.com,at11a.m.,easterntime.
ByorderoftheBoardofDirectors,PaulW.Heldman,Secretary
7
P r o x y S t a t e M e N t
Cincinnati,Ohio,May14,2014
ThisCombinedNotice,ProxyStatementandAnnualReportisbeingfurnishedtotheshareholdersofTheKrogerCo.inconnectionwiththesolicitationofproxiesbytheBoardofDirectorsforuseattheAnnualMeetingofShareholderstobeheldonJune26,2014,at11a.m.,easterntime,attheMUSICHALLBALLROOM,MUSICHALL,1241ElmStreet,Cincinnati,Ohio45202andatanyadjournmentsthereof.
The principal executive offices of TheKroger Co. are located at 1014Vine Street, Cincinnati,Ohio45202-1100. Our telephone number is 513-762-4000. This Proxy Statement and Annual Report, and theaccompanyingproxy,werefirstfurnishedtoshareholdersonMay14,2014.
Yourproxy issolicitedby theBoardofDirectorsofTheKrogerCo.,and thecostofsolicitationwillbe borne byKroger.Wewill reimburse banks, brokers, nominees, and other fiduciaries for postage andreasonable expenses incurred by them in forwarding the proxymaterial to their principals. Kroger hasretainedD.F.King&Co.,Inc.,48WallStreet,NewYork,NewYork,toassistinthesolicitationofproxiesandwillpaythatfirmafeeestimatedatpresentnottoexceed$15,000.Proxiesmaybesolicitedpersonally,bytelephone,electronicallyviatheInternet,orbymail.
RobertD.Beyer,W.RodneyMcMullen,andRonaldL.Sargent,allofwhomareKrogerdirectors,havebeennamedmembersoftheProxyCommittee.
AsofthecloseofbusinessonApril29,2014,therecorddate,ouroutstandingvotingsecuritiesconsistedof 509,553,233commonshares, theholdersofwhichwillbeentitled toonevoteper shareat theannualmeeting.Thesharesrepresentedbyeachproxywillbevotedunlesstheproxyisrevokedbeforeitisexercised.Revocationmaybe inwriting toKroger’s Secretary, or inperson at themeeting,orby appointmentof asubsequentproxy.Shareholdersmaynotcumulatevotesintheelectionofdirectors.
Ifyouholdsharesinstreetnameanddonotprovideyourbrokerwithspecificvotinginstructionsonproposals1,2,3,5and6,yourbrokerdoesnothavetheauthoritytovoteonthoseproposals.Thisisgenerallyreferredtoasa“brokernon-vote.”Proposal4isconsideredaroutinematterand,therefore,yourbrokermayvote your shares according to your broker’s discretion. The vote required, including the effect of brokernon-votesandabstentionsforeachofthematterspresentedforshareholdervote,issetforthbelow.
Item No. 1, Election of Directors–Anaffirmativevoteofthemajorityofthetotalnumberofvotescast“for”or“against”adirectornomineeisrequiredfortheelectionofadirectorinanuncontestedelection.Accordingly,brokernon-votesandabstentionswillhavenoeffectonthisproposal. Amajorityofvotescastmeansthatthenumberofsharesvoted“for”adirectornomineemustexceedthenumberofvotes“against”such director.
Item No. 2, Approval of 2014 Long-Term Incentive and Cash Bonus Plan – ApprovalbyshareholdersofthePlanrequirestheaffirmativevoteofthemajorityofsharesentitledtovoteonthematter.Accordingly,brokernon-votesandabstentionswillhavenoeffectonthisproposal.
Item No. 3, Advisory Vote to Approve Executive Compensation – Approval by shareholders ofexecutivecompensationrequirestheaffirmativevoteofthemajorityofsharesentitledtovoteonthematter.Accordingly,brokernon-votesandabstentionswillhavenoeffectonthisproposal.
Item No. 4, Selection of Auditors–Ratificationbyshareholdersoftheselectionofindependentpublicaccountantsrequirestheaffirmativevoteofthemajorityofsharesentitledtovoteonthematter.Accordingly,abstentionswillhavenoeffectonthisproposal.
Item Nos. 5 and 6, Shareholder Proposals –Theaffirmativevoteofamajorityofsharesparticipatinginthevotingonashareholderproposal isrequiredfor itsadoption.ProxieswillbevotedAGAINSTtheseproposals unless the Proxy Committee is otherwise instructed on a proxy properly executed and returned. Brokernon-votesandabstentionswillhavenoeffectontheseproposals.

8
Important Notice Regarding the Availability of Proxy Materials for the Shareholder Meeting to be Held on June 26, 2014.
UndertherulesadoptedbytheSEC,wearefurnishingproxymaterialstoourshareholdersprimarilyontheInternet.Webelievethatthisprocessshouldexpediteshareholders’receiptofproxymaterials,lowerthecostofourannualmeetingandhelptoconservenaturalresources.OnoraboutMay14,2014,wemailedtoeachofourshareholders(otherthanthosewhopreviouslyrequestedelectronicorpaperdelivery),aNoticeof InternetAvailabilityofProxyMaterialscontaining instructionsonhowtoaccessandreviewtheproxymaterialsontheInternetandinstructionsonhowtovoteyourshares.TheNoticeofInternetAvailabilityofProxyMaterialsalsocontainsinstructionsonhowtoreceiveapaperore-mailcopyoftheproxymaterials.IfyoureceiveaNoticeofInternetAvailabilityofProxyMaterials,youwillnotreceiveaprintedcopyoftheproxymaterialsunlessyourequestone.Ifyoureceivepapercopiesofourproxymaterials,youmayalsoviewthesematerials at http://www.proxyvote.com. If you receive paper copies of our proxy materials and wish to receive thembyelectronicdeliveryinthefuture,pleaserequestelectronicdeliveryathttp://www.proxyvote.com.

9
P r o P o S a l S t o S h a r e h o l d e r S
e l e c t i o N o F d i r e c t o r S ( i t e M N o . 1)
TheBoardofDirectors,asnowauthorized,consistsofthirteenmembers.Allmembersaretobeelectedattheannualmeetingtoserveuntiltheannualmeetingin2015,oruntiltheirsuccessorshavebeenelectedbytheshareholdersorbytheBoardofDirectorspursuanttoKroger’sRegulations,andqualified.Kroger’sArticlesofIncorporationprovidethatthevoterequiredforelectionofadirectorbytheshareholders,exceptinacontestedelectionorwhencumulativevotingisineffect,willbetheaffirmativevoteofamajorityofthevotes cast for or against the election of a nominee.
Theexperience,qualifications,attributes,andskillsthatledtheCorporateGovernanceCommitteeandtheBoard toconclude that the following individualsshouldserveasdirectorsareset forthoppositeeachindividual’sname.Thecommitteemembershipsstatedbelowarethoseineffectasofthedateofthisproxystatement.Itisintendedthat,excepttotheextentthatauthorityiswithheld,proxiesbytheProxyCommitteewillbevotedfortheelectionofthefollowingpersons:
NameProfessional
Occupation (1) AgeDirector
Since
N o M i N e e S F o r d i r e c t o r F o r t e r M S o F o F F i c e c o N t i N u i N g u N t i l 2 015
Reuben V. Anderson Mr. Anderson is a Senior Partner in the Jackson, Mississippi officeof Phelps Dunbar, a regional law firm based in NewOrleans. Priorto joining this law firm, he was a justice of the Supreme Court ofMississippi.Mr.Anderson iscurrentlyservingas the leaddirectorofAT&TInc.,andduringthepastfiveyearswasadirectorofTrustmarkCorporation.HeisamemberoftheCorporateGovernanceandPublicResponsibilitiesCommittees.
Mr.Andersonhasextensivelitigationexperience,andheservedasthefirstAfrican-American Justiceon theMississippi SupremeCourt.HisknowledgeandjudgmentgainedthroughyearsoflegalpracticeareofgreatvaluetotheBoard.Inaddition,asformerChairmanoftheBoardofTrusteesofTougalooCollegeandaresidentofMississippi,hebringsto the Board his insights into the African-American community andthesouthernregionoftheUnitedStates.Mr.Andersonhasservedonnumerousboardcommittees, including audit,publicpolicy, finance,executive, and nominating committees.
71 1991

10
NameProfessional
Occupation (1) AgeDirector
Since
Robert D. Beyer Mr.BeyerisChairmanofChaparalInvestmentsLLC,aprivateinvestmentfirmandholdingcompanythathefoundedin2009.From2005to2009,Mr.BeyerservedasChiefExecutiveOfficerofTheTCWGroup,Inc.,aglobalinvestmentmanagementfirm.From2000to2005,heservedasPresident and Chief Investment Officer of Trust Company of the West, theprincipaloperatingsubsidiaryofTCW.Mr.BeyerisamemberoftheBoardofDirectorsofTheAllstateCorporationandLeucadiaNationalCorporation.He ischairof theCorporateGovernanceCommittee, amemberoftheFinancialPolicyCommittee,andourLeadDirector.
Mr.Beyerbrings toKrogerhis experience asCEOofTCW, a globalinvestment management firm serving many of the largest institutional investorsintheU.S.HehasexceptionalinsightintoKroger’sfinancialstrategy, and his experience qualifies him to serve as a member ofthe Financial Policy Committee. While at TCW, he also conceived and developed the firm’s riskmanagement infrastructure, an experiencethatisusefultotheKrogerBoardinperformingitsriskmanagementoversight functions. His abilities and service as a director wererecognized by his peers,who selectedMr. Beyer as anOutstandingDirector in 2008 as part of the Outstanding Directors Program of the Financial Times.His strong insights into corporate governance formthefoundationofhisleadershiproleasLeadDirectorontheBoard.
54 1999
David B. Dillon Mr.DillonwaselectedChiefExecutiveOfficerin2003andChairmanoftheBoardofKrogerin2004.Mr.DillonretiredasChiefExecutiveOfficer at the end of calendar year 2013 and will continue to serve as ChairmanoftheBoarduntiltheendofcalendaryear2014.Mr.Dillonserved as President and Chief Operating Officer in 2000, as President in 1999, and as President andChiefOperatingOfficer from1995 to1999. Mr. Dillonwas elected Executive Vice President of Kroger in1990andPresidentofDillonCompanies,Inc.in1986.HeisadirectorofDIRECTVandUnionPacificCorporation,andduringthepastfiveyears was a director of Convergys Corporation.
Mr.DillonbringstoKrogerhisextensiveknowledgeofthesupermarketbusiness,havingover38yearsofexperiencewithKrogerandDillonCompanies.InadditiontohisdepthofknowledgeofKrogerandthefiercely competitive industry in which Kroger operates, he has gained awealthofexperiencebyservingonaudit,compensation,finance,andgovernancecommitteesofotherboards.
63 1995
11
NameProfessional
Occupation (1) AgeDirector
Since
Susan J. Kropf Ms.KropfwasPresidentandChiefOperatingOfficerofAvonProductsInc., a manufacturer and marketer of beauty care products, from2001until her retirement in January2007. She joinedAvon in1970.Prior to hermost recent assignment,Ms.Kropf had been ExecutiveVice President and Chief Operating Officer, Avon North America and GlobalBusinessOperationsfrom1998to2000.From1997to1998shewasPresident,AvonU.S.Ms.KropfwasamemberofAvon’sBoardofDirectorsfrom1998to2006.ShecurrentlyisamemberoftheBoardofDirectorsofCoach,Inc.,MeadWestvacoCorporation,andSherwinWilliams Company. She is a member of the Audit and FinancialPolicy Committees.
Ms.Kropfhasgainedauniqueconsumer insight,having ledamajorbeautycarecompany.Shehasextensiveexperienceinmanufacturing,marketing, supply chain operations, customer service, and productdevelopment,allofwhichassistherinherroleasamemberofKroger’sBoard.Ms.Kropfhasastrongfinancialbackground,andhasservedoncompensation, audit, and corporate governance committees of other boards.ShewasinductedintotheYWCAAcademyofWomenAchievers.
65 2007
David B. Lewis Mr.LewisisashareholderanddirectorofLewis&Munday,aDetroitbased lawfirmwithoffices inWashington,D.C.andNewYorkCity.He isadirectorofH&RBlock, Inc.andSTERISCorporation.He isamemberoftheFinancialPolicyCommitteeandvicechairofthePublicResponsibilitiesCommittee.
Inaddition tohisbackgroundasapracticingattorneyandexpertisein bond financing,Mr. Lewis brings to Kroger’s Board his financialexpertise gained while earning his MBA in Finance as well as hisservice and leadership on Kroger’s audit committee and the boardcommitteesofotherpubliclytradedcompanies.Mr.Lewishasservedon theBoardofDirectorsofConrail, Inc.,LG&EEnergyCorp.,M.A.Hanna,TRW,Inc.,andComerica,Inc.HeisaformerchairmanoftheNationalAssociationofSecuritiesProfessionals.
69 2002
12
NameProfessional
Occupation (1) AgeDirector
Since
W. Rodney McMullen Mr.McMullenwaselectedChiefExecutiveOfficerofKrogerinJanuary2014. Prior to this, he served as President and Chief Operating Officer fromAugust2009toDecember2013.Priortothat,Mr.McMullenwaselected Vice Chairman in 2003, Executive Vice President in 1999, and SeniorVicePresidentin1997.Mr.McMullenisadirectorofCincinnatiFinancial Corporation.
Mr. McMullen has broad experience in the supermarket business,having spenthiscareer spanningover35yearswithKroger.Hehasastrongfinancialbackground,havingservedasourCFO,andplayedamajorroleasarchitectofKroger’sstrategicplan.Hisserviceonthecompensation, executive, and investment committees of Cincinnati Financial Corporation adds depth to his extensive retail experience.
53 2003
Jorge P. Montoya
Mr.MontoyawasPresidentofTheProcter&GambleCompany’sGlobalSnacks&Beveragedivision,andPresidentofProcter&GambleLatinAmerica, from 1999 until his retirement in 2004. Prior to that, he was anExecutiveVicePresidentofProcter&Gamble,aproviderofbrandedconsumerpackagedgoods,from1995to1999.Mr.MontoyaisadirectorofTheGap,Inc.HeischairofthePublicResponsibilitiesCommitteeandamemberoftheCompensationCommittee.
Mr. Montoya brings to Kroger’s Board over 30 years of leadershipexperienceatapremierconsumerproductscompany.HehasadeepknowledgeoftheHispanicmarket,aswellasconsumerproductsandretailoperations.Mr.Montoyahasvastexperience inmarketingandgeneralmanagement,includinginternationalbusiness.Hewasnamedamongthe50mostimportantHispanicsinBusiness&Technology,inHispanic Engineer & Information Technology Magazine.
67 2007
Clyde R. Moore Mr.MooreistheChairmanandChiefExecutiveOfficerofFirstServiceNetworks, a national provider of facility and maintenance repairservices.HeisadirectorofFirstServiceNetworks.Mr.Mooreischairof the Compensation Committee and a member of the CorporateGovernanceCommittee.
Mr. Moore has over 25 years of general management experience inpublicandprivatecompanies.Hehassoundexperienceasacorporateleader overseeing all aspects of a facilities management firm and a manufacturingconcern.Mr.Moore’sexpertisebroadensthescopeoftheBoard’sexperiencetoprovideoversighttoKroger’sfacilitiesandmanufacturingbusinesses.
60 1997
13
NameProfessional
Occupation (1) AgeDirector
Since
Susan M. Phillips Dr.PhillipsisProfessorEmeritusofFinanceatTheGeorgeWashingtonUniversitySchoolofBusiness.ShejoinedthatuniversityasaProfessorandDean in 1998. She retired asDeanof the School of Business asof June 30, 2010, and as Professor the following year. She was amember of the Board of Governors of the Federal Reserve SystemfromDecember1991throughJune1998.BeforeherFederalReserveappointment, Dr. Phillips served as Vice President for Finance and UniversityServicesandProfessorofFinanceinTheCollegeofBusinessAdministrationattheUniversityofIowafrom1987through1991.Sheis a director of CBOEHoldings, Inc., State FarmMutual AutomobileInsuranceCompany, StateFarmLife InsuranceCompany, StateFarmCompanies Foundation, National Futures Association, the Chicago BoardOptionsExchange,andAgnesScottCollege.Dr.Phillipsalsowasa trustee of the Financial Accounting Foundation until the end of 2010. SheisamemberoftheAuditandCompensationCommittees.
Dr.PhillipsbringstotheBoardstrongfinancialacumen,alongwithadeepunderstandingof,andinvolvementwith,therelationshipbetweencorporationsandthegovernment.HerexperienceinacademiabringsauniqueanddiverseviewpointtothedeliberationsoftheBoard.Dr.PhillipshasbeendesignatedanAuditCommitteefinancialexpert.
69 2003
Steven R. Rogel Mr. Rogel was elected Chairman of the Board of WeyerhaeuserCompany, a forest products company, in 1999 and was President and Chief ExecutiveOfficer and a director thereof fromDecember 1997to January 1, 2008 when he relinquished the role of President. HerelinquishedtheCEOroleinAprilof2008andretiredasChairmanasofApril2009.BeforethattimeMr.RogelwasChiefExecutiveOfficer,PresidentandadirectorofWillametteIndustries,Inc.HeservedasChiefOperating Officer ofWillamette Industries, Inc. until October 1995and,beforethattime,asanexecutiveandgroupvicepresidentformorethanfiveyears.Mr.RogelisadirectorofUnionPacificCorporationandduringthepastfiveyearswasadirectorandnon-executiveChairmanoftheBoardofEnergySolutions,Inc.HeisamemberoftheCorporateGovernanceandFinancialPolicyCommittees.
Mr. Rogel has extensive experience in management of largecorporationsatalllevels.HebringstotheBoardauniqueperspective,having led a national supplier of paper products prior to his retirement. Mr.RogelpreviouslyservedasKroger’sLeadDirector,andhasservedon compensation, finance, audit, and governance committees of other corporations.
71 1999
James A. Runde Mr.RundeisaspecialadvisorandaformerViceChairmanofMorganStanley, a financial services provider, where he has been employedsince1974.HewasamemberoftheBoardofDirectorsofBurlingtonResources Inc. prior to its acquisition by ConocoPhillips in 2006.Mr.Runde serves as aTrusteeEmeritusofMarquetteUniversity andthe PierpontMorgan Library. He is amember of the CompensationCommittee and chair of the Financial Policy Committee.
Mr. Runde brings to Kroger’s Board a strong financial background,having ledamajor financial servicesprovider.Hehas servedon thecompensationcommitteeofamajorcorporation.
67 2006

14
NameProfessional
Occupation (1) AgeDirector
Since
Ronald L. Sargent Mr.SargentisChairmanandChiefExecutiveOfficerofStaples,Inc.,aconsumerproductsretailer,wherehehasbeenemployedsince1989.PriortojoiningStaples,Mr.Sargentspent10yearswithKrogerinvariouspositions.InadditiontoservingasadirectorofStaples,Mr.SargentisadirectorofFiveBelow,Inc.Duringthepastfiveyears,hewasadirectorofMattel,Inc.andTheHomeDepot,Inc.Mr.SargentischairoftheAuditCommitteeandamemberofthePublicResponsibilitiesCommittee.
Mr. Sargenthasover30yearsof retail experience, firstwithKrogerand then with increasing levels of responsibility and leadershipat Staples, Inc.His efforts helped carve out a newmarket niche forthe international retailer that he leads. His understanding of retailoperationsandconsumerinsightsareofparticularvaluetotheBoard.Mr.SargenthasbeendesignatedanAuditCommitteefinancialexpert.
58 2006
Bobby S. Shackouls Until the merger of Burlington Resources Inc. and ConocoPhillips,which became effective in 2006, Mr. Shackouls was Chairman oftheBoardofBurlingtonResourcesInc.,anaturalresourcesbusiness,since July 1997 and its President and Chief Executive Officer sinceDecember1995.Hehadbeenadirectorof thatcompanysince1995and President and Chief Executive Officer of Burlington ResourcesOilandGasCompany(formerlyknownasMeridianOilInc.),awholly-ownedsubsidiaryofBurlingtonResources,since1994.Mr.ShackoulsisadirectorofPlainsGPHoldings,L.P.andOasisPetroleumInc.Duringthepastfiveyears,Mr.ShackoulswasadirectorofConocoPhillipsandPNGSGP LLC, the general partner of PAANatural Gas Storage, L.P.Mr. Shackouls is amember of the Audit and Corporate GovernanceCommittees.Mr.ShackoulspreviouslyservedasKroger’sLeadDirector.
Mr. Shackouls brings to the Board the critical thinking that comeswith a chemical engineering background, aswell as his experienceleadingamajornaturalresourcescompany,coupledwithhiscorporategovernance expertise.
63 1999
(1) Exceptasnoted,eachofthedirectorshasbeenemployedbyhisorherpresentemployer(orasubsidiary)in an executive capacity for at least five years.

15
i N F o r M a t i o N c o N c e r N i N g t h e B o a r d o F d i r e c t o r S
c o M M i t t e e S o F t h e B o a r d
The Board of Directors has a number of standing committees including Audit, Compensation andCorporateGovernance.Allstandingcommitteesarecomposedexclusivelyofindependentdirectors.AllBoardcommitteeshavechartersthatcanbefoundonourcorporatewebsiteatir.kroger.comunderGuidelines on Issues of Corporate Governance.
ThetablebelowprovidesthecurrentmembershipofourindependentdirectorsoneachofthestandingcommitteesofourBoardofDirectors.
NameAudit
CommitteeCompensation
Committee
Corporate Governance Committee
Financial Policy
Committee
Public Responsibilities
Committee
ReubenV.Anderson x xRobertD.Beyer Chair xSusanJ.Kropf x xDavidB.Lewis x xJorgeP.Montoya x ChairClydeR.Moore Chair xSusanM.Phillips x xStevenR.Rogel x xJamesA.Runde x ChairRonaldL.Sargent Chair xBobbyS.Shackouls x x
During 2013, the Audit Committee met five times, the Compensation Committee met four times, and the Corporate Governance Committeemet two times. The Audit Committee reviews financial reportingand accounting matters pursuant to its charter and selects our independent accountants. The Compensation CommitteerecommendsfordeterminationbytheindependentmembersofourBoardthecompensationoftheChief Executive Officer, determines the compensation of Kroger’s other senior management, and administers some of our incentive programs. Additional information on the Compensation Committee’s processes and procedures for consideration of executive compensation are addressed in the Compensation Discussion and Analysisbelow.TheCorporateGovernanceCommitteedevelopscriteriaforselectingandretainingmembersoftheBoard,seeksoutqualifiedcandidatesfortheBoard,andreviewstheperformanceoftheBoardand,alongwiththeotherindependentboardmembers,theCEO.
d i r e c t o r N o M i N a t i o N S
TheCorporateGovernanceCommitteewillconsidershareholder recommendations fornominees formembershipontheBoardofDirectors. IfshareholderswishtonominateapersonorpersonsforelectiontotheBoardofDirectorsatour2015annualmeeting,writtennoticemustbesubmittedtotheCompany’sSecretary,andreceivedatourexecutiveofficesnotlaterthanJanuary14,2015.Suchnoticeshouldincludethename,age,businessaddressandresidenceaddressofsuchperson,theprincipaloccupationoremploymentofsuchperson,thenumberofsharesoftheCompanyownedofrecordorbeneficiallybysuchperson,andanyother information relating to theperson thatwouldbe required tobe included inaproxy statementrelatingtotheelectionofdirectors.TheSecretarywillforwardtheinformationtotheCorporateGovernanceCommitteeforitsconsideration.TheCommitteewillusethesamecriteriainevaluatingcandidatessubmittedbyshareholdersasitusesinevaluatingcandidatesidentifiedbytheCommittee.Thesecriteriaare:
• Demonstrated ability in fields considered tobeof value in thedeliberationsof theBoard, includingbusinessmanagement,publicservice,education,science,law,andgovernment;
• Higheststandardsofpersonalcharacterandconduct;

16
• Willingnesstofulfilltheobligationsofdirectorsandtomakethecontributionofwhichheorsheiscapable,includingregularattendanceandparticipationatBoardandcommitteemeetings,andpreparationforallmeetings,includingreviewofallmeetingmaterialsprovidedinadvanceofthemeeting;and
• AbilitytounderstandtheperspectivesofKroger’scustomers,takingintoconsiderationthediversityofour customers, including regional and geographic differences.
Racial, ethnic, and gender diversity is an important element in promoting full, open, and balanceddeliberationsofissuespresentedtotheBoard,andisconsideredbytheCorporateGovernanceCommittee.Some consideration also is given to the geographic location of director candidates in order to provide areasonabledistributionofmembersfromtheoperatingareasoftheCompany.
TheCorporateGovernanceCommitteetypicallyrecruitscandidatesforBoardmembershipthroughitsown efforts and through suggestions from other directors and shareholders. The Committee on occasion has retainedanoutsidesearchfirmtoassistinidentifyingandrecruitingBoardcandidateswhomeetthecriteriaestablishedbytheCommittee.
c o r P o r a t e g o v e r N a N c e
TheBoardofDirectorshasadoptedGuidelines on Issues of Corporate Governance. These Guidelines, which include copies of the current charters for the Audit, Compensation, and Corporate GovernanceCommittees,andtheothercommitteesoftheBoardofDirectors,areavailableonourcorporatewebsiteatir.kroger.com.Shareholdersmayobtainacopyof theGuidelinesbymakingawrittenrequest toKroger’sSecretaryatourexecutiveoffices.
i N d e P e N d e N c e
TheBoardofDirectorshasdeterminedthatallofthedirectors,withtheexceptionofMessrs.DillonandMcMullen,havenomaterialrelationshipswithKrogerand,therefore,areindependentforpurposesoftheNewYork StockExchange listing standards.TheBoardmade its determinationbasedon informationfurnishedbyallmembersregardingtheirrelationshipswithKrogeranditsmanagement,andotherrelevantinformation.Afterreviewingtheinformation,theBoarddeterminedthatallofthenon-employeedirectorswere independentbecause (i) theyall satisfied the independencestandardsset forth inRule10A-3of theSecuritiesExchangeActof1934,(ii)theyallsatisfiedthecriteriaforindependencesetforthinRule303A.02oftheNewYorkStockExchangeListedCompanyManual,(iii)anybusinesstransactionsbetweenKrogerandentitieswithwhichthedirectorsareaffiliated,thevalueofwhichfallsbelowthethresholdsidentifiedbytheNewYorkStockExchangelistingstandards,and(iv)nonehadanymaterialrelationshipswithusexceptforthose arising directly from their performance of services as a director for Kroger.
a u d i t c o M M i t t e e e x P e r t i S e
The Board of Directors has determined that Susan M. Phillips and Ronald L. Sargent, independentdirectorswhoaremembersoftheAuditCommittee,are“auditcommitteefinancialexperts”asdefinedbyapplicableSECregulationsandthatallmembersoftheAuditCommitteeare“financiallyliterate”asthattermisusedintheNYSElistingstandards.
c o d e o F e t h i c S
TheBoardofDirectorshasadoptedThe Kroger Co. Policy on Business Ethics,applicabletoallofficers,employees andmembers of theBoard ofDirectors, includingKroger’s principal executive, financial, andaccounting officers. The Policy is available on our corporatewebsite at ir.kroger.com. ShareholdersmayobtainacopyofthePolicybymakingawrittenrequesttoKroger’sSecretaryatourexecutiveoffices.Weintendtosatisfythedisclosurerequirementregardinganyamendmentto,orawaiverfrom,aprovisionofthe Policyforourprincipalexecutive,financialandaccountingofficersbypostingthatinformationonourwebsiteatir.kroger.com.

17
c o M M u N i c a t i o N S w i t h t h e B o a r d
The Board has established two separate mechanisms for shareholders and interested parties tocommunicatewiththeBoard.Anyshareholderorinterestedpartywhohasconcernsregardingaccounting,improperuseofKrogerassets,orethical improprietiesmayreporttheseconcernsviathetoll-freehotline(800-689-4609)oremail address ([email protected])establishedby theBoard’sAuditCommittee.Theconcerns are investigatedbyKroger’sVicePresidentofAuditingand reported to theAuditCommitteeasdeemedappropriatebytheVicePresidentofAuditing.
ShareholdersorinterestedpartiesalsomaycommunicatewiththeBoardinwritingdirectedtoKroger’sSecretaryatourexecutiveoffices.TheSecretarywillconsiderthenatureofthecommunicationanddeterminewhethertoforwardthecommunicationtothechairoftheCorporateGovernanceCommittee.Communicationsrelatingtopersonnelissuesorourordinarybusinessoperations,orseekingtodobusinesswithus,willbeforwardedtothebusinessunitofKrogerthattheSecretarydeemsappropriate.AllothercommunicationswillbeforwardedtothechairoftheCorporateGovernanceCommitteeforfurtherconsideration.ThechairoftheCorporateGovernanceCommitteewilltakesuchactionasheorshedeemsappropriate,whichmayincludereferraltotheCorporateGovernanceCommitteeortheentireBoard.
a t t e N d a N c e
TheBoardofDirectorsheldsevenmeetingsin2013.During2013,allincumbentdirectorsattendedatleast75%oftheaggregatenumberofmeetingsoftheBoardandcommitteesonwhichthatdirectorserved.MembersoftheBoardareexpectedtousetheirbesteffortstoattendallannualmeetingsofshareholders.Allfourteen membersthenservingontheBoardattendedlastyear’sannualmeeting.
c o M P e N S a t i o N c o N S u l t a N t S
TheCompensationCommitteedirectlyengagesacompensationconsultantfromMercerHumanResourceConsulting to advise the Committee in the design of compensation for executive officers. In 2013, Kroger paid thatconsultant$375,944forworkperformedfortheCommittee.Kroger,onmanagement’srecommendation,retainedtheparentandaffiliatedcompaniesofMercerHumanResourceConsultingtoprovideotherservicesforKroger in2013, forwhichKrogerpaid$4,743,100.Theseotherservicesprimarilyrelatedto insuranceclaims(forwhichKrogerwasreimbursedbyinsurancecarriersasclaimswereadjusted),insurancebrokerageandbondingcommissions,andpensionconsulting.Krogeralsomadepaymentstoaffiliatedcompaniesforinsurancepremiumsthatwerecollectedbytheaffiliatedcompaniesonbehalfofinsurancecarriers,buttheseamountsarenotincludedinthetotalsreferencedabove,astheamountswerepaidovertoinsurancecarriersforservicesprovidedbythosecarriers.AlthoughneithertheCommitteenortheBoardexpresslyapprovedtheother services, after taking intoconsideration theNYSE’s independence standards and the SEC rules,theCommitteedeterminedthattheconsultant is independentandhisworkhasnotraisedanyconflictofinterestbecause(a)hewasfirstengagedbytheCommitteebeforehebecameassociatedwithMercer;(b)heworksexclusivelyfortheCommitteeandnot forourmanagement;(c)hedoesnotbenefit fromtheotherworkthatMercer’sparentandaffiliatedcompaniesperformforKroger;and(d)neithertheconsultantnortheconsultant’steamperformanyotherservicesonbehalfofKroger.
NomemberoftheCompensationCommitteewasanofficeroremployeeoftheCompanyduringfiscalyear2013,andnomemberoftheCompensationCommitteewasformerlyanofficeroftheCompanyorwasapartytoanydisclosablerelatedpersontransactioninvolvingtheCompany.Duringfiscalyear2013,noneoftheexecutiveofficersoftheCompanyservedontheboardofdirectorsoronthecompensationcommitteeof any other entity that has or had executive officers serving as amember of the Board of Directors orCompensation Committee of the Company.
18
B o a r d o v e r S i g h t o F e N t e r P r i S e r i S k
While riskmanagement is primarily the responsibility of Kroger’s management team, the Board ofDirectorsisresponsiblefortheoverallsupervisionofourriskmanagementactivities.TheBoard’soversightofthematerialrisksfacedbyKrogeroccursatboththefullBoardlevelandatthecommitteelevel.
TheBoard’sAuditCommitteehasoversightresponsibilitynotonlyforfinancialreportingofKroger’smajor financial exposures and the stepsmanagement has taken tomonitor and control those exposures,butalsofortheeffectivenessofmanagement’sprocessesthatmonitorandmanagekeybusinessrisksfacingKroger,aswellas themajorareasof riskexposureandmanagement’sefforts tomonitorandcontrol thatexposure.TheAuditCommitteealsodiscusseswithmanagementitspolicieswithrespecttoriskassessmentandriskmanagement.
Management, including Kroger’s Chief Ethics and Compliance Officer, provides regular updatesthroughouttheyeartotherespectivecommitteesregardingthemanagementoftheriskstheyoversee,andeachofthesecommitteesreportsonrisktothefullBoardateachregularmeetingoftheBoard.
Inadditiontothereportsfromthecommittees,theBoardreceivespresentationsthroughouttheyearfromvariousdepartmentandbusinessunitleadersthatincludediscussionofsignificantrisksasnecessary.AteachBoardmeeting,theChairmanandtheCEOaddressmattersofparticularimportanceorconcern,includinganysignificantareasofriskthatrequireBoardattention.Additionally,throughdedicatedsessionsfocusingentirelyon corporate strategy, the full Board reviews in detail Kroger’s short- and long-term strategies, includingconsiderationof significant risks facingKroger and theirpotential impact. The independentdirectors, inexecutivesessionsledbytheLeadDirector,addressmattersofparticularconcern,includingsignificantareasofrisk,thatwarrantfurtherdiscussionorconsiderationoutsidethepresenceofKrogeremployees.
We believe that our approach to risk oversight, as described above, optimizes our ability to assessinter-relationshipsamong thevarious risks,make informedcost-benefitdecisions,andapproachemergingrisks in aproactivemanner forKroger.We alsobelieve that our risk structure complements our currentBoardleadershipstructure,asitallowsourindependentdirectors,throughthefivefullyindependentBoardcommittees, and in executive sessions of independent directors led by an independent LeadDirector, toexerciseeffectiveoversightoftheactionsofmanagement,ledbyMr.McMullenasCEO,inidentifyingrisksandimplementingeffectiveriskmanagementpoliciesandcontrols.
B o a r d l e a d e r S h i P S t r u c t u r e a N d l e a d d i r e c t o r
OurBoardiscomposedofelevenindependentnon-employeedirectors,andtwomanagementdirectors,Mr.Dillon,theChairmanoftheBoardandourformerChiefExecutiveOfficer,andMr.McMullen,ourChiefExecutive Officer. In addition, as provided in our Guidelines on Issues of Corporate Governance,theBoardhasdesignatedoneoftheindependentdirectorsasLeadDirector.TheBoardhasestablishedfivestandingcommittees—audit,compensation,corporategovernance,financialpolicy,andpublicresponsibilities.EachBoardcommitteeiscomposedsolelyof independentdirectors,eachwithadifferentindependentdirectorservingascommitteechair.ThemixofexperiencedindependentandmanagementdirectorsthatmakeupourBoard,alongwiththe independentroleofourLeadDirectorandour independentBoardcommittees,benefitsKrogeranditsshareholders.
TheBoarddesignatesoneof the independentdirectorsasaLeadDirector.TheLeadDirectorservesa variety of roles, including reviewing and approvingBoard agendas,meetingmaterials and schedules toconfirmtheappropriatetopicsarereviewedandsufficienttimeisallocatedtoeach;servingasliaisonbetweenthe Chairman of the Board,management, and the non-management directors; presiding at the executivesessionsofindependentdirectorsandatallothermeetingsoftheBoardofDirectorsatwhichtheChairmanoftheBoardisnotpresent;callinganexecutivesessionofindependentdirectorsatanytimeandservingastheBoard’srepresentativeforanyconsultationanddirectcommunication,followingarequest,withmajorshareholders.UnlessotherwisedeterminedbytheBoard,thechairoftheCorporateGovernanceCommitteeisdesignatedas theLeadDirector.RobertBeyer, an independentdirector and thechairof theCorporateGovernanceCommittee, iscurrentlyourLeadDirector.Mr.Beyer isaneffectiveLeadDirector forKrogerdue to, among other things, his independence, his deep strategic and operational understanding of Kroger obtainedwhileservingasaKrogerdirector,his insight intocorporategovernanceandhisexperienceonotherboards.
19
With respect to the roles of Chairman and CEO, the GuidelinesprovidethattheBoardwilldeterminewhenitisinthebestinterestsofKrogeranditsshareholdersfortherolestobeseparatedorcombined,andtheBoardexercises itsdiscretion as it deemsappropriate in lightofprevailingcircumstances.Aspartofthe succession planning process, the Guidelines provide that upon the selection of a new Chief Executive Officer,theBoardwilldeterminewhetheraseparationoftheofficesisappropriate.TheBoardbelievesthatthecombinationorseparationofthesepositionsshouldcontinuetobeconsideredaspartofthesuccessionplanning process, as was the case in 2003, and again in 2014, when the roles were separated.
OurBoardandeachof its committeesconduct an annual evaluation todeterminewhether they arefunctioningeffectively.Aspartofthisannualself-evaluation,theBoardassesseswhetherthecurrentleadershipstructurecontinuestobeappropriateforKrogeranditsshareholders.OurGuidelinesprovidetheflexibilityforourBoardtomodifyourleadershipstructureinthefutureasappropriate.WebelievethatKroger,likemanyU.S.companies,hasbeenwell-servedbythisflexibleleadershipstructure.

20
c o M P e N S a t i o N d i S c u S S i o N a N d a N a l y S i S
e x e c u t i v e c o M P e N S a t i o N – o v e r v i e w
As one of the largest retailers in the world, our executive compensation philosophy remains to attract andretainthebestmanagementtalentandtomotivatetheseemployeestoachieveourbusinessandfinancialgoals.Webelieveourstrategycreatesvalueforshareholdersinamannerconsistentwithourfocusonourcorevalues: honesty, integrity, respect, inclusion, diversity, and safety.
Toachieveourobjectives,ourCompensationCommitteeseekstoensurethatcompensationiscompetitiveandthatthereisadirectlinkbetweenpayandperformance.Todoso,itisguidedbythefollowingprinciples:
• Asignificantportionofpayshouldbeperformance-based,increasingproportionallywithanexecutive’slevelofresponsibility;
• Compensation should include incentive-based pay to drive performance, providing superior pay forsuperiorperformance,includingbothashort-andlong-termfocus;
• Compensationpoliciesshouldincludeanopportunityfor,andarequirementof,equityownership;and
• Componentsofcompensationshouldbetiedtoanevaluationofbusinessandindividualperformancemeasuredagainstmetricsthatalignwithourbusinessstrategy.
The compensation of our senior executives in fiscal year 2013 reflects these principles. Total compensation fortheyearisanindicatorofhowwellKrogerperformedcomparedtoourbusinessplan,reflectinghowourcompensationprogramrespondstobusinesschallengesandthemarketplace.Wecontinuetodeliversalesgrowth and positive earnings results.
• Akeymetric,identicalsupermarketsales,excludingthe53rdweekin2012andfuel,increased3.6%from2012.Throughfiscal2013,wehaveachieved41consecutivequartersofpositiveidenticalsalesgrowth.
• Netearningsperdilutedsharewere$2.90,andevenafter taking intoaccount several items thatwebelievearenecessary tomake these resultscomparable to fiscal2012,our results still exceededourguidance range.
• InSeptember2013,theBoardofDirectorsraisedthequarterlycashdividendby10%,to$0.165pershare.
• Kroger’sstockpriceincreased29.4%infiscalyear2013.
The Committee believes our management produced outstanding results in 2013, measured againstincreasinglyaggressivebusinessplanobjectivesforsales,earnings,andourstrategicplan.Thecompensationpaidtoournamedexecutiveofficersreflectedthisfactastheannualperformance-basedcashbonuspaidoutat104.949%ofbonuspotentials.Thestronglinkbetweenpayandperformanceisillustratedbyacomparisonofthe2012annualcashbonus,withan85.881%payout.In2012,weperformedwellbutdidnotachieveallofourbusinessplanobjectives.In2013,allofourbusinessplangoalswereexceeded(withtheexceptionofoursalesgoal,whichfellslightlyshort),resultinginanannualbonuspayoutthatexceeded100%ofpotentials.
Inkeepingwithouroverallcompensationphilosophy,weendeavortoensurethatourcompensationpracticesconformtobestpractices.Inparticular,overthepastseveralyearswehave:
• putinplacesignificantstockownershipguidelinelevelstoreinforcethelinkbetweentheinterestsofournamedexecutiveofficersandthoseofourshareholders;
• adopted claw-back policies under which the repayment of bonuses may be required incertaincircumstances;
• eliminatedtaxgross-ups;
• adoptedtherecommendationofshareholdersthattheybepermittedannually,onanadvisorybasis,tovoteonexecutivecompensation;and
• adoptedapolicyprohibitinghedgingandshortsales,andrestrictingpledging,ofKrogercommonsharesbyourofficersanddirectors.

21
Inaddition,beginningin2010,fiftypercentofthetime-basedequityawardsthatotherwisewouldhavebeengrantedtothenamedexecutiveofficersasrestrictedstockhavebeenreplacedwithperformanceunitsthatareearnedonlytotheextent thatperformanceobjectivesareachieved.Equitycompensationawardscontinuetoplayanimportantroleinrewardingnamedexecutiveofficersfortheachievementoflong-termbusinessobjectivesandprovidingincentivesforthecreationofshareholdervalue.
The following discussion and analysis addresses the compensation of the named executive officers, and thefactorsconsideredbytheCommitteeinsettingcompensationforthenamedexecutiveofficersandmakingrecommendations to the independentBoardmembers in the case of theCEO’s compensation.Additionaldetail isprovided in thecompensation tablesand theaccompanyingnarrativedisclosures that followthisdiscussion and analysis.
e x e c u t i v e c o M P e N S a t i o N – o B j e c t i v e S
TheCommitteehasseveral relatedobjectives regardingcompensation.First, theCommitteebelievesthatcompensationmustbedesignedtoattractandretain thosebestsuitedto fulfill thechallengingrolesthatexecutiveofficersplayatKroger.Second,someelementsofcompensationshouldhelpaligntheinterestsof the officers with your interests as shareholders. Third, compensation should create strong incentives for the officers (a) to achieve the annual business plan targets established by the Board, and (b) to achieveKroger’s long-termstrategicobjectives. Indevelopingcompensationprogramsandamounts tomeet theseobjectives,theCommitteeexercisesjudgmenttoensurethatexecutiveofficercompensationisappropriateandcompetitiveinlightofKroger’sperformanceandtheneedsofthebusiness.
S h a r e o w N e r S h i P g u i d e l i N e S
Tomore closely align the interests of the officerswith your interests as shareholders, the Board ofDirectorshasadoptedstockownershipguidelines.Theseguidelinesrequirenon-employeedirectors,officersandsomeotherkeyexecutivestoacquireandholdaminimumdollarvalueofKrogercommonshares.Theguidelines require the CEO to acquire andmaintain ownership of Kroger shares equal to five times hisbasesalary;theChiefOperatingOfficeratfourtimeshisbasesalary;ExecutiveVicePresidents,SeniorVicePresidentsandnon-employeedirectorsatthreetimestheirbasesalariesorannualbasecashretainers;andotherofficersandkeyexecutivesattwotimestheirbasesalaries.Coveredindividualsareexpectedtoachievethetarget levelwithinfiveyearsofappointmenttotheirposition.Krogershares, includingequityawardsfromKroger,maynotbesoldbycoveredindividualspriortoachievingholdingsrequiredbytheguidelines(otherthantopayfortheexercisepriceofoptionsandthetaxesassociatedwithequityawards),withouttheapproval of Kroger’s CEO.
r e S u l t S o F 2 0 1 3 a d v i S o r y v o t e t o a P P r o v e e x e c u t i v e c o M P e N S a t i o N
At the 2013 Annual Meeting of Shareholders, we held our third annual advisory vote on executivecompensation.Over97%ofthevotescastwereinfavoroftheadvisoryproposal in2013.TheCommitteeconsideredthisoverwhelminglyfavorableoutcomeandbelievesitconveysourshareholders’supportoftheCommittee’s decisions and the existing executive compensation programs. As a result, the Committee made no material changes in the structure of our compensation programs or pay for performance philosophy. At the 2014AnnualMeetingofShareholders,inkeepingwithourshareholders’requestforanannualadvisoryvote,we will again hold a vote to approve executive compensation (see page 55).TheCommitteewillcontinuetoconsider the results from this year’s and future advisory votes on executive compensation.
r o l e o F c o M P e N S a t i o N c o M M i t t e e
The Compensation Committee of the Board has the primary responsibility for establishing thecompensation of Kroger’s executive officers, including the named executive officers, with the exception of the Chief Executive Officer. The Committee’s role regarding the CEO’s compensation is to makerecommendationstotheindependentmembersoftheBoard;thoseindependentBoardmembersestablishthe CEO’s compensation.

22
e S t a B l i S h i N g e x e c u t i v e c o M P e N S a t i o N
TheindependentmembersoftheBoardhavetheexclusiveauthoritytodeterminetheamountoftheCEO’s salary; thebonuspotential for theCEO; thenature and amountof anyequity awardsmade to theCEO;andanyothercompensationquestionsrelatedto theCEO. Insetting theannualbonuspotential fortheCEO,theindependentdirectorsdeterminethedollaramountthatwillbemultipliedbythepercentagepayoutundertheannualbonusplangenerallyapplicabletoallcorporatemanagement,includingthenamedexecutive officers. The independent directors retain discretion to reduce the percentage payout the CEO wouldotherwisereceive.TheindependentdirectorsthusmakeaseparatedeterminationannuallyconcerningboththeCEO’sbonuspotentialandthepercentageofbonuspaid.
The Committee performs the same function and exercises the same authority as to the other named executive officers. The Committee’s annual review of compensation for the named executive officers includes the following:
• Conductsanannualreviewofallcomponentsofcompensation,quantifyingtotalcompensationforthenamed executive officers on tally sheets. The review includes a summary for each named executive officer ofsalary;annualperformance-basedcashbonus;long-termperformance-basedcashandperformanceunitcompensation;equity;accumulatedrealizedandunrealizedstockoptiongainsandrestrictedstockand performance unit values; the value of any perquisites; retirement benefits; severance benefitsavailableunderTheKrogerCo.EmployeeProtectionPlan;andearningsandpayoutsavailableunderKroger’snonqualifieddeferredcompensationprogram.
• ConsidersinternalpayequityatKrogertoensurethattheCEOisnotcompensateddisproportionately.The Committee has assured itself that the compensation of Kroger’s CEO and that of the other named executiveofficersbearsareasonablerelationshiptothecompensationlevelsofotherexecutivepositionsatKrogertakingintoconsiderationperformanceanddifferencesinresponsibilities.
• ReviewsareportfromtheCommittee’scompensationconsultants(describedbelow)comparingnamedexecutive officer and other senior executive compensation with that of other companies, primarily our competitors,toensurethattheCommittee’sobjectivesofcompetitivenessaremet.
• TakesintoaccountarecommendationfromtheCEO(exceptinthecaseofhisowncompensation)forsalary,bonuspotential, andequity awards foreachof the seniorofficers including theothernamedexecutiveofficers.TheCEO’srecommendation takes intoconsiderationtheobjectivesestablishedbyandthereportsreceivedbytheCommitteeaswellashisassessmentofindividualjobperformanceandcontributiontoourmanagementteam.
• Looksathistoricalinformationregardingsalary,bonus,andequitycompensationfora3-yearperiod.
Inconsideringeachof the factorsabove, theCommitteedoesnotmakeuseofa formula,but rathersubjectivelyreviewseachinsettingcompensation.
t h e c o M M i t t e e ’ S c o M P e N S a t i o N c o N S u l t a N t S a N d B e N c h M a r k i N g
As referenced earlier in this compensation discussion and analysis, the Committee directly engages a compensationconsultantfromMercerHumanResourceConsultingtoadvisetheCommitteeinthedesignofcompensation for executive officers.
TheMercer consultant conducts an annual competitive assessment of executive positions atKrogerfor theCommittee.Theassessment isoneof severalbases, asdescribedabove,onwhich theCommitteedetermines compensation. The consultant assesses:
• Basesalary;
• Targetannualperformance-basedbonus;
• Targetannualcashcompensation(thesumofsalaryandannualbonus);
• Annualizedlong-termincentiveawards,suchasstockoptions,restrictedshares,andperformance-basedlong-termcashbonusesandperformance-basedequityawards;and
• Totaldirectcompensation(thesumofalltheseelements).
23
Theconsultantcomparestheseelementsagainstthoseofothercompaniesinagroupofpublicly-tradedfood and drug retailers. For 2013, the group consisted of:
Costco Wholesale SupervaluCVS/Caremark TargetRite Aid Wal-MartSafeway Walgreens
Thispeergroupisthesamegroupaswasusedin2012.Themake-upofthecompensationpeergroupis reviewed annually and modified as circumstances warrant. Industry consolidation and other competitive forces will change the peer group used over time. The consultant also provides the Committee data from companiesin“generalindustry,”arepresentationofmajorpublicly-tradedcompanies.Thesedataarereferencepoints,particularlyforseniorstaffpositionswherecompetitionfortalentextendsbeyondtheretailsector.
In 2009, the Committee directly engaged an additional compensation consultant to conduct a review of Kroger’s executive compensation. This consultant, from FredericW. Cook & Co., Inc., examined thecompensationphilosophy,peergroupcomposition,annualcashbonus,andlong-termincentivecompensationincludingequityawards.TheconsultantconcludedthatKroger’sexecutivecompensationprogrammettheCommittee’sobjectives,andthatitprovidesastronglinkagebetweenpayandperformance.TheCommitteeexpectstoengageanadditionalcompensationconsultantfromtimetotimeasitdeemsadvisable.
ConsideringthesizeofKrogerinrelationtootherpeergroupcompanies,theCommitteebelievesthatsalariespaidtoourexecutiveofficersshouldbeatorabovethemedianpaidbycompetitorsforcomparablepositions.Thecommitteealsoaimstoprovideanannualbonuspotential toourexecutiveofficers that, ifthe increasingly more challenging annual business plan objectives are achieved, would cause total cashcompensationtobemeaningfullyabovethemedian.
c o M P o N e N t S o F e x e c u t i v e c o M P e N S a t i o N a t k r o g e r
Compensation for our named executive officers is comprised of the following:
• Salary;
• Performance-BasedAnnualCashBonus(annual,non-equityincentivepay);
• Performance-Based Long-Term Compensation (long-term, cash and performance unitincentivecompensation);
• OtherEquity(non-qualifiedstockoptionsandrestrictedstock);
• Retirementandotherbenefits;and
• Perquisites.
S a l a r y
Weprovideournamedexecutiveofficersandotheremployeesafixedamountofcashcompensation–salary–fortheirwork.Salariesfornamedexecutiveofficers(withtheexceptionoftheCEO)areestablishedeachyearbytheCommittee,inconsultationwiththeCEO.TheCEO’ssalaryisestablishedbytheindependentdirectors.SalariesforthenamedexecutiveofficerswerereviewedinJune2013.
Theamountofeachexecutive’ssalaryisinfluencedbynumerousfactorsincluding:
• AnassessmentofindividualcontributioninthejudgmentoftheCEOandtheCommittee(or,inthecaseoftheCEO,oftheCommitteeandtherestoftheindependentdirectors);
• Benchmarkingwithcomparablepositionsatpeergroupcompanies;
• Tenure;and
• RelationshipwiththesalariesofotherexecutivesatKroger.

24
Theassessmentof individualcontribution isbasedonasubjectivedetermination,without theuseofperformance targets, in the following areas:
• Leadership;
• Contributiontotheofficergroup;
• Achievementofestablishedobjectives,totheextentapplicable;
• Decision-makingabilities;
• Performanceoftheareasorgroupsdirectlyreportingtotheofficer;
• Increasedresponsibilities;
• Strategicthinking;and
• FurtheranceofKroger’scorevalues.
TheamountsshownbelowreflectthesalariesofthenamedexecutiveofficersineffectfollowingtheannualreviewoftheircompensationinJune.
Salaries
2011 2012 2013
DavidB.Dillon . . . . . . . . . . . . . . . . . . . . . . . . . . . . . . . . . . . . . . . . $1,290,000 $1,330,000 $1,370,000W.RodneyMcMullen* . . . . . . . . . . . . . . . . . . . . . . . . . . . . . . . . . . $ 910,000 $ 939,600 $ 968,600J.MichaelSchlotman . . . . . . . . . . . . . . . . . . . . . . . . . . . . . . . . . . . $ 650,000 $ 671,100 $ 704,655KathleenS.Barclay** . . . . . . . . . . . . . . . . . . . . . . . . . . . . . . . . . . . — $ 677,300 $ 700,000PaulW.Heldman . . . . . . . . . . . . . . . . . . . . . . . . . . . . . . . . . . . . . . $ 739,000 $ 763,000 $ 786,000MichaelL.Ellis*** . . . . . . . . . . . . . . . . . . . . . . . . . . . . . . . . . . . . . . — — $ 527,360
* Mr.McMullen’ssalaryincreasedto$1,100,000effectivewithhispromotiontoCEOonJanuary1,2014.
** Ms.Barclaybecameanamedexecutiveofficerin2012.
*** Mr.Ellisbecameanamedexecutiveofficerin2013.Hissalaryincreasedto$775,000effectivewithhispromotiontoPresidentandCOOonJanuary1,2014.
P e r F o r M a N c e - B a S e d a N N u a l c a S h B o N u S
Alargepercentageofouremployeesatalllevels,includingthenamedexecutiveofficers,areeligibletoreceiveaperformance-basedannualcashbonusbasedontheperformanceofKroger(inthecaseofthenamedexecutiveofficers)orbusinessunit(inthecaseofemployeesinourbusinessunits).TheCommitteeestablishesbonuspotentialsforeachexecutiveofficer,otherthantheCEOwhosebonuspotentialisestablishedbytheindependentdirectors.Actualpayouts,whichcanexceed100%ofthepotentialamountsbutmaynotexceed200%ofthepotentialamounts,representtheextenttowhichperformancemeetsorexceedsthethresholdsestablishedbytheCommittee.
TheCommitteeconsidersseveralfactorsinmakingitsdeterminationorrecommendationastobonuspotentials. First, the individual’s levelwithin the organization is a factor in that the Committee believesthatmoreseniorexecutivesshouldhaveasubstantialpartoftheircompensationdependentuponKroger’sperformance.Second, the individual’s salary isa factorso thatasubstantialportionofanamedexecutiveofficer’s total cash compensation is dependent upon Kroger’s performance. Finally, the Committee considers thereportsofitscompensationconsultantstoassessthebonuspotentialofthenamedexecutiveofficersinlightoftotalcompensationpaidtocomparableexecutivepositionsintheindustry.

25
TheannualcashbonuspotentialineffectfollowingtheannualreviewofcompensationinJuneforeachnamedexecutiveofficerisshownbelow.Actualbonuspayoutsareproratedtoreflectchanges,ifany,tobonuspotentials during the year.
Annual Bonus Potential
2011 2012 2013
DavidB.Dillon . . . . . . . . . . . . . . . . . . . . . . . . . . . . . . . . . . . . . . . . $1,500,000 $1,500,000 $1,500,000W.RodneyMcMullen* . . . . . . . . . . . . . . . . . . . . . . . . . . . . . . . . . . $1,000,000 $1,000,000 $1,000,000J.MichaelSchlotman . . . . . . . . . . . . . . . . . . . . . . . . . . . . . . . . . . . $ 525,000 $ 550,000 $ 550,000KathleenS.Barclay** . . . . . . . . . . . . . . . . . . . . . . . . . . . . . . . . . . . — $ 550,000 $ 550,000PaulW.Heldman . . . . . . . . . . . . . . . . . . . . . . . . . . . . . . . . . . . . . . $ 550,000 $ 550,000 $ 550,000MichaelL.Ellis*** . . . . . . . . . . . . . . . . . . . . . . . . . . . . . . . . . . . . . . — $ — $ 375,000
* Mr.McMullen’sannualbonuspotentialincreasedto$1,500,000effectivewithhispromotiontoCEOonJanuary1,2014.
** Ms.Barclaybecameanamedexecutiveofficerin2012.
*** Mr.Ellisbecameanamedexecutiveofficerin2013.Hisannualbonuspotentialincreasedto$750,000effectivewithhispromotiontoPresidentandCOOonJanuary1,2014.
Over time the Committee and our independent directors have placed an increased emphasis on our strategic plan bymaking the targetmore difficult to achieve. The bonus plan allows forminimal bonustobeearnedat relatively low levelsofperformance toprovide incentive for achievingevenhigher levelsof performance.
The amount of bonus that the named executive officers earn each year is determined by Kroger’sperformance compared to targets establishedby theCommittee andour independent directors basedonthebusinessplanadoptedbytheBoardofDirectors.In2013,one-thirdofthebonuswasbasedonatargetforidenticalsaleswithoutfuel;one-thirdwasbasedonatargetforEBITDAwithoutfuel;andone-thirdwasbasedonimplementationandresultsofasetofmeasuresunderourstrategicplan.Anadditional5%wouldbeearnedifKrogerachievedthreegoalswithrespecttoitssupermarketfueloperations:achievementofthetargetedfuelEBITDA,increaseofatleast3%intotalgallonssold, andachievementoftheplannednumberoffuel centers placed in service.
Following the close of the year, the Committee reviewed Kroger’s performance against the identical sales withoutfuel,EBITDAwithoutfuel,andstrategicplanobjectivesanddeterminedtheextenttowhichKrogerachievedthoseobjectives. Kroger’sEBITDAwithoutfuelfor2013was$4.245billionandKroger’sidenticalsaleswithout fuel for2013were3.5%. In2013,Kroger’s supermarket fuel EBITDAwas$232.990million,whichexceededthegoalof$184.875millionnecessarytoearnabonusforthefuelcomponent.Kroger’sfuelgallonsalesinsupermarketfuelcenterswere4.431billiongallons,or6.6%overtheprioryear.Weoperated1,240supermarketfuelcentersasoftheendof2013,exceedingourgoalof1,235centers.Asaresult,thepayoutpercentageincludedtheadditional5%fuelbonus.Duetoourperformancewhencomparedtothetargetsestablishedby theCommittee,andbasedon thebusinessplanadoptedby theBoardofDirectors,thenamedexecutiveofficersearned104.949%oftheirbonuspotentials.Thisisthesamebonuspercentagepayoutreceivedbyallotherparticipantsintheannualcorporatebonusplan.

26
The 2013 targets established by the Committee for annual bonus amounts based on identical saleswithoutfuelandEBITDAwithoutfuelresults,theactual2013results,andthebonuspercentageearnedineachofthecomponentsofnamedexecutiveofficerbonus,wereasfollows:
Targets
Component Minimum 100% Result Amount Earned
IdenticalSaleswithoutfuel . . . . . . . . . 1.6% 3.6% 3.5% 31.679%EBITDAwithoutfuel . . . . . . . . . . . . . . $3.583Billion $4.216Billion* $4.245Billion 34.474%StrategicPlan. . . . . . . . . . . . . . . . . . . . ** ** ** 33.796%FuelBonus . . . . . . . . . . . . . . . . . . . . . . [asdescribedinthetextabove] 5.000%Total Earned . . . . . . . . . . . . . . . . . . . . . 104.949%
* Payoutisat125%ifidenticalsalesgoalisachieved.
** The Strategic Plan component also was established by the Committee, but is not disclosed as it iscompetitively sensitive.
In2013,asinallyears,theCommitteeretaineddiscretiontoreducethebonuspayoutforallexecutiveofficers,includingthenamedexecutiveofficers,iftheCommitteedeterminedforanyreasonthatthebonuspayoutswerenotappropriate.TheindependentdirectorsretainedthatdiscretionfortheCEO’sbonus.Thosebodiesalsoretaineddiscretiontoadjustthetargetsundertheplanshouldunanticipateddevelopmentsariseduring theyear.Noadjustmentsweremade to the targets in2013.TheCommittee, and the independentdirectorsinthecaseoftheCEO,determinedthatthebonuspayoutsforthenamedexecutiveofficersshouldremain the same as other participants.
The percentage paid for 2013 represented excellent performance that exceeded our business planobjectives.Acomparisonofbonuspercentagesforthenamedexecutiveofficersinprioryearsdemonstratesthevariabilityofannualcashbonusincentivecompensation:
Fiscal Year Annual Cash Bonus
Percentage
2013 104.949%2012 85.881%2011 138.666%2010 53.868%2009 38.450%2008 104.948%2007 128.104%2006 141.118%2005 132.094%2004 55.174%
Theactualamountsofannualperformance-basedcashbonusespaidtothenamedexecutiveofficersfor2013arereported in theSummaryCompensationTableunder theheading“Non-Equity IncentivePlanCompensation” and footnote 4. These amounts represent the bonus potentials for each named executiveofficermultipliedbythe104.949%payoutpercentageearnedin2013.Innoeventcananyparticipantreceiveaperformance-basedannualcashbonusinexcessof$5,000,000.Themaximumamountthataparticipant,including each named executive officer, can earn is further limited to 200% of the participant’s bonuspotential amount.
Theperformance-basedannualcashbonusfor2014willbedeterminedbasedonKroger’sperformanceagainsttheidenticalsaleswithoutfuel,EBITDAwithoutfuel,strategicplan,andoperatingcostsasapercentageofsalesobjectivesestablishedbytheCommittee.Thefirstthreemetricswillbeweightedat30%eachandthefinalmetricwillbeweightedat10%.Theunderlyingstrategymetricshavebeenrevisedfromprioryearstofocusonshorter-termmeasures,asthelong-termbonusemphasizeslong-termperformance.The2014planalsoprovidesforanadditional5%payoutifourgoalsforsupermarketfuelEBITDA,supermarketfuelgallonssold,andtargetednumberoffuelcentersinoperationatthefiscalyearendareachieved.

27
l o N g -t e r M i N c e N t i v e S
TheCommitteebelievesintheimportanceofprovidinganincentivetothenamedexecutiveofficerstoachievethelong-termgoalsestablishedbytheBoardofDirectorsbyconditioningasignificantportionofcompensation on the achievement of those goals.
In 2006, theCommittee adopted the first in a series of long-termperformancebased compensationplansdesignedtorewardparticipantsfortheircontributiontothelong-termperformanceofKroger.Theseearlierplansprovidedforoverlappingfouryearperformanceperiodsthatallowedfortheearningofalong-termcashbonus.In2010,Kroger’slong-termincentiveprogramwasredesignedtocombinethetotalvalueofourlong-termcashbonusandequityprogramsintoacohesive,strategicrewardforeligibleexecutivesattheVicePresidentlevelandabove.Approximatelyfiftypercentoftheplanvalueisperformance-based,deliveredin cash and performance units, contingent on the achievement of certain strategic performance measures. Theotherfiftypercentofthevalueistime-basedanddeliveredinstockoptionsandrestrictedshares.Eachcomponentisdescribedinmoredetailbelow.
P e r F o r M a N c e B a S e d l o N g -t e r M c o M P e N S a t i o N
Thelong-termincentiveplanadoptedin2010(andearnedin2012)providesthemodelforourcombinedplan structure. Subsequent plans have been adopted each year thereafter. Each of these plans has thefollowing characteristics:
• Performanceismeasuredoverathreeyearperiod.
• Between130and170executives,includingthenamedexecutiveofficers,participateineachplan.
• Awardsincludebothcashandperformanceunits.
Ø Thecashbonusbaseequalstheexecutive’ssalaryattheendofthefiscalyearprecedingtheplanadoption date (or for those participants entering the plan after the commencement date, as of the dateofcommencingparticipationintheplan).
Ø A fixednumberofperformanceunits is awarded to eachparticipant. The awards arepaidoutin Kroger common shares, along with a cash amount equal to the dividends paid during theperformanceperiodonthenumberofissuedcommonshares.
• CompensationundertheplansisearnedbasedonourperformanceagainstmetricsestablishedbytheCommitteeatthebeginningoftheperformanceperiod.
• Thepayoutpercentage,basedontheextenttowhichtheperformancemetricsareachieved,isappliedtoboththebonusbaseandthenumberofperformanceunitsawarded.
• Actualpayoutscannotexceed100%of thecashbonusbaseor100%of thenumberofperformanceunits awarded.
• Innoeventcanacashbonusawardexceed$5,000,000.

28
Thefollowingtablesummarizeseachofthelong-termperformancebasedplansfortheyearsshown:
2011 Plan 2012 Plan 2013 Plan 2014 Plan
Performance Period 2011 to 2013 2012 to 2014 2013to2015 2014to2016
Payout Date March2014 March2015 March2016 March2017
Cash Bonus Base Salaryatendoffiscalyear2010*
Salaryatendoffiscalyear2011*
Salaryatendoffiscalyear2012*
Salaryatendoffiscalyear2013*
Performance Metrics
Strategic Plan 2%payoutperunitimprovement
2%payoutperunitimprovement
2%payoutperunitimprovement
2%payoutperunitimprovement
Reduction in Operating Cost as a Percentage of Sales, Excluding Fuel
0.50%payoutper0.01%reductioninoperating costsBaseline:27.60%
0.50%payoutper0.01%reductioninoperating costsBaseline:27.09%
0.50%payoutper0.01%reductioninoperating costsBaseline:26.69%
0.50%payoutper0.01%reductioninoperating costsBaseline:26.61%
Improvement in Associate Engagement
2%payoutperunitimprovement
4%payoutperunitimprovement
4%payoutperunitimprovement
4%payoutperunitimprovement
Return on Invested Capital
N/A N/A 1%payoutper0.01%improvement in ROIC Baseline:13.41%
1%payoutper0.01%improvement in ROICBaseline:13.43%
* Ordateofplanentry,iflater.
Atthetimeofadoptingnewlong-termplans,theCommitteehasmadeadjustmentstothepercentagepayouts for the components of the long-term plans to account for the increasing difficulty of achievingcompounded improvement.
The Committee anticipates adopting a new plan each year, measuring improvement over successive three-yearperiods.
Thelong-termperformancebasedplanadoptedin2011,whichmeasuredimprovementsthroughfiscalyear2013,paidoutinMarch2014andwascalculatedasfollows:
Component Baseline Result Improvement Multiplier Percentage
Earned
StrategicPlan. . . . . . . . . . . . . . . . . . . . . * * 6unitsofimprovement 2% 12.00%Associate Engagement . . . . . . . . . . . . . * * 8 units of improvement 2% 6.00%Operating Costs, as a Percentage of Sales,ExcludingFuel . . . . . . . . . . . . 27.60% 26.76% 84basispointimprovement 0.50% 42.00%
Total Earned . . . . . . . . . . . . . . . . . . . . . . 70.00%
* TheStrategicPlanandAssociateEngagementcomponentswereestablishedbytheCommitteebutarenot disclosed as they are competitively sensitive.
Accordingly,eachnamedexecutiveofficerreceivedcashinanamountequalto70.00%ofthatexecutive’slong-termcashbonusbase,andwas issued thenumberofKrogercommonsharesequal to70.00%of thenumberofperformanceunitsawardedtothatexecutive,alongwithacashamountequaltothedividendspaidonthatnumberofcommonsharesduringthethreeyearperformanceperiod.Payoutforthecashcomponentsofthe2011planarereportedinthe“Non-EquityIncentivePlanCompensation”and“AllOtherCompensation”columnsoftheSummaryCompensationTableandfootnotes4and6tothattable,andthecommonsharesissuedundertheplanarereportedintheOptionsExercisedandStockVestedTableandfootnote2tothattable.
29
Equity Awards
AwardsbasedonKroger’scommonsharesaregrantedperiodicallytothenamedexecutiveofficersandalargenumberofotheremployees.Equityparticipationalignstheinterestsofemployeeswithyourinterestasshareholders,andKrogerhistoricallyhasdistributedequityawardswidely.In2013,Krogergranted4,211,102 stockoptionstoapproximately 8,151employees,includingthenamedexecutiveofficers.TheoptionspermittheholdertopurchaseKrogercommonsharesatanoptionpriceequaltotheclosingpriceofKrogercommonshares on the date of the grant. Options are granted only on one of the four dates of Compensation Committee meetingsconductedafterKroger’spublicreleaseofitsquarterlyearningsresults.
Kroger’slong-termincentiveplansalsoprovideforotherequity-basedawards,includingrestrictedstockandperformanceunits.During2013,Krogerawarded3,116,214sharesofrestrictedstocktoapproximately20,214employees,includingthenamedexecutiveofficers;and413,588performanceunitstoapproximately167employees.PerformanceunitsprovidefortheissuanceofKrogercommonsharestoparticipants,afterthecompletionofthethreeyearperformanceperiod,basedontheextenttowhichtheperformancegoalsestablishedatthebeginningoftheperformanceperiodhavebeenachieved.
The Committee considers several factors in determining the amount of options, restricted shares, and performance units awarded to the named executive officers or, in the case of the CEO, recommending to the independent directors the amount awarded. These factors include:
• The compensation consultant’s benchmarking report regarding equity-based and other long-termcompensationawardedbyourcompetitors;
• Theofficer’slevelintheorganizationandtheinternalrelationshipofequity-basedawardswithinKroger;
• Individualperformance;and
• TherecommendationoftheCEO,forallnamedexecutiveofficersotherthantheCEO.
The Committee has long recognized that the amount of compensation provided to the named executive officersthroughequity-basedpay isoftenbelowtheamountpaidbyourcompetitors.Lowerequity-basedawards for the named executive officers and other seniormanagement permit a broader base of Krogeremployeestoparticipateinequityawards.
Amountsofequityawardsissuedandoutstandingforthenamedexecutiveofficersaresetforthinthetablesthatfollowthisdiscussionandanalysis.
r e t i r e M e N t a N d o t h e r B e N e F i t S
Krogermaintainsadefinedbenefitandseveraldefinedcontributionretirementplansforitsemployees.The named executive officers participate in one or more of these plans, as well as one or more excess plans designedtomakeuptheshortfallinretirementbenefitscreatedbylimitationsundertheInternalRevenueCode on benefits to highly compensated individuals under qualified plans. Additional details regardingretirementbenefitsavailabletothenamedexecutiveofficerscanbefoundinthe2013PensionBenefitstableand the accompanying narrative description that follows this discussion and analysis.
Kroger also maintains an executive deferred compensation plan in which some of the named executive officersparticipate.Thisplanisanonqualifiedplanunderwhichparticipantscanelecttodeferupto100%of their cash compensation each year. Compensation deferred bears interest, until paid out, at the raterepresentingKroger’scostoften-yeardebtintheyeartherateisset,asdeterminedbyKroger’sCEO,andreviewedwith theCommittee,prior to thebeginningof eachdeferral year. In 2013, that ratewas 3.8%.Deferredamountsarepaidoutonlyincash,inaccordancewithadeferraloptionselectedbytheparticipantat the time the deferral election is made.
We adopted The Kroger Co. Employee Protection Plan, or KEPP, during fiscal year 1988. That plan was amendedandrestatedin2007.Allofourmanagementemployeesandadministrativesupportpersonnelwhoseemploymentisnotcoveredbyacollectivebargainingagreement,withatleastoneyearofservice,arecovered.KEPPprovidesforseverancebenefitsandextendedKroger-paidhealthcare,aswellasthecontinuationofotherbenefitsasdescribedintheplan,whenanemployeeisactuallyorconstructivelyterminatedwithout

30
causewithin twoyears followingachange incontrolofKroger (asdefined in theplan).Participants areentitledtoseverancepayofupto24months’salaryandbonus.Theactualamountisdependentuponpaylevelandyearsofservice.KEPPcanbeamendedorterminatedbytheBoardatanytimepriortoachangein control.
Stockoption,restrictedstockandperformanceunitagreementswithparticipantsinKroger’slong-termincentiveplansprovidethatthoseawards“vest,”withoptionsbecomingimmediatelyexercisable,restrictionsonrestrictedstocklapsing,andcommonsharesequalto50%oftheperformanceunitsbeingawarded,uponachangeincontrolasdescribedintheagreements.
None of the named executive officers is party to an employment agreement.
P e r q u i S i t e S
TheCommitteedoesnotbelievethatitisnecessaryfortheattractionorretentionofmanagementtalenttoprovidethenamedexecutiveofficersasubstantialamountofcompensationintheformofperquisites.In2013,theonlyperquisitesavailabletoournamedexecutiveofficerswere:
• premiumspaidonlifeinsurancepolicies,
• premiumspaidonaccidentaldeathanddismembermentinsurance;and
• premiumspaidonlong-termdisabilityinsurancepolicies.
Thelifeinsurancebenefitwasofferedbeginningseveralyearsagotoreplaceasplit-dollarlifeinsurancebenefitthatwassubstantiallymorecostlytoKroger.Currently,159 active executives, including the named executive officers, and 87retiredexecutives,receivethisbenefit.
Inaddition,thenamedexecutiveofficersareentitledtothefollowingbenefitthatdoesnotconstituteaperquisiteasdefinedbySECrules:personaluseofKrogeraircraft,whichofficersmayleasefromKrogerandpaytheaveragevariablecostofoperatingtheaircraft,makingofficersmoreavailableandallowingforamoreefficient use of their time.
Thetotalamountofperquisites furnishedto thenamedexecutiveofficers isshownintheSummaryCompensationTableanddescribedinmoredetailinfootnote6tothattable.
e x e c u t i v e c o M P e N S a t i o N r e c o u P M e N t P o l i c y
If amaterial error of facts results in thepayment to an executive officer at the level ofGroupVicePresidentorhigherof an annualbonusor a long-termbonus in an amounthigher thanotherwisewouldhave been paid, as determined by the Committee, then the officer, upon demand from the Committee,willreimburseKrogerfortheamountsthatwouldnothavebeenpaidif theerrorhadnotoccurred.Thisrecoupmentpolicyapplies to thoseamountspaidbyKrogerwithin36monthsprior to thedetectionandpublicdisclosureoftheerror.Inenforcingthepolicy,theCommitteewilltakeintoconsiderationallfactorsthat it deems appropriate, including:
• Thematerialityoftheamountofpaymentinvolved;
• The extent to which other benefits were reduced in other years as a result of the achievement ofperformancelevelsbasedontheerror;
• Individualofficerculpability,ifany;and
• Otherfactorsthatshouldoffsettheamountofoverpayment.
31
h e d g i N g P o l i c y
Afterconsideringbestpracticesrelatedtoownershipofcompanyshares,theBoardadoptedapolicyregardinghedging,pledging,andshortsalesofKrogersecurities.Krogerdirectorsandofficersareprohibitedfrom engaging, directly or indirectly, in hedging transactions in, or short sales of, Kroger securities. In addition, they are precluded from pledging Kroger securities as collateral for a loan, except to the extent that sharessopledgedareinexcessofthenumberofsharestheindividualisrequiredtomaintaininaccordancewithKroger’sshareownershipguidelinesmoreparticularlydescribedearlierinthiscompensationdiscussionand analysis.
S e c t i o N 1 6 2 ( M ) o F t h e i N t e r N a l r e v e N u e c o d e
Taxlawsplaceadeductibilitylimitof$1,000,000onsometypesofcompensationfortheCEOandthenextfourmosthighlycompensatedofficersreportedinthisproxybecausetheyareamongthefourhighestcompensatedofficers(“coveredemployees”).InKroger’scase,thisgroupofindividualsisnotidenticaltothegroupofnamedexecutiveofficers.Compensationthatisdeemedtobe“performance-based”isexcludedforpurposesofthecalculationandis taxdeductible.AwardsunderKroger’s long-termincentiveplans,whenpayableuponachievementofstatedperformancecriteria,shouldbeconsideredperformance-basedandthecompensationpaidunderthoseplansshouldbetaxdeductible.Generally,compensationexpenserelatedtostockoptionsawardedtotheCEOandthenextfourmosthighlycompensatedofficersshouldbedeductible.On theotherhand,Kroger’s awardsof restricted stock that vest solelyupon thepassageof time arenotperformance-based.As a result, compensation expense for those awards to the coveredemployees isnotdeductible,totheextentthattherelatedcompensationexpense,plusanyotherexpenseforcompensationthatisnotperformance-based,exceeds$1,000,000.
Kroger’sbonusplansrelyonperformancecriteria,andhavebeenapprovedbyshareholders.Asaresult,bonusespaidundertheplanstothecoveredemployeeswillbedeductiblebyKroger.
Kroger’s policy is, primarily, to design and administer compensation plans that support the achievement oflong-termstrategicobjectivesandenhanceshareholdervalue.WhereitismaterialandsupportsKroger’scompensation philosophy, the Committee also will attempt to maximize the amount of compensation expense thatisdeductiblebyKroger.
c o M P e N S a t i o N c o M M i t t e e r e P o r t
The Compensation Committee has reviewed and discussed with management of the Company the CompensationDiscussionandAnalysiscontainedinthisproxystatement.Basedonitsreviewanddiscussionswithmanagement,theCompensationCommitteehasrecommendedtotheCompany’sBoardofDirectorsthattheCompensationDiscussionandAnalysisbeincludedintheCompany’sproxystatementandincorporatedbyreferenceintoitsannualreportonForm10-K.
Compensation Committee:ClydeR.Moore,ChairJorgeP.MontoyaSusanM.PhillipsJamesA.Runde

32
e x e c u t i v e c o M P e N S a t i o N
S u M M a r y c o M P e N S a t i o N t a B l e
Thefollowingtableshowsthecompensationof the formerChiefExecutiveOfficer,ChiefExecutiveOfficer, Chief Financial Officer and each of the Company’s three most highly compensated executive officers otherthantheformerCEO,CEOandCFO(the“namedexecutiveofficers”)duringthefiscalyearspresented:
S u M M a r y c o M P e N S a t i o N t a B l e
Name and Principal Position Year
Salary ($)
Bonus ($)
Stock Awards
($)
Option Awards
($)
Non-Equity Incentive PlanCompensation
($)
Change inPension
Value andNonqualified
DeferredCompensation
Earnings($)
All OtherCompensation
($)Total ($)
(1) (2) (3) (4) (5) (6)DavidB.Dillon 2013 $1,346,161 — $5,709,429 $2,781,910 $2,456,235 $ 15,376 $459,584 $12,768,695
Chairman and Former 2012 $1,328,320 — $3,332,852 $1,342,088 $1,600,065 $3,380,527 $301,985 $11,285,837Chief Executive Officer 2011 $1,273,871 — $3,130,540 $1,716,693 $2,699,153 $3,088,686 $232,820 $12,141,763
W.RodneyMcMullen 2013 $ 962,731 — $5,062,435 $ 907,862 $1,722,946 $ 63,518 $166,329 $ 8,885,821
Chief Executive Officer 2012 $ 937,732 — $1,087,655 $ 437,983 $1,079,085 $1,415,003 $124,998 $ 5,082,4562011 $ 899,113 — $1,009,368 $ 553,506 $1,821,903 $1,768,792 $104,573 $ 6,157,255
J.MichaelSchlotman 2013 $ 688,599 — $1,564,689 $ 509,088 $1,004,220 $ — $ 85,176 $ 3,851,772
SeniorVicePresident 2012 $ 669,787 — $ 609,908 $ 245,602 $ 602,146 $ 822,669 $ 60,137 $ 3,010,249and Chief Financial 2011 $ 631,371 — $ 503,801 $ 276,269 $1,002,310 $ 990,524 $ 45,269 $ 3,449,544Officer
KathleenS.Barclay 2013 $ 686,702 — $1,436,930 $ 307,838 $1,026,620 $ — $144,953 $ 3,603,043
SeniorVicePresident 2012 $ 675,972 — $ 491,998 $ 148,512 $ 628,271 $ — $ 96,054 $ 2,040,807
PaulW.Heldman 2013 $ 772,298 — $ 944,621 $ 460,267 $1,084,020 $ 11,645 $156,184 $ 3,429,035Executive Vice 2012 $ 761,501 — $ 551,418 $ 222,048 $ 648,071 $1,266,466 $115,715 $ 3,565,219President,Secretary 2011 $ 730,682 — $ 479,075 $ 262,710 $1,110,126 $1,374,309 $ 96,977 $ 4,053,879andGeneralCounsel
MichaelL.Ellis 2013 $ 539,576 — $1,484,681 $ 236,283 $ 755,571 $ 1,944 $ 64,332 $ 3,082,387
President and Chief Operating Officer
(1) Mr.McMullenwaspromotedtoChiefExecutiveOfficeronJanuary1,2014whenMr.DillonretiredfromhispositionasChiefExecutiveOfficer.Mr.DillonremainsasChairmanoftheBoard.Ms.Barclaybecameanamedexecutiveofficer in 2012.Mr. Ellis became anamedexecutiveofficer in 2013 andbecamePresidentandChiefOperatingOfficeronJanuary1,2014.
(2) The stock awards reflected in the table consist of both time-based and performance-based awardsgrantedundertheCompany’slong-termincentiveplans.Withrespecttotime-basedawards,orrestrictedstock,theaggregategrantdatefairvaluecomputedinaccordancewithFASBASCTopic718isasfollows:Mr.Dillon:$4,227,912;Mr.McMullen:$4,578,950;Mr.Schlotman:$1,293,572;Ms.Barclay:$1,272,990;Mr.Heldman:$699,504;andMr.Ellis:$1,358,848.
Thevalueoftheperformance-basedawards,orperformanceunits,reflectedinthetableisasfollows:Mr. Dillon: $1,481,517; Mr. McMullen: $483,485; Mr. Schlotman: $271,117; Ms. Barclay: $163,940;Mr.Heldman:$245,117;andMr.Ellis:$125,833.Thereportedamountsreflecttheaggregatefairvalueat thegrantdatebasedon theprobableoutcomeof theperformanceconditions.TheseamountsareconsistentwiththeestimateofaggregatecompensationcosttoberecognizedbytheCompanyoverthethree-yearperformanceperiodoftheawarddeterminedasofthegrantdateunderFASBASCTopic718,excluding the effect of estimated forfeitures.

33
Assuming that the highest level of performance conditions is achieved, the value of the performance unit awardsatthegrantdateisasfollows:Mr.Dillon$2,963,033;Mr.McMullen:$966,970;Mr.Schlotman:$542,234;Ms.Barclay:$327,881;Mr.Heldman:$490,233;andMr.Ellis:$251,666.Theseamountsarerequiredtobereportedinafootnoteandarenotreflectedinthetable.
The assumptions used in calculating the valuation are set forth in Note 12 to the consolidated financial statementsinKroger’s10-Kforfiscalyear2013endedFebruary1,2014.
(3) TheseamountsrepresenttheaggregategrantdatefairvalueofawardscomputedinaccordancewithFASBASCTopic718.TheassumptionsusedincalculatingthevaluationaresetforthinNote12totheconsolidatedfinancialstatementsinKroger’s10-Kforfiscalyear2013endedFebruary1,2014.
(4) Non-equityincentiveplancompensationearnedfor2013consistsofthefollowingtwoamountsforeachnamed executive officer:
Inaccordancewiththetermsofthe2013performance-basedannualcashbonusprogram,Krogerpaid104.959%ofbonuspotentialsfortheexecutiveofficersincludingthenamedexecutiveofficers.Paymentsweremadeinthefollowingamounts:Mr.Dillon:$1,574,235;Mr.McMullen:$1,099,946;Mr.Schlotman:$577,220;Ms.Barclay:$577,220;Mr.Heldman:$577,220;andMr.Ellis:$431,401.Theseamountswereearnedwithrespecttoperformancein2013,andpaidinMarch2014.
The2011Long-TermBonusPlan is aperformance-basedbonusplandesigned to rewardparticipantsforimprovingthelong-termperformanceoftheCompany.Theplancoveredperformanceduringfiscalyears2011,2012and2013,andamountsearnedundertheplanwerepaidinMarch2014.Thecashbonuspotentialamountequaledtheexecutive’ssalaryineffectonthelastdayoffiscalyear2010.Thefollowingamounts representpayouts at 70%ofbonuspotentials thatwere earnedunder theplan:Mr.Dillon:$882,000;Mr.McMullen: $623,000;Mr. Schlotman: $427,000;Ms. Barclay: $449,400;Mr. Heldman:$506,800;andMr.Ellis:$324,170.
(5) Amounts in the table for 2011 and 2012 are changes in pension value and preferential earnings onnonqualified deferred compensation. For 2013, the amounts only include preferential earnings onnonqualified deferred compensation. Under the Company’s deferred compensation plan, deferredcompensationearns interestat theraterepresentingKroger’scostof ten-yeardebtasdeterminedbyKroger’sCEO,andreviewedbytheCompensationCommittee,priortothebeginningofeachdeferralyear.Foreachparticipant,aseparatedeferralaccountiscreatedeachyear,andtheinterestrateestablishedunder the plan for that year is applied to that deferral account until the deferred compensation is paid out.IftheinterestrateestablishedbytheCompanyforaparticularyearexceeds120%oftheapplicablefederallong-terminterestratethatcorrespondsmostcloselytotheCompanyrate,theamountbywhichtheCompany rateexceeds120%of thecorresponding federal rate isdeemed tobe above-marketorpreferential. In twelve of the twenty years in which at least one named executive officer deferred compensation,theCompanyratesetundertheplanforthatyearexceeds120%ofthecorrespondingfederalrate.ForeachofthedeferralaccountsinwhichtheCompanyrateisdeemedtobeabove-market,theCompanycalculatestheamountbywhichtheactualannualearningsontheaccountexceedwhattheannualearningswouldhavebeeniftheaccountearnedinterestat120%ofthecorrespondingfederalrate, and discloses those amounts as preferential earnings. Amounts deferred in 2013 earned interest at aratehigherthan120%ofthecorrespondingfederalrate,accordinglytherearepreferentialearningsonthese amounts.
InaccordancewithSECrules,negativeamountsarerequiredtobedisclosedinthefootnotes,butnotreflectedinthesumoftotalcompensationreportedinthetable.Mr.Dillon’spensionvaluedecreasedby $1,863,504;Mr.McMullen’s pension value decreasedby $450,556;Mr. Schlotman’s pension valuedecreasedby$98,636;Mr.Heldman’spensionvaluedecreasedby$149,721;andMr.Ellis’pensionvaluesdecreasedby$6,080.During2013,pensionvaluesdecreasedprimarilyduetoanincreaseinthediscountrate for theplans, asdeterminedby theplanactuary anddecreased slightlydue to annuityelectionassumptions.Ms.BarclaydoesnotparticipateinaCompanydefinedbenefitpensionplanorthedeferredcompensation plan.
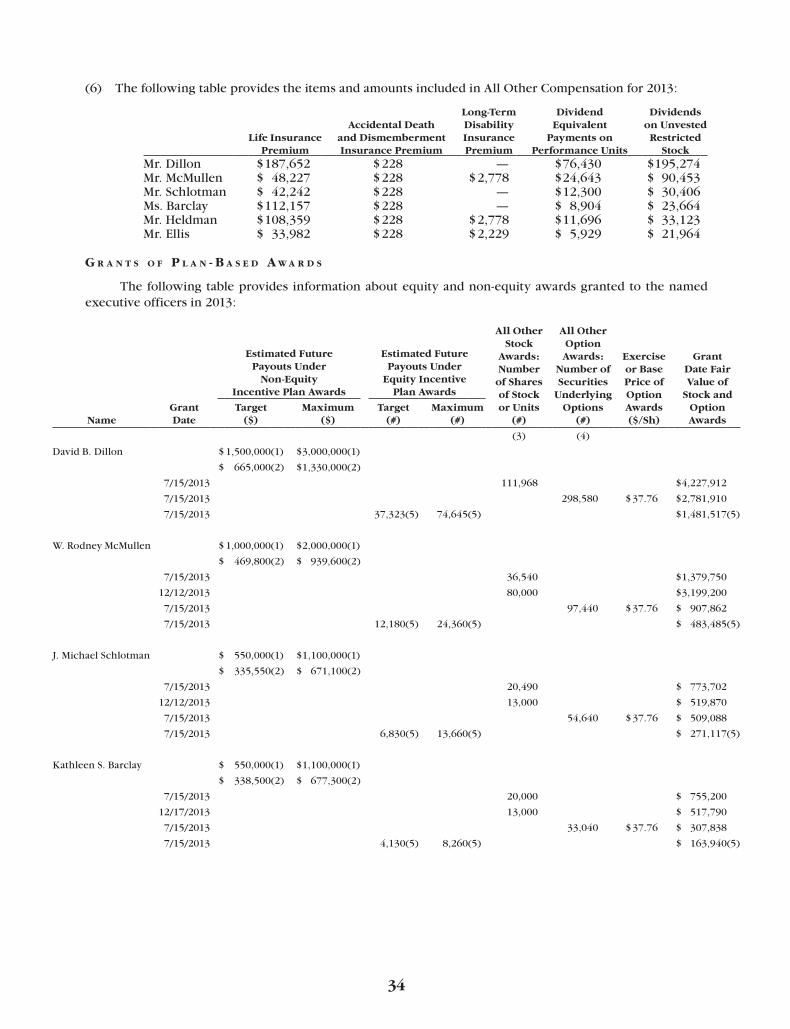
34
(6) ThefollowingtableprovidestheitemsandamountsincludedinAllOtherCompensationfor2013:
Life Insurance Premium
Accidental Death and Dismemberment Insurance Premium
Long-Term Disability Insurance Premium
Dividend Equivalent
Payments on Performance Units
Dividends on Unvested Restricted
StockMr.Dillon $187,652 $228 — $76,430 $195,274Mr.McMullen $ 48,227 $228 $2,778 $24,643 $ 90,453Mr.Schlotman $ 42,242 $228 — $12,300 $ 30,406Ms.Barclay $112,157 $228 — $ 8,904 $ 23,664Mr.Heldman $108,359 $228 $2,778 $11,696 $ 33,123Mr.Ellis $ 33,982 $228 $2,229 $ 5,929 $ 21,964
g r a N t S o F P l a N - B a S e d a w a r d S
Thefollowingtableprovides informationaboutequityandnon-equityawardsgrantedtothenamedexecutive officers in 2013:
NameGrantDate
Estimated FuturePayouts Under
Non-EquityIncentive Plan Awards
Estimated FuturePayouts Under
Equity IncentivePlan Awards
All OtherStock
Awards:Numberof Sharesof Stockor Units
(#)
All OtherOptionAwards:
Number ofSecurities
UnderlyingOptions
(#)
Exerciseor BasePrice ofOptionAwards($/Sh)
GrantDate FairValue of
Stock andOptionAwards
Target($)
Maximum($)
Target(#)
Maximum(#)
(3) (4)
DavidB.Dillon $1,500,000(1) $3,000,000(1)
$ 665,000(2) $1,330,000(2)
7/15/2013 111,968 $4,227,912
7/15/2013 298,580 $37.76 $2,781,910
7/15/2013 37,323(5) 74,645(5) $1,481,517(5)
W.RodneyMcMullen $ 1,000,000(1) $2,000,000(1)
$ 469,800(2) $ 939,600(2)
7/15/2013 36,540 $1,379,750
12/12/2013 80,000 $3,199,200
7/15/2013 97,440 $37.76 $ 907,862
7/15/2013 12,180(5) 24,360(5) $ 483,485(5)
J.MichaelSchlotman $ 550,000(1) $1,100,000(1)
$ 335,550(2) $ 671,100(2)
7/15/2013 20,490 $ 773,702
12/12/2013 13,000 $ 519,870
7/15/2013 54,640 $37.76 $ 509,088
7/15/2013 6,830(5) 13,660(5) $ 271,117(5)
KathleenS.Barclay $ 550,000(1) $1,100,000(1)
$ 338,500(2) $ 677,300(2)
7/15/2013 20,000 $ 755,200
12/17/2013 13,000 $ 517,790
7/15/2013 33,040 $37.76 $ 307,838
7/15/2013 4,130(5) 8,260(5) $ 163,940(5)

35
NameGrantDate
Estimated FuturePayouts Under
Non-EquityIncentive Plan Awards
Estimated FuturePayouts Under
Equity IncentivePlan Awards
All OtherStock
Awards:Numberof Sharesof Stockor Units
(#)
All OtherOptionAwards:
Number ofSecurities
UnderlyingOptions
(#)
Exerciseor BasePrice ofOptionAwards($/Sh)
GrantDate FairValue of
Stock andOptionAwards
Target($)
Maximum($)
Target(#)
Maximum(#)
(3) (4)
PaulW.Heldman $ 550,000(1) $1,100,000(1)
$ 381,500(2) $ 763,000(2)
7/15/2013 18,525 $ 699,504
7/15/2013 49,400 $37.76 $ 460,267
7/15/2013 6,175(5) 12,350(5) $ 245,117(5)
MichaelL.Ellis $ 375,000(1) $ 750,000(1)
$ 256,000(2) $ 512,000(2)
7/15/2013 9,510 $ 359,098
12/12/2013 25,000 $ 999,750
7/15/2013 25,360 $37.76 $ 236,283
7/15/2013 3,170(5) 6,340(5) $ 125,833(5)
(1) Theamountlistedunder“Target”foreachnamedexecutiveofficerrepresentsthebonuspotentialofthenamedexecutiveofficerundertheCompany’s2013performance-basedannualcashbonusprogram.Bythetermsofthisplan,payoutsarelimitedtonomorethan200%ofaparticipant’sbonuspotential;accordingly,theamountlistedunder“Maximum”equalstwotimesthatofficer’sbonuspotentialamount.InconnectionwithhispromotiononJanuary1,2014,Mr.McMullenwaseligibleforabonusbasedonaprorationofhisbonuspotentialof$1,000,000andofhis revisedbonuspotentialof$1,500,000. InconnectionwithhispromotiononJanuary1,2014,Mr.Elliswaseligibleforabonusbasedonaprorationofhisbonuspotentialof$375,000andofhisrevisedbonuspotentialof$750,000.Theamountactuallyearned under this plan is shown in the SummaryCompensation Table for 2013 and is described infootnote4tothattable.
(2) This amount represents the bonus potential of the named executive officer under the cash bonuscomponentoftheCompany’sperformance-based2013Long-TermIncentivePlan.“Maximum”amountequalstheannualbasesalaryofthenamedexecutiveofficersasofthelastdayoffiscalyear2012.Bonusesaredetermineduponcompletionoftheperformanceperiodasoffiscalyearending2015.Becausethetargetamountisnotdeterminable,theamountlistedunder“Target”reflectsarepresentativeamountbasedontheprobableoutcomeoftheperformanceconditions.
(3) ThisamountrepresentsthenumberofrestrictedsharesawardedunderoneoftheCompany’slong-termincentive plans.
(4) Thisamount represents thenumberof stockoptionsgrantedunderoneof theCompany’s long-termincentiveplans.OptionsaregrantedatfairmarketvalueofKrogercommonsharesonthedateofthegrant.FairmarketvalueisdefinedastheclosingpriceofKrogersharesonthedateofthegrant.
(5) PerformanceunitswereawardedundertheCompany’sperformance-based2013Long-TermIncentivePlan.The“Maximum”amountrepresentsthemaximumnumberofcommonsharesthatcanbeearnedbythenamedexecutiveofficerundertheaward.Becausethetargetamountofcommonsharesisnotdeterminable,theamountlistedunder“Target”reflectsarepresentativeamountbasedontheprobableoutcome of the performance conditions. The dollar amount listed in the grant date fair value column is the value at the grant date based on the probable outcome of these conditions. This amount isconsistentwiththeestimateofaggregatecompensationcosttoberecognizedbytheCompanyoverthethree-yearperformanceperioddeterminedasofthegrantdateunderFASBASCTopic718,excludingthe effect of estimated forfeitures, alongwith estimated cash payments equal to projected dividendequivalentpayments.
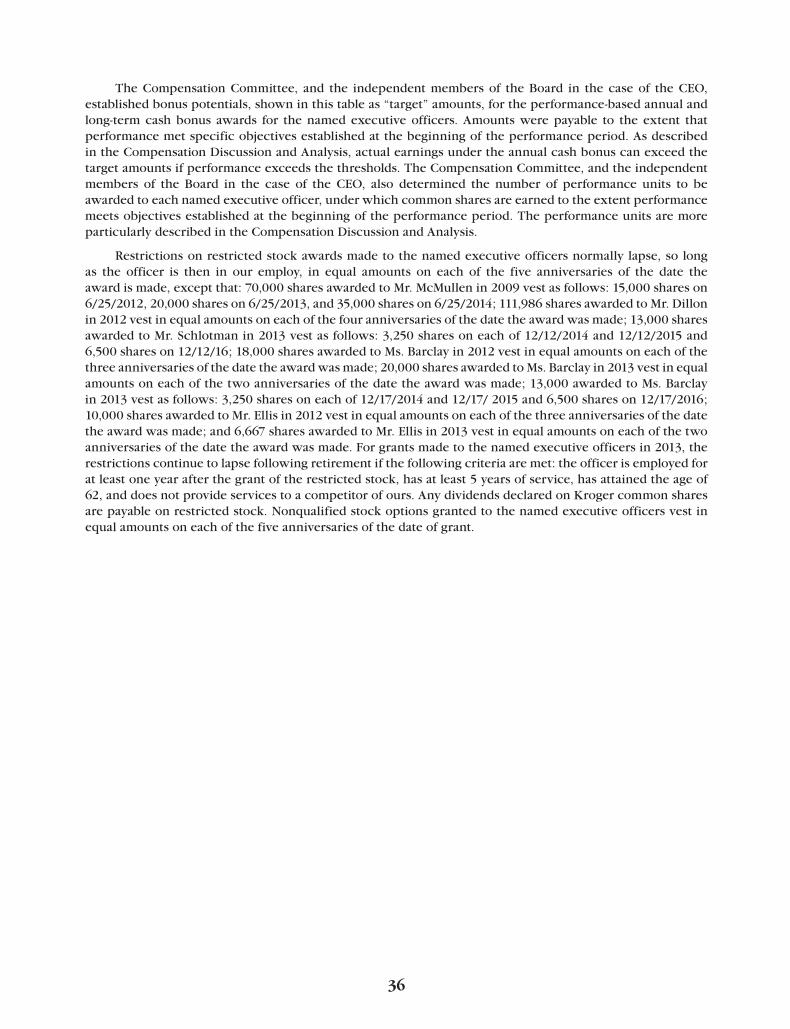
36
TheCompensationCommittee, and the independentmembersof theBoard in thecaseof theCEO,establishedbonuspotentials,showninthistableas“target”amounts,fortheperformance-basedannualandlong-termcashbonus awards for thenamedexecutiveofficers.Amountswerepayable to the extent thatperformancemetspecificobjectivesestablishedatthebeginningoftheperformanceperiod.AsdescribedintheCompensationDiscussionandAnalysis,actualearningsundertheannualcashbonuscanexceedthetarget amounts if performance exceeds the thresholds. The Compensation Committee, and the independent members of the Board in the case of the CEO, also determined the number of performance units to beawarded to each named executive officer, under which common shares are earned to the extent performance meetsobjectivesestablishedatthebeginningoftheperformanceperiod.TheperformanceunitsaremoreparticularlydescribedintheCompensationDiscussionandAnalysis.
Restrictionsonrestrictedstockawardsmadetothenamedexecutiveofficersnormallylapse,solongas the officer is then in our employ, in equal amounts on each of the five anniversaries of the date theawardismade,exceptthat:70,000sharesawardedtoMr.McMullenin2009vestasfollows:15,000shareson6/25/2012,20,000shareson6/25/2013,and35,000shareson6/25/2014;111,986sharesawardedtoMr.Dillonin2012vestinequalamountsoneachofthefouranniversariesofthedatetheawardwasmade;13,000sharesawardedtoMr.Schlotmanin2013vestasfollows:3,250sharesoneachof12/12/2014and12/12/2015and6,500shareson12/12/16;18,000sharesawardedtoMs.Barclayin2012vestinequalamountsoneachofthethreeanniversariesofthedatetheawardwasmade;20,000sharesawardedtoMs.Barclayin2013vestinequalamountsoneachofthetwoanniversariesofthedatetheawardwasmade;13,000awardedtoMs.Barclayin2013vestasfollows:3,250sharesoneachof12/17/2014and12/17/2015and6,500shareson12/17/2016;10,000sharesawardedtoMr.Ellisin2012vestinequalamountsoneachofthethreeanniversariesofthedatetheawardwasmade;and6,667sharesawardedtoMr.Ellisin2013vestinequalamountsoneachofthetwoanniversaries of the date the award was made. For grants made to the named executive officers in 2013, the restrictions continue to lapse following retirement if the following criteria are met: the officer is employed for atleastoneyearafterthegrantoftherestrictedstock,hasatleast5yearsofservice,hasattainedtheageof62,anddoesnotprovideservicestoacompetitorofours.AnydividendsdeclaredonKrogercommonsharesarepayableonrestrictedstock.Nonqualifiedstockoptionsgrantedtothenamedexecutiveofficersvestinequalamountsoneachofthefiveanniversariesofthedateofgrant.
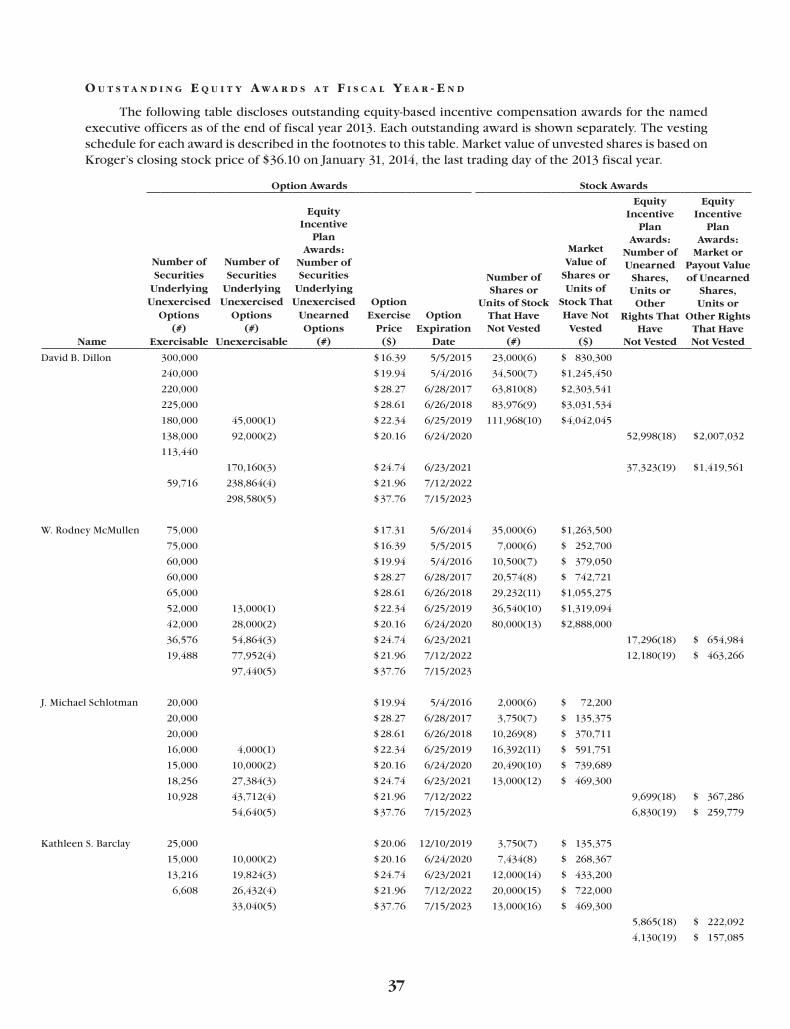
37
o u t S t a N d i N g e q u i t y a w a r d S a t F i S c a l y e a r - e N d
Thefollowingtabledisclosesoutstandingequity-basedincentivecompensationawardsforthenamedexecutive officers as of the end of fiscal year 2013. Each outstanding award is shown separately. The vesting scheduleforeachawardisdescribedinthefootnotestothistable.MarketvalueofunvestedsharesisbasedonKroger’sclosingstockpriceof$36.10onJanuary31,2014,thelasttradingdayofthe2013fiscalyear.
Option Awards Stock Awards
Name
Number ofSecurities
UnderlyingUnexercised
Options(#)
Exercisable
Number ofSecurities
UnderlyingUnexercised
Options(#)
Unexercisable
EquityIncentive
PlanAwards:
Number ofSecurities
UnderlyingUnexercised
UnearnedOptions
(#)
OptionExercise
Price($)
OptionExpiration
Date
Number ofShares or
Units of StockThat HaveNot Vested
(#)
MarketValue of
Shares orUnits of
Stock ThatHave Not
Vested($)
EquityIncentive
PlanAwards:
Number ofUnearned
Shares,Units orOther
Rights ThatHave
Not Vested
EquityIncentive
PlanAwards:
Market orPayout Valueof Unearned
Shares,Units or
Other RightsThat HaveNot Vested
DavidB.Dillon 300,000 $16.39 5/5/2015 23,000(6) $ 830,300
240,000 $19.94 5/4/2016 34,500(7) $1,245,450
220,000 $28.27 6/28/2017 63,810(8) $2,303,541
225,000 $28.61 6/26/2018 83,976(9) $3,031,534
180,000 45,000(1) $22.34 6/25/2019 111,968(10) $4,042,045
138,000 92,000(2) $20.16 6/24/2020 52,998(18) $2,007,032
113,440
170,160(3) $24.74 6/23/2021 37,323(19) $1,419,561
59,716 238,864(4) $21.96 7/12/2022
298,580(5) $37.76 7/15/2023
W.RodneyMcMullen 75,000 $17.31 5/6/2014 35,000(6) $1,263,500
75,000 $16.39 5/5/2015 7,000(6) $ 252,700
60,000 $19.94 5/4/2016 10,500(7) $ 379,050
60,000 $28.27 6/28/2017 20,574(8) $ 742,721
65,000 $28.61 6/26/2018 29,232(11) $1,055,275
52,000 13,000(1) $22.34 6/25/2019 36,540(10) $1,319,094
42,000 28,000(2) $20.16 6/24/2020 80,000(13) $2,888,000
36,576 54,864(3) $24.74 6/23/2021 17,296(18) $ 654,984
19,488 77,952(4) $21.96 7/12/2022 12,180(19) $ 463,266
97,440(5) $37.76 7/15/2023
J.MichaelSchlotman 20,000 $19.94 5/4/2016 2,000(6) $ 72,200
20,000 $28.27 6/28/2017 3,750(7) $ 135,375
20,000 $28.61 6/26/2018 10,269(8) $ 370,711
16,000 4,000(1) $22.34 6/25/2019 16,392(11) $ 591,751
15,000 10,000(2) $20.16 6/24/2020 20,490(10) $ 739,689
18,256 27,384(3) $24.74 6/23/2021 13,000(12) $ 469,300
10,928 43,712(4) $21.96 7/12/2022 9,699(18) $ 367,286
54,640(5) $37.76 7/15/2023 6,830(19) $ 259,779
KathleenS.Barclay 25,000 $20.06 12/10/2019 3,750(7) $ 135,375
15,000 10,000(2) $20.16 6/24/2020 7,434(8) $ 268,367
13,216 19,824(3) $24.74 6/23/2021 12,000(14) $ 433,200
6,608 26,432(4) $21.96 7/12/2022 20,000(15) $ 722,000
33,040(5) $37.76 7/15/2023 13,000(16) $ 469,300
5,865(18) $ 222,092
4,130(19) $ 157,085
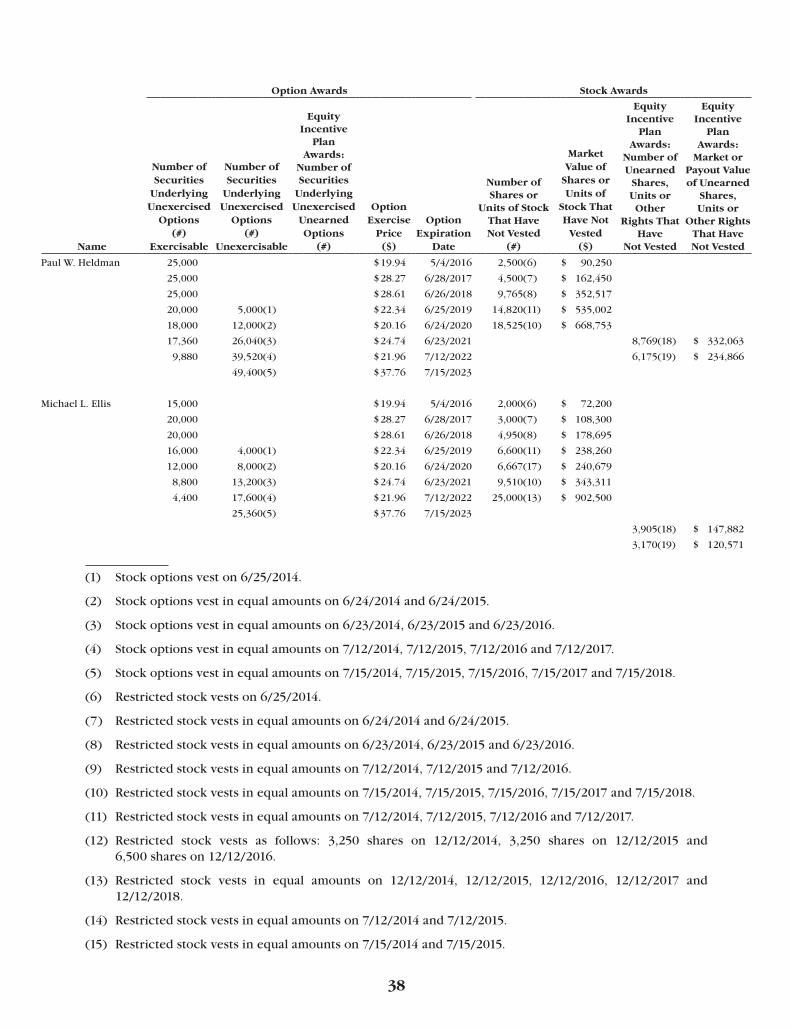
38
Option Awards Stock Awards
Name
Number ofSecurities
UnderlyingUnexercised
Options(#)
Exercisable
Number ofSecurities
UnderlyingUnexercised
Options(#)
Unexercisable
EquityIncentive
PlanAwards:
Number ofSecurities
UnderlyingUnexercised
UnearnedOptions
(#)
OptionExercise
Price($)
OptionExpiration
Date
Number ofShares or
Units of StockThat HaveNot Vested
(#)
MarketValue of
Shares orUnits of
Stock ThatHave Not
Vested($)
EquityIncentive
PlanAwards:
Number ofUnearned
Shares,Units orOther
Rights ThatHave
Not Vested
EquityIncentive
PlanAwards:
Market orPayout Valueof Unearned
Shares,Units or
Other RightsThat HaveNot Vested
PaulW.Heldman 25,000 $19.94 5/4/2016 2,500(6) $ 90,250
25,000 $28.27 6/28/2017 4,500(7) $ 162,450
25,000 $28.61 6/26/2018 9,765(8) $ 352,517
20,000 5,000(1) $22.34 6/25/2019 14,820(11) $ 535,002
18,000 12,000(2) $20.16 6/24/2020 18,525(10) $ 668,753
17,360 26,040(3) $24.74 6/23/2021 8,769(18) $ 332,063
9,880 39,520(4) $21.96 7/12/2022 6,175(19) $ 234,866
49,400(5) $37.76 7/15/2023
MichaelL.Ellis 15,000 $19.94 5/4/2016 2,000(6) $ 72,200
20,000 $28.27 6/28/2017 3,000(7) $ 108,300
20,000 $28.61 6/26/2018 4,950(8) $ 178,695
16,000 4,000(1) $22.34 6/25/2019 6,600(11) $ 238,260
12,000 8,000(2) $20.16 6/24/2020 6,667(17) $ 240,679
8,800 13,200(3) $24.74 6/23/2021 9,510(10) $ 343,311
4,400 17,600(4) $21.96 7/12/2022 25,000(13) $ 902,500
25,360(5) $37.76 7/15/2023
3,905(18) $ 147,882
3,170(19) $ 120,571
(1) Stockoptionsveston6/25/2014.
(2) Stockoptionsvestinequalamountson6/24/2014and6/24/2015.
(3) Stockoptionsvestinequalamountson6/23/2014,6/23/2015and6/23/2016.
(4) Stockoptionsvestinequalamountson7/12/2014,7/12/2015,7/12/2016and7/12/2017.
(5) Stockoptionsvestinequalamountson7/15/2014,7/15/2015,7/15/2016,7/15/2017and7/15/2018.
(6) Restrictedstockvestson6/25/2014.
(7) Restrictedstockvestsinequalamountson6/24/2014and6/24/2015.
(8) Restrictedstockvestsinequalamountson6/23/2014,6/23/2015and6/23/2016.
(9) Restrictedstockvestsinequalamountson7/12/2014,7/12/2015and7/12/2016.
(10) Restrictedstockvestsinequalamountson7/15/2014,7/15/2015,7/15/2016,7/15/2017and7/15/2018.
(11) Restrictedstockvestsinequalamountson7/12/2014,7/12/2015,7/12/2016and7/12/2017.
(12) Restricted stock vests as follows: 3,250 shares on 12/12/2014, 3,250 shares on 12/12/2015 and6,500shareson12/12/2016.
(13) Restricted stock vests in equal amounts on 12/12/2014, 12/12/2015, 12/12/2016, 12/12/2017 and12/12/2018.
(14) Restrictedstockvestsinequalamountson7/12/2014and7/12/2015.
(15) Restrictedstockvestsinequalamountson7/15/2014and7/15/2015.
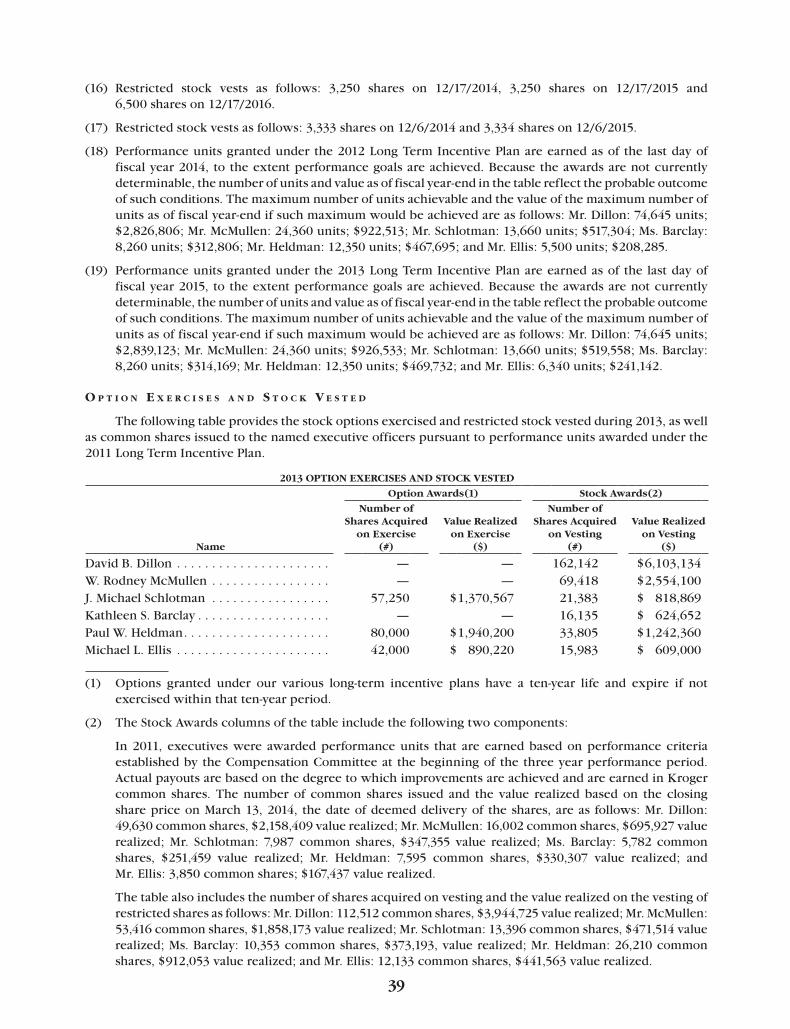
39
(16) Restricted stock vests as follows: 3,250 shares on 12/17/2014, 3,250 shares on 12/17/2015 and6,500shareson12/17/2016.
(17) Restrictedstockvestsasfollows:3,333shareson12/6/2014and3,334shareson12/6/2015.
(18) Performanceunitsgrantedunderthe2012LongTermIncentivePlanareearnedasof the lastdayoffiscalyear2014,totheextentperformancegoalsareachieved.Becausetheawardsarenotcurrentlydeterminable,thenumberofunitsandvalueasoffiscalyear-endinthetablereflecttheprobableoutcomeofsuchconditions.Themaximumnumberofunitsachievableandthevalueofthemaximumnumberofunitsasoffiscalyear-endifsuchmaximumwouldbeachievedareasfollows:Mr.Dillon:74,645units;$2,826,806;Mr.McMullen:24,360units;$922,513;Mr.Schlotman:13,660units;$517,304;Ms.Barclay:8,260units;$312,806;Mr.Heldman:12,350units;$467,695;andMr.Ellis:5,500units;$208,285.
(19) Performanceunitsgrantedunderthe2013LongTermIncentivePlanareearnedasof the lastdayoffiscalyear2015,totheextentperformancegoalsareachieved.Becausetheawardsarenotcurrentlydeterminable,thenumberofunitsandvalueasoffiscalyear-endinthetablereflecttheprobableoutcomeofsuchconditions.Themaximumnumberofunitsachievableandthevalueofthemaximumnumberofunitsasoffiscalyear-endifsuchmaximumwouldbeachievedareasfollows:Mr.Dillon:74,645units;$2,839,123;Mr.McMullen:24,360units;$926,533;Mr.Schlotman:13,660units;$519,558;Ms.Barclay:8,260units;$314,169;Mr.Heldman:12,350units;$469,732;andMr.Ellis:6,340units;$241,142.
o P t i o N e x e r c i S e S a N d S t o c k v e S t e d
Thefollowingtableprovidesthestockoptionsexercisedandrestrictedstockvestedduring2013,aswellas common shares issued to the named executive officers pursuant to performance units awarded under the 2011 Long Term Incentive Plan.
2013 OPTION EXERCISES AND STOCK VESTED
Name
Option Awards(1) Stock Awards(2)
Number ofShares Acquired
on Exercise(#)
Value Realizedon Exercise
($)
Number ofShares Acquired
on Vesting(#)
Value Realizedon Vesting
($)
DavidB.Dillon . . . . . . . . . . . . . . . . . . . . . . — — 162,142 $6,103,134W.RodneyMcMullen . . . . . . . . . . . . . . . . . — — 69,418 $2,554,100J.MichaelSchlotman . . . . . . . . . . . . . . . . . 57,250 $1,370,567 21,383 $ 818,869KathleenS.Barclay . . . . . . . . . . . . . . . . . . . — — 16,135 $ 624,652PaulW.Heldman . . . . . . . . . . . . . . . . . . . . . 80,000 $1,940,200 33,805 $1,242,360MichaelL.Ellis . . . . . . . . . . . . . . . . . . . . . . 42,000 $ 890,220 15,983 $ 609,000
(1) Options granted under our various long-term incentive plans have a ten-year life and expire if notexercisedwithinthatten-yearperiod.
(2) TheStockAwardscolumnsofthetableincludethefollowingtwocomponents:
In2011, executiveswere awardedperformanceunits that are earnedbasedonperformancecriteriaestablishedbytheCompensationCommitteeat thebeginningof thethreeyearperformanceperiod.ActualpayoutsarebasedonthedegreetowhichimprovementsareachievedandareearnedinKrogercommon shares. Thenumber of common shares issued and the value realizedbasedon the closingsharepriceonMarch13,2014, thedateofdeemeddeliveryof theshares,areas follows:Mr.Dillon:49,630commonshares,$2,158,409valuerealized;Mr.McMullen:16,002commonshares,$695,927valuerealized;Mr. Schlotman: 7,987 common shares, $347,355 value realized;Ms. Barclay: 5,782 commonshares, $251,459 value realized; Mr. Heldman: 7,595 common shares, $330,307 value realized; andMr.Ellis:3,850commonshares;$167,437valuerealized.
Thetablealsoincludesthenumberofsharesacquiredonvestingandthevaluerealizedonthevestingofrestrictedsharesasfollows:Mr.Dillon:112,512commonshares,$3,944,725valuerealized;Mr.McMullen:53,416commonshares,$1,858,173valuerealized;Mr.Schlotman:13,396commonshares,$471,514valuerealized;Ms.Barclay:10,353commonshares,$373,193,valuerealized;Mr.Heldman:26,210commonshares,$912,053valuerealized;andMr.Ellis:12,133commonshares,$441,563valuerealized.

40
P e N S i o N B e N e F i t S
The following table provides information on pension benefits as of 2013 year-end for the named executive officers.
2013 PENSION BENEFITS
Name Plan Name
Number of Years Credited Service
(#)
PresentValue of
Accumulated Benefit
($)
PaymentsDuring
Last FiscalYear($)
DavidB.Dillon TheKrogerConsolidatedRetirementBenefitPlan 18 $ 753,266 $0TheKrogerCo.ExcessBenefitPlan 18 $9,736,250 $0DillonCompanies,Inc.ExcessBenefitPensionPlan 20 $8,211,305 $0
W.RodneyMcMullen TheKrogerConsolidatedRetirementBenefitPlan 28 $ 802,528 $0TheKrogerCo.ExcessBenefitPlan 28 $6,579,958 $0
J.MichaelSchlotman TheKrogerConsolidatedRetirementBenefitPlan 28 $ 899,195 $0TheKrogerCo.ExcessBenefitPlan 28 $3,760,659 $0
PaulW.Heldman TheKrogerConsolidatedRetirementBenefitPlan 31 $1,346,417 $0TheKrogerCo.ExcessBenefitPlan 31 $6,867,111 $0
MichaelL.Ellis TheKrogerConsolidatedRetirementBenefitPlan 39 $ 90,301 $0TheKrogerCo.ExcessBenefitPlan 39 $ 71,317 $0
Messrs.Dillon,McMullen,Schlotman,HeldmanandEllisparticipateinTheKrogerConsolidatedRetirementBenefitPlan(the“ConsolidatedPlan”),whichisaqualifieddefinedbenefitpensionplan.TheConsolidatedPlangenerallydeterminesaccruedbenefitsusingacashbalance formula,but retainsbenefit formulasapplicableunderpriorplans forcertain “grandfatheredparticipants”whowereemployedbyKrogeronDecember31,2000.Eachoftheabovelistednamedexecutiveofficers,exceptforMr.Ellis,iseligibleforthesegrandfatheredbenefitsundertheConsolidatedPlan.Theirbenefits,therefore,aredeterminedusingformulasapplicableunderprior plans, including the Kroger formula covering service to The Kroger Co. and the Dillon Companies, Inc. PensionPlan formulacovering service toDillonCompanies, Inc.WhileMr.Ellis is alsoaparticipant in theConsolidatedPlan,heisnotagrandfatheredparticipant,butisaparticipantinthecashbalanceformula.
Messrs.Dillon,McMullen,Schlotman,HeldmanandEllisalsoareeligibletoreceivebenefitsunderTheKrogerCo.ExcessBenefitPlan(the“KrogerExcessPlan”),andMr.Dillonisalsoeligibletoreceivebenefitsunder theDillonCompanies, Inc.ExcessBenefitPensionPlan (the“DillonExcessPlan”).Theseplansarecollectivelyreferredtoasthe“ExcessPlans.”TheExcessPlansareeachconsideredtobenonqualifieddeferredcompensationplansasdefinedinSection409AoftheInternalRevenueCode.ThepurposeoftheExcessPlansistomakeuptheshortfallinretirementbenefitscausedbythelimitationsonbenefitstohighlycompensatedindividualsunderqualifiedplansinaccordancewiththeInternalRevenueCode.
Eachoftheabovelistednamedexecutiveofficers,exceptforMr.Ellis,willreceivebenefitsundertheConsolidated Plan and the Excess Plans, determined as follows:
• 1½%timesyearsofcreditedservicemultipliedbytheaverageofthehighestfiveyearsoftotalearnings(basesalaryandannualbonus)duringthelasttencalendaryearsofemployment,reducedby1¼%timesyearsofcreditedservicemultipliedbytheprimarysocialsecuritybenefit;
• normalretirementageis65;
• unreducedbenefitsarepayablebeginningatage62;and
• benefitspayablebetween ages55 and62will be reducedby ¹⁄³ of one percent for each of the first 24monthsandby½ofonepercentforeachofthenext60monthsbywhichthecommencementofbenefitsprecedesage62.

41
Althoughparticipantsgenerally receivecreditedservicebeginningatage21, thoseparticipantswhocommencedemploymentpriorto1986,includingtheabovelistednamedexecutiveofficers,begantoaccruecreditedserviceafterattainingage25.Intheeventofaterminationofemployment,Mr.Schlotmancurrentlyiseligibleforareducedearlyretirementbenefit,ashehasattainedage55.Mr.Ellis,asacashbalanceparticipantintheConsolidatedPlan,willreceivebenefitsasanannualpaycreditequalto5%ofeligibleearningswithinterestaccruingdailyatarateequaltothe30-yearTreasuryrate.
Mr.DillonalsoparticipatesintheDillonEmployees’ProfitSharingPlan(the“DillonPlan”).TheDillonPlanisaqualifieddefinedcontributionplanunderwhichDillonCompanies,Inc.anditsparticipatingsubsidiariesmaychoosetomakediscretionarycontributionseachyearthatarethenallocatedtoeachparticipant’saccount.ParticipationintheDillonPlanwasfrozeneffectiveJanuary1,2001.BenefitsundertheDillonPlandonotcontinuetoaccrueforMr.Dillon.ParticipantsintheDillonPlanelectfromamonganumberofinvestmentoptions and the amounts in their accounts are invested and credited with investment earnings in accordance withtheirelections.PriortoJuly1,2000,participantscouldelecttomakevoluntarycontributionsundertheDillonPlan,butthatoptionwasdiscontinuedeffectiveasofJuly1,2000.ParticipantscanelecttoreceivetheirDillonPlanbenefitintheformofeitheralumpsumpaymentorinstallmentpayments.
Due to offset formulas contained in the Consolidated Plan and the Dillon Excess Plan, Mr. Dillon’saccruedbenefitsundertheDillonPlanoffsetaportionofthebenefitthatwouldotherwiseaccrueforthemunderthoseplansfortheirservicewithDillonCompanies,Inc.Althoughbenefitsthataccrueunderdefinedcontributionplansarenotreportableundertheaccompanyingtable,wehaveaddednarrativedisclosureoftheDillonPlanbecauseoftheoffsettingeffectthatbenefitsunderthatplanhasonbenefitsaccruingunderthe Consolidated Plan and the Dillon Excess Plan.
The assumptionsused in calculating thepresent values are set forth inNote 15 to the consolidatedfinancialstatementsinKroger’sForm10-Kforfiscalyear2013endedFebruary1,2014.Thediscountrateusedtodeterminethepresentvaluesis4.99%,whichisthesamerateusedatthemeasurementdateforfinancialreporting purposes.
N o N q u a l i F i e d d e F e r r e d c o M P e N S a t i o N
The following table provides information on nonqualified deferred compensation for the namedexecutive officers for 2013.
2013 NONQUALIFIED DEFERRED COMPENSATION
ExecutiveContributions
in Last FY
Registrant Contributions
in Last FY
Aggregate Earningsin Last FY
Aggregate Withdrawals/Distributions
Aggregate Balance at Last FYE
Name ($) ($) ($) ($) ($)
DavidB.Dillon . . . . . . . . . . . . . . . . . . . . $ 60,000(1) $0 $ 76,367 $0 $1,173,732W.RodneyMcMullen . . . . . . . . . . . . . . . $215,817(2) $0 $452,389 $0 $6,998,182J.MichaelSchlotman . . . . . . . . . . . . . . . $ 0 $0 $ 0 $0 $ 0PaulW.Heldman . . . . . . . . . . . . . . . . . . . $ 0 $0 $ 80,713 $0 $1,449,413KathleenS.Barclay . . . . . . . . . . . . . . . . . $ 0 $0 $ 0 $0 $ 0MichaelL.Ellis . . . . . . . . . . . . . . . . . . . . $ 0 $0 $ 33,804 $0 $ 584,760
(1) Thisamountrepresentsthedeferralofperformance-basedannualbonusearnedinfiscalyear2012andpaidinMarch2013.ThisamountisincludedintheSummaryCompensationTablefor2012infootnote4.
(2) Thisamountrepresentsthedeferralofperformance-basedannualbonusearnedinfiscalyear2012andpaid inMarch 2013 in the amount of $171,762 and deferral of long-term cash bonus earned duringthe2010through2012performanceperiodandpaidinMarch2013intheamountof$44,055.TheseamountsareincludedintheSummaryCompensationTablefor2012infootnote4.
Eligibleparticipantsmayelecttodeferupto100%oftheamountoftheirsalarythatexceedsthesumoftheFICAwagebaseandpre-taxinsuranceandotherInternalRevenueCodeSection125plandeductions,aswellas100%oftheirannualandlong-termbonuscompensation.Deferralaccountamountsarecreditedwith

42
interestattheraterepresentingKroger’scostoften-yeardebtasdeterminedbyKroger’sCEOandreviewedbytheCompensationCommitteepriortothebeginningofeachdeferralyear.Theinterestrateestablishedfordeferralamountsforeachdeferralyearwillbeappliedtothosedeferralamountsforallsubsequentyearsuntilthedeferredcompensationispaidout.Participantscanelecttoreceivelumpsumdistributionsorquarterlyinstallments for periods up to ten years. Participants also can elect between lump sumdistributions andquarterlyinstallmentstobereceivedbydesignatedbeneficiariesiftheparticipantdiesbeforedistributionofdeferred compensation is completed.
d i r e c t o r c o M P e N S a t i o N
Thefollowingtabledescribesthefiscalyear2013compensationfornon-employeedirectors.EmployeedirectorsreceivenocompensationfortheirBoardservice.
2013 DIRECTOR COMPENSATION
Name
FeesEarnedor Paidin Cash
($)
StockAwards
($)
OptionAwards
($)
Non-EquityIncentive PlanCompensation
($)
Change inPension Value
andNonqualified
DeferredCompensation
Earnings($)
All
OtherCompensation
($)Total($)
(2) (2) (12)
ReubenV.Anderson . . . . . . . . $ 79,823 $165,011 $—(4) — $ 833(10) $ 189 $245,856
RobertD.Beyer. . . . . . . . . . . . $ 99,935 $165,011(3) $—(4) — $6,664(11) $ 189 $271,799
SusanJ.Kropf . . . . . . . . . . . . . $ 89,798 $165,011(3) $—(5) — N/A $ 189 $254,998
JohnT.LaMacchia(1) . . . . . . . $ 72,512 $ 67,817 $—(7) — $ 455(11) $3,556(13) $144,340
DavidB.Lewis . . . . . . . . . . . . $ 79,823 $165,011 $—(6) — N/A $ 189 $245,023
JorgeP.Montoya . . . . . . . . . . . $ 93,299 $165,011 $—(5) — N/A $ 189 $258,499
ClydeR.Moore . . . . . . . . . . . . $ 95,815 $165,011(3) $—(7) — $ 2,900(10) $ 189 $263,915
SusanM.Phillips . . . . . . . . . . . $ 89,798 $165,011 $—(8) — $2,211(11) $ 189 $257,209
StevenR.Rogel . . . . . . . . . . . . $ 79,823 $165,011 $—(4) — N/A $ 189 $245,023
JamesA.Runde . . . . . . . . . . . . $ 93,299 $165,011 $—(6) — N/A $ 189 $258,499
RonaldL.Sargent . . . . . . . . . . $105,784 $165,011(3) $—(6) — $2,279(11) $ 189 $273,263
BobbyS.Shackouls . . . . . . . . . $105,628 $165,011(3) $—(9) — N/A $ 189 $270,828
(1) Mr.LaMacchiaretiredasamemberoftheBoardofDirectorson12/12/13.
(2) TheseamountsrepresenttheaggregategrantdatefairvalueofawardscomputedinaccordancewithFASBASCTopic718.
(3) Aggregatenumberofstockawardsoutstandingatfiscalyearendwas2,750shares.
(4) Aggregatenumberofstockoptionsoutstandingatfiscalyearendwas57,500shares.
(5) Aggregatenumberofstockoptionsoutstandingatfiscalyearendwas37,500shares.
(6) Aggregatenumberofstockoptionsoutstandingatfiscalyearendwas42,500shares.
(7) Aggregatenumberofstockoptionsoutstandingatfiscalyearendwas47,500shares.
(8) Aggregatenumberofstockoptionsoutstandingatfiscalyearendwas46,500shares.
(9) Aggregatenumberofstockoptionsoutstandingatfiscalyearendwas32,500shares.
(10) Thisamountreflectsthechangeinpensionvaluefortheapplicabledirectors.OnlythosedirectorselectedtotheBoardpriortoJuly17,1997areeligibletoparticipateintheoutsidedirectorretirementplan.
(11) This amount reflects preferential earnings on nonqualified deferred compensation. For a completeexplanationofpreferentialearnings,pleaserefertofootnote5totheSummaryCompensationTable.

43
(12) Thisamountreflectsthevalueofgiftcardsintheamountof$75andthecosttotheCompanyperdirectorforprovidingaccidentaldeathanddismembermentinsurancecoveragefornon-employeedirectorsintheamountof$114.ThesepremiumsarepaidonanannualbasisinJuly.
(13) Inconnectionwithhisretirement,Mr.LaMacchiareceivedagiftvaluedat$867andacharitabledonationwasgiveninhisnameintheamountof$2,500.
EffectiveAugust1,2013,eachnon-employeedirectorreceivesanannualretainerof$85,000.Thechairsof each of the Audit Committee and the Compensation Committee receive an additional annual retainer of $20,000.Thechairofeachoftheothercommitteesreceivesanadditionalannualretainerof$15,000.EachmemberoftheAuditCommitteereceivesanadditionalannualretainerof$10,000.ThedirectordesignatedastheLeadDirectorreceivesanadditionalannualretainerof$25,000.Beginningin2013,incentiveshareswereissuedtonon-employeedirectorsinlieuofoptionsandrestrictedstock,asaportionofthedirectors’overallcompensation.OnJuly15,2013,eachnon-employeedirector,exceptforMr.LaMacchia,received4,370commonshares.Mr.LaMacchiareceived1,796commonshares,ashisawardwasproratedasaresultofhisplanned retirement.
Non-employeedirectorsfirstelectedpriortoJuly17,1997receiveamajormedicalplanbenefitaswellasanunfundedretirementbenefit.Theretirementbenefitequalstheaveragecashcompensationforthefivecalendaryearsprecedingretirement.ParticipantswhoretirefromtheBoardpriortoage70willbecreditedwith50%vestingafter fiveyearsofservice,and10%foreachadditionalyearuptoamaximumof100%.Benefitsforparticipantswhoretirepriortoage70beginatthelaterofactualretirementorage65.
Wealsomaintainadeferredcompensationplan,inwhichallnon-employeemembersoftheBoardareeligibletoparticipate.Participantsmaydeferupto100%oftheircashcompensation.Theymayelectfromeitherorbothofthefollowingtwoalternativemethodsofdeterminingbenefits:
• interestaccruesuntilpaidoutattherateofinterestdeterminedpriortothebeginningofthedeferralyeartorepresentKroger’scostoften-yeardebt;and
• amountsarecreditedin“phantom”stockaccountsandtheamountsinthoseaccountsfluctuatewiththeprice of Kroger common shares.
Inbothcases,deferredamountsarepaidoutonly incash,basedondeferraloptionsselectedbytheparticipantsatthetimethedeferralelectionsaremade.Participantscanelecttohavedistributionsmadeina lumpsumor inquarterly installments, andmaymakecomparableelections fordesignatedbeneficiarieswhoreceivebenefitsintheeventthatdeferredcompensationisnotcompletelypaidoutuponthedeathofthe participant.
TheBoardhasdetermined thatcompensationofnon-employeedirectorsmustbecompetitiveonanon-goingbasistoattractandretaindirectorswhomeetthequalificationsforserviceonKroger’sBoard.Non-employeedirectorcompensationwillbereviewedfromtimetotimeastheCorporateGovernanceCommitteedeems appropriate.
P o t e N t i a l P a y M e N t S u P o N t e r M i N a t i o N o r c h a N g e i N c o N t r o l
Kroger has no employment agreements with its named executive officers and no contracts, agreements, plans or arrangements that provide for payments to the named executive officers in connection with resignation,severance,retirement,termination,orchangeincontrol,exceptforthoseavailablegenerallytosalaried employees. The Kroger Co. Employee Protection Plan, or KEPP, applies to all management employees andadministrativesupportpersonnelwhoarenotcoveredbyacollectivebargainingagreement,withatleastoneyearofservice,andprovidesseverancebenefitswhenaparticipant’semploymentisterminatedactuallyor constructively within two years following a change in control of Kroger. The actual amount is dependent on pay level and years of service. For purposes of KEPP, a change in control occurs if:
• anypersonorentity(excludingKroger’semployeebenefitplans)acquires20%ormoreofthevotingpowerofKroger;
• amerger,consolidation,shareexchange,division,orotherreorganizationortransactionwithKrogerresults in Kroger’s voting securities existing prior to that event representing less than 60% of thecombinedvotingpowerimmediatelyaftertheevent;

44
• Kroger’sshareholdersapproveaplanofcompleteliquidationorwindingupofKrogeroranagreementforthesaleordispositionofallorsubstantiallyallofKroger’sassets;or
• duringanyperiodof24consecutivemonths,individualsatthebeginningoftheperiodwhoconstitutedKroger’sBoardofDirectorsceaseforanyreasontoconstituteatleastamajorityoftheBoardofDirectors.
Assuming that a change in control occurred on the last day of Kroger’s fiscal year 2013, and the named executive officers had their employment terminated, they would receive a maximum payment, or, in the case ofgrouptermlifeinsurance,abenefithavingacosttoKroger,intheamountsshownbelow:
NameSeverance
Benefit
Additional Vacation and
Bonus
Accrued and
Banked Vacation
Group Term Life Insurance
Tuition Reimbursement
Outplacement Reimbursement
DavidB.Dillon . . . . . . . . $4,958,446 $107,366 $776,640 $32 $5,000 $10,000W.RodneyMcMullen . . . $3,458,466 $ 73,132 $592,448 $32 $5,000 $10,000J.MichaelSchlotman . . . $2,187,021 $ 40,364 $423,744 $32 $5,000 $10,000KathleenS.Barclay . . . . . $2,204,318 $ 41,224 $ 66,030 $32 $5,000 $10,000PaulW.Heldman . . . . . . . $2,375,510 $ 42,047 $222,780 $32 $5,000 $10,000MichaelL.Ellis . . . . . . . . $1,654,634 $ 29,166 $ 93,384 $32 $5,000 $10,000
Each of the named executive officers also is entitled to continuation of health care coverage for up to 24monthsatthesamecontributionrateasexistedpriortothechangeincontrol.ThecosttoKrogercannotbecalculated,asKrogerselfinsuresthehealthcarebenefitandthecostisbasedonthehealthcareservicesutilizedbytheparticipantandeligibledependents.
Under theKEPPbenefitswillbe reduced, to theextentnecessary, so thatpayments toanexecutiveofficerwillinnoeventexceed2.99timestheofficer’saverageW-2earningsovertheprecedingfiveyears.
Kroger’schangeincontrolbenefitsunderKEPPandunderequitycompensationawardsarediscussedfurther in theCompensationDiscussion andAnalysis section under the “Retirement andOther Benefits”heading.
c o M P e N S a t i o N P o l i c i e S a S t h e y r e l a t e t o r i S k M a N a g e M e N t
Kroger’s compensation policies and practices for its employees are designed to attract and retain highly qualifiedandengagedemployees,andtominimizerisksthatwouldhaveamaterialadverseeffectonKroger.Oneofthesepolicies,theexecutivecompensationrecoupmentpolicy,ismoreparticularlydescribedintheCompensationDiscussionandAnalysis.KrogerdoesnotbelievethatitscompensationpoliciesandpracticescreaterisksthatarereasonablylikelytohaveamaterialadverseeffectonKroger.
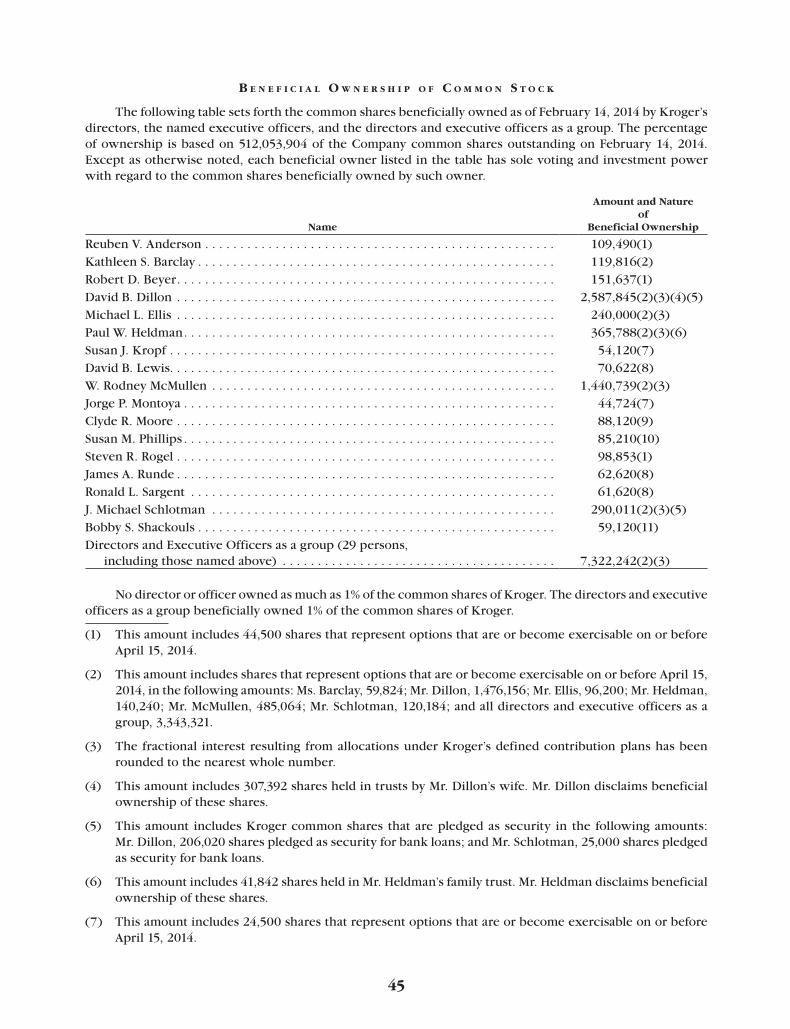
45
B e N e F i c i a l o w N e r S h i P o F c o M M o N S t o c k
ThefollowingtablesetsforththecommonsharesbeneficiallyownedasofFebruary14,2014byKroger’sdirectors, the named executive officers, and the directors and executive officers as a group. The percentage ofownership isbasedon512,053,904of theCompanycommonsharesoutstandingonFebruary14,2014.Exceptasotherwisenoted,eachbeneficialownerlistedinthetablehassolevotingandinvestmentpowerwithregardtothecommonsharesbeneficiallyownedbysuchowner.
Name
Amount and Natureof
Beneficial Ownership
ReubenV.Anderson . . . . . . . . . . . . . . . . . . . . . . . . . . . . . . . . . . . . . . . . . . . . . . . . . . 109,490(1)KathleenS.Barclay . . . . . . . . . . . . . . . . . . . . . . . . . . . . . . . . . . . . . . . . . . . . . . . . . . . 119,816(2)RobertD.Beyer . . . . . . . . . . . . . . . . . . . . . . . . . . . . . . . . . . . . . . . . . . . . . . . . . . . . . . 151,637(1)DavidB.Dillon . . . . . . . . . . . . . . . . . . . . . . . . . . . . . . . . . . . . . . . . . . . . . . . . . . . . . . 2,587,845(2)(3)(4)(5)MichaelL.Ellis . . . . . . . . . . . . . . . . . . . . . . . . . . . . . . . . . . . . . . . . . . . . . . . . . . . . . . 240,000(2)(3)PaulW.Heldman . . . . . . . . . . . . . . . . . . . . . . . . . . . . . . . . . . . . . . . . . . . . . . . . . . . . . 365,788(2)(3)(6)SusanJ.Kropf . . . . . . . . . . . . . . . . . . . . . . . . . . . . . . . . . . . . . . . . . . . . . . . . . . . . . . . 54,120(7)DavidB.Lewis. . . . . . . . . . . . . . . . . . . . . . . . . . . . . . . . . . . . . . . . . . . . . . . . . . . . . . . 70,622(8)W.RodneyMcMullen . . . . . . . . . . . . . . . . . . . . . . . . . . . . . . . . . . . . . . . . . . . . . . . . . 1,440,739(2)(3)JorgeP.Montoya . . . . . . . . . . . . . . . . . . . . . . . . . . . . . . . . . . . . . . . . . . . . . . . . . . . . . 44,724(7)ClydeR.Moore . . . . . . . . . . . . . . . . . . . . . . . . . . . . . . . . . . . . . . . . . . . . . . . . . . . . . . 88,120(9)SusanM.Phillips . . . . . . . . . . . . . . . . . . . . . . . . . . . . . . . . . . . . . . . . . . . . . . . . . . . . . 85,210(10)StevenR.Rogel . . . . . . . . . . . . . . . . . . . . . . . . . . . . . . . . . . . . . . . . . . . . . . . . . . . . . . 98,853(1)JamesA.Runde . . . . . . . . . . . . . . . . . . . . . . . . . . . . . . . . . . . . . . . . . . . . . . . . . . . . . . 62,620(8)RonaldL.Sargent . . . . . . . . . . . . . . . . . . . . . . . . . . . . . . . . . . . . . . . . . . . . . . . . . . . . 61,620(8)J.MichaelSchlotman . . . . . . . . . . . . . . . . . . . . . . . . . . . . . . . . . . . . . . . . . . . . . . . . . 290,011(2)(3)(5)BobbyS.Shackouls . . . . . . . . . . . . . . . . . . . . . . . . . . . . . . . . . . . . . . . . . . . . . . . . . . . 59,120(11)Directors and Executive Officers as a group (29 persons, includingthosenamedabove) . . . . . . . . . . . . . . . . . . . . . . . . . . . . . . . . . . . . . . . 7,322,242(2)(3)
Nodirectororofficerownedasmuchas1%ofthecommonsharesofKroger.Thedirectorsandexecutiveofficersasagroupbeneficiallyowned1%ofthecommonsharesofKroger.
(1) Thisamountincludes44,500sharesthatrepresentoptionsthatareorbecomeexercisableonorbeforeApril15,2014.
(2) ThisamountincludessharesthatrepresentoptionsthatareorbecomeexercisableonorbeforeApril15,2014,inthefollowingamounts:Ms.Barclay,59,824;Mr.Dillon,1,476,156;Mr.Ellis,96,200;Mr.Heldman,140,240;Mr.McMullen,485,064;Mr.Schlotman,120,184;andalldirectorsandexecutiveofficersasagroup, 3,343,321.
(3) Thefractional interestresulting fromallocationsunderKroger’sdefinedcontributionplanshasbeenroundedtothenearestwholenumber.
(4) Thisamountincludes307,392sharesheldintrustsbyMr.Dillon’swife.Mr.Dillondisclaimsbeneficialownership of these shares.
(5) Thisamount includesKrogercommonshares thatarepledgedassecurity in the followingamounts:Mr.Dillon,206,020sharespledgedassecurityforbankloans;andMr.Schlotman,25,000sharespledgedassecurityforbankloans.
(6) Thisamountincludes41,842sharesheldinMr.Heldman’sfamilytrust.Mr.Heldmandisclaimsbeneficialownership of these shares.
(7) Thisamountincludes24,500sharesthatrepresentoptionsthatareorbecomeexercisableonorbeforeApril15,2014.

46
(8) Thisamountincludes29,500sharesthatrepresentoptionsthatareorbecomeexercisableonorbeforeApril15,2014.
(9) Thisamountincludes34,500sharesthatrepresentoptionsthatareorbecomeexercisableonorbeforeApril15,2014.
(10) Thisamountincludes33,500sharesthatrepresentoptionsthatareorbecomeexercisableonorbeforeApril15,2014.
(11) Thisamountincludes19,500sharesthatrepresentoptionsthatareorbecomeexercisableonorbeforeApril15,2014.
AsofFebruary14,2014,thefollowingreportedbeneficialownershipofKrogercommonsharesbasedonreportsonSchedule13GfiledwiththeSecuritiesandExchangeCommissionorotherreliableinformationas follows:
Name Address of Beneficial Owner
Amount andNature of
Ownership Percentage
of Class
BlackRock,Inc.(1) 40East52ndStreet 38,359,173 7.40%NewYork,NY10022
FMRLLC(2) 245SummerStreetBoston,MA02210
37,604,848 7.28%
TheKrogerCo.SavingsPlan 1014VineStreet 26,231,418(3) 5.12%Cincinnati,OH45202
(1) ReflectsbeneficialownershipbyBlackRockInc.,asofDecember31,2013,asreportedonAmendmentNo.4totheSchedule13GfiledwiththeSEConJanuary29,2014,andreportssolevotingpowerwithrespectto31,511,599commonsharesandsoledispositivepowerwithrespectto38,359,173commonshares.
(2) Reflects beneficial ownership by FMR LLC, as of December 31, 2013, as reported on Schedule 13GfiledwiththeSEConFebruary14,2014(the“FMR13G”),andreportssolevotingpowerwithrespectto1,337,580common shares and soledispositivepowerwith respect to37,604,848common shares.The FMR 13G reports beneficial ownership of common shares by FidelityManagement & ResearchCompany,EdwardC.Johnson3d,FMRLLC,FidelitySelectCo,LLC,SelectCoFunds,FidelityManagementTrustCompany,StrategicAdvisors,Inc.,PyramisGlobalAdvisors,LLC,PyramisGlobalAdvisorsTrustCompany and FIL Limited. The voting and investment power of the various holders with respect to these commonsharesissetforthintheFMR13G.
(3) Sharesbeneficiallyownedbyplantrusteesforthebenefitofparticipantsinemployeebenefitplan.
S e c t i o N 16 ( a ) B e N e F i c i a l o w N e r S h i P r e P o r t i N g c o M P l i a N c e
Section16(a)oftheSecuritiesExchangeActof1934requiresourofficersanddirectors,andpersonswhoownmorethan10%ofaregisteredclassofourequitysecurities,tofilereportsofownershipandchangesinownershipwiththeSecuritiesandExchangeCommission.Thoseofficers,directorsandshareholdersarerequiredbySECregulationtofurnishuswithcopiesofallSection16(a)formstheyfile.
Based solely on our review of the copies of Forms 3 and 4 received by Kroger, and any writtenrepresentationsfromcertainreportingpersonsthatnoForms5wererequiredforthosepersons,webelievethatduring fiscalyear2013all filingrequirementsapplicable toourofficers,directorsand10%beneficialownersweretimelysatisfied,withthefollowingexceptions.InMarch2013,KathleenS.Barclay,RobertW.Clark,GeoffreyJ.Covert,DavidB.Dillon,MichaelJ.Donnelly,KevinM.Dougherty,MichaelL.Ellis,PaulW.Heldman,ScottM.Henderson,ChristopherT.Hjelm,CalvinJ.Kaufman,LynnMarmer,W.RodneyMcMullen,M.MarnettePerry,J.MichaelSchlotman,MaryElizabethVanOflen,andR.PeteWilliamswere2dayslate

47
in the filingofForms4 toreport (i) shareawardsunderCompanyperformanceunitagreements,and(ii)withtheexceptionofMr.McMullen,sharedispositionsfortaxliabilityrelatedtosaidshareawards;duetoanadministrativeerrorbytheCompany.Also,inMarch2013,MarkC.TuffinfiledaForm5toreport4,000shareshelddirectlythatinadvertentlywerenotreportedonhisForm3filingandasubsequentForm3/AandForm 4 filing.
r e l a t e d P e r S o N t r a N S a c t i o N S
UnderourStatement of Policy with Respect to Related Person TransactionsandtherulesoftheSEC,the Audit Committee approved the following related party transaction:
• Duringfiscalyear2013,KrogermadepurchasesfromStaples,Inc.,totalingapproximately$10million.Thisamountrepresentssubstantiallylessthan2%ofStaples’annualconsolidatedgrossrevenue.KrogerperiodicallyemploysabiddingprocessornegotiationsfollowingabenchmarkingofcostsofproductsfromvariousvendorsfortheitemspurchasedfromStaplesandawardsthebusinessbasedontheresultsof thatprocess.RonaldL. Sargent, amemberofKroger’sBoardofDirectors, isChairmanandChiefExecutiveOfficerofStaples.
Director independence isdiscussed aboveunder theheading “InformationConcerning theBoardofDirectors.”Kroger’spolicyonrelatedpersontransactionsisasfollows:
S t a t e M e N t o F P o l i c y w i t h r e S P e c t t o
r e l a t e d P e r S o N t r a N S a c t i o N S
a . i N t r o d u c t i o N
ItisthepolicyofKroger’sBoardofDirectorsthatanyRelatedPersonTransactionmaybeconsummatedor may continue only if the Committee approves or ratifies the transaction in accordance with the guidelines setforthinthispolicy.TheBoardofDirectorshasdeterminedthattheAuditCommitteeoftheBoardisbestsuited to review and approve Related Person Transactions.
Forthepurposesofthispolicy,a“RelatedPerson”is:
1. anypersonwhois,oratanytimesincethebeginningofKroger’slastfiscalyearwas,adirectororexecutiveofficerofKrogeroranomineetobecomeadirectorofKroger;
2. anypersonwhoisknowntobethebeneficialownerofmorethan5%ofanyclassofKroger’svotingsecurities;and
3. anyimmediatefamilymemberofanyoftheforegoingpersons,whichmeansanychild,stepchild,parent,stepparent,spouse,sibling,mother-in-law,father-in-law,son-in-law,daughter-in-law,brother-in-law,orsister-in-lawofthedirector,executiveofficer,nomineeormorethan5%beneficialowner,andanyperson(otherthanatenantoremployee)sharingthehouseholdofsuchdirector,executiveofficer,nomineeormorethan5%beneficialowner.
Forthepurposesofthispolicy,a“RelatedPersonTransaction”isatransaction,arrangementorrelationship(oranyseriesofsimilartransactions,arrangementsorrelationships)sincethebeginningofKroger’slastfiscalyearinwhichKroger(includinganyofitssubsidiaries)was,isorwillbeaparticipantandtheamountinvolvedexceeds $120,000, and in which any Related Person had, has or will have a direct or indirect material interest (otherthansolelyasaresultofbeingadirectororalessthan10percentbeneficialownerofanotherentity).
48
Notwithstanding the foregoing, the Audit Committee has reviewed the following types of transactions andhasdeterminedthateachtypeoftransactionisdeemedtobepre-approved,eveniftheamountinvolvedexceeds $120,000.
1. Certain Transactions with Other Companies. Any transaction for property or services in the ordinary course of business involving payments to or from another company at which a Related Person’sonlyrelationshipisasanemployee(includinganexecutiveofficer),director,orbeneficialowneroflessthan10%ofthatcompany’sshares,iftheaggregateamountinvolvedinanyfiscalyeardoesnotexceed the greater of $1,000,000 or 2 percent of that company’s annual consolidated gross revenues.
2. CertainCompanyCharitableContributions.Anycharitablecontribution,grantorendowmentbyKroger(oroneofitsfoundations)toacharitableorganization,foundation,universityorothernotfor profit organization at which a Related Person’s only relationship is as an employee (including anexecutiveofficer)orasadirector,iftheaggregateamountinvolveddoesnotexceed$250,000or5percent,whicheverislesser,ofthecharitableorganization’slatestpubliclyavailableannualconsolidated gross revenues.
3. Transactionswhere all Shareholders Receive Proportional Benefits. Any transaction where the RelatedPerson’sinterestarisessolelyfromtheownershipofKrogercommonstockandallholdersofKrogercommonstockreceivedthesamebenefitonaproratabasis.
4. Executive Officer and Director Compensation.(a)AnyemploymentbyKrogerofanexecutiveofficerif theexecutiveofficer’s compensation is required tobe reported inKroger’sproxy statement,(b)anyemploymentbyKrogerofanexecutiveofficeriftheexecutiveofficerisnotanimmediatefamilymemberofaRelatedPersonandtheCompensationCommitteeapproved(orrecommendedthattheBoardapprove)theexecutiveofficer’scompensation,and(c)anycompensationpaidtoadirectorifthecompensationisrequiredtobereportedinKroger’sproxystatement.
5. Other Transactions. (a) Any transaction involving a Related Personwhere the rates or chargesinvolvedaredeterminedbycompetitivebids,(b)anytransactionwithaRelatedPersoninvolvingtherenderingofservicesasacommonorcontractcarrier,orpublicutility,atratesorchargesfixedinconformitywith laworgovernmentalauthority,or (c)any transactionwithaRelatedPersoninvolving services as abankdepositaryof funds, transfer agent, registrar, trusteeunder a trustindenture or similar services.
B . a u d i t c o M M i t t e e a P P r o v a l
In the event management becomes aware of any Related Person Transactions that are not deemedpre-approvedunderparagraphAofthispolicy,thosetransactionswillbepresentedtotheCommitteeforapprovalatthenextregularCommitteemeeting,orwhereitisnotpracticableordesirabletowaituntilthenext regular Committee meeting, to the Chair of the Committee (who will possess delegated authority to act betweenCommitteemeetings)subjecttoratificationbytheCommitteeatitsnextregularmeeting.IfadvanceapprovalofaRelatedPersonTransactionisnotfeasible,thentheRelatedPersonTransactionwillbepresentedtotheCommitteeforratificationatthenextregularCommitteemeeting,orwhereit isnotpracticableordesirabletowaituntilthenextregularCommitteemeeting,totheChairoftheCommitteeforratification,subjecttofurtherratificationbytheCommitteeatitsnextregularmeeting.
In connection with each regular Committee meeting, a summary of each new Related Person Transaction deemedpre-approvedpursuant toparagraphsA(1)andA(2)abovewillbeprovided to theCommittee forits review.
IfaRelatedPersonTransactionwillbeongoing,theCommitteemayestablishguidelinesformanagementto follow in its ongoing dealings with the Related Person. Thereafter, the Committee, on at least an annual basis,willreviewandassessongoingrelationshipswiththeRelatedPersontoseethattheyareincompliancewith the Committee’s guidelines and that the Related Person Transaction remains appropriate.

49
TheCommittee(ortheChair)willapproveonlythoseRelatedPersonTransactionsthatarein,orarenot inconsistentwith, the best interests ofKroger and its shareholders, as theCommittee (or theChair)determinesingoodfaithinaccordancewithitsbusinessjudgment.
No director will participate in any discussion or approval of a Related Person Transaction for which he orshe,oranimmediatefamilymember(asdefinedabove),isaRelatedPersonexceptthatthedirectorwillprovideallmaterialinformationabouttheRelatedPersonTransactiontotheCommittee.
c . d i S c l o S u r e
KrogerwilldiscloseallRelatedPersonTransactions inKroger’s applicable filingsas requiredby theSecuritiesActof1933,theSecuritiesExchangeActof1934andrelatedrules.
a u d i t c o M M i t t e e r e P o r t
TheprimaryfunctionoftheAuditCommitteeistorepresentandassisttheBoardofDirectorsinfulfillingitsoversightresponsibilitiesregardingtheCompany’sfinancialreportingandaccountingpracticesincludingthe integrityof theCompany’s financial statements; theCompany’s compliancewith legal and regulatoryrequirements;theindependentpublicaccountants’qualificationsandindependence;theperformanceoftheCompany’sinternalauditfunctionandindependentpublicaccountants;andthepreparationofthisreportthatSECrulesrequirebeincludedintheCompany’sannualproxystatement.TheAuditCommitteeperformsthisworkpursuanttoawrittencharterapprovedbytheBoardofDirectors.TheAuditCommitteechartermostrecentlywasrevisedduringfiscal2012andisavailableontheCompany’swebsiteatir.kroger.com.TheAudit Committee has implemented procedures to assist it during the course of each fiscal year in devoting the attention that is necessary and appropriate to each of the matters assigned to it under the Committee’s charter. The Audit Committee held five meetings during fiscal year 2013. The Audit Committee meets separately withtheCompany’s internalauditorandPricewaterhouseCoopersLLP,theCompany’s independentpublicaccountants, without management present, to discuss the results of their audits, their evaluations of the Company’s internal controls over financial reporting, and the overall quality of the Company’s financialreporting.TheAuditCommitteealsomeetsseparatelywiththeCompany’sChiefFinancialOfficerandGeneralCounsel when needed. Following these separate discussions, the Audit Committee meets in executive session.
ManagementoftheCompanyisresponsibleforthepreparationandpresentationoftheCompany’sfinancialstatements, the Company’s accounting and financial reporting principles and internal controls, and procedures that are designed to provide reasonable assurance regarding compliance with accounting standards andapplicablelawsandregulations.TheindependentpublicaccountantsareresponsibleforauditingtheCompany’sfinancial statements and expressing opinions as to the financial statements’ conformity with generally accepted accounting principles and the effectiveness of the Company’s internal control over financial reporting.
In the performance of its oversight function, the Audit Committee has reviewed and discussed with management and PricewaterhouseCoopers LLP the audited financial statements for the year ended February 1, 2014, management’s assessment of the effectiveness of the Company’s internal control overfinancialreportingasofFebruary1,2014,andPricewaterhouseCoopers’evaluationoftheCompany’sinternalcontrol over financial reporting as of that date. The Audit Committee has also discussed with the independent public accountants thematters that the independent public accountantsmust communicate to theAuditCommitteeunderapplicablerequirementsofthePublicCompanyAccountingOversightBoard.
With respect to theCompany’s independentpublic accountants, theAuditCommittee, amongotherthings, discussed with PricewaterhouseCoopers LLP matters relating to its independence and has received the written disclosures and the letter from the independent public accountants required by applicablerequirements of the Public Company Accounting Oversight Board regarding the independent publicaccountants’ communications with the Audit Committee concerning independence. The Audit Committee hasreviewedandapprovedinadvanceallservicesprovidedtotheCompanybyPricewaterhouseCoopersLLP.
The Audit Committee annually reviews PricewaterhouseCoopers LLP’s independence and performance inconnectionwiththeAuditCommittee’sresponsibilityfortheappointmentandoversightoftheCompany’sindependentpublicaccountants.TheAuditCommitteeconsiders,amongotherthings,PricewaterhouseCoopersLLP’s historical and recent performance on the Company’s audit, including an internal survey of their service

50
qualitybymembersofmanagement and theAuditCommittee.TheAuditCommittee reviews recentPublicCompanyAccountingOversightBoardreportsonPricewaterhouseCoopersLLPanditspeerfirms,andconsidersPricewaterhouseCoopersLLP’stenureastheCompany’sindependentpublicaccountantsandtheirfamiliaritywithouroperations,businesses,accountingpoliciesandpracticesandinternalcontroloverfinancialreporting.Further,inconjunctionwiththemandatedrotationofthepublicaccountants’leadengagementpartner,theAuditCommittee is directly involved in the selection of PricewaterhouseCoopers LLP’s lead engagement partner every fiveyears.TheAuditCommitteebelievesthatthecontinuedretentionofPricewaterhouseCoopersLLPtoserveastheCompany’sindependentpublicaccountantsisinthebestinterestsoftheCompanyanditsshareowners.
Baseduponthereviewanddiscussionsdescribedinthisreport,theAuditCommitteerecommendedtotheBoardofDirectorsthattheauditedconsolidatedfinancialstatementsbeincludedintheCompany’sAnnualReportonForm10-KfortheyearendedFebruary1,2014,asfiledwiththeSEC.
ThisreportissubmittedbytheAuditCommittee.
RonaldL.Sargent,ChairSusanJ.KropfSusanM.PhillipsBobbyS.Shackouls
a P P r o v a l o F t h e 2 0 14 l o N g -t e r M i N c e N t i v e a N d c a S h B o N u S P l a N ( i t e M N o . 2 )
TheBoardofDirectorshasadopted,subjecttoshareholderapproval,TheKrogerCo.2014Long-TermIncentiveandCashBonusPlan(“Plan”)forwhichamaximumof25,000,000sharesarereserved.ThepurposeofthePlanistoassistinattractingandretainingemployeesanddirectorsofoutstandingabilityandtoaligntheirinterestswiththoseoftheshareholdersofKroger.Ifapproved,thePlanwillbeeffectiveasofJune26,2014.
d e S c r i P t i o N o F t h e P l a N
General.ThePlanconsistsoftwoseparateequity-basedprograms;theInsiderProgramandtheNon-InsiderProgram.Officers anddirectorsofKroger subject toSection16(a)of theSecuritiesExchangeActof 1934 (the “ExchangeAct”) are eligible for grantsor awardsunder the InsiderProgramwhile all otheremployees of Kroger are eligible for grants or awards under theNon-Insider Program. As of the date ofthisproxystatement,29employeesanddirectorsareeligibletoparticipateintheInsiderProgramandtheremainingapproximately375,000employeesofKrogerareeligibletoparticipateintheNon-InsiderProgram.Inaddition,thePlanprovidesforaperformance-basedCashBonusPrograminwhichall375,000employeesareeligibletoparticipate.Shareholderslastapprovedasimilarplan,providingforissuanceofamaximumof25,000,000shares,attheannualmeetingofshareholdersheldinJune2011.Krogerintendsforsharesundertheseplanstobesufficientforgrantsandawardsmadeintheordinarycourseforaperiodofthreetofouryears.OptionsmaynotbeissuedbelowthefairmarketvalueofaKrogercommonshareonthedateofthegrant.Optionsandstockappreciationrightsmaynotberepriced.
Administration.TheInsiderProgramwillbeadministeredbyacommitteeoftheBoardofDirectorsthatmeetsthestandardsofRule16b-3(d)(1)undertheExchangeActandinitiallywillbetheCompensationCommitteeoftheBoardofDirectors,madeupexclusivelyofindependentdirectors.TheNon-InsiderProgramwillbeadministeredbyacommitteeofthreeofficersappointedbytheChiefExecutiveOfficer,themembersof which are ineligible to receive grants or awards under the Non-Insider Program. The administeringcommitteeineachcaseisreferredtoasthe“Committee.”TheCashBonusProgramwillbeadministeredbytheCommitteeundertheInsiderProgram.ThePlanisdraftedtomaintainthemaximumamountofflexibilitywith the Committee determining the ultimate provisions of each grant or award.
TheCommitteeisauthorizedtoawardorgrantnonstatutorystockoptions,stockappreciationrights,performanceunits,restrictedstockandincentivesharestoparticipantsundertheInsiderProgramandtheNon-InsiderProgram,andtoawardperformance-basedcashbonusesundertheCashBonusProgram.TheCommittee will determine the types and amounts of awards or grants, the recipients of awards or grants, vesting schedules, restrictions, performance criteria, and other provisions of the grants or awards. All of these provisionswillbesetforthinawritteninstrument.
51
InadditiontootherrightsofindemnificationtheymayhaveasdirectorsoremployeesofKroger,membersoftheCommitteewillbeindemnifiedbyKrogerforreasonableexpensesincurredinconnectionwithdefenseofanyactionbroughtagainstthembyreasonofactiontakenorfailuretoactunderorinconnectionwiththePlanoranygrantorawardthereunder,ifthemembersactedingoodfaithandinamannerthattheybelievedtobeinthebestinterestofKroger.
TheBoardofDirectorsmay terminateor amend thePlanat any timewithout shareholder approval,exceptthatitmaynotamendthePlanwithoutshareholderapprovalifrequiredbyapplicablelaw,regulations,orrulesoftheprincipalexchangeorinterdealerquotationsystemonwhichKroger’scommonsharesarelistedorquoted.UnlessearlierterminatedbytheBoardofDirectors,thePlanwillterminateonMarch13,2024.TerminationofthePlanwillhavenoeffectonthevalidityofanyoptions,stockappreciationrights,performanceunits,restrictedstockorincentivesharesoutstandingonthedateoftermination.
Unlessotherwiseprovidedintheagreement,awardsandgrantswillnotbetransferableotherthanbywillorthelawsofdescentanddistribution.
Shares Subject to Grant. Under the Plan, up to 25,000,000 authorized but unissued or reacquiredcommonsharesmaybeissuedupontheexerciseofstockoptions,stockappreciationrights,performanceunits,orawardedasrestrictedstockorincentiveshares.Innoeventmayanyparticipantreceiveawardsandgrantstotalingmorethan3,750,000commonsharesintheaggregateunderthePlan.Themaximumnumberof shares thatmaybe issuedas restricted stock, incentive shares,orperformanceunitsunder thePlan is10,000,000intheaggregate.However,theCommitteeundertheInsiderProgrammayincreasethisnumber,butforeachshareissuedforsuchpurposeinexcessof10,000,000,thenumberofsharesthatmaybeissuedunderthePlanwillbereducedbyfourshares.
Ifanoption,stockappreciationright,orperformanceunitexpiresorterminateswithouthavingbeenfullyissued,orifrestrictedstockorincentivesharesarenotissuedorareforfeitedpriortothepaymentofadividendonthosesharestoaparticipant,thesharesnotexercised,unissuedorforfeited,asthecasemaybe,willgenerallybecomeavailableforothergrantsorawardsunderthePlan.
Stock Options.NonstatutorystockoptionsgrantedunderthePlanwillhaveexercisepricesnotlessthanthegreaterofthefairmarketvaluepercommonshareortheparvalueofacommonshare,atermofnotmorethan10yearsafterthedateofgrant,andmaynotbeexercisedbeforesixmonthsfromthedateofgrant.ThePlanprohibitsthe“repricing”ofstockoptions.SubjecttothetermsofthePlan,theCommitteedeterminesthevestingscheduleandothertermsandconditionsapplicabletostockoptionsgrantedtoemployees.Inrecentyears,optiongrantsgenerallyhavenotbecomeexercisableearlierthanoneyearfromthedateofgrant.Aneligibleparticipantmayreceivemorethanonegrantofoptions.
The Committee may in its discretion provide for the payment of the option exercise price otherwise than incash,includingbydeliveryofcommonshares,valuedattheirfairmarketvalueonthedateofexercise,orbyacombinationofbothcashandcommonshares.
Stock Appreciation Rights.StockappreciationrightsmaybegrantedinconnectionwiththegrantofanonstatutoryoptionunderthePlan(“relatedrights”).IntheCommittee’ssolediscretion,arelatedrightmayapplytoalloraportionofthecommonsharessubjecttotherelatedoption.StockappreciationrightsmayalsobegrantedindependentlyofanyoptiongrantedunderthePlan.Astockappreciationrightentitlesthegranteeuponexercisetoelecttoreceiveincash,commonsharesoracombinationthereof,theexcessofthefairmarketvalueofaspecifiednumberofcommonsharesatthetimeofexerciseoverthefairmarketvalueofsuchnumberofsharesatthetimeofgrant,or,inthecaseofarelatedright,theexercisepriceprovidedintherelatedoption.TotheextentrequiredtocomplywiththerequirementsofRule16b-3undertheExchangeAct or otherwise provided in an agreement under the Plan, the Committee will have sole discretion to consent toordisapprovetheelectionofanygranteetoreceivecashinfullorpartialsettlementofaright.Astockappreciationrightgenerallywillnotbeexercisableuntilatleastsixmonthsfromthedateofgrantandwillhaveatermofnotmorethantenyearsfromthedateofgrant(or,inthecaseofarelatedright,notbeyondtheexpirationoftherelatedoption).ThePlanprohibitsthe“repricing”ofstockappreciationrights.

52
Performance Units.Performanceunitsmaybegrantedinconnectionwiththegrantofanonstatutorystock option under the Plan (“related performance unit”). In the Committee’s sole discretion, a relatedperformanceunitmayapplytoalloraportionofthecommonsharessubjecttotherelatedoption.PerformanceunitsmayalsobegrantedindependentlyofanyoptiongrantedunderthePlan.Inconnectionwiththegrantofperformanceunits,theCommitteewillestablishPerformanceGoals(asdefinedbelow)foraspecifiedperiod.
Upontheexerciseofperformanceunits,orautomaticallyuponsatisfactionof theperformancegoalsassetforthinanagreementfortheperformanceunits,agranteewillbeentitledtoreceivethepaymentofsuchunitsinaccordancewiththetermsoftheawardincommonshares,cash,oracombinationthereof,asthe Committee may determine. The values generally will depend upon the extent to which the performance goalsforthespecifiedperiodhavebeensatisfied,asdeterminedbytheCommittee.Performancegoalsmaybeparticulartoagranteeorthedepartment,branch,subsidiaryorotherunitinwhichthegranteeworks,ormaybebasedontheperformanceofKrogergenerallyandmaycoversuchperiodsasmaybespecifiedby the Committee. For purposes of the Plan, “PerformanceGoals”means performance goals establishedby theCommitteewhichmaybebasedon(i)earningsorearningspershareofKroger,aunitofKroger,or designatedprojects; (ii) total sales, identical sales, or comparable sales ofKroger, a unit ofKroger, ordesignatedprojects;(iii)cashflow;(iv)cashflowfromoperations;(v)operatingprofitorincome;(vi)netincome;(vii)operatingmargin;(viii)netincomemargin;(ix)returnonnetassets;(x)economicvalueadded;(xi)returnontotalassets;(xii)returnoncommonequity;(xiii)returnontotalorinvestedcapital;(xiv)totalshareholderreturn;(xv)revenue;(xvi)revenuegrowth;(xvii)earningsbeforeinterest,taxes,depreciationandamortization(“EBITDA”);(xviii)EBITDAgrowth;(xix)fundsfromoperationspershareandpersharegrowth; (xx) cash available for distribution; (xxi) cash available for distribution per share and per sharegrowth;(xxii)sharepriceperformanceonanabsolutebasisandrelativetoanindexofearningspershareorimprovementsinKroger’sattainmentofexpenselevels;(xxiii)reductioninoperatingcostsasapercentageofsales;(xxiv)performanceinkeycategories;(xxv)implementingorcompletionofstrategicinitiativesorcriticalprojects;and(xxvi)keycategoryperformanceasmeasuredbytheresultsofsurveysofcustomersorassociates,oranyotherobjectivegoalsestablishedbytheCommittee,andmaybeabsoluteintheirtermsormeasured against or in relationship to other companies similarly or otherwise situated. Performance units may beexercisedonlyupontheachievementofminimumPerformanceGoalsduringtheperiodasdeterminedbytheCommittee.TheCommitteewilldeterminetheperiodduringwhichperformanceunitsareexercisableand specifically set forth such period in any agreement granting performance units to a participant in the Plan,provided,however,thataperformanceunitgenerallymaynotbeexerciseduntiltheexpirationofatleast six months from the date of grant. Performance units will expire no later than ten years from the date ofgrant(orinthecaseofarelatedperformanceunit,theexpirationoftherelatedoption).Anyperformanceunitspaidintheformofcasharedeemedtobepaidincommonshares,withthenumberofsharesbeingdeemedpaidequaltotheamountofcashpaidtotheemployeedividedbythefairmarketvalueofacommonshare on the date of payment.
Restricted Stock. TheCommitteemayawardrestrictedstocktoparticipants.Thestockwillbesubjecttoforfeiture,restrictionsontransferability,andotherrestrictionsasspecifiedintheagreement.TheCommitteehasauthoritytoimposeothertermsandconditionsasitmaydetermineinitsdiscretionincludingmakingthevestingofawardscontingentontheachievementofPerformanceGoals.Duringtheperiodthatarestrictedstockawardissubjecttorestrictions,anemployeehastherighttovotethesharesandreceivedividends.
Incentive Shares. The Committee may grant incentive shares to participants. Incentive share awards will consistofcommonsharesissuedortobeissuedatsuchtimes,subjecttoachievementofsuchPerformanceGoalsorothergoals,orwithoutcondition,andonsuchothertermsandconditionsastheCommitteedeemsappropriate and specifies in an agreement relating thereto.
Cash Bonuses.TwotypesofbonusescanbeawardedundertheCashBonusProgram;anannualbonusaward for each fiscal year, and a long-termbonus award formeasurementperiods in excess of one year.BonuspaymentsarebasedonKroger’sperformancemeasuredagainstPerformanceGoalsestablishedbytheCommittee.TheCommitteeestablishesabonus“potential” foreachbonuspayableunder theCashBonusProgramforeachparticipant,basedontheparticipant’slevelwithinKroger,andactualpayoutscanexceedthatamountwhenKroger’sperformanceexceedsthepre-establishedthresholds.InitiallythePerformanceGoalsforannualbonuseswillincludethefollowingcomponents:(i)EBITDA;(ii)identicalsales;(iii)achievement

53
ofstrategicinitiatives;and(iv)achievementofsupermarketfuelcentergoalsforEBITDA,gallonssold,andnumber of fuel centers. Initially the PerformanceGoals for long-termbonuseswill include the followingcomponents: (i)performance in fourkeycategories inKroger’s strategicplan, (ii) reduction inoperatingcostsasapercentageofsales,(iii)performanceincategoriesdesignedtomeasureassociateengagement,and(iv)returnoninvestedcapital.NosingleCashBonustoaparticipantmayexceed$5,000,000.
c e r t a i N F e d e r a l i N c o M e t a x c o N S e q u e N c e S
Nonstatutory Stock Options, Stock Appreciation Rights, and Performance Units. A grantee will not recognizeincomeonthegrantofanonstatutorystockoption,stockappreciationrightorperformanceunit,butgenerallywillrecognizeordinaryincomeupontheexercisethereof.Theamountofincomerecognizedupontheexerciseofanonstatutorystockoptiongenerallywillbemeasuredbytheexcess,ifany,ofthefairmarketvalueofthesharesatthetimeofexerciseovertheexerciseprice,providedthesharesissuedareeithertransferableornot subject to a substantial riskof forfeiture.The amountof income recognizedupon theexerciseofastockappreciationrightoraperformanceunit,ingeneral,willbeequaltotheamountofcashreceivedandthefairmarketvalueofanysharesreceivedatthetimeofexercise,providedthesharesissuedareeithertransferableornotsubjecttoasubstantialriskofforfeiture,plustheamountofanytaxeswithheld.Undercertaincircumstances,incomeontheexerciseofaperformanceunitwillbedeferredifthegranteemakesaproperelectiontodefersuchincome.InsomecasestherecognitionofincomebyagranteefromtheexerciseofaperformanceunitmaybedelayedforuptosixmonthsifasaleoftheshareswouldsubjectthegranteetosuitunderSection16(b)oftheExchangeActunlessthegranteeelectstorecognizeincomeatthetime of receipt of such shares. In either case, the amount of income recognized is measured with respect to thefairmarketvalueofthecommonstockatthetimetheincomeisrecognized.
In the case of ordinary income recognizedby a grantee as described above in connectionwith theexerciseofanonstatutorystockoption,a stockappreciationright,oraperformanceunit,Krogerwillbeentitledtoadeductionintheamountofordinaryincomesorecognizedbythegrantee.Krogerwillreporttheincometoberecognizedbygranteeandwillwithholdtheappropriatetaxes.
Incentive Shares and Restricted Stock. Agranteeofincentivesharesorrestrictedstockisnotrequiredto include the value of such shares in ordinary income until the first time the grantee’s rights in the shares are transferable or arenot subject to a substantial riskof forfeiture,whichever occurs earlier, unless thegranteeelectstobetaxedonreceiptoftheshares.Ineithercase,theamountofsuchincomewillbeequaltotheexcessofthefairmarketvalueofthestockatthetimetheincomeisrecognizedovertheamountpaidforthestock.Krogerwillbeentitledtoadeduction intheamountof theordinary incomerecognizedbythegranteeforKroger’staxableyearwhichincludesthelastdayofthegrantee’staxableyearinwhichsuchgranteerecognizestheincome.Krogerwillreporttheincometoberecognizedbygranteeandwillwithholdthe appropriate taxes.
General. Therulesgoverningthetaxtreatmentofoptions,stockappreciationrights,performanceunits,incentivesharesandrestrictedstockandstockacquiredupontheexerciseofoptions,stockappreciationrightsandperformanceunitsarequitetechnical,sothattheabovedescriptionoftaxconsequencesisnecessarilygeneralinnatureanddoesnotpurporttobecomplete.Moreover,statutoryprovisionsare,ofcourse,subjectto change, as are their interpretations, and their application may vary in individual circumstances. Finally, thetaxconsequencesunderapplicablestatelawmaynotbethesameasunderthefederalincometaxlaws.
Tax Deductibility Cap.Section162(m)oftheCodeprovidesthatcertaincompensationreceivedinanyyear by a “covered employee” in excess of $1,000,000 is non-deductible by Kroger for federal income taxpurposes.Section162(m)providesanexception,however,for“performance-basedcompensation.”Totheextentpracticableunderthecircumstances, theCommitteecurrently intendstostructuregrantsandawardsmadeunderthePlanto“coveredemployees”asperformance-basedcompensationthatisexemptfromSection162(m).
Thissummaryofthe2014Long-TermIncentiveandCashBonusPlanisqualifiedinitsentiretybythecompletetextofthePlanthatissetforthinAppendix1ofthisProxyStatement.

54
e x i S t i N g P l a N S
AsofourfiscalyearendedFebruary1,2014,therewere16,171,099sharesremainingforfutureissuanceunderexistingequitycompensationplans.Oftheseshares,5,103,640wereavailableforawardsotherthanoptionsor stockappreciation rights.Under someof theseplans, this sublimiton fullvalue sharescanbeincreasedbydecreasingbyfourthetotalnumberofsharesissuableundertheplanforeachsuchincreasedshare.
t h e B o a r d o F d i r e c t o r S r e c o M M e N d S a v o t e F o r t h i S P r o P o S a l .
N e w P l a N B e N e F i t S
2014 Long-Term Incentive and Cash Bonus Plan
Name and Position (1) Dollar value ($) Number of Units
AllGroups . . . . . . . . . . . . . . . . . . . . . . . . . . . . . . . . . . . . . . . . . . . . . . . . . (1) (1)
(1) Awardsunderthe2014Long-TermIncentiveandCashBonusPlanaresubjecttothediscretionoftheCompensationCommitteeoracommitteeofofficers,asapplicable.Itisnotpossibletodeterminethebenefits thatwill be received by executive officers and other employees if the plan is approved byshareholders.PleaserefertotheGrantsofPlan-BasedAwardstablefordisclosureofequityawardsmadeto our named executive officers in fiscal 2013.
e q u i t y c o M P e N S a t i o N P l a N i N F o r M a t i o N
ThefollowingtableprovidesinformationregardingsharesoutstandingandavailableforissuanceundertheCompany’sexistingequitycompensationplans.
Plan Category
(a)Number of securities
to be issuedupon exercise of
outstanding options,warrants and rights
(1)
(b)Weighted-averageexercise price of
outstanding options, warrants
and rights
(c)Number of securitiesremaining for futureissuance under equitycompensation plans(excluding securitiesreflected in column
(a))(2)
Equitycompensationplansapprovedbysecurity holders . . . . . . . . . . . . . . . . . . . . . 22,863,444 $25.66 16,171,099
Equitycompensationplansnotapprovedbysecurity holders . . . . . . . . . . . . . . . . . . . . . — $ — —
Total. . . . . . . . . . . . . . . . . . . . . . . . . . . . . . . . . 22,863,444 $25.66 16,171,099
(1) Thetotalnumberofsecuritiesreportedincludesthemaximumnumberofcommonshares,1,189,345,thatmaybeissuedunderperformanceunitsgrantedunderoneormorelong-termincentiveplans.ThenatureoftheawardsismoreparticularlydescribedintheEquitysectionoftheCompensationDiscussionandAnalysis.Theweighted-averageexercisepriceincolumn(b)doesnottaketheseperformanceunitawardsintoaccount.Basedonhistoricaldata,orinthecaseoftheawardmadein2011andearnedin2013,theactualpayoutpercentage,theCompany’sbestestimateofthenumberofsecuritiesthatwillbeissuedundertheperformanceunitagreementsisapproximately752,139.
(2) Theplansincludeinitiallimitationsonthenumberofsharesthatcanbeissuedasincentivesharesorrestrictedstock.TheCompanymayincreasethisamountbydecreasingthetotalnumberofsecuritiesthatcanbeissuedbyfourforeachstockshareissuedinexcessofthestatedinitiallimitation.

55
a d v i S o r y v o t e o N e x e c u t i v e c o M P e N S a t i o N ( i t e M N o . 3 )
TheDodd-FrankWallStreetReformandConsumerProtectionAct,enactedinJuly2010,requiresthatwegiveourshareholderstherighttoapprove,onanonbinding,advisorybasis,thecompensationofournamedexecutiveofficersasdisclosedearlierinthisproxystatementinaccordancewiththeSEC’srules.
As discussed earlier in our Compensation Discussion and Analysis, our compensation philosophy is to:
• maketotalcompensationcompetitive;
• includeopportunitiesforequityownershipaspartofcompensation;and
• useincentivecompensationtohelpdriveperformancebyprovidingsuperiorpayforsuperiorresults.
Furthermore, as previously disclosed, an increased percentage of total potential compensation is performance-basedasopposedtotime-basedashalfofthecompensationpreviouslyawardedtothenamedexecutiveofficersasrestrictedstock(andearnedbasedonthepassageoftime)isnowonlyearnedtotheextentthatperformancegoalsareachieved.Inaddition,annualandlong-termcashbonusesareperformance-basedandearnedonlytotheextentthatperformancegoalsareachieved.Inaddition,annualandlong-termcashbonusesareperformance-basedandearnedonlytotheextentthatperformancegoalsareachieved.Intyinga largeportionofexecutivecompensationtoachievementofshort-termand long-termstrategicandoperationalgoals,weseektocloselyaligntheinterestsofournamedexecutiveofficerswiththeinterestsofour shareholders.
The vote on this resolution is not intended to address any specific element of compensation. Rather, the voterelatestothecompensationofournamedexecutiveofficersasdescribedinthisproxystatement.Thevote isadvisory.Thismeansthat thevote isnotbindingonKroger.TheCompensationCommitteeofourBoardofDirectorsisresponsibleforestablishingexecutivecompensation.InsodoingthatCommitteewillconsider, along with all other relevant factors, the results of this vote.
Weaskourshareholderstovoteonthefollowingresolution:
“RESOLVED,thatthecompensationpaidtotheCompany’snamedexecutiveofficers,asdisclosedpursuantto Item 402 of Regulation S-K, including the Compensation Discussion and Analysis, compensationtables,andtherelatednarrativediscussion,isherebyAPPROVED.”
t h e B o a r d o F d i r e c t o r S r e c o M M e N d S a v o t e F o r t h i S P r o P o S a l .
S e l e c t i o N o F a u d i t o r S ( i t e M N o . 4 )
TheAuditCommitteeoftheBoardofDirectorsisresponsiblefortheappointment,compensationandretentionofKroger’sindependentauditor,asrequiredbylawandbyapplicableNYSErules.OnMarch12,2014, the Audit Committee appointed PricewaterhouseCoopers LLP as Kroger’s independent auditor for the fiscalyearendingJanuary31,2015.WhileshareholderratificationoftheselectionofPricewaterhouseCoopersLLP as Kroger’s independent auditor is not required by Kroger’s Regulations or otherwise, the Board ofDirectorsissubmittingtheselectionofPricewaterhouseCoopersLLPtoshareholdersforratification,asithasin past years, as a good corporate governance practice. If the shareholders fail to ratify the selection, the Audit Committeemay,butisnotrequiredto,reconsiderwhethertoretainthatfirm.Eveniftheselectionisratified,the Audit Committee in its discretion may direct the appointment of a different auditor at any time during the yearifitdeterminesthatsuchachangewouldbeinthebestinterestsofKrogeranditsshareholders.
ArepresentativeofPricewaterhouseCoopersLLPisexpectedtobepresentatthemeetingtorespondtoappropriatequestionsandtomakeastatementifheorshedesirestodoso.
t h e B o a r d o F d i r e c t o r S r e c o M M e N d S a v o t e F o r t h i S P r o P o S a l .

56
d i S c l o S u r e o F a u d i t o r F e e S
ThefollowingdescribesthefeesbilledtoKrogerbyPricewaterhouseCoopersLLPrelatedtothefiscalyearsendedFebruary1,2014andFebruary2,2013:
Fiscal Year 2013 Fiscal Year 2012
Audit Fees . . . . . . . . . . . . . . . . . . . . . . . . . . . . . . . . . . . . . . . . . . . . . . . . . . $5,151,390 $4,428,204Audit-RelatedFees . . . . . . . . . . . . . . . . . . . . . . . . . . . . . . . . . . . . . . . . . . . . 151,878 45,993Tax Fees . . . . . . . . . . . . . . . . . . . . . . . . . . . . . . . . . . . . . . . . . . . . . . . . . . . . 188,021 —All Other Fees . . . . . . . . . . . . . . . . . . . . . . . . . . . . . . . . . . . . . . . . . . . . . . . — —Total. . . . . . . . . . . . . . . . . . . . . . . . . . . . . . . . . . . . . . . . . . . . . . . . . . . . . . . $5,491,289 $4,474,197
Audit FeesfortheyearsendedFebruary1,2014andFebruary2,2013,respectively,wereforprofessionalservices rendered for the audits of Kroger’s consolidated financial statements, the issuance of comfort letters tounderwriters,consents,andassistancewiththereviewofdocumentsfiledwiththeSEC.
Audit-Related Fees.AuditrelatedservicesfortheyearendedFebruary1,2014wereforassuranceandrelatedservicespertainingtoaccountingconsultationinconnectionwithattestservicesthatarenotrequiredbystatuteorregulation,andconsultationsconcerningfinancialaccountingandreportingstandards.TheseservicesareconsideredapprovedundertheCompany’sexistingAuditandNon-AuditServicePre-ApprovalPolicy.ThesefeesalsoincludedservicesrelatedtoacquisitionrelatedduediligencewhichwereapprovedbytheAuditCommitteeinJune2013.
Tax Fees fortheyearendedFebruary1,2014werefortaxauditsupportanddebtrestructuring.WedidnotengagePricewaterhouseCoopersLLPforanytaxservicesfortheyearendedFebruary2,2013.
All Other Fees. We did not engage PricewaterhouseCoopers LLP for other services for the years ended February1,2014andFebruary2,2013.
TheAuditCommitteerequires that itapprove inadvanceallauditandnon-auditworkperformedbyPricewaterhouseCoopersLLP.OnMarch12,2014,theAuditCommitteeapprovedservicestobeperformedbyPricewaterhouseCoopersLLPfortheremainderoffiscalyear2014thatarerelatedtotheauditofKrogerorinvolvetheaudititself.In2007,theAuditCommitteeadoptedanauditandnon-auditservicepre-approvalpolicy.Pursuanttothetermsofthatpolicy,theCommitteewillannuallypre-approvecertaindefinedservicesthat are expected tobeprovidedby the independent auditors. If it becomes appropriateduring the yearto engage the independent accountant for additional services, the Audit Committee must first approve the specificservicesbeforetheindependentaccountantmayperformtheadditionalwork.
PricewaterhouseCoopersLLPhasadvisedtheAuditCommitteethatneitherthefirm,noranymemberofthefirm,hasanyfinancialinterest,directorindirect,inanycapacityinKrogeroritssubsidiaries.
S h a r e h o l d e r P r o P o S a l ( i t e M N o . 5 )
Wehavebeennotifiedbyfiveshareholders,thenamesandshareholdingsofwhichwillbefurnishedpromptlytoanyshareholderuponwrittenororalrequesttoKroger’sSecretaryatKroger’sexecutiveoffices,that they intend to propose the following resolution at the annual meeting:
“ t h e k r o g e r c o M P a N y h u M a N r i g h t S r i S k a S S e S S M e N t - 2 0 14
RESOLVED,thatshareholdersofTheKrogerCompany(“Kroger”)urgetheBoardofDirectorstoreporttoshareholders,atreasonablecostandomittingproprietaryinformation,onKroger’sprocessforidentifyingandanalyzingpotentialandactualhumanrightsrisksofKroger’soperationsandsupplychain(referredtohereinasa“humanrightsriskassessment”)addressingthefollowing:
• Humanrightsprinciplesusedtoframetheassessment
• Frequencyofassessment

57
• Methodologyusedtotrackandmeasureperformance
• Natureandextentofconsultationwithrelevantstakeholdersinconnectionwiththeassessment
• Howtheresultsoftheassessmentareincorporatedintocompanypoliciesanddecisionmaking
ThereportshouldbemadeavailabletoshareholdersonKroger’swebsitenolaterthanOctober31,2014.
S u P P o r t i N g S t a t e M e N t
Aslong-termshareholders,wefavorpoliciesandpracticesthatprotectandenhancethevalueofourinvestments.Thereisincreasingrecognitionthatcompanyrisksrelatedtohumanrightsviolations,suchaslitigation,reputationaldamage,andprojectdelaysanddisruptions,canadverselyaffectshareholdervalue.
Kroger,likemanyothercompanies,hasadoptedasuppliercodeofconduct(SeeTheKrogerCompanyStandardVendorAgreement)buthasyettopublishacompany-wideHumanRightsPolicy,addressinghumanrights issues and a separate human rights code that applies to its suppliers. Adoption of these principles would beanimportantfirststepineffectivelymanaginghumanrightsrisks.Companiesmustthenassessriskstoshareholder value of human rights practices in their operations and supply chains to translate principles into protective practices.
TheimportanceofhumanrightsriskassessmentisreflectedintheUnitedNationsGuidingPrinciplesonBusinessandHumanRights(the“RuggiePrinciples”)approvedbytheUNHumanRightsCouncilin2011.TheRuggiePrinciplesurgethat“businessenterprisesshouldcarryouthumanrightsduediligence…accessingactual andpotential human rights impacts, integrating and acting upon the findings, tracking responses,andcommunicatinghowimpactsareaddressed.”(http://www.business-humanrights.org/media/documents/ruggie/ruggie-guiding-principles-21-mar-201l.pd:D
Kroger’sbusinessexposesittosignificanthumanrightsrisks.Asofyear-end2012,Krogeroperations,including supermarkets, convenience and jewelry stores, are located in over 40 states,with suppliers incountries around theworld, including Iran,China andMalaysia. The company’s supply chain is complexandglobal. The company acknowledges thatwork stoppages, supply chain interruptions andcivil unrest(TheKrogerCompanyForm10-K,Feb.2,2013,pages32,34)couldadverselyaffectthecompany’sabilitytoexecute its strategic plan.
Weurgeshareholderstovoteforthisproposal.”
t h e B o a r d o F d i r e c t o r S r e c o M M e N d S a v o t e a g a i N S t t h i S P r o P o S a l F o r t h e F o l l o w i N g r e a S o N S :
Krogerrecognizestheimportanceofensuringbasichumanrightsarerecognizedbythoseseekingtodobusinesswithus.Assuch,Krogerhasinplaceacomprehensivecodeofconductthatisapplicabletothosethatfurnishgoodsorservicestous,aswellastheircontractors.Thatcodeofconducthasbeenpublishedandisavailableonourwebsiteatwww.kroger.com.Ourexistingcodeofconductrequirescompliancewithallapplicablelaborlaws,regulations,andorders,includingtheFairLaborStandardsAct.Inaddition,thecodeof conduct:
• Prohibitschild,indentured,involuntary,orprisonlabor;
• Prohibitsexposingworkerstounreasonablyhazardous,unsafe,orunhealthyconditions;
• Prohibitsunlawfuldiscrimination;
• Requirestheworkplacetobefreefromharassment;
• Requiresworkerstobetreatedfairly,withdignityandrespect;
• Requiresthatwagesmeetorexceedlegalandindustrystandards;
• RequiresthatU.S.workersbeeligibleforemploymentintheU.S.;
58
• Prohibitsbribesandconductthatappearsimproperormayresultinaconflictofinterest;
• RequirescompliancewiththeU.S.ForeignCorruptPracticesAct;and
• Requiresmaintenanceofrecords(thatmustbefurnishedtousuponrequest)evidencingcompliancewith the code.
Kroger’scodeofconductdoesmorethansimplyreportingonhumanrightsrisksinitssupplychain;itprohibitsthosethatdobusinesswithusfromengaginginthetypeofconductofconcerntotheproponents.Thosethatviolateourcodewillnotbepermittedtodobusinesswithusuntiltheycomplywithourcode.Assuch,wedonotbelievethathumanrightsviolationsinoursupplychainposeasubstantialrisk,thattherequestedreportwouldservelittlebenefittoshareholders,andpreparationofareportwoulddivertresourcesthatotherwisecouldbemoreappropriatelyusedinthebestinterestsofshareholders.
Thisproposalcoversthesamesubjectmatterasonesubmittedtoavoteatthelastthreeyears’annualmeetingsandwassoundlydefeatedbyshareholders.
S h a r e h o l d e r P r o P o S a l ( i t e M N o . 6 )
Wehavebeennotifiedbytwoshareholders, thenameandshareholdingsofwhichwillbe furnishedpromptlytoanyshareholderuponwrittenororalrequesttoKroger’sSecretaryatKroger’sexecutiveoffices,that it intends to propose the following resolution at the annual meeting:
“WHEREAS,post-consumerpackagingandprintedpapercomprisesnearlyhalfofU.S.landfillwasteandisasignificantconsumerofnaturalresources,energyandsourceofgreenhousegasemissions.Halfofprintedpaperandpackagingislandfilledorburnedratherthanrecycled.Plasticpackagingdebrismigratestooceanswhere it damages fisheries, tourism andmarine life. There is a growing link between ineffective wastemanagementandplasticdebrispilingupinEarth’soceansandwaterways,whereit·injuresandkillsmarineanimals,transportsinvasivespeciesandposesathreattohumanhealth.Californiaspendsnearly$500millionannuallytopreventtrash,muchofitpackaging,frompollutingbeaches,riversandoceanfrontage.
Theestimatedmarketvalueofwastedpackagingthatcouldberecycledis$11.4billion.Increasedrecyclingprovidesmoreefficientuseofvaluableresources.Itgenerateslesspollution,andrequireslessenergythanusing virgin rawmaterials. In the U.S., taxpayers pay to recycle packaging, but poor infrastructure andstrappedmunicipalbudgetshaveyieldedlaggingrecyclingrates:38%foraluminum;34%forglass,andonly12%forplastic.Further,Kroger’shousebrands,amongotherproducts,arerecentlyincreasing useofnon-recyclableflexibleplasticpackaging,suchaspouches.
Morethan40countrieshaveshiftedsomeorallcostsofpackagingrecyclingontoproducers.U.S.producersofpackaging-intensivebrandscanexpecttobeaskedtotakemoreresponsibilityforrecyclingofpackaginginthefuture.Webelievesomemeasureofresponsibilityforpackagingisakeycomponentofacorporateenvironmentalsustainabilitypolicy.
ExtendedProducerResponsibility(EPR),acorporateandpublicpolicythatshiftsaccountabilityforfinancingrecycling ofmaterials from taxpayers to producers, is a promising potential solution. Twomajor brands,Coca-ColaCo.andNestleWatersNA,havecalledforproducerstoadoptEPRprogramsintheU.S.Legislationispendinginseveralstates.Takinganactiveroleinplanningformandatedproducerresponsibilityforpackagingwillreducerisk,ensurecontinuedhighqualitypackaging,reducewastedresources,andincreaseprogramefficiencies. The company has not moved decisively to lead or participate in such an effort nor addressed its responsibilityforpost-consumerpackagingforitsbrands.
BEITRESOLVEDTHATshareownersofKrogerrequestthattheboardofdirectorsissueareport,atreasonablecostandomittingconfidentialinformation,developingapolicypositiononthecompany’sresponsibilityforpost-consumer product packaging recycling of its private label brands, and assessingwhether alternativeapproachescouldleadtosubstantiallyincreasedpackagingrecycling.

59
SupportingStatement:Optionsreviewedinthereportshouldincludeanalysesofcompany-basedactionsthatwillincreaserecyclabilityofpackagingmaterials,andparticipationinpolicyandtechnicaldevelopmentofEPRorotherproducerresponsibilitystrategiesincollaborationwithsectorpeers,policymakersandsupplierswithagoalofgreatlyincreasedU.S.recyclingratesandreducedenergyuseandpollution.”
t h e B o a r d o F d i r e c t o r S r e c o M M e N d S a v o t e a g a i N S t t h i S P r o P o S a l F o r t h e F o l l o w i N g r e a S o N S :
Kroger shares the proponent’s concerns regarding waste reduction and recognizes the important role it playsasagoodstewardoftheenvironment.Wehavenumeroussustainabilityinitiativesinplacetopreserveour natural resources and to conserve energy. For instance, the company recycledmore than 35millionpoundsofplasticwaste,frombagsandplasticfilm,in2013.Thecompanyalsorecyclesmorethanabillionpoundsof cardboardeachyear.Most importantly,we’vepioneered thePerishableDonationsPartnership,whichenablesthedonationofmorethan49millionpoundsofsafe,wholesomefoodtoFeedingAmericafoodbankstofighthungerinlocalcommunities.Thatwhichcannotbedonatediscompostedorconvertedtoenergythroughaninnovativewastetoenergysystem.Byscalinguptheseinnovativesolutions,Krogerisreducingtheamountofwastebeingsenttolandfills.Krogeralsoworkstoreducewasteinthefirstplacebydesigningoptimizedpackaging,andisparticipatinginnationaleffortstoexpandandscaleinfrastructure.Foreachofthepastseveralyearswehavepublishedon-lineThe Kroger Co. Public Responsibilities Report and our annual Sustainability Reportthathighlightthecompany’ssustainabilityinitiativesandwastereductionefforts in greater detail.
ThisproposalrequeststhatKrogertakeadditionalstepstoreportonthefeasibilityofadoptingapolicyof“ExtendedProducerResponsibility,”orEPR.Theresolutionprovidesnoguidanceregardingproponent’sviewoftherequirementsofacompany-adoptedEPRpolicy.
Kroger supports efforts to reducewaste in the supply chain, asdescribed above and inour varioussustainabilityreports.Itwouldbeinappropriate,however,tosupportapolicythatisnotclearlydefined.Webelieveoursupportforwastereductioneffortsinoursupplychainaresignificantandmeaningful.
KrogerisfamiliarwithvariousEPRproposalsinstatesandlawsinothercountriesthatrequireretailersandmanufacturerstopaysubstantialtaxesandfeesrelatedtowastedisposal.Theproposalsvaryindetailandimplementation,andwhilewedoassessnewlawsandregulationsfortheirfeasibility,costandrequirements,todosoforeachindividualEPRproposalatthefederal,state,andinternationallevelwouldrequiresignificantresourcesthatcouldbeallocatedmorewiselyinthebestinterestsofshareholders.
Krogeroftenisaskedtotakeapositiononlegislationorregulatoryproposals.Whileoccasionallywewillcommunicatetofederal,stateandlocalofficialsourpositionsonspecificpolicyissues,webelieveitispremature to offer an official position statement on EPR legislative and regulatory proposals without first carefully examining the specifics of each individual law or regulation and how it would affect our customers andourbusiness.
Thisproposalcoversthesamesubjectmatterasonesubmittedtoavoteatthelasttwoyears’annualmeetingsandwassoundlydefeatedbyshareholders.
SHAREHOLDERPROPOSALS–2015ANNUALMEETING.ShareholderproposalsintendedforinclusioninourproxymaterialrelatingtoKroger’sannualmeetinginJune2015shouldbeaddressedtotheSecretaryofKroger andmustbe receivedatourexecutiveofficesnot later than January14,2015.Theseproposalsmust complywithRule 14a-8 and the SEC’s proxy rules. TheCompany’s Regulations contain an advancenotice of shareholder business and nominations requirement,which generally prescribes the proceduresthat a shareholder of the Company must follow if the shareholder intends, at an annual meeting, to nominate apersonforelectiontotheCompany’sBoardofDirectorsortoproposeotherbusinesstobeconsideredbyshareholders. These procedures include, among other things, that the shareholder give timely notice to the SecretaryoftheCompanyofthenominationorotherproposedbusiness,thatthenoticecontainspecifiedinformation,andthattheshareholdercomplywithcertainotherrequirements.Generally,inthecaseofan
60
annualmeeting,ashareholder’snotice inordertobetimelymustbedeliveredinwritingtotheSecretaryoftheCompany,atitsprincipalexecutiveoffice,notlater45calendardayspriortothedateonwhichtheCompany’s proxy statement for the prior year’s annual meeting of shareholders was mailed to shareholders. If a shareholder’s nomination or proposal is not in compliance with the procedures set forth in the Regulations, theCompanymaydisregardsuchnominationorproposal.Accordingly,ifashareholderintends,atthe2015annualmeeting,tonominateapersonforelectiontotheBoardofDirectorsortoproposeotherbusiness,theshareholdermustdeliveranoticeofsuchnominationorproposaltotheCompany’sSecretarynotlaterMarch30,2015,andcomplywiththerequirementsoftheRegulations.IfashareholdersubmitsaproposaloutsideofRule14a-8fortheCompany’s2015annualmeetingofshareholderandsuchproposalisnotdeliveredwithin the time frame specified in the Regulations, the Company’s proxy may confer discretionary authority onpersonsbeingappointedasproxiesonbehalfoftheCompanytovoteonsuchproposal.Noticesshouldbeaddressedinwritingto:Secretary,TheKrogerCo.,1014VineStreet,Cincinnati,Ohio45202-1100.
AttachedtothisProxyStatementisKroger’s2013AnnualReportwhichincludesabriefdescriptionofKroger’sbusiness, including thegeneral scopeandnature thereofduring2013, togetherwith theauditedfinancial information contained in our 2013 report to the SEC on Form10-K.A copy of that report is available to shareholders on request without charge by writing to: Todd A. Foley, Treasurer, The Kroger Co., 1014 Vine Street, Cincinnati, Ohio 45202-1100 or by calling 1-513-762-1220.OurSECfilingsareavailabletothepublicfromtheSEC’swebsiteatwww.sec.gov.
h o u S e h o l d i N g o F P r o x y M a t e r i a l S
We have adopted a procedure approved by the SEC called “householding.” Under this procedure,shareholders of record who have the same address and last name will receive only one copy of the Notice ofInternetAvailabilityofProxyMaterials(orproxymaterialsinthecaseofshareholderswhoreceivepapercopiesof suchmaterials)unlessoneormoreof theseshareholdersnotifiesus that theywish tocontinuereceivingindividualcopies.Thisprocedurewillreduceourprintingcostsandpostagefees.Householdingwillnotinanywayaffectdividendcheckmailings.
Ifyouareeligibleforhouseholding,butyouandothershareholdersofrecordwithwhomyoushareanaddresscurrentlyreceivemultiplecopiesofourNoticeofInternetAvailabilityofProxyMaterials(orproxymaterialsinthecaseofshareholderswhoreceivepapercopiesofsuchmaterials),orifyouholdinmorethanone account, and in either case you wish to receive only a single copy for your household or if you prefer toreceiveseparatecopiesofourdocuments inthefuture,pleasecontactyourbankorbroker,orcontactKroger’sSecretaryat1014VineStreet,Cincinnati,Ohio45202-1100orviatelephoneat513-762-4000.
Beneficialshareholderscanrequestinformationabouthouseholdingfromtheirbanks,brokersorotherholders of record.
Themanagementknowsofnoothermattersthataretobepresentedatthemeetingbut,ifanyshouldbepresented,theProxyCommitteeexpectstovotethereonaccordingtoitsbestjudgment.
ByorderoftheBoardofDirectors,
PaulW.Heldman,Secretary
61
APPENDIX 1
THE KROGER CO. 2014 LONG-TERM INCENTIVE AND CASH BONUS PLAN
1. Definitions
In this Plan the following definitions will apply:
1.1 “Agreement” means a written instrument implementing a grant of an Option, Right orPerformanceUnit,anawardofRestrictedStockorIncentiveShares,orsettingforththetermsofaCashBonus.
1.2 “Board”meanstheBoardofDirectorsoftheCompany.
1.3 “CashBonus”meansanannualor long-termbonusawarded toaparticipantunder theCashBonusProgram anddeterminedby theCommitteebasedonperformancemeasured against PerformanceGoalsestablishedbytheCommittee.
1.4 “CashBonusProgram”meansthatportionofthePlanunderwhichaparticipantisawardedaCashBonus.
1.5 “Code”meanstheInternalRevenueCodeof1986,asamended.
1.6 “Committee”meansthecommitteeappointedtoadministereachoftheProgramsunderthePlan.ForpurposesoftheInsiderProgramandtheCashBonusProgramtheCommitteewillbeacommitteeoftheBoardmeetingthestandardsofRule16b-3(d)(1)undertheExchangeAct,oranysimilarsuccessorrule,appointedbytheBoardtoadministertheInsiderProgramandtheCashBonusProgram,whichinitiallywillbecomposedofthosemembersoftheCompensationCommitteeoftheBoardwhoqualifyas“outsidedirectors”underSection162(m)oftheCode.ForpurposesoftheNon-InsiderProgram,theCommitteewillbetheStockOption Committee.
1.7 “Company”meansTHEKROGERCO.
1.8 “DateofExercise”meansthedateonwhichtheCompanyreceivesnoticeoftheexerciseofanOption,RightorPerformanceUnitinaccordancewiththetermsofArticle9.
1.9 “DateofGrant”meansthedateonwhichanOption,RightorPerformanceUnitisgrantedorRestrictedStockorIncentiveSharesareawardedbytheCommittee.
1.10 “Director”meansanon-EmployeememberoftheBoardoftheCompany.
1.11 “Employee”meansanyperson,excludingDirectors, towhomawardsorgrantscanbemadepursuant to the securities lawsof theUnited State and towhom such awards or grants aremadeby theCommittee.
1.12 “ExchangeAct”meanstheSecuritiesExchangeActof1934,asamended.
1.13 “FairMarket Value” of a Sharemeans the amount equal to the fairmarket value of a Sharedeterminedpursuant to a reasonablemethod adoptedby theCommittee in good faith for suchpurpose.Unlessotherwiseprovided in anAgreement to thecontrary, theFairMarketValueof a Sharewillbe theclosingpriceonthedateofdeterminationontheNewYorkStockExchange--CompositeTransactions,orifnosales are made on such date, on the most recent prior date for which sales are reported.
1.14 “Grantee” means an Employee or a Director to whom Restricted Stock has been awardedpursuanttoArticle11ortowhomIncentiveShareshavebeenawardedpursuanttoArticle12.
1.15 “IncentiveShare”meansaShareawardedpursuanttoArticle12.
1.16 “Insider”meansanofficeroftheCompanysubjecttoSection16(a)oftheExchangeAct.
1.17 “InsiderProgram”meansthatportionofthePlanunderwhichgrantsorawardsaremadetoInsiders and Directors.
62
1.18 “Non-InsiderProgram”meansthatportionofthePlanunderwhichgrantsorawardsaremadeto Employees, excluding Insiders.
1.19 “Option”meansanonstatutorystockoptiongrantedunderthePlanthatdoesnotqualifyasanincentivestockoptionunderSection422oftheCode.
1.20 “OptionPeriod”meanstheperiodduringwhichanOptionmaybeexercised.
1.21 “OptionPrice”meansthepriceperShareatwhichanOptionmaybeexercised.TheOptionPricewillbedeterminedbytheCommittee,butinnoeventwilltheOptionPriceofanOptionbelessthantheFairMarketValueperSharedeterminedasoftheDateofGrant.
1.22 “Optionee”meansanEmployeeorDirectortowhomanOption,RightorPerformanceUnithasbeengranted.
1.23 “Performance Goals” means performance goals established by the Committee that may bebasedon: (i) earningsor earningsper shareofKroger, aunitofKroger, ordesignatedprojects; (ii) totalsales,identicalsales,orcomparablesalesofKroger,aunitofKroger,ordesignatedprojects;(iii)cashflow;(iv)cashflowfromoperations;(v)operatingprofitorincome;(vi)netincome;(vii)operatingmargin;(viii)netincomemargin;(ix)returnonnetassets;(x)economicvalueadded;(xi)returnontotalassets;(xii)returnoncommonequity; (xiii) returnon total or invested capital; (xiv) total shareholder return; (xv) revenue;(xvi) revenue growth; (xvii) earnings before interest, taxes, depreciation and amortization (“EBITDA”);(xviii) EBITDA growth; (xix) funds from operations per share and per share growth; (xx) cash availablefor distribution; (xxi) cash available for distribution per share and per share growth; (xxii) share priceperformanceonanabsolutebasisandrelativetoanindexofearningspershareorimprovementsinKroger’sattainmentofexpenselevels;(xxiii)reductioninoperatingcostsasapercentageofsales;(xxiv)performanceinkeycategories;(xxv)implementingorcompletionofstrategicinitiativesorcriticalprojects,and(xxvi)keycategoryperformanceasmeasuredbytheresultsofsurveysofcustomersorassociates;oranyotherobjectivegoalsestablishedbytheCommittee,andmaybeabsoluteintheirtermsormeasuredagainstorinrelationshipto other companies similarly or otherwise situated. Performance goalsmaybeparticular to an employeeorthedepartment,branch,Subsidiaryorotherdivisioninwhichheorsheworks,ormaybebasedontheperformanceoftheCompanygenerally,andmaycoversuchperiodasmaybespecifiedbytheCommittee.
1.24 “Performance Unit” means a performance unit granted under the Plan in accordance withArticle 8.
1.25 “PerformanceUnitPeriod”meanstheperiodduringwhichaPerformanceUnitisoutstanding.
1.26 “Plan”meansTHEKROGERCO.2014Long-TermIncentiveandCashBonusPlan.
1.27 “RelatedOption”meanstheOptioninconnectionwithwhichaspecifiedRightorPerformanceUnitisgranted.
1.28 “RelatedPerformanceUnit”meansthePerformanceUnitgrantedinconnectionwithaspecifiedOption.
1.29 “RelatedRight”meanstheRightgrantedinconnectionwithaspecifiedOption.
1.30 “RestrictedStock”meansSharesawardedpursuanttoArticle11.
1.31 “Right”meansastockappreciationrightgrantedunderthePlanpursuanttoArticle7.
1.32 “RightPeriod”meanstheperiodduringwhichaRightmaybeexercised.
1.33 “Share”meansanauthorizedbutunissuedcommonshare,parvalue$1.00per share,of theCompany,orareacquiredpreviouslyissuedcommonshare.
1.34 “StockOptionCommittee”meansacommitteeof threeormoremembersappointedby theChiefExecutiveOfficeroftheCompanytoadministertheNon-InsiderProgram,eachofwhomisineligibletoreceivegrantsorawardsundertheNon-InsiderProgram,andhasbeensoineligibleforatleastoneyear.
1.35 “Subsidiary”meansacorporationatleast50%ofthetotalcombinedvotingpowerofallclassesofstockofwhichisownedbytheCompany,eitherdirectlyorthroughoneormoreotherSubsidiaries.

63
2. Purpose
ThePlanisintendedtoassistinattractingandretainingEmployeesandDirectorsofoutstandingabilityand to promote the identification of their interests with those of the shareholders of the Company.
3. Administration
The Plan will be administered by the Committee. In addition to any other powers granted to theCommittee,itwillhavethefollowingpowers,subjecttotheexpressprovisionsofthePlan:
3.1 todetermineinitsdiscretiontheEmployeestowhomOptions,PerformanceUnitsorRightswillbegranted,towhomRestrictedStockandIncentiveShareswillbeawarded,andthoseEmployeeseligibletoreceiveCashBonuses;thenumberofSharestobesubjecttoeachOption,Right,PerformanceUnit,RestrictedStockor IncentiveShareaward,and the termsuponwhichOptions,RightsorPerformanceUnitsmaybeacquiredandexercisedandthetermsandconditionsofRestrictedStockandIncentiveShareawardsandCashBonuses;
3.2 todetermineallothertermsandprovisionsofeachAgreement,whichneednotbeidentical;
3.3 without limiting the generality of the foregoing, to provide in its discretion in an Agreement:
(a) for an agreement by the Optionee or Grantee to render services to the Companyora Subsidiaryuponsuch termsandconditionsasmaybe specified in theAgreement,provided that theCommitteewillnothavethepowertocommittheCompanyoranySubsidiarytoemployorotherwiseretainanyOptioneeorGrantee;
(b) forrestrictionsonthetransfer,saleorotherdispositionofSharesissuedtotheOptioneeupontheexerciseofanOption,RightorPerformanceUnit,forotherrestrictionspermittedbyArticle11withrespecttoRestrictedStockorforconditionswithrespecttotheissuanceofIncentiveShares;
(c) foranagreementbytheOptioneeorGranteetoreselltotheCompany,underspecifiedconditions,SharesissuedupontheexerciseofanOption,RightorPerformanceUnitorawardedasRestrictedStockorIncentiveShares;
(d) forthepaymentoftheOptionPriceupontheexercisebyanEmployeeorDirectorofanOptionotherwisethanincash,includingwithoutlimitationbydeliveryofCommonShares(otherthanRestrictedStock)valuedatFairMarketValueontheDateofExerciseoftheOption,oracombinationofcashandShares;and
(e) forthedeferralofreceiptofamountsthatotherwisewouldbedistributeduponexerciseofaPerformanceUnit,thetermsandconditionsofanysuchdeferralandanyinterestordividendequivalentorotherpaymentthatwillaccruewithrespecttodeferreddistributions;
3.4 toconstrueandinterprettheAgreementsandthePlan;
3.5 torequire,whetherornotprovidedforinthepertinentAgreement,ofanypersonexercisinganOption,RightorPerformanceUnitoracquiringRestrictedStockorIncentiveShares,atthetimeofsuchexercise or acquisition, themaking of any representations or agreements that the Committeemay deemnecessaryoradvisableinordertocomplywiththesecuritieslawsoftheUnitedStatesorofanystate;
3.6 toprovideforsatisfactionofanOptionee’sorGrantee’staxliabilitiesarisinginconnectionwiththePlanthrough,without limitation,retentionbytheCompanyofCommonSharesotherwise issuableontheexerciseofanOption,RightorPerformanceUnitorpursuanttoanawardofIncentiveSharesorthroughdeliveryofCommonSharestotheCompanybytheOptioneeorGranteeundersuchtermsandconditionsastheCommitteedeemsappropriate;and
3.7 to make all other determinations and take all other actions necessary or advisable for theadministration of the Plan.
AnydeterminationsoractionsmadeortakenbytheCommitteepursuanttothisArticlewillbebindingand final.
64
4. Eligibility
Options,Rights,PerformanceUnits,RestrictedStockandIncentiveSharesmaybegrantedorawardedonly toEmployeesandDirectors.CashBonusesmayonlybeawardedtoEmployees. Innoeventmayanyparticipantreceiveawardsandgrantstotalingmorethan3,750,000SharesintheaggregateunderthisPlan,andnosingleCashBonustoaparticipantmayexceed$5,000,000.
5. Shares Subject to the Plan
5.1 ThemaximumnumberofSharesthatmaybeissuedunderthePlanis25,000,000Shares.Exceptas otherwise provided in the following sentence, themaximumnumber of Shares thatmay be issued asRestrictedStock,IncentiveShares,orPerformanceUnitsunderthePlanis10,000,000Sharesintheaggregate.Notwithstandingtheforegoing,theCommitteefortheInsiderProgrammayincreasethenumberofSharesthatmaybeissuedasRestrictedStock,IncentiveShares,orPerformanceUnitstoanamountinexcessof10,000,000Shares,providedthatforeachsuchShareinexcessof10,000,000SharesthatareissuedasRestrictedStock,IncentiveShares,orPerformanceUnits,intheaggregate,thenumberofSharesthatmaybeissuedunderthePlanwillbereducedbyfourShares.InadditiontothedecisionsthatitmakesinadministeringtheInsiderProgram,annuallytheCommitteefortheInsiderProgramwillapprovethenumberofSharestobegrantedundertheNon-InsiderProgramforthatfiscalyear.
5.2 If an Option, Right or Performance Unit expires or terminates for any reason (other thanterminationbyvirtueoftheexerciseofaRelatedOption,RelatedRightoraRelatedPerformanceUnit,asthecasemaybe)withouthavingbeenfullyexercised,ifSharesofRestrictedStockareforfeitedorifIncentiveSharesarenotissuedorareforfeited,theunissuedorforfeitedSharesthathadbeensubjecttotheAgreementrelatingtheretowillbecomeavailableforthegrantofotherOptions,RightsandPerformanceUnitsorfortheawardofadditionalRestrictedStockorIncentiveShares,providedthatinthecaseofforfeitedShares,theGranteehasreceivednodividendspriortoforfeiturewithrespecttosuchShares.
6. Options
6.1 TheCommitteeisauthorizedtograntOptionstoEmployeesandDirectors.
6.2 TheOptionPeriodforOptionsgrantedtoEmployeesandDirectorswillbedeterminedbytheCommittee and specifically set forth in theAgreement.NoOptionwill be exercisablebefore sixmonthsaftertheDateofGrant(exceptthatthislimitationneednotapplyintheeventofthedeathordisabilityoftheOptioneewithinthesix-monthperiod)oraftertenyearsfromtheDateofGrant.
6.3 ThemaximumnumberofShareswithrespecttowhichOptionsmaybegrantedtoanyEmployeeorDirectorunderthisPlanduringitstermis3,750,000Shares.InnoeventwilltheOptionPriceofanOptionbelessthantheFairMarketValueofaShareatthetimeofthegrant.
6.4 Exceptinconnectionwithacorporatetransactioninvolvingthecompany(including,withoutlimitation, any stock dividend, stock split, extraordinary cash dividend, recapitalization, reorganization,merger, consolidation, split-up, spin-off, combination, or exchange of shares) or as otherwise permittedpursuanttoArticle13orArticle15,theOptionPriceofanOptionassetforthontheDateofGrantwillnotbereducedduringthetermoftheOption,norwillOptionsbecanceledinexchangeforcash,otherawards,ornewly issued Options with an Option Price that is less than the Option Price of the original Options without shareholderapproval(i.e.,Optionswillnotbe“repriced”).
6.5 AllothertermsofOptionsgrantedunderthePlanwillbedeterminedbytheCommitteeinitssole discretion.
7. Rights
7.1 TheCommitteeisherebyauthorizedtograntRightstoEmployeesandDirectors.
7.2 ARightmaybegrantedunderthePlan:
(a) inconnectionwith,andatthesametimeas,thegrantofanOptionunderthePlan;or
(b) independentlyofanyOptiongrantedunderthePlan.
65
ARightgrantedunderclause(a)oftheprecedingsentenceisaRelatedRight.ARelatedRightmay,intheCommittee’sdiscretion,applytoalloraportionoftheSharessubjecttotheRelatedOption.
7.3 ARightmaybeexercisedinwholeorinpartasprovidedintheAgreement,and,subjecttotheprovisions of the Agreement, entitles its Optionee to receive, without any payment to the Company (other thanrequiredincometaxwithholdingamounts),eithercashorthatnumberofShares(equaltothehighestwholenumberofShares),oracombinationthereof,inanamountorhavingaFairMarketValuedeterminedasoftheDateofExercisenottoexceedthenumberofSharessubjecttotheportionoftheRightexercisedmultipliedbyanamountequaltotheexcessof(i)theFairMarketValueofaShareontheDateofExerciseoftheRightover(ii)either(A)theFairMarketValueofaShareontheDateofGrantoftheRightifitisnotaRelatedRight,or(B)theOptionPriceasprovidedintheRelatedOptioniftheRightisaRelatedRight.
7.4 The Right Period will be determined by the Committee and specifically set forth in theAgreement,provided,however--
(a) aRightmaynotbeexercisedbeforetheexpirationofsixmonthsfromtheDateofGrant(exceptthatthislimitationneednotapplyintheeventofthedeathordisabilityoftheOptioneewithinthesix-monthperiod);
(b) aRightwillexpirenolaterthantheearlierof(i)tenyearsfromtheDateofGrant,or(ii)inthecaseofaRelatedRight,theexpirationoftheRelatedOption;and
(c) aRightmaybeexercisedonlywhentheFairMarketValueofaShareexceedseither(i)theFairMarketValueofaShareontheDateofGrantoftheRightifitisnotaRelatedRight,or(ii)theOptionPrice as provided in the Related Option if the Right is a Related Right.
7.5 Theexercise,inwholeorinpart,ofaRelatedRightwillcauseareductioninthenumberofSharessubjecttotheRelatedOptionequaltothenumberofShareswithrespecttowhichtheRelatedRightisexercised.Similarly,theexercise,inwholeorinpart,ofaRelatedOptionwillcauseareductioninthenumberofSharessubjecttotheRelatedRightequaltothenumberofShareswithrespecttowhichtheRelatedOptionis exercised.
7.6 RightsgrantedunderthePlan,totheextentdeterminedbytheCommittee,willcomplywiththerequirementsofRule16b-3undertheExchangeActduringthetermofthisPlan.ShouldanyadditionalprovisionsbenecessaryforthisArticle7tocomplywiththerequirementsofRule16b-3oranyotherrulesorregulations,theBoardmayamendthisPlantodelete,addtoormodifytheprovisionsofthePlanaccordingly,subjecttotheprovisionsofArticle14, ifapplicable.TheCompanyintendstocomply, ifandtotheextentapplicable,withtherequirementsofRule16b-3;however,theCompany’sfailureforanyreasonwhatsoeverto complywith such requirementswill not impose any liabilityon theCompany to anyOptioneeor anyother party.
7.7 To theextent requiredbyRule16b-3under theExchangeActorotherwiseprovided in theAgreement, the Committee will have sole discretion to consent to or disapprove the election of any Optionee to receive cash in full or partial settlement of a Right. In cases where an election of settlement in cash must beconsentedtobytheCommittee,theCommitteemayconsentto,ordisapprove,suchelectionatanytimeaftersuchelection,orwithinsuchperiodfortakingactionasisspecifiedintheelection,andfailuretogiveconsentwillbedisapproval.ConsentmaybegiveninwholeorastoaportionoftheRightsurrenderedbytheOptionee.Iftheelectiontoreceivecashisdisapprovedinwholeorinpart,theRightwillbedeemedtohavebeenexercisedforShares,or,ifsospecifiedinthenoticeofexerciseandelection,nottohavebeenexercisedto the extent the election to receive cash is disapproved.
7.8 ThemaximumnumberofShareswithrespecttowhichRightsmaybegrantedtoanyEmployeeorDirectorunderthisPlanduringitstermis3,750,000Shares.
7.9 Exceptinconnectionwithacorporatetransactioninvolvingthecompany(including,withoutlimitation, any stock dividend, stock split, extraordinary cash dividend, recapitalization, reorganization,merger, consolidation, split-up, spin-off, combination, or exchange of shares) or as otherwise permittedpursuanttoArticle13orArticle15,theexercisepriceofaRightassetforthontheDateofGrantwillnot

66
bereducedduringthetermoftheRight,norwillRightsbecanceledinexchangeforcash,otherawards,ornewly issued Rights with an exercise price that is less than the exercise price of the original Rights without shareholderapproval(i.e.,Rightswillnotbe“repriced”).
8. Performance Units
8.1 TheCommitteeisherebyauthorizedtograntPerformanceUnitstoEmployeesandDirectors.
8.2 PerformanceUnitsmaybegrantedunderthePlan:
(a) inconnectionwith,andatthesametimeas,thegrantofanOptionunderthePlan;or
(b) independentlyofanyOptiongrantedunderthePlan.
APerformanceUnit grantedunder clause (a)of thepreceding sentence is aRelatedPerformanceUnit.ARelatedPerformanceUnitmay,intheCommittee’sdiscretion,applytoalloraportionofthesharessubjecttothe Related Option.
8.3 APerformanceUnitmaybeexercised inwholeor inpart,or automaticallymaybedeemedexercised upon satisfaction of the PerformanceGoals, as provided in theAgreement, and, subject to theprovisions of the Agreement, entitles its Optionee to receive, without any payment to the Company (other thanrequired incometaxwithholdingamounts),cash,SharesoracombinationofcashandShares,baseduponthedegreetowhichPerformanceGoalsestablishedbytheCommitteeandspecifiedintheAgreementhavebeenachieved.
8.4 ThePerformanceUnitPeriodwillbedeterminedbytheCommitteeandspecificallysetforthintheAgreement,provided,however--
(a) aPerformanceUnitmaynotbeexercisedbeforetheexpirationofsixmonthsfromtheDateofGrant(exceptthatthislimitationneednotapplyintheeventofthedeathordisabilityoftheOptioneewithinthesix-monthperiod);and
(b) aPerformanceUnitwillexpirenolaterthantheearlierof(i)tenyearsfromtheDateofGrant,or(ii)inthecaseofaRelatedPerformanceUnit,theexpirationoftheRelatedOption.
8.5 EachAgreement granting PerformanceUnitswill specify the number of PerformanceUnitsgranted;provided,however,thatthemaximumnumberofRelatedPerformanceUnitsmaynotexceedthemaximumnumberofSharessubjecttotheRelatedOption.
8.6 Theexercise,inwholeorinpart,ofRelatedPerformanceUnitswillcauseareductioninthenumberofSharessubjecttotheRelatedOptionandthenumberofPerformanceUnitsinaccordancewiththetermsoftheAgreement.Similarly,theexercise,inwholeorinpart,ofaRelatedOption,willcauseareductioninthenumberofSharessubjecttotheRelatedPerformanceUnitequaltothenumberofShareswithrespectto which the Related Option is exercised.
8.7 PerformanceUnitsgrantedunderthePlan,totheextentdeterminedbytheCommittee,willcomplywiththerequirementsofRule16b-3undertheExchangeActduringthetermofthisPlan.ShouldanyadditionalprovisionsbenecessaryforthisArticle8tocomplywiththerequirementsofRule16b-3oranyotherapplicableruleorregulation,theBoardmayamendthisPlantodelete,addtoormodifytheprovisionsofthePlanaccordingly,subjecttotheprovisionsofArticle14,ifapplicable.TheCompanyintendstocomply,ifandtotheextentapplicable,withtherequirementsofRule16b-3;however,theCompany’sfailureforanyreasonwhatsoevertocomplywithsuchrequirementswillnotimposeanyliabilityontheCompanytoanyOptionee or any other party.
8.8 To theextent requiredbyRule16b-3under theExchangeActorotherwiseprovided in theAgreement, the Committee will have sole discretion to consent to or disapprove the election of any Optionee toreceivecashinfullorpartialsettlementofaPerformanceUnit.IncaseswhereanelectionofsettlementincashmustbeconsentedtobytheCommittee,theCommitteemayconsentto,ordisapprove,suchelectionatanytimeaftersuchelection,orwithinsuchperiodfortakingactionasisspecifiedintheelection,andfailuretogiveconsentwillbedisapproval.ConsentmaybegiveninwholeorastoaportionofthePerformance
67
Unit surrenderedby theOptionee. If theelection to receivecash isdisapproved inwholeor inpart, thePerformanceUnitwillbedeemedtohavebeenexercisedforShares,or,ifsospecifiedinthenoticeofexerciseandelection,nottohavebeenexercisedtotheextenttheelectiontoreceivecashisdisapproved.
8.9 ThemaximumnumberofSharesthatmaybeissuedtoanyEmployeeorDirectorpursuanttotheexerciseofPerformanceUnitsmaynotexceed3,750,000Shares.Forpurposesoftheprecedingsentence,anyPerformanceUnitspaidintheformofcashwillbedeemedtohavebeenpaidinShares,withthenumberofSharesbeingdeemedpaidequaltotheamountofcashpaidtotheEmployeeorDirectordividedbytheFairMarketValueofaShareonthedateofpayment.
9. Exercise
AnOption,RightorPerformanceUnit,subjecttotheprovisionsoftheAgreementunderwhichitwasgranted,maybeexercisedinwholeorinpartbythedeliverytotheCompanyofwrittennoticeoftheexercise,insuchformastheCommitteemayprescribe,accompanied,inthecaseofanOption,by(i)fullpaymentfortheShareswithrespecttowhichtheOptionisexercised,or(ii)irrevocableinstructionstoabrokerselectedbytheCommitteetoconsummate“cashless”exercisestodeliverpromptlytotheCompanycashequaltofullpaymentfortheSharesforwhichtheOptionisexercised.
10. Non-transferability
Options,Rights,PerformanceUnitsandIncentiveSharesgrantedorawardedunderthePlanwillnotbe transferable otherwise than bywill or the laws of descent and distribution, and anOption, Right orPerformanceUnitmaybeexercisedduringhisorherlifetimeonlybytheOptioneeor,intheeventofhisor her legal disability, by his or her legal representative. A Related Right or Related PerformanceUnit istransferableonlywhentheRelatedOptionistransferableandonlywiththeRelatedOptionandunderthesame conditions.
11. Restricted Stock Awards
11.1 TheCommittee is hereby authorized to award Shares of Restricted Stock to Employees andDirectors.
11.2 RestrictedStockawardsunderthePlanwillconsistofSharesthatarerestrictedagainsttransfer,subject to forfeiture, and subject to suchother termsandconditions intended to further thepurposesofthePlanasmaybedeterminedbytheCommittee.Thetermsandconditionsmayprovide,inthediscretionof theCommittee, for thevestingof suchawards tobecontingentupontheachievementofoneormorePerformanceGoals.
11.3 RestrictedStockawardswillbeevidencedbyAgreementscontainingprovisionssettingforththe terms and conditions governing such awards. Each such agreement will contain the following:
(a) prohibitions against the sale, assignment, transfer, exchange, pledge, hypothecation,orotherencumbranceof(i)theSharesawardedasRestrictedStockunderthePlan,(ii)therighttovotetheShares,or(iii)therighttoreceivedividendsthereonineachcaseduringtherestrictionperiodapplicabletotheShares;provided,however,thattheGranteewillhavealltheotherrightsofashareholderincluding,butnotlimitedto,therighttoreceivedividendsandtherighttovotetheShares;
(b) atleastoneterm,conditionorrestrictionconstitutinga“substantialriskofforfeiture”asdefinedinSection83(c)oftheCode;
(c) suchother terms,conditionsandrestrictionsas theCommittee in itsdiscretionmayspecify(including,withoutlimitation,provisionscreatingadditionalsubstantialrisksofforfeiture);
(d) arequirementthateachcertificateorotherevidenceofownershiprepresentingSharesofRestrictedStockmustbedepositedwiththeCompany,oritsdesignee,andwillbearthefollowinglegend:
“This certificate or other evidence of ownership and the shares of stockrepresentedherebyaresubjecttothetermsandconditions(includingtherisksof forfeiture and restrictions against transfer) contained in THE KROGER CO.

68
2014Long-TermIncentiveandCashBonusPlanandanAgreemententeredintobetweentheregisteredownerandTheKrogerCo.ReleasefromsuchtermsandconditionswillbemadeonlyinaccordancewiththeprovisionsofthePlanandtheAgreement,acopyofeachofwhichisonfileintheofficeoftheSecretaryofThe Kroger Co.
(e) theapplicableperiodorperiodsofanyterms,conditionsorrestrictionsapplicabletotheRestrictedStock,provided,however,thattheCommitteeinitsdiscretionmayacceleratetheexpirationoftheapplicablerestrictionperiodwithrespecttoanypartoralloftheSharesawardedtoaGrantee;and
(f) thetermsandconditionsuponwhichanyrestrictionsuponSharesofRestrictedStockawardedunder thePlanwill lapseandnewcertificates freeof the foregoing legendwillbe issued to theGranteeorhisorherlegalrepresentative.
11.4 TheCommitteemay include inanAgreementarequirementthat intheeventofaGrantee’sterminationofemployment forany reasonprior to the lapseof restrictions,all SharesofRestrictedStockwillbe forfeitedby theGrantee to theCompanywithoutpaymentof anyconsiderationby theCompany,andneither theGranteenoranysuccessors,heirs,assignsorpersonal representativesof theGranteewillthereafterhaveanyfurtherrightsorinterestintheSharesorcertificates.
11.5 ThemaximumnumberofSharesofRestrictedStockthatmaybeawardedtoanyEmployeeorDirectorunderthisPlanduringitstermis3,750,000Shares.
12. Incentive Share Awards
12.1 TheCommitteeisherebyauthorizedtoawardIncentiveSharestoEmployeesandDirectors.
12.2 IncentiveShareswillbeSharesthatareissuedatsuchtimes,subjecttoachievementofsuchPerformanceGoals or other goals, orwithout condition, and on such other terms and conditions as theCommittee deems appropriate and specify in the Agreement relating thereto.
12.3 ThemaximumnumberofSharesofIncentiveSharesthatmaybeawardedtoanyEmployeeorDirectorunderthisPlanduringitstermis3,750,000Shares.
13. Capital Adjustments
The number and class of Shares subject to each outstandingOption, Right or Performance Unit orRestrictedStockorIncentiveShareaward,theOptionPriceandtheaggregatenumberandclassofSharesforwhichgrantsorawardsthereaftermaybemadewillbesubjecttosuchadjustment,ifany,astheCommitteeinitssolediscretiondeemsappropriatetoreflectsucheventsasstockdividends,stocksplits,adoptionofstockrightsplans,recapitalizations,mergers,consolidationsorreorganizationsoforbytheCompany.
14. Termination or Amendment
TheBoardmayamendorterminatethisPlaninanyrespectatanytime.Boardapprovalmustbe accompanied by (i) shareholder approval in those cases in which amendment requires shareholderapprovalunderapplicable laworregulationsortherequirementsoftheprincipalexchangeor interdealerquotationsystemonwhichtheSharesarelistedorquoted,and(ii)affectedOptioneeorGranteeapprovalif the amendment or termination would adversely affect the holder’s rights under any outstanding grants or awards.TheCashBonusProgrammaybewhollyorpartiallyamendedorotherwisemodified,suspendedorterminatedatanytimeorfromtimetotimebytheCommitteeortheBoard.TotheextentrequiredbySection162(m)oftheInternalRevenueCodewithrespecttobonusawardsthattheCommitteedeterminesshouldqualifyasperformance-basedcompensationasdescribedinSection162(m)(4)(C),noactionmaymodifytheperformancecriteriaorbonuspotentialsafterthecommencementofthemeasurementperiodwithrespecttowhichsuchbonusawardsrelate.

69
15. Modification, Extension and Renewal of Options, Rights, Performance Units, Restricted Stock and Incentive Shares
SubjecttothetermsandconditionsandwithinthelimitationsofthePlan,theCommitteemaymodify,extendorrenewoutstandingOptions,RightsandPerformanceUnits,oracceptthesurrenderofoutstandingoptions,rightsandperformanceunits(to theextentnot theretoforeexercised)grantedunderthePlanorunderanyotherplanoftheCompany,aSubsidiaryoracompanyorsimilarentityacquiredbytheCompanyoraSubsidiary,andauthorizethegrantingofnewOptions,RightsandPerformanceUnitspursuanttothePlaninsubstitutiontherefor(totheextentnottheretoforeexercised),andthesubstitutedOptions,RightsandPerformanceUnitsmayspecifyalongertermthanthesurrenderedoptions,rightsandperformanceunitsormayhaveanyotherprovisionsthatareauthorizedbythePlan;providedthattheexercisepricemaynotbelessthanthatofthesurrenderedoption,rightsandperformanceunits.Subjecttothetermsandconditionsand within the limitations of the Plan, the Committee may modify the terms of any outstanding Agreement providing forawardsofRestrictedStockor IncentiveShares.Notwithstanding the foregoing,however,nomodificationofanOption,RightorPerformanceUnitgrantedunderthePlan,oranawardofRestrictedStockorIncentiveShares,will,withouttheconsentoftheOptioneeorGrantee,alterorimpairanyoftheOptionee’sorGrantee’srightsorobligations.
16. Cash Bonuses
TwotypesofbonusescanbeawardedundertheCashBonusProgram;anannualbonusawardforeachfiscalyear,andalong-termbonusawardformeasurementperiodsinexcessofoneyear.BonuspaymentsarebasedontheCompany’sperformancemeasuredagainstPerformanceGoalsestablishedbytheCommittee.TheCommitteeestablishesabonus“potential”foreachbonuspayableundertheCashBonusProgramforeachparticipant,basedontheparticipant’slevelwithintheCompany,andactualpayoutscanexceedthatamountwhentheCompany’sperformanceexceedsthepre-establishedthresholds. Initially thePerformanceGoalsforannualbonuseswillincludethefollowingcomponents:(i)EBITDA;(ii)identicalsales;(iii)achievementofstrategicinitiatives,and(iv)achievementofsupermarketfuelcentergoalsforEBITDA,gallonssold,andnumber of fuel centers. Initially the PerformanceGoals for long-termbonuseswill include the followingcomponents:(i)performanceinfourkeycategoriesintheCompany’sstrategicplan,(ii)reductioninoperatingcostsasapercentageofsales,(iii)performanceincategoriesdesignedtomeasureassociateengagement,and(iv).Nosinglecashbonustoaparticipantmayexceed$5,000,000.
17. Effectiveness of the Plan
The Plan and any amendments requiring shareholder approval pursuant to Article 14 are subject toapprovalbyvoteoftheshareholdersoftheCompanywithin12monthsaftertheiradoptionbytheBoard.Subjecttothatapproval, thePlaniseffectiveuponapprovalbytheshareholdersandanyamendmentsareeffectiveonthedateonwhichtheyareadoptedbytheBoard.Options,Rights,PerformanceUnits,RestrictedStockandIncentiveSharesmaybegrantedorawardedpriortoshareholderapprovalofthePlanoramendments,buteachsuchOption,Right,PerformanceUnit,RestrictedStockorIncentiveSharegrantorawardwillbesubjecttotheapprovalofthePlanoramendmentsbytheshareholders.ThedateonwhichanyOption,Right,PerformanceUnit,RestrictedStockorIncentiveSharesgrantedorawardedpriortoshareholderapprovalofthePlanoramendmentisgrantedorawardedwillbetheDateofGrantforallpurposesasiftheOption,Right,PerformanceUnit,RestrictedStockorIncentiveShareshadnotbeensubjecttoapproval.NoOption,RightorPerformanceUnitmaybeexercisedpriortosuchshareholderapproval,andanyRestrictedStockorIncentiveSharesawardedwillbeforfeitedifsuchshareholderapprovalisnotobtained.
18. Term of the Plan
UnlesssoonerterminatedbytheBoardpursuanttoArticle14,thePlanwillterminateonthedatetenyearsafteritsadoptionbytheBoard,andnoOptions,Rights,PerformanceUnits,RestrictedStockorIncentiveSharesmaybegrantedorawardedaftertermination.TheterminationwillnotaffectthevalidityofanyOption,Right,PerformanceUnit,RestrictedStockorIncentiveSharesoutstandingonthedateoftermination.

70
19. Indemnification of Committee
InadditiontosuchotherrightsofindemnificationastheymayhaveasDirectorsorasmembersoftheCommittee, themembers of theCommitteewill be indemnified by theCompany against the reasonableexpenses,includingattorneys’fees,actuallyandreasonablyincurredinconnectionwiththedefenseofanyaction,suitorproceeding,orinconnectionwithanyappealtherein,towhichtheyoranyofthemmaybeapartybyreasonofanyactiontakenorfailuretoactunderorinconnectionwiththePlanoranygrantorawardhereunder,andagainstallamountsreasonablypaidbytheminsettlementthereoforpaidbytheminsatisfactionofajudgmentinanysuchaction,suitorproceeding,ifsuchmembersactedingoodfaithandinamannerthattheybelievedtobein,andnotopposedto,thebestinterestsoftheCompany.
20. General Provisions
20.1 The establishment of the Planwill not confer upon any Employee or Director any legal orequitable right against the Company, any Subsidiary or the Committee, except as expressly provided inthe Plan.
20.2 The Plan does not constitute inducement or consideration for the employment of any Employee ortheserviceofanyDirector,norisitacontractofemploymentbetweentheCompanyoranySubsidiaryandany Employee or Director. Participation in the Plan, or the receipt of a grant or award hereunder, will not give anEmployeeorDirectoranyrighttoberetainedintheserviceoftheCompanyoranySubsidiary.
20.3 TheCompanyanditsSubsidiariesmayassumeoptions,warrants,orrightstopurchasestockissuedorgrantedbyothercorporationswhosestockorassetsareacquiredbytheCompanyoritsSubsidiaries,orthatismergedintoorconsolidatedwiththeCompany.AssumedoptionswillnotbecountedtowardthelimitspecifiedinSection6.3unlesstheCommitteedeterminesthatapplicationofthelimitisnecessaryforthegrantsofOptionstoqualifyas“performance-basedcompensation”underSection162(m)oftheCode.NeithertheadoptionofthisPlan,noritssubmissiontotheshareholders,maybetakentoimposeanylimitationsonthepowersoftheCompanyoritsaffiliatestoissue,grant,orassumeoptions,warrants,rights,orrestrictedstock,otherwisethanunderthisPlan,ortoadoptotherlong-termincentiveplansortoimposeanyrequirementofshareholder approval upon the same.
20.4 The interests of any Employee or Director under the Plan are not subject to the claims ofcreditorsandmaynot,inanyway,beassigned,alienatedorencumberedexceptasprovidedinArticle10.
20.5 ThePlanwillbegoverned,construedandadministeredinaccordancewiththelawsofOhio.

2 0 1 3 a N N u a l r e P o r t

A-1
F i N a N c i a l r e P o r t 2 0 1 3
M a N a g e M e N t ’ S r e S P o N S i B i l i t y F o r F i N a N c i a l r e P o r t i N g
The management of The Kroger Co. has the responsibility for preparing the accompanying financial statements and for their integrity and objectivity. The statements were prepared in accordance with generally accepted accounting principles applied on a consistent basis and are not misstated due to material error or fraud. The financial statements include amounts that are based on management’s best estimates and judgments. Management also prepared the other information in the report and is responsible for its accuracy and consistency with the financial statements.
The Company’s financial statements have been audited by PricewaterhouseCoopers LLP, an independent registered public accounting firm, whose selection has been approved by the shareholders. Management has made available to PricewaterhouseCoopers LLP all of the Company’s financial records and related data, as well as the minutes of the shareholders’ and directors’ meetings. Furthermore, management believes that all representations made to PricewaterhouseCoopers LLP during its audit were valid and appropriate.
Management also recognizes its responsibility for fostering a strong ethical climate so that the Company’s affairs are conducted according to the highest standards of personal and corporate conduct. This responsibility is characterized and reflected in The Kroger Co. Policy on Business Ethics, which is publicized throughout the Company and available on the Company’s website at ir.kroger.com. The Kroger Co. Policy on Business Ethics addresses, among other things, the necessity of ensuring open communication within the Company; potential conflicts of interests; compliance with all domestic and foreign laws, including those related to financial disclosure; and the confidentiality of proprietary information. The Company maintains a systematic program to assess compliance with these policies.
M a N a g e M e N t ’ S r e P o r t o N i N t e r N a l c o N t r o l o v e r F i N a N c i a l r e P o r t i N g
The management of the Company is responsible for establishing and maintaining adequate internal control over financial reporting for the Company. With the participation of the Chief Executive Officer and the Chief Financial Officer, our management conducted an evaluation of the effectiveness of our internal control over financial reporting based on the framework and criteria established in Internal Control – Integrated Framework, issued by the Committee of Sponsoring Organizations of the Treadway Commission. Based on this evaluation, our management has concluded that the Company’s internal control over financial reporting was effective as of February 1, 2014.
W. Rodney McMullen J. Michael SchlotmanChief Executive Officer Senior Vice President and
Chief Financial Officer
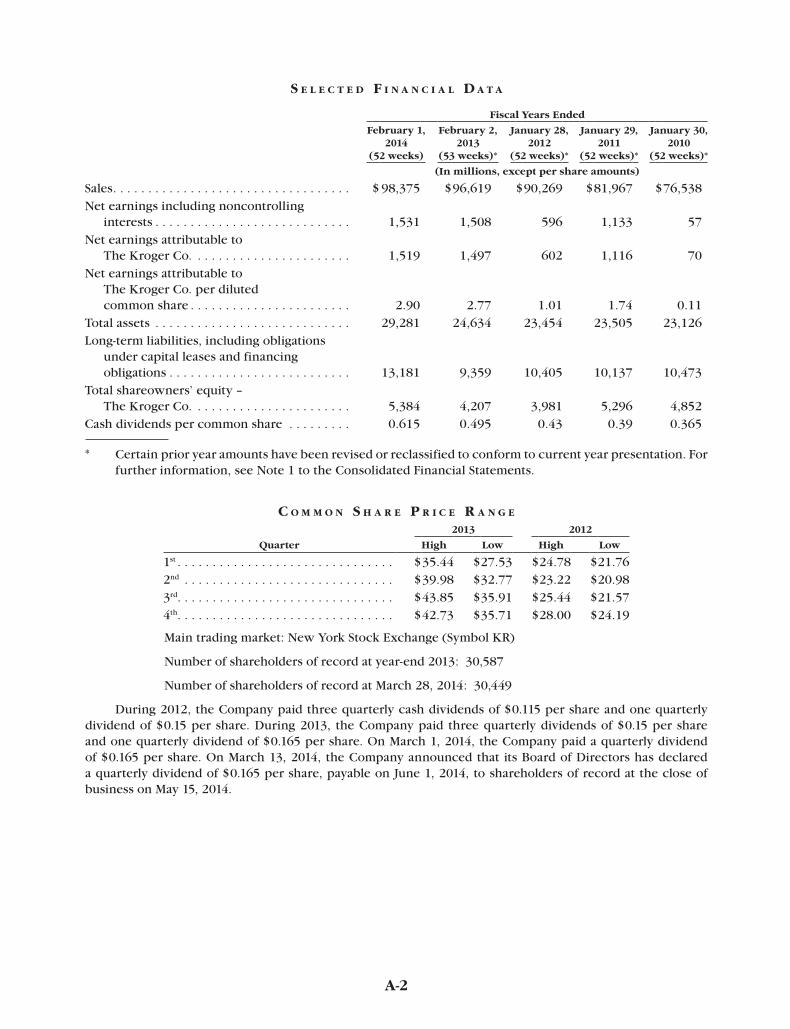
A-2
S e l e c t e d F i N a N c i a l d a t a
Fiscal Years Ended
February 1,2014
(52 weeks)
February 2,2013
(53 weeks)*
January 28,2012
(52 weeks)*
January 29,2011
(52 weeks)*
January 30,2010
(52 weeks)*
(In millions, except per share amounts)
Sales . . . . . . . . . . . . . . . . . . . . . . . . . . . . . . . . . . $ 98,375 $96,619 $90,269 $81,967 $76,538Net earnings including noncontrolling
interests . . . . . . . . . . . . . . . . . . . . . . . . . . . . 1,531 1,508 596 1,133 57Net earnings attributable to
The Kroger Co. . . . . . . . . . . . . . . . . . . . . . . 1,519 1,497 602 1,116 70Net earnings attributable to
The Kroger Co. per diluted common share . . . . . . . . . . . . . . . . . . . . . . . 2.90 2.77 1.01 1.74 0.11
Total assets . . . . . . . . . . . . . . . . . . . . . . . . . . . . 29,281 24,634 23,454 23,505 23,126Long-term liabilities, including obligations
under capital leases and financing obligations . . . . . . . . . . . . . . . . . . . . . . . . . . 13,181 9,359 10,405 10,137 10,473
Total shareowners’ equity – The Kroger Co. . . . . . . . . . . . . . . . . . . . . . . 5,384 4,207 3,981 5,296 4,852
Cash dividends per common share . . . . . . . . . 0.615 0.495 0.43 0.39 0.365
* Certain prior year amounts have been revised or reclassified to conform to current year presentation. For further information, see Note 1 to the Consolidated Financial Statements.
c o M M o N S h a r e P r i c e r a N g e
2013 2012
Quarter High Low High Low
1st . . . . . . . . . . . . . . . . . . . . . . . . . . . . . . . $35.44 $27.53 $24.78 $21.762nd . . . . . . . . . . . . . . . . . . . . . . . . . . . . . . $39.98 $32.77 $23.22 $20.983rd. . . . . . . . . . . . . . . . . . . . . . . . . . . . . . . $43.85 $35.91 $25.44 $21.574th . . . . . . . . . . . . . . . . . . . . . . . . . . . . . . . $42.73 $35.71 $28.00 $24.19
Main trading market: New York Stock Exchange (Symbol KR)
Number of shareholders of record at year-end 2013: 30,587
Number of shareholders of record at March 28, 2014: 30,449
During 2012, the Company paid three quarterly cash dividends of $0.115 per share and one quarterly dividend of $0.15 per share. During 2013, the Company paid three quarterly dividends of $0.15 per share and one quarterly dividend of $0.165 per share. On March 1, 2014, the Company paid a quarterly dividend of $0.165 per share. On March 13, 2014, the Company announced that its Board of Directors has declared a quarterly dividend of $0.165 per share, payable on June 1, 2014, to shareholders of record at the close of business on May 15, 2014.
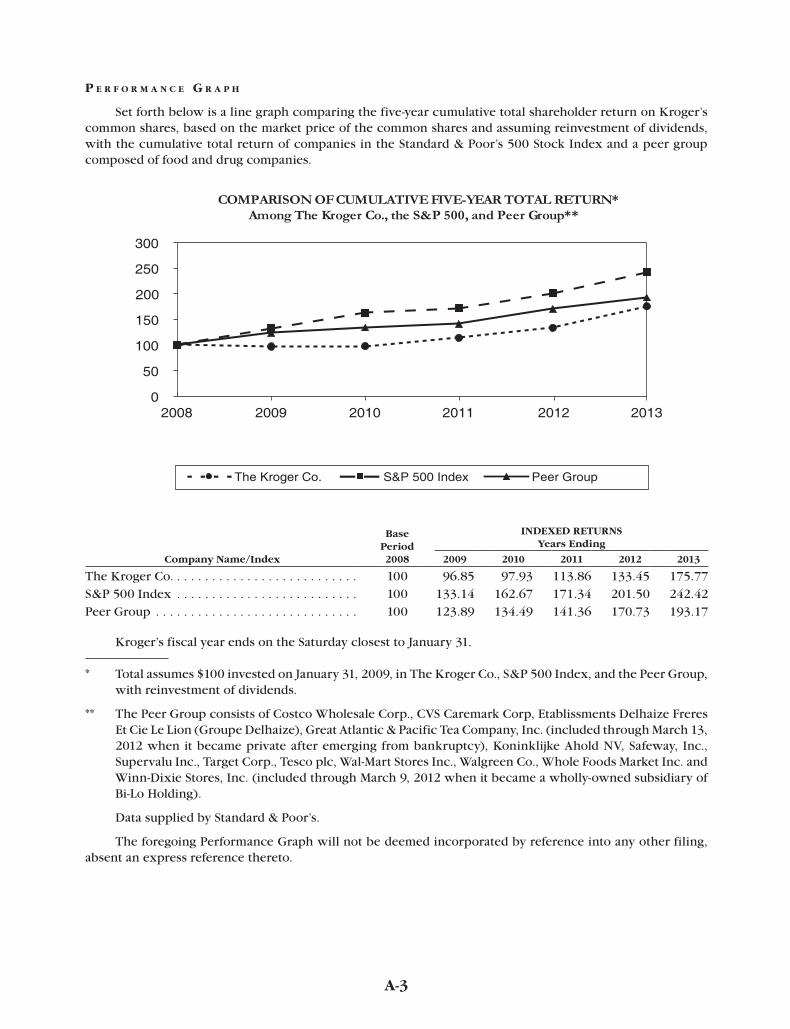
A-3
P e r F o r M a N c e g r a P h
Set forth below is a line graph comparing the five-year cumulative total shareholder return on Kroger’s common shares, based on the market price of the common shares and assuming reinvestment of dividends, with the cumulative total return of companies in the Standard & Poor’s 500 Stock Index and a peer group composed of food and drug companies.
2008 2009 2010 2011 2012 2013
The Kroger Co. S&P 500 Index Peer Group
COMPARISON OF CUMULATIVE FIVE-YEAR TOTAL RETURN*Among The Kroger Co., the S&P 500, and Peer Group**
0
50
100
150
200
250
300
Company Name/Index
BasePeriod2008
INDEXED RETURNSYears Ending
2009 2010 2011 2012 2013
The Kroger Co. . . . . . . . . . . . . . . . . . . . . . . . . . . 100 96.85 97.93 113.86 133.45 175.77S&P 500 Index . . . . . . . . . . . . . . . . . . . . . . . . . . 100 133.14 162.67 171.34 201.50 242.42Peer Group . . . . . . . . . . . . . . . . . . . . . . . . . . . . . 100 123.89 134.49 141.36 170.73 193.17
Kroger’s fiscal year ends on the Saturday closest to January 31.
* Total assumes $100 invested on January 31, 2009, in The Kroger Co., S&P 500 Index, and the Peer Group, with reinvestment of dividends.
** The Peer Group consists of Costco Wholesale Corp., CVS Caremark Corp, Etablissments Delhaize Freres Et Cie Le Lion (Groupe Delhaize), Great Atlantic & Pacific Tea Company, Inc. (included through March 13, 2012 when it became private after emerging from bankruptcy), Koninklijke Ahold NV, Safeway, Inc., Supervalu Inc., Target Corp., Tesco plc, Wal-Mart Stores Inc., Walgreen Co., Whole Foods Market Inc. and Winn-Dixie Stores, Inc. (included through March 9, 2012 when it became a wholly-owned subsidiary of Bi-Lo Holding).
Data supplied by Standard & Poor’s.
The foregoing Performance Graph will not be deemed incorporated by reference into any other filing, absent an express reference thereto.

A-4
i S S u e r P u r c h a S e S o F e q u i t y S e c u r i t i e S
Period (1)
Total Number of Shares
Purchased
Average Price Paid Per Share
Total Number of Shares
Purchased as Part of Publicly
Announced Plans or
Programs (2)
Maximum Dollar Value of Shares that May Yet Be
Purchased Underthe Plans orPrograms (3)(in millions)
First period - four weeks November 10, 2013 to December 7, 2013 . . . . 1,525,832 $41.99 1,525,832 $281
Second period - four weeks December 8, 2013 to January 4, 2014 . . . . . . . 1,776,028 $40.04 1,776,028 $214
Third period – four weeks January 5, 2014 to February 1, 2014 . . . . . . . . 2,407,317 $37.91 2,407,317 $129
Total. . . . . . . . . . . . . . . . . . . . . . . . . . . . . . . . . . . . 5,709,177 $39.66 5,709,177 $129
(1) The reported periods conform to the Company’s fiscal calendar composed of thirteen 28-day periods. The fourth quarter of 2013 contained three 28-day periods.
(2) Shares were repurchased under (i) a $500 million share repurchase program, authorized by the Board of Directors and announced on October 16, 2012 and (ii) a program announced on December 6, 1999 to repurchase common shares to reduce dilution resulting from our employee stock option and long-term incentive plans, which program is limited to proceeds received from exercises of stock options and the tax benefits associated therewith. The programs have no expiration date but may be terminated by the Board of Directors at any time. Total shares purchased include shares that were surrendered to the Company by participants under the Company’s long-term incentive plans to pay for taxes on restricted stock awards. On March 13, 2014, the Company announced a new $1 billion share repurchase program that was authorized by the Board of Directors, replacing the program identified in clause (i) above.
(3) The amounts shown in this column reflect amounts remaining, as of February 1, 2014, under the $500 million share repurchase program referenced in clause (i) of Note 2 above. Amounts to be invested under the program utilizing option exercise proceeds are dependent upon option exercise activity.
B u S i N e S S
The Kroger Co. (the “Company”) was founded in 1883 and incorporated in 1902. As of February 1, 2014, the Company was one of the largest retailers in the world based on annual sales. The Company also manufactures and processes some of the food for sale in its supermarkets. The Company’s principal executive offices are located at 1014 Vine Street, Cincinnati, Ohio 45202, and its telephone number is (513) 762-4000. The Company maintains a web site (www.thekrogerco.com) that includes additional information about the Company. The Company makes available through its web site, free of charge, its annual reports on Form 10-K, its quarterly reports on Form 10-Q, its current reports on Form 8-K and its interactive data files, including amendments. These forms are available as soon as reasonably practicable after the Company has filed them with, or furnished them electronically to, the SEC.
The Company’s revenues are earned and cash is generated as consumer products are sold to customers in its stores. The Company earns income predominantly by selling products at price levels that produce revenues in excess of its costs to make these products available to its customers. Such costs include procurement and distribution costs, facility occupancy and operational costs, and overhead expenses. The Company’s fiscal year ends on the Saturday closest to January 31. All references to 2013, 2012 and 2011 are to the fiscal years ended February 1, 2014, February 2, 2013 and January 28, 2012, respectively, unless specifically indicated otherwise.
e M P l o y e e S
As of February 1, 2014, the Company employed approximately 375,000 full- and part-time employees. A majority of the Company’s employees are covered by collective bargaining agreements negotiated with local unions affiliated with one of several different international unions. There are approximately 300 such agreements, usually with terms of three to five years.
A-5
S t o r e S
As of February 1, 2014, the Company operated, either directly or through its subsidiaries, 2,640 supermarkets and multi-department stores, 1,240 of which had fuel centers. Approximately 45% of these supermarkets were operated in Company-owned facilities, including some Company-owned buildings on leased land. The Company’s current strategy emphasizes self-development and ownership of store real estate. The Company’s stores operate under several banners that have strong local ties and brand recognition. Supermarkets are generally operated under one of the following formats: combination food and drug stores (“combo stores”); multi-department stores; marketplace stores; or price impact warehouses.
The combo stores are the primary food store format. They typically draw customers from a 2 – 2½ mile radius. The Company believes this format is successful because the stores are large enough to offer the specialty departments that customers desire for one-stop shopping, including natural food and organic sections, pharmacies, general merchandise, pet centers and high-quality perishables such as fresh seafood and organic produce.
Multi-department stores are significantly larger in size than combo stores. In addition to the departments offered at a typical combo store, multi-department stores sell a wide selection of general merchandise items such as apparel, home fashion and furnishings, electronics, automotive products, toys and fine jewelry.
Marketplace stores are smaller in size than multi-department stores. They offer full-service grocery, pharmacy and health and beauty care departments as well as an expanded perishable offering and general merchandise area that includes apparel, home goods and toys.
Price impact warehouse stores offer a “no-frills, low cost” warehouse format and feature everyday low prices plus promotions for a wide selection of grocery and health and beauty care items. Quality meat, dairy, baked goods and fresh produce items provide a competitive advantage. The average size of a price impact warehouse store is similar to that of a combo store.
In addition to the supermarkets, as of February 1, 2014, the Company operated through subsidiaries 786 convenience stores and 320 fine jewelry stores. All 144 of our fine jewelry stores located in malls are operated in leased locations. In addition, 83 convenience stores were operated by franchisees through franchise agreements. Approximately 54% of the convenience stores operated by subsidiaries were operated in Company-owned facilities. The convenience stores offer a limited assortment of staple food items and general merchandise and, in most cases, sell gasoline.
S e g M e N t S
The Company operates retail food and drug stores, multi-department stores, jewelry stores, and convenience stores throughout the United States. The Company’s retail operations, which represent over 99% of the Company’s consolidated sales and EBITDA, are its only reportable segment. The Company’s retail operating divisions have been aggregated into one reportable segment due to the operating divisions having similar economic characteristics with similar long-term financial performance. In addition, the Company’s operating divisions offer to its customers similar products, have similar distribution methods, operate in similar regulatory environments, purchase the majority of the Company’s merchandise for retail sale from similar (and in many cases identical) vendors on a coordinated basis from a centralized location, serve similar types of customers, and are allocated capital from a centralized location. The Company’s operating divisions reflect the manner in which the business is managed and how the Company’s Chief Executive Officer and Chief Operating Officer, who act as the Company’s chief operating decision makers, assess performance internally. All of the Company’s operations are domestic. Revenues, profit and losses and total assets are shown in the Company’s Consolidated Financial Statements set forth in Item 8 below.
M e r c h a N d i S i N g a N d M a N u F a c t u r i N g
Corporate brand products play an important role in the Company’s merchandising strategy. Our supermarkets, on average, stock approximately 13,000 private label items. The Company’s corporate brand products are primarily produced and sold in three “tiers.” Private Selection is the premium quality brand designed to be a unique item in a category or to meet or beat the “gourmet” or “upscale” brands. The “banner

A-6
brand” (Kroger, Ralphs, King Soopers, etc.), which represents the majority of the Company’s private label items, is designed to satisfy customers with quality products. Before Kroger will carry a banner brand product we must be satisfied that the product quality meets our customers’ expectations in taste and efficacy, and we guarantee it. Kroger Value is the value brand, designed to deliver good quality at a very affordable price. In addition, the Company continues to grow its other brands, including Simple Truth and Simple Truth Organic. Both Simple Truth and Simple Truth Organic are free from 101 artificial preservatives and ingredients that customers have told us they do not want in their food, and the Simple Truth Organic products are USDA certified organic.
Approximately 40% of the corporate brand units sold are produced in the Company’s manufacturing plants; the remaining corporate brand items are produced to the Company’s strict specifications by outside manufacturers. The Company performs a “make or buy” analysis on corporate brand products and decisions are based upon a comparison of market-based transfer prices versus open market purchases. As of February 1, 2014, the Company operated 38 manufacturing plants. These plants consisted of 18 dairies, nine deli or bakery plants, five grocery product plants, two beverage plants, two meat plants and two cheese plants.
S e a S o N a l i t y
The majority of our revenues are generally not seasonal in nature. However, revenues tend to be higher during the major holidays throughout the year.
e x e c u t i v e o F F i c e r S o F t h e r e g i S t r a N t
The disclosure regarding executive officers is set forth in Item 10 of Part III of this Form 10-K under the heading “Executive Officers of the Company,” and is incorporated herein by reference.
c o M P e t i t i v e e N v i r o N M e N t
For the disclosure related to the Company’s competitive environment, see Item 1A under the heading “Competitive Environment.”

A-7
M a N a g e M e N t ’ S d i S c u S S i o N a N d a N a l y S i S o F F i N a N c i a l c o N d i t i o N a N d r e S u l t S o F o P e r a t i o N S
o u r B u S i N e S S
The Kroger Co. was founded in 1883 and incorporated in 1902. It is one of the nation’s largest retailers, as measured by revenue, operating 2,640 supermarket and multi-department stores under two dozen banners including Kroger, City Market, Dillons, Food 4 Less, Fred Meyer, Fry’s, Harris Teeter, Jay C, King Soopers, QFC, Ralphs and Smith’s. Of these stores, 1,240 have fuel centers. We also operate 786 convenience stores, either directly or through franchisees, and 320 fine jewelry stores.
Kroger operates 38 manufacturing plants, primarily bakeries and dairies, which supply approximately 40% of the corporate brand units sold in our retail outlets.
Our revenues are earned and cash is generated as consumer products are sold to customers in our stores. We earn income predominately by selling products at price levels that produce revenues in excess of the costs we incur to make these products available to our customers. Such costs include procurement and distribution costs, facility occupancy and operational costs, and overhead expenses. Our retail operations, which represent over 99% of Kroger’s consolidated sales and EBITDA, are our only reportable segment.
On January 28, 2014, we closed our merger with Harris Teeter Supermarkets, Inc. (“Harris Teeter”) by purchasing 100% of the Harris Teeter outstanding common stock for approximately $2.4 billion. The merger allows us to expand into the fast-growing southeastern and mid-Atlantic markets and into Washington, D.C. Harris Teeter is included in our ending Consolidated Balance Sheet, but because of the timing of the merger closing late in the year its results of operations were not material to our consolidated results of operations for 2013. See Note 2 to the Consolidated Financial Statements for more information related to our merger with Harris Teeter.
o u r 2 0 1 3 P e r F o r M a N c e
We achieved outstanding results in 2013. Our business strategy continues to resonate with a full range of customers and our results reflect the balance we seek to achieve across our business including positive identical sales growth, increases in loyal household count, and good cost control, as well as growth in net earnings and net earnings per diluted share. Our 2013 net earnings were $1.5 billion or $2.90 per diluted share, compared to $1.5 billion, or $2.77 per diluted share for the same period of 2012. The net earnings for 2013 include a net benefit of $23 million, which includes benefits from certain tax items of $40 million, offset partially by after-tax expense of $17 million ($7 million in interest and $10 million in operating, general and administrative expenses) in costs related to our merger with Harris Teeter (“2013 adjusted items”). See Note 5 to the Consolidated Financial Statements for more information relating to the benefits from certain tax items. For 2012, our net earnings include an estimated after-tax amount of $58 million or $0.11 per diluted share due to a 53rd week in fiscal year 2012 (the “extra week”). In addition, 2012 net earnings benefited by $74 million after-tax or $0.14 per diluted share from a settlement with Visa and MasterCard and from a reduction in our obligation to fund the UFCW consolidated pension fund created in January 2012. Excluding the 2013 adjusted items, net earnings for 2013 totaled $1.5 billion, or $2.85 per diluted share, compared to net earnings in 2012 of $1.4 billion, or $2.52 per diluted share, excluding the Visa and MasterCard settlement, the UFCW consolidated pension fund adjustment and the extra week in 2012. We believe adjusted net earnings and adjusted net earnings per diluted share present a more accurate year-over-year comparison of our financial results because the adjusted items were not directly related to our day-to-day business. After accounting for these 2013 and 2012 adjusted items, our adjusted net earnings per diluted share for 2013 represents a 13% increase, compared to 2012. Please refer to the “Net Earnings” section for more information.
Our identical supermarket sales increased 3.6%, excluding fuel, in 2013, compared to 2012. We have achieved 41 consecutive quarters of positive identical supermarket sales growth, excluding fuel. As we continue to outpace many of our competitors on identical supermarket sales growth, we continue to gain market share. We focus on identical supermarket sales growth, excluding fuel, as it is a key performance target for our long-term growth strategy.
A-8
Increasing market share is an important part of our long-term strategy as it best reflects how our products and services resonate with customers. Market share growth allows us to spread the fixed costs in our business over a wider revenue base. Our fundamental operating philosophy is to maintain and increase market share by offering customers good prices and superior products and service. Based on Nielsen POS+ data, our estimated market share increased in total by approximately 50 basis points in 2013 across our 18 marketing areas outlined by the Nielsen report. This information also indicates that our market share increased in 16 of the marketing areas and declined in two. Wal-Mart supercenters are one of our top two competitors in 13 of these 18 marketing areas. In these 13 marketing areas, our market share increased in 12 and slightly declined in one. These market share results reflect our long-term strategy of market share growth.
r e S u l t S o F o P e r a t i o N S
The following discussion summarizes our operating results for 2013 compared to 2012 and for 2012 compared to 2011. Comparability is affected by income and expense items that fluctuated significantly between and among the periods and an extra week in 2012.
Net Earnings
Net earnings totaled $1.5 billion in 2013, $1.5 billion in 2012 and $602 million in 2011. The net earnings for 2013 include a net benefit of $23 million, after tax, related to the 2013 adjusted items. The net earnings for 2012 include a benefit from net earnings of approximately $58 million, after-tax, for the extra week and a net $74 million, after-tax, benefit for the settlement with Visa and MasterCard and a reduction in our obligation to fund the UFCW consolidated pension fund created in January 2012 (“2012 adjusted items”). The net earnings for 2011 include a UFCW consolidated pension plan charge totaling $591 million, after-tax (“2011 adjusted item”). Excluding these benefits and charges for adjusted items in 2013, 2012 and 2011, adjusted net earnings were $1.5 billion in 2013, $1.4 billion in 2012 and $1.2 billion in 2011. 2013 adjusted net earnings improved, compared to adjusted net earnings in 2012, due to an increase in first-in, first-out (“FIFO”) non-fuel operating profit and decreased interest expense, partially offset by increased income tax expense. 2012 adjusted net earnings improved, compared to adjusted net earnings in 2011, due to an increase in FIFO non-fuel operating profit, increased net earnings from our fuel operations and a last-in, first-out (“LIFO”) charge of $55 million (pre-tax), compared to a LIFO charge of $216 million (pre-tax) in 2011, partially offset by increased interest expense and income tax expense.
2013 net earnings per diluted share totaled $2.90, and adjusted net earnings per diluted share totaled $2.85, which excludes the 2013 adjusted items. 2012 net earnings per diluted share totaled $2.77, and adjusted net earnings per diluted share totaled $2.52, which excludes the 2012 adjusted items. 2011 net earnings per diluted share totaled $1.01, and adjusted net earnings per diluted share in 2011 totaled $2.00, which excludes the 2011 adjusted item. Adjusted net earnings per diluted share in 2013, compared to adjusted net earnings per diluted share in 2012, increased primarily due to fewer shares outstanding as a result of the repurchase of Kroger common shares, increased FIFO non-fuel operating profit and decreased interest expense, partially offset by increased income tax expense. Adjusted net earnings per diluted share in 2012, compared to adjusted net earnings per diluted share in 2011, increased primarily due to fewer shares outstanding as a result of the repurchase of Kroger common shares, increased FIFO non-fuel operating profit, increased net earnings from our fuel operations and a decrease in the LIFO charge to $55 million (pre-tax), compared to a LIFO charge of $216 million (pre-tax) in 2011, partially offset by increased interest expense and income tax expense.
Management believes adjusted net earnings (and adjusted net earnings per diluted share) are useful metrics to investors and analysts because the adjusted items referenced above in net earnings and net earnings per diluted share are not directly related to our day-to-day business. Adjusted net earnings (and adjusted net earnings per diluted share) are non-generally accepted accounting principle (“non-GAAP”) financial measures and should not be considered alternatives to net earnings (and net earnings per diluted share) or any other generally accepted accounting principle (“GAAP”) measure of performance. Adjusted net earnings (and adjusted net earnings per diluted share) should not be reviewed in isolation or considered substitutes for our financial results as reported in accordance with GAAP. Management uses adjusted net earnings (and adjusted net earnings per diluted share) as it believes these measures are more meaningful indicators of ongoing operating performance since, as adjusted, those earnings relate more directly to our day-to-day operations. Management also uses adjusted net earnings (and adjusted net earnings per diluted share) to measure our progress against internal budgets and targets. In addition, management takes into account adjusted net earnings when calculating management incentive programs.

A-9
The following table provides a reconciliation of net earnings attributable to The Kroger Co. to net earnings attributable to The Kroger Co. excluding the adjusted items and a reconciliation of net earnings attributable to The Kroger Co. per diluted common share to the net earnings attributable to The Kroger Co. per diluted common share excluding the adjusted items, for 2013, 2012 and 2011:
Net Earnings per Diluted Share excluding the Adjustment Items (in millions, except per share amounts)
2013 2012 2011
Net earnings attributable to The Kroger Co. . . . . . . . . . . . . . . . . . . . . . . . . . . $1,519 $1,497 $ 602Benefit from certain tax items offset by Harris Teeter merger costs (1) . . . . . (23) — —53rd week adjustment (1) . . . . . . . . . . . . . . . . . . . . . . . . . . . . . . . . . . . . . . . . . . — (58) —Adjustment for the UFCW consolidated pension plan liability and
credit card settlement (1) . . . . . . . . . . . . . . . . . . . . . . . . . . . . . . . . . . . . . . — (74) —UFCW pension plan consolidation charge (1) . . . . . . . . . . . . . . . . . . . . . . . . . — — 591Net earnings attributable to The Kroger Co. excluding the adjustment
items above . . . . . . . . . . . . . . . . . . . . . . . . . . . . . . . . . . . . . . . . . . . . . . . . . $1,496 $1,365 $1,193Net Earnings attributable to The Kroger Co. per diluted common share . . . . $ 2.90 $ 2.77 $ 1.01Benefit from certain tax items offset by Harris Teeter merger costs (2) . . . . . (0.05) — —53rd week adjustment (2) . . . . . . . . . . . . . . . . . . . . . . . . . . . . . . . . . . . . . . . . . — (0.11) —Adjustments for the UFCW consolidated pension plan liability and
credit card settlement (2) . . . . . . . . . . . . . . . . . . . . . . . . . . . . . . . . . . . . . . — (0.14) —UFCW pension plan consolidation charge (2) . . . . . . . . . . . . . . . . . . . . . . . . . — — 0.99Net earnings attributable to The Kroger Co. per diluted common
share excluding the adjustment items above . . . . . . . . . . . . . . . . . . . . . . . $ 2.85 $ 2.52 $ 2.00Average numbers of common shares used in diluted calculation . . . . . . . . . . 520 537 593
(1) The amounts presented represent the after-tax effect of each adjustment. Pre-tax amounts were $27 for Harris Teeter merger costs in 2013, $91 for the 53rd week adjustment in 2012, $115 for the adjustment for the UFCW consolidated pension plan liability and credit card settlement in 2012 and $953 for the UFCW pension plan consolidation charge in 2011.
(2) The amounts presented represent the net earnings per diluted common share effect of each adjustment.
Sales
Total Sales (in millions)
2013Percentage Increase (2) 2012
2012 Adjusted (3)
Percentage Increase (4) 2011
Total supermarket sales without fuel . . . . . . . . . . . . . . . . . . . $76,666 4.0% $75,179 $73,733 3.8% $71,004
Fuel sales . . . . . . . . . . . . . . . . . . . . . . . . 18,962 3.0% 18,896 18,413 8.9% 16,901Other sales (1) . . . . . . . . . . . . . . . . . . . . 2,747 9.2% 2,544 2,515 6.4% 2,364Total sales . . . . . . . . . . . . . . . . . . . . . . . $98,375 3.9% $96,619 $94,661 4.9% $90,269
(1) Other sales primarily relate to sales at convenience stores, excluding fuel; jewelry stores; manufacturing plants to outside customers; variable interest entities; a specialty pharmacy; and in-store health clinics.
(2) This column represents the percentage increase in 2013, compared to adjusted sales in 2012.
(3) The 2012 adjusted column represents the items presented in the 2012 column as adjusted to remove the extra week.
(4) This column represents the percentage increase in adjusted sales in 2012, compared to 2011.

A-10
Total sales increased in 2013, compared to 2012, by 1.82%. The increase in 2013 total sales, compared to 2012, was primarily due to our identical supermarket sales increase, excluding fuel, of 3.6%, partially offset by the extra week in fiscal 2012. Total sales increased in 2013, compared to 2012 adjusted total sales, by 3.9%. The increase in 2013 total sales, compared to 2012 adjusted total sales, was primarily due to our identical supermarket sales increase, excluding fuel, of 3.6%. Identical supermarket sales, excluding fuel, increased in 2013, compared to 2012, primarily due to an increase in average sale per customer, partially due to inflation, and an increase in the transaction count.
Total sales increased in 2012, compared to 2011, by 7.0%. The increase in 2012 total sales, compared to 2011, was primarily due to our identical supermarket sales increase, excluding fuel, of 3.5%, increased fuel sales of 8.9% and the extra week in fiscal 2012. Adjusted total sales increased in 2012, compared to 2011, by 4.9%. The increase in 2012 adjusted total sales, compared to 2011 total sales, was primarily due to our identical supermarket sales increase, excluding fuel, of 3.5% and an increase in fuel sales of 8.9%. Identical supermarket sales, excluding fuel, increased in 2012, adjusted for the extra week, compared to 2011, primarily due to an increase in the average sale per customer, partially due to inflation, and an increase in the transaction count. Total fuel sales increased in 2012, adjusted for the extra week, compared to 2011, primarily due to an increase in fuel gallons sold of 7.8% and an increase in the average retail fuel price of 1.7%. The increase in the average retail fuel price was caused by an increase in the product cost of fuel.
We define a supermarket as identical when it has been in operation without expansion or relocation for five full quarters. Although identical supermarket sales is a relatively standard term, numerous methods exist for calculating identical supermarket sales growth. As a result, the method used by our management to calculate identical supermarket sales may differ from methods other companies use to calculate identical supermarket sales. We urge you to understand the methods used by other companies to calculate identical supermarket sales before comparing our identical supermarket sales to those of other such companies. Fuel discounts received at our fuel centers and earned based on in-store purchases are included in all of the supermarket identical sales results calculations illustrated below and reduce our identical supermarket sales results. Differences between total supermarket sales and identical supermarket sales primarily relate to changes in supermarket square footage. Identical supermarket sales include sales from all departments at identical Fred Meyer multi-department stores. We calculate annualized identical supermarket sales by adding together four quarters of identical supermarket sales. Our identical supermarket sales results are summarized in the table below, based on the 52-week period of 2013, compared to the previous year results adjusted to a comparable 52 week period.
Identical Supermarket Sales (dollars in millions)
2013 2012 (1)
Including supermarket fuel centers . . . . . . . . . . . $ 88,482 $ 85,661Excluding supermarket fuel centers . . . . . . . . . . . $ 74,095 $ 71,541
Including supermarket fuel centers . . . . . . . . . . . 3.3% 4.5%Excluding supermarket fuel centers . . . . . . . . . . . 3.6% 3.5%
(1) Identical supermarket sales for 2013 were calculated on a 52 week basis by excluding week 1 of fiscal 2012 in our 2012 identical supermarket sales base. Identical supermarket sales for 2012 were calculated on a 53 week basis by including week 1 of fiscal 2012 in our 2011 identical supermarket sales base.

A-11
Gross Margin and FIFO Gross Margin
Our gross margin rates, as a percentage of sales, were 20.57% in 2013, 20.59% in 2012 and 20.92% in 2011. The decrease in 2013, compared to 2012, resulted primarily from continued investments in lower prices for our customers and increased shrink and advertising costs, as a percentage of sales, offset partially by a growth rate in retail fuel sales that was lower than the total Company sales growth rate. Our retail fuel operations lower our gross margin rate, as a percentage of sales, due to the very low gross margin on retail fuel sales as compared to non-fuel sales. A lower growth rate in retail fuel sales, as compared to the growth rate for the total Company, increases the gross margin rates, as a percentage of sales, when compared to the prior year. The decrease in gross margin rates in 2012, compared to 2011, resulted primarily from a higher growth rate in fuel sales, as compared to the growth rate for the total Company, continued investments in lower prices for our customers and increased shrink and warehousing costs, as a percentage of sales, offset partially by a decrease in the LIFO charge as a percentage of sales.
We calculate FIFO gross margin as sales minus merchandise costs, including advertising, warehousing, and transportation expenses, but excluding the LIFO charge. Merchandise costs exclude depreciation and rent expenses. Our LIFO charge was $52 million in 2013, $55 million in 2012 and $216 million in 2011. FIFO gross margin is a non-GAAP financial measure and should not be considered as an alternative to gross margin or any other GAAP measure of performance. FIFO gross margin should not be reviewed in isolation or considered as a substitute for our financial results as reported in accordance with GAAP. FIFO gross margin is an important measure used by management to evaluate merchandising and operational effectiveness. Management believes FIFO gross margin is a useful metric to investors and analysts because it measures our day-to-day merchandising and operational effectiveness.
Our FIFO gross margin rates, as a percentage of sales, were 20.62% in 2013, 20.65% in 2012 and 21.15% in 2011. Our retail fuel operations lower our FIFO gross margin rate, as a percentage of sales, due to the very low FIFO gross margin on retail fuel sales as compared to non-fuel sales. Excluding the effect of retail fuel operations, our FIFO gross margin rate decreased 14 basis points in 2013, as a percentage of sales, compared to 2012. This decrease in 2013, compared to 2012, resulted primarily from continued investments in lower prices for our customers and increased shrink and advertising costs as a percentage of sales. Excluding the effect of retail fuel operations, our FIFO gross margin rate decreased 40 basis points in 2012, as a percentage of sales, compared to 2011. This decrease in 2012, compared to 2011, resulted primarily from continued investments in lower prices for our customers and increased shrink and warehousing costs as a percentage of sales.
LIFO Charge
The LIFO charge was $52 million in 2013, $55 million in 2012 and $216 million in 2011. We experienced relatively consistent levels of product cost inflation in 2013, compared to 2012. In 2013, our LIFO charge resulted primarily from an annualized product cost inflation related to meat, seafood and pharmacy. In 2012, our LIFO charge resulted primarily from an annualized product cost inflation related to grocery, natural foods, meat, deli and bakery, general merchandise and grocery, partially offset by deflation in seafood and manufactured product. In 2012, we experienced lower levels of product cost inflation, compared to 2011. In 2011, our LIFO charge primarily resulted from an annualized product cost inflation related to grocery, meat and seafood, deli and bakery, and pharmacy.
A-12
Operating, General and Administrative Expenses
Operating, general and administrative (“OG&A”) expenses consist primarily of employee-related costs such as wages, health care benefits and retirement plan costs, utilities and credit card fees. Rent expense, depreciation and amortization expense, and interest expense are not included in OG&A.
OG&A expenses, as a percentage of sales, were 15.45% in 2013, 15.37% in 2012 and 17.00% in 2011. Excluding the 2013, 2012 and 2011 adjusted items, OG&A expenses, as a percentage of sales, were 15.43% in 2013, 15.52% in 2012 and 15.94% in 2011. Our retail fuel operations reduce our overall OG&A rate, as a percentage of sales, due to the very low OG&A rate on retail fuel sales as compared to non-fuel sales. OG&A expenses, as a percentage of sales excluding fuel and the 2013 adjusted items, decreased 17 basis points in 2013, compared to 2012, adjusted for the 2012 adjusted items. This decrease resulted primarily from increased identical supermarket sales growth, productivity improvements and effective cost controls at the store level, offset partially by increased incentive compensation. OG&A expenses, as a percentage of sales excluding fuel and the 2012 adjusted items, decreased 36 basis points in 2012, compared to 2011, adjusted for the 2011 adjusted items. This decrease resulted primarily from increased identical supermarket sales growth, productivity improvements, effective cost controls at the store level, the benefit received in lower operating expenses from the consolidation of four UFCW multi-employer pension plans in the prior year and decreased incentive compensation, offset partially by increased healthcare costs.
Rent Expense
Rent expense was $613 million in 2013, as compared to $628 million in 2012 and $619 million in 2011. Rent expense, as a percentage of sales, was 0.62% in 2013, as compared to 0.65% in 2012 and 0.69% in 2011. Rent expense, as a percentage of sales excluding fuel, decreased four basis points in 2013, compared to 2012 and four basis points in 2012, compared to 2011. These continual decreases in rent expense, as a percentage of sales both including and excluding fuel, reflects our continued emphasis on owning rather than leasing, whenever possible, and the benefit of increased sales.
Depreciation and Amortization Expense
Depreciation and amortization expense was $1.7 billion in both 2013 and 2012 and $1.6 billion in 2011. Depreciation and amortization expense, as a percentage of sales, was 1.73% in 2013, 1.71% in 2012 and 1.81% in 2011. Excluding the extra week in 2012, depreciation and amortization expense, as a percentage of sales, was 1.74% in 2012. Depreciation and amortization expense, as a percentage of sales excluding fuel and the extra week in 2012, decreased three basis points in 2013, compared to 2012 and seven basis points in 2012, compared to 2011. These continual decreases in depreciation and amortization expense, excluding the extra week in 2012, as a percentage of sales both including and excluding fuel, are primarily the result of increasing sales, offset partially by our increased spending in capital investments.
Operating Profit and FIFO Operating Profit
Operating profit was $2.7 billion in 2013, $2.8 billion in 2012 and $1.3 billion in 2011. Excluding the extra week, operating profit was $2.7 billion in 2012. Operating profit, as a percentage of sales, was 2.77% in 2013, 2.86% in 2012 and 1.42% in 2011. Operating profit, as a percentage of sales excluding the extra week in 2012, was 2.81%. Operating profit, excluding the 2013, 2012 and 2011 adjusted items, was $2.7 billion in 2013, $2.6 billion in 2012 and $2.2 billion in 2011. Operating profit, as a percentage of sales excluding the 2013, 2012 and 2011 adjusted items, was 2.79% in 2013, 2.69% in 2012 and 2.47% in 2011.
Operating profit, as a percentage of sales excluding the 2013 and 2012 adjusted items, increased 10 basis points in 2013, compared to 2012, primarily due to improvements in operating, general and administrative expenses, rent and depreciation, as a percentage of sales, offset partially by continued investments in lower prices for our customers and increased shrink and advertising costs, as a percentage of sales. Operating profit, as a percentage of sales excluding the 2012 and 2011 adjusted items, increased 22 basis points in 2012, compared to 2011, primarily due to improvements in operating, general and administrative expenses, rent, depreciation and the LIFO charge, as a percentage of sales, offset partially by continued investments in lower prices for our customers and increased shrink and warehousing costs, as a percentage of sales.

A-13
We calculate FIFO operating profit as operating profit excluding the LIFO charge. FIFO operating profit is a non-GAAP financial measure and should not be considered as an alternative to operating profit or any other GAAP measure of performance. FIFO operating profit should not be reviewed in isolation or considered as a substitute for our financial results as reported in accordance with GAAP. FIFO operating profit is an important measure used by management to evaluate operational effectiveness. Management believes FIFO operating profit is a useful metric to investors and analysts because it measures our day-to-day operational effectiveness. Since fuel discounts are earned based on in-store purchases, fuel operating profit does not include fuel discounts, which are allocated to our in-store supermarket location departments. We also derive operating, general and administrative expenses, rent and depreciation and amortization through the use of estimated allocations in the calculation of fuel operating profit.
FIFO operating profit was $2.8 billion in 2013 and 2012, and $1.5 billion in 2011. Excluding the extra week in 2012, FIFO operating profit was $2.7 billion. FIFO operating profit, as a percentage of sales, was 2.82% in 2013, 2.92% in 2012 and 1.66% in 2011. FIFO operating profit, as a percentage of sales excluding the extra week in 2012, was 2.87%. FIFO operating profit, excluding the 2013, 2012, and 2011 adjusted items, was $2.8 billion in 2013, $2.6 billion in 2012 and $2.4 billion in 2011. FIFO operating profit, as a percentage of sales excluding the 2013, 2012, and 2011 adjusted items, was 2.84% in 2013, 2.75% in 2012, and 2.71% in 2011.
Retail fuel sales lower our overall FIFO operating profit rate due to the very low FIFO operating profit rate, as a percentage of sales, of retail fuel sales compared to non-fuel sales. FIFO operating profit, excluding fuel, was $2.6 billion in 2013 and 2012, and $1.3 billion in 2011. Excluding the extra week, FIFO operating profit, excluding fuel, was $2.5 billion in 2012. FIFO operating profit, as a percentage of sales excluding fuel, was 3.22% in 2013, 3.35% in 2012, and 1.77% in 2011. Excluding the extra week, FIFO operating profit, as a percentage of sales excluding fuel, was 3.28% in 2012. FIFO operating profit, excluding fuel and the 2013, 2012 and 2011 adjusted items, was $2.6 billion in 2013, $2.4 billion in 2012 and $2.3 billion in 2011. FIFO operating profit, as a percentage of sales excluding fuel and the 2013, 2012, and 2011 adjusted items, was 3.24% in 2013, 3.13% in 2012 and 3.07% in 2011.
Excluding fuel, FIFO operating profit, as a percentage of sales excluding the 2013 and 2012 adjusted items, increased 11 basis points in 2013, compared to 2012, primarily due to improvements in OG&A expenses, rent and depreciation, as a percentage of sales, offset partially by continued investments in lower prices for our customers and increased shrink and advertising costs, as a percentage of sales. Excluding fuel, FIFO operating profit, as a percentage of sales excluding the 2012 and 2011 adjusted items, increased six basis points in 2012, compared to 2011, primarily due to improvements in operating, general and administrative expenses, rent and depreciation, as a percentage of sales, offset partially by continued investments in lower prices for our customers and increased shrink and warehousing costs, as a percentage of sales.
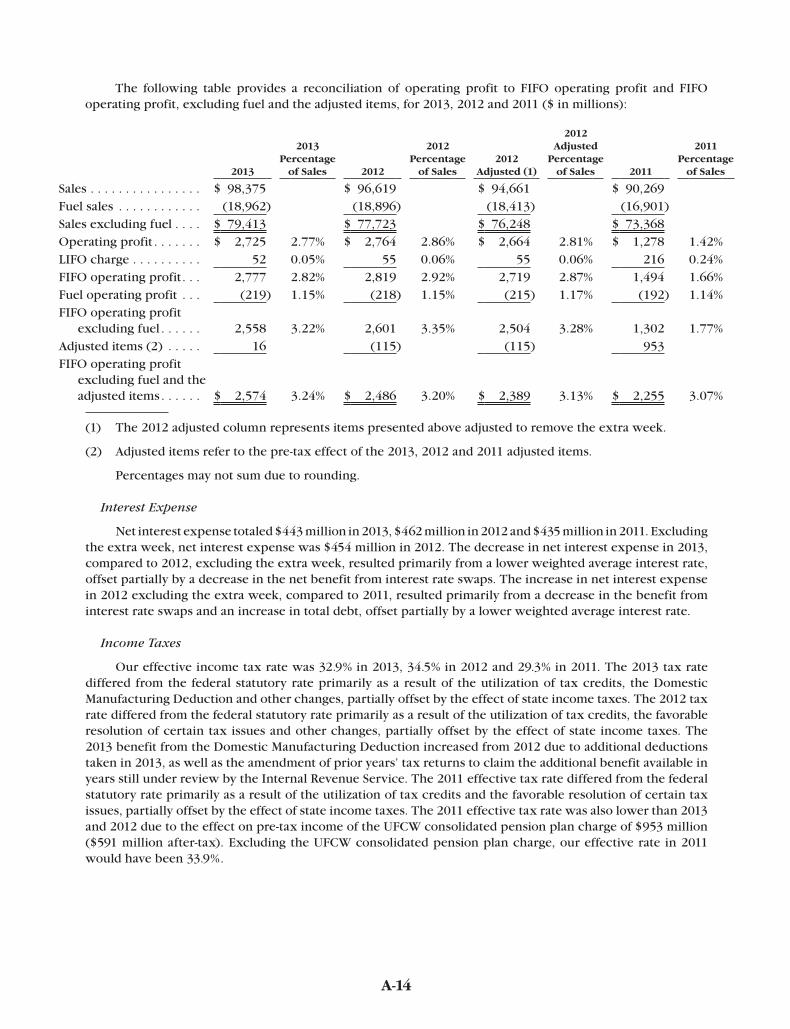
A-14
The following table provides a reconciliation of operating profit to FIFO operating profit and FIFO operating profit, excluding fuel and the adjusted items, for 2013, 2012 and 2011 ($ in millions):
2013
2013 Percentage
of Sales 2012
2012 Percentage
of Sales2012
Adjusted (1)
2012 Adjusted
Percentage of Sales 2011
2011 Percentage
of Sales
Sales . . . . . . . . . . . . . . . . $ 98,375 $ 96,619 $ 94,661 $ 90,269Fuel sales . . . . . . . . . . . . (18,962) (18,896) (18,413) (16,901)Sales excluding fuel . . . . $ 79,413 $ 77,723 $ 76,248 $ 73,368Operating profit . . . . . . . $ 2,725 2.77% $ 2,764 2.86% $ 2,664 2.81% $ 1,278 1.42%LIFO charge . . . . . . . . . . 52 0.05% 55 0.06% 55 0.06% 216 0.24%FIFO operating profit. . . 2,777 2.82% 2,819 2.92% 2,719 2.87% 1,494 1.66%Fuel operating profit . . . (219) 1.15% (218) 1.15% (215) 1.17% (192) 1.14%FIFO operating profit
excluding fuel . . . . . . 2,558 3.22% 2,601 3.35% 2,504 3.28% 1,302 1.77%Adjusted items (2) . . . . . 16 (115) (115) 953FIFO operating profit
excluding fuel and the adjusted items . . . . . . $ 2,574 3.24% $ 2,486 3.20% $ 2,389 3.13% $ 2,255 3.07%
(1) The 2012 adjusted column represents items presented above adjusted to remove the extra week.
(2) Adjusted items refer to the pre-tax effect of the 2013, 2012 and 2011 adjusted items.
Percentages may not sum due to rounding.
Interest Expense
Net interest expense totaled $443 million in 2013, $462 million in 2012 and $435 million in 2011. Excluding the extra week, net interest expense was $454 million in 2012. The decrease in net interest expense in 2013, compared to 2012, excluding the extra week, resulted primarily from a lower weighted average interest rate, offset partially by a decrease in the net benefit from interest rate swaps. The increase in net interest expense in 2012 excluding the extra week, compared to 2011, resulted primarily from a decrease in the benefit from interest rate swaps and an increase in total debt, offset partially by a lower weighted average interest rate.
Income Taxes
Our effective income tax rate was 32.9% in 2013, 34.5% in 2012 and 29.3% in 2011. The 2013 tax rate differed from the federal statutory rate primarily as a result of the utilization of tax credits, the Domestic Manufacturing Deduction and other changes, partially offset by the effect of state income taxes. The 2012 tax rate differed from the federal statutory rate primarily as a result of the utilization of tax credits, the favorable resolution of certain tax issues and other changes, partially offset by the effect of state income taxes. The 2013 benefit from the Domestic Manufacturing Deduction increased from 2012 due to additional deductions taken in 2013, as well as the amendment of prior years’ tax returns to claim the additional benefit available in years still under review by the Internal Revenue Service. The 2011 effective tax rate differed from the federal statutory rate primarily as a result of the utilization of tax credits and the favorable resolution of certain tax issues, partially offset by the effect of state income taxes. The 2011 effective tax rate was also lower than 2013 and 2012 due to the effect on pre-tax income of the UFCW consolidated pension plan charge of $953 million ($591 million after-tax). Excluding the UFCW consolidated pension plan charge, our effective rate in 2011 would have been 33.9%.
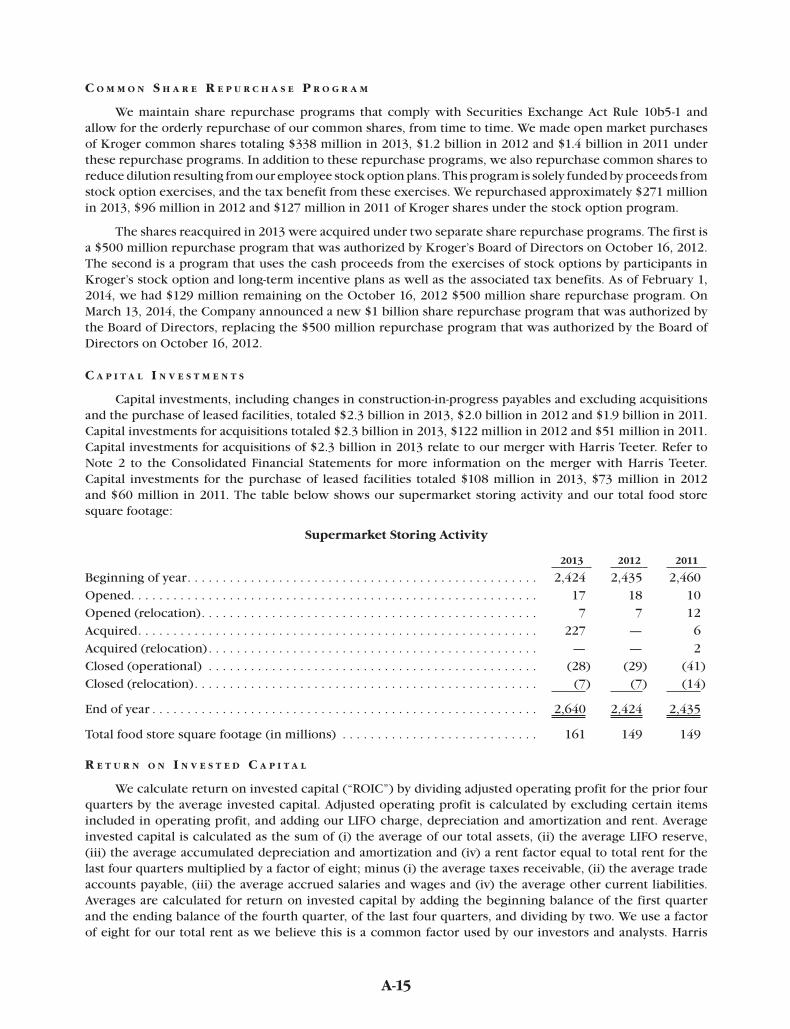
A-15
c o M M o N S h a r e r e P u r c h a S e P r o g r a M
We maintain share repurchase programs that comply with Securities Exchange Act Rule 10b5-1 and allow for the orderly repurchase of our common shares, from time to time. We made open market purchases of Kroger common shares totaling $338 million in 2013, $1.2 billion in 2012 and $1.4 billion in 2011 under these repurchase programs. In addition to these repurchase programs, we also repurchase common shares to reduce dilution resulting from our employee stock option plans. This program is solely funded by proceeds from stock option exercises, and the tax benefit from these exercises. We repurchased approximately $271 million in 2013, $96 million in 2012 and $127 million in 2011 of Kroger shares under the stock option program.
The shares reacquired in 2013 were acquired under two separate share repurchase programs. The first is a $500 million repurchase program that was authorized by Kroger’s Board of Directors on October 16, 2012. The second is a program that uses the cash proceeds from the exercises of stock options by participants in Kroger’s stock option and long-term incentive plans as well as the associated tax benefits. As of February 1, 2014, we had $129 million remaining on the October 16, 2012 $500 million share repurchase program. On March 13, 2014, the Company announced a new $1 billion share repurchase program that was authorized by the Board of Directors, replacing the $500 million repurchase program that was authorized by the Board of Directors on October 16, 2012.
c a P i t a l i N v e S t M e N t S
Capital investments, including changes in construction-in-progress payables and excluding acquisitions and the purchase of leased facilities, totaled $2.3 billion in 2013, $2.0 billion in 2012 and $1.9 billion in 2011. Capital investments for acquisitions totaled $2.3 billion in 2013, $122 million in 2012 and $51 million in 2011. Capital investments for acquisitions of $2.3 billion in 2013 relate to our merger with Harris Teeter. Refer to Note 2 to the Consolidated Financial Statements for more information on the merger with Harris Teeter. Capital investments for the purchase of leased facilities totaled $108 million in 2013, $73 million in 2012 and $60 million in 2011. The table below shows our supermarket storing activity and our total food store square footage:
Supermarket Storing Activity
2013 2012 2011
Beginning of year. . . . . . . . . . . . . . . . . . . . . . . . . . . . . . . . . . . . . . . . . . . . . . . . . . 2,424 2,435 2,460Opened. . . . . . . . . . . . . . . . . . . . . . . . . . . . . . . . . . . . . . . . . . . . . . . . . . . . . . . . . . 17 18 10Opened (relocation). . . . . . . . . . . . . . . . . . . . . . . . . . . . . . . . . . . . . . . . . . . . . . . . 7 7 12Acquired. . . . . . . . . . . . . . . . . . . . . . . . . . . . . . . . . . . . . . . . . . . . . . . . . . . . . . . . . 227 — 6Acquired (relocation) . . . . . . . . . . . . . . . . . . . . . . . . . . . . . . . . . . . . . . . . . . . . . . . — — 2Closed (operational) . . . . . . . . . . . . . . . . . . . . . . . . . . . . . . . . . . . . . . . . . . . . . . . (28) (29) (41)Closed (relocation). . . . . . . . . . . . . . . . . . . . . . . . . . . . . . . . . . . . . . . . . . . . . . . . . (7) (7) (14)
End of year . . . . . . . . . . . . . . . . . . . . . . . . . . . . . . . . . . . . . . . . . . . . . . . . . . . . . . . 2,640 2,424 2,435
Total food store square footage (in millions) . . . . . . . . . . . . . . . . . . . . . . . . . . . . 161 149 149
r e t u r N o N i N v e S t e d c a P i t a l
We calculate return on invested capital (“ROIC”) by dividing adjusted operating profit for the prior four quarters by the average invested capital. Adjusted operating profit is calculated by excluding certain items included in operating profit, and adding our LIFO charge, depreciation and amortization and rent. Average invested capital is calculated as the sum of (i) the average of our total assets, (ii) the average LIFO reserve, (iii) the average accumulated depreciation and amortization and (iv) a rent factor equal to total rent for the last four quarters multiplied by a factor of eight; minus (i) the average taxes receivable, (ii) the average trade accounts payable, (iii) the average accrued salaries and wages and (iv) the average other current liabilities. Averages are calculated for return on invested capital by adding the beginning balance of the first quarter and the ending balance of the fourth quarter, of the last four quarters, and dividing by two. We use a factor of eight for our total rent as we believe this is a common factor used by our investors and analysts. Harris

A-16
Teeter’s invested capital has been excluded from the calculation in 2013 due to the timing of the merger and the immaterial effect on operations as compared to the average invested capital. ROIC is a non-GAAP financial measure of performance. ROIC should not be reviewed in isolation or considered as a substitute for our financial results as reported in accordance with GAAP. ROIC is an important measure used by management to evaluate our investment returns on capital. Management believes ROIC is a useful metric to investors and analysts because it measures how effectively we are deploying our assets. All items included in the calculation of ROIC are GAAP measures, excluding certain adjustments to operating income.
Although ROIC is a relatively standard financial term, numerous methods exist for calculating a company’s ROIC. As a result, the method used by our management to calculate ROIC may differ from methods other companies use to calculate their ROIC. We urge you to understand the methods used by other companies to calculate their ROIC before comparing our ROIC to that of such other companies.
The following table provides a calculation of ROIC for 2013 and 2012 on a 52 week basis and excluding the assets and liabilities recorded at year end for Harris Teeter ($ in millions):
February 1, 2014
February 2, 2013
Return on Invested CapitalNumerator
Operating profit on a 53 week basis in fiscal year 2012. . . . . . . . . . . . . . . . . . . $ 2,725 $ 2,76453rd week operating profit adjustment . . . . . . . . . . . . . . . . . . . . . . . . . . . . . . . . — (100)LIFO charge. . . . . . . . . . . . . . . . . . . . . . . . . . . . . . . . . . . . . . . . . . . . . . . . . . . . . 52 55Depreciation . . . . . . . . . . . . . . . . . . . . . . . . . . . . . . . . . . . . . . . . . . . . . . . . . . . . 1,703 1,652Rent on a 53 week basis in fiscal year 2012 . . . . . . . . . . . . . . . . . . . . . . . . . . . . 613 62853rd week rent adjustment . . . . . . . . . . . . . . . . . . . . . . . . . . . . . . . . . . . . . . . . . — (12)2013 adjusted item . . . . . . . . . . . . . . . . . . . . . . . . . . . . . . . . . . . . . . . . . . . . . . . 16 —2012 adjusted items . . . . . . . . . . . . . . . . . . . . . . . . . . . . . . . . . . . . . . . . . . . . . . — (115)Adjusted operating profit . . . . . . . . . . . . . . . . . . . . . . . . . . . . . . . . . . . . . . . . . . $ 5,109 $ 4,872
DenominatorAverage total assets . . . . . . . . . . . . . . . . . . . . . . . . . . . . . . . . . . . . . . . . . . . . . . . $ 26,958 $ 24,044Average taxes receivable (1) . . . . . . . . . . . . . . . . . . . . . . . . . . . . . . . . . . . . . . . . (10) (22)Average LIFO reserve . . . . . . . . . . . . . . . . . . . . . . . . . . . . . . . . . . . . . . . . . . . . . 1,124 1,071Average accumulated depreciation and amortization. . . . . . . . . . . . . . . . . . . . . 14,991 14,051Average trade accounts payable . . . . . . . . . . . . . . . . . . . . . . . . . . . . . . . . . . . . . (4,683) (4,382)Average accrued salaries and wages . . . . . . . . . . . . . . . . . . . . . . . . . . . . . . . . . . (1,084) (1,061)Average other current liabilities (2) . . . . . . . . . . . . . . . . . . . . . . . . . . . . . . . . . . (2,544) (2,314)Adjustment for Harris Teeter (3) . . . . . . . . . . . . . . . . . . . . . . . . . . . . . . . . . . . . . (1,618) —Rent x 8. . . . . . . . . . . . . . . . . . . . . . . . . . . . . . . . . . . . . . . . . . . . . . . . . . . . . . . . 4,904 4,928Average invested capital . . . . . . . . . . . . . . . . . . . . . . . . . . . . . . . . . . . . . . . . . . . $ 38,038 $ 36,315
Return on Invested Capital . . . . . . . . . . . . . . . . . . . . . . . . . . . . . . . . . . . . . . . . . . . 13.43% 13.42%
(1) Taxes receivable were $18 as of February 1, 2014, $2 as of February 2, 2013 and $42 as of January 28, 2012.
(2) Other current liabilities included accrued income taxes of $92 as of February 1, 2014 and $128 as of February 2, 2013. As of January 28, 2012, other current liabilities did not include any accrued income taxes. Accrued income taxes are removed from other current liabilities in the calculation of average invested capital.
(3) Harris Teeter’s invested capital has been excluded from the calculation due to the timing of the merger and the immaterial effect on the operations as compared to the average invested capital.

A-17
c r i t i c a l a c c o u N t i N g P o l i c i e S
We have chosen accounting policies that we believe are appropriate to report accurately and fairly our operating results and financial position, and we apply those accounting policies in a consistent manner. Our significant accounting policies are summarized in Note 1 to the Consolidated Financial Statements.
The preparation of financial statements in conformity with GAAP requires us to make estimates and assumptions that affect the reported amounts of assets, liabilities, revenues, and expenses, and related disclosures of contingent assets and liabilities. We base our estimates on historical experience and other factors we believe to be reasonable under the circumstances, the results of which form the basis for making judgments about the carrying values of assets and liabilities that are not readily apparent from other sources. Actual results could differ from those estimates.
We believe that the following accounting policies are the most critical in the preparation of our financial statements because they involve the most difficult, subjective or complex judgments about the effect of matters that are inherently uncertain.
Self-Insurance Costs
We primarily are self-insured for costs related to workers’ compensation and general liability claims. The liabilities represent our best estimate, using generally accepted actuarial reserving methods, of the ultimate obligations for reported claims plus those incurred but not reported for all claims incurred through February 1, 2014. We establish case reserves for reported claims using case-basis evaluation of the underlying claim data and we update as information becomes known.
For both workers’ compensation and general liability claims, we have purchased stop-loss coverage to limit our exposure to any significant exposure on a per claim basis. We are insured for covered costs in excess of these per claim limits. We account for the liabilities for workers’ compensation claims on a present value basis utilizing a risk-adjusted discount rate. A 25 basis point decrease in our discount rate would increase our liability by approximately $2 million. General liability claims are not discounted.
The assumptions underlying the ultimate costs of existing claim losses are subject to a high degree of unpredictability, which can affect the liability recorded for such claims. For example, variability in inflation rates of health care costs inherent in these claims can affect the amounts realized. Similarly, changes in legal trends and interpretations, as well as a change in the nature and method of how claims are settled can affect ultimate costs. Our estimates of liabilities incurred do not anticipate significant changes in historical trends for these variables, and any changes could have a considerable effect on future claim costs and currently recorded liabilities.
Impairments of Long-Lived Assets
We monitor the carrying value of long-lived assets for potential impairment each quarter based on whether certain trigger events have occurred. These events include current period losses combined with a history of losses or a projection of continuing losses or a significant decrease in the market value of an asset. When a trigger event occurs, we perform an impairment calculation, comparing projected undiscounted cash flows, utilizing current cash flow information and expected growth rates related to specific stores, to the carrying value for those stores. If we identify impairment for long-lived assets to be held and used, we compare the assets’ current carrying value to the assets’ fair value. Fair value is determined based on market values or discounted future cash flows. We record impairment when the carrying value exceeds fair market value. With respect to owned property and equipment held for disposal, we adjust the value of the property and equipment to reflect recoverable values based on our previous efforts to dispose of similar assets and current economic conditions. We recognize impairment for the excess of the carrying value over the estimated fair market value, reduced by estimated direct costs of disposal. We recorded asset impairments in the normal course of business totaling $39 million in 2013, $18 million in 2012 and $37 million in 2011. We record costs to reduce the carrying value of long-lived assets in the Consolidated Statements of Operations as “Operating, general and administrative” expense.
A-18
The factors that most significantly affect the impairment calculation are our estimates of future cash flows. Our cash flow projections look several years into the future and include assumptions on variables such as inflation, the economy and market competition. Application of alternative assumptions and definitions, such as reviewing long-lived assets for impairment at a different level, could produce significantly different results.
Goodwill
Our goodwill totaled $2.1 billion as of February 1, 2014. We review goodwill for impairment in the fourth quarter of each year, and also upon the occurrence of triggering events. We perform reviews of each of our operating divisions and variable interest entities (collectively, our reporting units) that have goodwill balances. Fair value is determined using a multiple of earnings, or discounted projected future cash flows, and we compare fair value to the carrying value of a reporting unit for purposes of identifying potential impairment. We base projected future cash flows on management’s knowledge of the current operating environment and expectations for the future. If we identify potential for impairment, we measure the fair value of a reporting unit against the fair value of its underlying assets and liabilities, excluding goodwill, to estimate an implied fair value of the division’s goodwill. We recognize goodwill impairment for any excess of the carrying value of the division’s goodwill over the implied fair value.
In 2013, goodwill increased $901 million due to our merger with Harris Teeter which closed on January 28, 2014. For additional information related to the allocation of the Harris Teeter purchase price, refer to Note 2 to the Consolidated Financial Statements.
The annual evaluation of goodwill performed for our other reporting units during the fourth quarter of 2013, 2012 and 2011 did not result in impairment. Based on current and future expected cash flows, we believe goodwill impairments are not reasonably likely. A 10% reduction in fair value of our reporting units would not indicate a potential for impairment of our goodwill balance.
For additional information relating to our results of the goodwill impairment reviews performed during 2013, 2012 and 2011 see Note 3 to the Consolidated Financial Statements.
The impairment review requires the extensive use of management judgment and financial estimates. Application of alternative estimates and assumptions, such as reviewing goodwill for impairment at a different level, could produce significantly different results. The cash flow projections embedded in our goodwill impairment reviews can be affected by several factors such as inflation, business valuations in the market, the economy and market competition.
Store Closing Costs
We provide for closed store liabilities on the basis of the present value of the estimated remaining non-cancellable lease payments after the closing date, net of estimated subtenant income. We estimate the net lease liabilities using a discount rate to calculate the present value of the remaining net rent payments on closed stores. We usually pay closed store lease liabilities over the lease terms associated with the closed stores, which generally have remaining terms ranging from one to 20 years. Adjustments to closed store liabilities primarily relate to changes in subtenant income and actual exit costs differing from original estimates. We make adjustments for changes in estimates in the period in which the change becomes known. We review store closing liabilities quarterly to ensure that any accrued amount that is not a sufficient estimate of future costs, or that no longer is needed for its originally intended purpose, is adjusted to earnings in the proper period.
We estimate subtenant income, future cash flows and asset recovery values based on our experience and knowledge of the market in which the closed store is located, our previous efforts to dispose of similar assets and current economic conditions. The ultimate cost of the disposition of the leases and the related assets is affected by current real estate markets, inflation rates and general economic conditions.
We reduce owned stores held for disposal to their estimated net realizable value. We account for costs to reduce the carrying values of property, equipment and leasehold improvements in accordance with our policy on impairment of long-lived assets. We classify inventory write-downs in connection with store closings, if any, in “Merchandise costs.” We expense costs to transfer inventory and equipment from closed stores as they are incurred.
A-19
Post-Retirement Benefit Plans
We account for our defined benefit pension plans using the recognition and disclosure provisions of GAAP, which require the recognition of the funded status of retirement plans on the Consolidated Balance Sheet. We record, as a component of Accumulated Other Comprehensive Income (“AOCI”), actuarial gains or losses, prior service costs or credits and transition obligations that have not yet been recognized.
The determination of our obligation and expense for Company-sponsored pension plans and other post-retirement benefits is dependent upon our selection of assumptions used by actuaries in calculating those amounts. Those assumptions are described in Note 15 to the Consolidated Financial Statements and include, among others, the discount rate, the expected long-term rate of return on plan assets, average life expectancy and the rate of increases in compensation and health care costs. Actual results that differ from our assumptions are accumulated and amortized over future periods and, therefore, generally affect our recognized expense and recorded obligation in future periods. While we believe that our assumptions are appropriate, significant differences in our actual experience or significant changes in our assumptions, including the discount rate used and the expected return on plan assets, may materially affect our pension and other post-retirement obligations and our future expense. Note 15 to the Consolidated Financial Statements discusses the effect of a 1% change in the assumed health care cost trend rate on other post-retirement benefit costs and the related liability.
The objective of our discount rate assumptions was intended to reflect the rates at which the pension benefits could be effectively settled. In making this determination, we take into account the timing and amount of benefits that would be available under the plans. Our methodology for selecting the discount rates as of year-end 2013 and 2012 was to match the plan’s cash flows to that of a hypothetical bond portfolio whose cash flow from coupons and maturities match the plan’s projected benefit cash flows. The discount rates are the single rates that produce the same present value of cash flows. The selection of the 4.99% and 4.68% discount rates as of year-end 2013 for pension and other benefits, respectively, represents the hypothetical bond portfolio using bonds with an AA or better rating constructed with the assistance of an outside consultant. We utilized a discount rate of 4.29% and 4.11% as of year-end 2012 for pension and other benefits, respectively. A 100 basis point increase in the discount rate would decrease the projected pension benefit obligation as of February 1, 2014, by approximately $395.
To determine the expected rate of return on pension plan assets held by Kroger for 2013, we considered current and forecasted plan asset allocations as well as historical and forecasted rates of return on various asset categories. Due to the Harris Teeter merger occurring close to year end, the expected rate of return on pension plan assets acquired in the Harris Teeter merger did not affect our net periodic benefit cost in 2013. For 2013 and 2012, we assumed a pension plan investment return rate of 8.5%. Our pension plan’s average rate of return was 8.1% for the 10 calendar years ended December 31, 2013, net of all investment management fees and expenses. The value of all investments in our Company-sponsored defined benefit pension plans, excluding pension plan assets acquired in the Harris Teeter merger, during the calendar year ending December 31, 2013, net of investment management fees and expenses, increased 8.0%. For the past 20 years, our average annual rate of return has been 9.2%. Based on the above information and forward looking assumptions for investments made in a manner consistent with our target allocations, we believe an 8.5% rate of return assumption was reasonable for 2013 and 2012. See Note 15 to the Consolidated Financial Statements for more information on the asset allocations of pension plan assets.
Sensitivity to changes in the major assumptions used in the calculation of Kroger’s pension plan liabilities is illustrated below (in millions).
PercentagePoint Change
Projected BenefitObligation
Decrease/(Increase)Expense
Decrease/(Increase)
Discount Rate. . . . . . . . . . . . . . . . . . . . . . . . . . . . . +/- 1.0% $395/(477) $31/($36)Expected Return on Assets . . . . . . . . . . . . . . . . . . +/- 1.0% — $28/($28)

A-20
We contributed $100 million in 2013, $71 million in 2012 and $52 million in 2011 to our Company-sponsored defined benefit pension plans. We do not expect to make any contributions to Company-sponsored defined benefit pension plans in 2014. Among other things, investment performance of plan assets, the interest rates required to be used to calculate the pension obligations, and future changes in legislation, will determine the amounts of contributions.
We contributed and expensed $148 million in 2013, $140 million in 2012 and $130 million in 2011 to employee 401(k) retirement savings accounts. The 401(k) retirement savings account plans provide to eligible employees both matching contributions and automatic contributions from the Company based on participant contributions, plan compensation, and length of service.
Multi-Employer Pension Plans
We also contribute to various multi-employer pension plans based on obligations arising from collective bargaining agreements. These plans provide retirement benefits to participants based on their service to contributing employers. The benefits are paid from assets held in trust for that purpose. Trustees are appointed in equal number by employers and unions. The trustees typically are responsible for determining the level of benefits to be provided to participants as well as for such matters as the investment of the assets and the administration of the plans.
In the fourth quarter of 2011, we entered into a memorandum of understanding (“MOU”) with 14 locals of the UFCW that participated in four multi-employer pension funds. The MOU established a process that amended each of the collective bargaining agreements between Kroger and the UFCW locals under which we made contributions to these funds and consolidated the four multi-employer pension funds into one multi-employer pension fund.
Under the terms of the MOU, the locals of the UFCW agreed to a future pension benefit formula through 2021. We are designated as the named fiduciary of the new consolidated pension plan with sole investment authority over the assets. We committed to contribute sufficient funds to cover the actuarial cost of current accruals and to fund the pre-consolidation Unfunded Actuarial Accrued Liability (“UAAL”) that existed as of December 31, 2011, in a series of installments on or before March 31, 2018. At January 1, 2012, the UAAL was estimated to be $911 million (pre-tax). In accordance with GAAP, we expensed $911 million in 2011 related to the UAAL. The expense was based on a preliminary estimate of the contractual commitment. In 2012, we finalized the UAAL contractual commitment and recorded an adjustment that reduced our 2011 estimated commitment by $53 million (pre-tax). The final UAAL contractual commitment, at January 1, 2012, was $858 million (pre-tax). In the fourth quarter of 2011, we contributed $650 million to the consolidated multi-employer pension plan of which $600 million was allocated to the UAAL and $50 million was allocated to service and interest costs and expensed in 2011. In the fourth quarter of 2012, we contributed $258 million to the consolidated multi-employer pension plan to fully fund our UAAL contractual commitment. Future contributions will be dependent, among other things, on the investment performance of assets in the plan. The funding commitments under the MOU replace the prior commitments under the four existing funds to pay an agreed upon amount per hour worked by eligible employees.
We recognize expense in connection with these plans as contributions are funded or, in the case of the UFCW consolidated pension plan, when commitments are made, in accordance with GAAP. We made cash contributions to these plans of $228 million in 2013, $492 million in 2012 and $946 million in 2011. The cash contributions for 2012 and 2011 include our $258 million contribution in 2012 and our $650 million contribution in 2011 to the UFCW consolidated pension plan in the fourth quarter of each year.
Based on the most recent information available to us, we believe that the present value of actuarially accrued liabilities in most of the multi-employer plans to which we contribute substantially exceeds the value of the assets held in trust to pay benefits. We have attempted to estimate the amount by which these liabilities exceed the assets, (i.e., the amount of underfunding), as of December 31, 2013. Because Kroger is only one of a number of employers contributing to these plans, we also have attempted to estimate the ratio of Kroger’s contributions to the total of all contributions to these plans in a year as a way of assessing Kroger’s “share” of the underfunding. Nonetheless, the underfunding is not a direct obligation or liability of Kroger or of any employer except as noted above. As of December 31, 2013, we estimate that Kroger’s share of the

A-21
underfunding of multi-employer plans to which Kroger contributes was $1.6 billion, pre-tax, or $1.0 billion, after-tax. This represents a decrease in the estimated amount of underfunding of approximately $150 million, pre-tax, or $95 million, after-tax, as of December 31, 2013, compared to December 31, 2012. The decrease in the amount of underfunding is attributable to the increased returns on the assets held in the multi-employer plans during 2013. Our estimate is based on the most current information available to us including actuarial evaluations and other data (that include the estimates of others), and such information may be outdated or otherwise unreliable.
We have made and disclosed this estimate not because, except as noted above, this underfunding is a direct liability of Kroger. Rather, we believe the underfunding is likely to have important consequences. In 2013, excluding all payments to the UFCW consolidated pension plan and the pension plans that were consolidated into the UFCW consolidated pension plan, our contributions to these plans increased approximately 5% over the prior year and have grown at a compound annual rate of approximately 8% since 2008. In 2014, we expect to contribute approximately $250 million to multi-employer pension plans, subject to collective bargaining and capital market conditions. Excluding all payments to the UFCW consolidated pension plan and the pension plans that were consolidated into the UFCW consolidated pension plan, based on current market conditions, we expect increases in expense as a result of increases in multi-employer pension plan contributions over the next few years. Finally, underfunding means that, in the event we were to exit certain markets or otherwise cease making contributions to these funds, we could trigger a substantial withdrawal liability. Any adjustment for withdrawal liability will be recorded when it is probable that a liability exists and can be reasonably estimated, in accordance with GAAP.
The amount of underfunding described above is an estimate and could change based on contract negotiations, returns on the assets held in the multi-employer plans and benefit payments. The amount could decline, and Kroger’s future expense would be favorably affected, if the values of the assets held in the trust significantly increase or if further changes occur through collective bargaining, trustee action or favorable legislation. On the other hand, Kroger’s share of the underfunding could increase and Kroger’s future expense could be adversely affected if the asset values decline, if employers currently contributing to these funds cease participation or if changes occur through collective bargaining, trustee action or adverse legislation. The Company continues to evaluate our potential exposure to under-funded multi-employer pension plans. Although these liabilities are not a direct obligation or liability of Kroger, any commitments to fund certain multi-employer plans will be expensed when our commitment is probable and an estimate can be made.
See Note 16 to the Consolidated Financial Statements for more information relating to our participation in these multi-employer pension plans.
Deferred Rent
We recognize rent holidays, including the time period during which we have access to the property for construction of buildings or improvements, as well as construction allowances and escalating rent provisions on a straight-line basis over the term of the lease. The deferred amount is included in Other Current Liabilities and Other Long-Term Liabilities on the Consolidated Balance Sheets.
Uncertain Tax Positions
We review the tax positions taken or expected to be taken on tax returns to determine whether and to what extent a benefit can be recognized in our consolidated financial statements. Refer to Note 5 to the Consolidated Financial Statements for the amount of unrecognized tax benefits and other related disclosures related to uncertain tax positions.
Various taxing authorities periodically audit our income tax returns. These audits include questions regarding our tax filing positions, including the timing and amount of deductions and the allocation of income to various tax jurisdictions. In evaluating the exposures connected with these various tax filing positions, including state and local taxes, we record allowances for probable exposures. A number of years may elapse before a particular matter, for which an allowance has been established, is audited and fully resolved. As of

A-22
February 1, 2014, the Internal Revenue Service had concluded its field examination of our 2008 and 2009 federal tax returns. We have filed an administrative appeal with the Internal Revenue Service protesting certain adjustments proposed by the Internal Revenue Service as a result of their field work.
The assessment of our tax position relies on the judgment of management to estimate the exposures associated with our various filing positions.
Share-Based Compensation Expense
We account for stock options under the fair value recognition provisions of GAAP. Under this method, we recognize compensation expense for all share-based payments granted. We recognize share-based compensation expense, net of an estimated forfeiture rate, over the requisite service period of the award. In addition, we record expense for restricted stock awards in an amount equal to the fair market value of the underlying stock on the grant date of the award, over the period the award restrictions lapse.
Inventories
Inventories are stated at the lower of cost (principally on a LIFO basis) or market. In total, approximately 95% of inventories in 2013 and 96% of inventories in 2012 were valued using the LIFO method. Cost for the balance of the inventories, including substantially all fuel inventories, was determined using the FIFO method. Replacement cost was higher than the carrying amount by $1.2 billion at February 1, 2014 and by $1.1 billion at February 2, 2013. We follow the Link-Chain, Dollar-Value LIFO method for purposes of calculating our LIFO charge or credit.
We follow the item-cost method of accounting to determine inventory cost before the LIFO adjustment for substantially all store inventories at our supermarket divisions. This method involves counting each item in inventory, assigning costs to each of these items based on the actual purchase costs (net of vendor allowances and cash discounts) of each item and recording the cost of items sold. The item-cost method of accounting allows for more accurate reporting of periodic inventory balances and enables management to more precisely manage inventory. In addition, substantially all of our inventory consists of finished goods and is recorded at actual purchase costs (net of vendor allowances and cash discounts).
We evaluate inventory shortages throughout the year based on actual physical counts in our facilities. We record allowances for inventory shortages based on the results of recent physical counts to provide for estimated shortages from the last physical count to the financial statement date.
Vendor Allowances
We recognize all vendor allowances as a reduction in merchandise costs when the related product is sold. In most cases, vendor allowances are applied to the related product cost by item, and therefore reduce the carrying value of inventory by item. When it is not practicable to allocate vendor allowances to the product by item, we recognize vendor allowances as a reduction in merchandise costs based on inventory turns and as the product is sold. We recognized approximately $6.2 billion in 2013 and 2012 and $5.9 billion in 2011 of vendor allowances as a reduction in merchandise costs. We recognized approximately 94% of all vendor allowances in the item cost with the remainder being based on inventory turns.
r e c e N t l y a d o P t e d a c c o u N t i N g S t a N d a r d S
In February 2013, the FASB amended its standards on comprehensive income by requiring disclosure of information about amounts reclassified out of accumulated other comprehensive income (“AOCI”) by component. Specifically, the amendment requires disclosure of the effect of significant reclassifications out of AOCI on the respective line items in net income in which the item was reclassified if the amount being reclassified is required to be reclassified to net income in its entirety in the same reporting period. It requires cross reference to other disclosures that provide additional detail for amounts that are not required to be reclassified in their entirety in the same reporting period. This new disclosure became effective for us beginning February 3, 2013, and is being adopted prospectively in accordance with the standard. See Note 9 to the Company’s Consolidated Financial Statements for the Company’s new disclosures related to this amended standard.

A-23
In December 2011, the FASB amended its standards related to offsetting assets and liabilities. This amendment requires entities to disclose both gross and net information about certain instruments and transactions eligible for offset in the statement of financial position and certain instruments and transactions subject to an agreement similar to a master netting agreement. This information is intended to enable users of the financial statements to understand the effect of these arrangements on our financial position. The new rules became effective for us on February 3, 2013. In January 2013, the FASB further amended this standard to limit its scope to derivatives, repurchase and reverse repurchase agreements, securities borrowings and lending transactions. See Note 7 to the Company’s Consolidated Financial Statements for the Company’s new disclosures related to this amended standard.
r e c e N t l y i S S u e d a c c o u N t i N g S t a N d a r d S
In July 2013, the FASB amended Accounting Standards Codification (“ASC”) 740, “Income Taxes.” The amendments provide guidance on the financial statement presentation of an unrecognized tax benefit, as either a reduction of a deferred tax asset or as a liability, when a net operating loss carryforward, similar tax loss, or a tax credit carryforward exists. The amendments will be effective for interim and annual periods beginning after December 15, 2013 and may be applied on a retrospective basis. Early adoption is permitted. We do not expect the adoption of these amendments to have a significant effect on our consolidated financial position or results of operations.
l i q u i d i t y a N d c a P i t a l r e S o u r c e S
Cash Flow Information
Net cash provided by operating activities
We generated $3.4 billion of cash from operations in 2013, compared to $2.8 billion in 2012 and $2.7 billion in 2011. The cash provided by operating activities came from net earnings including non-controlling interests adjusted primarily for non-cash expenses of depreciation and amortization, the LIFO charge and changes in working capital. The increase in net cash provided by operating activities in 2013, compared to 2012, resulted primarily due to changes in working capital and long-term liabilities. The increase in net cash provided by operating activities in 2012, compared to 2011, resulted primarily due to an increase in net earnings including non-controlling interests, offset by a decline in long-term liabilities and changes in working capital.
The use of cash for the payment of long-term liabilities decreased in 2013, as compared to 2012, primarily due to our funding of the remaining UAAL in 2012. The use of cash increased in 2012, as compared to 2011, primarily due to our funding of the remaining UAAL commitment. Changes in working capital used cash from operating activities of $130 million in 2013, compared to $332 million in 2012 and $300 million in 2011. The decreased use of cash for changes in working capital in 2013, compared to 2012, was primarily due to a decrease in deposits in-transit and a reduced use of cash for prepaid expenses and receivables. The increased use of cash for changes in working capital in 2012, compared to 2011, was primarily due to an increased use of cash for prepaid expenses and less cash provided by accrued expenses, partially offset by a reduced use of cash for inventories. Cash used for prepaid expenses increased in 2012, compared to 2011, due to Kroger prefunding $250 million of employee benefits at the end of 2012. These amounts are also net of cash contributions to our Company-sponsored defined benefit pension plans totaling $100 million in 2013, $71 million in 2012 and $52 million in 2011.
The amount of cash paid for income taxes increased in 2013, compared to 2012, primarily due to additional deductions taken in 2012 related to the funding of our pension contributions and union health benefits. The amount of cash paid for income taxes increased in 2012, compared to 2011, primarily due to an increase in net earnings including non-controlling interests.

A-24
Net cash used by investing activities
Cash used by investing activities was $4.8 billion in 2013, compared to $2.2 billion in 2012 and $1.9 billion in 2011. The amount of cash used by investing activities increased in 2013, compared to 2012, due to increased payments for capital investments and acquisitions. The amount of cash used by investing activities increased in 2012, compared to 2011, due to increased payments for capital investments and acquisitions. Capital investments, including changes in construction-in-progress payables and excluding acquisitions, were $2.4 billion in 2013, $2.1 billion in 2012 and $2.0 billion in 2011. Acquisitions were $2.3 billion in 2013, $122 million in 2012 and $51 million in 2011. The increase in payments for acquisitions in 2013, compared to 2012 was primarily due to our merger with Harris Teeter. Refer to the “Capital Investments” section for an overview of our supermarket storing activity during the last three years.
Net cash used by financing activities
Financing activities provided (used) cash of $1.6 billion in 2013, ($600) million in 2012 and ($1.4) billion in 2011. The increase in cash provided by financing activities in 2013, compared to 2012, was primarily related to increased proceeds from the issuance of long-term debt, primarily to finance our merger with Harris Teeter, and a reduction in payments on long-term debt and treasury stock purchases, offset partially by net payments on our commercial paper program. The decrease in the amount of cash used for financing activities in 2012, compared to 2011, was primarily related to increased proceeds from the issuance of long-term debt and net borrowings from our commercial paper program, offset partially by payments on long-term debt. Proceeds from the issuance of long-term debt were $3.5 billion in 2013, $863 million in 2012 and $453 million in 2011. Proceeds (payments) provided from our commercial paper program were ($395) million in 2013, $1.3 billion in 2012 and $370 million in 2011. Please refer to the “Debt Management” section for additional information. We repurchased $609 million of Kroger common shares in 2013, compared to $1.3 billion in 2012 and $1.5 billion in 2011. We paid dividends totaling $319 million in 2013, $267 million in 2012 and $257 million in 2011.
Debt Management
Total debt, including both the current and long-term portions of capital lease and lease-financing obligations increased $2.4 billion to $11.3 billion as of year-end 2013, compared to 2012. The increase in 2013, compared to 2012, resulted from the issuance of (i) $600 million of senior notes bearing an interest rate of 3.85%, (ii) $400 million of senior notes bearing an interest rate of 5.15%, (iii) $500 million of senior notes bearing an interest rate of 3-month London Inter-Bank Offering Rate (“LIBOR”) plus 53 basis points, (iv) $300 million of senior notes bearing an interest rate of 1.2%, (v) $500 million of senior notes bearing an interest rate of 2.3%, (vi) $700 million of senior notes bearing an interest rate of 3.3%, and (vii) $500 million of senior notes bearing an interest rate of 4.0%, offset partially by a reduction in commercial paper of $395 million and payments at maturity of $400 million of senior notes bearing an interest rate of 5.0% and $600 million of senior notes bearing an interest rate of 7.5%. This increase in financing obligations was due to partially funding our merger with Harris Teeter, refinancing our debt maturities in 2013 and replacing the senior notes that matured in fourth quarter of 2012, offset partially by the payment at maturity of our $400 million of senior notes bearing an interest rate of 5.0%, $600 million of senior notes bearing an interest rate of 7.5% and a reduction in commercial paper of $395 million.
Total debt, including both the current and long-term portions of capital leases and lease-financing obligations increased $714 million to $8.9 billion as of year-end 2012, compared to 2011. The increase in 2012, compared to 2011, resulted from increased borrowings of $1.3 billion of commercial paper supported by our credit facility and the issuance of (i) $500 million of senior notes bearing an interest rate of 3.4% and (ii) $350 million of senior notes bearing an interest rate of 5.0%, offset partially by payments at maturity of (i) $491 million of senior notes bearing an interest rate of 6.75%, (ii) $346 million of senior notes bearing an interest rate of 6.2% and (iii) $500 million of senior notes bearing an interest rate of 5.5%. This increase in financing obligations was primarily to fund our $258 million UFCW consolidated pension plan contribution in the fourth quarter of 2012, prefunding $250 million of employee benefit costs at the end of 2012, to repurchase common shares, pay at maturity $500 million of senior notes bearing an interest rate of 5.5% and purchase of a specialty pharmacy.

A-25
Liquidity Needs
We estimate our liquidity needs over the next twelve-month period to be approximately $4.5 billion, which includes anticipated requirements for working capital, capital expenditures, interest payments and scheduled principal payments of debt and commercial paper, offset by cash and temporary cash investments on hand at the end of 2013. Based on current operating trends, we believe that cash flows from operating activities and other sources of liquidity, including borrowings under our commercial paper program and bank credit facility, will be adequate to meet our liquidity needs for the next twelve months and for the foreseeable future beyond the next twelve months. We have approximately $1.2 billion of commercial paper and $300 million of senior notes maturing in the next twelve months, which is included in the $4.5 billion in estimated liquidity needs. We expect to refinance this debt, in 2014, by issuing additional senior notes or commercial paper on favorable terms based on our past experience. We also currently plan to continue repurchases of common shares under the Company’s share repurchase programs. We may use our commercial paper program to fund debt maturities during 2014 but do not currently expect to use the program permanently. We believe we have adequate coverage of our debt covenants to continue to maintain our current debt ratings and to respond effectively to competitive conditions.
Factors Affecting Liquidity
We can currently borrow on a daily basis approximately $2 billion under our commercial paper (“CP”) program. At February 1, 2014, we had $1.2 billion of CP borrowings outstanding. CP borrowings are backed by our credit facility, and reduce the amount we can borrow under the credit facility. If our short-term credit ratings fall, the ability to borrow under our current CP program could be adversely affected for a period of time and increase our interest cost on daily borrowings under our CP program. This could require us to borrow additional funds under the credit facility, under which we believe we have sufficient capacity. However, in the event of a ratings decline, we do not anticipate that our borrowing capacity under our CP program would be any lower than $500 million on a daily basis. Although our ability to borrow under the credit facility is not affected by our credit rating, the interest cost on borrowings under the credit facility could be affected by an increase in our Leverage Ratio. As of March 28, 2014, we had $665 million of CP borrowings outstanding. The decrease as of March 28, 2014, compared to year-end 2013, was due to applying cash from operations against our year-end CP outstanding borrowings.
Our credit facility requires the maintenance of a Leverage Ratio and a Fixed Charge Coverage Ratio (our “financial covenants”). A failure to maintain our financial covenants would impair our ability to borrow under the credit facility. These financial covenants and ratios are described below:
• OurLeverageRatio(theratioofNetDebttoConsolidatedEBITDA,asdefinedinthecreditfacility)was2.30 to 1 as of February 1, 2014. If this ratio were to exceed 3.50 to 1, we would be in default of our credit facility and our ability to borrow under the facility would be impaired. In addition, our Applicable Margin on borrowings is determined by our Leverage Ratio.
• OurFixedChargeCoverageRatio(theratioofConsolidatedEBITDAplusConsolidatedRentalExpensetoConsolidated Cash Interest Expense plus Consolidated Rental Expense, as defined in the credit facility) was 4.83 to 1 as of February 1, 2014. If this ratio fell below 1.70 to 1, we would be in default of our credit facility and our ability to borrow under the facility would be impaired.
Our credit agreement is more fully described in Note 6 to the Consolidated Financial Statements. We were in compliance with our financial covenants at year-end 2013.
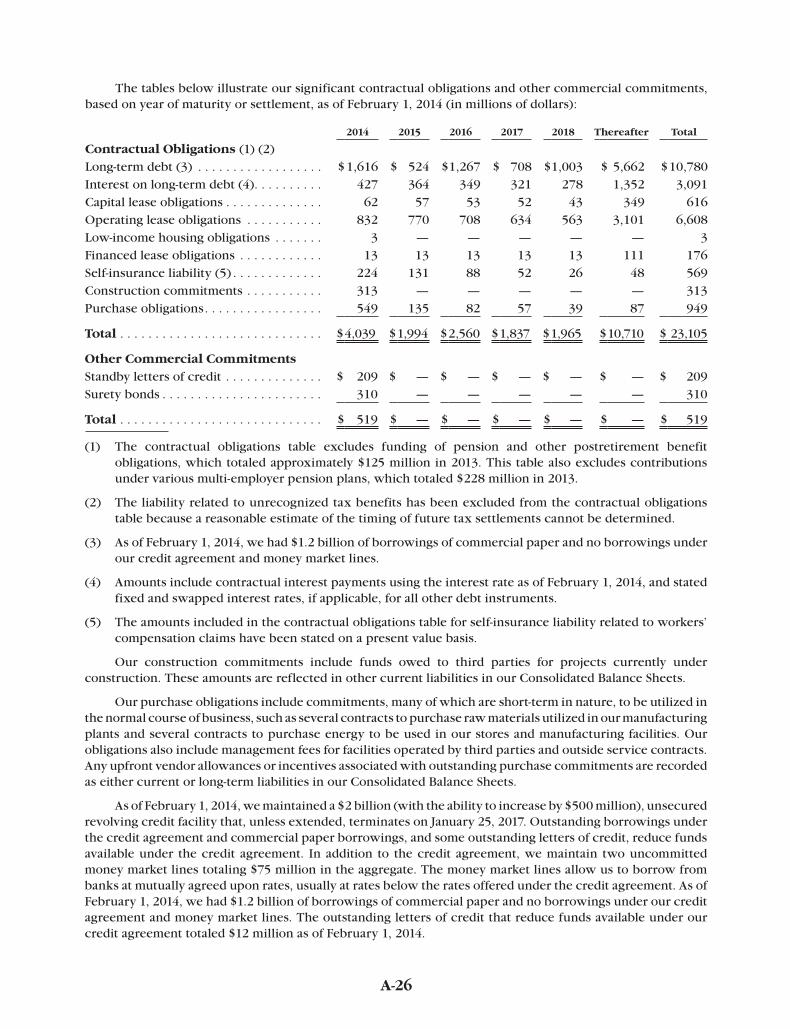
A-26
The tables below illustrate our significant contractual obligations and other commercial commitments, based on year of maturity or settlement, as of February 1, 2014 (in millions of dollars):
2014 2015 2016 2017 2018 Thereafter Total
Contractual Obligations (1) (2)Long-term debt (3) . . . . . . . . . . . . . . . . . . $1,616 $ 524 $1,267 $ 708 $1,003 $ 5,662 $10,780Interest on long-term debt (4). . . . . . . . . . 427 364 349 321 278 1,352 3,091Capital lease obligations . . . . . . . . . . . . . . 62 57 53 52 43 349 616Operating lease obligations . . . . . . . . . . . 832 770 708 634 563 3,101 6,608Low-income housing obligations . . . . . . . 3 — — — — — 3Financed lease obligations . . . . . . . . . . . . 13 13 13 13 13 111 176Self-insurance liability (5) . . . . . . . . . . . . . 224 131 88 52 26 48 569Construction commitments . . . . . . . . . . . 313 — — — — — 313Purchase obligations . . . . . . . . . . . . . . . . . 549 135 82 57 39 87 949
Total . . . . . . . . . . . . . . . . . . . . . . . . . . . . . $4,039 $1,994 $2,560 $1,837 $1,965 $10,710 $ 23,105
Other Commercial CommitmentsStandby letters of credit . . . . . . . . . . . . . . $ 209 $ — $ — $ — $ — $ — $ 209Surety bonds . . . . . . . . . . . . . . . . . . . . . . . 310 — — — — — 310
Total . . . . . . . . . . . . . . . . . . . . . . . . . . . . . $ 519 $ — $ — $ — $ — $ — $ 519
(1) The contractual obligations table excludes funding of pension and other postretirement benefit obligations, which totaled approximately $125 million in 2013. This table also excludes contributions under various multi-employer pension plans, which totaled $228 million in 2013.
(2) The liability related to unrecognized tax benefits has been excluded from the contractual obligations table because a reasonable estimate of the timing of future tax settlements cannot be determined.
(3) As of February 1, 2014, we had $1.2 billion of borrowings of commercial paper and no borrowings under our credit agreement and money market lines.
(4) Amounts include contractual interest payments using the interest rate as of February 1, 2014, and stated fixed and swapped interest rates, if applicable, for all other debt instruments.
(5) The amounts included in the contractual obligations table for self-insurance liability related to workers’ compensation claims have been stated on a present value basis.
Our construction commitments include funds owed to third parties for projects currently under construction. These amounts are reflected in other current liabilities in our Consolidated Balance Sheets.
Our purchase obligations include commitments, many of which are short-term in nature, to be utilized in the normal course of business, such as several contracts to purchase raw materials utilized in our manufacturing plants and several contracts to purchase energy to be used in our stores and manufacturing facilities. Our obligations also include management fees for facilities operated by third parties and outside service contracts. Any upfront vendor allowances or incentives associated with outstanding purchase commitments are recorded as either current or long-term liabilities in our Consolidated Balance Sheets.
As of February 1, 2014, we maintained a $2 billion (with the ability to increase by $500 million), unsecured revolving credit facility that, unless extended, terminates on January 25, 2017. Outstanding borrowings under the credit agreement and commercial paper borrowings, and some outstanding letters of credit, reduce funds available under the credit agreement. In addition to the credit agreement, we maintain two uncommitted money market lines totaling $75 million in the aggregate. The money market lines allow us to borrow from banks at mutually agreed upon rates, usually at rates below the rates offered under the credit agreement. As of February 1, 2014, we had $1.2 billion of borrowings of commercial paper and no borrowings under our credit agreement and money market lines. The outstanding letters of credit that reduce funds available under our credit agreement totaled $12 million as of February 1, 2014.
A-27
In addition to the available credit mentioned above, as of February 1, 2014, we had authorized for issuance $2.5 billion of securities under a shelf registration statement filed with the SEC and effective on December 13, 2013.
We also maintain surety bonds related primarily to our self-insured workers’ compensation claims. These bonds are required by most states in which we are self-insured for workers’ compensation and are placed with predominately third-party insurance providers to insure payment of our obligations in the event we are unable to meet our claim payment obligations up to our self-insured retention levels. These bonds do not represent liabilities of Kroger, as we already have reserves on our books for the claims costs. Market changes may make the surety bonds more costly and, in some instances, availability of these bonds may become more limited, which could affect our costs of, or access to, such bonds. Although we do not believe increased costs or decreased availability would significantly affect our ability to access these surety bonds, if this does become an issue, we would issue letters of credit, in states where allowed, against our credit facility to meet the state bonding requirements. This could increase our cost and decrease the funds available under our credit facility.
We also are contingently liable for leases that have been assigned to various third parties in connection with facility closings and dispositions. We could be required to satisfy obligations under the leases if any of the assignees are unable to fulfill their lease obligations. Due to the wide distribution of our assignments among third parties, and various other remedies available to us, we believe the likelihood that we will be required to assume a material amount of these obligations is remote. We have agreed to indemnify certain third-party logistics operators for certain expenses, including pension trust fund contribution obligations and withdrawal liabilities.
In addition to the above, we enter into various indemnification agreements and take on indemnification obligations in the ordinary course of business. Such arrangements include indemnities against third party claims arising out of agreements to provide services to Kroger; indemnities related to the sale of our securities; indemnities of directors, officers and employees in connection with the performance of their work; and indemnities of individuals serving as fiduciaries on benefit plans. While Kroger’s aggregate indemnification obligation could result in a material liability, we are not aware of any current matter that could result in a material liability.
o u t l o o k
This discussion and analysis contains certain forward-looking statements about Kroger’s future performance, including Harris Teeter. These statements are based on management’s assumptions and beliefs in light of the information currently available. Such statements are indicated by words such as “comfortable,” “committed,” “will,” “expect,” “goal,” “should,” “intend,” “target,” “believe,” “anticipate,” “plan,” and similar words or phrases. These forward-looking statements are subject to uncertainties and other factors that could cause actual results to differ materially.
Statements elsewhere in this report and below regarding our expectations, projections, beliefs, intentions or strategies are forward-looking statements within the meaning of Section 21E of the Securities Exchange Act of 1934. While we believe that the statements are accurate, uncertainties about the general economy, our labor relations, our ability to execute our plans on a timely basis and other uncertainties described below could cause actual results to differ materially.
• Weexpectnetearningsperdilutedshareintherangeof$3.14-$3.25forfiscalyear2014.
• In2014,weexpectnetearningsperdilutedsharegrowthof10–14%,whichincludestheexpectedaccretion to net earnings from the Harris Teeter merger. Thereafter, we would expect to return to our 8 – 11% long-term growth rate.
• Weexpectidenticalsupermarketsalesgrowth,excludingfuelsales,of2.5%-3.5%infiscalyear2014.
• We expect full-year FIFO non-fuel operatingmargin for 2014 to expand slightly compared to 2013,excluding the 2013 adjusted items.
• For2014,weexpectourannualizedLIFOchargetobeapproximately$55million.

A-28
• For2014,weexpectinterestexpensetobeapproximately$490million.
• Weplantousecashflowprimarilyforcapitalinvestments,toimproveourcurrentdebtcoverageratios,to pay cash dividends and to repurchase stock.
• Weexpecttoobtainsalesgrowthfromnewsquarefootage,aswellasfromincreasedproductivityfromexisting locations.
• We expect capital investments for 2014 to increase to approximately $2.8 - $3.0 billion, excludingmergers, acquisitions and purchases of leased facilities. We also expect capital investments to increase incrementally $200 million each year over the next few years, excluding mergers, acquisitions and purchases of leased facilities, to accomplish our strategy. We expect total food store square footage for 2014 to grow approximately 1.8% before mergers, acquisitions and operational closings.
• For2014,weexpectoureffectivetaxratetobeapproximately35.0%,excludingtheunexpectedeffectof the resolution of any tax issues and benefits from certain tax items.
• Wedonotanticipategoodwillimpairmentsin2014.
• For2014,weexpect tocontribute approximately$250million tomulti-employerpension funds.Wecontinue to evaluate our potential exposure to under-funded multi-employer pension plans. Although these liabilities are not a direct obligation or liability of Kroger, any commitments to fund certain multi-employer plans will be expensed when our commitment is probable and an estimate can be made.
• In2014,wewillnegotiateagreementswiththeUFCWforstoreassociatesinCincinnati,Atlanta,SouthernCalifornia, New Mexico, Richmond/Hampton Roads, West Virginia and Arizona, and an agreement with the Teamsters covering several distribution and manufacturing facilities. These negotiations will be challenging, as we must have competitive cost structures in each market while meeting our associates’ needs for good wages and affordable health care. Also, we must address the underfunding of multi-employer pension plans.
Various uncertainties and other factors could cause actual results to differ materially from those contained in the forward-looking statements. These include:
• Theextenttowhichoursourcesofliquidityaresufficienttomeetourrequirementsmaybeaffectedbythe state of the financial markets and the effect that such condition has on our ability to issue commercial paper at acceptable rates. Our ability to borrow under our committed lines of credit, including our bank credit facilities, could be impaired if one or more of our lenders under those lines is unwilling or unable to honor its contractual obligation to lend to us, or in the event that natural disasters or weather conditions interfere with the ability of our lenders to lend to us. Our ability to refinance maturing debt may be affected by the state of the financial markets.
• Ourabilitytousecashflowtocontinuetomaintainourinvestmentgradedebtratingandrepurchaseshares, pay dividends and fund capital investments, could be affected by unanticipated increases in net total debt, our inability to generate cash flow at the levels anticipated, and our failure to generate expected earnings.
• Our ability to achieve sales, earnings and cash flowgoalsmaybe affectedby: labor negotiations ordisputes; changes in the types and numbers of businesses that compete with us; pricing and promotional activities of existing and new competitors, including non-traditional competitors, and the aggressiveness of that competition; our response to these actions; the state of the economy, including interest rates, the inflationary and deflationary trends in certain commodities, and the unemployment rate; the effect that fuel costs have on consumer spending; changes in government-funded benefit programs; manufacturing commodity costs; diesel fuel costs related to our logistics operations; trends in consumer spending; the extent to which our customers exercise caution in their purchasing in response to economic conditions; the inconsistent pace of the economic recovery; changes in inflation or deflation in product and operating costs; stock repurchases; the effect of brand prescription drugs going off patent; our ability to retain additional pharmacy sales from third party payors; natural disasters or adverse weather conditions; the success of our future growth plans; and the successful integration of Harris Teeter. The

A-29
extent to which the adjustments we are making to our strategy create value for our shareholders will depend primarily on the reaction of our customers and our competitors to these adjustments, as well as operating conditions, including inflation or deflation, increased competitive activity, and cautious spending behavior of our customers. Our ability to achieve sales and earnings goals may also be affected by our ability to manage the factors identified above.
• Duringthefirstthreequartersofourfiscalyear,ourLIFOchargeandtherecognitionofLIFOexpensewill be affected primarily by estimated year-end changes in product costs. Our LIFO charge for the fiscal year will be affected primarily by changes in product costs at year-end.
• Ifactualresultsdiffersignificantlyfromanticipatedfutureresultsforcertainreportingunitsincludingvariable interest entities, an impairment loss for any excess of the carrying value of the reporting units’ goodwill over the implied fair value would have to be recognized.
• Oureffectivetaxratemaydifferfromtheexpectedrateduetochangesinlaws,thestatusofpendingitems with various taxing authorities, and the deductibility of certain expenses.
• The actual amount of automatic andmatching cash contributions to our 401(k) Retirement SavingsAccount Plan will depend on the number of participants, savings rate, compensation as defined by the plan, and length of service of participants.
• Changesinourproductmixmaynegativelyaffectcertainfinancialindicators.Forexample,wecontinueto add supermarket fuel centers to our store base. Since gasoline generates low profit margins, we expect to see our FIFO gross profit margins decline as gasoline sales increase.
We cannot fully foresee the effects of changes in economic conditions on Kroger’s business. We have assumed economic and competitive situations will not change significantly in 2014.
Other factors and assumptions not identified above could also cause actual results to differ materially from those set forth in the forward-looking information. Accordingly, actual events and results may vary significantly from those included in, contemplated or implied by forward-looking statements made by us or our representatives. We undertake no obligation to update the forward-looking information contained in this filing.

A-30
r e P o r t o F i N d e P e N d e N t r e g i S t e r e d P u B l i c a c c o u N t i N g F i r M
To the Shareowners and Board of Directors of The Kroger Co.
In our opinion, the accompanying consolidated balance sheets and the related consolidated statements of operations, comprehensive income, cash flows and changes in shareowners’ equity present fairly, in all material respects, the financial position of The Kroger Co. and its subsidiaries at February 1, 2014 and February 2, 2013, and the results of their operations and their cash flows for each of the three years in the period ended February 1, 2014 in conformity with accounting principles generally accepted in the United States of America. Also in our opinion, the Company maintained, in all material respects, effective internal control over financial reporting as of February 1, 2014, based on criteria established in Internal Control - Integrated Framework (1992) issued by the Committee of Sponsoring Organizations of the Treadway Commission (COSO). The Company’s management is responsible for these financial statements, for maintaining effective internal control over financial reporting and for its assessment of the effectiveness of internal control over financial reporting, included in Management’s Report on Internal Control over Financial Reporting appearing under Item 9A. Our responsibility is to express opinions on these financial statements and on the Company’s internal control over financial reporting based on our integrated audits. We conducted our audits in accordance with the standards of the Public Company Accounting Oversight Board (United States). Those standards require that we plan and perform the audits to obtain reasonable assurance about whether the financial statements are free of material misstatement and whether effective internal control over financial reporting was maintained in all material respects. Our audits of the financial statements included examining, on a test basis, evidence supporting the amounts and disclosures in the financial statements, assessing the accounting principles used and significant estimates made by management, and evaluating the overall financial statement presentation. Our audit of internal control over financial reporting included obtaining an understanding of internal control over financial reporting, assessing the risk that a material weakness exists, and testing and evaluating the design and operating effectiveness of internal control based on the assessed risk. Our audits also included performing such other procedures as we considered necessary in the circumstances. We believe that our audits provide a reasonable basis for our opinions.
A company’s internal control over financial reporting is a process designed to provide reasonable assurance regarding the reliability of financial reporting and the preparation of financial statements for external purposes in accordance with generally accepted accounting principles. A company’s internal control over financial reporting includes those policies and procedures that (i) pertain to the maintenance of records that, in reasonable detail, accurately and fairly reflect the transactions and dispositions of the assets of the company; (ii) provide reasonable assurance that transactions are recorded as necessary to permit preparation of financial statements in accordance with generally accepted accounting principles, and that receipts and expenditures of the company are being made only in accordance with authorizations of management and directors of the company; and (iii) provide reasonable assurance regarding prevention or timely detection of unauthorized acquisition, use, or disposition of the company’s assets that could have a material effect on the financial statements.
Because of its inherent limitations, internal control over financial reporting may not prevent or detect misstatements. Also, projections of any evaluation of effectiveness to future periods are subject to the risk that controls may become inadequate because of changes in conditions, or that the degree of compliance with the policies or procedures may deteriorate.

A-31
As described in Management’s Report on Internal Control Over Financial Reporting, management has excluded Harris Teeter Supermarkets, Inc. from its assessment of internal control over financial reporting as of February 1, 2014 because it was acquired by the Company in a purchase business combination on January 28, 2014. We have also excluded Harris Teeter Supermarkets, Inc. from our audit of internal control over financial reporting. Harris Teeter Supermarkets, Inc. is a wholly-owned subsidiary whose total assets and total revenues represent 12% and less than 1%, respectively, of the related consolidated financial statement amounts as of and for the year ended February 1, 2014.
Cincinnati, Ohio April 1, 2014

A-32
T H E K R O G E R C O .
c o N S o l i d a t e d B a l a N c e S h e e t S
(In millions, except par values)February 1,
2014February 2,
2013
ASSETSCurrent assets
Cash and temporary cash investments � � � � � � � � � � � � � � � � � � � � � � � � � � � � � � � � � � � � � � � $ 401 $ 238
Store deposits in-transit� � � � � � � � � � � � � � � � � � � � � � � � � � � � � � � � � � � � � � � � � � � � � � � � � � � 958 955
Receivables � � � � � � � � � � � � � � � � � � � � � � � � � � � � � � � � � � � � � � � � � � � � � � � � � � � � � � � � � � � � 1,116 1,051
FIFO inventory � � � � � � � � � � � � � � � � � � � � � � � � � � � � � � � � � � � � � � � � � � � � � � � � � � � � � � � � � 6,801 6,244
LIFO reserve � � � � � � � � � � � � � � � � � � � � � � � � � � � � � � � � � � � � � � � � � � � � � � � � � � � � � � � � � � � (1,150) (1,098)
Prepaid and other current assets � � � � � � � � � � � � � � � � � � � � � � � � � � � � � � � � � � � � � � � � � � � 704 569
Total current assets � � � � � � � � � � � � � � � � � � � � � � � � � � � � � � � � � � � � � � � � � � � � � � � � � � � � 8,830 7,959
Property, plant and equipment, net � � � � � � � � � � � � � � � � � � � � � � � � � � � � � � � � � � � � � � � � � � 16,893 14,848
Intangibles, net � � � � � � � � � � � � � � � � � � � � � � � � � � � � � � � � � � � � � � � � � � � � � � � � � � � � � � � � � � 702 130
Goodwill � � � � � � � � � � � � � � � � � � � � � � � � � � � � � � � � � � � � � � � � � � � � � � � � � � � � � � � � � � � � � � � 2,135 1,234
Other assets � � � � � � � � � � � � � � � � � � � � � � � � � � � � � � � � � � � � � � � � � � � � � � � � � � � � � � � � � � � � � 721 463
Total Assets � � � � � � � � � � � � � � � � � � � � � � � � � � � � � � � � � � � � � � � � � � � � � � � � � � � � � � � � � � $29,281 $24,634
LIABILITIESCurrent liabilities
Current portion of long-term debt including obligations under capital leases and financing obligations � � � � � � � � � � � � � � � � � � � � � � � � � � � � � � � � � � � � � � � � � � � � � � � $ 1,657 $ 2,734
Trade accounts payable� � � � � � � � � � � � � � � � � � � � � � � � � � � � � � � � � � � � � � � � � � � � � � � � � � � 4,881 4,484
Accrued salaries and wages � � � � � � � � � � � � � � � � � � � � � � � � � � � � � � � � � � � � � � � � � � � � � � � 1,150 1,017
Deferred income taxes � � � � � � � � � � � � � � � � � � � � � � � � � � � � � � � � � � � � � � � � � � � � � � � � � � � 248 288
Other current liabilities� � � � � � � � � � � � � � � � � � � � � � � � � � � � � � � � � � � � � � � � � � � � � � � � � � � 2,769 2,538
Total current liabilities� � � � � � � � � � � � � � � � � � � � � � � � � � � � � � � � � � � � � � � � � � � � � � � � � � 10,705 11,061
Long-term debt including obligations under capital leases and financing obligationsFace-value of long-term debt including obligations under capital leases and
financing obligations � � � � � � � � � � � � � � � � � � � � � � � � � � � � � � � � � � � � � � � � � � � � � � � � � � � 9,654 6,141
Adjustment to reflect fair-value interest rate hedges � � � � � � � � � � � � � � � � � � � � � � � � � � � � (1) 4
Long-term debt including obligations under capital leases and financing obligations � � � 9,653 6,145
Deferred income taxes� � � � � � � � � � � � � � � � � � � � � � � � � � � � � � � � � � � � � � � � � � � � � � � � � � � � � 1,381 796
Pension and postretirement benefit obligations � � � � � � � � � � � � � � � � � � � � � � � � � � � � � � � � � 901 1,291
Other long-term liabilities � � � � � � � � � � � � � � � � � � � � � � � � � � � � � � � � � � � � � � � � � � � � � � � � � � 1,246 1,127
Total Liabilities � � � � � � � � � � � � � � � � � � � � � � � � � � � � � � � � � � � � � � � � � � � � � � � � � � � � � � � � 23,886 20,420
Commitments and contingencies (see Note 13)
SHAREOWNERS’ EQUITYPreferred shares, $100 par per share, 5 shares authorized and unissued� � � � � � � � � � � � � � — —Common shares, $1 par per share, 1,000 shares authorized;
959 shares issued in 2013 and 2012 � � � � � � � � � � � � � � � � � � � � � � � � � � � � � � � � � � � � � � � � 959 959Additional paid-in capital� � � � � � � � � � � � � � � � � � � � � � � � � � � � � � � � � � � � � � � � � � � � � � � � � � � 3,549 3,451Accumulated other comprehensive loss � � � � � � � � � � � � � � � � � � � � � � � � � � � � � � � � � � � � � � � (464) (753)Accumulated earnings � � � � � � � � � � � � � � � � � � � � � � � � � � � � � � � � � � � � � � � � � � � � � � � � � � � � � 10,981 9,787Common stock in treasury, at cost, 451 shares in 2013 and 445 shares in 2012 � � � � � � � � (9,641) (9,237)
Total Shareowners’ Equity - The Kroger Co�� � � � � � � � � � � � � � � � � � � � � � � � � � � � � � � � � � 5,384 4,207Noncontrolling interests � � � � � � � � � � � � � � � � � � � � � � � � � � � � � � � � � � � � � � � � � � � � � � � � � � � 11 7
Total Equity � � � � � � � � � � � � � � � � � � � � � � � � � � � � � � � � � � � � � � � � � � � � � � � � � � � � � � � � � � 5,395 4,214
Total Liabilities and Equity� � � � � � � � � � � � � � � � � � � � � � � � � � � � � � � � � � � � � � � � � � � � � � � $29,281 $24,634
The accompanying notes are an integral part of the consolidated financial statements�

A-33
T H E K R O G E R C O .
c o N S o l i d a t e d S t a t e M e N t S o F o P e r a t i o N S
Years Ended February 1, 2014, February 2, 2013 and January 28, 2012
(In millions, except per share amounts)2013
(52 weeks)2012
(53 weeks)2011
(52 weeks)
Sales � � � � � � � � � � � � � � � � � � � � � � � � � � � � � � � � � � � � � � � � � � � � � � � � � � � � � � � � � $98,375 $96,619 $90,269Merchandise costs, including advertising, warehousing, and
transportation, excluding items shown separately below� � � � � � � � � � � � � 78,138 76,726 71,389Operating, general and administrative � � � � � � � � � � � � � � � � � � � � � � � � � � � � � � 15,196 14,849 15,345Rent � � � � � � � � � � � � � � � � � � � � � � � � � � � � � � � � � � � � � � � � � � � � � � � � � � � � � � � � � 613 628 619Depreciation � � � � � � � � � � � � � � � � � � � � � � � � � � � � � � � � � � � � � � � � � � � � � � � � � � 1,703 1,652 1,638
Operating Profit � � � � � � � � � � � � � � � � � � � � � � � � � � � � � � � � � � � � � � � � � � � � � � 2,725 2,764 1,278Interest expense � � � � � � � � � � � � � � � � � � � � � � � � � � � � � � � � � � � � � � � � � � � � � � � 443 462 435
Earnings before income tax expense � � � � � � � � � � � � � � � � � � � � � � � � � � � � � � 2,282 2,302 843Income tax expense� � � � � � � � � � � � � � � � � � � � � � � � � � � � � � � � � � � � � � � � � � � � � 751 794 247
Net earnings including noncontrolling interests � � � � � � � � � � � � � � � � � � � � � 1,531 1,508 596Net earnings (loss) attributable to noncontrolling interests � � � � � � � � � � � � � 12 11 (6)
Net earnings attributable to The Kroger Co�� � � � � � � � � � � � � � � � � � � � � � � � � $ 1,519 $ 1,497 $ 602
Net earnings attributable to The Kroger Co� per basic common share� � � � � $ 2.93 $ 2�78 $ 1�01
Average number of common shares used in basic calculation � � � � � � � � � � � 514 533 590Net earnings attributable to The Kroger Co� per diluted common share � � � $ 2.90 $ 2�77 $ 1�01Average number of common shares used in diluted calculation � � � � � � � � � 520 537 593
Dividends declared per common share� � � � � � � � � � � � � � � � � � � � � � � � � � � � � � $ 0.63 $ 0�53 $ 0�44
The accompanying notes are an integral part of the consolidated financial statements�

A-34
T H E K R O G E R C O .
c o N S o l i d a t e d S t a t e M e N t S o F c o M P r e h e N S i v e i N c o M e
Years Ended February 1, 2014, February 2, 2013 and January 28, 2012
(In millions)2013
(52 weeks)2012
(53 weeks)2011
(52 weeks)
Net earnings including noncontrolling interests � � � � � � � � � � � � � � � � � � � � � $1,531 $1,508 $ 596Other comprehensive income (loss)
Unrealized gain on available for sale securities, net of income tax (1) � � � � 5 — 2Change in pension and other postretirement defined benefit plans,
net of income tax (2) � � � � � � � � � � � � � � � � � � � � � � � � � � � � � � � � � � � � � � � � 295 75 (271)Unrealized gains and losses on cash flow hedging activities,
net of income tax (3) � � � � � � � � � � � � � � � � � � � � � � � � � � � � � � � � � � � � � � � � (12) 13 (26)Amortization of unrealized gains and losses on cash flow hedging
activities, net of income tax (4) � � � � � � � � � � � � � � � � � � � � � � � � � � � � � � � � 1 3 1Total other comprehensive income (loss) � � � � � � � � � � � � � � � � � � � � � � � � 289 91 (294)
Comprehensive income � � � � � � � � � � � � � � � � � � � � � � � � � � � � � � � � � � � � � � � � � 1,820 1,599 302Comprehensive income (loss) attributable to noncontrolling interests � � � � 12 11 (6)
Comprehensive income attributable to The Kroger Co� � � � � � � � � � � � � � � � $1,808 $1,588 $ 308
(1) Amount is net of tax of $3 in 2013 and $1 in 2011�
(2) Amount is net of tax of $173 in 2013, $45 in 2012 and $(154) in 2011�
(3) Amount is net of tax of $(8) in 2013, $7 in 2012 and $(15) in 2011�
(4) Amount is net of tax of $1 in 2013, $2 in 2012 and $1 in 2011�
The accompanying notes are an integral part of the consolidated financial statements�

A-35
T H E K R O G E R C O .
c o N S o l i d a t e d S t a t e M e N t S o F c a S h F l o w S
Years Ended February 1, 2014, February 2, 2013 and January 28, 2012
(In millions)2013
(52 weeks)2012
(53 weeks)2011
(52 weeks)
Cash Flows From Operating Activities:
Net earnings including noncontrolling interests � � � � � � � � � � � � � � � � � � � � � � � � � � � � � � � � � � $ 1,531 $ 1,508 $ 596
Adjustments to reconcile net earnings to net cash provided by operating activities:
Depreciation� � � � � � � � � � � � � � � � � � � � � � � � � � � � � � � � � � � � � � � � � � � � � � � � � � � � � � � � � � 1,703 1,652 1,638
Asset impairment charge � � � � � � � � � � � � � � � � � � � � � � � � � � � � � � � � � � � � � � � � � � � � � � � � 39 18 37
LIFO charge � � � � � � � � � � � � � � � � � � � � � � � � � � � � � � � � � � � � � � � � � � � � � � � � � � � � � � � � � � 52 55 216
Stock-based employee compensation � � � � � � � � � � � � � � � � � � � � � � � � � � � � � � � � � � � � � � 107 82 81
Expense for Company-sponsored pension plans � � � � � � � � � � � � � � � � � � � � � � � � � � � � � � 74 89 70
Deferred income taxes � � � � � � � � � � � � � � � � � � � � � � � � � � � � � � � � � � � � � � � � � � � � � � � � � � 72 176 31
Other � � � � � � � � � � � � � � � � � � � � � � � � � � � � � � � � � � � � � � � � � � � � � � � � � � � � � � � � � � � � � � � 47 23 3
Changes in operating assets and liabilities net of effects from acquisitions of businesses:
Store deposits in-transit � � � � � � � � � � � � � � � � � � � � � � � � � � � � � � � � � � � � � � � � � � � � � � � 25 (169) (120)
Inventories � � � � � � � � � � � � � � � � � � � � � � � � � � � � � � � � � � � � � � � � � � � � � � � � � � � � � � � � � (131) (78) (361)
Receivables� � � � � � � � � � � � � � � � � � � � � � � � � � � � � � � � � � � � � � � � � � � � � � � � � � � � � � � � � (8) (126) (63)
Prepaid expenses � � � � � � � � � � � � � � � � � � � � � � � � � � � � � � � � � � � � � � � � � � � � � � � � � � � � (49) (257) 52
Trade accounts payable � � � � � � � � � � � � � � � � � � � � � � � � � � � � � � � � � � � � � � � � � � � � � � � 3 67 83
Accrued expenses � � � � � � � � � � � � � � � � � � � � � � � � � � � � � � � � � � � � � � � � � � � � � � � � � � � 77 67 215
Income taxes receivable and payable� � � � � � � � � � � � � � � � � � � � � � � � � � � � � � � � � � � � � (47) 164 (106)
Contribution to Company-sponsored pension plans � � � � � � � � � � � � � � � � � � � � � � � � � (100) (71) (52)
Other � � � � � � � � � � � � � � � � � � � � � � � � � � � � � � � � � � � � � � � � � � � � � � � � � � � � � � � � � � � � � (15) (367) 338
Net cash provided by operating activities � � � � � � � � � � � � � � � � � � � � � � � � � � � � � � � � � � � 3,380 2,833 2,658
Cash Flows From Investing Activities:
Payments for property and equipment, including payments for lease buyouts � � � � � � � � � (2,330) (2,062) (1,898)
Proceeds from sale of assets� � � � � � � � � � � � � � � � � � � � � � � � � � � � � � � � � � � � � � � � � � � � � � � � 24 49 51
Payments for acquisitions� � � � � � � � � � � � � � � � � � � � � � � � � � � � � � � � � � � � � � � � � � � � � � � � � � (2,344) (122) (51)
Other � � � � � � � � � � � � � � � � � � � � � � � � � � � � � � � � � � � � � � � � � � � � � � � � � � � � � � � � � � � � � � � � � (121) (48) (10)
Net cash used by investing activities � � � � � � � � � � � � � � � � � � � � � � � � � � � � � � � � � � � � � � � (4,771) (2,183) (1,908)
Cash Flows From Financing Activities:
Proceeds from issuance of long-term debt� � � � � � � � � � � � � � � � � � � � � � � � � � � � � � � � � � � � � 3,548 863 453
Payments on long-term debt � � � � � � � � � � � � � � � � � � � � � � � � � � � � � � � � � � � � � � � � � � � � � � � (1,060) (1,445) (547)
Net (payments) borrowings of commercial paper� � � � � � � � � � � � � � � � � � � � � � � � � � � � � � � (395) 1,275 370
Proceeds from issuance of capital stock � � � � � � � � � � � � � � � � � � � � � � � � � � � � � � � � � � � � � � 196 110 118
Treasury stock purchases � � � � � � � � � � � � � � � � � � � � � � � � � � � � � � � � � � � � � � � � � � � � � � � � � � (609) (1,261) (1,547)
Dividends paid � � � � � � � � � � � � � � � � � � � � � � � � � � � � � � � � � � � � � � � � � � � � � � � � � � � � � � � � � � (319) (267) (257)
Net increase in book overdrafts � � � � � � � � � � � � � � � � � � � � � � � � � � � � � � � � � � � � � � � � � � � � � 193 121 19
Other � � � � � � � � � � � � � � � � � � � � � � � � � � � � � � � � � � � � � � � � � � � � � � � � � � � � � � � � � � � � � � � � � — 4 4
Net cash provided (used) by financing activities � � � � � � � � � � � � � � � � � � � � � � � � � � � � � � 1,554 (600) (1,387)
Net increase (decrease) in cash and temporary cash investments � � � � � � � � � � � � � � � � � � � � � � 163 50 (637)
Cash and temporary cash investments:
Beginning of year � � � � � � � � � � � � � � � � � � � � � � � � � � � � � � � � � � � � � � � � � � � � � � � � � � � � � � � � 238 188 825
End of year � � � � � � � � � � � � � � � � � � � � � � � � � � � � � � � � � � � � � � � � � � � � � � � � � � � � � � � � � � � � � $ 401 $ 238 $ 188
Reconciliation of capital investments:
Payments for property and equipment, including payments for lease buyouts � � � � � � � � � � � $(2,330) $(2,062) $(1,898)
Payments for lease buyouts � � � � � � � � � � � � � � � � � � � � � � � � � � � � � � � � � � � � � � � � � � � � � � � � � � 108 73 60
Changes in construction-in-progress payables � � � � � � � � � � � � � � � � � � � � � � � � � � � � � � � � � � � � (83) (1) (60)
Total capital investments, excluding lease buyouts � � � � � � � � � � � � � � � � � � � � � � � � � � � � � � $(2,305) $(1,990) $(1,898)
Disclosure of cash flow information:
Cash paid during the year for interest � � � � � � � � � � � � � � � � � � � � � � � � � � � � � � � � � � � � � � � � $ 401 $ 438 $ 457
Cash paid during the year for income taxes� � � � � � � � � � � � � � � � � � � � � � � � � � � � � � � � � � � � $ 679 $ 468 $ 296
The accompanying notes are an integral part of the consolidated financial statements�

A-36
T H E K R O G E R C O .
c o N S o l i d a t e d S t a t e M e N t o F c h a N g e S i N S h a r e o w N e r S ’ e q u i t y
Years Ended February 1, 2014, February 2, 2013 and January 28, 2012
(In millions, except per share amounts)
Common StockAdditional
Paid-InCapital
Treasury Stock
AccumulatedOther
ComprehensiveGain (Loss)
AccumulatedEarnings
NoncontrollingInterest TotalShares Amount Shares Amount
Balances at January 29, 2011 � � � � � � � � � � � � � � � � � � � � 959 $959 $3,394 339 $(6,732) $(550) $ 8,225 $ 2 $ 5,298
Issuance of common stock:
Stock options exercised � � � � � � � � � � � � � � � � � � � � � — — — (6) 118 — — — 118
Restricted stock issued � � � � � � � � � � � � � � � � � � � � � � — — (55) (2) 34 — — — (21)
Treasury stock activity:
Treasury stock purchases, at cost � � � � � � � � � � � � � � — — — 61 (1,420) — — — (1,420)
Stock options exchanged � � � � � � � � � � � � � � � � � � � � — — — 6 (127) — — — (127)
Share-based employee compensation � � � � � � � � � � � � � — — 81 — — — — — 81
Other comprehensive loss net of income tax of $(167) � � � � � � � � � � � � � � � � � � � � � � � � � � � � � — — — — — (294) — — (294)
Other � � � � � � � � � � � � � � � � � � � � � � � � � � � � � � � � � � � � � � � — — 7 — (5) — — (11) (9)
Cash dividends declared ($0�44 per common share) � � � � � � � � � � � � � � � � � � — — — — — — (256) — (256)
Net earnings (loss) including non-controlling interests � � � � � � � � � � � � � � � � � � � � � � � � � � � � � � � � � — — — — — — 602 (6) 596
Balances at January 28, 2012 � � � � � � � � � � � � � � � � � � � � 959 $959 $3,427 398 $(8,132) $(844) $ 8,571 $(15) $ 3,966
Issuance of common stock:
Stock options exercised � � � � � � � � � � � � � � � � � � � � � — — — (7) 110 — — — 110
Restricted stock issued � � � � � � � � � � � � � � � � � � � � � � — — (59) (2) 40 — — — (19)
Treasury stock activity:
Treasury stock purchases, at cost � � � � � � � � � � � � � � — — — 51 (1,165) — — — (1,165)
Stock options exchanged � � � � � � � � � � � � � � � � � � � � — — — 5 (96) — — — (96)
Share-based employee compensation � � � � � � � � � � � � � — — 82 — — — — — 82
Other comprehensive gain net of income tax of $54 � � � � � � � � � � � � � � � � � � � � � � � � � � � � � � � � � � � — — — — — 91 — — 91
Other � � � � � � � � � � � � � � � � � � � � � � � � � � � � � � � � � � � � � � � — — 1 — 6 — — 11 18
Cash dividends declared ($0�53 per common share) � � � � � � � � � � � � � � � � � � — — — — — — (281) — (281)
Net earnings including non-controlling interests � � � � — — — — — — 1,497 11 1,508
Balances at February 2, 2013 � � � � � � � � � � � � � � � � � � � � 959 $959 $3,451 445 $(9,237) $(753) $ 9,787 $ 7 $ 4,214
Issuance of common stock:
Stock options exercised � � � � � � � � � � � � � � � � � � � � � — — — (9) 196 — — — 196
Restricted stock issued � � � � � � � � � � � � � � � � � � � � � � — — (60) (2) 26 — — — (34)
Treasury stock activity:
Treasury stock purchases, at cost � � � � � � � � � � � � � � — — — 9 (338) — — — (338)
Stock options exchanged � � � � � � � � � � � � � � � � � � � � — — — 8 (271) — — — (271)
Share-based employee compensation � � � � � � � � � � � � � — — 107 — — — — — 107
Other comprehensive gain net of income tax of $169 � � � � � � � � � � � � � � � � � � � � � � � � � � � � � � � � � � — — — — — 289 — — 289
Other � � � � � � � � � � � � � � � � � � � � � � � � � � � � � � � � � � � � � � � — — 51 — (17) — — (8) 26
Cash dividends declared ($0�63 per common share) � � � � � � � � � � � � � � � � � � — — — — — — (325) — (325)
Net earnings including non-controlling interests � � � � — — — — — — 1,519 12 1,531
Balances at February 1, 2014 � � � � � � � � � � � � � � � � � � � � 959 $959 $3,549 451 $(9,641) $(464) $10,981 $ 11 $ 5,395
The accompanying notes are an integral part of the consolidated financial statements�

A-37
N o t e s t o C o N s o l i d a t e d F i N a N C i a l s t a t e m e N t s
All dollar amounts are in millions except share and per share amounts�
Certain prior-year amounts have been reclassified to conform to current year presentation�
1 . a c c o u N t i N g P o l i c i e S
The following is a summary of the significant accounting policies followed in preparing these financial statements�
Description of Business, Basis of Presentation and Principles of Consolidation
The Kroger Co� (the “Company”) was founded in 1883 and incorporated in 1902� As of February 1, 2014, the Company was one of the largest retailers in the United States based on annual sales� The Company also manufactures and processes food for sale by its supermarkets� The accompanying financial statements include the consolidated accounts of the Company, its wholly-owned subsidiaries and the Variable Interest Entities (“VIEs”) in which the Company is the primary beneficiary� Significant intercompany transactions and balances have been eliminated�
Certain revenue transactions previously reported in sales and merchandise costs in the Consolidated Statements of Operations are now reported net within sales� Certain prior year amounts have been revised or reclassified to conform to the current year presentation� These amounts were not material to the prior periods�
Fiscal Year
The Company’s fiscal year ends on the Saturday nearest January 31� The last three fiscal years consist of the 52-week periods ended February 1, 2014 and January 28, 2012 and the 53-week period ended February 2, 2013�
Pervasiveness of Estimates
The preparation of financial statements in conformity with generally accepted accounting principles (“GAAP”) requires management to make estimates and assumptions that affect the reported amounts of assets and liabilities� Disclosure of contingent assets and liabilities as of the date of the consolidated financial statements and the reported amounts of consolidated revenues and expenses during the reporting period also is required� Actual results could differ from those estimates�
Inventories
Inventories are stated at the lower of cost (principally on a last-in, first-out “LIFO” basis) or market� In total, approximately 95% and 96% of inventories for 2013 and 2012, respectively, were valued using the LIFO method� Cost for the balance of the inventories, including substantially all fuel inventories, was determined using the first-in, first-out (“FIFO”) method� Replacement cost was higher than the carrying amount by $1,150 at February 1, 2014 and $1,098 at February 2, 2013� The Company follows the Link-Chain, Dollar-Value LIFO method for purposes of calculating its LIFO charge or credit�
The item-cost method of accounting to determine inventory cost before the LIFO adjustment is followed for substantially all store inventories at the Company’s supermarket divisions� This method involves counting each item in inventory, assigning costs to each of these items based on the actual purchase costs (net of vendor allowances and cash discounts) of each item and recording the cost of items sold� The item-cost method of accounting allows for more accurate reporting of periodic inventory balances and enables management to more precisely manage inventory� In addition, substantially all of the Company’s inventory consists of finished goods and is recorded at actual purchase costs (net of vendor allowances and cash discounts)�
The Company evaluates inventory shortages throughout the year based on actual physical counts in its facilities� Allowances for inventory shortages are recorded based on the results of these counts to provide for estimated shortages as of the financial statement date�

A-38
N o t e s t o C o N s o l i d a t e d F i N a N C i a l s t a t e m e N t s , C o N t i N u e d
Property, Plant and Equipment
Property, plant and equipment are recorded at cost or, in the case of assets acquired in a business combination, at fair value� Depreciation expense, which includes the amortization of assets recorded under capital leases, is computed principally using the straight-line method over the estimated useful lives of individual assets� Buildings and land improvements are depreciated based on lives varying from 10 to 40 years� All new purchases of store equipment are assigned lives varying from three to nine years� Leasehold improvements are amortized over the shorter of the lease term to which they relate, which varies from four to 25 years, or the useful life of the asset� Manufacturing plant and distribution center equipment is depreciated over lives varying from three to 15 years� Information technology assets are generally depreciated over five years� Depreciation expense was $1,703 in 2013, $1,652 in 2012 and $1,638 in 2011�
Interest costs on significant projects constructed for the Company’s own use are capitalized as part of the costs of the newly constructed facilities� Upon retirement or disposal of assets, the cost and related accumulated depreciation are removed from the balance sheet and any gain or loss is reflected in net earnings�
Deferred Rent
The Company recognizes rent holidays, including the time period during which the Company has access to the property for construction of buildings or improvements and escalating rent provisions on a straight-line basis over the term of the lease� The deferred amount is included in Other Current Liabilities and Other Long-Term Liabilities on the Company’s Consolidated Balance Sheets�
Goodwill
The Company reviews goodwill for impairment during the fourth quarter of each year, and also upon the occurrence of trigger events� The Company performs reviews of each of its operating divisions and variable interest entities (collectively, our reporting units) that have goodwill balances� Generally, fair value is determined using a multiple of earnings, or discounted projected future cash flows, and is compared to the carrying value of a division for purposes of identifying potential impairment� Projected future cash flows are based on management’s knowledge of the current operating environment and expectations for the future� If potential for impairment is identified, the fair value of a division is measured against the fair value of its underlying assets and liabilities, excluding goodwill, to estimate an implied fair value of the division’s goodwill� Goodwill impairment is recognized for any excess of the carrying value of the division’s goodwill over the implied fair value� Results of the goodwill impairment reviews performed during 2013, 2012 and 2011 are summarized in Note 3 to the Consolidated Financial Statements�
Impairment of Long-Lived Assets
The Company monitors the carrying value of long-lived assets for potential impairment each quarter based on whether certain trigger events have occurred� These events include current period losses combined with a history of losses or a projection of continuing losses or a significant decrease in the market value of an asset� When a trigger event occurs, an impairment calculation is performed, comparing projected undiscounted future cash flows, utilizing current cash flow information and expected growth rates related to specific stores, to the carrying value for those stores� If the Company identifies impairment for long-lived assets to be held and used, the Company compares the assets’ current carrying value to the assets’ fair value� Fair value is based on current market values or discounted future cash flows� The Company records impairment when the carrying value exceeds fair market value� With respect to owned property and equipment held for sale, the value of the property and equipment is adjusted to reflect recoverable values based on previous efforts to dispose of similar assets and current economic conditions� Impairment is recognized for the excess of the carrying value over the estimated fair market value, reduced by estimated direct costs of disposal� The Company recorded asset impairments in the normal course of business totaling $39, $18 and $37 in 2013, 2012 and 2011, respectively� Costs to reduce the carrying value of long-lived assets for each of the years presented have been included in the Consolidated Statements of Operations as “Operating, general and administrative” expense�

A-39
N o t e s t o C o N s o l i d a t e d F i N a N C i a l s t a t e m e N t s , C o N t i N u e d
Store Closing Costs
The Company provides for closed store liabilities relating to the present value of the estimated remaining non-cancellable lease payments after the closing date, net of estimated subtenant income� The Company estimates the net lease liabilities using a discount rate to calculate the present value of the remaining net rent payments on closed stores� The closed store lease liabilities usually are paid over the lease terms associated with the closed stores, which generally have remaining terms ranging from one to 20 years� Adjustments to closed store liabilities primarily relate to changes in subtenant income and actual exit costs differing from original estimates� Adjustments are made for changes in estimates in the period in which the change becomes known� Store closing liabilities are reviewed quarterly to ensure that any accrued amount that is not a sufficient estimate of future costs, or that no longer is needed for its originally intended purpose, is adjusted to income in the proper period�
Owned stores held for disposal are reduced to their estimated net realizable value� Costs to reduce the carrying values of property, equipment and leasehold improvements are accounted for in accordance with the Company’s policy on impairment of long-lived assets� Inventory write-downs, if any, in connection with store closings, are classified in “Merchandise costs�” Costs to transfer inventory and equipment from closed stores are expensed as incurred�
The following table summarizes accrual activity for future lease obligations of stores that were closed in the normal course of business and assumed in the merger with Harris Teeter Supermarkets, Inc� (“Harris Teeter”):
Future LeaseObligations
Balance at January 28, 2012 � � � � � � � � � � � � � � � � � � � � � � � � � � � � � � � � � � $ 55Additions � � � � � � � � � � � � � � � � � � � � � � � � � � � � � � � � � � � � � � � � � � � � � � 6Payments � � � � � � � � � � � � � � � � � � � � � � � � � � � � � � � � � � � � � � � � � � � � � � (10)Other � � � � � � � � � � � � � � � � � � � � � � � � � � � � � � � � � � � � � � � � � � � � � � � � � (7)
Balance at February 2, 2013 � � � � � � � � � � � � � � � � � � � � � � � � � � � � � � � � � � 44Additions � � � � � � � � � � � � � � � � � � � � � � � � � � � � � � � � � � � � � � � � � � � � � � 7Payments � � � � � � � � � � � � � � � � � � � � � � � � � � � � � � � � � � � � � � � � � � � � � � (9)Other � � � � � � � � � � � � � � � � � � � � � � � � � � � � � � � � � � � � � � � � � � � � � � � � � (2)Assumed from Harris Teeter � � � � � � � � � � � � � � � � � � � � � � � � � � � � � � � � 18
Balance at February 1, 2014 � � � � � � � � � � � � � � � � � � � � � � � � � � � � � � � � � � $ 58
Interest Rate Risk Management
The Company uses derivative instruments primarily to manage its exposure to changes in interest rates� The Company’s current program relative to interest rate protection and the methods by which the Company accounts for its derivative instruments are described in Note 7�
Commodity Price Protection
The Company enters into purchase commitments for various resources, including raw materials utilized in its manufacturing facilities and energy to be used in its stores, manufacturing facilities and administrative offices� The Company enters into commitments expecting to take delivery of and to utilize those resources in the conduct of the normal course of business� The Company’s current program relative to commodity price protection and the methods by which the Company accounts for its purchase commitments are described in Note 7�

A-40
N o t e s t o C o N s o l i d a t e d F i N a N C i a l s t a t e m e N t s , C o N t i N u e d
Benefit Plans and Multi-Employer Pension Plans
The Company recognizes the funded status of its retirement plans on the Consolidated Balance Sheet� Actuarial gains or losses, prior service costs or credits and transition obligations that have not yet been recognized as part of net periodic benefit cost are required to be recorded as a component of Accumulated Other Comprehensive Income (“AOCI”)� All plans are measured as of the Company’s fiscal year end�
The determination of the obligation and expense for Company-sponsored pension plans and other post-retirement benefits is dependent on the selection of assumptions used by actuaries and the Company in calculating those amounts� Those assumptions are described in Note 15 and include, among others, the discount rate, the expected long-term rate of return on plan assets and the rates of increase in compensation and health care costs� Actual results that differ from the assumptions are accumulated and amortized over future periods and, therefore, generally affect the recognized expense and recorded obligation in future periods� While the Company believes that the assumptions are appropriate, significant differences in actual experience or significant changes in assumptions may materially affect the pension and other post-retirement obligations and future expense�
The Company also participates in various multi-employer plans for substantially all union employees� Pension expense for these plans is recognized as contributions are funded� Refer to Note 16 for additional information regarding the Company’s participation in these various multi-employer plans and the United Food and Commercial Workers International Union (“UFCW”) consolidated fund�
The Company administers and makes contributions to the employee 401(k) retirement savings accounts� Contributions to the employee 401(k) retirement savings accounts are expensed when contributed� Refer to Note 15 for additional information regarding the Company’s benefit plans�
Stock Based Compensation
The Company accounts for stock options under fair value recognition provisions� Under this method, the Company recognizes compensation expense for all share-based payments granted� The Company recognizes share-based compensation expense, net of an estimated forfeiture rate, over the requisite service period of the award� In addition, the Company records expense for restricted stock awards in an amount equal to the fair market value of the underlying stock on the grant date of the award, over the period the awards lapse�
Deferred Income Taxes
Deferred income taxes are recorded to reflect the tax consequences of differences between the tax basis of assets and liabilities and their financial reporting basis� Refer to Note 5 for the types of differences that give rise to significant portions of deferred income tax assets and liabilities� Deferred income taxes are classified as a net current or noncurrent asset or liability based on the classification of the related asset or liability for financial reporting purposes� A deferred tax asset or liability that is not related to an asset or liability for financial reporting is classified according to the expected reversal date�
Uncertain Tax Positions
The Company reviews the tax positions taken or expected to be taken on tax returns to determine whether and to what extent a benefit can be recognized in its consolidated financial statements� Refer to Note 5 for the amount of unrecognized tax benefits and other related disclosures related to uncertain tax positions�
Various taxing authorities periodically audit the Company’s income tax returns� These audits include questions regarding the Company’s tax filing positions, including the timing and amount of deductions and the allocation of income to various tax jurisdictions� In evaluating the exposures connected with these various tax filing positions, including state and local taxes, the Company records allowances for probable exposures� A number of years may elapse before a particular matter, for which an allowance has been established, is audited and fully resolved� As of February 1, 2014, the Internal Revenue Service had concluded its field examination of
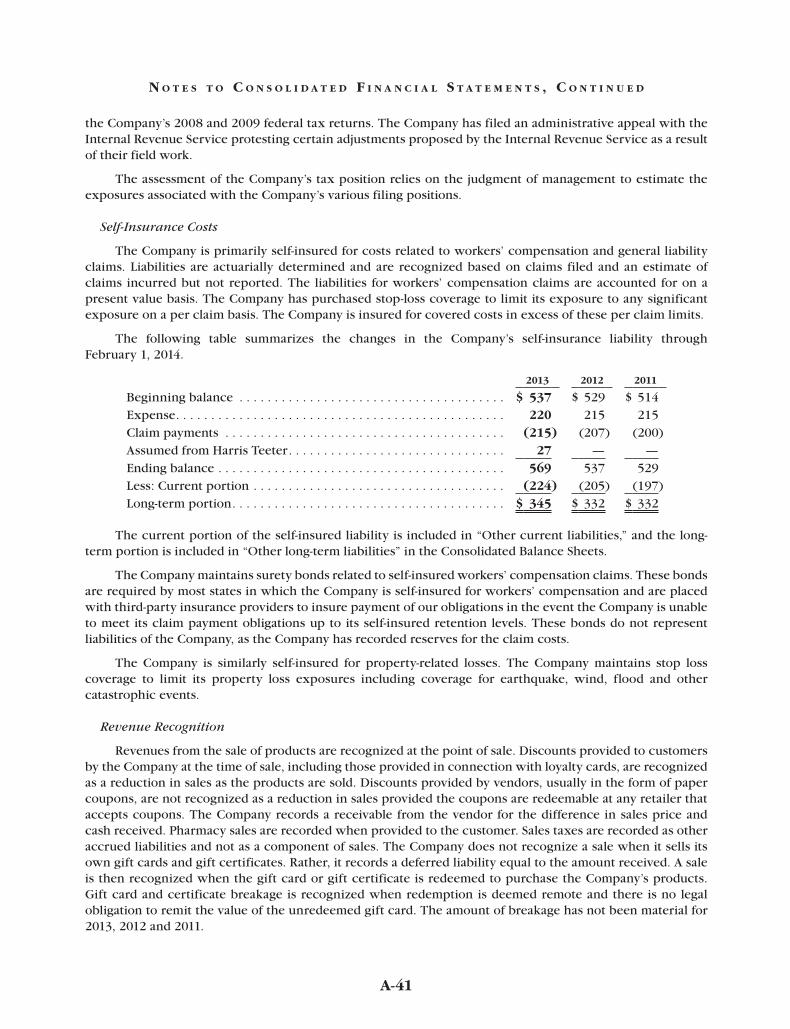
A-41
N o t e s t o C o N s o l i d a t e d F i N a N C i a l s t a t e m e N t s , C o N t i N u e d
the Company’s 2008 and 2009 federal tax returns� The Company has filed an administrative appeal with the Internal Revenue Service protesting certain adjustments proposed by the Internal Revenue Service as a result of their field work�
The assessment of the Company’s tax position relies on the judgment of management to estimate the exposures associated with the Company’s various filing positions�
Self-Insurance Costs
The Company is primarily self-insured for costs related to workers’ compensation and general liability claims� Liabilities are actuarially determined and are recognized based on claims filed and an estimate of claims incurred but not reported� The liabilities for workers’ compensation claims are accounted for on a present value basis� The Company has purchased stop-loss coverage to limit its exposure to any significant exposure on a per claim basis� The Company is insured for covered costs in excess of these per claim limits�
The following table summarizes the changes in the Company’s self-insurance liability through February 1, 2014�
2013 2012 2011
Beginning balance � � � � � � � � � � � � � � � � � � � � � � � � � � � � � � � � � � � � � � $ 537 $ 529 $ 514Expense � � � � � � � � � � � � � � � � � � � � � � � � � � � � � � � � � � � � � � � � � � � � � � � 220 215 215Claim payments � � � � � � � � � � � � � � � � � � � � � � � � � � � � � � � � � � � � � � � � (215) (207) (200)Assumed from Harris Teeter � � � � � � � � � � � � � � � � � � � � � � � � � � � � � � � 27 — —Ending balance � � � � � � � � � � � � � � � � � � � � � � � � � � � � � � � � � � � � � � � � � 569 537 529Less: Current portion � � � � � � � � � � � � � � � � � � � � � � � � � � � � � � � � � � � � (224) (205) (197)Long-term portion � � � � � � � � � � � � � � � � � � � � � � � � � � � � � � � � � � � � � � � $ 345 $ 332 $ 332
The current portion of the self-insured liability is included in “Other current liabilities,” and the long-term portion is included in “Other long-term liabilities” in the Consolidated Balance Sheets�
The Company maintains surety bonds related to self-insured workers’ compensation claims� These bonds are required by most states in which the Company is self-insured for workers’ compensation and are placed with third-party insurance providers to insure payment of our obligations in the event the Company is unable to meet its claim payment obligations up to its self-insured retention levels� These bonds do not represent liabilities of the Company, as the Company has recorded reserves for the claim costs�
The Company is similarly self-insured for property-related losses� The Company maintains stop loss coverage to limit its property loss exposures including coverage for earthquake, wind, flood and other catastrophic events�
Revenue Recognition
Revenues from the sale of products are recognized at the point of sale� Discounts provided to customers by the Company at the time of sale, including those provided in connection with loyalty cards, are recognized as a reduction in sales as the products are sold� Discounts provided by vendors, usually in the form of paper coupons, are not recognized as a reduction in sales provided the coupons are redeemable at any retailer that accepts coupons� The Company records a receivable from the vendor for the difference in sales price and cash received� Pharmacy sales are recorded when provided to the customer� Sales taxes are recorded as other accrued liabilities and not as a component of sales� The Company does not recognize a sale when it sells its own gift cards and gift certificates� Rather, it records a deferred liability equal to the amount received� A sale is then recognized when the gift card or gift certificate is redeemed to purchase the Company’s products� Gift card and certificate breakage is recognized when redemption is deemed remote and there is no legal obligation to remit the value of the unredeemed gift card� The amount of breakage has not been material for 2013, 2012 and 2011�

A-42
N o t e s t o C o N s o l i d a t e d F i N a N C i a l s t a t e m e N t s , C o N t i N u e d
Merchandise Costs
The “Merchandise costs” line item of the Consolidated Statements of Operations includes product costs, net of discounts and allowances; advertising costs (see separate discussion below); inbound freight charges; warehousing costs, including receiving and inspection costs; transportation costs; and manufacturing production and operational costs� Warehousing, transportation and manufacturing management salaries are also included in the “Merchandise costs” line item; however, purchasing management salaries and administration costs are included in the “Operating, general, and administrative” line item along with most of the Company’s other managerial and administrative costs� Rent expense and depreciation expense are shown separately in the Consolidated Statements of Operations�
Warehousing and transportation costs include distribution center direct wages, repairs and maintenance, utilities, inbound freight and, where applicable, third party warehouse management fees, as well as transportation direct wages and repairs and maintenance� These costs are recognized in the periods the related expenses are incurred�
The Company believes the classification of costs included in merchandise costs could vary widely throughout the industry� The Company’s approach is to include in the “Merchandise costs” line item the direct, net costs of acquiring products and making them available to customers in its stores� The Company believes this approach most accurately presents the actual costs of products sold�
The Company recognizes all vendor allowances as a reduction in merchandise costs when the related product is sold� When possible, vendor allowances are applied to the related product cost by item and, therefore, reduce the carrying value of inventory by item� When the items are sold, the vendor allowance is recognized� When it is not possible, due to systems constraints, to allocate vendor allowances to the product by item, vendor allowances are recognized as a reduction in merchandise costs based on inventory turns and, therefore, recognized as the product is sold�
Advertising Costs
The Company’s advertising costs are recognized in the periods the related expenses are incurred and are included in the “Merchandise costs” line item of the Consolidated Statements of Operations� The Company’s pre-tax advertising costs totaled $587 in 2013, $553 in 2012 and $532 in 2011� The Company does not record vendor allowances for co-operative advertising as a reduction of advertising expense�
Cash, Temporary Cash Investments and Book Overdrafts
Cash and temporary cash investments represent store cash and short-term investments with original maturities of less than three months� Book overdrafts are included in trade accounts payable and accrued salaries and wages�
Deposits In-Transit
Deposits in-transit generally represent funds deposited to the Company’s bank accounts at the end of the year related to sales, a majority of which were paid for with debit cards, credit cards and checks, to which the Company does not have immediate access but that settle within a few days of the sales transaction�
Consolidated Statements of Cash Flows
For purposes of the Consolidated Statements of Cash Flows, the Company considers all highly liquid debt instruments purchased with an original maturity of three months or less to be temporary cash investments�
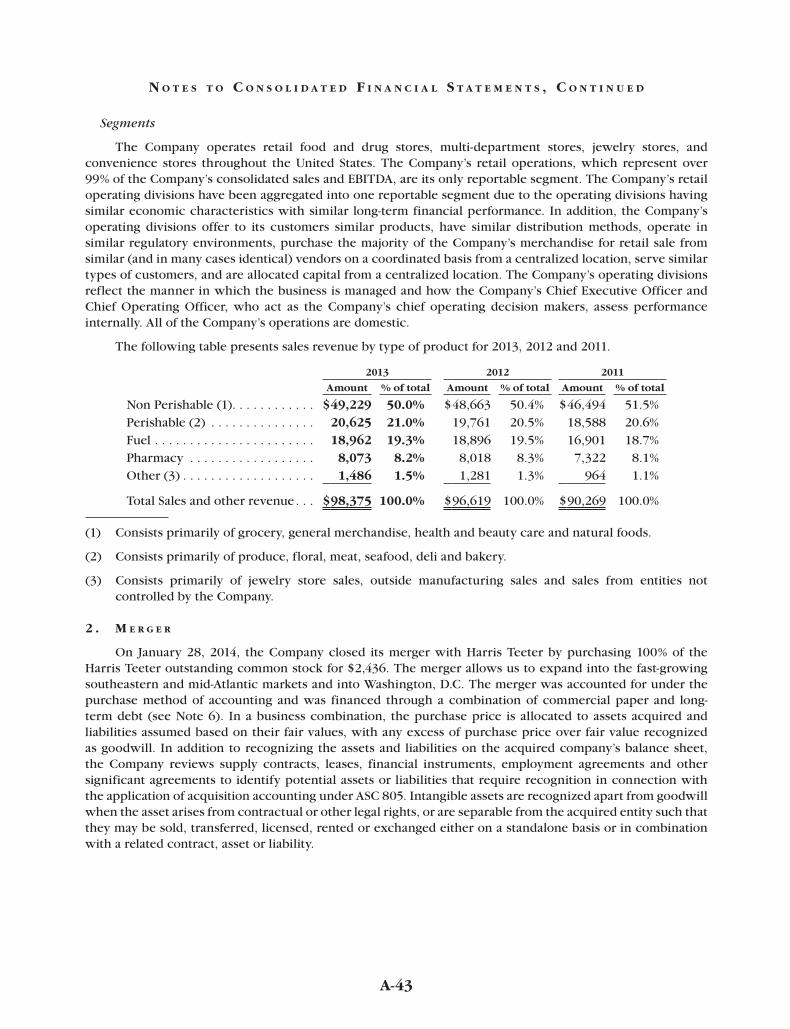
A-43
N o t e s t o C o N s o l i d a t e d F i N a N C i a l s t a t e m e N t s , C o N t i N u e d
Segments
The Company operates retail food and drug stores, multi-department stores, jewelry stores, and convenience stores throughout the United States� The Company’s retail operations, which represent over 99% of the Company’s consolidated sales and EBITDA, are its only reportable segment� The Company’s retail operating divisions have been aggregated into one reportable segment due to the operating divisions having similar economic characteristics with similar long-term financial performance� In addition, the Company’s operating divisions offer to its customers similar products, have similar distribution methods, operate in similar regulatory environments, purchase the majority of the Company’s merchandise for retail sale from similar (and in many cases identical) vendors on a coordinated basis from a centralized location, serve similar types of customers, and are allocated capital from a centralized location� The Company’s operating divisions reflect the manner in which the business is managed and how the Company’s Chief Executive Officer and Chief Operating Officer, who act as the Company’s chief operating decision makers, assess performance internally� All of the Company’s operations are domestic�
The following table presents sales revenue by type of product for 2013, 2012 and 2011�
2013 2012 2011
Amount % of total Amount % of total Amount % of total
Non Perishable (1) � � � � � � � � � � � � $49,229 50.0% $48,663 50�4% $46,494 51�5%Perishable (2) � � � � � � � � � � � � � � � 20,625 21.0% 19,761 20�5% 18,588 20�6%Fuel � � � � � � � � � � � � � � � � � � � � � � � 18,962 19.3% 18,896 19�5% 16,901 18�7%Pharmacy � � � � � � � � � � � � � � � � � � 8,073 8.2% 8,018 8�3% 7,322 8�1%Other (3) � � � � � � � � � � � � � � � � � � � 1,486 1.5% 1,281 1�3% 964 1�1%
Total Sales and other revenue � � � $98,375 100.0% $96,619 100�0% $90,269 100�0%
(1) Consists primarily of grocery, general merchandise, health and beauty care and natural foods�
(2) Consists primarily of produce, floral, meat, seafood, deli and bakery�
(3) Consists primarily of jewelry store sales, outside manufacturing sales and sales from entities not controlled by the Company�
2 . M e r g e r
On January 28, 2014, the Company closed its merger with Harris Teeter by purchasing 100% of the Harris Teeter outstanding common stock for $2,436� The merger allows us to expand into the fast-growing southeastern and mid-Atlantic markets and into Washington, D�C� The merger was accounted for under the purchase method of accounting and was financed through a combination of commercial paper and long-term debt (see Note 6)� In a business combination, the purchase price is allocated to assets acquired and liabilities assumed based on their fair values, with any excess of purchase price over fair value recognized as goodwill� In addition to recognizing the assets and liabilities on the acquired company’s balance sheet, the Company reviews supply contracts, leases, financial instruments, employment agreements and other significant agreements to identify potential assets or liabilities that require recognition in connection with the application of acquisition accounting under ASC 805� Intangible assets are recognized apart from goodwill when the asset arises from contractual or other legal rights, or are separable from the acquired entity such that they may be sold, transferred, licensed, rented or exchanged either on a standalone basis or in combination with a related contract, asset or liability�

A-44
N o t e s t o C o N s o l i d a t e d F i N a N C i a l s t a t e m e N t s , C o N t i N u e d
Pending the finalization of the Company’s valuations and other items, the following table summarizes the preliminary fair values of the assets acquired and liabilities assumed:
January 28, 2014
ASSETSCash and temporary cash investments � � � � � � � � � � � � � � � � � � � � � � � � � � � � � � � � � � � � � � � � � � � � � � $ 92Store deposits in-transit � � � � � � � � � � � � � � � � � � � � � � � � � � � � � � � � � � � � � � � � � � � � � � � � � � � � � � � � � � 28Receivables� � � � � � � � � � � � � � � � � � � � � � � � � � � � � � � � � � � � � � � � � � � � � � � � � � � � � � � � � � � � � � � � � � � � 41FIFO inventory � � � � � � � � � � � � � � � � � � � � � � � � � � � � � � � � � � � � � � � � � � � � � � � � � � � � � � � � � � � � � � � � � 426Prepaid and other current assets � � � � � � � � � � � � � � � � � � � � � � � � � � � � � � � � � � � � � � � � � � � � � � � � � � � 31
Total current assets � � � � � � � � � � � � � � � � � � � � � � � � � � � � � � � � � � � � � � � � � � � � � � � � � � � � � � � � � � � 618
Property, plant and equipment � � � � � � � � � � � � � � � � � � � � � � � � � � � � � � � � � � � � � � � � � � � � � � � � � � � � 1,328Intangibles � � � � � � � � � � � � � � � � � � � � � � � � � � � � � � � � � � � � � � � � � � � � � � � � � � � � � � � � � � � � � � � � � � � � 558Other assets � � � � � � � � � � � � � � � � � � � � � � � � � � � � � � � � � � � � � � � � � � � � � � � � � � � � � � � � � � � � � � � � � � � 238
Total Assets, excluding Goodwill� � � � � � � � � � � � � � � � � � � � � � � � � � � � � � � � � � � � � � � � � � � � � � � � � 2,742
LIABILITIESCurrent portion of long-term debt including obligations under
capital leases and financing obligations� � � � � � � � � � � � � � � � � � � � � � � � � � � � � � � � � � � � � � � � � � � (7)Trade accounts payable � � � � � � � � � � � � � � � � � � � � � � � � � � � � � � � � � � � � � � � � � � � � � � � � � � � � � � � � � � (202)Accrued salaries and wages � � � � � � � � � � � � � � � � � � � � � � � � � � � � � � � � � � � � � � � � � � � � � � � � � � � � � � � (47)Deferred income taxes� � � � � � � � � � � � � � � � � � � � � � � � � � � � � � � � � � � � � � � � � � � � � � � � � � � � � � � � � � � (20)Other current liabilities � � � � � � � � � � � � � � � � � � � � � � � � � � � � � � � � � � � � � � � � � � � � � � � � � � � � � � � � � � (159)
Total current liabilities � � � � � � � � � � � � � � � � � � � � � � � � � � � � � � � � � � � � � � � � � � � � � � � � � � � � � � � � (435)
Fair-value of long-term debt including obligations under capital leases and financing obligations� � � � � � � � � � � � � � � � � � � � � � � � � � � � � � � � � � � � � � � � � � � (252)
Deferred income taxes� � � � � � � � � � � � � � � � � � � � � � � � � � � � � � � � � � � � � � � � � � � � � � � � � � � � � � � � � � � (285)Pension and postretirement benefit obligations � � � � � � � � � � � � � � � � � � � � � � � � � � � � � � � � � � � � � � � (98)Other long-term liabilities � � � � � � � � � � � � � � � � � � � � � � � � � � � � � � � � � � � � � � � � � � � � � � � � � � � � � � � � (137)
Total Liabilities � � � � � � � � � � � � � � � � � � � � � � � � � � � � � � � � � � � � � � � � � � � � � � � � � � � � � � � � � � � � � � (1,207)
Total Identifiable Net Assets � � � � � � � � � � � � � � � � � � � � � � � � � � � � � � � � � � � � � � � � � � � � � � � � � � � � 1,535Goodwill � � � � � � � � � � � � � � � � � � � � � � � � � � � � � � � � � � � � � � � � � � � � � � � � � � � � � � � � � � � � � � � � � � � � � 901
Total Purchase Price � � � � � � � � � � � � � � � � � � � � � � � � � � � � � � � � � � � � � � � � � � � � � � � � � � � � � � � � � � $ 2,436
Of the $558 allocated to intangible assets, $430 relates to the Harris Teeter trade name, to which we assigned an indefinite life and, therefore, will not be amortized� The Company also recorded $53 and $75 related to pharmacy prescription files and favorable leasehold interests, respectively� The Company will amortize the pharmacy prescription files and favorable leasehold interests over seven and 24 years, respectively� The goodwill recorded as part of the merger was attributable to the assembled workforce of Harris Teeter and operational synergies expected from the merger, as well as any intangible assets that do not qualify for separate recognition� The transaction was treated as a stock purchase for income tax purposes� The assets acquired and liabilities assumed as part of the merger did not result in a step up of the tax basis and goodwill is not expected to be deductible for tax purposes� The above amounts represent the preliminary allocation of the purchase price, and are subject to revision when the resulting valuations of property and intangible assets are finalized, which will occur prior to January 28, 2015� Due to the timing of the merger closing late in the year, the revenue and earnings of Harris Teeter in 2013 were not material�

A-45
N o t e s t o C o N s o l i d a t e d F i N a N C i a l s t a t e m e N t s , C o N t i N u e d
Pro forma results of operations, assuming the transaction had taken place at the beginning of 2012, are included in the following table� The pro forma information includes historical results of operations of Harris Teeter and adjustments for interest expense that would have been incurred due to financing the acquisition, depreciation and amortization of the assets acquired and excludes the pre-acquisition transaction related expenses incurred by Harris Teeter and the Company� The pro forma information does not include efficiencies, cost reductions, synergies and investments in lower prices for our customers expected to result from the merger or immaterial acquisitions completed in 2012� The unaudited pro forma financial information is not necessarily indicative of the results that actually would have occurred had the merger been completed at the beginning of the 2012�
Fiscal year ended February 1, 2014
Fiscal year ended February 2, 2013
Sales � � � � � � � � � � � � � � � � � � � � � � � � � � � � � � � � � � � � � � � � � � � � � � � � � � � � � $103,202 $101,214Net earnings including noncontrolling interests � � � � � � � � � � � � � � � � � � 1,664 1,584Net earnings attributable to noncontrolling interests� � � � � � � � � � � � � � � 12 11
Net earnings attributable to The Kroger Co�� � � � � � � � � � � � � � � � � � � � $ 1,652 $ 1,573
3 . g o o d w i l l a N d i N t a N g i B l e a S S e t S
The following table summarizes the changes in the Company’s net goodwill balance through February 1, 2014�
2013 2012
Balance beginning of yearGoodwill � � � � � � � � � � � � � � � � � � � � � � � � � � � � � � � � � � � � � � � � � � � � � � � � � $ 3,766 $ 3,670Accumulated impairment losses � � � � � � � � � � � � � � � � � � � � � � � � � � � � � � � (2,532) (2,532)
1,234 1,138
Activity during the yearAcquisitions� � � � � � � � � � � � � � � � � � � � � � � � � � � � � � � � � � � � � � � � � � � � � � � 901 96
Balance end of yearGoodwill � � � � � � � � � � � � � � � � � � � � � � � � � � � � � � � � � � � � � � � � � � � � � � � � � 4,667 3,766Accumulated impairment losses � � � � � � � � � � � � � � � � � � � � � � � � � � � � � � � (2,532) (2,532)
$ 2,135 $ 1,234
In 2013, the Company acquired all the outstanding shares of Harris Teeter, a supermarket retailer in southeastern and mid-Atlantic markets and Washington, D�C�, resulting in additional goodwill of $901� See Note 2 for additional information regarding the merger�
In 2012, the Company acquired an interest in one of its suppliers and all the outstanding shares of Axium Pharmacy, a leading specialty pharmacy that provides specialized drug therapies and support services for patients with complex medical conditions, resulting in combined additional goodwill of $96�
Testing for impairment must be performed annually, or on an interim basis upon the occurrence of a triggering event or a change in circumstances that would more likely than not reduce the fair value of a reporting unit below its carrying amount� The annual evaluation of goodwill performed during the fourth quarter of 2013, 2012 and 2011 did not result in impairment�
Based on current and future expected cash flows, the Company believes goodwill impairments are not reasonably likely� A 10% reduction in fair value of the Company’s reporting units would not indicate a potential for impairment of the Company’s remaining goodwill balance�
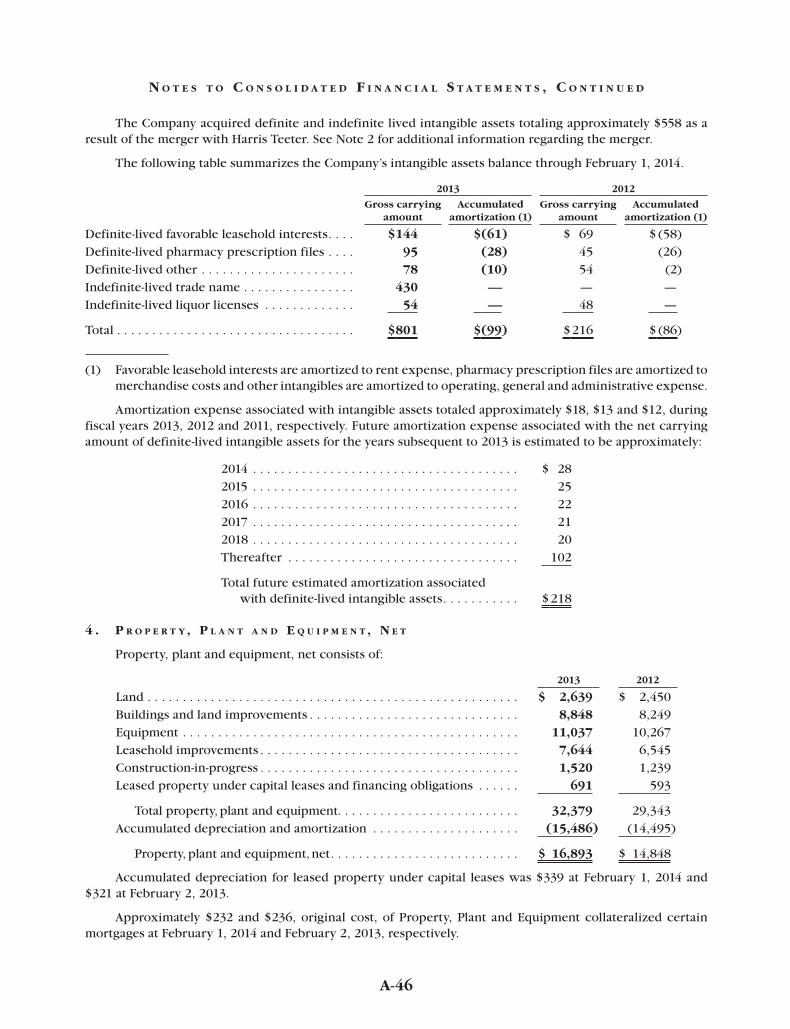
A-46
N o t e s t o C o N s o l i d a t e d F i N a N C i a l s t a t e m e N t s , C o N t i N u e d
The Company acquired definite and indefinite lived intangible assets totaling approximately $558 as a result of the merger with Harris Teeter� See Note 2 for additional information regarding the merger�
The following table summarizes the Company’s intangible assets balance through February 1, 2014�
2013 2012
Gross carrying amount
Accumulated amortization (1)
Gross carrying amount
Accumulated amortization (1)
Definite-lived favorable leasehold interests� � � � $144 $(61) $ 69 $ (58)Definite-lived pharmacy prescription files � � � � 95 (28) 45 (26)Definite-lived other � � � � � � � � � � � � � � � � � � � � � � 78 (10) 54 (2)Indefinite-lived trade name � � � � � � � � � � � � � � � � 430 — — —Indefinite-lived liquor licenses � � � � � � � � � � � � � 54 — 48 —
Total � � � � � � � � � � � � � � � � � � � � � � � � � � � � � � � � � � $801 $(99) $216 $ (86)
(1) Favorable leasehold interests are amortized to rent expense, pharmacy prescription files are amortized to merchandise costs and other intangibles are amortized to operating, general and administrative expense�
Amortization expense associated with intangible assets totaled approximately $18, $13 and $12, during fiscal years 2013, 2012 and 2011, respectively� Future amortization expense associated with the net carrying amount of definite-lived intangible assets for the years subsequent to 2013 is estimated to be approximately:
2014 � � � � � � � � � � � � � � � � � � � � � � � � � � � � � � � � � � � � � � $ 282015 � � � � � � � � � � � � � � � � � � � � � � � � � � � � � � � � � � � � � � 252016 � � � � � � � � � � � � � � � � � � � � � � � � � � � � � � � � � � � � � � 222017 � � � � � � � � � � � � � � � � � � � � � � � � � � � � � � � � � � � � � � 212018 � � � � � � � � � � � � � � � � � � � � � � � � � � � � � � � � � � � � � � 20Thereafter � � � � � � � � � � � � � � � � � � � � � � � � � � � � � � � � � 102
Total future estimated amortization associated with definite-lived intangible assets� � � � � � � � � � � $218
4 . P r o P e r t y , P l a N t a N d e q u i P M e N t , N e t
Property, plant and equipment, net consists of:
2013 2012
Land � � � � � � � � � � � � � � � � � � � � � � � � � � � � � � � � � � � � � � � � � � � � � � � � � � � � � $ 2,639 $ 2,450Buildings and land improvements � � � � � � � � � � � � � � � � � � � � � � � � � � � � � � 8,848 8,249Equipment � � � � � � � � � � � � � � � � � � � � � � � � � � � � � � � � � � � � � � � � � � � � � � � � 11,037 10,267Leasehold improvements � � � � � � � � � � � � � � � � � � � � � � � � � � � � � � � � � � � � � 7,644 6,545Construction-in-progress � � � � � � � � � � � � � � � � � � � � � � � � � � � � � � � � � � � � � 1,520 1,239Leased property under capital leases and financing obligations � � � � � � 691 593
Total property, plant and equipment� � � � � � � � � � � � � � � � � � � � � � � � � � 32,379 29,343Accumulated depreciation and amortization � � � � � � � � � � � � � � � � � � � � � (15,486) (14,495)
Property, plant and equipment, net� � � � � � � � � � � � � � � � � � � � � � � � � � � $ 16,893 $ 14,848
Accumulated depreciation for leased property under capital leases was $339 at February 1, 2014 and $321 at February 2, 2013�
Approximately $232 and $236, original cost, of Property, Plant and Equipment collateralized certain mortgages at February 1, 2014 and February 2, 2013, respectively�
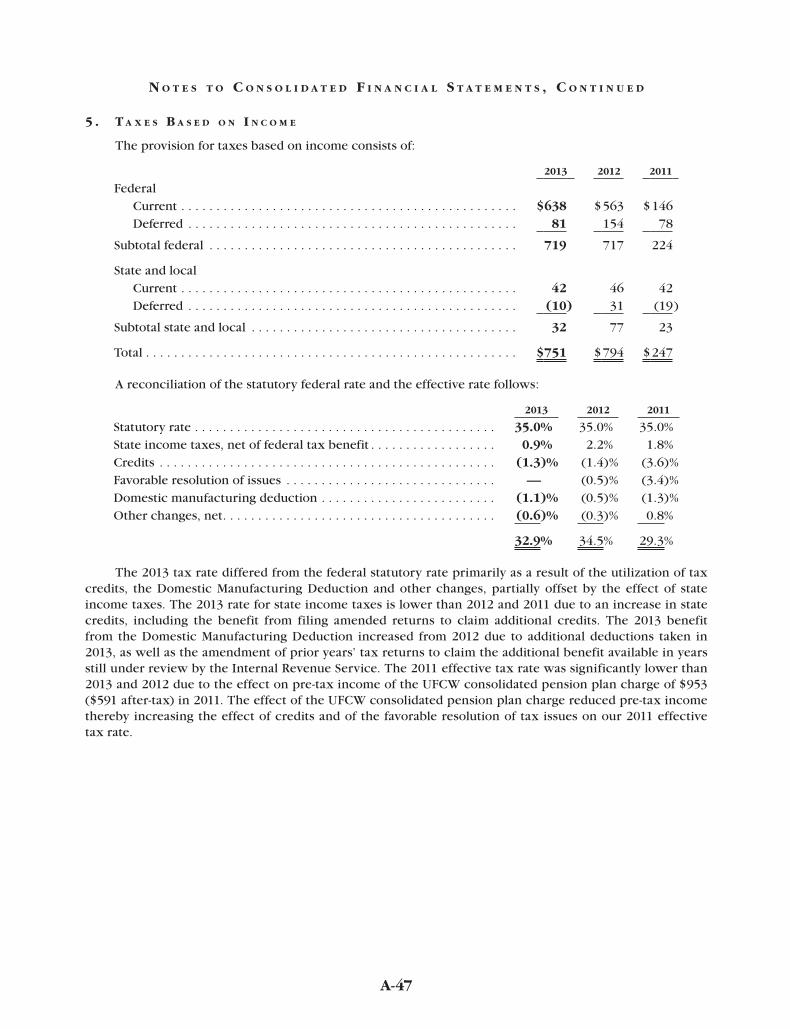
A-47
N o t e s t o C o N s o l i d a t e d F i N a N C i a l s t a t e m e N t s , C o N t i N u e d
5 . t a x e S B a S e d o N i N c o M e
The provision for taxes based on income consists of:
2013 2012 2011
FederalCurrent � � � � � � � � � � � � � � � � � � � � � � � � � � � � � � � � � � � � � � � � � � � � � � � � $638 $563 $146Deferred � � � � � � � � � � � � � � � � � � � � � � � � � � � � � � � � � � � � � � � � � � � � � � � 81 154 78
Subtotal federal � � � � � � � � � � � � � � � � � � � � � � � � � � � � � � � � � � � � � � � � � � � � 719 717 224
State and localCurrent � � � � � � � � � � � � � � � � � � � � � � � � � � � � � � � � � � � � � � � � � � � � � � � � 42 46 42Deferred � � � � � � � � � � � � � � � � � � � � � � � � � � � � � � � � � � � � � � � � � � � � � � � (10) 31 (19)
Subtotal state and local � � � � � � � � � � � � � � � � � � � � � � � � � � � � � � � � � � � � � � 32 77 23
Total � � � � � � � � � � � � � � � � � � � � � � � � � � � � � � � � � � � � � � � � � � � � � � � � � � � � � $751 $794 $247
A reconciliation of the statutory federal rate and the effective rate follows:
2013 2012 2011
Statutory rate � � � � � � � � � � � � � � � � � � � � � � � � � � � � � � � � � � � � � � � � � � � 35.0% 35�0% 35�0%State income taxes, net of federal tax benefit � � � � � � � � � � � � � � � � � � 0.9% 2�2% 1�8%Credits � � � � � � � � � � � � � � � � � � � � � � � � � � � � � � � � � � � � � � � � � � � � � � � � (1.3)% (1�4)% (3�6)%Favorable resolution of issues � � � � � � � � � � � � � � � � � � � � � � � � � � � � � � — (0�5)% (3�4)%Domestic manufacturing deduction � � � � � � � � � � � � � � � � � � � � � � � � � (1.1)% (0�5)% (1�3)%Other changes, net� � � � � � � � � � � � � � � � � � � � � � � � � � � � � � � � � � � � � � � (0.6)% (0�3)% 0�8%
32.9% 34�5% 29�3%
The 2013 tax rate differed from the federal statutory rate primarily as a result of the utilization of tax credits, the Domestic Manufacturing Deduction and other changes, partially offset by the effect of state income taxes� The 2013 rate for state income taxes is lower than 2012 and 2011 due to an increase in state credits, including the benefit from filing amended returns to claim additional credits� The 2013 benefit from the Domestic Manufacturing Deduction increased from 2012 due to additional deductions taken in 2013, as well as the amendment of prior years’ tax returns to claim the additional benefit available in years still under review by the Internal Revenue Service� The 2011 effective tax rate was significantly lower than 2013 and 2012 due to the effect on pre-tax income of the UFCW consolidated pension plan charge of $953 ($591 after-tax) in 2011� The effect of the UFCW consolidated pension plan charge reduced pre-tax income thereby increasing the effect of credits and of the favorable resolution of tax issues on our 2011 effective tax rate�
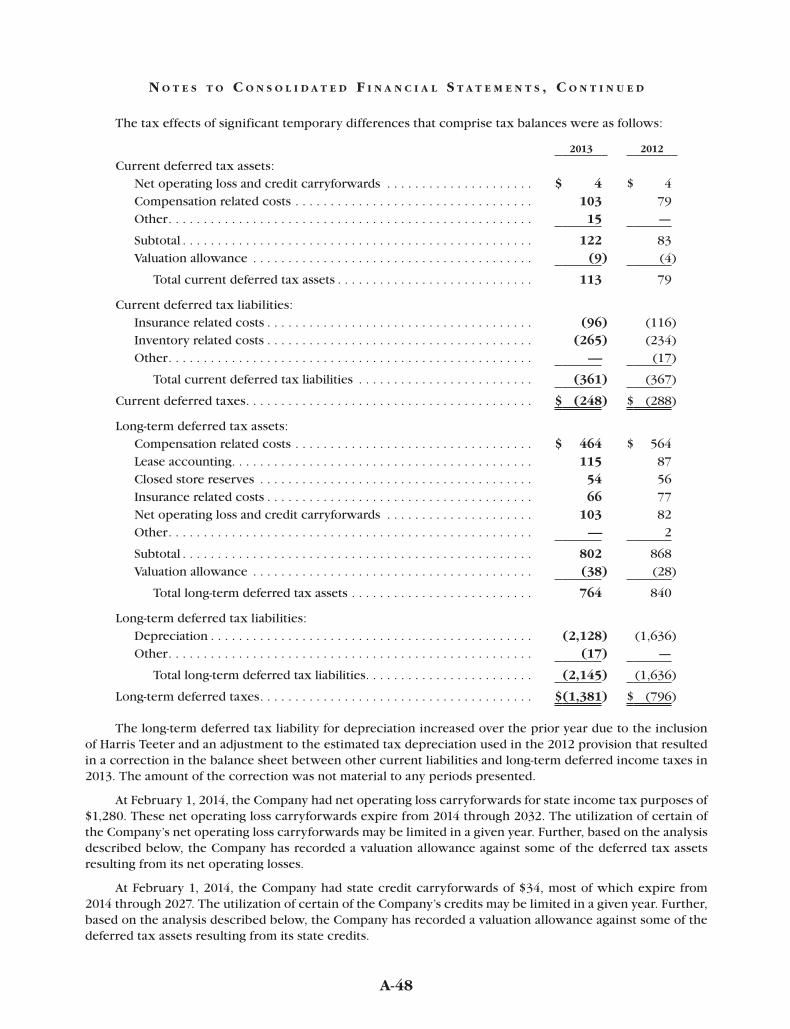
A-48
N o t e s t o C o N s o l i d a t e d F i N a N C i a l s t a t e m e N t s , C o N t i N u e d
The tax effects of significant temporary differences that comprise tax balances were as follows:
2013 2012
Current deferred tax assets:Net operating loss and credit carryforwards � � � � � � � � � � � � � � � � � � � � � $ 4 $ 4Compensation related costs � � � � � � � � � � � � � � � � � � � � � � � � � � � � � � � � � � 103 79Other� � � � � � � � � � � � � � � � � � � � � � � � � � � � � � � � � � � � � � � � � � � � � � � � � � � � 15 —
Subtotal � � � � � � � � � � � � � � � � � � � � � � � � � � � � � � � � � � � � � � � � � � � � � � � � � � 122 83Valuation allowance � � � � � � � � � � � � � � � � � � � � � � � � � � � � � � � � � � � � � � � � (9) (4)
Total current deferred tax assets � � � � � � � � � � � � � � � � � � � � � � � � � � � � 113 79
Current deferred tax liabilities:Insurance related costs � � � � � � � � � � � � � � � � � � � � � � � � � � � � � � � � � � � � � � (96) (116)Inventory related costs � � � � � � � � � � � � � � � � � � � � � � � � � � � � � � � � � � � � � � (265) (234)Other� � � � � � � � � � � � � � � � � � � � � � � � � � � � � � � � � � � � � � � � � � � � � � � � � � � � — (17)
Total current deferred tax liabilities � � � � � � � � � � � � � � � � � � � � � � � � � (361) (367)
Current deferred taxes� � � � � � � � � � � � � � � � � � � � � � � � � � � � � � � � � � � � � � � � � $ (248) $ (288)
Long-term deferred tax assets:Compensation related costs � � � � � � � � � � � � � � � � � � � � � � � � � � � � � � � � � � $ 464 $ 564Lease accounting� � � � � � � � � � � � � � � � � � � � � � � � � � � � � � � � � � � � � � � � � � � 115 87Closed store reserves � � � � � � � � � � � � � � � � � � � � � � � � � � � � � � � � � � � � � � � 54 56Insurance related costs � � � � � � � � � � � � � � � � � � � � � � � � � � � � � � � � � � � � � � 66 77Net operating loss and credit carryforwards � � � � � � � � � � � � � � � � � � � � � 103 82Other� � � � � � � � � � � � � � � � � � � � � � � � � � � � � � � � � � � � � � � � � � � � � � � � � � � � — 2
Subtotal � � � � � � � � � � � � � � � � � � � � � � � � � � � � � � � � � � � � � � � � � � � � � � � � � � 802 868Valuation allowance � � � � � � � � � � � � � � � � � � � � � � � � � � � � � � � � � � � � � � � � (38) (28)
Total long-term deferred tax assets � � � � � � � � � � � � � � � � � � � � � � � � � � 764 840
Long-term deferred tax liabilities:Depreciation � � � � � � � � � � � � � � � � � � � � � � � � � � � � � � � � � � � � � � � � � � � � � � (2,128) (1,636)Other� � � � � � � � � � � � � � � � � � � � � � � � � � � � � � � � � � � � � � � � � � � � � � � � � � � � (17) —
Total long-term deferred tax liabilities� � � � � � � � � � � � � � � � � � � � � � � � (2,145) (1,636)
Long-term deferred taxes� � � � � � � � � � � � � � � � � � � � � � � � � � � � � � � � � � � � � � � $(1,381) $ (796)
The long-term deferred tax liability for depreciation increased over the prior year due to the inclusion of Harris Teeter and an adjustment to the estimated tax depreciation used in the 2012 provision that resulted in a correction in the balance sheet between other current liabilities and long-term deferred income taxes in 2013� The amount of the correction was not material to any periods presented�
At February 1, 2014, the Company had net operating loss carryforwards for state income tax purposes of $1,280� These net operating loss carryforwards expire from 2014 through 2032� The utilization of certain of the Company’s net operating loss carryforwards may be limited in a given year� Further, based on the analysis described below, the Company has recorded a valuation allowance against some of the deferred tax assets resulting from its net operating losses�
At February 1, 2014, the Company had state credit carryforwards of $34, most of which expire from 2014 through 2027� The utilization of certain of the Company’s credits may be limited in a given year� Further, based on the analysis described below, the Company has recorded a valuation allowance against some of the deferred tax assets resulting from its state credits�
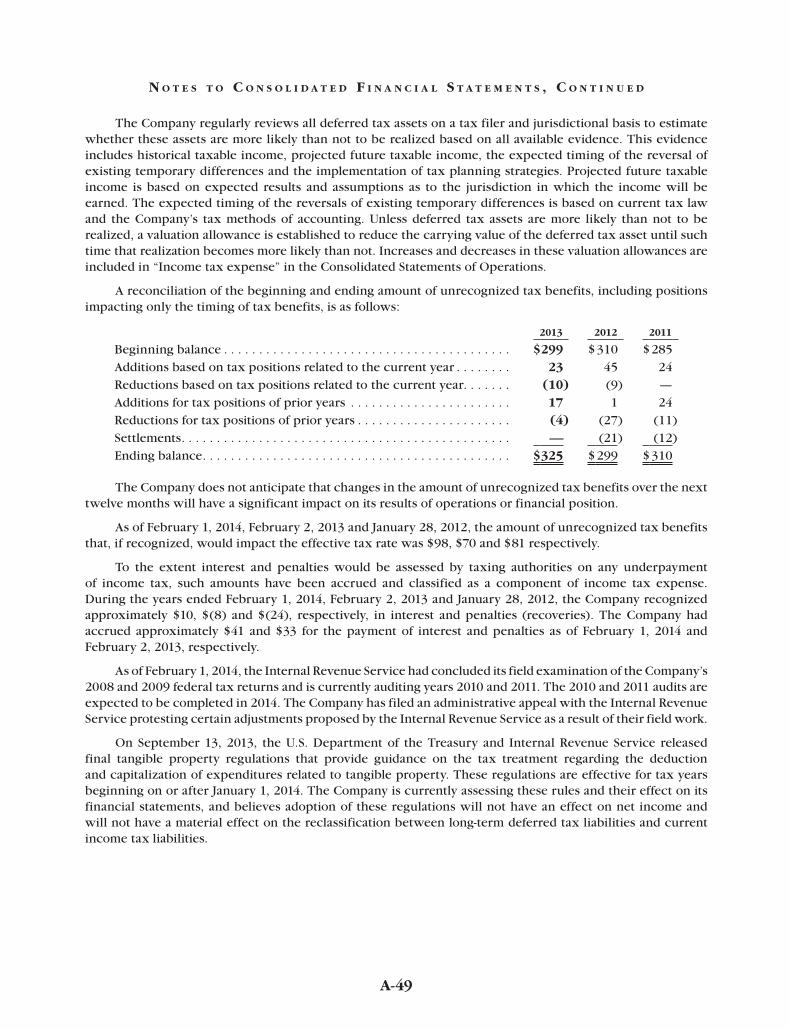
A-49
N o t e s t o C o N s o l i d a t e d F i N a N C i a l s t a t e m e N t s , C o N t i N u e d
The Company regularly reviews all deferred tax assets on a tax filer and jurisdictional basis to estimate whether these assets are more likely than not to be realized based on all available evidence� This evidence includes historical taxable income, projected future taxable income, the expected timing of the reversal of existing temporary differences and the implementation of tax planning strategies� Projected future taxable income is based on expected results and assumptions as to the jurisdiction in which the income will be earned� The expected timing of the reversals of existing temporary differences is based on current tax law and the Company’s tax methods of accounting� Unless deferred tax assets are more likely than not to be realized, a valuation allowance is established to reduce the carrying value of the deferred tax asset until such time that realization becomes more likely than not� Increases and decreases in these valuation allowances are included in “Income tax expense” in the Consolidated Statements of Operations�
A reconciliation of the beginning and ending amount of unrecognized tax benefits, including positions impacting only the timing of tax benefits, is as follows:
2013 2012 2011
Beginning balance � � � � � � � � � � � � � � � � � � � � � � � � � � � � � � � � � � � � � � � � � $299 $310 $285Additions based on tax positions related to the current year � � � � � � � � 23 45 24Reductions based on tax positions related to the current year� � � � � � � (10) (9) —Additions for tax positions of prior years � � � � � � � � � � � � � � � � � � � � � � � 17 1 24Reductions for tax positions of prior years � � � � � � � � � � � � � � � � � � � � � � (4) (27) (11)Settlements� � � � � � � � � � � � � � � � � � � � � � � � � � � � � � � � � � � � � � � � � � � � � � � — (21) (12)Ending balance� � � � � � � � � � � � � � � � � � � � � � � � � � � � � � � � � � � � � � � � � � � � $325 $299 $310
The Company does not anticipate that changes in the amount of unrecognized tax benefits over the next twelve months will have a significant impact on its results of operations or financial position�
As of February 1, 2014, February 2, 2013 and January 28, 2012, the amount of unrecognized tax benefits that, if recognized, would impact the effective tax rate was $98, $70 and $81 respectively�
To the extent interest and penalties would be assessed by taxing authorities on any underpayment of income tax, such amounts have been accrued and classified as a component of income tax expense� During the years ended February 1, 2014, February 2, 2013 and January 28, 2012, the Company recognized approximately $10, $(8) and $(24), respectively, in interest and penalties (recoveries)� The Company had accrued approximately $41 and $33 for the payment of interest and penalties as of February 1, 2014 and February 2, 2013, respectively�
As of February 1, 2014, the Internal Revenue Service had concluded its field examination of the Company’s 2008 and 2009 federal tax returns and is currently auditing years 2010 and 2011� The 2010 and 2011 audits are expected to be completed in 2014� The Company has filed an administrative appeal with the Internal Revenue Service protesting certain adjustments proposed by the Internal Revenue Service as a result of their field work�
On September 13, 2013, the U�S� Department of the Treasury and Internal Revenue Service released final tangible property regulations that provide guidance on the tax treatment regarding the deduction and capitalization of expenditures related to tangible property� These regulations are effective for tax years beginning on or after January 1, 2014� The Company is currently assessing these rules and their effect on its financial statements, and believes adoption of these regulations will not have an effect on net income and will not have a material effect on the reclassification between long-term deferred tax liabilities and current income tax liabilities�

A-50
N o t e s t o C o N s o l i d a t e d F i N a N C i a l s t a t e m e N t s , C o N t i N u e d
6 . d e B t o B l i g a t i o N S
Long-term debt consists of:
2013 2012
0�80% to 8�00% Senior notes due through 2043 � � � � � � � � � � � � � � � � � � � � � $ 9,083 $ 6,5875�00% to 12�75% Mortgages due in varying amounts through 2034 � � � � � � 64 600�27% to 0�45% Commercial paper due through February 2014� � � � � � � � � 1,250 1,645Other � � � � � � � � � � � � � � � � � � � � � � � � � � � � � � � � � � � � � � � � � � � � � � � � � � � � � � 383 184
Total debt � � � � � � � � � � � � � � � � � � � � � � � � � � � � � � � � � � � � � � � � � � � � � � � � � � � 10,780 8,476Less current portion � � � � � � � � � � � � � � � � � � � � � � � � � � � � � � � � � � � � � � � � � � (1,616) (2,700)
Total long-term debt� � � � � � � � � � � � � � � � � � � � � � � � � � � � � � � � � � � � � � � � � � � $ 9,164 $ 5,776
In 2013, the Company issued $600 of senior notes due in fiscal year 2023 bearing an interest rate of 3�85%, $400 of senior notes due in fiscal year 2043 bearing an interest rate of 5�15%, $500 of senior notes due in fiscal year 2016 bearing an interest rate of 3-month London Inter-Bank Offering Rate plus 53 basis points, $300 of senior notes due in fiscal year 2016 bearing an interest rate of 1�20%, $500 of senior notes due in fiscal year 2019 bearing an interest rate of 2�30%, $700 of senior notes due in fiscal year 2021 bearing an interest rate of 3�30% and $500 in senior notes due in fiscal year 2024 bearing an interest rate of 4�00%� In 2013, the Company repaid $400 of senior notes bearing an interest rate of 5�00% and $600 of senior notes bearing an interest rate of 7�50% upon their maturity�
In 2012, the Company issued $500 of senior notes due in fiscal year 2022 bearing an interest rate of 3�40% and $350 of senior notes due in fiscal year 2042 bearing an interest rate of 5�00%� In 2012, the Company repaid upon their maturity $491 of senior notes bearing an interest rate of 6�75%, $346 of senior notes bearing an interest rate of 6�20% and $500 of senior notes bearing an interest rate of 5�50%�
On January 25, 2012, the Company amended and extended its $2,000 unsecured revolving credit facility� The Company entered into the amended credit facility to amend and extend the Company’s existing credit facility which would have terminated on May 15, 2014� The amended credit facility provides for a $2,000 unsecured revolving credit facility (the “Credit Agreement”), with a termination date of January 25, 2017, unless extended as permitted under the Credit Agreement� The Company has the ability to increase the size of the Credit Agreement by up to an additional $500, subject to certain conditions�
Borrowings under the Credit Agreement bear interest at the Company’s option, at either (i) LIBOR plus a market rate spread, based on the Company’s Leverage Ratio or (ii) the base rate, defined as the highest of (a) the Bank of America prime rate, (b) the Federal Funds rate plus 0�5%, and (c) one-month LIBOR plus 1�0%, plus a market rate spread based on the Company’s Leverage Ratio� The Company will also pay a Commitment Fee based on the Leverage Ratio and Letter of Credit fees equal to a market rate spread based on the Company’s Leverage Ratio� The Credit Agreement contains covenants, which, among other things, require the maintenance of a Leverage Ratio of not greater than 3�50:1�00 and a Fixed Charge Coverage Ratio of not less than 1�70:1�00� In the first quarter of 2012, the covenants were amended to exclude up to $1,000 in expense related to the Company’s commitment to fund the UFCW consolidated pension plan� The Company may repay the Credit Agreement in whole or in part at any time without premium or penalty� The Credit Agreement is not guaranteed by the Company’s subsidiaries�
In addition to the Credit Agreement, the Company maintained two uncommitted money market lines totaling $75 in the aggregate� The money market lines allow the Company to borrow from banks at mutually agreed upon rates, usually at rates below the rates offered under the credit agreement� As of February 1, 2014, the Company had $1,250 of borrowings of commercial paper, with a weighted average interest rate of 0�27%, and no borrowings under its Credit Agreement and money market lines� As of February 2, 2013, the Company had $1,645 of borrowings of commercial paper, with a weighted average interest rate of 0�45%, and no borrowings under its Credit Agreement and money market lines�

A-51
N o t e s t o C o N s o l i d a t e d F i N a N C i a l s t a t e m e N t s , C o N t i N u e d
As of February 1, 2014, the Company had outstanding letters of credit in the amount of $209, of which $12 reduces funds available under the Company’s Credit Agreement� The letters of credit are maintained primarily to support performance, payment, deposit or surety obligations of the Company�
Most of the Company’s outstanding public debt is subject to early redemption at varying times and premiums, at the option of the Company� In addition, subject to certain conditions, some of the Company’s publicly issued debt will be subject to redemption, in whole or in part, at the option of the holder upon the occurrence of a redemption event, upon not less than five days’ notice prior to the date of redemption, at a redemption price equal to the default amount, plus a specified premium� “Redemption Event” is defined in the indentures as the occurrence of (i) any person or group, together with any affiliate thereof, beneficially owning 50% or more of the voting power of the Company, (ii) any one person or group, or affiliate thereof, succeeding in having a majority of its nominees elected to the Company’s Board of Directors, in each case, without the consent of a majority of the continuing directors of the Company or (iii) both a change of control and a below investment grade rating�
The aggregate annual maturities and scheduled payments of long-term debt, as of year-end 2013, and for the years subsequent to 2013 are:
2014 � � � � � � � � � � � � � � � � � � � � � � � � � � � � � � � � � � � � � � � � � � � � � � � � � $ 1,6162015 � � � � � � � � � � � � � � � � � � � � � � � � � � � � � � � � � � � � � � � � � � � � � � � � � 5242016 � � � � � � � � � � � � � � � � � � � � � � � � � � � � � � � � � � � � � � � � � � � � � � � � � 1,2672017 � � � � � � � � � � � � � � � � � � � � � � � � � � � � � � � � � � � � � � � � � � � � � � � � � 7082018 � � � � � � � � � � � � � � � � � � � � � � � � � � � � � � � � � � � � � � � � � � � � � � � � � 1,003Thereafter � � � � � � � � � � � � � � � � � � � � � � � � � � � � � � � � � � � � � � � � � � � � 5,662
Total debt � � � � � � � � � � � � � � � � � � � � � � � � � � � � � � � � � � � � � � � � � � � � � $10,780
7. d e r i v a t i v e F i N a N c i a l i N S t r u M e N t S
GAAP defines derivatives, requires that derivatives be carried at fair value on the balance sheet, and provides for hedge accounting when certain conditions are met� The Company’s derivative financial instruments are recognized on the balance sheet at fair value� Changes in the fair value of derivative instruments designated as “cash flow” hedges, to the extent the hedges are highly effective, are recorded in other comprehensive income, net of tax effects� Ineffective portions of cash flow hedges, if any, are recognized in current period earnings� Other comprehensive income or loss is reclassified into current period earnings when the hedged transaction affects earnings� Changes in the fair value of derivative instruments designated as “fair value” hedges, along with corresponding changes in the fair values of the hedged assets or liabilities, are recorded in current period earnings� Ineffective portions of fair value hedges, if any, are recognized in current period earnings�
The Company assesses, both at the inception of the hedge and on an ongoing basis, whether derivatives used as hedging instruments are highly effective in offsetting the changes in the fair value or cash flow of the hedged items� If it is determined that a derivative is not highly effective as a hedge or ceases to be highly effective, the Company discontinues hedge accounting prospectively�
Interest Rate Risk Management
The Company is exposed to market risk from fluctuations in interest rates� The Company manages its exposure to interest rate fluctuations through the use of a commercial paper program, interest rate swaps (fair value hedges) and forward-starting interest rate swaps (cash flow hedges)� The Company’s current program relative to interest rate protection contemplates hedging the exposure to changes in the fair value of fixed-rate debt attributable to changes in interest rates� To do this, the Company uses the following guidelines: (i) use average daily outstanding borrowings to determine annual debt amounts subject to interest rate exposure, (ii) limit the average annual amount subject to interest rate reset and the amount of floating rate debt to a combined total of $2,500 or less, (iii) include no leveraged products, and (iv) hedge without regard to profit motive or sensitivity to current mark-to-market status�

A-52
N o t e s t o C o N s o l i d a t e d F i N a N C i a l s t a t e m e N t s , C o N t i N u e d
The Company reviews compliance with these guidelines annually with the Financial Policy Committee of the Board of Directors� These guidelines may change as the Company’s needs dictate�
Fair Value Interest Rate Swaps
The table below summarizes the outstanding interest rate swaps designated as fair value hedges as of February 1, 2014 and February 2, 2013�
2013 2012
PayFloating
PayFixed
PayFloating
PayFixed
Notional amount � � � � � � � � � � � � � � � � � � � � � � � � � � � � � � � � � � � � � � � � � � $ 100 $— $ 475 $—Number of contracts � � � � � � � � � � � � � � � � � � � � � � � � � � � � � � � � � � � � � � � 2 — 6 —Duration in years� � � � � � � � � � � � � � � � � � � � � � � � � � � � � � � � � � � � � � � � � � 4�94 — 1�41 —Average variable rate � � � � � � � � � � � � � � � � � � � � � � � � � � � � � � � � � � � � � � � 5�83 % — 3�29% —Average fixed rate � � � � � � � � � � � � � � � � � � � � � � � � � � � � � � � � � � � � � � � � � 6�80 % — 5�38% —Maturity � � � � � � � � � � � � � � � � � � � � � � � � � � � � � � � � � � � � � � � � � � � � � � � � � December 2018 Between
April 2013 and December 2018
During the first quarter of 2013, four of the Company’s fair value swaps, with a notional amount aggregating $375, matured�
The gain or loss on these derivative instruments as well as the offsetting gain or loss on the hedged items attributable to the hedged risk is recognized in current earnings as “Interest expense�” These gains and losses for 2013 and 2012 were as follows:
Year-To-Date
February 1, 2014 February 2, 2013
Consolidated Statement of Operations Classification
Gain/(Loss) on Swaps
Gain/(Loss) on Borrowings
Gain/(Loss) on Swaps
Gain/(Loss) on Borrowings
Interest Expense � � � � � � � � � � � � � � � � � � � � $(3) $4 $(24) $16
The following table summarizes the location and fair value of derivative instruments designated as fair value hedges on the Company’s Consolidated Balance Sheets:
Asset Derivatives
Fair Value
Derivatives Designated as Fair Value Hedging InstrumentsFebruary 1,
2014February 2,
2013Balance Sheet
Location
Interest Rate Hedges � � � � � � � � � � � � � � � � � � � � � � � � � � � � � � $(2) $1 (Other Long-Term Liabilities)/Other
Assets
Cash Flow Forward-Starting Interest Rate Swaps
As of February 1, 2014, the Company did not have any outstanding forward-starting interest rate swap agreements�
As of February 2, 2013, the Company had 17 forward-starting interest rate swap agreements with maturity dates between April 2013 and January 2014 with an aggregate notional amount totaling $850� In 2012, the Company entered into seven of these forward-starting interest rate swap agreements with an aggregate notional amount totaling $350� A forward-starting interest rate swap is an agreement that effectively hedges the variability in future benchmark interest payments attributable to changes in interest rates on the forecasted issuance of fixed-rate debt� The Company entered into the forward-starting interest rate swaps

A-53
N o t e s t o C o N s o l i d a t e d F i N a N C i a l s t a t e m e N t s , C o N t i N u e d
in order to lock in fixed interest rates on its forecasted issuances of debt in fiscal year 2013� Accordingly, the forward-starting interest rate swaps were designated as cash-flow hedges as defined by GAAP� As of February 2, 2013, the fair value of the interest rate swaps was recorded in other assets and other long-term liabilities for $14 and $9, respectively, and AOCI and accumulated other comprehensive loss for $9 net of tax and $6 net of tax, respectively�
During 2013, the Company terminated 29 forward-starting interest rate swap agreements with maturity dates of April 2013 and January 2014 with an aggregate notional amount totaling $1,700� Twelve of these forward-starting interest rate swap agreements, with an aggregate notional amount totaling $850, were entered into and terminated in 2013� These forward-starting interest rate swap agreements were hedging the variability in future benchmark interest payments attributable to changing interest rates on the forecasted issuance of fixed-rate debt issued in 2013� As discussed in Note 6, the Company issued $3,500 of senior notes in 2013� Since these forward-starting interest rate swap agreements were classified as cash flow hedges, the unamortized loss of $15, $9 net of tax, has been deferred net of tax in AOCI and will be amortized to earnings as the interest payments are made�
The following table summarizes the effect of the Company’s derivative instruments designated as cash flow hedges for 2013 and 2012:
Year-To-Date
Derivatives in Cash Flow Hedging Relationships
Amount of Gain/(Loss) in AOCI on Derivative
(Effective Portion)
Amount of Gain/(Loss) Reclassified from AOCI into Income (Effective
Portion)Location of Gain/(Loss)
Reclassified into Income (Effective Portion)2013 2012 2013 2012
Forward-Starting Interest Rate Swaps, net of tax* � � � � � � � � � $(25) $(14) $(1) $(3) Interest expense
* The amounts of Gain/(Loss) in AOCI on derivatives include unamortized proceeds and payments from forward-starting interest rate swaps once classified as cash flow hedges that were terminated prior to end of 2013�
For the above fair value and cash flow interest rate swaps, the Company has entered into International Swaps and Derivatives Association master netting agreements that permit the net settlement of amounts owed under their respective derivative contracts� Under these master netting agreements, net settlement generally permits the Company or the counterparty to determine the net amount payable for contracts due on the same date and in the same currency for similar types of derivative transactions� These master netting agreements generally also provide for net settlement of all outstanding contracts with a counterparty in the case of an event of default or a termination event�
Collateral is generally not required of the counterparties or of the Company under these master netting agreements� As of February 1, 2014 and February 2, 2013, no cash collateral was received or pledged under the master netting agreements�

A-54
N o t e s t o C o N s o l i d a t e d F i N a N C i a l s t a t e m e N t s , C o N t i N u e d
The effect of the net settlement provisions of these master netting agreements on the Company’s derivative balances upon an event of default or termination event is as follows as of February 1, 2014 and February 2, 2013:
February 1, 2014
Gross Amount
Recognized
Gross Amounts Offset in
the Balance Sheet
Net Amount
Presented in the Balance
Sheet
Gross Amounts Not Offset in the Balance Sheet
Financial Instruments
Cash Collateral
Net Amount
LiabilitiesFair Value Interest Rate Swaps � � � $2 $— $2 $— $— $2
February 2, 2013
Gross Amount
Recognized
Gross Amounts Offset in
the Balance Sheet
Net Amount
Presented in the Balance
Sheet
Gross Amounts Not Offset in the Balance Sheet
Net Amount
Financial Instruments
Cash Collateral
AssetsCash Flow Forward-Starting
Interest Rate Swaps � � � � � � � � � $16 $ (2) $14 $— $— $14Fair Value Interest Rate Swaps � � � 1 — 1 — — 1Total� � � � � � � � � � � � � � � � � � � � � � � � $17 $ (2) $15 $— $— $15
LiabilitiesCash Flow Forward-Starting
Interest Rate Swaps � � � � � � � � � $11 $ (2) $ 9 $— $— $ 9
Commodity Price Protection
The Company enters into purchase commitments for various resources, including raw materials utilized in its manufacturing facilities and energy to be used in its stores, warehouses, manufacturing facilities and administrative offices� The Company enters into commitments expecting to take delivery of and to utilize those resources in the conduct of normal business� Those commitments for which the Company expects to utilize or take delivery in a reasonable amount of time in the normal course of business qualify as normal purchases and normal sales�
8 . F a i r va l u e M e a S u r e M e N t S
GAAP establishes a fair value hierarchy that prioritizes the inputs used to measure fair value� The three levels of the fair value hierarchy defined in the standards are as follows:
Level 1 – Quoted prices are available in active markets for identical assets or liabilities;
Level 2 – Pricing inputs are other than quoted prices in active markets included in Level 1, which are either directly or indirectly observable;
Level 3 – Unobservable pricing inputs in which little or no market activity exists, therefore requiring an entity to develop its own assumptions about the assumptions that market participants would use in pricing an asset or liability�

A-55
N o t e s t o C o N s o l i d a t e d F i N a N C i a l s t a t e m e N t s , C o N t i N u e d
For items carried at (or adjusted to) fair value in the consolidated financial statements, the following tables summarize the fair value of these instruments at February 1, 2014 and February 2, 2013:
February 1, 2014 Fair Value Measurements UsingQuoted Prices in Active Markets for Identical
Assets(Level 1)
Significant Other Observable Inputs
(Level 2)
Significant Unobservable
Inputs(Level 3) Total
Available-for-Sale Securities � � � � � � � � � � � � � � � $36 $— $ — $36Warrants � � � � � � � � � � � � � � � � � � � � � � � � � � � � � � — 16 — 16Long-Lived Assets � � � � � � � � � � � � � � � � � � � � � � � — — 29 29Interest Rate Hedges � � � � � � � � � � � � � � � � � � � � � — (2) — (2)Total� � � � � � � � � � � � � � � � � � � � � � � � � � � � � � � � � � $36 $14 $29 $79
February 2, 2013 Fair Value Measurements UsingQuoted Prices in Active Markets for Identical
Assets(Level 1)
Significant Other Observable Inputs
(Level 2)
Significant Unobservable
Inputs(Level 3) Total
Available-for-Sale Securities � � � � � � � � � � � � � � � $ 8 $ — $20 $28Long-Lived Assets � � � � � � � � � � � � � � � � � � � � � � � — — 8 8Interest Rate Hedges � � � � � � � � � � � � � � � � � � � � � — 6 — 6Total� � � � � � � � � � � � � � � � � � � � � � � � � � � � � � � � � � $ 8 $ 6 $28 $42
In 2013, one of the Company’s available-for-sale securities began trading in an active market� Because of this, the Company transferred the $20 fair value of securities from a Level 3 asset to a Level 1 asset in 2013� In 2013, unrealized gains on the Level 1 available-for-sale securities totaled $8�
The Company values warrants using the Black-Scholes option-pricing model� The Black-Scholes option-pricing model is classified as a Level 2 input�
The Company values interest rate hedges using observable forward yield curves� These forward yield curves are classified as Level 2 inputs�
Fair value measurements of non-financial assets and non-financial liabilities are primarily used in the impairment analysis of goodwill, other intangible assets, long-lived assets and in the valuation of store lease exit costs� The Company reviews goodwill and other intangible assets for impairment annually, during the fourth quarter of each fiscal year, and as circumstances indicate the possibility of impairment� See Note 3 for further discussion related to the Company’s carrying value of goodwill� Long-lived assets and store lease exit costs were measured at fair value on a nonrecurring basis using Level 3 inputs as defined in the fair value hierarchy� See Note 1 for further discussion of the Company’s policies and recorded amounts for impairments of long-lived assets and valuation of store lease exit costs� In 2013, long-lived assets with a carrying amount of $68 were written down to their fair value of $29, resulting in an impairment charge of $39� In 2012, long-lived assets with a carrying amount of $26 were written down to their fair value of $8, resulting in an impairment charge of $18�
Mergers are accounted for using the acquisition method of accounting, which requires that the purchase price paid for an acquisition be allocated to the assets and liabilities acquired based on their estimated fair values as of the effective date of the acquisition, with the excess of the purchase price over the net assets being recorded as goodwill� See Note 2 for further discussion related to the merger with Harris Teeter�

A-56
N o t e s t o C o N s o l i d a t e d F i N a N C i a l s t a t e m e N t s , C o N t i N u e d
F a i r va l u e o F o t h e r F i N a N c i a l i N S t r u M e N t S
Current and Long-term Debt
The fair value of the Company’s long-term debt, including current maturities, was estimated based on the quoted market prices for the same or similar issues adjusted for illiquidity based on available market evidence� If quoted market prices were not available, the fair value was based upon the net present value of the future cash flow using the forward interest rate yield curve in effect at respective year-ends� At February 1, 2014, the fair value of total debt was $11,547 compared to a carrying value of $10,780� At February 2, 2013, the fair value of total debt was $9,339 compared to a carrying value of $8,476�
Cash and Temporary Cash Investments, Store Deposits In-Transit, Receivables, Prepaid and Other Current Assets, Trade Accounts Payable, Accrued Salaries and Wages and Other Current Liabilities
The carrying amounts of these items approximated fair value�
Other Assets
The fair values of these investments were estimated based on quoted market prices for those or similar investments, or estimated cash flows, if appropriate� At February 1, 2014 and February 2, 2013, the carrying and fair value of long-term investments for which fair value is determinable were $51 and $44, respectively�
9 . o t h e r c o M P r e h e N S i v e i N c o M e ( l o S S )
The following table represents the changes in AOCI by component for the year ended February 1, 2014:
Cash Flow Hedging
Activities (1)
Available for sale
Securities (1)
Pension and Postretirement Defined Benefit
Plans (1) Total (1)
Balance at February 2, 2013 � � � � � � � � � � � � � � � � � � $ (14) $ 7 $(746) $(753)OCI before reclassifications (2) � � � � � � � � � � � � � � � (12) 5 197 190Amounts reclassified out of AOCI � � � � � � � � � � � � � 1 — 98 99Net current-period OCI � � � � � � � � � � � � � � � � � � � � � � (11) 5 295 289Balance at February 1, 2014 � � � � � � � � � � � � � � � � � � $ (25) $12 $(451) $(464)
(1) All amounts are net of tax�
(2) Net of tax of $(8), $3 and $116 for cash flow hedging activities, available for sale securities and pension and postretirement defined benefit plans, respectively�
The following table represents the items reclassified out of AOCI and the related tax effects for the year ended February 1, 2014:
February 1, 2014
Gains on cash flow hedging activitiesAmortization of unrealized gains and losses on cash flow hedging activities (1) � � � � � � � $ 2Tax expense � � � � � � � � � � � � � � � � � � � � � � � � � � � � � � � � � � � � � � � � � � � � � � � � � � � � � � � � � � � � (1)Net of tax � � � � � � � � � � � � � � � � � � � � � � � � � � � � � � � � � � � � � � � � � � � � � � � � � � � � � � � � � � � � � � 1
Pension and postretirement defined benefit plan itemsAmortization of amounts included in net periodic pension expense (2)� � � � � � � � � � � � � � 155Tax expense � � � � � � � � � � � � � � � � � � � � � � � � � � � � � � � � � � � � � � � � � � � � � � � � � � � � � � � � � � � � (57)Net of tax � � � � � � � � � � � � � � � � � � � � � � � � � � � � � � � � � � � � � � � � � � � � � � � � � � � � � � � � � � � � � � 98
Total reclassifications, net of tax � � � � � � � � � � � � � � � � � � � � � � � � � � � � � � � � � � � � � � � � � � � � � � � $ 99
(1) Reclassified from AOCI into interest expense�
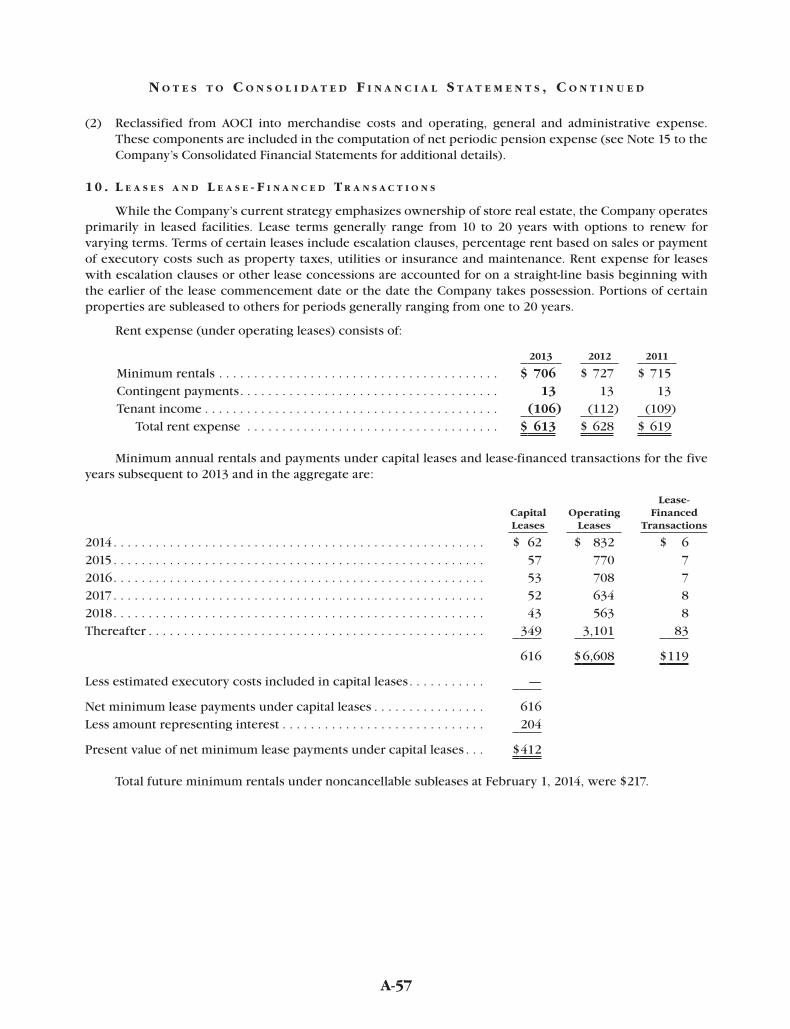
A-57
N o t e s t o C o N s o l i d a t e d F i N a N C i a l s t a t e m e N t s , C o N t i N u e d
(2) Reclassified from AOCI into merchandise costs and operating, general and administrative expense� These components are included in the computation of net periodic pension expense (see Note 15 to the Company’s Consolidated Financial Statements for additional details)�
1 0 . l e a S e S a N d l e a S e - F i N a N c e d t r a N S a c t i o N S
While the Company’s current strategy emphasizes ownership of store real estate, the Company operates primarily in leased facilities� Lease terms generally range from 10 to 20 years with options to renew for varying terms� Terms of certain leases include escalation clauses, percentage rent based on sales or payment of executory costs such as property taxes, utilities or insurance and maintenance� Rent expense for leases with escalation clauses or other lease concessions are accounted for on a straight-line basis beginning with the earlier of the lease commencement date or the date the Company takes possession� Portions of certain properties are subleased to others for periods generally ranging from one to 20 years�
Rent expense (under operating leases) consists of:
2013 2012 2011
Minimum rentals � � � � � � � � � � � � � � � � � � � � � � � � � � � � � � � � � � � � � � � � $ 706 $ 727 $ 715Contingent payments� � � � � � � � � � � � � � � � � � � � � � � � � � � � � � � � � � � � � 13 13 13Tenant income � � � � � � � � � � � � � � � � � � � � � � � � � � � � � � � � � � � � � � � � � � (106) (112) (109)
Total rent expense � � � � � � � � � � � � � � � � � � � � � � � � � � � � � � � � � � � � $ 613 $ 628 $ 619
Minimum annual rentals and payments under capital leases and lease-financed transactions for the five years subsequent to 2013 and in the aggregate are:
CapitalLeases
OperatingLeases
Lease-Financed
Transactions
2014 � � � � � � � � � � � � � � � � � � � � � � � � � � � � � � � � � � � � � � � � � � � � � � � � � � � � � $ 62 $ 832 $ 62015 � � � � � � � � � � � � � � � � � � � � � � � � � � � � � � � � � � � � � � � � � � � � � � � � � � � � � 57 770 72016 � � � � � � � � � � � � � � � � � � � � � � � � � � � � � � � � � � � � � � � � � � � � � � � � � � � � � 53 708 72017 � � � � � � � � � � � � � � � � � � � � � � � � � � � � � � � � � � � � � � � � � � � � � � � � � � � � � 52 634 82018 � � � � � � � � � � � � � � � � � � � � � � � � � � � � � � � � � � � � � � � � � � � � � � � � � � � � � 43 563 8Thereafter � � � � � � � � � � � � � � � � � � � � � � � � � � � � � � � � � � � � � � � � � � � � � � � � 349 3,101 83
616 $6,608 $119
Less estimated executory costs included in capital leases � � � � � � � � � � � —
Net minimum lease payments under capital leases � � � � � � � � � � � � � � � � 616Less amount representing interest � � � � � � � � � � � � � � � � � � � � � � � � � � � � � 204
Present value of net minimum lease payments under capital leases � � � $412
Total future minimum rentals under noncancellable subleases at February 1, 2014, were $217�
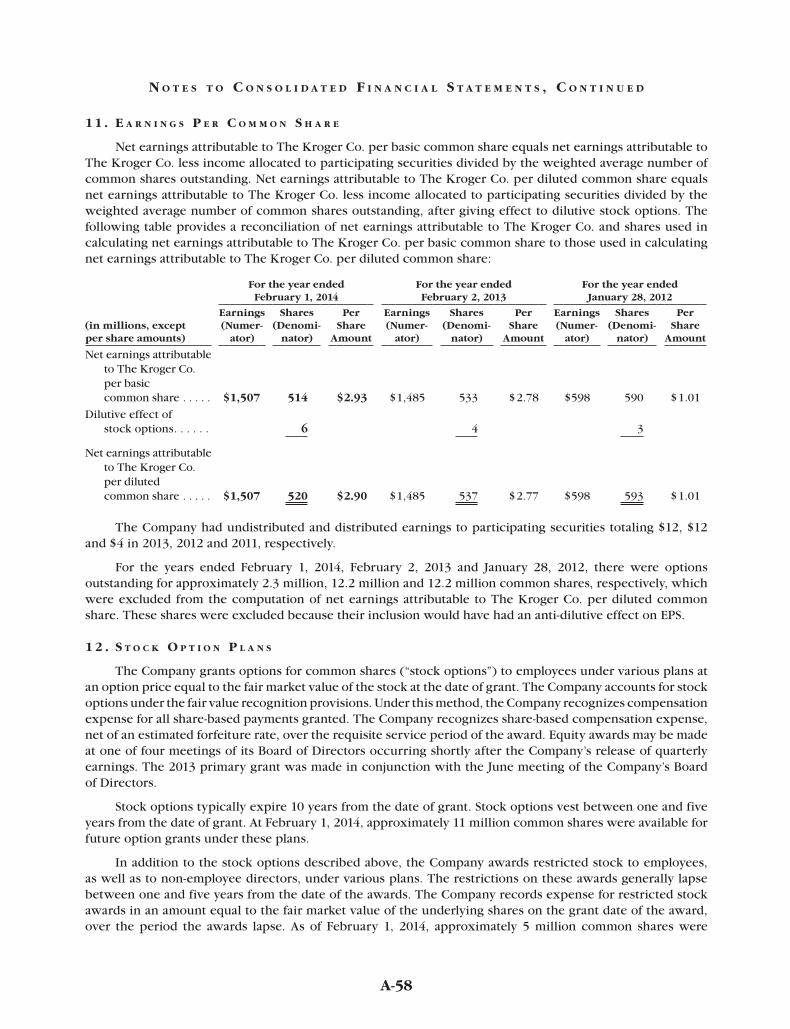
A-58
N o t e s t o C o N s o l i d a t e d F i N a N C i a l s t a t e m e N t s , C o N t i N u e d
1 1 . e a r N i N g S P e r c o M M o N S h a r e
Net earnings attributable to The Kroger Co� per basic common share equals net earnings attributable to The Kroger Co� less income allocated to participating securities divided by the weighted average number of common shares outstanding� Net earnings attributable to The Kroger Co� per diluted common share equals net earnings attributable to The Kroger Co� less income allocated to participating securities divided by the weighted average number of common shares outstanding, after giving effect to dilutive stock options� The following table provides a reconciliation of net earnings attributable to The Kroger Co� and shares used in calculating net earnings attributable to The Kroger Co� per basic common share to those used in calculating net earnings attributable to The Kroger Co� per diluted common share:
For the year endedFebruary 1, 2014
For the year endedFebruary 2, 2013
For the year endedJanuary 28, 2012
(in millions, except per share amounts)
Earnings(Numer-
ator)
Shares(Denomi-
nator)
PerShare
Amount
Earnings(Numer-
ator)
Shares(Denomi-
nator)
PerShare
Amount
Earnings(Numer-
ator)
Shares(Denomi-
nator)
PerShare
Amount
Net earnings attributable to The Kroger Co� per basic common share � � � � � $1,507 514 $2.93 $1,485 533 $2�78 $598 590 $1�01
Dilutive effect of stock options � � � � � � 6 4 3
Net earnings attributable to The Kroger Co� per diluted common share � � � � � $1,507 520 $2.90 $1,485 537 $2�77 $598 593 $1�01
The Company had undistributed and distributed earnings to participating securities totaling $12, $12 and $4 in 2013, 2012 and 2011, respectively�
For the years ended February 1, 2014, February 2, 2013 and January 28, 2012, there were options outstanding for approximately 2�3 million, 12�2 million and 12�2 million common shares, respectively, which were excluded from the computation of net earnings attributable to The Kroger Co� per diluted common share� These shares were excluded because their inclusion would have had an anti-dilutive effect on EPS�
1 2 . S t o c k o P t i o N P l a N S
The Company grants options for common shares (“stock options”) to employees under various plans at an option price equal to the fair market value of the stock at the date of grant� The Company accounts for stock options under the fair value recognition provisions� Under this method, the Company recognizes compensation expense for all share-based payments granted� The Company recognizes share-based compensation expense, net of an estimated forfeiture rate, over the requisite service period of the award� Equity awards may be made at one of four meetings of its Board of Directors occurring shortly after the Company’s release of quarterly earnings� The 2013 primary grant was made in conjunction with the June meeting of the Company’s Board of Directors�
Stock options typically expire 10 years from the date of grant� Stock options vest between one and five years from the date of grant� At February 1, 2014, approximately 11 million common shares were available for future option grants under these plans�
In addition to the stock options described above, the Company awards restricted stock to employees, as well as to non-employee directors, under various plans� The restrictions on these awards generally lapse between one and five years from the date of the awards� The Company records expense for restricted stock awards in an amount equal to the fair market value of the underlying shares on the grant date of the award, over the period the awards lapse� As of February 1, 2014, approximately 5 million common shares were
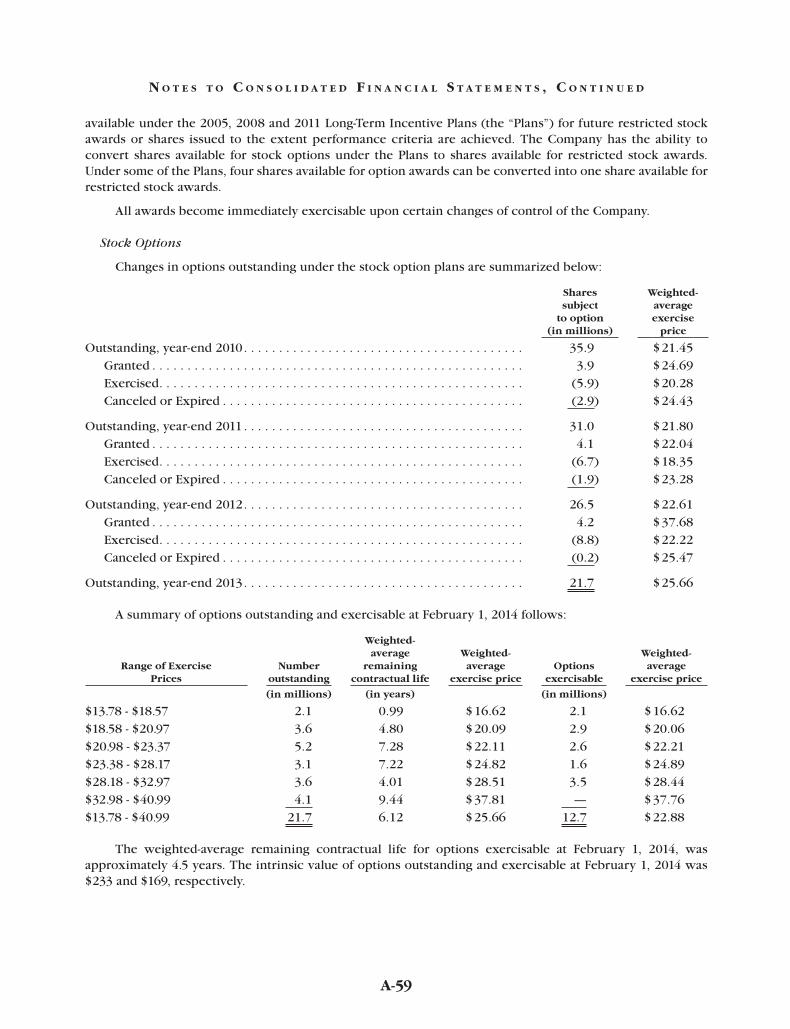
A-59
N o t e s t o C o N s o l i d a t e d F i N a N C i a l s t a t e m e N t s , C o N t i N u e d
available under the 2005, 2008 and 2011 Long-Term Incentive Plans (the “Plans”) for future restricted stock awards or shares issued to the extent performance criteria are achieved� The Company has the ability to convert shares available for stock options under the Plans to shares available for restricted stock awards� Under some of the Plans, four shares available for option awards can be converted into one share available for restricted stock awards�
All awards become immediately exercisable upon certain changes of control of the Company�
Stock Options
Changes in options outstanding under the stock option plans are summarized below:
Sharessubject
to option(in millions)
Weighted- averageexercise
price
Outstanding, year-end 2010� � � � � � � � � � � � � � � � � � � � � � � � � � � � � � � � � � � � � � � � 35�9 $21�45Granted � � � � � � � � � � � � � � � � � � � � � � � � � � � � � � � � � � � � � � � � � � � � � � � � � � � � � 3�9 $24�69Exercised� � � � � � � � � � � � � � � � � � � � � � � � � � � � � � � � � � � � � � � � � � � � � � � � � � � � (5�9) $20�28Canceled or Expired � � � � � � � � � � � � � � � � � � � � � � � � � � � � � � � � � � � � � � � � � � � (2�9) $24�43
Outstanding, year-end 2011 � � � � � � � � � � � � � � � � � � � � � � � � � � � � � � � � � � � � � � � � 31�0 $21�80Granted � � � � � � � � � � � � � � � � � � � � � � � � � � � � � � � � � � � � � � � � � � � � � � � � � � � � � 4�1 $22�04Exercised� � � � � � � � � � � � � � � � � � � � � � � � � � � � � � � � � � � � � � � � � � � � � � � � � � � � (6�7) $18�35Canceled or Expired � � � � � � � � � � � � � � � � � � � � � � � � � � � � � � � � � � � � � � � � � � � (1�9) $23�28
Outstanding, year-end 2012� � � � � � � � � � � � � � � � � � � � � � � � � � � � � � � � � � � � � � � � 26�5 $22�61Granted � � � � � � � � � � � � � � � � � � � � � � � � � � � � � � � � � � � � � � � � � � � � � � � � � � � � � 4�2 $37�68Exercised� � � � � � � � � � � � � � � � � � � � � � � � � � � � � � � � � � � � � � � � � � � � � � � � � � � � (8�8) $22�22Canceled or Expired � � � � � � � � � � � � � � � � � � � � � � � � � � � � � � � � � � � � � � � � � � � (0�2) $25�47
Outstanding, year-end 2013� � � � � � � � � � � � � � � � � � � � � � � � � � � � � � � � � � � � � � � � 21�7 $25�66
A summary of options outstanding and exercisable at February 1, 2014 follows:
Range of Exercise Prices
Numberoutstanding
Weighted-average
remainingcontractual life
Weighted-average
exercise priceOptions
exercisable
Weighted- average
exercise price
(in millions) (in years) (in millions)
$13�78 - $18�57 2�1 0�99 $16�62 2�1 $16�62$18�58 - $20�97 3�6 4�80 $20�09 2�9 $20�06$20�98 - $23�37 5�2 7�28 $22�11 2�6 $22�21$23�38 - $28�17 3�1 7�22 $24�82 1�6 $24�89$28�18 - $32�97 3�6 4�01 $28�51 3�5 $28�44$32�98 - $40�99 4�1 9�44 $37�81 — $37�76$13�78 - $40�99 21�7 6�12 $25�66 12�7 $22�88
The weighted-average remaining contractual life for options exercisable at February 1, 2014, was approximately 4�5 years� The intrinsic value of options outstanding and exercisable at February 1, 2014 was $233 and $169, respectively�

A-60
N o t e s t o C o N s o l i d a t e d F i N a N C i a l s t a t e m e N t s , C o N t i N u e d
Restricted stock
Changes in restricted stock outstanding under the restricted stock plans are summarized below:
Restricted shares
outstanding (in millions)
Weighted-average grant-date fair value
Outstanding, year-end 2010� � � � � � � � � � � � � � � � � � � � � � � � � � � � � � � � � � � � � � 4�4 $22�39Granted � � � � � � � � � � � � � � � � � � � � � � � � � � � � � � � � � � � � � � � � � � � � � � � � � � � 2�5 $24�63Lapsed � � � � � � � � � � � � � � � � � � � � � � � � � � � � � � � � � � � � � � � � � � � � � � � � � � � � (2�5) $21�96Canceled or Expired � � � � � � � � � � � � � � � � � � � � � � � � � � � � � � � � � � � � � � � � � (0�2) $23�80
Outstanding, year-end 2011 � � � � � � � � � � � � � � � � � � � � � � � � � � � � � � � � � � � � � � 4�2 $23�92Granted � � � � � � � � � � � � � � � � � � � � � � � � � � � � � � � � � � � � � � � � � � � � � � � � � � � 2�6 $22�23Lapsed � � � � � � � � � � � � � � � � � � � � � � � � � � � � � � � � � � � � � � � � � � � � � � � � � � � � (2�4) $24�34Canceled or Expired � � � � � � � � � � � � � � � � � � � � � � � � � � � � � � � � � � � � � � � � � (0�1) $23�28
Outstanding, year-end 2012� � � � � � � � � � � � � � � � � � � � � � � � � � � � � � � � � � � � � � 4�3 $22�67Granted � � � � � � � � � � � � � � � � � � � � � � � � � � � � � � � � � � � � � � � � � � � � � � � � � � � 3�2 $37�69Lapsed � � � � � � � � � � � � � � � � � � � � � � � � � � � � � � � � � � � � � � � � � � � � � � � � � � � � (2�5) $22�97Canceled or Expired � � � � � � � � � � � � � � � � � � � � � � � � � � � � � � � � � � � � � � � � � (0�1) $27�31
Outstanding, year-end 2013� � � � � � � � � � � � � � � � � � � � � � � � � � � � � � � � � � � � � � 4�8 $32�31
The weighted-average grant date fair value of stock options granted during 2013, 2012 and 2011 was $8�98, $4�39 and $6�00, respectively� The fair value of each stock option grant was estimated on the date of grant using the Black-Scholes option-pricing model, based on the assumptions shown in the table below� The Black-Scholes model utilizes extensive judgment and financial estimates, including the term employees are expected to retain their stock options before exercising them, the volatility of the Company’s stock price over that expected term, the dividend yield over the term and the number of awards expected to be forfeited before they vest� Using alternative assumptions in the calculation of fair value would produce fair values for stock option grants that could be different than those used to record stock-based compensation expense in the Consolidated Statements of Operations� The increase in the fair value of the stock options granted during 2013, compared to 2012, resulted primarily from an increase in the Company’s share price, an increase in the weighted average risk-free interest rate and a decrease in the expected dividend yield� The decrease in the fair value of the stock options granted during 2012, compared to 2011, resulted primarily from a decrease in the Company’s share price, a decrease in the weighted average risk-free interest rate and an increase in the expected dividend yield�
The following table reflects the weighted-average assumptions used for grants awarded to option holders:
2013 2012 2011
Weighted average expected volatility � � � � � � � � � � � � � � � � � � � � � � � 26.34% 26�49% 26�31%Weighted average risk-free interest rate � � � � � � � � � � � � � � � � � � � � � 1.87% 0�97% 2�16%Expected dividend yield � � � � � � � � � � � � � � � � � � � � � � � � � � � � � � � � � 1.82% 2�49% 1�90%Expected term (based on historical results) � � � � � � � � � � � � � � � � � 6.8 years 6�9 years 6�9 years
The weighted-average risk-free interest rate was based on the yield of a treasury note as of the grant date, continuously compounded, which matures at a date that approximates the expected term of the options� The dividend yield was based on our history and expectation of dividend payouts� Expected volatility was determined based upon historical stock volatilities; however, implied volatility was also considered� Expected term was determined based upon a combination of historical exercise and cancellation experience as well as estimates of expected future exercise and cancellation experience�

A-61
N o t e s t o C o N s o l i d a t e d F i N a N C i a l s t a t e m e N t s , C o N t i N u e d
Total stock compensation recognized in 2013, 2012 and 2011 was $107, $82 and $81, respectively� Stock option compensation recognized in 2013, 2012 and 2011 was $24, $22 and $22, respectively� Restricted shares compensation recognized in 2013, 2012 and 2011 was $83, $60 and $59, respectively�
The total intrinsic value of options exercised was $115, $44 and $24 in 2013, 2012 and 2011, respectively� The total amount of cash received in 2013 by the Company from the exercise of options granted under share-based payment arrangements was $196� As of February 1, 2014, there was $154 of total unrecognized compensation expense remaining related to non-vested share-based compensation arrangements granted under the Company’s equity award plans� This cost is expected to be recognized over a weighted-average period of approximately two years� The total fair value of options that vested was $20, $23 and $33 in 2013, 2012 and 2011, respectively�
Shares issued as a result of stock option exercises may be newly issued shares or reissued treasury shares� Proceeds received from the exercise of options, and the related tax benefit, may be utilized to repurchase the Company’s common shares under a stock repurchase program adopted by the Company’s Board of Directors� During 2013, the Company repurchased approximately eight million common shares in such a manner�
1 3 . c o M M i t M e N t S a N d c o N t i N g e N c i e S
The Company continuously evaluates contingencies based upon the best available evidence�
The Company believes that allowances for loss have been provided to the extent necessary and that its assessment of contingencies is reasonable� To the extent that resolution of contingencies results in amounts that vary from the Company’s estimates, future earnings will be charged or credited�
The principal contingencies are described below:
Insurance — The Company’s workers’ compensation risks are self-insured in most states� In addition, other workers’ compensation risks and certain levels of insured general liability risks are based on retrospective premium plans, deductible plans, and self-insured retention plans� The liability for workers’ compensation risks is accounted for on a present value basis� Actual claim settlements and expenses incident thereto may differ from the provisions for loss� Property risks have been underwritten by a subsidiary and are all reinsured with unrelated insurance companies� Operating divisions and subsidiaries have paid premiums, and the insurance subsidiary has provided loss allowances, based upon actuarially determined estimates�
Litigation — Various claims and lawsuits arising in the normal course of business, including suits charging violations of certain antitrust, wage and hour, or civil rights laws, are pending against the Company� Some of these suits purport or have been determined to be class actions and/or seek substantial damages� Any damages that may be awarded in antitrust cases will be automatically trebled� Although it is not possible at this time to evaluate the merits of all of these claims and lawsuits, nor their likelihood of success, the Company is of the belief that any resulting liability will not have a material adverse effect on the Company’s financial position, results of operations, or cash flows�
The Company continually evaluates its exposure to loss contingencies arising from pending or threatened litigation and believes it has made provisions where the loss contingency can be reasonably estimated and an adverse outcome is probable� Nonetheless, assessing and predicting the outcomes of these matters involves substantial uncertainties� Management currently believes that the aggregate range of loss for the Company’s exposure is not material to the Company� It remains possible that despite management’s current belief, material differences in actual outcomes or changes in management’s evaluation or predictions could arise that could have a material adverse effect on the Company’s financial condition, results of operations, or cash flows�
Assignments — The Company is contingently liable for leases that have been assigned to various third parties in connection with facility closings and dispositions� The Company could be required to satisfy the obligations under the leases if any of the assignees is unable to fulfill its lease obligations� Due to the wide distribution of the Company’s assignments among third parties, and various other remedies available, the Company believes the likelihood that it will be required to assume a material amount of these obligations is remote�

A-62
N o t e s t o C o N s o l i d a t e d F i N a N C i a l s t a t e m e N t s , C o N t i N u e d
14 . S t o c k
Preferred Shares
The Company has authorized five million shares of voting cumulative preferred shares; two million shares were available for issuance at February 1, 2014� The shares have a par value of $100 per share and are issuable in series�
Common Shares
The Company has authorized one billion common shares, $1 par value per share� On May 20, 1999, the shareholders authorized an amendment to the Amended Articles of Incorporation to increase the number of authorized common shares from one billion to two billion when the Board of Directors determines it to be in the best interest of the Company�
Common Stock Repurchase Program
The Company maintains stock repurchase programs that comply with Securities Exchange Act Rule 10b5-1 to allow for the orderly repurchase of The Kroger Co� common shares, from time to time� The Company made open market purchases totaling $338, $1,165 and $1,420 under these repurchase programs in 2013, 2012 and 2011, respectively� In addition to these repurchase programs, in December 1999, the Company began a program to repurchase common shares to reduce dilution resulting from its employee stock option plans� This program is solely funded by proceeds from stock option exercises and the related tax benefit� The Company repurchased approximately $271, $96 and $127 under the stock option program during 2013, 2012 and 2011, respectively�
15 . c o M P a N y - S P o N S o r e d B e N e F i t P l a N S
The Company administers non-contributory defined benefit retirement plans for some non-union employees and union-represented employees as determined by the terms and conditions of collective bargaining agreements� These include several qualified pension plans (the “Qualified Plans”) and non-qualified plans (the “Non-Qualified Plans”)� The Non-Qualified Plans pay benefits to any employee that earns in excess of the maximum allowed for the Qualified Plans by Section 415 of the Internal Revenue Code� The Company only funds obligations under the Qualified Plans� Funding for the pension plans is based on a review of the specific requirements and on evaluation of the assets and liabilities of each plan�
In addition to providing pension benefits, the Company provides certain health care benefits for retired employees� The majority of the Company’s employees may become eligible for these benefits if they reach normal retirement age while employed by the Company� Funding of retiree health care benefits occurs as claims or premiums are paid�
The Company recognizes the funded status of its retirement plans on the Consolidated Balance Sheet� Actuarial gains or losses, prior service costs or credits and transition obligations that have not yet been recognized as part of net periodic benefit cost are required to be recorded as a component of AOCI� All plans are measured as of the Company’s fiscal year end�
Amounts recognized in AOCI as of February 1, 2014 and February 2, 2013 consist of the following (pre-tax):
Pension Benefits Other Benefits Total
2013 2012 2013 2012 2013 2012
Net actuarial loss (gain) � � � � � � � � � � � � � � � � $857 $1,201 $(111) $(15) $746 $1,186Prior service cost (credit) � � � � � � � � � � � � � � � 2 3 (35) (8) (33) (5)
Total� � � � � � � � � � � � � � � � � � � � � � � � � � � � � � � � $859 $1,204 $(146) $(23) $713 $1,181

A-63
N o t e s t o C o N s o l i d a t e d F i N a N C i a l s t a t e m e N t s , C o N t i N u e d
Amounts in AOCI expected to be recognized as components of net periodic pension or postretirement benefit costs in the next fiscal year are as follows (pre-tax):
Pension Benefits
Other Benefits Total
2014 2014 2014
Net actuarial loss (gain) � � � � � � � � � � � � � � � � � � � � � � � � � � � � � � � � � � � � � � � � $52 $ (6) $46Prior service cost (credit) � � � � � � � � � � � � � � � � � � � � � � � � � � � � � � � � � � � � � � � 1 (7) (6)
Total� � � � � � � � � � � � � � � � � � � � � � � � � � � � � � � � � � � � � � � � � � � � � � � � � � � � � � � � $53 $(13) $40
Other changes recognized in other comprehensive income in 2013, 2012 and 2011 were as follows (pre-tax):
Pension Benefits Other Benefits Total
2013 2012 2011 2013 2012 2011 2013 2012 2011
Incurred net actuarial loss (gain) � � � � � $(243) $ (33) $451 $ (97) $ 6 $32 $(340) $ (27) $483Amortization of prior service
credit (cost) � � � � � � � � � � � � � � � � � � � — — (1) 4 4 5 4 4 4Amortization of net actuarial
gain (loss) � � � � � � � � � � � � � � � � � � � � (102) (97) (64) — — 2 (102) (97) (62)Other � � � � � � � � � � � � � � � � � � � � � � � � � � � — — — (30) — — (30) — —Total recognized in other
comprehensive income � � � � � � � � � � (345) (130) 386 (123) 10 39 (468) (120) 425
Total recognized in net periodic benefit cost and other comprehensive income � � � � � � � � � � $(271) $ (41) $456 $ (95) $38 $62 $(366) $ (3) $518
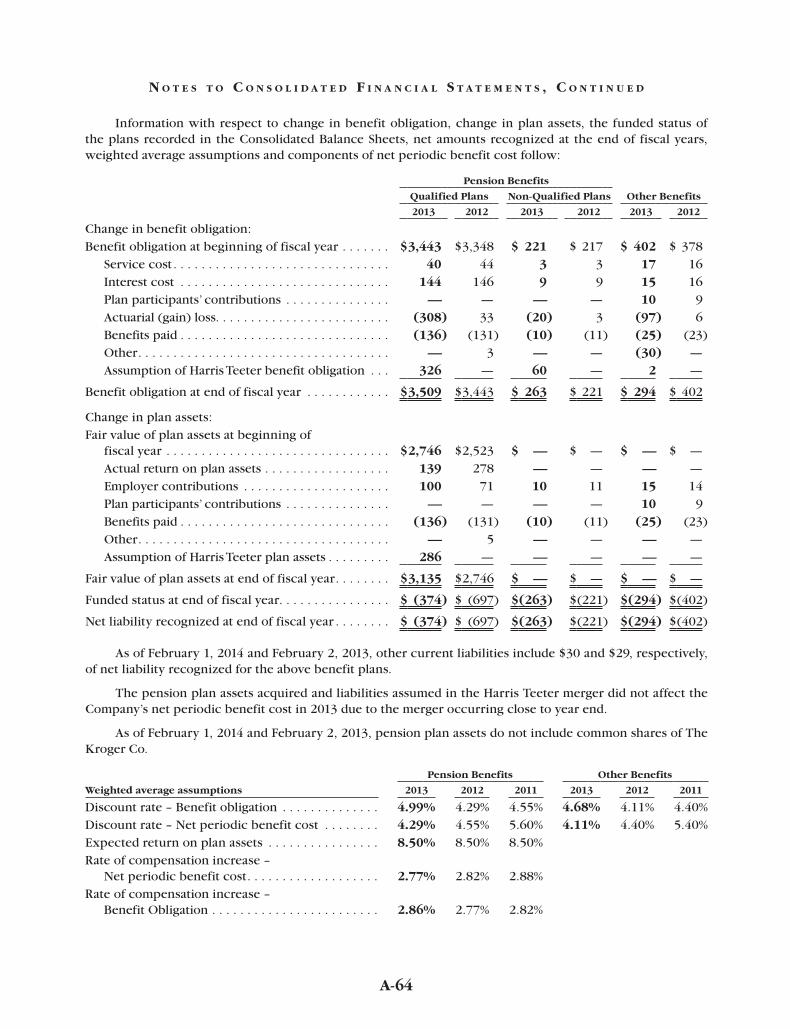
A-64
N o t e s t o C o N s o l i d a t e d F i N a N C i a l s t a t e m e N t s , C o N t i N u e d
Information with respect to change in benefit obligation, change in plan assets, the funded status of the plans recorded in the Consolidated Balance Sheets, net amounts recognized at the end of fiscal years, weighted average assumptions and components of net periodic benefit cost follow:
Pension Benefits
Qualified Plans Non-Qualified Plans Other Benefits
2013 2012 2013 2012 2013 2012
Change in benefit obligation:Benefit obligation at beginning of fiscal year � � � � � � � $3,443 $3,348 $ 221 $ 217 $ 402 $ 378
Service cost � � � � � � � � � � � � � � � � � � � � � � � � � � � � � � � 40 44 3 3 17 16Interest cost � � � � � � � � � � � � � � � � � � � � � � � � � � � � � � 144 146 9 9 15 16Plan participants’ contributions � � � � � � � � � � � � � � � — — — — 10 9Actuarial (gain) loss� � � � � � � � � � � � � � � � � � � � � � � � � (308) 33 (20) 3 (97) 6Benefits paid � � � � � � � � � � � � � � � � � � � � � � � � � � � � � � (136) (131) (10) (11) (25) (23)Other� � � � � � � � � � � � � � � � � � � � � � � � � � � � � � � � � � � � — 3 — — (30) —Assumption of Harris Teeter benefit obligation � � � 326 — 60 — 2 —
Benefit obligation at end of fiscal year � � � � � � � � � � � � $3,509 $3,443 $ 263 $ 221 $ 294 $ 402
Change in plan assets:Fair value of plan assets at beginning of
fiscal year � � � � � � � � � � � � � � � � � � � � � � � � � � � � � � � � $2,746 $2,523 $ — $ — $ — $ —Actual return on plan assets � � � � � � � � � � � � � � � � � � 139 278 — — — —Employer contributions � � � � � � � � � � � � � � � � � � � � � 100 71 10 11 15 14Plan participants’ contributions � � � � � � � � � � � � � � � — — — — 10 9Benefits paid � � � � � � � � � � � � � � � � � � � � � � � � � � � � � � (136) (131) (10) (11) (25) (23)Other� � � � � � � � � � � � � � � � � � � � � � � � � � � � � � � � � � � � — 5 — — — —Assumption of Harris Teeter plan assets � � � � � � � � � 286 — — — — —
Fair value of plan assets at end of fiscal year� � � � � � � � $3,135 $2,746 $ — $ — $ — $ —
Funded status at end of fiscal year� � � � � � � � � � � � � � � � $ (374) $ (697) $(263) $(221) $(294) $(402)
Net liability recognized at end of fiscal year � � � � � � � � $ (374) $ (697) $(263) $(221) $(294) $(402)
As of February 1, 2014 and February 2, 2013, other current liabilities include $30 and $29, respectively, of net liability recognized for the above benefit plans�
The pension plan assets acquired and liabilities assumed in the Harris Teeter merger did not affect the Company’s net periodic benefit cost in 2013 due to the merger occurring close to year end�
As of February 1, 2014 and February 2, 2013, pension plan assets do not include common shares of The Kroger Co�
Pension Benefits Other Benefits
Weighted average assumptions 2013 2012 2011 2013 2012 2011
Discount rate – Benefit obligation � � � � � � � � � � � � � � 4.99% 4�29% 4�55% 4.68% 4�11% 4�40%Discount rate – Net periodic benefit cost � � � � � � � � 4.29% 4�55% 5�60% 4.11% 4�40% 5�40%Expected return on plan assets � � � � � � � � � � � � � � � � 8.50% 8�50% 8�50%Rate of compensation increase –
Net periodic benefit cost � � � � � � � � � � � � � � � � � � � 2.77% 2�82% 2�88%Rate of compensation increase –
Benefit Obligation � � � � � � � � � � � � � � � � � � � � � � � � 2.86% 2�77% 2�82%
A-65
N o t e s t o C o N s o l i d a t e d F i N a N C i a l s t a t e m e N t s , C o N t i N u e d
The Company’s discount rate assumptions were intended to reflect the rates at which the pension benefits could be effectively settled� They take into account the timing and amount of benefits that would be available under the plans� The Company’s policy for selecting the discount rates as of year-end 2013 and 2012 changed from the policy as of year-end 2011� In 2013 and 2012, the Company’s policy was to match the plan’s cash flows to that of a hypothetical bond portfolio whose cash flow from coupons and maturities match the plan’s projected benefit cash flows� The discount rates are the single rates that produce the same present value of cash flows� The selection of the 4�99% and 4�68% discount rates as of year-end 2013 for pension and other benefits, respectively, represents the hypothetical bond portfolio using bonds with an AA or better rating constructed with the assistance of an outside consultant� In 2011, the Company’s policy was to match the plan’s cash flows to that of a yield curve that provides the equivalent yields on zero-coupon corporate bonds for each maturity� Benefit cash flows due in a particular year can theoretically be “settled” by “investing” them in the zero-coupon bond that matures in the same year� The discount rates are the single rates that produce the same present value of cash flows� The selection of the 4�55% and 4�40% discount rates as of year-end 2011 for pension and other benefits, respectively, represents the equivalent single rates constructed under a broad-market AA yield curve constructed with the assistance of an outside consultant� A 100 basis point increase in the discount rate would decrease the projected pension benefit obligation as of February 1, 2014, by approximately $395�
To determine the expected rate of return on pension plan assets held by the Company for 2013, the Company considered current and forecasted plan asset allocations as well as historical and forecasted rates of return on various asset categories� Due to the Harris Teeter merger occurring close to year end, the expected rate of return on pension plan assets acquired in the Harris Teeter merger did not affect our net periodic benefit costs in 2013� For 2013, 2012 and 2011, the Company assumed a pension plan investment return rate of 8�5%� The Company pension plan’s average rate of return was 8�1% for the 10 calendar years ended December 31, 2013, net of all investment management fees and expenses� The value of all investments in the Company-sponsored defined benefit pension plans, excluding pension plan assets acquired in the Harris Teeter merger, during the calendar year ending December 31, 2013 increased 8�0%, net of investment management fees and expenses� For the past 20 years, the Company’s average annual rate of return has been 9�2%� Based on the above information and forward looking assumptions for investments made in a manner consistent with the Company’s target allocations, the Company believes an 8�5% rate of return assumption was reasonable for 2013, 2012 and 2011�
The Company calculates its expected return on plan assets by using the market-related value of plan assets� The market-related value of plan assets is determined by adjusting the actual fair value of plan assets for gains or losses on plan assets� Gains or losses represent the difference between actual and expected returns on plan investments for each plan year� Gains or losses on plan assets are recognized evenly over a five year period� Using a different method to calculate the market-related value of plan assets would provide a different expected return on plan assets�
The funded status increased in 2013, compared to 2012, due primarily to the increase in the discount rate, return on plan assets and contributions to the plan, offset slightly by the update in the mortality assumption�
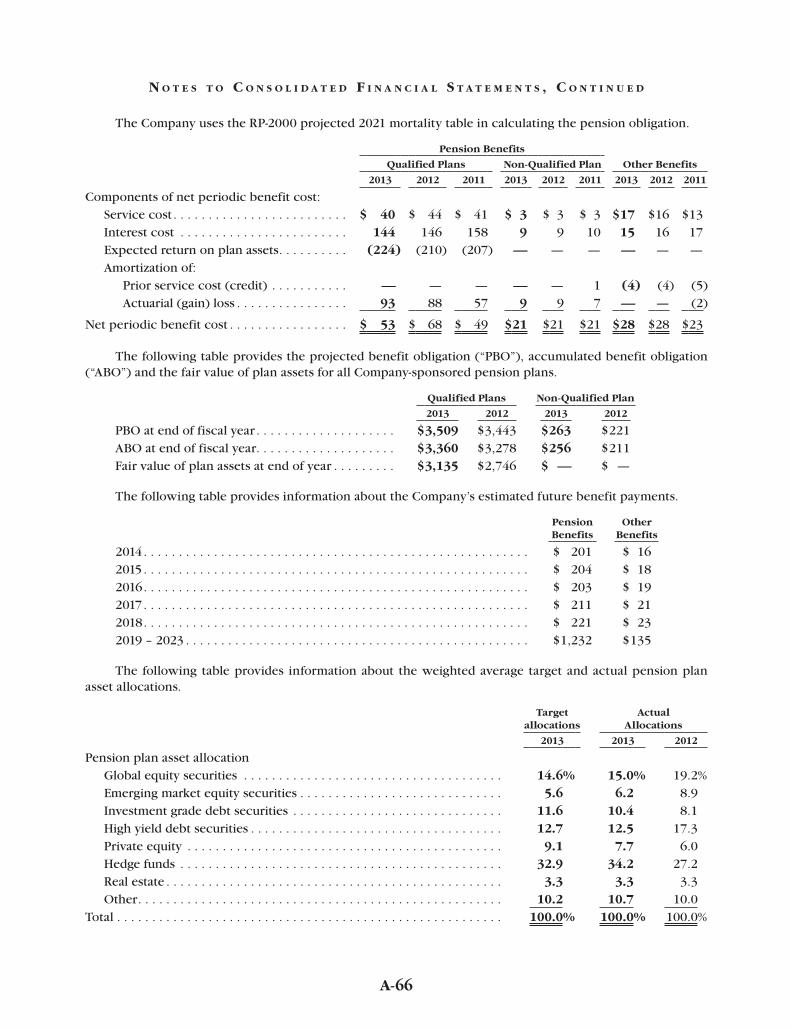
A-66
N o t e s t o C o N s o l i d a t e d F i N a N C i a l s t a t e m e N t s , C o N t i N u e d
The Company uses the RP-2000 projected 2021 mortality table in calculating the pension obligation�
Pension Benefits
Qualified Plans Non-Qualified Plan Other Benefits
2013 2012 2011 2013 2012 2011 2013 2012 2011
Components of net periodic benefit cost:Service cost � � � � � � � � � � � � � � � � � � � � � � � � � $ 40 $ 44 $ 41 $ 3 $ 3 $ 3 $17 $16 $13Interest cost � � � � � � � � � � � � � � � � � � � � � � � � 144 146 158 9 9 10 15 16 17Expected return on plan assets� � � � � � � � � � (224) (210) (207) — — — — — —Amortization of:
Prior service cost (credit) � � � � � � � � � � � — — — — — 1 (4) (4) (5)Actuarial (gain) loss � � � � � � � � � � � � � � � � 93 88 57 9 9 7 — — (2)
Net periodic benefit cost � � � � � � � � � � � � � � � � � $ 53 $ 68 $ 49 $21 $21 $21 $28 $28 $23
The following table provides the projected benefit obligation (“PBO”), accumulated benefit obligation (“ABO”) and the fair value of plan assets for all Company-sponsored pension plans�
Qualified Plans Non-Qualified Plan
2013 2012 2013 2012
PBO at end of fiscal year � � � � � � � � � � � � � � � � � � � � $3,509 $3,443 $263 $221ABO at end of fiscal year � � � � � � � � � � � � � � � � � � � � $3,360 $3,278 $256 $211Fair value of plan assets at end of year � � � � � � � � � $3,135 $2,746 $ — $ —
The following table provides information about the Company’s estimated future benefit payments�
Pension Benefits
Other Benefits
2014 � � � � � � � � � � � � � � � � � � � � � � � � � � � � � � � � � � � � � � � � � � � � � � � � � � � � � � � $ 201 $ 162015 � � � � � � � � � � � � � � � � � � � � � � � � � � � � � � � � � � � � � � � � � � � � � � � � � � � � � � � $ 204 $ 182016 � � � � � � � � � � � � � � � � � � � � � � � � � � � � � � � � � � � � � � � � � � � � � � � � � � � � � � � $ 203 $ 192017 � � � � � � � � � � � � � � � � � � � � � � � � � � � � � � � � � � � � � � � � � � � � � � � � � � � � � � � $ 211 $ 212018 � � � � � � � � � � � � � � � � � � � � � � � � � � � � � � � � � � � � � � � � � � � � � � � � � � � � � � � $ 221 $ 232019 – 2023 � � � � � � � � � � � � � � � � � � � � � � � � � � � � � � � � � � � � � � � � � � � � � � � � � $1,232 $135
The following table provides information about the weighted average target and actual pension plan asset allocations�
Target allocations
ActualAllocations
2013 2013 2012
Pension plan asset allocationGlobal equity securities � � � � � � � � � � � � � � � � � � � � � � � � � � � � � � � � � � � � � 14.6% 15.0% 19�2%Emerging market equity securities � � � � � � � � � � � � � � � � � � � � � � � � � � � � � 5.6 6.2 8�9Investment grade debt securities � � � � � � � � � � � � � � � � � � � � � � � � � � � � � � 11.6 10.4 8�1High yield debt securities � � � � � � � � � � � � � � � � � � � � � � � � � � � � � � � � � � � � 12.7 12.5 17�3Private equity � � � � � � � � � � � � � � � � � � � � � � � � � � � � � � � � � � � � � � � � � � � � � 9.1 7.7 6�0Hedge funds � � � � � � � � � � � � � � � � � � � � � � � � � � � � � � � � � � � � � � � � � � � � � � 32.9 34.2 27�2Real estate � � � � � � � � � � � � � � � � � � � � � � � � � � � � � � � � � � � � � � � � � � � � � � � � 3.3 3.3 3�3Other� � � � � � � � � � � � � � � � � � � � � � � � � � � � � � � � � � � � � � � � � � � � � � � � � � � � 10.2 10.7 10�0
Total � � � � � � � � � � � � � � � � � � � � � � � � � � � � � � � � � � � � � � � � � � � � � � � � � � � � � � � 100.0% 100.0% 100�0%

A-67
N o t e s t o C o N s o l i d a t e d F i N a N C i a l s t a t e m e N t s , C o N t i N u e d
Investment objectives, policies and strategies are set by the Pension Investment Committees (the “Committees”) appointed by the CEO� The primary objectives include holding and investing the assets and distributing benefits to participants and beneficiaries of the pension plans� Investment objectives have been established based on a comprehensive review of the capital markets and each underlying plan’s current and projected financial requirements� The time horizon of the investment objectives is long-term in nature and plan assets are managed on a going-concern basis�
Investment objectives and guidelines specifically applicable to each manager of assets are established and reviewed annually� Derivative instruments may be used for specified purposes, including rebalancing exposures to certain asset classes� Any use of derivative instruments for a purpose or in a manner not specifically authorized is prohibited, unless approved in advance by the Committees�
The current target allocations shown represent a combination of the 2013 targets established by the Company in 2012 and allocation targets on assets acquired as part of the merger with Harris Teeter� The Company will rebalance by liquidating assets whose allocation materially exceeds target, if possible, and investing in assets whose allocation is materially below target� If markets are illiquid, the Company may not be able to rebalance to target quickly� To maintain actual asset allocations consistent with target allocations, assets are reallocated or rebalanced periodically� In addition, cash flow from employer contributions and participant benefit payments can be used to fund underweight asset classes and divest overweight asset classes, as appropriate� The Company expects that cash flow will be sufficient to meet most rebalancing needs�
The Company is not required and does not expect to make any contributions to the Company-sponsored defined benefit pension plans in 2014� If the Company does make any contributions in 2014, the Company expects these contributions will decrease its required contributions in future years� Among other things, investment performance of plan assets, the interest rates required to be used to calculate the pension obligations, and future changes in legislation, will determine the amounts of any contributions� The Company expects 2014 expense for Company-sponsored defined benefit pension plans to be approximately $40� In addition, the Company expects 401(k) Retirement Savings Account Plan cash contributions and expense from automatic and matching contributions to participants to increase approximately $30 in 2014 compared to 2013 primarily due to the Harris Teeter merger�
Assumed health care cost trend rates have a significant effect on the amounts reported for the health care plans� The Company used a 7�10% initial health care cost trend rate and a 4�50% ultimate health care cost trend rate to determine its expense� A one-percentage-point change in the assumed health care cost trend rates would have the following effects:
1% Point Increase
1% Point Decrease
Effect on total of service and interest cost components � � � � � � � � � � � � � � � � � � � � � � � � � $ 5 $ (4)Effect on postretirement benefit obligation � � � � � � � � � � � � � � � � � � � � � � � � � � � � � � � � � � � $ 31 $ (26)

A-68
N o t e s t o C o N s o l i d a t e d F i N a N C i a l s t a t e m e N t s , C o N t i N u e d
The following table sets forth by level, within the fair value hierarchy, the Plan’s assets at fair value as of February 1, 2014 and February 2, 2013:
a S S e t S a t F a i r va l u e a S o F F e B r u a r y 1 , 2 0 14
Quoted Prices in Active Markets for Identical
Assets (Level 1)
Significant Other
Observable Inputs
(Level 2)
Significant Unobservable
Inputs (Level 3) Total
Cash and cash equivalents � � � � � � � � � � � � � � � � � � � $ 26 $ — $ — $ 26Corporate Stocks � � � � � � � � � � � � � � � � � � � � � � � � � � � 326 — — 326Corporate Bonds � � � � � � � � � � � � � � � � � � � � � � � � � � � — 94 — 94U�S� Government Securities � � � � � � � � � � � � � � � � � � — 60 — 60Mutual Funds/Collective Trusts � � � � � � � � � � � � � � � 303 419 39 761Partnerships/Joint Ventures � � � � � � � � � � � � � � � � � � — 317 — 317Hedge Funds � � � � � � � � � � � � � � � � � � � � � � � � � � � � � � — — 1,073 1,073Private Equity � � � � � � � � � � � � � � � � � � � � � � � � � � � � � — — 243 243Real Estate � � � � � � � � � � � � � � � � � � � � � � � � � � � � � � � � — — 96 96Other � � � � � � � � � � � � � � � � � � � � � � � � � � � � � � � � � � � � — 139 — 139Total� � � � � � � � � � � � � � � � � � � � � � � � � � � � � � � � � � � � � $655 $1,029 $1,451 $3,135
a S S e t S a t F a i r va l u e a S o F F e B r u a r y 2 , 2 0 1 3
Quoted Prices in Active Markets for Identical
Assets (Level 1)
Significant Other
Observable Inputs
(Level 2)
Significant Unobservable
Inputs (Level 3) Total
Cash and cash equivalents � � � � � � � � � � � � � � � � � � � $ 17 $ — $ — $ 17Corporate Stocks � � � � � � � � � � � � � � � � � � � � � � � � � � � 375 — — 375Corporate Bonds � � � � � � � � � � � � � � � � � � � � � � � � � � � — 72 — 72U�S� Government Securities � � � � � � � � � � � � � � � � � � — 66 — 66Mutual Funds/Collective Trusts � � � � � � � � � � � � � � � 130 559 — 689Partnerships/Joint Ventures � � � � � � � � � � � � � � � � � � — 378 — 378Hedge Funds � � � � � � � � � � � � � � � � � � � � � � � � � � � � � � — — 739 739Private Equity � � � � � � � � � � � � � � � � � � � � � � � � � � � � � — — 180 180Real Estate � � � � � � � � � � � � � � � � � � � � � � � � � � � � � � � � — — 91 91Other � � � � � � � � � � � � � � � � � � � � � � � � � � � � � � � � � � � � — 139 — 139Total� � � � � � � � � � � � � � � � � � � � � � � � � � � � � � � � � � � � � $522 $1,214 $1,010 $2,746

A-69
N o t e s t o C o N s o l i d a t e d F i N a N C i a l s t a t e m e N t s , C o N t i N u e d
For measurements using significant unobservable inputs (Level 3) during 2013 and 2012, a reconciliation of the beginning and ending balances is as follows:
Hedge Funds Private Equity Real Estate Collective Trusts
Ending balance, January 28, 2012 � � � � � � � � � � $ 579 $159 $ 81 $—Contributions into Fund � � � � � � � � � � � � � � � � � 175 49 23 —Realized gains � � � � � � � � � � � � � � � � � � � � � � � � � 11 15 3 —Unrealized gains � � � � � � � � � � � � � � � � � � � � � � � 55 — 2 —Distributions � � � � � � � � � � � � � � � � � � � � � � � � � � (81) (49) (22) —Other � � � � � � � � � � � � � � � � � � � � � � � � � � � � � � � � — 6 4 —
Ending balance, February 2, 2013 � � � � � � � � � 739 180 91 —Contributions into Fund � � � � � � � � � � � � � � � � � 297 74 22 —Realized gains � � � � � � � � � � � � � � � � � � � � � � � � � 7 12 11 —Unrealized gains � � � � � � � � � � � � � � � � � � � � � � � 71 17 — —Distributions � � � � � � � � � � � � � � � � � � � � � � � � � � (88) (47) (27) —Other � � � � � � � � � � � � � � � � � � � � � � � � � � � � � � � � — 7 (1) —Assumption of Harris Teeter plan assets � � � � 47 — — 39
Ending balance, February 1, 2014 � � � � � � � � � � $1,073 $243 $ 96 $39
See Note 8 for a discussion of the levels of the fair value hierarchy� The assets’ fair value measurement level above is based on the lowest level of any input that is significant to the fair value measurement�
The following is a description of the valuation methods used for the plan’s assets measured at fair value in the above tables:
• Cashandcashequivalents:Thecarryingvalueapproximatesfairvalue.
• Corporate Stocks: The fair values of these securities are based on observablemarket quotations foridentical assets and are valued at the closing price reported on the active market on which the individual securities are traded�
• CorporateBonds:Thefairvaluesofthesesecuritiesareprimarilybasedonobservablemarketquotationsfor similar bonds, valued at the closing price reported on the active market on which the individual securities are traded� When such quoted prices are not available, the bonds are valued using a discounted cash flow approach using current yields on similar instruments of issuers with similar credit ratings, including adjustments for certain risks that may not be observable, such as credit and liquidity risks�
• U.S.GovernmentSecurities:CertainU.S.Governmentsecuritiesarevaluedattheclosingpricereportedin the active market in which the security is traded� Other U�S� government securities are valued based on yields currently available on comparable securities of issuers with similar credit ratings� When quoted prices are not available for similar securities, the security is valued under a discounted cash flow approach that maximizes observable inputs, such as current yields of similar instruments, but includes adjustments for certain risks that may not be observable, such as credit and liquidity risks�
• MutualFunds/CollectiveTrusts:Themutualfunds/collectivetrustfundsarepublicinvestmentvehiclesvalued using a Net Asset Value (NAV) provided by the manager of each fund� The NAV is based on the underlying net assets owned by the fund, divided by the number of shares outstanding� The NAV’s unit price is quoted on a private market that is not active� However, the NAV is based on the fair value of the underlying securities within the fund, which are traded on an active market, and valued at the closing price reported on the active market on which those individual securities are traded�
• Partnerships/Joint Ventures: These funds consist primarily of U.S. government securities, CorporateBonds, Corporate Stocks, and derivatives, which are valued in a manner consistent with these types of investments, noted above�

A-70
N o t e s t o C o N s o l i d a t e d F i N a N C i a l s t a t e m e N t s , C o N t i N u e d
• HedgeFunds:HedgefundsareprivateinvestmentvehiclesvaluedusingaNetAssetValue(NAV)providedby the manager of each fund� The NAV is based on the underlying net assets owned by the fund, divided by the number of shares outstanding� The NAV’s unit price is quoted on a private market that is not active� The NAV is based on the fair value of the underlying securities within the funds, which may be traded on an active market, and valued at the closing price reported on the active market on which those individual securities are traded� For investments not traded on an active market, or for which a quoted price is not publicly available, a variety of unobservable valuation methodologies, including discounted cash flow, market multiple and cost valuation approaches, are employed by the fund manager to value investments� Fair values of all investments are adjusted annually, if necessary, based on audits of the Hedge Fund financial statements; such adjustments are reflected in the fair value of the plan’s assets�
• PrivateEquity:PrivateEquityinvestmentsarevaluedbasedonthefairvalueoftheunderlyingsecuritieswithin the fund, which include investments both traded on an active market and not traded on an active market� For those investments that are traded on an active market, the values are based on the closing price reported on the active market on which those individual securities are traded� For investments not traded on an active market, or for which a quoted price is not publicly available, a variety of unobservable valuation methodologies, including discounted cash flow, market multiple and cost valuation approaches, are employed by the fund manager to value investments� Fair values of all investments are adjusted annually, if necessary, based on audits of the private equity fund financial statements; such adjustments are reflected in the fair value of the plan’s assets�
• RealEstate:Realestateinvestmentsincludeinvestmentsinrealestatefundsmanagedbyafundmanager.These investments are valued using a variety of unobservable valuation methodologies, including discounted cash flow, market multiple and cost valuation approaches�
The methods described above may produce a fair value calculation that may not be indicative of net realizable value or reflective of future fair values� Furthermore, while the plan believes its valuation methods are appropriate and consistent with other market participants, the use of different methodologies or assumptions to determine the fair value of certain financial instruments could result in a different fair value measurement�
The Company contributed and expensed $148, $140 and $130 to employee 401(k) retirement savings accounts in 2013, 2012 and 2011, respectively� The 401(k) retirement savings account plan provides to eligible employees both matching contributions and automatic contributions from the Company based on participant contributions, compensation as defined by the plan, and length of service�
The Company also administers other defined contribution plans for eligible employees� The cost of these plans was $5, $7 and $6 for 2013, 2012 and 2011, respectively�
1 6 . M u l t i - e M P l o y e r P e N S i o N P l a N S
The Company contributes to various multi-employer pension plans based on obligations arising from collective bargaining agreements� These plans provide retirement benefits to participants based on their service to contributing employers� The benefits are paid from assets held in trust for that purpose� Trustees are appointed in equal number by employers and unions� The trustees typically are responsible for determining the level of benefits to be provided to participants as well as for such matters as the investment of the assets and the administration of the plans�
In the fourth quarter of 2011, the Company entered into a memorandum of understanding (“MOU”) with 14 locals of the UFCW that participated in four multi-employer pension funds� The MOU established a process that amended each of the collective bargaining agreements between the Company and the UFCW locals under which the Company made contributions to these funds and consolidated the four multi-employer pension funds into one multi-employer pension fund�

A-71
N o t e s t o C o N s o l i d a t e d F i N a N C i a l s t a t e m e N t s , C o N t i N u e d
Under the terms of the MOU, the locals of the UFCW agreed to a future pension benefit formula through 2021� The Company was designated as the named fiduciary of the new consolidated pension plan with sole investment authority over the assets� If investment results fail to meet expectations, the Company could be responsible for the shortfall� The Company committed to contribute sufficient funds to cover the actuarial cost of current accruals and to fund the pre-consolidation Unfunded Actuarial Accrued Liability (“UAAL”) that existed as of December 31, 2011, in a series of installments on or before March 31, 2018� At January 1, 2012, the UAAL was estimated to be $911 (pre-tax)� In accordance with GAAP, the Company expensed $911 in 2011 related to the UAAL� The expense was based on a preliminary estimate of the contractual commitment� In 2012, the Company finalized the UAAL contractual commitment and recorded an adjustment that reduced the 2011 estimated commitment by $53 (pre-tax)� The final UAAL contractual commitment, at January 1, 2012, was $858 (pre-tax)� In the fourth quarter of 2011, the Company contributed $650 to the consolidated multi-employer pension plan of which $600 was allocated to the UAAL and $50 was allocated to service and interest costs and expensed in 2011� In the fourth quarter of 2012, the Company contributed $258 to the consolidated multi-employer pension plan to fully fund the Company’s UAAL contractual commitment� Future contributions will be dependent, among other things, on the investment performance of assets in the plan� The funding commitments under the MOU replace the prior commitments under the four existing funds to pay an agreed upon amount per hour worked by eligible employees�
The Company recognizes expense in connection with its multi-employer pension plans as contributions are funded, or in the case of the UFCW consolidated pension plan, when commitments are made� The Company made contributions to these funds of $228 in 2013, $492 in 2012 and $946 in 2011� The cash contributions for 2012 and 2011 include the Company’s $258 and $650 contributions described above, respectively, to the UFCW consolidated pension plan in the fourth quarter of each year�
The risks of participating in multi-employer pension plans are different from the risks of participating in single-employer pension plans in the following respects:
a� Assets contributed to the multi-employer plan by one employer may be used to provide benefits to employees of other participating employers�
b� If a participating employer stops contributing to the plan, the unfunded obligations of the plan allocable to such withdrawing employer may be borne by the remaining participating employers�
c� If the Company stops participating in some of its multi-employer pension plans, the Company may be required to pay those plans an amount based on its allocable share of the underfunded status of the plan, referred to as a withdrawal liability�
The Company’s participation in these plans is outlined in the following tables� The EIN / Pension Plan Number column provides the Employer Identification Number (“EIN”) and the three-digit pension plan number� The most recent Pension Protection Act Zone Status available in 2013 and 2012 is for the plan’s year-end at December 31, 2012 and December 31, 2011, respectively� Among other factors, generally, plans in the red zone are less than 65 percent funded, plans in the yellow zone are less than 80 percent funded and plans in the green zone are at least 80 percent funded� The FIP/RP Status Pending / Implemented Column indicates plans for which a funding improvement plan (“FIP”) or a rehabilitation plan (“RP”) is either pending or has been implemented� Unless otherwise noted, the information for these tables was obtained from the Forms 5500 filed for each plan’s year-end at December 31, 2012 and December 31, 2011� The multi-employer contributions listed in the table below are the Company’s multi-employer contributions made in fiscal years 2013, 2012 and 2011�

A-72
N o t e s t o C o N s o l i d a t e d F i N a N C i a l s t a t e m e N t s , C o N t i N u e d
The following table contains information about the Company’s multi-employer pension plans:
Pension FundEIN / PensionPlan Number
Pension Protection
Act Zone Status
FIP/RP Status
Pending/Implemented
SurchargeImposed (7)
Multi-Employer Contributions
2013 2012 2013 2012 2011
SO CA UFCW Unions & Food Employers Joint Pension Trust Fund (1) (2) � � � � � � � � � � 95-1939092 - 001 Red Red Implemented $ 45 $ 43 $ 40 No
BD of Trustees of UNTD Food and Commercial (1) (5) � � � � � � 58-6101602 - 001 N/A Red N/A — — 59 No
Desert States Employers & UFCW Unions Pension Plan (1) � � � � � 84-6277982 - 001 Green Green No 23 22 20 No
UFCW Unions and Food Employers Pension Plan of Central Ohio (1) (5) � � � � � � � � 31-6089168 - 001 N/A Green N/A — — 23 No
Sound Retirement Trust (formerly Retail Clerks Pension Plan) (1) (3) � � � � � � � � 91-6069306 – 001 Red Red Implemented 13 12 10 No
Rocky Mountain UFCW Unions and Employers Pension Plan (1) � � � � � � � � � � � � � � � � � � 84-6045986 - 001 Green Green No 17 17 16 No
Indiana UFCW Unions and Retail Food Employers Pension Plan (1) (5) � � � � � � � � � 35-6244695 - 001 N/A Red N/A — — 5 No
Oregon Retail Employees Pension Plan (1) � � � � � � � � � � � 93-6074377 - 001 Red Red Implemented 7 7 6 No
Bakery and Confectionary Union & Industry International Pension Fund (1) � � � � � � � � � � � 52-6118572 - 001 Red Red Implemented 12 10 9 No
Washington Meat Industry Pension Trust (1) (4) � � � � � � � � 91-6134141 - 001 Red Red Implemented 3 3 2 No
Retail Food Employers & UFCW Local 711 Pension (1) � � � � � � � 51-6031512 - 001 Red Red Implemented 8 8 7 No
Denver Area Meat Cutters and Employers Pension Plan (1) � � � � 84-6097461 - 001 Green Green No 8 8 8 No
United Food & Commercial Workers Intl Union – Industry Pension Fund (1) (4) � � � � � � � � 51-6055922 - 001 Green Green No 33 33 33 No
Northwest Ohio UFCW Union and Employers Joint Pension Fund (1) (5) � � � � � � � � 34-0947187 - 001 N/A Green N/A — — 2 No
Western Conference of Teamsters Pension Plan � � � � � 91-6145047 - 001 Green Green No 31 30 31 No
Central States, Southeast & Southwest Areas Pension Plan � � � � � � � � � � � � � � 36-6044243 - 001 Red Red Implemented 15 12 14 No
UFCW Consolidated Pension Plan (1) (6) � � � � � � � � � 58-6101602 – 001 Green N/A No — 275 650 No
Other � � � � � � � � � � � � � � � � � � � � � � � 13 12 11
Total Contributions � � � � � � � � � � � � $228 $ 492 $ 946
(1) The Company’s multi-employer contributions to these respective funds represent more than 5% of the total contributions received by the pension funds�

A-73
N o t e s t o C o N s o l i d a t e d F i N a N C i a l s t a t e m e N t s , C o N t i N u e d
(2) The information for this fund was obtained from the Form 5500 filed for the plan’s year-end at March 31, 2013 and March 31, 2012�
(3) The information for this fund was obtained from the Form 5500 filed for the plan’s year-end at September 30, 2012 and September 30, 2011�
(4) The information for this fund was obtained from the Form 5500 filed for the plan’s year-end at June 30, 2012 and June 30, 2011�
(5) As of December 31, 2011, these four pension funds were consolidated into the UFCW consolidated pension plan� See the above information regarding this multi-employer pension fund consolidation�
(6) The UFCW consolidated pension plan was formed on January 1, 2012, as the result of the consolidation of four existing multi-employer pension plans� See the above information regarding this multi-employer pension fund consolidation�
(7) Under the Pension Protection Act, a surcharge may be imposed when employers make contributions under a collective bargaining agreement that is not in compliance with a rehabilitation plan� As of February 1, 2014, the collective bargaining agreements under which the Company was making contributions were in compliance with rehabilitation plans adopted by the applicable pension fund�
The following table describes (a) the expiration date of the Company’s collective bargaining agreements and (b) the expiration date of the Company’s most significant collective bargaining agreements for each of the material multi-employer funds in which the Company participates�
Pension Fund
Expiration Dateof CollectiveBargainingAgreement
Most Significant CollectiveBargaining Agreements (1)
(not in millions)
Count Expiration
SO CA UFCW Unions & Food Employers Joint Pension Trust Fund
March 2014 (2) to June 2014 2
March 2014 (2) to June 2014
UFCW Consolidated Pension Plan (3)July 2013 (2) to
June 2017 8October 2013 (2) to
June 2017
Desert States Employers & UFCW Unions Pension PlanJune 2014 to October 2014 1 October 2014
Sound Retirement Trust (formerly Retail Clerks Pension Plan)May 2016 to
December 2016 2May 2016 to August 2016
Rocky Mountain UFCW Unions and Employers Pension PlanSeptember 2015 to
October 2015 1 September 2015
Oregon Retail Employees Pension PlanApril 2013 (2) to
October 2016 3August 2015 to
June 2016Bakery and Confectionary Union & Industry
International Pension FundMay 2011 (2) to September 2017 4
May 2014 to August 2016
Washington Meat Industry Pension TrustJanuary 2015 to
July 2016 1 May 2016
Retail Food Employers & UFCW Local 711 PensionApril 2013 (2) to
March 2015 2 March 2015
Denver Area Meat Cutters and Employers Pension PlanSeptember 2015 to
October 2015 1 September 2015United Food & Commercial Workers Intl Union – Industry
Pension FundJuly 2013 (2) to
June 2017 2April 2015 to March 2017
Western Conference of Teamsters Pension PlanApril 2014 to
April 2018 5July 2014 to
September 2015Central States, Southeast & Southwest Areas Pension Plan September 2014 2 September 2014

A-74
N o t e s t o C o N s o l i d a t e d F i N a N C i a l s t a t e m e N t s , C o N t i N u e d
(1) This column represents the number of significant collective bargaining agreements and their expiration date for each of the Company’s pension funds listed above� For purposes of this table, the “significant collective bargaining agreements” are the largest based on covered employees that, when aggregated, cover the majority of the employees for which we make multi-employer contributions for the referenced pension fund�
(2) Certain collective bargaining agreements for each of these pension funds are operating under an extension�
(3) As of January 1, 2012, four multi-employer pension funds were consolidated into the UFCW consolidated pension plan� See the above information regarding this multi-employer pension fund consolidation�
Based on the most recent information available to it, the Company believes that the present value of actuarial accrued liabilities in most of these multi-employer plans substantially exceeds the value of the assets held in trust to pay benefits� Moreover, if the Company were to exit certain markets or otherwise cease making contributions to these funds, the Company could trigger a substantial withdrawal liability� Any adjustment for withdrawal liability will be recorded when it is probable that a liability exists and can be reasonably estimated�
The Company also contributes to various other multi-employer benefit plans that provide health and welfare benefits to active and retired participants� Total contributions made by the Company to these other multi-employer benefit plans were approximately $1,100 in 2013, $1,100 in 2012 and $1,000 in 2011�
17. r e c e N t l y a d o P t e d a c c o u N t i N g S t a N d a r d S
In February 2013, the Financial Accounting Standards Board (“FASB”) amended its standards on comprehensive income by requiring disclosure of information about amounts reclassified out of accumulated other comprehensive income (“AOCI”) by component� Specifically, the amendment requires disclosure of the effect of significant reclassifications out of AOCI on the respective line items in net income in which the item was reclassified if the amount being reclassified is required to be reclassified to net income in its entirety in the same reporting period� It requires cross reference to other disclosures that provide additional detail for amounts that are not required to be reclassified in their entirety in the same reporting period� This new disclosure became effective for the Company beginning February 3, 2013, and is being adopted prospectively in accordance with the standard� See Note 9 to the Company’s Consolidated Financial Statements for the Company’s new disclosures related to this amended standard�
In December 2011, the FASB amended its standards related to offsetting assets and liabilities� This amendment requires entities to disclose both gross and net information about certain instruments and transactions eligible for offset in the statement of financial position and certain instruments and transactions subject to an agreement similar to a master netting agreement� This information is intended to enable users of the financial statements to understand the effect of these arrangements on the Company’s financial position� The new rules became effective for the Company on February 3, 2013� In January 2013, the FASB further amended this standard to limit its scope to derivatives, repurchase and reverse repurchase agreements, securities borrowings and lending transactions� See Note 7 to the Company’s Consolidated Financial Statements for the Company’s new disclosures related to this amended standard�
1 8 . r e c e N t l y i S S u e d a c c o u N t i N g S t a N d a r d S
In July 2013, the FASB amended Accounting Standards Codification (“ASC”) 740, “Income Taxes�” The amendment provides guidance on the financial statement presentation of an unrecognized tax benefit, as either a reduction of a deferred tax asset or as a liability, when a net operating loss carryforward, similar tax loss, or a tax credit carryforward exists� The amendment will be effective for interim and annual periods beginning after December 15, 2013 and may be applied on a retrospective basis� Early adoption is permitted� The Company does not expect the adoption of this amendment to have a significant effect on the Company’s consolidated financial position or results of operations�
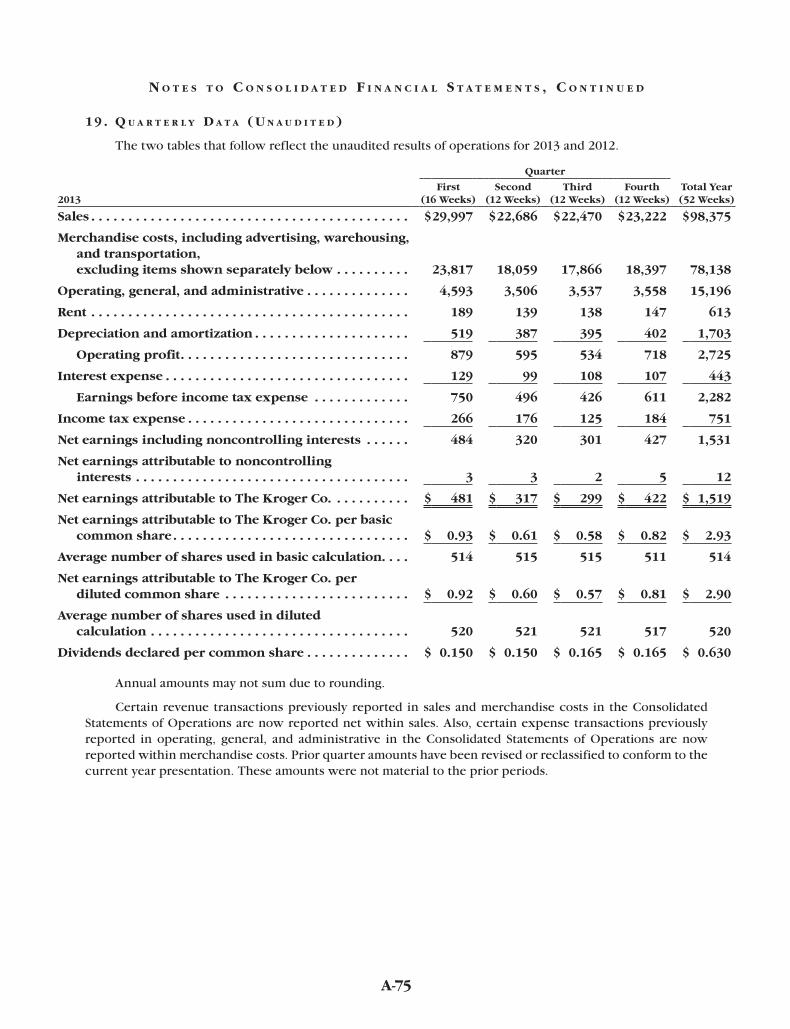
A-75
N o t e s t o C o N s o l i d a t e d F i N a N C i a l s t a t e m e N t s , C o N t i N u e d
19 . q u a r t e r l y d a t a ( u N a u d i t e d )
The two tables that follow reflect the unaudited results of operations for 2013 and 2012�
Quarter
2013First
(16 Weeks)Second
(12 Weeks)Third
(12 Weeks)Fourth
(12 Weeks)Total Year(52 Weeks)
Sales . . . . . . . . . . . . . . . . . . . . . . . . . . . . . . . . . . . . . . . . . . . $29,997 $22,686 $22,470 $23,222 $98,375
Merchandise costs, including advertising, warehousing, and transportation, excluding items shown separately below . . . . . . . . . . 23,817 18,059 17,866 18,397 78,138
Operating, general, and administrative . . . . . . . . . . . . . . 4,593 3,506 3,537 3,558 15,196
Rent . . . . . . . . . . . . . . . . . . . . . . . . . . . . . . . . . . . . . . . . . . . 189 139 138 147 613
Depreciation and amortization . . . . . . . . . . . . . . . . . . . . . 519 387 395 402 1,703
Operating profit. . . . . . . . . . . . . . . . . . . . . . . . . . . . . . . 879 595 534 718 2,725
Interest expense . . . . . . . . . . . . . . . . . . . . . . . . . . . . . . . . . 129 99 108 107 443
Earnings before income tax expense . . . . . . . . . . . . . 750 496 426 611 2,282
Income tax expense . . . . . . . . . . . . . . . . . . . . . . . . . . . . . . 266 176 125 184 751
Net earnings including noncontrolling interests . . . . . . 484 320 301 427 1,531
Net earnings attributable to noncontrolling interests . . . . . . . . . . . . . . . . . . . . . . . . . . . . . . . . . . . . . 3 3 2 5 12
Net earnings attributable to The Kroger Co. . . . . . . . . . . $ 481 $ 317 $ 299 $ 422 $ 1,519
Net earnings attributable to The Kroger Co. per basic common share . . . . . . . . . . . . . . . . . . . . . . . . . . . . . . . . $ 0.93 $ 0.61 $ 0.58 $ 0.82 $ 2.93
Average number of shares used in basic calculation. . . . 514 515 515 511 514
Net earnings attributable to The Kroger Co. per diluted common share . . . . . . . . . . . . . . . . . . . . . . . . . $ 0.92 $ 0.60 $ 0.57 $ 0.81 $ 2.90
Average number of shares used in diluted calculation . . . . . . . . . . . . . . . . . . . . . . . . . . . . . . . . . . . 520 521 521 517 520
Dividends declared per common share . . . . . . . . . . . . . . $ 0.150 $ 0.150 $ 0.165 $ 0.165 $ 0.630
Annual amounts may not sum due to rounding�
Certain revenue transactions previously reported in sales and merchandise costs in the Consolidated Statements of Operations are now reported net within sales� Also, certain expense transactions previously reported in operating, general, and administrative in the Consolidated Statements of Operations are now reported within merchandise costs� Prior quarter amounts have been revised or reclassified to conform to the current year presentation� These amounts were not material to the prior periods�

A-76
N o t e s t o C o N s o l i d a t e d F i N a N C i a l s t a t e m e N t s , C o N C l u d e d
Quarter
2012First
(16 Weeks)Second
(12 Weeks)Third
(12 Weeks)Fourth
(13 Weeks)Total Year(53 Weeks)
Sales � � � � � � � � � � � � � � � � � � � � � � � � � � � � � � � � � � � � � � � � � � $29,026 $21,697 $21,776 $24,120 $96,619
Merchandise costs, including advertising, warehousing, and transportation, excluding items shown separately below � � � � � � � � � � 23,056 17,249 17,352 19,069 76,726
Operating, general, and administrative� � � � � � � � � � � � � � � 4,464 3,391 3,305 3,689 14,849
Rent � � � � � � � � � � � � � � � � � � � � � � � � � � � � � � � � � � � � � � � � � � 191 139 141 157 628
Depreciation and amortization � � � � � � � � � � � � � � � � � � � � � 501 383 382 386 1,652
Operating profit � � � � � � � � � � � � � � � � � � � � � � � � � � � � � � 814 535 596 819 2,764
Interest expense � � � � � � � � � � � � � � � � � � � � � � � � � � � � � � � � 141 106 103 112 462
Earnings before income tax expense � � � � � � � � � � � � � � 673 429 493 707 2,302
Income tax expense� � � � � � � � � � � � � � � � � � � � � � � � � � � � � � 232 148 175 239 794
Net earnings including noncontrolling interests � � � � � � � 441 281 318 468 1,508
Net earnings attributable to noncontrolling interests� � � � 2 2 1 6 11
Net earnings attributable to The Kroger Co�� � � � � � � � � � � $ 439 $ 279 $ 317 $ 462 $ 1,497
Net earnings attributable to The Kroger Co� per basic common share � � � � � � � � � � � � � � � � � � � � � � � $ 0�78 $ 0�52 $ 0�61 $ 0�89 $ 2�78
Average number of shares used in basic calculation� � � � � 556 538 518 514 533
Net earnings attributable to The Kroger Co� per diluted common share � � � � � � � � � � � � � � � � � � � � � � $ 0�78 $ 0�51 $ 0�60 $ 0�88 $ 2�77
Average number of shares used in diluted calculation � � � 559 541 522 518 537
Dividends declared per common share� � � � � � � � � � � � � � � $ 0�115 $ 0�115 $ 0�150 $ 0�150 $ 0�530
Annual amounts may not sum due to rounding�
Certain revenue transactions previously reported in sales and merchandise costs in the Consolidated Statements of Operations are now reported net within sales� Prior quarter amounts have been revised or reclassified to conform to the current year presentation� These amounts were not material to the prior periods�

Kroger has a variety of plans under which employees may acquire common shares of Kroger� Employees of Kroger and its subsidiaries own shares through a profit sharing plan, as well as 401(k) plans and a payroll deduction plan called the Kroger Stock Exchange� If employees have questions concerning their shares in the Kroger Stock Exchange, or if they wish to sell shares they have purchased through this plan, they should contact:
Computershare Plan Managers P�O� Box 43021 Providence, RI 02940 Phone 800-872-3307
Questions regarding Kroger’s 401(k) plans should be directed to the employee’s Human Resources Department or 1-800-2KROGER� Questions concerning any of the other plans should be directed to the employee’s Human Resources Department�
SHAREOWNERS: Wells Fargo Shareowner Services, a division of Wells Fargo Bank, N�A�, is Registrar and Transfer Agent for Kroger’s Common Shares� For questions concerning payment of dividends, changes of address, etc�, individual shareowners should contact:
Wells Fargo Shareowner Services P� O� Box 64854 Saint Paul, MN 55164-0854 Toll Free 1-855-854-1369
Shareholder questions and requests for forms available on the Internet should be directed to: www�shareowneronline�com�
FINANCIAL INFORMATION: Call (513) 762-1220 to request printed financial information, including Kroger’s most recent report on Form 10-Q or 10-K, or press release� Written inquiries should be addressed to Shareholder Relations, The Kroger Co�, 1014 Vine Street, Cincinnati, Ohio 45202-1100� Information also is available on Kroger’s corporate website at ir�kroger�com�

e x e c u t i v e o F F i c e r S
Kathleen S. BarclaySenior Vice President
Robert W. ClarkGroup Vice President
Geoffrey J. CovertSenior Vice President
David B. DillonChairman of the Board
Michael J. DonnellySenior Vice President
Kevin M. DoughertyGroup Vice President
Michael L. EllisPresident and Chief Operating Officer
Todd A. FoleyVice President and Treasurer
Paul W. HeldmanExecutive Vice President, Secretary and General Counsel
Christopher T. HjelmSenior Vice President and Chief Information Officer
Lynn MarmerGroup Vice President
W. Rodney McMullenChief Executive Officer
M. Marnette PerrySenior Vice President
J. Michael SchlotmanSenior Vice President and Chief Financial Officer
Erin S. SharpGroup Vice President, Manufacturing
Mark C. TuffinSenior Vice President
M. Elizabeth Van OflenVice President and Controller
R. Pete WilliamsSenior Vice President
o P e r a t i N g u N i t h e a d S
Paul L. BowenJay C
William H. Breetz, Jr.Southwest Division
Timothy F. BrownDelta Division
Jeffrey D. BurtCentral Division
Jay CumminsSmith’s
Russell J. DispenseKing Soopers
Peter M. EngelFred Meyer Jewelers
Joseph E. FeyMid-Atlantic Division
Dennis R. GibsonQFC
Donna GiordanoRalphs
Rick GoingNashville Division
Joseph A. Grieshaber, Jr.Dillon Stores
Lynn T. GustFred Meyer Stores
Kevin L. HessKwik Shop
Jayne HomcoMichigan Division
Bryan H. KaltenbachFood 4 Less
Calvin J. KaufmanLouisville Division
Bruce A. LuciaAtlanta Division
Bruce A. MacaulayColumbus Division
Sukanya MadlingerCincinnati Division
Stephen M. McKinneyFry’s
Gary MillerchipKroger Personal Finance
Frederick J. Morganthall IIHarris Teeter
Jeffrey A. ParkerConvenience Stores
Darel PfeiffTurkey Hill Minit Markets
Mark W. SalisburyTom Thumb
Arthur Stawski, Sr.Loaf ‘N Jug
Ron StewartQuik Stop
Michael J. StollThe Little Clinic
Van TarverSupermarket Petroleum

The Kroger Co. • 1014 Vine STreeT • CinCinnaTi, ohio 45202 • (513) 762-4000