THE KINETICS OF TRYPSIN DIGESTION* · THE KINETICS OF TRYPSIN DIGESTION* BY DEAN FRASERi AND...
19
THE KINETICS OF TRYPSIN DIGESTION* BY DEAN FRASERi AND RICHARD E. POWELL (From the Department of Biology, Princeton University, Princeton, and the Firus Laboratory and the Department of Chemistry, University of California, Berkeley) (Received for publication, January 30, 1950) The present study of a typical proteolytic enzyme extends the quanti- tative investigations previously reported from this laboratory on the effects of pressure on protein systems in viva (1) and in vitro (2). This paper presents new data on the self-digestion of trypsin and the digestion of casein by trypsin; a forthcoming paper will discuss the effects of tem- perature and hydrostatic pressure on these processes. This particular system was chosen because of classical interest, because of the commercial availability of crystalline trypsin and purified casein, and also because some investigations of the kinetics of digestion of casein by trypsin are already to be found in the literature (3). As is frequently the case, the rate law suggested by the interpretation of the data has a complex integrated form not easily tested by the usual methods. A simple graphical technique (which we have called the slide- fit technique) has proved useful in handling kinetic data in general (Powell, unpublished data). With this technique it is quite as easy to test the agreement of data with complex rate laws as with the simple classical rate laws. Section I of this paper presents an analysis of trypsin self-digestion data. The rate of this process was studied to find out whether it might proceed rapidly enough to introduce any significant error into the studies of casein digestion. The data, while not intended for kinetic analysis, are presented as a simple illustration of the slide-fit technique and because the kinetic process, second order digestion complicated by reversible inhibition of the enzyme by its digestion products, appears completely parallel to the casein digestion. Section II presents new data covering a wide range of the essential vari- ables of casein-trypsin digestion and interprets them similarly in terms of known properties of the components. * This work was done in part under a grant by the American Cancer Society, rec- ommended by the Committee on Growth of the National Research Council, under the direction of Professor Frank H. Johnson, Princeton University, and in part under a fellowship of the American Cancer Society, recommended by the Committee on Growth of the National Research Council. t Present address, Virus Laboratory, University of California, Berkeley, Cali- fQr&. 803 by guest on June 3, 2018 http://www.jbc.org/ Downloaded from
Transcript of THE KINETICS OF TRYPSIN DIGESTION* · THE KINETICS OF TRYPSIN DIGESTION* BY DEAN FRASERi AND...
THE KINETICS OF TRYPSIN DIGESTION*
BY DEAN FRASERi AND RICHARD E. POWELL
(From the Department of Biology, Princeton University, Princeton, and the Firus Laboratory and the Department of Chemistry, University of California,
Berkeley)
(Received for publication, January 30, 1950)
The present study of a typical proteolytic enzyme extends the quanti- tative investigations previously reported from this laboratory on the effects of pressure on protein systems in viva (1) and in vitro (2). This paper presents new data on the self-digestion of trypsin and the digestion of casein by trypsin; a forthcoming paper will discuss the effects of tem- perature and hydrostatic pressure on these processes. This particular system was chosen because of classical interest, because of the commercial availability of crystalline trypsin and purified casein, and also because some investigations of the kinetics of digestion of casein by trypsin are already to be found in the literature (3).
As is frequently the case, the rate law suggested by the interpretation of the data has a complex integrated form not easily tested by the usual methods. A simple graphical technique (which we have called the slide- fit technique) has proved useful in handling kinetic data in general (Powell, unpublished data). With this technique it is quite as easy to test the agreement of data with complex rate laws as with the simple classical rate laws.
Section I of this paper presents an analysis of trypsin self-digestion data. The rate of this process was studied to find out whether it might proceed rapidly enough to introduce any significant error into the studies of casein digestion. The data, while not intended for kinetic analysis, are presented as a simple illustration of the slide-fit technique and because the kinetic process, second order digestion complicated by reversible inhibition of the enzyme by its digestion products, appears completely parallel to the casein digestion.
Section II presents new data covering a wide range of the essential vari- ables of casein-trypsin digestion and interprets them similarly in terms of known properties of the components.
* This work was done in part under a grant by the American Cancer Society, rec- ommended by the Committee on Growth of the National Research Council, under the direction of Professor Frank H. Johnson, Princeton University, and in part under a fellowship of the American Cancer Society, recommended by the Committee on Growth of the National Research Council.
t Present address, Virus Laboratory, University of California, Berkeley, Cali- fQr&.
803
by guest on June 3, 2018http://w
ww
.jbc.org/D
ownloaded from

804 KINETICS OF TRYPSIN DIGESTION
I. Slide-Fit Technique and Trypsin Self-Digestion
Experimental-Conditions in the trypsin experiments were exactly like those for casein-trypsin (Section II), except that samples were taken from a single stock. A freshly made solution of 3 mg. per ml. of crystalline trypsin (Worthington Laboratory, assay 50 per cent) in very dilute hy- drochloric acid (pH 1.96) was mixed in the proportion 1.1 to 1.5 with 0.1 M phosphate buffer of pH 7.3, and the mixture (pH 7.1, chosen to dupli- cate the casein conditions which, in turn, approximate Kunitz’ conditions) was stirred mechanically at 35”. Part (2.6 ml.) of each sample was pre- cipitated with 5 per cent trichloroacetic acid (TCA) and the optical density of the filtrate determined at 280 rnp, and part (1.1 ml.) was allowed to di- gest 1.5 ml. of 1 per cent casein in the same buffer under standard condi-
1.0 -
.6 - '\ \
.6 - \- \
.4 - \
I .2 - 3,
0 I I I I I II 11 11 11 11 ' "1 100 90 SC 70 60 50 40 30 20 IO 0
FIG. 1. Activity of trypain measured by casein digested in 20 minutes under standard conditions. Ordinate, optical density; abscissa, amount of trypsin charged as per cent of normal charge (see the text).
tions (35”, 20.0 minutes) as a measure of its residual enzymatic activity. The amount of casein digested was determined by measuring the optical density of a TCA filtrate at 280 rnp, and correcting for the optical density of the first part of the sample, i.e., the contribution of self-digested trypsin (Table I).
Calibration-A similar 3 mg. per ml. solution of trypsin was diluted with varying amounts of the dilute hydrochloric acid so that successive samples contained amounts differing by 10 per cent increments. Each sample was then diluted (1.1 ml. + 1.5 ml.) with the phosphate buffer (to reproduce the self-digestion conditions above) and 1.1 ml. of this solution was added to 1.5 ml. of 1 per cent casein and incubated; the optical density of a TCA filtrate was determined. The resulting per cent of active tryp- sin versus the optical density of the casein digested is shown in Fig. 1.
The data for Sample ~-TO (Table I) were then converted to per cent of
by guest on June 3, 2018http://w
ww
.jbc.org/D
ownloaded from

D. FRASER AND R. E. POWELL 806
TABLE I I’rypsin Self-Digestion
Time, min. Self-di est! optical enslty d
Casein dfgest. Corrected* optical density optical density Per cent undigested
Sample ~-TO (initial concentration, 1.27 mg. per ml. of 50 70 trypsin)
3 6
10 15 20 30 40 60 90
120
0.173 1.600 1.455 0.195 1.466 1.412 0.222 1.478 1.412 0.250 1.398 1.321 0.270 1.548 1.462 0.294 1.434 1.338 0.325 1.453 1.344 0.346 1.381 1.263 0.385 1.349 1.214 0.395 1.298 1.159
Sample l-To (initial concentration 3 of that above)
Sot 72 72 55$ 82$ 58 59 47 42 35
1 0.096 2 0.148 4 0.101 5 0.098 7 0.102
10 0.104 19 0.123 35 0.137 60 0.150 90 0.167
840 w 80 82 80 78 68 60 53 43
* Correction = 11/26 (optical density of self-digest - 0.067) where 0.067 is the blank.
t The figures in this column are from Fig. 1. $ Points omitted in Fig. 3. 5 The figures in this column are from Fig. 2.
FIG. 2. Trypsin calibration. Ordinate, optical density at 280 rnp from partially ielf-digested trypsin; abscissa, per cent active or undigested trypsin as determined rom activity in digesting casein under standard conditions. 0, blank experiment,
by guest on June 3, 2018http://w
ww
.jbc.org/D
ownloaded from
fsdf s ff

806 KINETICS OF TRYPSIN DIGESTION
active trypsin by use of Fig. 1, and these values, as determined by casein digestion ability, are plotted against the optical density (Table I) of par- tially digested trypsin in Fig. 2. This is a direct calibration which can be used (as with the data for Sample l-To) to determine the amount of di- gested trypsin in a solution without recourse to the cumbersome procedure of casein digestion.
DISCUSSION AND RESULTS
Simple Orders of Reaction-Trypsin is known to exist in dynamic equi- librium with a reversibly denatured form of itself (4) ; it is presumably this form of the protein which is digested by the active enzyme. Thus’
T. + Td <= (Ta-Td T Kt
T. + product (P) (1)
Since the denaturation equilibrium (4) and complex formation equilibrium (theory of absolute reaction rates) are attained very rapidly, their con- stants may be combined with the specific rate constant, and the trypsin considered to be a single reacting species, T, giving the rate equation
dP dT -- z= dt
= k’(T.)(T) = k(T)* (2
If CY is the degree of reaction and To the original charge of trypsin, then
P = cuTO and T =I (l--a) To
Substituting, rearranging, and integrating formally give a
s da t
o (1 - a)l = To k c dt 1
We may combine the constants and take the logarithm of both sides a log s
da - = log k’ + log t
0 0 - cd2
After integrating, we may then choose a purely arbitrary set of values for CY, covering any range desired, and obtain a corresponding set of values for the log of the integral without recourse to any daki whatsoever. This is a purely mathematical evaluation of the general second order reaction for given values of CY. (Derivations for other orders are made similarly.)
1 Throughout the paper the following terminology is used. To and CO refer to ini- tial concentrations; a 2C-T experiment is one with 2 times the “standard” casein concentration (see “Experimental”); C-XT refers to a set of experiments with vary- ing TO; T, is active trypsin; Td is reversibly denatured trypsin; T,.Td, etc., are the intermediate complexes; Kg, K,, K, are equilibrium constants and the k’s are rate constants of the digestion reactions; P is unspecified reaction product; C is unre- acted casein; cd is digested casein.
by guest on June 3, 2018http://w
ww
.jbc.org/D
ownloaded from

D. F’RASER AND R. E. POWELL 807
A plot of a! against these values of its integral is, from the above equa- tion, the equivalent of a plot of cr against log k’ + log t. Since log k’ is a constant, it is obvious that log t must describe the shape of the curve and log k’ only its position.
We may now take any data presumed to follow the above rate law and plot the obtained values of (II against log t. If the reaction mechanism is not correct, the plot of a against log t will give, in general, a curve of dif- ferent shape which cannot be superimposed on the hypothetical curve by a shift of the abscissa. If they do fit, the position along the abscissa de- termines k’ .
Comparison of Data to Simple Orders of Reaction-A set of theoretical curves for zero through the third order for the slide-fit is shown in Fig. 3
loo so 60
70
60
50
40
30
20
IO
0 .I I IO
FIG. 3. Theoretical curves for zero, first, second, and third orders of reaction showing fit of data of known first (0) and second (8 , 0 ) order reactions, trypsin self-digestion (V) and trypsin-digested casein (0). Ordinate, per cent unreacted; abscissa, theoretical rate integral, logarithmic scale (see the text).
with the per cent of undigested trypsin (rather than (Y) plotted against the log of the integral. The data are fitted by plotting the theoretical curve and the data on identical paper and shifting the two sheets horizontally, always keeping the x axis superimposed. The data are then traced in the position of best fit and the reaction k is determined by noting the value of the theoretical curve for unit time of the data. To illustrate (Fig. 3), the data of Lauffer and Price (5) for the demonstrated first order (5,2) thermal denaturation of tobacco mosaic virus and the data of Hughes and Ingold (6) for the second order decomposition of phenethyl ammonium hydroxide in water have been used. In contrast, the data for trypsin self-digestion (and casein data) are seen to show a rate drop even faster than third order.
Inhibition by Reaction Pro&&--Returning to the original simple reac- tion mechanism (Equations 1 and 2), we may write the expression for the
by guest on June 3, 2018http://w
ww
.jbc.org/D
ownloaded from
808 KINETICS OF TRYPSIN DIGESTION
activated complex equilibrium
(‘L-T) ~1 = (T3(T) or Kt(T) =
(Ta.T) 0’s)
(3)
If we now assume that the active trypsin is inhibited by the products in a simple reversible manner (cf. (7)), the following equations result:
T a + P - T,.P +g- ’
K = (‘J!.*P) ’ (TX’) Or
(4)
The presumption that the inhibition is reversible is likely from the cor- responding reaction of the casein-trypsin system which is discussed below. The total amount of undigested trypsin present is
(T) = (Ta) + (T..T) + (T,.P)
If we now add the above equilibrium expressions, Equations 3 and 4, and add 1 to each side of the resulting equation
1 + Kc(T) + K,(P) = (~3 + 0’3 CL-T) + (T,.P) - - (Ta) (‘I’.)
or
(Ta) = (T.1 + 0.a.T) +(T..P) 0)
1 + Kt(T) + K,(P) = 1 + IL(T) + K,(P)
The rate equation dT --= dt
k(T.) CO
may now be rewritten by substituting for T,
dT --=k W dt 1 + KdT) + K,(P)
Actually in both this and the casein-trypsin system comparison of the alternatives with the data has shown that the amount of T, not combined with the product is arithmetically negligible compared to that which is in the form (T, .P) ; i.e., 1 + Kt(T) < <K,(P). Although the development may be carried through with the above form, it is simpler to introduce this fact and to reintroduce the variable CY for the degree of reaction. Then
T &Y = k (1 - cr)*(To)* ’ dT K,(aTo)
and after rearrangement and integration
a 1 ---n-Z= 1 --a
$t 1-a p
(5)
by guest on June 3, 2018http://w
ww
.jbc.org/D
ownloaded from
D. FRASER AND R. E. POWELL 809
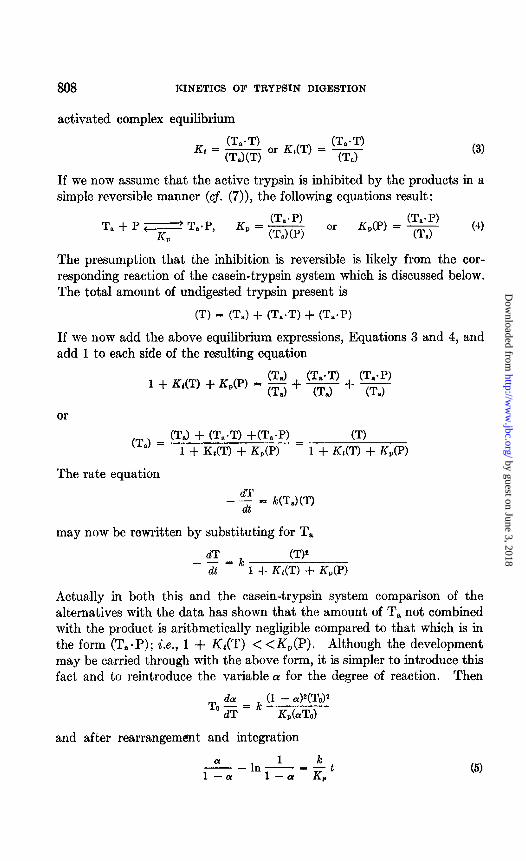
This single parameter expression for the self-inactivation or self-diges- tion of trypsin would obviously be difficult to test by ordinary methods, since it cannot be solved simply for (Y. By the slide-fit technique, however, it may be treated exactly the same as the above examples. Arbitrary values for Q! are chosen, substituted, and plotted against the corresponding evaluation of the integral, as before, on semilogarithmic paper. This leads to the curve of Fig. 4.
It can be seen from Equation 5 that if the hypothesis is correct the rate of self-digestion should be independent of the starting concentration. When the results of experiments at two different concentrations are plot- ted on the same type of paper with the per cent which has reacted (or not reacted, actually) against time and the points fitted to the above theo-
loo I,,,, I I I,,,,,, I I I Illll
70 - 60 -
60-
40 -
1 I ,I IllI I I Ill,, .Ol .I I
FIG. 4. Trypsin self-digestion data at two concentrations fitted to a theoretical curve describing first order inhibition of the trypsin by the products of reaction. Ordinate, per cent undigested; abscissa, theoretical rate integral, logarithmic scale (see the text). 0, normal concentration (l-To). 0, triple normal concentration (~-TO).
retical curve, the fit is striking, as may be seen in Fig. 4. The rate con- stant (value of the theoretical curve for time = 1 minute) is 0.0052 (off scale as drawn).
Other HypothesesIn addition to’ the two factors deleted in the deriva- tion of Equation 5, various other theories were considered. The hypoth- eses and unfavorable results were parallel to those described for casein- trypsin digestion in Section II.
II. Digestion of Casein by Trypsin
Experimental-The standard experiment comprises the digestion at 35.0” of 1 per cent Difco “isoelectric” casein by approximately two-thirds its volume of 1 mg. per ml. of crystalline trypsin at pH 7.10 (chosen to parallel Kunita’ and Northrop’s conditions). This is referred to as a C-T experi- ment. An experiment with twice as much initial casein is a 2C-T or with half as much trypsin a C-$,T experiment.
by guest on June 3, 2018http://w
ww
.jbc.org/D
ownloaded from

810 KINETICS OF TRYPSIN DIGESTION
The casein is prepared by shaking 1.000 gm. of Difco isoelectric casein into 75 to 80 ml. of 0.1 M disodium hydrogen phosphate, stirred mechani- cally as rapidly as possible, without engendering foaming. After adjustment to pH 7.30 at 25” with 0.1 M potassium dihydrogen phosphate (about 12 to 13 ml.), the solution is made up to 100 ml. in a volumetric flask with 0.1 M disodium hydrogen and potassium dihydrogen phosphates mixed to pH 7.30 at 25”. This solution will keep 3 to 4 days in the refrigerator.
The trypsin solution used is 1 mg. per ml. (Worthington Laboratory) “once purified crystalline trypsin” (assay 50 per cent) in refrigerated hy- drochloric acid of pH 1.96. The solution must be kept iced and should be used immediately.
Since the ultimate aim of these experiments was to study the reaction under pressure, the following procedure was designed to keep the enzyme and substrate separate until used under pressure and at various tempera- tures. With semiautomatic, syringe pipettes (to speed the procedure and avoid changes in the trypsin) a set of test-tubes is charged with 3.0 ml. each of 5 per cent TCA. To each of a set of stainless steel bombs (John- son, Baylor, and Fraser (2)) are added the above casein solution, a stain- less steel messenger, and 5 drops of hexadecane (Paragon). (The hexade- cane (m.p. 1%‘) may be replaced by tetradecane for experiments at lower temperature.) Both have the advantages of inertness, availability, and lack of effect on the optical density when removed as described. Hexa- decane melts and allows mixing within 1 minute, even at 25”, and in glass tubes.) The bombs are chilled in ice until the hexadecane, is frozen (3 to 5 minutes) and meanwhile the trypsin solution is prepared. Then 1.1 ml. of the fresh trypsin solution are added and enough hexadecane to fill the bomb (2 to 5 drops). A rubber dam is placed on each bomb, the top is screwed in place, and the group is immersed in the bath at the desired temperature. After 1 minute the set of bombs is removed, inverted several times to allow the messengers to mix substrate and enzyme, giving a final pH of 7.1, and then returned to the bath. At the desired time intervals the bombs are removed, and the contents dumped into the TCA solution and poured back and forth. After at least 1 hour the mixture is again chilled to solidify the hexadecane and filtered, and the optical density is determined at room temperature at 280 m/L in the Beckman quartz spec- trophotometer. The optical density is converted to per cent of casein un- digested by using the calibration curve of Fig. 5, the preparation of which is described below.
Calibration-Kunitz, using the optical density of a TCA filtrate as above, devised a method for the determination of trypsin activity by measuring the casein digested in a given time (8). Here, however, we must know the amount or fraction of casein digested. To relate casein digested to
by guest on June 3, 2018http://w
ww
.jbc.org/D
ownloaded from
D. FRASER AND R. E. POWELL 811
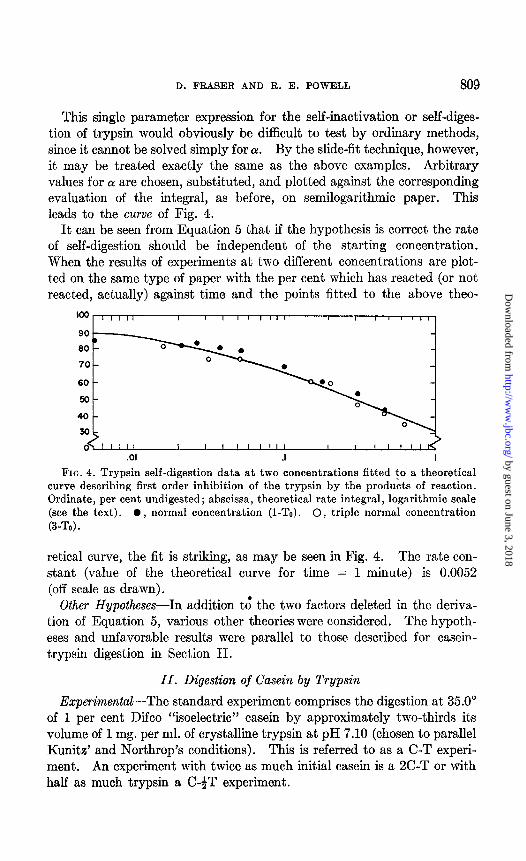
optical density, varying amounts were digested completely (under the stated conditions this requires about 3 hours, but the digestions were ac- tually run for 18 to 18.5 hours to insure completion) and the optical density of the filtrate was measured. To compensate for the varying charges of casein half the usual volume of 10 per cent (instead of 5 per cent) TCA solution was used for quenching and an equal volume of buffer (which has no effect on the optical density) containing enough casein to make up the charge differential was added before the experimental sample.
Completion of casein digestion implies partial subsequent digestion of the trypsin by itself. If the same amount of casein is digested completely with varying amounts of trypsin, the variations in optical density must be
OYI I I I II III1 II(I 1 ‘I 1/2x IX 2x 3x 4x
FIG. 5. Complete digestion of varying amounts of casein with varying amounts of trypsin. Ordinate, optical density at 280 rnp; abscissa, trypsin concetitration. X = 0.212 mg. per ml. of final concentration. 100 per cent casein = 5.77 mg. per ml. 0, 0, different experiments.
due to the self-digested trypsin (since undigested trypsin has no effect on the blank). Hence, by extrapolation back to zero concentration of tryp- sin, one can estimate the optical density which would have been produced from casein alone. This was done with the results shown in Fig. 5, and the resulting intercepts were used to make the calibration of Fig. 6.
Since the zero intercept for casein did not quite coincide with the blanks prepared by adding trypsin and casein separately to TCA, the straight line of Fig. 6 was drawn for the best fit to these points and the blank average. The error possibly introduced in this compromise is insignificant in all ex- cept the $C-T experiments.
Discussion of Methods-In considering the results of experiments in which the kinetics are based on determination of some property which varies with the time of reaction, it must always be questioned whether the
by guest on June 3, 2018http://w
ww
.jbc.org/D
ownloaded from

812 KINETICS OF TRYPSIN DIGESTION
quantity measured is a true indication of the disappearance of the reactant. In other words, we are determining here the rate of appearance of a some- what arbitrarily defined product and considering it as a measure of the dis- appearance of casein. In justification three observations may be pointed out: First, it has been found that the optical density curve (Fig. 6) follows Beer’s law; i.e., it is linear. ‘Secondly, the opalescence produced by TCA with most digested casein disappears at the’same time that the optical den- sity of the filtrate reaches a maximum. Since the precipitate is an indica- tion of undigested casein or large fragments, this means that no precipitable, undigestible fragments are piling up; on the other hand, once the precipi- tate disappears, the optical density, which is our measure of casein disap- pearance, no longer increases. Thirdly, in the preparation of the
)
loo 90 80 70 60 50 40 30 20 IO 0
FIG. 6. Calibration of casein digestion. Ordinate, optical density at 280 ~Q.L; abscissa, per cent of casein undigested. 100 per cent casein = 5.77 mg. per ml. The points are the zero extrapolations of Fig. 5. 0, blank experiment.
calibration of trypsin self-digestion (Figs. 1 and 2), the drop in digestive activity was followed simultaneously with the appearance of the optical density of the filtrate. The two processes were completely parallel within the limits of experimental error; i.e., if the per cent of active trypsin de- termined by ability to digest casein is plotted against the optical density of the self-digested filtrate, a straight line is obtained which passes through the blank. The increase in optical density is thus a measure of the dis- appearance of the protein trypsin as manifested by its enzymatic activity.
In previous studies of casein-trypsin digestion various properties have been used as the measure of the amount digested. Some (e.g. Van Slyke amino nitrogen or form01 titration) actually measure the number of bonds cut; others (e.g. viscosity) measure protein disappearance, but are difficult to interpret. The criterion of a satisfactory property is that it measures the appearance or disappearance of a substance on one or the other side
by guest on June 3, 2018http://w
ww
.jbc.org/D
ownloaded from

D. FRASER AND R. E. POWELL 813
of the rate-determining step and that other kinetic processes do not ex- cessively complicate it’s increase or decrease. The present assumption is that TCA precipitation discriminates between molecules of the size of casein and considerably smaller particles which are either the direct result of the rate-determining step or which are formed very rapidly thereafter. This presumption is strengthened not only by the above observations but also by the reasonable nature of the results.
DISCUSSION AND RESULTS
Although the digestion of casein by trypsin has been extensively studied, no satisfactory picture of the process has appeared. In view of the con- flicting results in the literature, it seems necessary to start by showing that the casein-trypsin digestion cannot be explained by a simple classical rate law, and then to proceed to more elaborate considerations.
The simplest picture of casein-trypsin digestion is one in which trypsin self-digestion is negligible; Le., the trypsin is a true catalyst. A set of ap- propriate plots for the C-T data shows that by the usual techniques of kinetic analysis the data fit either the first or second laws with a little strain- ing. In each case, however, the best straight line fails to pass through the zero intercept by a considerable margin. When the initial trypsin con- centration is varied, a rather clear linear dependence on concentration can be seen. But when the starting concentration of casein is varied, the con- clusion is reached that the reaction is apparently zero order for casein. Since this is completely inconsistent with the results of individual runs and with the results of enzymatic kinetics in general, it is obvious that this interpretation is faulty.
The lack of agreement of the simple kinetic models with the data can be more clearly shown by use of the slide-fit technique, and it may be seen from the casein digestion points of Fig. 3 that the rate falls off even faster than the most improbable third order.
R&e of Trypsin Self-Digestion-The most striking feature of all of the data (Figs. 7 and 8) is the extremely rapid dropping of the rate as the re- action proceeds. This aspect of casein-trypsin digestion has been noted before (9) by other investigators and various reasons have been assigned to it.
Since it became known that trypsin exists in dynamic equilibrium with a reversibly denatured trypsin (4) and that the active form is capable of digesting the denatured form, it has frequently been assumed that the com- plexities of trypsin digestions are due in part, at least, to concomitant self- digestion of the enzyme. Northrop has shown (10) that casein digestion at 0” is a first order process and it was believed that this was because of the lack of self-digestion at this temperature. The data for trypsin self-
by guest on June 3, 2018http://w
ww
.jbc.org/D
ownloaded from

814 KINETICS OF TRYPSIN DIQESTION
digestion (Section I) show that the rate is slower than the casein-trypsin reaction by about an order of magnitude in the concentration range which we are considering. It is a priori unlikely, therefore, that enzymatic self- digestion is important in the rate decline of casein-trypsin digestion. Ac-
100 t II 111111 I I,,,1 90 - 80 - 70 - v 60 - 0
v v 50 - qo ovv
40 - "ea
30 - i n *o AA o 8%)
20 - ",YP IO - A
AA 0 I I,~IIII At -III~II
IO 100,
FIG. 7. SC-T raw data. Varying amounts of casein digested with the same amount of trypsin. Ordinate, per cent undigested; abscissa, time in minutes (loga- rithmic scale). IC-T (A, A); +C-T (Cl); C-T (0); 2C-T (V). The solid symbols are the corresponding controls.
loo I I I ,#llll I I I IIlll
90 -
80 - A
70 - 0 A 60 0 -
50 - A 40 A -
30 -
FIG. 8. C-XT raw data. The same amount of initial casein digested with varying amounts of trypsin. Ordinate and abscissa as in Fig. 5. C-l/lOT (A); C-$T (El); C-T (0) (same points as in Fig. 5) ; C-2T (V) ; C-3T (0). The solid symbols are the corresponding controls.
tually the rate change introduced even by assumption of trypsin self- digestion (at its normal rate in the absence of casein) turns out to be inconsiderable, even at extreme degrees of reaction (see the dotted curve in Fig. 9). The possibility of the rate drop being due to self-digestion of the enzyme can, therefore, be dismissed.
by guest on June 3, 2018http://w
ww
.jbc.org/D
ownloaded from

D. FRAi3ER AND R. E. POWELL 815
Inhibition by Reaction Products--In the literature on casein-trypsin, mention has frequently been made of the inhibiting effect of the products >f the reaction. Although later kinetic studies seem to have neglected this factor, Northrop (7) has investigated this effect, using partially puri- Sed trypsin, and has shown that the inhibitor combines reversibly with the ;rypsin and that the ratio is probably 1: 1.
Assumption of the mechanism
T a + c +- 0L.C) Kc
-+ Cd + T, +-I (T.-Cd k KP
tllows substitution in the rate equation
dC --P dd
k(Ta*C) = kKo(TJ(C)
in a manner completely parallel to that used in the trypsin system. We need not consider the equilibrium between T, and reversibly denatured trypsin because this is rapidly attained (4) and has no effect on the kinetics of the digestion process. Trypsin self-digestion is also disregarded because it has been shown above to be too slow to be of significance. In the sub- stitution for T,, the following equation is obtained (cf. Section I),
(T3 3 (T.-Cd) + (TJ + (T.*C) 1 + &(cd) + K&2
Actually by comparing the complete integrated form with the data, even assuming extreme cases, we have found that the amount of T. not com- bined with the product is arithmetically negligible compared to that in the form T,.Cd. To simplify the development this factor is introduced and the variable LY, the degree of reaction, is substituted, as was done in the trypsin derivation. Then
(Co) $ = kK. (TJ(1 - a)(Cd
KP&o)
which on integration gives
kK, (To) -‘Y=Kp.(CO)t (6)
This cannot be solved for a! and tested in the usual manner, but comparison of this rather complicated relationship with the data may easily be made by means of slide-fit technique.
Comparison of Data and Theory-The raw data are plotted in two sets (Figs. 7 and 8) to emphasize the dependence on the starting concentrations of casein and of trypsin and to avoid confusion of the points. It can be
by guest on June 3, 2018http://w
ww
.jbc.org/D
ownloaded from

816 KINETICS OF TRYPSIN DIGESTION
seen from Equation (6) that the data for all experiments should, if the hy- pothesis is correct, be representable by a single curve, provided that the time values for various experiments are displaced by the appropriate values
I00 90
00
70
60
50
40
30
20
IO
0 .Ol .I I IO
FIG. 9. XC-T data of Fig. 7 displaced for control trypsin data and initial casein charge and fitted by slide-fit technique to theoretical curves describing first order inhibition of the trypsin by the products of digestion. Ordinate, per cent undi- gested; abscissa, theoretical rate integral, logarithmic scale (see the text). The dotted curve shows the alteration introduced by assumption of trypsin self-diges- tion at a normal rate.
70
60
50
40
30
20
IO
0 I J-LU .Ol .I I
FIG. 10. C-XT data of Fig. 8 displaced for initial trypsin charge and fitted b! slide-fit technique to same theoretical curve used in Fig. 9. Ordinate and absciss: as in Fig. 9. The dotted curve shows the fit of a theory which assumes the casein tl contain 15 per cent of a more rapidly digested component.
of TO and CO. To cannot, because of the instability of trypsin solutions be simply calculated from the dilution of the stock. A control digestior with standard TO and Co is therefore run with each experiment and thj correct To value determined by the best fit of the control points (see FigE 7 and 8) to the curve of the standard run, which is taken arbitrarily a having unit charges.
by guest on June 3, 2018http://w
ww
.jbc.org/D
ownloaded from

D. FRASER AND R. E. POWELL 817
The standard (C-T) data are then transferred to another sheet of graph paper; the new sheet is moved horizontally by the corrected To:CO ratio for each experiment and the points for this experiment traced. The re- sults are again shown in Figs. 9 and 10 for clarity.
Now the assembled data can be fitted to the theoretical curve obtained in the above derivation by superposition of the sheets and sliding along the 2 axis. It can be seen (Figs. 9 and 10) that the fit of the data is fairly good, especially considering the wide range of the reactant ratio, and much better than that obtained by any previous hypothesis. The discrepancies occur in the early points which lie below the theoretical curve, and, in gen- eral, it seems that the fit might be better if the curve were somewhat flatter.
Second Order InhGition-The most obvious effect which would result in a flatter curve is the assumption of a higher order of inhibition. Ac- tually the curve for second order inhibition is not greatly different from the above theoretical curve and results in a better fit to some of the data. Such a hypothesis does not seem readily interpretable mechanistically. Moreover, this is so clearly inconsistent with the trypsin self-digestion data and with Northrop’s experience (7) with the inhibitor that it was aban- doned.
Other Inhibition Ej’ects-In the above derivation several factors were omitted. If we consider that active trypsin may be present in appreciable amount or that an arithmetically significant amount may be bound by it- self and by undigested casein, corresponding integrated equations may be obtained, including as many such factors as desired. All such equations, however, lead to theoretical curves steeper than those of Figs. 9 and 10, and, in all cases, a less satisfactory fit by far, thus justifying their omission in the above derivation.
In passing it may be noted that several other hypotheses were tested to be sure that the data could not be equally well fitted. They include assumption of a varying order of inhibition, depending on the ratio of casein to trypsin, assumption of second order inhibition with trypsin or unchanged casein, assumption of higher orders of inhibition with the prod- uct, and assumption of a sum of first and second order inhibition with the product. The failure of any of these, even in extreme cases, to give at all satisfactory fits lends confidence to the view that the above explanation is valid.
Comparison with Previous World--Not all the data which were obtained by Northrop on the digestion of casein are comparable, since much of the early work was done with partially purified enzyme and led to anomalous results. With crystalline trypsin Northrop (9) digested casein under con- ditions similar to ours, determining the digested casein by TCA precipi- tation and nitrogen analysis of the supernatant fluid. In Fig. 11 North- rop’s data from the three experiments at different concentrations of casein
by guest on June 3, 2018http://w
ww
.jbc.org/D
ownloaded from

818 KINETICS OF TRYPSIN DIGESTION
digested at 35” have been fitted to the same theoretical curve which was used in Figs. 9 and 10. The fit lends confidence to both the present theory and analytical method.
Inhomogeneity of Caseilz-One of the points which it was of interest to consider in connection with the anomalies noted in casein-trypsin diges- tion by previous workers was the known inhomogeneity of casein. Ex- amination of casein electrophoretically has indicated that so called purified casein, prepared by isoelectric precipitation, as was the casein used in the present work, consists of two main fractions in the ratio 81: 19 and is sub- ject to small variations depending on the source (11).
The data of Figs. 9 and 10 lend themselves readily to the assumption that the casein is not pure, in the sense that a minor component has been
Fro. 11. Data of Northrop fitted to the curve of Figs. 9 and 10. Same and abscissa.
ordinate
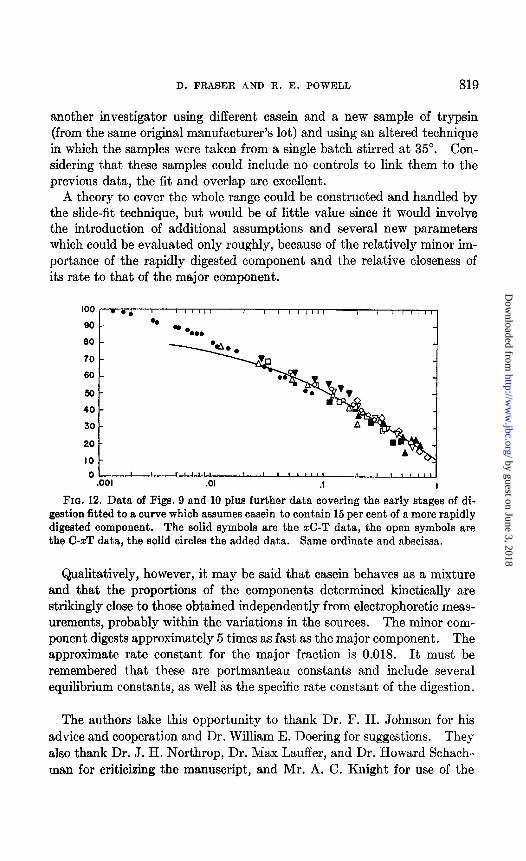
digested much more rapidly than the main fraction. It may be seen that the data tend to extrapolate to about 85 per cent instead of 100 per cent. (This value was actually determined by means of a log versus log plot, which shows the effect much more clearly.) If this is true, the early part of the digestion should show characteristic behavior and drop rapidly from 100 per cent to the lower curve. In Fig. 10 (dotted curve) and Fig. 12 the assembled data have been fitted to a theoretical curve, each point of which is 85 per cent of the corresponding ordinate of the curve of Figs. 9 and 10. In addition, in Fig. 12 further data2 are included, covering the first part of the reaction and showing that the fit to the original curve is reasonably satisfactory. With the curve of 85 per cent pure casein, how- ever, the behavior is exactly that which would be expected. It is of interest to note that these data were obtained in a different laboratory by
2 These additional data were obtained by Mr. A. C. Knight, Department of Chemistry, University of California.
by guest on June 3, 2018http://w
ww
.jbc.org/D
ownloaded from
D. FRASER AND R. E. POWELL 819
another investigator using different casein and a new sample of trypsin (from the same original manufacturer’s lot) and using an altered technique in which the samples were taken from a single batch stirred at 35”. Con- sidering that these samples could include no controls to link them to the previous data, the fit and overlap are excellent.
A theory to cover the whole range could be constructed and handled by the slide-fit technique, but would be of little value since it would involve the introduction of additional assumptions and several new parameters which could be evaluated only roughly, because of the relatively minor im- portance of the rapidly digested component and the relative closeness of its rate to that of the major component.
100
so
60
70
60
50
40
30
20
IO
0 .OOl .Ol .I I
FIG. 12. Data of Figs. 9 and 10 plus further data covering the early stages of di- gestion fitted to a curve which assumes casein to contain 15 per cent of a more rapidly digested component. The solid symbols are the S-T data, the open BymbOlB are the C-zT data, the solid circles the added data. Same ordinate and abscissa.
Qualitatively, however, it may be said that casein behaves as a mixture and that the proportions of the components determined kinetically are strikingly close to those obtained independently from electrophoretic meas- urements, probably within the variations in the sources. The minor com- ponent digests approximately 5 times as fast as the major component. The approximate rate constant for the major fraction is 0.018. It must be remembered that these are portmanteau constants and include several equilibrium constants, as well as the specific rate constant of the digestion.
The authors take this opportunity to thank Dr. F. H. Johnson for his advice and cooperation and Dr. William E. Doering for suggestions. They also thank Dr. J. H. Northrop, Dr. Max Lauffer, and Dr. Howard Schach.. man for criticizing the manuscript, and Mr. A. C. Knight for use of the
by guest on June 3, 2018http://w
ww
.jbc.org/D
ownloaded from
820 KINETICS OF TRYPSIN DIGESTION
data included in Fig. 12. Particular appreciation is due Miss Rosamond S. Baker for conscientious and capable technical assistance.
SUMMARY
Preliminary data for the self-digestion of trypsin and more complete data for the digestion of purified casein by crystalline trypsin are presented and analyzed. Both reactions have been studied in phosphate buffer, pH 7.1, at 35”, and the casein data cover a range of 97 per cent completion and a concentration ratio of 160 (casein to trypsin). The data are repre- sentable by a single parameter expression in each case on the assumption that the reaction involves 1 molecule of trypsin and 1 of casein (or trypsin), but that the enzymatic activity of trypsin is inhibited by a reversible equi- librium with the products of digestion. A closer fit to the casein data is obtained by the further assumption that the casein consists of two com- ponents digested at different rates; the proportions obtained from the present kinetic data agree well with the known composition of casein. Comparison of the data to the theory is made by a graphical method of analysis which is generally applicable to kinetic data and most useful in cases in which the integrated rate law is complex.
BIBLIOGRAPHY
1. Brown, D. E., Johnson, F. H., and Marsland, D. A., J. CeZZ. and Comp. Physiol., 20,151 (1942). Johnson, F. H., Eyring, H., Streblay, R., Chaplin, H., Huber, Cl., and Gherardi, G., J. Gen. Physiol., 28, 463 (1945). ZoBell, C., and John- son, F. H., J. Bat., 67, 179 (1949).
2. Eyring, H., Johnson, F. H., and Gensler, R. L., J. Phys. Chem., 60, 453 (1946). Campbell, D. H., and Johnson, F. H., J. Am. Chem. Sot., 88,725 (1946). John- son, F. H., Baylor, M. B., and Fraser, D., Arch. Biochem., 19, 237 (1948). Johnson, F. H., and Schlegel, S. M., J. Cell. and Comp. Physiol., 31,421 (1948).
3. Northrop, J. H., Kunitz, M., and Herriott, R., Crystalline enzymes, New York (1948) .
4. Anson, M. L., and Mirsky, A. E., J. Gen. Physiol., 17, 393 (1934). 5. Lauffer, M. A., and Price, W. Cl., J. Biol. Chem., 133, 1 (1940). 6. Hughes, E. D., and Ingold, C. K., J. Chem. Sot., 523 (1933). 7. Northrop, J. H., J. Gen. Physiol., 4, 245 (1921). 8. Kunitz, M., J. Gen. PhysioZ., 30, 306 (1947). 9. Northrop, J. H., J. Gen. Physiol., 16, 339 (1932).
10. Northrop, J. H., J. Gen. Physiol., 6, 417 (1924). 11. Warner, R. C., J. Am. Chem. Sot., 88, 1725 (1944).
by guest on June 3, 2018http://w
ww
.jbc.org/D
ownloaded from

Dean Fraser and Richard E. PowellDIGESTION
THE KINETICS OF TRYPSIN
1950, 187:803-820.J. Biol. Chem.
http://www.jbc.org/content/187/2/803.citation
Access the most updated version of this article at
Alerts:
When a correction for this article is posted•
When this article is cited•
alerts to choose from all of JBC's e-mailClick here
tml#ref-list-1
http://www.jbc.org/content/187/2/803.citation.full.haccessed free atThis article cites 0 references, 0 of which can be
by guest on June 3, 2018http://w
ww
.jbc.org/D
ownloaded from