Augmented Reality Barriers & Drivers for Widespread Adoption

The Key Dr ivers and Barr iers tothe Susta inable Developmentof Commerc ia l Property inNew Zealand
A u t h o r s Sandy Bond and Guy Perrett
A b s t r a c t In 2011 research was conducted to identify the key drivers and barriersto the sustainable development of commercial property in New Zealand(NZ) by surveying a cross-section of these market participants. Theoverall aim of the research was to identify any barriers that need tobe overcome so that progress can be made towards advancing thesustainable building agenda in NZ’s commercial property sector that willhelp improve building energy performance and reduce greenhouse gasemissions. The results indicate there remain key issues for the propertyindustry to resolve, the most significant of which is the commercialproperty sectors’ view of the cost premium for green buildings versusconventional buildings.
Worldwide initiatives, such as the Kyoto Protocol (Ministry for the Environment,2010), which seeks to address global warming by setting targets for participatingcountries to reduce their greenhouse gas emissions, are underway in an effort tomanage natural resources and the environment in a sustainable manner. It has beenestimated that buildings contribute around 30% of greenhouse gas emissionsglobally (Arnel, 2010).
According to Klein, Drucker, and Vizzier (2009, p. 3), ‘‘The built environmentthrives on the use of vast amounts of resources, including land, materials, energyand water... Yet opportunities for reducing damage to the environment presentthemselves throughout the entire process.’’
It has been estimated that buildings contribute around 30% of greenhouse gasemissions globally.1 In 2002, eight countries responded to concerns about theimpact of the property sector on the environment by establishing the World GreenBuilding Council (WorldGBC). A number of other countries have subsequentlyjoined the WorldGBC, including New Zealand (NZ). The stated mission of theWorldGBC is to ‘‘accelerate the transformation of the built environment towardssustainability’’ (World Green Building Council, 2010). One of the most advancedGreen Building Councils is the United States Green Building Council (USGBC).The mission of the USGBC is to: ‘‘transform the way buildings and communitiesare designed, built and operated, enabling an environmentally and sociallyresponsible, healthy, and prosperous environment that improves the quality of life’’(USGBC, 2011).
T h e K e y D r i v e r s a n d B a r r i e r s � 4 9
J O S R E � V o l . 4 � N o . 1 – 2 0 1 2
While the NZ Green Building Council (NZGBC) was only established relativelyrecently in July 2005, and is lagging behind the major markets of Australia, UnitedKingdom, Canada, and the U.S. in terms of the number of Green Star ratedbuildings, research indicates that sustainable buildings will play an important rolein NZ property portfolios in the future (Myers, Reed, and Robinson, 2008).
In NZ, key stakeholders in a position to influence sustainable propertydevelopment in the market place include: the NZGBC, the NZ government,corporate tenants, major developers, institutional property investors and, to someextent, financiers. For the purposes of this research, a sustainable commercialproperty, or green building, is one that fits the social, environmental, and economicbalance stated in the Bruntdland definition of sustainability, evidenced by theproperty being certified by an independent third party.2 In NZ’s case, thisindependent third party is the NZGBC, which administers the Green Star buildingrating system.
� L i t e r a t u r e R e v i e w
New Zealand Green Building Council
The establishment of the NZGBC in July 2005 and the progressive developmentof the Green Star NZ rating tools have provided participants within the NZproperty industry an initial framework to progress the investment in, and thefinancing and construction of, sustainable buildings. The NZGBC became amember of the World Green Building Council in 2006, bringing NZ into theinternational green building framework, yet maintaining its own identity.
The purpose of the NZGBC is to accelerate the development and adoption ofmarket-based green building practices. The NZGBC achieves these aims through:(1) setting standards of best practice through the adaptation of the Green Starrating tool; (2) education and training for all areas of the building industry valuechain; and (3) providing access to networks, information and resources for itsmembers to actively lead the market (NZGBC, 2011a).
Green Star NZ is a comprehensive, national, voluntary environmental ratingscheme that evaluates the environmental attributes and performance of NZ’sbuildings using a suite of rating tool kits developed to be applicable to eachbuilding type and function. Currently, for non-residential property, rating tools areavailable for the following property types/categories: office, interiors, industrial,and education.
Green Star works by evaluating a building against a number of categories thatassess the environmental impact that is a direct consequence of a building’s siteselection, design, construction, and maintenance. The nine categories includedwithin all Green Star rating tools (NZGBC, 2011a) are (1) management, (2) indoorenvironment quality, (3) energy, (4) transport, (5) water, (6) materials, (7) landuse and ecology, (8) emissions, and (9) innovation.
While the NZGBC continues to work on rating tool design and development andto promote the sustainable development of NZ’s property sector, to date rating

5 0 � B o n d a n d P e r r e t t
tools are only available for the design and built stages of a building’s lifecyclewithin the above categories. Tools have yet to be developed for other propertycategories including retail and tourism properties.
An example of the NZGBC’s current efforts to promote sustainable developmentmore widely is an initiative that the NZGBC has worked on with the ChristchurchCity Council, subsequent to and as a result of the devastation from the Canterburyearthquakes. This initiative includes the development of a new building rating toolspecifically for the Christchurch recovery efforts called Building a SustainableEnvironment (BASE). BASE is a simple, introductory-level green buildingassessment for the Christchurch Central City rebuild. The Central City Plan forChristchurch proposes that new office, retail, apartments, and mixed-use buildingswithin the Central City must achieve a ‘pass’ score under BASE. The tool hasbeen developed as a separate, but complementary building assessment offering tothe NZGBC’s existing Green Star tools (NZGBC, 2011b).
Government Policies & Incentives to Improve the Energy Efficiencyof Buildings
In 2001, the NZ government introduced the New Zealand Energy Efficiency andConservation Strategy (NZEECS). The NZEECS is prepared in accordance withthe Energy Efficiency and Conservation Act 2000 and outlines governmentpolicies, objectives, and targets, and as required by the Act, will be in force fora period of five years. It is a detailed action plan for increasing the uptake ofenergy efficiency, conservation, and renewable energy programs across theeconomy. A second version of the NZEEC Strategy was published in 2007 thatlooked at the lessons learned under the previous Strategy. A third edition of theNZEECS (2011–2016) was released in 2011 that sets the government’s policies,objectives, and targets for the next five years and outlines the means by whichthese will be achieved.
The sections of the NZEECS of most relevance to commercial property is‘‘Business’’ and ‘‘Public Sector,’’ two of the six sectors identified that willcontribute to the overall NZ Energy Strategy 2011–2021 goal. The other foursectors are: Transport, Homes, Products, and the Electricity System. According tothe NZEECS, ‘‘The greatest areas of potential improvement (in energy efficiency,ed.) are the transport and business sectors, followed by the residential sector,’’(Energy Efficiency and Conservation Authority, 2011, p. 17).
According to the NZEECS 2011, ‘‘Energy efficient commercial building designand the use of building materials that enhance energy efficiency offer majoropportunities to lock in substantial energy savings through a building’s life,’’(EECA, 2011, p. 21). To assist the raising of building performance, thegovernment pledges to invest in further research into how energy is used inbuildings that will inform a review of the building code. Further, the governmentsupports the adoption of market-based solutions that set aspirational goals aboveminimum standards that include the use of building performance rating tools, suchas those developed by the NZGBC. The government recognizes that more energy-
T h e K e y D r i v e r s a n d B a r r i e r s � 5 1
J O S R E � V o l . 4 � N o . 1 – 2 0 1 2
efficient buildings require greater building management and technical expertiseand is committed to further investing in building the capability and capacity ofthe building and construction sector.
Additionally, under NZEECS 2011–2016, the government’s procurement reformprovides an important lever to support public sector agencies in making energy-efficient choices in the purchase and lease of energy-efficient buildings. As such,‘‘local government has a significant role in providing community leadership, long-term investment planning and implementing building, resource management, andtransport legislation,’’ (EECA, 2011, p. 27).
A 2009 Ministry for the Environment (MFE) report entitled New Zealand’s FifthNational Communication under the United Nations Framework Convention onClimate Change identifies policies and measures applicable to the commercialproperty sector. These include programs run by the EECA to support businessesto become more energy efficient: financial assistance through the ElectricityCommission to improve electricity efficiency, and initiatives developed by MPI toincrease the use of wood as a construction material as MAF-sponsored researchshows that wood-based building products have a lower greenhouse gas footprintthan other construction materials (Ministry for the Environment, 2011).
The EECA provides information on new technologies and energy managementand one-on-one support for energy-intensive businesses. Grant funding is availablefor energy and design audits and also for new or under-utilized technologyimprovements. Up to 40% of the total project cost is available (up to $100,000),or up to 75% of the cost of a feasibility study (up to $10,000) for newtechnologies. Examples of technologies funded include fans and boiler controls,bio-digesters, and heat recovery systems (Ministry for the Environment, 2011).
The EECA is also the principal sponsor for the introduction and use of theNational Australian Built Environment Rating System (NABERS) in NZ and hasnegotiated a license from the Australian government for an initial term of fiveyears with an option to extend for a further five years. NABERS measures anexisting building’s environmental performance during operation. It rates a buildingon the basis of its measured operational impacts in categories such as energy,water, waste and indoor environment (NABERS, 2010). The EECA is seeking topartner with the NZ property industry to administer the NABERS scheme in NZ.The EECA expects to formally launch NABERS (for office energy only, initially)in NZ by January 2013.
The Electricity Commission offers financial assistance to businesses in thecommercial sector to improve their electricity efficiency. Businesses can apply forpart-funding from the Electricity Commission for electricity efficiency projectswhere there is a current barrier preventing such projects from proceeding. Theseprojects target efficiency measures such as upgrades of building managementsystems, lighting replacements, replacement of inefficient chiller systems, orinstallation of monitoring and targeting systems (Ministry for the Environment,2011).
In addition to the specific government policies and measures outlined above, thegeneral controls of building and environmental legislation, such as the Building

5 2 � B o n d a n d P e r r e t t
Act 2004 and Resource Management Act 1991, provide a broad framework toencourage sustainable development of the commercial property sector.
Drivers and Barriers to Green Building
A study of the NZ property sector by Myers, Reed, and Robinson (2008, p. 318)found that ‘‘the perception of the investor and developer markets in NZ was thatsustainable buildings will play an important role in property portfolios in thefuture. Although there is uncertainty about the value and market for sustainablebuildings at the present, investor optimism was clearly identified. However, thelevel of uptake and investment in sustainable buildings would be accelerated ifevidence for the financial case for sustainable buildings was proven.’’
There is a lack of research in NZ about the financial performance of greenbuildings compared to conventional buildings. However, in Australia, a study byNewell, MacFarlane, and Kok (2011) to assess the value premium of bothNABERS energy and Green Star ratings in the office market found that a 5 starNABERS energy rated building delivered a value premium of 9% compared to anon-rated building, with a 5 star Green Star rating showing a premium in valueof 12% compared to a non-rated building. A 3–4.5 star NABERS energy ratedbuilding achieved a 2%–3% value premium compared to a conventional building.
There are a number of quantitative studies of financial performance of greenbuildings in the U.S., where sales data are more readily available and sustainableratings for buildings have been in existence longer [Leadership in Energy andEnvironmental Design (LEED) was developed in 1998 in the U.S.] than is thecase for Australia or NZ (2003 and 2005, respectively).3 For example, a study byFuerst and McAllister (2009) of the effect of eco-labeling (LEED and ENERGYSTAR) on the occupancy rates of commercial offices in the U.S. found asignificant positive relationship between occupancy rate and the eco-label.Controlling for differences in age, height, building class, and quality, the resultssuggest that occupancy rates are approximately 8% higher in LEED-labeled officesand 3% higher in ENERGY STAR-labeled offices. Miller, Spivey, and Florance(2008), using the CoStar database, found that LEED buildings command rentpremiums of $11.33 per square foot over their non-LEED peers and rental ratesin ENERGY STAR buildings represent a $2.40 per square foot premium overcomparable non-ENERGY STAR buildings. ENERGY STAR buildings are sellingfor an average of 5.76% more, while LEED buildings command a 9.94% premium.
Drivers for green building, other than financial performance, are outlined, forexample, by Yudelson (2010), and include:
� Utility cost savings for energy and water.� Maintenance cost reductions.� Increased value from higher net operating income (NOI), due to higher
rents and greater occupancy in certified buildings.� Increased occupier productivity, due to improved health of tenants, and
reduced absenteeism.

T h e K e y D r i v e r s a n d B a r r i e r s � 5 3
J O S R E � V o l . 4 � N o . 1 – 2 0 1 2
� Marketing benefits, especially for developers and building owners.� Public relation benefits, especially for developers, building owners, and
managers.� Recruitment and retention of key employees.� Demonstration of commitment to sustainability and environmental
stewardship.
According to Ang and Wilkinson (2008), regulation is the tool government usesto drive the market toward more energy-efficient buildings. In addition, accordingto Bond (2010), in Australia the government and other public-sector bodies areleading by their examples in their briefs for sustainable buildings. Largeprogressive corporations in the private sector are also a leading driver for greenbuildings (Bond, 2010, p. 5). Many companies today have a strong environmentalfocus and sustainability policy at the core of their business, which leads them tooccupy a green building.
Smith and Baird (2007) found that ‘rising energy costs’ is one of the primarydrivers for sustainable buildings in NZ. Although according to the Green BuildingCouncil of Australia (2008), tenants have become less focused on savings inoperating costs, and are placing a higher value on the intangible benefits, such asproductivity, staff attraction and retention, and reduced sick leave and absenteeism.Miller, Spivey, and Florance (2008) estimate the productivity benefits fromenvironmentally sustainable building designs to be as much as 10 times the energysavings from green efforts.
Despite the advantages of sustainable buildings, there are many barriers toinvesting in greening buildings (Urban Land Institute, 2009; Bond, 2010;Yudelson, 2010):
� Financial Considerations: One of the biggest barriers to investing ingreen buildings is the perception that they cost more compared toconventional buildings. However, according to Davis Langdon (2007),there is no significant difference in average costs for green buildings ascompared to non-green buildings.
� Split Incentives: Another barrier is split incentives between landlord’sand tenant’s where the landlords are investing in green buildings but thetenants are benefiting through reduced energy and water costs, greaterproductivity, etc.
� Lack of Knowledge and Experienced Workforce: A lack of practicalunderstanding among building owners about energy efficiency and greenbuilding, including overestimates of the initial cost premium, hinders theimplementation of sustainability measures.
� Lack of Incentives: Incentives are not strong enough to change behavior.Energy prices are still low and tax and other political incentives are notsignificant enough to change behavior.
According to Choi (2009), the benefits of green buildings are only evident overthe longer period and recommends documenting and communicating the cost,

5 4 � B o n d a n d P e r r e t t
benefits, and performance of green buildings as part of the strategy to increaseadoption of green building practices.
The next section will briefly describe the research methodology and data set. Theresults are then discussed. The final section provides a summary and conclusion.
� R e s e a r c h
Due to the limited number of sales of green buildings in NZ, a quantitative studyto determine any expected value premium from such buildings was not possible.Instead, this study investigates the barriers and drivers to sustainable development,not to prove the ‘‘business case’’ for such development, but to learn what theindustry perceives the drivers and barriers are to the uptake of sustainable buildingpractices.
Methodology
The drivers and successes as well as the barriers and impediments to the uptakeof sustainable practices were investigated. This involved a combination of an inperson structured interview with a representative of the NZGBC and an onlinesurvey of participants in the commercial property sector.
Survey Samples
An interview was arranged with the NZGBC’s Director of Business and Technical,Rohan Bush, as the CEO’s nominee for the interview. The sample for the onlinesurvey of commercial property sector professionals and executives was compiledfrom various professional registers and websites, including the NZGBC’s website,the Property Institute of NZ membership directory, the Property Council of NZmembership directory, and the NZ Institute of Architects directory. This sampleof 300 people consisted of property investors, property developers, propertymanagers, architects, building contractors, financiers, project managers, andproperty consultants.
Data Collection Methods
The interview with Rohan Bush was conducted using a semi-structuredquestionnaire pre-approved by the NZGBC. The online survey of the commercialproperty sector was conducted utilizing Qualtrics online survey software. Due tothe length of the overall survey and to encourage respondents to answer allapplicable questions, the survey was structured in two parts. Section one targeteddevelopers, investors, and managers and section two targeted the balance of thesample. With the exception of just a few questions that reflected the particularsample segment, the questions in section two mirrored those in section one.
The online survey had five sections. The first section was designed to captureinformation about the respondents, their companies, and whether or not they haveexperience in green building. The second section focused on respondents who

T h e K e y D r i v e r s a n d B a r r i e r s � 5 5
J O S R E � V o l . 4 � N o . 1 – 2 0 1 2
indicated they have experience in green building and sought to capture their viewson a range of issues around their involvement in green building including keydrivers and barriers to green building. The third section focused on the respondentswho do not have any experience with green buildings, but expressed an interestin becoming involved in this sector of the industry. The fourth section focused onthe respondents who indicated no interest in green building and sought tounderstand their reasons. The fifth section sought to capture all respondents’ viewson the capacity of the NZ property sector to drive forward the sustainabilityagenda and what changes and improvements they view as being required toincrease green building investment and development in NZ’s commercial propertysector.
A survey link along with an explanation of the purpose of the survey was emailedto each person in the sample, inviting them to participate. A follow-up reminderemail was sent one week after the initial email. The level of response to the onlinesurvey is discussed below. Responses from the survey were downloaded andanalyzed using Excel. Numerical results are expressed as either an average of thescores for each category for a particular question (the lower the score, the moresignificant) or as a percentage of the total responses received for a particularquestion.
� R e s u l t s
NZ Green Building Council Interview Results
The interview was conducted with the NZGBC’s Rohan Bush. Questions werestructured in two sections and were designed to obtain input from the NZGBC inseven key areas including:
1. Where the NZGBC is in its development as an organization.2. The current view of green building within the public and private sectors.3. The overall level of interest in green building.4. Drivers and barriers to green building.5. The status of the Green Star certification system.6. Education of property practitioners on green building.7. The Christchurch rebuild.
The NZGBC Organization. The NZGBC has been in existence for over six yearsand has grown considerably. There are 13 full-time staff equivalents employed bythe NZGBC and the organization’s work program addresses both residential andcommercial buildings.
The NZGBC continues to attract a large number of organizations as members andenjoys a high level of industry support. Approximately one-third of the NZGBC’sincome comes from membership subscriptions, a further third from runningeducation and training programs, and the final third from running events and
5 6 � B o n d a n d P e r r e t t
managing special projects. While the NZGBC has progressed in its organizationaldevelopment and in gaining industry support, until such time as it is fullyresourced (including financing and staffing levels) to allow for further toolsdevelopment, the industry as a whole will be somewhat hampered in its uptakeof green building.
Current State of NZ’s Green Building Industry. The NZGBC considers that thecurrent state of the green building industry in NZ is ‘‘developing’’ since theexisting buildings performance tool, other building type tools, and NABERS arenot yet in place. The NZGBC considers that the public are ‘‘moderately interested’’in green building and observed that the media often picks up on events such as anew Green Star rated building being completed or a green building event beingheld. Notwithstanding this, the NZGBC believes that further education of thepublic is required concerning green building.
The NZGBC also considers that the government is only moderately interested ingreen building and that while there is some ministerial support, green building isnot a top priority for the present government. It was noted that there is, however,some project-based government funding available. In comparison to its views onthe government and public’s interest in green building, the NZGBC considers thatthe commercial property sector is very interested in green building given it has aregistered membership of 450 businesses and organizations, generally goodattendances at events, and a good uptake of Green Star ratings.
Drivers and Barriers to Green Building. When asked to rank various options(from 1 to 10, 1 being the most significant) as to what prevents the incorporationof sustainable features in developments, low client demand was ranked as themost significant, followed by high costs versus low perceived benefits. Thisresponse suggests that a lack of government incentives is a significant barrier togreen building development, implying that increased government incentives wouldhelp to overcome the issue of cost. The full rankings are shown in Exhibit 1.
In terms of the drivers to green building development, an industry rating systemwas ranked as the most important driver, followed by competitive advantage, andthirdly tenant satisfaction and productivity. Exhibit 2 shows the full rankings.
Perhaps not surprisingly, the NZGBC identified the most significant driver as theGreen Star rating system that it promotes. Beyond this, the rankings given by theNZGBC imply that market-related factors such as ‘competitive advantage’ aremore significant drivers of green building than ‘government policy’ and regulatorycontrols such as the building code.
Green Star Ratings. The NZGBC licenses Green Star from the Green BuildingCouncil of Australia (GBCA) and has to obtain approval from the GBCA forchanges to Green Star in NZ. While there are significant cost savings to theNZGBC by effectively ‘piggy backing’ on the GBCA, the NZGBC does not havethe freedom to change Green Star in NZ as it so chooses.
The numbers of buildings that have been certified either with a Green Star designor built rating are shown in Exhibit 3. These figures indicate that two-thirds of

T h e K e y D r i v e r s a n d B a r r i e r s � 5 7
J O S R E � V o l . 4 � N o . 1 – 2 0 1 2
Exhibi t 1 � Barriers to the Incorporation of Sustainable Features in Developments
(1 = most important, and 10 = least important)
Exhibi t 2 � Drivers of Green Building Development
(1 = most important, and 10 = least important)

5 8 � B o n d a n d P e r r e t t
Exhibi t 3 � Green Star Certifications
Tool4 GreenStars
5 GreenStars
6 GreenStars
NewBuildings
ExistingBuildingsa Total
Office V1 & 2009 22 24 3 38 11 49
Office ‘‘As Built’’ 4 5 1 10 0 10
Industrial Design 2009 0 1 0 1 0 1
Education Design 2009 0 10 0 10 0 10
Interior 2009 2 3 2 7
Total 28 42 6 59 11 77
Note:a Retrofit
Green Star certifications have been awarded for newly constructed office buildingsand around 78% of all Green Star certifications awarded to date have been fornew buildings.
Over half (55%) of the ratings are for 5 Green Stars, compared to 36% for 4Green Star and only 8% are 6 Green Star. This indicates that the market has anappetite for a 5 Green Star office product notwithstanding that a cost premiummay apply in comparison to a conventional building or a 4 Green Star product.However, a 5-star rating is still more readily obtainable compared to a 6-starrating, where the cost premium can be significant. The ‘‘As Built’’ rating, whichis based on performance data collected over a year and used to indicate whetherthe building is performing as designed, is less common, with only 17% of officeratings being ‘‘As Built.’’ This may be due to the use of ratings primarily formarketing purposes (to sell or lease space), as well as the additional cost ofobtaining the ‘‘As Built’’ rating.
When asked to give an indication of any cost premium for building a green versusa non-green building of 4, 5, and 6 Green Stars, the NZGBC advised that nocomprehensive research had yet been undertaken to test this in NZ, but thatinternational research indicates that if a project is managed correctly, there is thepotential for no cost premium to achieve a 4 or 5 Green Star certification.However, when not managed correctly, a 4 Green Star building can cost up to 5%more than a non-green building and a 5 Green Star building can cost up to 10%more than a non-green building. A 6 Green Star building, if managed correctly,has the potential to only cost around 5% more, but if not managed correctly, itcould cost up to 10% or more than the cost of a non-green building. The NZGBCconsiders that one of the main barriers to the commercial property sector’s uptakeof the Green Star certification system is the cost of obtaining certification. Toaddress this issue, the NZGBC is planning a tool review with the objective ofreducing the cost of obtaining certification by 20% to 30%.
T h e K e y D r i v e r s a n d B a r r i e r s � 5 9
J O S R E � V o l . 4 � N o . 1 – 2 0 1 2
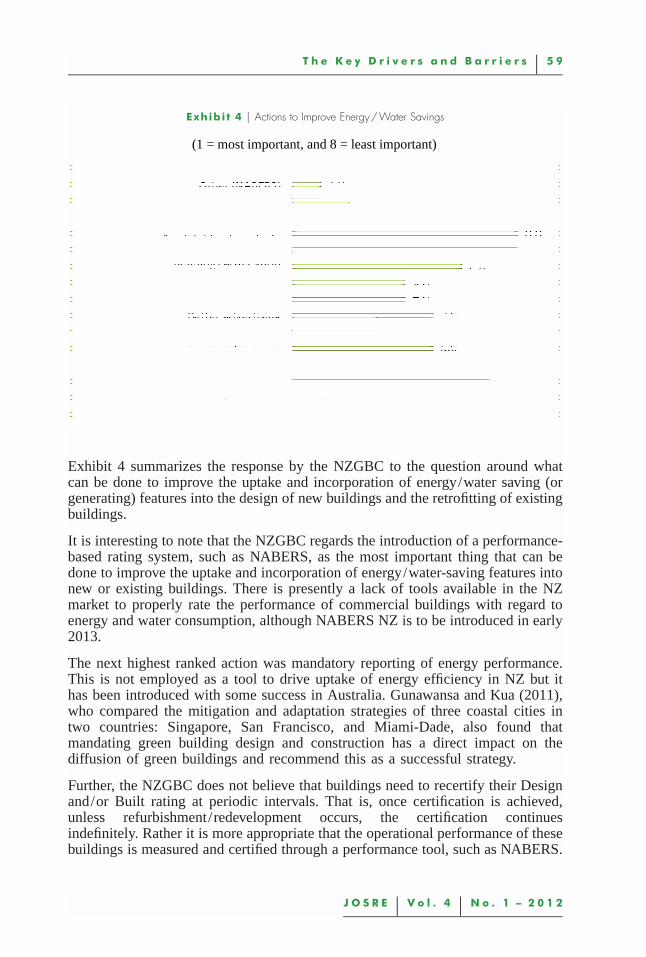
Exhibi t 4 � Actions to Improve Energy/Water Savings
(1 = most important, and 8 = least important)
Exhibit 4 summarizes the response by the NZGBC to the question around whatcan be done to improve the uptake and incorporation of energy/water saving (orgenerating) features into the design of new buildings and the retrofitting of existingbuildings.
It is interesting to note that the NZGBC regards the introduction of a performance-based rating system, such as NABERS, as the most important thing that can bedone to improve the uptake and incorporation of energy/water-saving features intonew or existing buildings. There is presently a lack of tools available in the NZmarket to properly rate the performance of commercial buildings with regard toenergy and water consumption, although NABERS NZ is to be introduced in early2013.
The next highest ranked action was mandatory reporting of energy performance.This is not employed as a tool to drive uptake of energy efficiency in NZ but ithas been introduced with some success in Australia. Gunawansa and Kua (2011),who compared the mitigation and adaptation strategies of three coastal cities intwo countries: Singapore, San Francisco, and Miami-Dade, also found thatmandating green building design and construction has a direct impact on thediffusion of green buildings and recommend this as a successful strategy.
Further, the NZGBC does not believe that buildings need to recertify their Designand/or Built rating at periodic intervals. That is, once certification is achieved,unless refurbishment/redevelopment occurs, the certification continuesindefinitely. Rather it is more appropriate that the operational performance of thesebuildings is measured and certified through a performance tool, such as NABERS.

6 0 � B o n d a n d P e r r e t t
To this end, the NZGBC has been working with the EECA to bring NABERSinto NZ as a joint industry/government initiative. While the NZGBC would liketo have developed its own Green Star building performance tool (close to aNABERS equivalent), due to funding restrictions and the EECA being keen onintroducing NABERS into the NZ property market, it is likely that NABERS willbecome the property industry benchmark in NZ for measuring the environmentalperformance of commercial buildings.
The NZGBC considers that the introduction of NABERS into the NZ market willprovide the following opportunities: (1) benchmarking of individual buildings andportfolios; (2) increased ability to improve the environmental performance of abuilding on a measured basis; and (3) better level of information available forexisting and/or prospective tenants of a building.
In commenting on the strengths and weaknesses of NABERS, the NZGBC notedthat NABERS is relatively simple and cost effective to manage. It is also highlyflexible in that it can be applied to a ‘base building,’ an individual tenancy, or anentire building. The main weakness of NABERS that the NZGBC identified isthat it is not a holistic approach to the assessment of a building’s environmentalperformance. Ideally, the NZGBC would like to see a Green Star design, builtand performance-based system in place for the design and ongoing managementof green-rated commercial buildings in NZ.
Education of Property Practitioners. While the NZGBC runs training programsfor those who wish to become qualified practitioners and/or accreditedprofessionals in the application of Green Star, it considers there is also a need forincreased education of asset and property managers in the management of GreenStar certified commercial property. The NZGBC is working with universities,technical institutes, and the Property Institute of NZ to ensure all relevantprofessions have access to quality education on green buildings.
Christchurch Rebuild. The final question to the NZGBC was in relation to theopportunities that the rebuild of the Christchurch CBD presents for the NZGBCto promote green building in NZ. The NZGBC recognizes that the Christchurchrebuild provides an opportunity for it to demonstrate leadership and to facilitateproperty industry and community discussion around the sustainability of the builtenvironment. The NZGBC sees the Christchurch rebuild as an opportunity to makegreater progress in advancing the sustainability of NZ’s built environment.
Results from the Survey of the Commercial Property Sector
The online industry survey of 300 NZ-based property professionals wasundertaken in 2011. The survey was divided into two sections: section one asksquestions about the respondent and their company’s background; section two asksquestions about the respondent’s involvement with ‘‘green’’ buildings. The overallresponse rate was 18.67% (n � 56) after one follow-up reminder. Of the 56 peoplewho participated, 34 (60.7% of those that responded, or 11.3% of the total sample)were involved in green buildings.
The sample of property professionals, many of whom are key players in NZ’scommercial property sector, included investors, developers, asset and property

T h e K e y D r i v e r s a n d B a r r i e r s � 6 1
J O S R E � V o l . 4 � N o . 1 – 2 0 1 2
Exhibi t 5 � Analysis of Sample
36
53
22
75
2228
34
5
25
0
5
10
15
20
25
%
Dev
elop
ers
Inve
stor
sM
anag
ers
Arc
hite
cts
Pro
ject
Man
ager
Pro
pert
yC
onsu
ltant
sC
ontr
acto
rsFi
nanc
iers
Oth
erRespondent Category (numbers shown above the bar)
managers, building contractors, architects, financiers, project managers, andproperty consultants. Exhibit 5 provides a breakdown of the professionalbackgrounds of the 300 people invited to take part in the survey.
For reasons not disclosed, financiers and project managers chose not to participate.Exhibit 6 provides a breakdown by profession of the 56 respondents. The largestrespondent group was architects, followed equally by developers, investors, andmanagers. The ‘Other’ category was made up of corporate real estate managers,quantity surveyors, engineers, an energy management provider, and occupiers.
Section One: Company Information. Over three-fourths (77%, n � 43) ofrespondents hold senior management positions: managing directors or seniormanagers. The ‘Other’ category was represented by mid-tier property managersand property specialists. The majority of respondents were men (89%, n � 50)with 70% (n � 39) of the respondent’s company’s operational location being inAuckland, NZ’s largest commercial property market, 16% (n � 9) in Wellington,the capital city of NZ, 5.4% (n � 3) in Christchurch, and 7% (n � 4) locatedthroughout NZ. The companies had been involved in the NZ property industry fora wide range of time periods from 3 years to 100 years (mean � 24.6 years).Exhibit 7 indicates that the spread of categories within which the respondentsoperate is strongly weighted towards commercial office, industrial, and retailproperty, with close to one-third being involved with a combination of theseproperty types. The ‘Other’ category represents primarily residential, hotel, motel,and retirement village property types.

6 2 � B o n d a n d P e r r e t t
Exhibi t 6 � Respondent Categories
8 8 8
15
0
34
0
10
0
5
10
15
20
25
30
%
Dev
elop
ers
Inve
stor
sM
anag
ers
Arc
hite
cts
Pro
ject
Man
ager
Pro
pert
yC
onsu
ltant
sC
ontr
acto
rsFi
nanc
iers
Oth
er
Respondent Category (number shown above the bar)
Exhibi t 7 � Property Categories
5139
45
2223
21
11
17
0102030405060708090
100
%
Com
mer
cial
Indu
stri
al
Ret
ail
Hea
lthE
duca
tion
Oth
erC
omm
, Ind
&R
etai
lC
ombi
natio
n
Property Type (number shown above the bar)
T h e K e y D r i v e r s a n d B a r r i e r s � 6 3
J O S R E � V o l . 4 � N o . 1 – 2 0 1 2
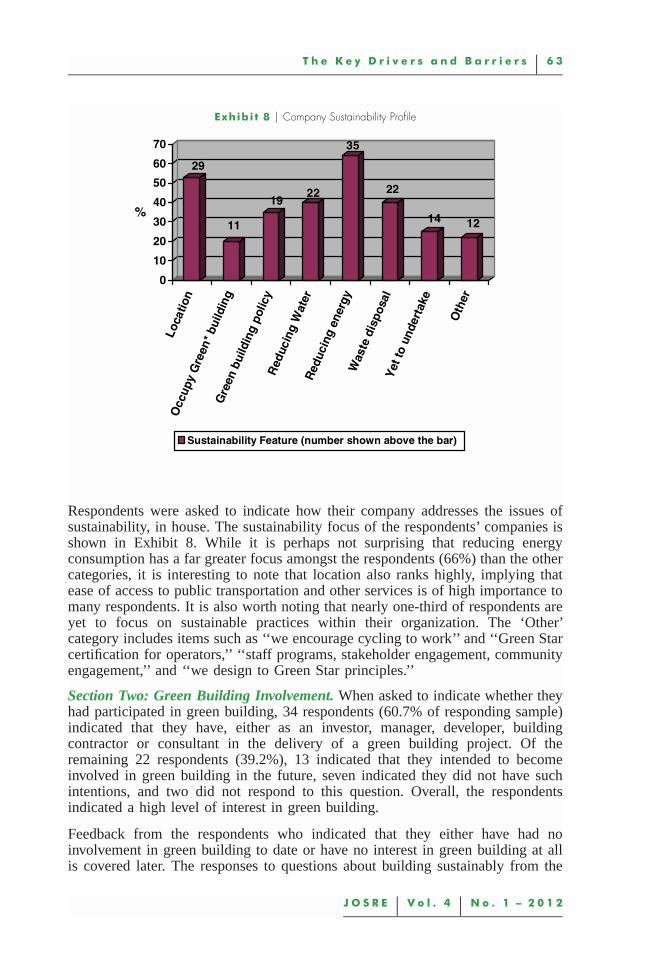
Exhibi t 8 � Company Sustainability Profile
29
11
1922
35
22
14 12
0
10
20
30
40
50
60
70
%
Loca
tion
Occ
upy
Gre
en*
build
ing
Gre
enbu
ildin
gpo
licy
Red
ucin
gW
ater
Red
ucin
gen
ergy
Was
tedi
spos
alY
etto
unde
rtak
e
Oth
er
Sustainability Feature (number shown above the bar)
Respondents were asked to indicate how their company addresses the issues ofsustainability, in house. The sustainability focus of the respondents’ companies isshown in Exhibit 8. While it is perhaps not surprising that reducing energyconsumption has a far greater focus amongst the respondents (66%) than the othercategories, it is interesting to note that location also ranks highly, implying thatease of access to public transportation and other services is of high importance tomany respondents. It is also worth noting that nearly one-third of respondents areyet to focus on sustainable practices within their organization. The ‘Other’category includes items such as ‘‘we encourage cycling to work’’ and ‘‘Green Starcertification for operators,’’ ‘‘staff programs, stakeholder engagement, communityengagement,’’ and ‘‘we design to Green Star principles.’’
Section Two: Green Building Involvement. When asked to indicate whether theyhad participated in green building, 34 respondents (60.7% of responding sample)indicated that they have, either as an investor, manager, developer, buildingcontractor or consultant in the delivery of a green building project. Of theremaining 22 respondents (39.2%), 13 indicated that they intended to becomeinvolved in green building in the future, seven indicated they did not have suchintentions, and two did not respond to this question. Overall, the respondentsindicated a high level of interest in green building.
Feedback from the respondents who indicated that they either have had noinvolvement in green building to date or have no interest in green building at allis covered later. The responses to questions about building sustainably from the

6 4 � B o n d a n d P e r r e t t
Exhibi t 9 � Green Building Categories
21
10
32
8
12
1
4
65
00
10
20
30
40
50
60
70
80
90
100
%
Off
ice
Ret
ail
Indu
stri
al
Apa
rtm
ents
Inte
rior
s
Oth
er
New
Retrofitted
34 respondents (11.3% of the total sample) who are involved in green buildingare considered next.
Respondents Who Are Involved in Green Buildings
The respondents involved in green building were asked how long they have beeninvolved. From the 21 responses received (37.6% of the total respondent groupof 56), the experience ranged from one to six years, with an average of four years.The number of buildings, new or retrofitted, that respondents have been involvedwith either to develop, manage or own varies between one and ten, with only onerespondent indicating the higher level of involvement, and the mode is three.While these statistics indicate that the respondents are relatively light on greenbuilding experience, it is put more in perspective when one considers that theNZGBC was only established in July 2005.
Exhibit 9 indicates that the primary categories for new green buildings that the21 respondents have involvement with have been the office and industrial sectors,with ‘‘other’’ represented by schools/education, hospital laboratories, andcommunity buildings. Only ten respondents have involvement with greenretrofitted buildings, and this has again focused on the office sector, but theserespondents are also involved in the other sectors to a lesser extent.
Drivers and Barriers to Green Building. When asked to indicate their reasonsfor being involved in green building, 16 (80%) of the 20 respondents indicatedthat ‘‘benefit to the environment’’ is the primary driver, closely followed by‘‘tenant demand’’ (75%, n � 15) and corporate social responsibility (60%, n �12). Exhibit 10 outlines these responses. These results suggest that the commercial

T h e K e y D r i v e r s a n d B a r r i e r s � 6 5
J O S R E � V o l . 4 � N o . 1 – 2 0 1 2
Exhibi t 10 � Reasons for Being Involved in Green Buildings
1
8
15
1
98
1
12
16
0
10
20
30
40
50
60
70
80
%
Fina
ncia
l inc
entiv
esFi
nanc
ial b
enef
itsTe
nant
Dem
and
Fina
ncie
rre
quir
emen
tC
ompa
nyIm
age
Per
sona
l ben
efits
Reg
ulat
ions
CS
RB
enef
itto
envi
ronm
ent
property sector sees green building as offering a balance between the commercialand environmental aspects of property investment and development.
Only half (17) of the respondents involved in green buildings answered thequestion about where the demand for green buildings is coming from. Themajority (94%) of those respondents consider that the demand comes from theclient, less than half believe it comes from their recommendations to clients, and23.5% said it was due to government requirements to procure or occupy greenbuildings. Only 17.6% said it was due to the NZ Building Code requirements andanother 17.6% said it was for ‘‘Other’’ reasons such as a global response or tenantexpectations.
Exhibit 11 indicates that the most preferred sustainable features being incorporatedinto new buildings are, in order of preference, air conditioning, light zoning/sensors, and thermal zoning. Similarly ranked for retrofitted buildings, mostpreferred were light zoning/sensors, followed by air-conditioning, and thermalzoning. The least preferred sustainable features indicated for both new andretrofitted buildings were waterless urinals and renewable energy sources. The‘Other’ category includes features such as rain water harvesting, smart metering,and building management systems. There were 18 responses to the question onnew building features representing 53% of the sample that is involved in greenbuildings, i.e., 34 (or 32% of all 56 respondents to the survey), and 13 responses

6 6 � B o n d a n d P e r r e t t
Exhibi t 11 � Preferred Sustainable Features
Sustainable Features New Build Rank Retrofitted Rank
Air-conditioning 1 2
Light zoning &/or light sensors 2 1
Thermal zoning 3 3
Low ozone depleting potential refrigerants 4 4
Solar hot water systems 5 6
Bicycle racks and shower 6 5
Automatic external louvers 7 7
Use of renewable energy sources 8 8
Waterless urinals 9 9
Other, please specify 10 10
for the question relating to retrofitted building features (38% of those involved ingreen buildings).
Next, respondents were asked to identify the most energy efficient sustainablebuilding design features that they have used to achieve positive sustainabilityoutcomes and to indicate payback periods where available. Answers were quitevaried and included: ‘‘Good internal light composition, cross ventilation alongwith good thermal properties in construction materials.’’ ‘‘Upgrade to highfrequency (HF) ballasts and eco fluorescent lighting: payback of approximately2.1 years.’’ ‘‘Solar orientation to maximize natural light to floor plate.’’ ‘‘Daylightharvesting/daylight improvement: payback less than six months.’’ ‘‘Reduce openplan lighting levels to 400 lux.’’ ‘‘Separate metering of energy.’’ ‘‘Passive designcoupled with solar shading and mixed mode natural ventilation.’’ ‘‘The use ofVRV air-conditioning, light zoning, and sensors.’’ ‘‘Minimizing internal appliedfinishes, lighting and air-conditioning zoning, external sun shade devices.’’‘‘Passive ventilation, water reducing elements, solar: payback around five years.’’
Respondents were also asked to identify the most effective building materials theyhave used to achieve energy-efficient, sustainable building outcomes and toindicate payback periods where available. Again, answers were quite varied andincluded: ‘‘Fly ash concrete, even though the cement is considered problematic.’’‘‘Recycled materials (green rated).’’ ‘‘Low E glazing.’’ ‘‘Exposed concrete fordurability and thermal storage.’’ ‘‘Timber.’’ ‘‘Recyclable polyester insulation.’’
These responses indicate that to a certain extent the industry is aware of and hasimplemented a range of energy-efficient design features, technologies, andmaterials in buildings to achieve positive sustainability outcomes. Althoughthere appears to be somewhat limited knowledge amongst the respondentsof the payback periods of incorporating these design features, technologies, andbuilding materials.

T h e K e y D r i v e r s a n d B a r r i e r s � 6 7
J O S R E � V o l . 4 � N o . 1 – 2 0 1 2
Exhibi t 12 � Barriers to Incorporation of Sustainable Features in Developments
Barrier Rank
Unwillingness to pay additional costs 1
High costs vs. low perceived benefits 2
Lack of government incentives 3
Lack of owner/occupier awareness 4
Low client demand 5
Lack of developer awareness 6
Poor access to information 7
Unreliable/unproven technology 8
Limited availability of new technology 9
Other, please specify 10
When asked whether buildings that are designed to be more energy efficient areactually being used in a way that maximizes their energy/resource useperformance, 29% of the 21 respondents to this question answered yes, 33%answered no, and the remainder were unsure. Those that answered ‘no’ indicatedthat better education of owners, managers, and occupiers of green buildings isneeded. One respondent also noted that there are no measures to ensure that greenbuildings are operated as designed. Another noted that there is inadequatehandover information/user guides provided to occupiers.
Respondents were asked if they know what the average energy/water saving isfor a green building compared to a conventional building. The majority (86%) ofrespondents answered ‘no,’ indicating that there is a real need to educate and getinformation into the market around the performance of green buildings comparedto conventional buildings. The introduction of a system such as NABERS willgive more certainty to those involved in the property industry around the actualenvironmental performance of green buildings and will assist in the managementof these buildings.
Exhibit 12 shows that according to respondents the primary barriers to theincorporation of sustainable features in developments are the marketsunwillingness to pay for the additional costs of sustainable features and that themarket is yet to be fully convinced that the extra cost of building green issupported by the benefits. There is also an indication that the market wouldrespond more favorably to green building if there were government subsidies andincentives for doing so. The ‘Other’ category includes statements such as ‘‘ourbuildings are relatively new’’ and ‘‘not enough incentives.’’
Exhibit 13 shows that the primary driver of green building is tenant satisfactionand productivity. Today, many corporations have sustainability policies integral totheir business operations. The requirement to occupy a green building is often

6 8 � B o n d a n d P e r r e t t
Exhibi t 13 � Drivers of Green Building Development
Driver Rank
Tenant satisfaction and productivity 1
Superior building performance 2
Rising energy costs 3
Competitive advantage 4
Lower lifecycle costs 5
Industry rating system (Green Star) 6
Government policy 7
Building code 8
Increased education 9
Greater availability of green products 10
Exhibi t 14 � Benefits of Green Buildings
Benefits Rank
Occupancy cost savings 1
Increased property value 2
Increased rent 3
Marketing potential 4
Healthy indoor air quality 5
Decreased obsolescence 6
Other 7
mandated by a company’s sustainability policy. Therefore, it is not surprising thatthe industry rated tenant satisfaction and productivity as the key driver of greenbuilding development. Other key drivers include superior building performanceand rising energy costs, followed by competitive advantage and lower lifecyclecosts. Over the medium to longer term, it is these factors that set green buildingsapart from traditional buildings.
Cost of Green Buildings. When asked to indicate what clients would consider anacceptable level of additional cost for incorporating sustainable features into abuilding, more than half of the respondents (52.9%) indicated that clients wouldaccept a premium of up to 5%. The balance of the respondents was evenly splitbetween no additional cost and a 5% to 10% additional cost. Exhibit 14 indicatesrespondents’ views of what they believe clients would consider the importantfinancial and non-financial benefits for additional costs that may be incurred for

T h e K e y D r i v e r s a n d B a r r i e r s � 6 9
J O S R E � V o l . 4 � N o . 1 – 2 0 1 2
Exhibi t 15 � Cost Premium of Green vs. Non-green Buildings
1
0 0
3
1
0
6
3
1
7
6
2
0
7
8
0 0
6
0
5
10
15
20
25
30
35
40
45
50
%
0%
1-2%
3-5%
6-10
%
11-2
0%
>20%
4 Green Stars
5 Green Stars
6 Green Stars
incorporating sustainable features into a building. Occupancy cost savings wereconsidered to be the most important benefit, which would ultimately flow throughto increased rent and property value, being the second and third ranked benefitsidentified. Financial benefits were generally regarded as more important than non-financial benefits.
Exhibit 15 shows respondents views on the question of what the cost premium is(if any) for a green building versus a non-green building for a 4, 5, and 6 GreenStar rating. The responses indicate that of the 17 respondents who answered thisquestion over three quarters (76%) felt that there is a cost premium to achieve a4 Green Star rated building of 3% to 10%. This is a wide variance for what canbe described as an ‘‘entry level’’ Green Star rating and is markedly different tothe NZGBC’s response to this question, which was zero increased cost if managedcorrectly, up to 5% otherwise.
The same issue appears to exist for 5 Green Star rated buildings. The industryresponse indicates a cost premium of 6% to 20%: 35% thought there would be a6% to 10% premium and 41% felt the premium would be 11% to 20% premium.The NZGBC has indicated zero cost premium if done properly and up to 10%premium otherwise. Likewise, 82.4% of respondents indicated an 11% to 20% ormore premium for a 6 Green Star rated building; 47% responded that they feltthe premium would be 11% to 20% and 35% responded that they felt there wouldbe a 20% or higher premium. Whereas the NZGBC advised a premium of 5 to10% depending on how well a project is managed. This issue of the cost premiumfor green buildings versus non-green buildings is clearly something that theindustry is weary of and appears to be a major barrier to the progress of greenbuilding in NZ.

7 0 � B o n d a n d P e r r e t t
Exhibi t 16 � Actions to Improve Energy/Water Savings
Actions New Build Rank Retrofitted Rank
Building code 1 2
Change in legislation 2 3
More rebates/subsidies 3 2
Building certification 4 4
Mandatory energy efficiency 5 5
Availability of products 6 6
Better advertising 7 7
Other, please specify 8 8
Interestingly, when asked if a project’s profitability was projected to be lower dueto green building practices being implemented would they still proceed, over half(53%, n � 9) of respondents answered ‘yes’ and 47% (n � 8) answered ‘unsure.’Significantly, none of the respondents answered ‘no,’ indicating a degree of interestin green building, despite the sensitivity to a ‘cost premium’ for green buildings.
Energy and Water Savings. Respondents were asked to indicate what more theythink can be done to improve the uptake and incorporation of energy/watersavings (or generating) features into the design of new buildings and theretrofitting of existing buildings. Responses were similar for new and retrofittedbuildings. Exhibit 16 shows that the industry considers that changes to the buildingcode, legislation, and increased financial incentives are required to improve theuptake of energy/water saving features, indicating that the industry is not likelyto implement energy/water saving measures voluntarily. Other suggestionsincluded increasing water charges.
Sustainability Agenda. When asked to give their opinion of how important thesustainability agenda is to the NZ commercial property sector, the majority ofrespondents think that the sustainability agenda is important. Over half (54%,n � 20) think that it is fairly important, 27% (n � 10) very important, and 16%(n � 6) indicated it was extremely important to the NZ commercial propertysector.
Industry Capability. Respondents were asked whether they consider that the NZproperty industry has the knowledge/skills, technology, and resources to drive thesustainability agenda. Exhibit 17 shows that over half of the respondents answered‘yes’ for each category, highlighting that they consider that the industry isgenerally well placed to advance green building in NZ.
Those respondents who answered ‘no’ to any category were asked to give a briefexplanation of what knowledge/skills, technology or resources are required. Someconstructive suggestions were received. The answers given are summarized asfollows:

T h e K e y D r i v e r s a n d B a r r i e r s � 7 1
J O S R E � V o l . 4 � N o . 1 – 2 0 1 2
Exhibi t 17 � Industry Capability
ResponseKnowledge% (n)
Technology% (n)
Resources% (n)
Yes 57% (21) 62% (23) 54% (20)
No 16% (6) 16% (6) 11% (4)
Unsure 27% (10) 22% (8) 35% (13)
� Knowledge/Skills: Need for simpler tools for rating of sustainability andinformation of the financial benefits and costs for achieving ESDproperties; lack of experience and knowledge of green buildingtechnologies and products; industry needs to consider more thanindividual buildings and look instead at systems: ecology and naturalsystems, urban design, integration of buildings and landscape.
� Technology/Resources: Lack of information on energy consumption ofdifferent classes and grades of property; need for a mandatory buildingenergy rating system to reward green buildings or at least those that areenergy efficient.
Changes and Improvements. The final general question asked respondents toidentify the changes and improvements that are required to increase green buildingdevelopment and investment in NZ’s commercial property sector. A range ofsuggestions were put forward by 32 respondents (57%). These suggestions havebeen categorized under four headings: central and local government policy, cost/benefit, education, and building rating systems.
� Central and Local Government Policy1. Mandatory disclosure of a buildings environmental performance.2. Regulation requiring sustainable features in buildings.3. Introduction of central and local government subsidies, including tax
breaks for certified buildings.� Cost/Benefit
1. More empirical evidence to demonstrate the benefits of green buildingto tenants and investors.
� Education1. Begin with education within schools and other learning institutions.2. More training and education of all involved in the sustainable
development and retrofitting of commercial property.� Rating Systems
1. Reduce the NZGBC cost of certifying a building by 50%.2. Introduce a compulsory rating system for energy and water use. The
planned introduction of NABERS will generate a new level of interest.

7 2 � B o n d a n d P e r r e t t
Exhibi t 18 � Property Categories: Planned Involvement in Green Building
11
9
4
3 3 4
2
01 1
0 00
10
20
30
40
50
60
70
80
%
Off
ice
Ret
ail
Indu
stri
al
Apa
rtm
ents
Inte
rior
s
Oth
er
New
Retrofitted
Future Participation in Green Building. Of the 22 respondents that have notbeen involved in green building, two-thirds (n � 14) indicated that they intend tobecome involved in the future; 79% of their involvement will be in officeproperties. This focus on offices is similar to that Exhibit 9. There is an increasein expectations for both new and retrofitted retail property even though theNZGBC has yet to release a set of Green Star tools for retail property. While theretrofitting of industrial property is seen as important for those with an intentionto get involved in green building, there is less focus on interiors, compared tothose already involved in green building (Exhibit 18).
When asked to indicate their reasons for planning to become involved in greenbuilding, over nearly two-thirds (64%, n � 9) of the 14 respondents that answeredthis question advised that benefit to the environment and corporate socialresponsibility are the primary drivers. For this group, tenant demand was far lessa factor (36%) than for those who have already had involvement in green building(75%, see Exhibit 10). These results are shown in Exhibit 19.
The respondents who indicated no intention to become involved in green buildinggave a number of explanations for this. In their view, green building was just afad, and although nice to have they did not see it as essential. Others indicatedthat it was for economic reasons or that their clients are not interested in greenbuilding options and are solely focused on immediate financial returns.
Statistical Analysis
A number of tests were run to determine if there were significant differences inresponses between the varying professional groups. Cross tabulations and chi-

T h e K e y D r i v e r s a n d B a r r i e r s � 7 3
J O S R E � V o l . 4 � N o . 1 – 2 0 1 2
Exhibi t 19 � Reasons for Plans to Become Involved in Green Buildings
3
6
5
1
7
6
2
9 9
0
10
20
30
40
50
60
70
%
Fina
ncia
l inc
entiv
esFi
nanc
ial b
enef
itsTe
nant
Dem
and
Fina
ncie
r req
uire
men
tC
ompa
nyIm
age
Pers
onal
bene
fits
Reg
ulat
ions
CS
RB
enef
itto
envi
ronm
ent
square tests were performed, and Cramer’s V and Phi obtained. However, therewere no significant differences in responses between the varying professionalgroups for any of the questions. A limitation of the study was the small samplesize. However, as more buildings become rated Green Star and with growingtenant and investor demand for green rated space and buildings, we expect anincrease in involvement from many of the professional groups, particularly withthe introduction of the NABERS NZ rating tool and if this were to be mademandatory, as it has been in Australia.
� C o n c l u s i o n s a n d R e c o m m e n d a t i o n s
Green building is relatively new to the NZ commercial property sector, yet thereare indications that as economic conditions improve, green building activity ispoised to grow. In particular, the rebuild of the Christchurch CBD will provide asignificant opportunity for the promotion and advancement of green building inNZ. The NZGBC expects to play a key role in the promotion of green buildingin the rebuild of Christchurch in terms of the training of professionals andfacilitating property industry and community discussion around sustainability ofthe built environment.
It is anticipated that the NZGBC’s review and expected reduction in charges forGreen Star will encourage a greater number of property developers and investors

7 4 � B o n d a n d P e r r e t t
to seek a Green Star rating for their buildings. The timing for completion of thisreview will be particularly relevant to the Christchurch rebuild. The introductionof BASE as an introductory level green building assessment specifically for theChristchurch rebuild should encourage developers and investors to incorporatesustainable features in their commercial properties and is a positive step forChristchurch. The NZGBC should also look at developing rating tools specificallyfor smaller projects that can be applied universally across NZ’s commercialproperty sector. This will encourage developers and owners of smaller commercialproperties to participate in sustainable development.
As the property sectors key promoter of green building, the NZGBC needs tobetter educate the public and users around the benefits of green building. One ofthe significant barriers to the uptake of green building is the markets view of thecost premium for green building versus conventional building. There appears tobe a difference of opinion between the NZGBC and that of industry on this issue.Given that cost premium was a common barrier to green building identified fromthe literature review, it would tend to support the findings from the industry survey.The solution to overcome this barrier appears to lie with the NZGBC and itstraining function. The NZGBC needs to clearly demonstrate to the commercialproperty sector the business case for green building. Otherwise, in the absence ofgovernment intervention, the growth of this sector will be very much determinedby growth in tenant or end-user demand, which was identified by both the NZGBCand industry survey as a key factor in the uptake of green building at present.
It is also evident that the NZGBC needs to resolve its funding issues in order thatstaffing levels can be increased sufficiently to develop a full suite of Green Starrating tools, which will in turn provide a comprehensive green building ‘design’and ‘built’ certification system to the NZ commercial property sector. There isalso an opportunity for educational providers and professional bodies toincorporate green building education within their established qualifications forthe medium to longer term supply of qualified professionals to the propertysector.
Clearly, in achieving a green building solution there are design features andmaterials that are preferred by the industry. However, the actual use andmanagement of green buildings needs attention, as the results from the surveyindicate. This is also a matter that can be addressed by the universities andprofessional bodies in the training of asset, facilities, and property managers.
While central government could play a more direct role in encouraging thecommercial property sector towards green building, by reinstating the greenleasing policy and through regulation, tax breaks, and other incentives, the presentgovernment is more inclined to allow market forces to determine the level of greenbuilding that occurs. However, the government is somewhat supportive ofsustainable development, as evidenced by the funding available through EECA,MAF, and the Electricity Commission. In particular, it is the EECA that is a keysponsor for the introduction of NABERS to the NZ property sector.

T h e K e y D r i v e r s a n d B a r r i e r s � 7 5
J O S R E � V o l . 4 � N o . 1 – 2 0 1 2
The introduction of NABERS NZ was identified by both the NZGBC and industryas providing a significant opportunity to promote and grow the level of marketparticipation in green building in NZ. This is particularly relevant for the existingcommercial building stock. Although the NZGBC would like to provide acomprehensive design, built, and performance-based assessment system, GreenStar does not assess the ongoing environmental performance of greenbuildings.
The key industry drivers for being involved in green building are a balancebetween environmental/social conscience and the commercial/financialimperatives of commercial property investment and development including theopportunity to secure good quality tenants. As noted above, this industryenthusiasm for green building is somewhat tempered by the perception that greenbuildings are significantly more expensive to develop than conventional buildings.Looking forward, this is a matter that needs to be resolved within the propertyindustry for green building to become the benchmark for the design anddevelopment of buildings within NZ’s commercial property sector.
� E n d n o t e s1 Arnel (2010), Tackling Global Climate Change: Meeting Local Priorities, A World Green
Building Council Special Report, September, p. 1.2 The report Our Common Future (1987), put forward by the World Commission on
Environment and Development (subsequently renamed the Brundtland Commission),popularized the notion of ‘‘sustainable development’’ and is defined in the report as‘‘development that meets the needs of the present without compromising the ability offuture generations to meet their own needs.’’
3 BRE Environmental Assessment Method (BREEAM) was one of the earliest rating toolsto measure the sustainability of new non-domestic buildings, developed in the U.K. in1990.
� R e f e r e n c e s
Ang, S.L. and S.J. Wilkinson. Is the Social Agenda Driving Sustainable PropertyDevelopment in Melbourne, Australia? Property Management, 2008, 26:5, 331–43.Arnel, T. Tackling Global Climate Change: Meeting Local Priorities. A World GreenBuilding Council Special Report, September 2010. http: / /www.worldgbc.org/site2/resources/case-studies/gbc-reports / [accessed October 15, 2011].Bond, S. Best of the Best in Green Design: Drivers and Barriers to SustainableDevelopment in Australia. PRRES Conference, Sydney, 2010.Choi, C. Removing Market Barriers to Green Development: Principles and Action Projectsto Promote Widespread Adoption of Green Development Practices. Journal of SustainableReal Estate, 2009, 1, 107–38.Davis, Langdon. Cost of Green Revisited: Examining the Feasibility and Cost Impact ofSustainable Design in the Light of Increased Market Adoption. 2007. http: / /www.davislangdon.com/upload/ images/publications/USA/The%20Cost%20of%20Green%20Revisited.pdf [accessed January 26, 2012].

7 6 � B o n d a n d P e r r e t t
Energy Efficiency and Conservation Authority (EECA). New Zealand Energy Efficiencyand Conservation Strategy 2011–2016 and New Zealand Energy Efficiency andConservation Strategy 2011–2016. 2011. http: / /www.eeca.govt.nz/sites/all /files/nz-energy-strategy-2011.pdf [accessed February 22, 2012].
Fuerst, F. and P. McAllister. An Investigation of the Effects of Eco-labeling on OfficeOccupancy Rates. Journal of Sustainable Real Estate, 2009, 1, 49–64.
Green Building Council of Australia. The Dollars and Sense of Green Buildings 2008.2008. http: / /www.gbca.org.au/docs/dollars-sense08 [accessed May 23, 2010].
Gunawansa, A.G. and H.W. Kua. A Comparison of Climate Change Mitigation andAdaptation Strategies for the Construction Industries of Three Coastal Territories.Sustainable Development, 2011, DOI: 10.1002/sd.527.
Klein, J., A. Drucker, and K. Vizzier. A Practical Guide to Green Real Estate Management.Chicago: Institute of Real Estate Management of the National Association of Realtors,2009.
Miller, N., J. Spivey, and A. Florance. Does Green Pay Off. Journal of Real Estate PortfolioManagement, 2008, 14:4, 385–401.
Ministry for the Environment. Publications: Ministry for the Environment. 2011. http: / /www.mfe.govt.nz/publications/climate /nz-fifth-national-communication/nz-fifth-national-communication.pdf, [accessed February 19, 2011].
Myers, G., R. Reed, and J. Robinson. Sustainable Property—The Future of the NewZealand Market. Pacific Rim Property Research Journal, 2008, 14:3, 298–321.
NABERS. About NABERS. 2010. http: / /www.nabers.com.au/page.aspx?cid�506[accessed August 20, 2011].
Newell, G., J. MacFarlane, and N. Kok. Building Better Returns. 2011. http: / /www.lowcarbonaustralia.com.au/sites/default /files/upload/Building%20Better%20Returns%20from%20Australian%20Property%20Institute.pdf[accessed October 24, 2011].
NZGBC. Who We Are. 2011a. http: / /www.nzgbc.org.nz/ index.php?option�comcontent&view�article&id�62&Itemid�32 [accessed March 6. 2012].
——. Base Rating Tool. 2011b. http: / /www.nzgbc.org.nz/ index.php?option�comcontent&view�article&id�219&Itemid�319 [accessed March 6, 2012].
Smith, J. and G. Baird. Implementation of a Building Sustainability Rating Tool: A Surveyof the New Zealand Building Industry. Proceedings of the SB07 New Zealand Conference,Auckland, November 14–16, 2007. Auckland, New Zealand: New Zealand SustainableBuilding Conference.
Ministry for the Environment. The Kyoto Protocol. April 15, 2010. http: / /www.mfe.govt.nz[accessed February 10, 2011].
Urban Land Institute. Retrofitting Office Buildings to be Green and Energy-Efficient:Optimizing Building Performance, Tenant Satisfaction, and Financial Return. Washington,D.C., 2009.
USGBC. About USGBC. 2011. http: / /www.usgbc.org/DisplayPage.aspx?CMSPageID�124 [Retrieved January 21, 2011]
World Green Building Council. Who We Are. 2010. http: / /www.worldgbc.org/site2/index.php?cID�83# [accessed January 21, 2011].
Yudelson, J. Greening Existing Buildings. McGraw Hill Companies Inc., 2010.

T h e K e y D r i v e r s a n d B a r r i e r s � 7 7
J O S R E � V o l . 4 � N o . 1 – 2 0 1 2
The participation of the NZGBC and its Director—Business Development andTechnical, Rohan Bush, in the structured interview is appreciated. The participationof the respondents to the industry survey is also greatly appreciated.
Sandy Bond, Lincoln University, Canterbury, New Zealand or dr [email protected].
Guy Perrett, Property Institute of New Zealand, Auckland 0630, New Zealandor [email protected].


![Awareness, Drivers, Actions, and Barriers of Sustainable … · 2017. 1. 23. · According to Kibert [23], for a building to be sustainable and green, it must have a robust design](https://static.fdocuments.us/doc/165x107/60e46c1516d55e51185359fe/awareness-drivers-actions-and-barriers-of-sustainable-2017-1-23-according.jpg)