The Kerala Panchayat Raj Act, 1994 - തദ്ദേശ...
46
Chapter 4 Environmental Baseline and Implications of Development Interventions at the Local Level 4.1. Introduction his chapter looks at the environmental baseline pertaining to the state of Kerala vis-à-vis aspects relevant to the proposed local government strengthening project. The physical and biological environment in the state has been discussed in addition to sectors such as agriculture, irrigation, fishery, industry, water& sanitation, pulic works, housing etc. To illustrate typical local environmental issues in context of specific Local Governments, a discussion on the State of the Environment (SoE) report 2005, of sample gram panchayaths and municipalities has been included. These reports delineate typical environmental issues, their implications and the LSG‟s / community‟s response at the local level. The Panchayati Raj Act of Kerala defines a host of mandatory functions, general functions and sectoral functions to be performed by three tier local self government institutional set-up. The long list of functions mentioned in the act, encompass a diverse spectrum of sectors and services. Consequently, the nature of environmental and social (E&S) implications resulting from the performance of these varied functions also spans an equally wide range. While the E&S impacts in respect of certain functions could be of substantially adverse nature, impacts in respect of certain other functions could be, on the other hand, outright beneficial, which is exactly opposite of the former. Further, certain other act functions may be completely neutral in terms of E&S impacts. In addition to the above, an attempt has been made to develop an in-depth understanding of adverse E&S impacts that can be caused by sectoral programmes and interventions by development departments under state and central schemes by including them as well in the environmental and socal analysis carried out as above, using the same activity-impact matrix method. Subsequently, to get a first hand feel of the development paradigm and environmental concerns of local bodies, structured focus groups discussions were organized in selected three tier Panchayats and Urban Local Bodies. This Chapter summarises the environmental baseline, findings of the the activity-impact matrix analyisis and the highlights of the Focus Group Discussions conducted in selected local bodies. 4.2 Environmental Baseline The state of Kerala is situated at the western edge of the tip of the Indian peninsula. The topography in this region is unique in the sense that the land mass rises from 5m below sea level in the west to the towering heights of 2695 m above mean sea level in the east within a relatively short span of 120 km. The state has a geographical area of 38863 sq. km with a base length of 560 km along the coast and width ranging from 11km to 124 km. Physiographically, there are three natural regions namely, lowlands, midlands and the highlands which have very different climates and ecology. The three regions are shown in the map given in Fig 4.1. T T
Transcript of The Kerala Panchayat Raj Act, 1994 - തദ്ദേശ...

Chapter 4
Environmental Baseline and Implications of Development Interventions at the Local Level
4.1. Introduction
his chapter looks at the environmental baseline pertaining to the state of Kerala vis-à-vis
aspects relevant to the proposed local government strengthening project. The physical and
biological environment in the state has been discussed in addition to sectors such as
agriculture, irrigation, fishery, industry, water& sanitation, pulic works, housing etc. To
illustrate typical local environmental issues in context of specific Local Governments, a
discussion on the State of the Environment (SoE) report 2005, of sample gram panchayaths and
municipalities has been included. These reports delineate typical environmental issues, their
implications and the LSG‟s / community‟s response at the local level.
The Panchayati Raj Act of Kerala defines a host of mandatory functions, general functions and
sectoral functions to be performed by three tier local self government institutional set-up. The
long list of functions mentioned in the act, encompass a diverse spectrum of sectors and
services. Consequently, the nature of environmental and social (E&S) implications resulting
from the performance of these varied functions also spans an equally wide range. While the
E&S impacts in respect of certain functions could be of substantially adverse nature, impacts
in respect of certain other functions could be, on the other hand, outright beneficial, which is
exactly opposite of the former. Further, certain other act functions may be completely neutral
in terms of E&S impacts.
In addition to the above, an attempt has been made to develop an in-depth understanding of
adverse E&S impacts that can be caused by sectoral programmes and interventions by
development departments under state and central schemes by including them as well in the
environmental and socal analysis carried out as above, using the same activity-impact matrix
method.
Subsequently, to get a first hand feel of the development paradigm and environmental
concerns of local bodies, structured focus groups discussions were organized in selected three
tier Panchayats and Urban Local Bodies. This Chapter summarises the environmental baseline,
findings of the the activity-impact matrix analyisis and the highlights of the Focus Group
Discussions conducted in selected local bodies.
4.2 Environmental Baseline
The state of Kerala is situated at the western edge of the tip of the Indian peninsula. The
topography in this region is unique in the sense that the land mass rises from 5m below sea
level in the west to the towering heights of 2695 m above mean sea level in the east within a
relatively short span of 120 km. The state has a geographical area of 38863 sq. km with a base
length of 560 km along the coast and width ranging from 11km to 124 km. Physiographically,
there are three natural regions namely, lowlands, midlands and the highlands which have very
different climates and ecology. The three regions are shown in the map given in Fig 4.1.
TT

130
Environmental Assessment Report
Kerala Local Government Strengthening Project
Suchitwa Mission, Thiruvananthapuram
Figure 4. 1: Topograpical regions in Kerala (source www.prokerla.com)
Geologically, there are four major rock formations namely, crystallines, sedimentaries,
laterites and recent and sub recent sediments. Though Kerala has a variety of mineral
deposits, they are not plenteous. The sandy beaches of Kerala contain ilmenite, the main ore
of titanium, and rutile (titanium oxide).
There are extensive deposits1 of white clay and commercially valuable deposits of graphite,
lignite (brown coal), limestone, and mica in Kerala. Iron ore has been found at Calicut. Kerala's
monazite, magnetite, sillimanite, and zircon deposits are largely undeveloped. Apart from this
the beach sand of Kerala is rich in radioactive elements. Although it has been proved that
there are deposits of gold at some places of Wayanad, Kozhikode and Malappuram districts,
mining is yet to start. Neendakara, Chavara and Kayamkulam regions have ample deposits of
illuminate, magnetite, zircon etc. Following are some other mineral deposits found in Kerala:
White Clay: Various places of Thiruvananthapuram district have rich deposits of white
clay. Apart from this Kundara and Chattannur of Kollam district are famous for their
plenteous deposits of China clay. This china clay is extensively used for the production
of ceramic wares and materials such as electric fuses.
1 www.prokerala.com

131
Chapter 4
Environmental Analysis of Developmental Interventions at Local Level
Suchitwa Mission, Thiruvananthapuram
Graphite: Thiruvananthapuram and Kollam districts of the state have abundant deposits
of graphite. Being a multipurpose mineral, graphite is used in making a variety of
products.
Silica sand: This is the main constituent of glass and therefore the major raw material
of glass industry. Silica is found in various part of Alappuzha district like Cherthalai,
Panavalli, Pallippuram etc.
Iron ore: Deposits of Iron ore has been found at various places surrounding Kozhikode.
Bauxite: Fairly large deposits of bauxite have been found at various places of the
Kollam district like Shooranadu, Adichanelloore etc.
4.2.1 Demography
Kerala's population as per Census 2001 was 318.41 lakh, 3.1% of that of the country. Among the
districts in Kerala, Malappuram has the highest population of 36.3 lakh while Wayanad has the
lowest at 7.87 lakh. The population density of the state is about 819 people per square
kilometres, three times the national average. Kerala is one of the densest States in the
country. The district wise population figures for the state are given in Table 4.1.
Among the districts of Kerala,
Alappuzha has the highest density
of population with 1489/Km2 and
Idukki has the lowest with 252/Km2.
The decadal growth rate had been
at higher rate from 1941 to 1971
and since then the growth rate has
been declining. The state recorded
a decadal population growth of +
9.42% (1991-2001). Among the
districts, Pathanamthitta had the
lowest decadal growth rate of
population of 3.72% and
Malappuram, the highest growth
rate of 17.22%. Kerala, with a sex-
ratio (females per 1000 males) of
1058, is the only state in India with
a positive figure. This indicates very
high potential for economic growth.
The proportion of people in the
working age group is 63.4% in Kerala
as against 55.6% in India. As per 2001 Census, the total number of old age persons was 33.36
lakh, with highest percentage of old age population in Alappuzha district. 74% of the
Table 4.1: Kerala Districtwise Population
District Population Males Females
Thiruvananthapuram 32,34,356 15,69,917 16,64,439
Kollam 25,85,208 12,49,621 13,35,587
Alappuzha 21,09,160 10,14,529 10,94,631
Pathanamthitta 12,34,016 5,89,398 6,44,618
Kottayam 19,53,646 9,64,926 9,88,720
Idukki 11,29,221 5,66,682 5,62,539
Ernakulam 31,05,798 15,38,397 15,67,401
Thrissur 29,74,232 14,22,052 15,52,180
Palakkad 26,17,482 12,66,985 13,50,497
Kozhikode 28,79,131 13,99,358 14,79,773
Wayanad 7,80,619 3,91,273 3,89,346
Malappuram 36,25,471 17,54,576 18,70,895
Kannur 24,08,956 11,52,817 12,56,139
Kasargod 12,04,078 5,88,083 6,15,995
Total 3,18,41,374 1,54,68,614 1,63,72,760
Source : Census India 2001

132
Environmental Assessment Report
Kerala Local Government Strengthening Project
Suchitwa Mission, Thiruvananthapuram
population lives in rural areas. The population growth and decadal growth rate of Kerala are
depicted in Figure 4.2. In the human development and related indices Kerala occupies prime
position among the Indian States.
Figure 4.2: Trends in population growth in Kerala
4.2.1 Land use
The landscape of Kerala is a result of marine, fluvio-marine/estuarine, fluvial, denudational
cum depositional and denudational processes. As a result, the low land is characterized by
beaches, coastal plains, river terraces, marshes and lagoons. The midland consists of dissected
peneplains with numerous flood plains, terraces, valley fills and colluviums. The high ranges
run parallel to the coast from south to north with a break at the Palghat gap region. The
denudation process with ever active tectonics resulted in 44 river basins, 1750 sub basins and
4452 mini watersheds. The increased pressure on land for more resources and accelerated
human interventions in the form of mining, quarrying, filling of low lands along with all the
ingredients like high rainfall, undulating topography etc has led to significant land
modifications influencing the biophysical system and adversely affecting the ecological
security and environmental
stability. The major
environmental issues
confronting land
environment are land use
change, mining, soil erosion
and soil quality
deterioration. There are
various initiatives to
mitigate/manage these
issues, in order to upgrade
the overall environmental
systems.
Figure 4.3 shows the land
use pattern in Kerala. It can be seen from the figure that about 55% of the land is under
cultivation. 28% of the state is covered by forests. The amount of land under non-agricultural
uses is about 11%. These are the main three categories accounting for more than three-fourths
POPULATION GROWTH- KERALA
0
50
100
150
200
250
300
350
1901
1911
1921
1931
1941
1951
1961
1971
1981
1991
2001
Po
pu
lati
on
in
lakh
s
Rural
Urban
Total
POPULATION- DECADAL GROWTH RATE
0
5
10
15
20
25
30
1901 1911 1921 1931 1941 1951 1961 1971 1981 1991 2001G
row
th r
ate
(%
)
Area under
cultivation
Figure 4. 3: Land use distribution in Kerala Source: http://www.kerenvis.nic.in/pdftables/land1.pdf

133
Chapter 4
Environmental Analysis of Developmental Interventions at Local Level
Suchitwa Mission, Thiruvananthapuram
if the total area of the state. The rest of the land uses such as barren / uncultivated land, land
under miscellaneous tree crops, permanent pastures and grazing land and cultivable waste
land account for very small portions of the overall land share.
Table 4.2: District wise Land Use for Kerala for the year ending 2007- 08 (in Hectares)
District
Area
For
Land
Utilisation
Statistics
Not Available For Cutivation Other Uncultivated Land Excluding Fallow Land Fallow Land
Net
Area Sown
Total
Cropped
Area Forests
Area
Under
Non Agricultural
Uses
Barren
and
Un Culturable
Land
Total
Permane
nt
Pastures
and
Other
Grazing
Lands
Misc Tree
Crops and
Groves not
Included in
Net Area
Culturable
Waste
Land
Total
Fallow
Lands
Other
than
Current
Fallows
Current
Fallow
Total
ALAPPUZHA 141011 0 33178 149 33327 0 153 13956 14109 4462 4634 9096 84479 109455
ERNAKULAM 305826 70617 51734 405 52139 1 131 8182 8314 5308 9749 15057 159699 184773
IDUKKI 436328 198413 23077 2615 25692 171 248 1517 1936 892 1032 1924 208363 295783
KANNUR 297112 48734 32940 3513 36453 0 185 6008 6193 1993 4946 6939 198793 218606
KASARGOD 199166 5625 28630 8842 37472 15 2260 12415 14690 2590 2470 5060 136319 145083
KOLLAM (QUILON) 248788 81438 31345 228 31573 0 115 958 1073 1716 4646 6362 128342 170901
KOTTAYAM 220442 8141 29636 1805 31441 0 160 6577 6737 3372 3885 7257 166866 215902
KOZHIKODE 234641 41386 31017 1084 32101 0 188 1364 1552 714 2522 3236 156366 211576
MALAPPURAM 355446 103417 43212 2614 45826 8 427 5221 5656 4637 10749 15386 185161 247031
PALAKKAD 447584 136257 57506 2902 60408 0 1822 26037 27859 9131 17142 26273 196787 322171
PATHANAMTHITT 265277 155214 17863 381 18244 0 118 2911 3029 3571 3050 6621 82169 106706
THIRUVANTRUM 218781 49861 24393 318 24711 8 60 474 542 329 2457 2786 140881 158827
TRISSUR 302919 103619 42380 424 42804 7 382 6090 6479 6050 14617 20667 129350 174221
WYNAD 212966 78787 15767 247 16014 6 148 1054 1208 449 1054 1503 115454 200059
State Total 3886287 1081509 462678 25527 488205 216 6397 92764 99377 45214 82953 128167 2089029 2761094
Source: www.dacnet.com
Table 4.2 (above) gives the district wise land use figures for the entire state. It can be seen
that the land under non-agricultural uses is quite significant.
4.2.1.2 E&S Impacts of Land-use
Land use changes are manifested, generally, as change in cropping pattern, quarrying, slope
modification, soil excavation, conversion of paddy lands and swampy areas and filling of
wetlands etc. Such changes affect the environment adversely by way of intense soil erosion,
water logging, water scarcity, mono cropping and loss of biodiversity. Terrain modifications,
generally effected as a prelude to land use changes, at times, lead to catastrophic incidences
such as landslides, increased recurrence of earth tremors and land subsidence. Population
growth, migration, urbanization, industrialization and globalization are the major factors that
led to significant land use change in the State. The land use changes over the years were
instrumental in changing the landscape ecology, which had far-reaching environmental
consequences. The conservation, development and management of land resources based on
agro-ecological and social parameters are vital and it requires resource based land use
planning for agricultural and non-agricultural uses with special consideration for fragile
ecosystems such as paddy fields, high lands etc.
Mining of natural resources involves extreme disturbance to biological life systems, in general,
and violation of the rights of local communities in particular. The major mining activity in the
State is confined to the bleaching clay and china clay deposits. There are also unorganized
mining activities, especially with respect to tile and brick clay, alluvial sands, crystalline
rocks, soils etc. Many of the mineral occurrences are in very fragile physical, biological and
social environments and therefore, the pressure exerted and the impacts are high in terms of
magnitude and intensity and mostly permanent in nature. Though the Central and State

134
Environmental Assessment Report
Kerala Local Government Strengthening Project
Suchitwa Mission, Thiruvananthapuram
Governments have introduced various regulations to minimize the environmental repercussions
due to mining activity, there are serious shortcomings in its implementation.
Soil erosion results not only in the loss of soil materials, but also in the loss of soil nutrients,
and soil bio-resources. Loss of soil causes decrease of soil volume over the bedrock that is
available for storage of water and hence will reduce effective water availability for growth of
plants as well as recharge of ground water. Soil flora and fauna that is abundant in the surface
soil and responsible for the fertility and productivity of soil, also get washed off along with top
soil. In Kerala, the soil erosion is mainly due to flowing water and is catalyzed by peculiar land
form, soil types, climate and landuse. The quantum of eroded soil or debris gets transported
over land or deposited in ponds, rivers, reservoirs and lakes or washed down to the sea. There
is continued effort on effective implementation of watershed based development programmes
with thrust on agronomic measures.
Intensive cultivation, often with incorrect crop and soil management practices, give rise to
heavy loss in soil quality. The neglect of organic or green manure application, excessive or
imbalanced application of chemical fertilizers, indiscriminate use of insecticides, fungicides,
herbicides etc gave rise to alterations in soil structure, which in turn led to changes in all
other soil quality attributes. The poor performance in industrial and municipal waste
management further aggravated the scenario. The enhanced land and water pollution has its
manifestations not only in agricultural productivity but also in increasing disease burden. The
drive for organic cultivation and effective pollution control is yet to catch up with the
necessity.
The land is mostly subjected to undesirable practices and hence subjected to serious
degradation in Kerala. In order to overcome this and to have a comprehensive action plan for
conservation and management of limited land that the State has, it is appropriate to evolve a
detailed Land Use Policy, integrated action plans and statutory regulations and appropriate
institutional mechanisms for their effective implementation. Preventive and curative measures
against pollution and contamination of soil and land may receive high priority for years to
come, and technological measures to prevent the ill effects on human health will get priority
in short term.
4.2.2 Water resources
The normal rainfall of the State is estimated to be 2903 mm, however, the spatial and
temporal distribution pattern is mainly responsible for the frequent floods and droughts in
Kerala. The average annual rainfall in the lowland of Kerala ranges from 900 mm in the south
to 3500 mm in the north. In the midland, annual rainfall ranges from 1400 mm in the south to
4000 mm in the north. In the highlands, annual rainfall varies from 2500 mm in the south to
about 6000 mm in the north. About 60 % of this rainfall is received during Southwest monsoon
period (June- August), 30 % during North- East monsoon and the remaining 10 % during the rest
of the year. There are certain pockets such as Attappady in Palakkad district where the
average annual rainfall is only 600 mm.

135
Chapter 4
Environmental Analysis of Developmental Interventions at Local Level
Suchitwa Mission, Thiruvananthapuram
The seasonality in precipitation and inflow leads to considerable variation in water availability
and demand in Kerala. It is estimated that only about 15% of the surface flow is available for
six months from December to May. But the requirement of fresh water during this period is
almost about 70-75% of the annual requirement. The supply and demand situation of fresh
water from various sources annually and during summer season is given in Table 4.1 and Table
4.2.
Table 4.1. Annual and summer season water availability
No Item
Water resource potential (Mm3)
Total Utilisable annually Utilisable during
summer
1
2
3
Surface water
Groundwater
Surface storage in
reservoirs
77,900
7,900
5,500
42,700
5,135
5,500
6,405
5,135
5,500
Total 91,300 53,335 17,040
Table 4.2. Annual and summer water demand for the year 2001
No Item Water demand (Mm3)
Annual requirement Summer requirement
1
2
3
4
5
Domestic use
Birds and animals
Industry
Soil toxicity removal
Irrigation
1,226
438
6,400
5,000
13,665
809
203
3,200
3,500
13,665
Total 26,729 21,377
(Source )
The State has 44 rivers, but as per the national norms, not even a single one is major. Except
the four medium rivers, the remaining 40 rivers are minor ones and the combined discharge of
them is only about onethird of that of Godavari. Monsoon flows contribute to almost 90% of the
annual yield, leaving only about 10% during the lean flow period. The fresh water structures of
the state also include 995 tanks and ponds having more than 15000 Mm3 summer storage and
numerous perennial springs. Dug wells are the major extraction structures for the groundwater
resources with a density of over 200 wells per square km. The extraction of groundwater using
borewells in the hard rock terrain and filter-point wells and tube wells in the soft rock terrains
are also the increase.
The overall supply-demand situation indicates a deficit of about 4000 Mm3 of fresh water. The
major interventions in water resources sector, such as damming the rivers, industrial intake
and outflow, construction of deep canals, irrigation, sinking of wells and pumping, river sand
mining etc. have caused serious environmental impacts. The drought and flood situation in

136
Environmental Assessment Report
Kerala Local Government Strengthening Project
Suchitwa Mission, Thiruvananthapuram
Kerala is often severe. The drought in Kerala is reflected as water scarcity in summer, when
the rivers dry up and groundwater table lowers. Examination of the summer monsoon rainfall
series of Kerala for the period 1871 – 1990 indicated 20 deficient rainfall years, but the
severity of drought was reflected only since 1983. During recent drought years in Kerala, more
than 25% of the homestead open wells in the midland and highland dried up, yield of surface
water sources diminished with upstream portions of rivers dried out, rice crop, plantation and
spice crops perished and hydroelectric power production reduced, affecting more than 3
million people. Two of the major reasons for the drought are the loss of water retention
provinces such as forest regions and erosion of porous soil horizons. The flood in Kerala is
attributed to increased magnitude or intensity of rainfall and the indiscriminate reclamation of
wet lands and paddy fields. About 40% of the total area of wetlands and paddy fields in the
State (5700 km2) has already been reclaimed according to 1999 data and this turn adversely
affected the drainage courses and flood cushion, worsening the flood situation. The loss of
forest has also contributed significantly to both flood and drought alike. In the beginning of the
20th century, the state had 43% of its land area covered by thick forest which declined to about
10% badly affecting the retention and gradual release of rain water.
Irrigation
From Table 4.2, it can be seen that almost two thirds of the total water demand in the state is
for irrigation. Table 4.3 (below) gives the trends in source wise irrigated area over the years.
It can be seen from the above table that wells and other sources have a significant share in the
irrigation of the state. Also, it seems over the past few years, the irrigation scenario has
mostly remained static. A look at the crop wise irrigated area in table 4.4 (below) also
reinforces the same observation. Even in this case, except for a few crops, the irrigated area
Table 4.3
Economic Review 2008

137
Chapter 4
Environmental Analysis of Developmental Interventions at Local Level
Suchitwa Mission, Thiruvananthapuram
under most other crops has mostly remained at the same level.
Groundwater
In Kerala, groundwater occurs under phreatic, semi-confined and confined conditions. The
groundwater resources are largely concentrated in the sedimentary aquifers of the coastal
regions. The groundwater resources are tapped mainly for drinking and irrigation purposes.
The ground water potential of Kerala is very low as compared to that of many other States in
the country. The state has a replenishable groundwater resource of 6841 million cubic meters.
The net groundwater availability is 6229 million cubic meters. The gross groundwater draft is
2920 million cubic meters and the net groundwater available for future use is 3221 million
cubic meters.
A district-wise analysis of ground water resources of Kerala shows that Palakkad has the higher
potential for ground water recharge (12%) followed by Thrissur (11%), Ernakulam (9%), Kannur
(8%), Kottayam (7%) and Alleppey (6.8%). Thiruvananthapuram has the lowest (4%) potential
for ground water recharge. The stage of development of groundwater is the highest in
Kasargod district (79%) and the lowest is in Wayanad (25%). The overall stage of development
in the State is 47% which is greater than the national level.
The district wise ground water balance sheet for Kerala as on 31.3.2004 is given in Table 4.5.
It shows that at a macro level, Kerala has abundant groundwater resources and adequate
potential to take care of any further development in the forthcoming decades. However, at
the micro level, there are instances where overexploitation of ground water has been noticed
and documented. This is discussed in the following paragraphs.
Table 4.4
Economic Review 2008

138
Environmental Assessment Report
Kerala Local Government Strengthening Project
Suchitwa Mission, Thiruvananthapuram
Ground water development is calculated in percentages and blocks are categorized into four
categories. The new nomenclature for the categorization of blocks is as follows:
a) Safe (White) : The Stage of ground water development less than 70%.
b) Semi-critical (Grey):The Stage of ground water development between 70 and 90%.
c) Critical(Dark) : The stage of ground water development between 90 and 100% and
ground water levels show long term declining trends.
d) Over exploited: The stage of ground water development more than 100% and ground
water levels show declining trends during pre and post monsoon periods.
Out of 151 blocks, 5 blocks are categorized as over-exploited, 15 as critical, 30 as semi critical
and 101 as safe. The over exploited blocks, have been notified by the State Ground Water
Authority vide its Extra Ordinary Gazette Notification as „Notified Areas‟ and they are listed
below:
Name of the Block Name of the District
Athiyannur Thiruvananthapuram
Kodungallur Thrissur
Chittoor Palakkad
Kozhikode Kozhikode
Kasaragod Kasaragod
In the Notified areas, no individual and/or agency, is expected to undertake any ground water
based activity, which will entail additional ground water draft. Institutional Credit for
financing of Drip and sprinkler sets, underground pipelines and replacement of pump sets
(without increasing the H.P) only are allowed. Any fresh ground water structures such as open
well, filter point, bore well, tube well, etc, cannot be financed. Increase in HP of the
pumpsets or the change in type of Pumpsets under the programme of replacement, deepening
Table 4.5
, Economic Review 2008

139
Chapter 4
Environmental Analysis of Developmental Interventions at Local Level
Suchitwa Mission, Thiruvananthapuram
of existing wells or replacement of defunct wells cannot be allowed. In case, any such activity
is proposed, the necessary written permission from the State Ground water Authority is
required.
Groundwater Quality
Groundwater quality is also a very important parameter from the environmental and health
points of view. The state of Kerala has some patches wherein quality of groundwater is of
concern. These are compiled in Table 4.6 below:
Table 4.6: Blocks in Kerala having groundwater quality issues
Parameter Blocks
Salinity: EC>3000
S/cm
Palakkad
Floride>1.5
mg/litre
Palakkad
Iron> 1 mg/litre Alappuzha, Ernakulam, Idukki, Kannur, Kasaragod, Kollam,
Kottayam, Kozhikode, Malappuram, Palakkad, Pathanamthitta,
Thiruvananthapuram, Thrissur, Wayanad
Nitrate>45
mg/litre
Alappuzha, Idukki, Kollam, Kottayam, Kozhikode, Malappuram,
Palakkad, Pathanamthitta, Thiruvananthapuram, Thrissur,
Wayanad
Source: CGWB 2010
Drinking water
Drinking water systems in Kerala can be broadly classified into two categories:
a) Schemes owned and operated by the state government through the Kerala Water
Authority and local governments and
b) Family managed drinking water supply wherein individual families create their own
drinking water sources by constructing wells on their own premises and managing the
water supply by themselves. Family managed drinking water supply systems in Kerala
play a substantial role in the water supply scenario especially in rural areas.
The provision of piped water supply in rural areas is the responsibility of the State Government
and funds have been provided in the state budgets right from the commencement of first Five
Year Plan. The National Water Supply and Sanitation programme was introduced in the social
welfare sector in 1954. The states gradually built up the Public Health Engineering
Departments to address the problems of water Supply and sanitation. In 1972 - 73, the
Government of India introduced Accelerated Rural Water Supply Programme to assist the
states and Union Territories with 100 percent grants in aid to implement schemes in problem
villages. Under this programme more than 450-piped rural systems were launched in Kerala.
During 1980s, as part of the National Drinking Water supply and Sanitation Decade Programme,
several projects were implemented with financial support of bilateral and multilateral
, Economic Review 2008

140
Environmental Assessment Report
Kerala Local Government Strengthening Project
Suchitwa Mission, Thiruvananthapuram
agencies.
Over the years, the organizational set up for the implementation and management of water
supply schemes had undergone several changes. The Kerala Water Authority (KWA) came into
existence on 1st April 1984 in the place of the erstwhile Public Health Engineering Department
of the Government of Kerala. KWA is one of the main agencies responsible for the design,
construction, operation and maintenance of water supply and sewerage schemes in the whole
state. KWA has been implementing piped water supply schemes based on surface and
groundwater sources. It also executes multilateral and bilateral funded projects and
accelerated rural water supply schemes on behalf of the Government of India.
Presently, the major implementing agencies of drinking water supply schemes in the State are
Kerala Water Authority (KWA), Kerala Rural Water Supply and Sanitation Agency (KRWSA) and
Local Self Government Institutions (LSGIs). KRWSA and LSGIs are ensuring community
participation in the implementation of water supply schemes by sharing the financial costs and
taking responsibility for management, operation and maintenance to some extent.
In Kerala, 71.77 per cent of the total population has access to drinking water as at the end of
March 2009. 69.35 per cent of the total population covered is from rural areas. Total number
of rural people having access to drinking water is 158.47 lakh, which constitutes 67.77 per cent
of the total rural population.
The increase in the number of citizens covered by water supply schemes during 2008-09 is
226240. Of this increase, 215868 are in the rural area and 10372 are in the urban area. During
2008-09, Ernakulam District had the highest rural water supply coverage (97.83%) and
Kozhikkode District had the lowest coverage (38.69%). In the case of total population covered,
Ernakulam District had the highest coverage (96.19%) and Kozhikkode District had the lowest
coverage (52.75%) of water supply in Kerala during 2008-09. District wise details of various
schemes in the state Table 4.7.

141
Chapter 4
Environmental Analysis of Developmental Interventions at Local Level
Suchitwa Mission, Thiruvananthapuram
E&S impacts connected with water resources
The major environment problems associated with water resources are flood, drought, land
slides, salinity intrusion, water logging and pollution. The hydrologic modification of welands
and over exploitation of groundwater also pose challenges in many parts of the state. The
major water quality problem associated with rivers and open wells is bacteriological pollution.
The dumping of solid waste, bathing and discharge of effluents also create problems. Low pH,
high iron etc., are common in well waters in the laterite covered midland areas. High
concentrations of fluoride over the permissible levels have been reported from certain parts of
Palakkad and Alleppey districts.
When the fresh water flow reduces during the summer, the flushing of the river system
weakens and salinity propagates more into the river interiors. It causes severe problems to
irrigation, drinking, and industrial water supply. It has been reported that saline water
intrusion in River Chaliyar during summer extends up to 24 km from the river mouth during
summer. More number of rivers is now subjected to saline intrusion during summer months.
Table 4.7
(Economic Review 2008)

142
Environmental Assessment Report
Kerala Local Government Strengthening Project
Suchitwa Mission, Thiruvananthapuram
The saline water intrusion into coastal groundwater aquifers is also a major problem, as about
70% of the population there depends on well water. The localised saline water intrusion also
occurs as a result of excessive pumping from wells.
A number of industries situated on the banks of rivers and backwaters empty their effluents
into the water bodies. As a result, several estuarine and river systems in Kerala are now
hotspots of heavy metal pollution. For example, the effluent discharge from ten major
industries to Kochi estuary is about 57000 m3 per day. The quantum of pollution caused by the
discharge of untreated sewage into wetland system is also alarming. A major source of
pollution of Vembanad Lake is the domestic sewage generated in the urban areas of Alappuzha
and Kochi. About 10,000 people are added every year to the urban population of the city of
Kochi alone. Kochi city generates about 2550 million litres per day of wastewater that enters
the lake directly through major canals. The pollution load of Kochi Corporation is reported to
be 1,96,000 kg/day of BOD. The total dissolved solid content near a sewage discharge site in
Kochi estuary was as high as 54000 mg/l. It has been reported that the Vembanad estuary
annually receives residues of about 25000 tones of fertilizers and 500 tones of highly toxic
pesticides from Kuttanad region alone (Anon, 1989). The presence of DDT in Pampa river (4000
ng/l), lindane in Thanneermukkam (6000 ng/l) and endosulphan in Vembanad lake (122 ng/l)
and Manimala river (1114 ng/l) are also of serious concern. High content of particulate and
dissolved mercury concentrations, presence of lead, cadmium, zinc etc are reported from
water and sediment samples of Kochi and Veli.
Coconut husk retting is considered an important source of organic pollution in the water bodies
of Kerala. As a result of retting, large quantities of organic substances like pectin, petosan,
fat and tannin are librated into the water by the activity of bacteria and fungi. Decomposition
of pectin results in the production of sulphides, characterized by hydrogen sulphide with
strong foul smell. The polyphenols released from coconut husk during the process of retting
interferes with microbial activity. Anoxic conditions, excess hydrogen sulphide and increased
turbidity drastically reduce the primary productivity of the lake. Investigations of the retting
zones show high organic content, high BOD (513.7 mg/l), low oxygen values (0.05ml/l) and
high sulphides (4.97 mg/l)m which converts productive portion of the lakes to non-productive
anoxic areas leading to devastation of bottom fauna. The retting yards also act as breeding
grounds for the mosquitoes, which act as a vector for filariasis.
When excess nutrients are available in water bodies through various sources and due to over
fertilization, exorbitant growth of aquatic plants takes place, which the system is not in a
position to support. Thus, it exceeds the supporting capacity of the environment and
consequently, problems of various types will creep in. Dead plants settle down and lead to
siltation and shallowing of the water body. For the bacterial decomposition of plant debris,
oxygen will be extracted from the medium resulting in depletion of oxygen in the system. Many
of the lake systems of Kerala are facing intense weed growth resulting out of high degree of
eutrophication, leading to slow death of such water bodies. .

143
Chapter 4
Environmental Analysis of Developmental Interventions at Local Level
Suchitwa Mission, Thiruvananthapuram
The groundwater gets contaminated by overflow/seepage of sewage/infiltration of human
excreta from latrine pits, especially in coastal plains where the density of wells and toilet pits
are very high and located close to each other. The number of dug wells in the State is
projected to be about 40,00,000 and about 95% of the 6.59 million households have toilets.
The possibility of cross contamination of wells from the toilet pits is very high. It is found that
inconsiderate pumping from dug wells depletes the groundwater level and yield leading to
drying up of the wells over the years. It is more pronounced in lateritic terrain covering over
60% of the total land area of the state. The wells located on the banks of rivers subjected
indiscriminate sand mining or deep cut irrigation canals are also subjected to such adverse
effects.
The high rate of soil erosion, debris flows and sedimentation in water bodies is a major
problem especially for tanks and reservoirs. The storage loss of reservoirs in Kerala, on an
annual basis, varies from 0.25% to 1.32%. Though this is lower compared to the major dams in
India (0.14% to 1.79%) and China (0.55% to 3.82%), it is a major concern considering the natural
vegetation in catchments. Indiscriminate mining of river sand has led to severe degradation of
the riverine ecosystem of almost all rivers of Kerala. It was indicated that about 20,000 lorry
loads of river sand was being mined per day from all rivers of Kerala. It is reported that the
extraction rate of river sand from the seven rivers debouching into the Vembanad lake is about
6 Mm3 against a replenishment rate of 0.09 Mm3 per year. Over exploitation of river sand
depletes the porous sand layer by 5 to 15 cm per year. Consequently, most of the rivers got
deepened by about 2 to 3 m over the last 15 to 20 years.
A unit land of Kerala receives about 2.5 times more rainfall compared to the national average,
but the same unit of land supports 3.6 times more population, on an average. Therefore, for
self-sufficiency, a unit land of Kerala has to produce 3.6 times more food, water and biomass
compared to the national average. It calls for intensive efforts for the conservation of land and
water on the basis of watersheds as vegetation has a major role in controlling floods and
sediment yield from the catchments and mitigating drought by maintaining soil moisture and
groundwater level.
4.2.3 Forest and Natural Habitats
The forest cover of Kerala, as per Forest Survey of India (2009) data is 44.58% of the total
geographical area which is categorized under very dense (8%), moderately dense (55%) and
open forest (37%). But as per the land use data of the state, only about 22% of the land is
under forest and forest plantation. Some 23% of the total forest area falls in Idukki district. But
the relative forest coverage is maximum in Wayanad (83%) and minimum in Alappuzha (2.7%).
The major forest types and their extent are Tropical wet evergreen (26%), Semi-evergreen
(23%), Tropical moist deciduous (18%), Tropical dry deciduous (2.4%), Mountain subtropical
temporate shoal (0.5%), Grasslands (0.1%) and plantations (30%). In addition, the coastal
stretch has mangrove forest area of about 420 ha. In general, 62% of the forests in the state is
under degraded condition (SoE Report-2005). The degradation of natural forests is due to
factors such as unregulated/ illegal harvest, forest fire, weeds, diversion for non-forest
purposes, soil erosion, harmful effects of management and poor regeneration. In

144
Environmental Assessment Report
Kerala Local Government Strengthening Project
Suchitwa Mission, Thiruvananthapuram
addition, the loss in continuity of forest patches, patch size and their crown density also
causes degradation. The major forest produce in the state include timber, reeds, bamboo,
sandal wood and fire wood. The quantity of timber production in 2008-09 was 50300.79 cum
(round log). The number of bamboos and reeds produced were 18.98 lakh and 186.80 lakh
respectively. The sandal wood production was 30808.6 kg.
Figure 4.4 shows the various kinds of forest cover present in Kerala:
Figure 4.4
It is evident from the figure that most of the forest in Kerala is open forest or moderately
dense forest. Coverage under dense forest is very low at around less than 4%. The district wise
forest cover for Kerala is given in Table 4.8
Source: State of Forests Report 2007

145
Chapter 4
Environmental Analysis of Developmental Interventions at Local Level
Suchitwa Mission, Thiruvananthapuram
There are 16 wild life sanctuaries, 5 National parks, one community Reserve, four elephant
reserves and two biosphere reserves in the State. The total area under the protected area
network comes to about 24 % of the total forest area of the State. It is higher than the national
average. The Periyar Tiger Reserve in Kerala is one of the best managed tiger reserve in the
country, with the forest dwellers on its fringes actively assisting the official machinery in the
conservation efforts. The state has also taken various initiatives in the recent past such as
declaration of a buffer zone of area 148 km2 around the Silent Valley National Park, adding 148
km2 of reserve forest from Ranni Forest Division to Periyar Tiger Reserve as critical tiger
habitat, declaring Parambikulam Wild Life Sanctuary as a Tiger Reserve, notifying an area of
110 km2 area in Kozhikode District as Malabar Sanctuary and declaring a special sanctuary for
national bird, peacock at Choolannur in Thrissur district. In addition, an area of 150 ha at
Kadalundi in Kozhikkode district was declared as community reserve for supporting mangroves.
There has been large-scale deforestation and conversion of forest area in certain regions. The
topographical maps available since 1900 and LANDSAT images (1973 and 1983) indicate a
substantial decline in forest vegetation cover over the years (Chattopadhyay, 1985). In 1905,
the forest vegetation was 44.4% of the total area which declined to 27.7% by 1965, to 17.1% by
1973, and to 14.7% by 1983. However, the actual forest area that sustains forest biodiversity
and functions of forest ecosystem is only less than 8% of the total area (Satishchandran, 2002).
A comprehensive state forest policy to address the specific problems and issues related to the
conservation of forests and biodiversity of the state as well as the livelihood needs of the
forest development communities has been formulated during 2007. The Forest Management
Policy of the state encompasses technology improvement, bio-diversity conservation and
development of partnership with the forest dependent communities and fringe dwellers.
4.8

146
Environmental Assessment Report
Kerala Local Government Strengthening Project
Suchitwa Mission, Thiruvananthapuram
Special thrust is also given for protecting species of plants and animals.
The Westem Ghat region is one of the 25 biodiversity hotspots in the whole world.The state
contains more than 4500 species of flowering plants of which 1500 taxa are endemic in nature.
There is also rich faunal wealth in the state. The wealth of genetic diversity of the state in the
form of domesticated crops or breeds of animals together with their wild relatives is not fully
documented. But it is considered to be very rich as more than 74% of the land area is under
various crops protected under distinct micro-watershed boundaries. However, they are under
severe stress due to the degradation of native agri-ecosystems, large conversion of agricultural
land, introduction of exotic crops, mechanised farming etc causing major loss of indigenous
agriculture and domesticated biodiversity. There are 102 species of mammals, 476 species of
birds, 169 species of reptiles, 89 species of amphibians and 202 species of fresh water fishes,
reported from Kerala. Among the mammals, 12 taxa are endemic to western ghats of which 6
are vulnerable, 3 are endangered and 1 is critically endangered. A unique and huge diversity of
bird fauna is also found in the state. Nearly, 25% of the Indian avifauna is recorded from the
state, of which nearly 150 species are located in the coastal stretches. The avifauna of the
state includes resident species (228 nos), winter visitors (94 nos), resident and local migrants
(14 nos), accidental and exceptional stragglers (4 nos) and uncertain identifications (136 nos).
Of the known species of birds in Kerala, 18 are endemic to the Western Ghats. Of the 169
reptile species of Kerala, 59 are endmic to western ghats and 9 are endemic to Kerala. Among
these, 26 species are vulnerable, 22 are endangered, 1 is critically endangered and one is
extinct (saltwater crocodile). Among the 89 species of amphibians reported from Kerala, 57
are endemic to the western ghats and 9 to Kerala. Among these, 35 are under vulnerable
category and 11 are endangered. Out of the 202 species of fresh water fishes recorded from
Kerala, 79 are endemic to western ghats and 42 are restricted to Kerala waters. Among these,
24 species are threatened and 10 are most threatened. It is also important to note that among
the 42 endemic species of Kerala, 13 are reported to be critically endangered. There are
roughly 6000 species of insects of which 20% is endemic to the state. The coastal waters of
Kerala is also characterized by rich marine faunal diversity. The high density of population
with limited natural resources excerts significant pressure on the environment of the State.
When it is combined with the numerous pockets of ecologically fragile areas and biodiversity
hot spots, it assumes greater significance.
4.2.4. Agriculture
The climate and topography in Kerala is conducive to varying crop types, such as, coconut and
rice in the sultry lowlands, rice, tapioca, banana, arecanut, coconut, pepper, cashew and
rubber in hot humid midlands and tea, coffee and cardamom in the cool subtropic highlands.
Agriculture is practiced in over 55% of the geographical area. The micro ecosystems are such
that the valleys with near waterlogged conditions for most part of the year are seen
juxtaposed with dry hilltops decked with densely canopied trees.

147
Chapter 4
Environmental Analysis of Developmental Interventions at Local Level
Suchitwa Mission, Thiruvananthapuram
Figure 4.25
10
15
20
25Share of Agriculture & allied
sector in GSDP (%)
The agricultural income in Kerala during 2007-08 indicated a decline of 5.70 per cent in
growth. The share of agriculture and allied sectors in GSDP indicated a continuous decline in
the state (see Figure 4.2). The share was only 11.90 per cent during 2008-09. Kerala has a
diverse land use and cropping pattern. The
land reforms introduced in the State brought in
radical and comprehensive institutional
changes leading to drastic transformation in
the land holding pattern. This has resulted in
shift in the land use pattern.
Considering the characteristics of soil,
drainage/wetness, erosion, runoff etc., Kerala
has 18 land capability subclass associations of
five broad land capability classes, namely Good
cultivable land, Moderately good cultivable
land, Fairly good cultivable lands, Well suited for forestry or grazing and Land suited only for
wildlife and recreation (KSLUB, 1995 and 2002). Only about 37% of the area of Kerala is
suitable for irrigation with certain limitations.
There has been significant change in land use over the years. The State conceived and
implemented a progressive Land Reforms Act with an objective of sustainable use of all
productive land through the involvement of the entire population by distributing land to the
landless. Over the last two decades, there is a decline in agricultural land use. Land use
changes are manifested, generally, as change in cropping pattern. The changes in crop area
and production of some of the important crops grown in Kerala are shown in Table 4.9.
Out of a gross cropped area of 27.02 lakh ha. in 2008-09, food crops comprising rice, pulses,
minor millets and tapioca occupy only 12.05 per cent. Kerala state which had a low base in
food production is facing serious challenges in retaining even this meager area. Kerala
agricultural economy is undergoing structural transformation from the mid seventies by
switching over a large proportion of its traditional crop area which was devoted to subsistence
crops like rice and tapioca to more remunerative crops like coconut and rubber. The area
under rice has been declining consistently over the last several years, but the pattern appears
to be reversing (see tables 4.9 and 4.10). The area under commercial plantation crops in
general and rubber in particular has increased considerably during the last two decades (see
table 4.11). The index of food grain production declined by 10.7 points and non-food grains
declined by 6.84 points. Even though there was a decline of index of non-food grain area,
index of area under plantation crops increased by 1.83 points in 2008-09.

148
Environmental Assessment Report
Kerala Local Government Strengthening Project
Suchitwa Mission, Thiruvananthapuram
Table 4.9. Changes in crop area and production, Kerala, 1961-62 & 2008-09
Sl
No
Crop Area (ha) Production (Tonnes)
1961-62 2005-06 %
variation
1961-62 2005-06 % variation
1 Rice 7,53,009 2,34,265 -69 9,88,150 5,90,241 -40
2 Tapioca 2,36,776 87,278 -63 16,18,713 27,10,934 67
3 Coconut 5,05,035 7,80,500 55 3,247mn 5,763mn 77
4 Pepper 99,887 1,75,808 76 26,550 40,641 53
5 Cashew 55,051 52,875 -4 84,449 42,274 -50
6 Rubber 1,33,133 5,17,475 289 24,589 7,83,485 3086
7 Pulses 43,546 3,943 -91 16,889 2,982 -82
8 Ginger 12,050 5,578 -54 11,185 23,380 109
9 Turmeric 4,847 2,754 -43 4,267 6,292 47
10 Banana 42,693 53,516 25 55,443 4,27,604 671
11 Coffee 18,807 84,696 350 8,145 57,200 602
12 Tea 37,426 36,557 -2 37,428 51,726 38
(Source : Dept. of Economics and Statistics, 2007; State Planning Board, 2010)
Table 4.10

149
Chapter 4
Environmental Analysis of Developmental Interventions at Local Level
Suchitwa Mission, Thiruvananthapuram
Several initiatives have been taken by the Government in recent years for promotion of
cultivation, in general, and rice, in particular linking the agriculture department, local
governments and Kudumbasree units of the State Poverty Eradication Mission. It includes
Padasekharam based action plans linking credit facility, input support, water management,
insurance, procurement and supplementary income sources. „Harithashree‟, the lease land
farming promoted by the State Poverty Eradication Mission, Kerala, through „Kudumbasree‟,
has helped women farmers to stay on in agriculture for their livelihood. The major crop
cultivated by the Kudumbashree group is Paddy (29% of area) followed by Plantain (25% of
area), vegetables (15% of area) and Tapioca (15% of area) during 2008-09 under the lease land
farming. A total area of 27,269 Ha have been brought under lease land farming as per the data
available for 2008-09. The State has also developed a strong network for supplies and services
which include Krishi Bhavans in all the Grama panchayats for transfer of technology and
organising agricultural services. Planting material delivery system has been developed which
includes 33 state seed farms, 10 district farms, 10 special farms and 8 coconut nurseries. The
paddy seed farms and the District Agricultural Farms are under the control of the District
Panchayats for facilitating appropriate seed planning at the grass root level. There has also
been increased effort for promoting organic agriculture including preparation of an organic
agriculture policy. This will improve the production of organic tea, rice, vegetables, pepper
etc which are done in a small scale at present.
4.2.5 Animal husbandry
Livestock sector in Kerala is extremely livelihood intensive and a major contributor to the
Table 4.11

150
Environmental Assessment Report
Kerala Local Government Strengthening Project
Suchitwa Mission, Thiruvananthapuram
agricultural GSDP of Kerala to the tune of 40%. Cattle population in Kerala which was 33.96
lakh in 1996, 21.22 lakh in 2003 (see Table 4.12) and 17.19 lakh in 2006. The crossbred cattle
population was 67% during 1996, 82% in 2003 and 93% in 2006 of the total cattle population.
Contribution of Kerala to national milk production was 2.4 percent during 2003-04 declined to
2.1 per cent in 2008-09. The gap between the production and requirement of egg is also
increasing at an alarming rate. Concerted efforts of the State to increase the egg production
have begun to show signs of improvement. Egg production which was 1199 M.Nos in 2007
increased to 1379 M.Nos in 2008 and to 1507 M.Nos. in 2009; an increase of 26 percent over
2007. Though meat production is increasing over the years, it cannot cater to the demand
fully.
In Kerala there are 3445 dairy co-operatives including 2646 Anand pattern societies. The newly
registered Societies during 2008-09 is 122. Of the 22 dairies functioning in the State 12 are in
the Co-operative Sector (Milma) and handles 9.90 lakh litres of milk/day, 14 chilling plants,
two cattle feed plants, a milk powder plant, an established training centre and 5000
distribution outlets. MILMA represents more than 8.11 lakh dairy farmers who have organised
2646 Anand Pattern Cooperative Societies. The remaining 10 are run by private/charitable
societies which handle 64000MT milk per annum. There are also about 25 small dairies which
are not registered and they handle 10000 litres of milk/day.
The per capita availability of egg is very low at 41 eggs/year and poultry meat is 0.9 kg/year
against the world average of 147 eggs and 11 kg poultry meat/year in the country. Government
of India has set a target for achieving production of over 52 billion eggs by 2011-12, at a
growth rate of 4.3 per cent. The poultry rearing on commercial lines is largely confined to
broiler production. In Kerala, the egg production which reached 2054 million in 1999-2000
continuously declined till 2005-06, but began to increase in 2006-07 and that trend is
maintained in succeeding years. Backyard poultry system has good potential in the state.
Around 8-10 lakh chicks are being introduced every year in the state.
India is endowed with more than 11 per cent of worlds‟ livestock population comprising a
Table 4.12

151
Chapter 4
Environmental Analysis of Developmental Interventions at Local Level
Suchitwa Mission, Thiruvananthapuram
variety of meat animals such as buffaloes, goat, sheep, pigs, cattle and poultry. The per capita
animal protein availability is about 10g against world average of 25g. The minimum
requirement targeted is 20g per capita/day of animal protein of which 4g will come from
meat. The estimated demand for meat would be 7.7 million tonnes against the present
production of 5.7 million tonnes. Meat production in Kerala comprises of beef, mutton, pork
and broiler chicken. Out of this, beef is almost entirely from the culled animals brought from
the neighbouring states. The rearing of goat and pig is concentrated in selected pockets. As in
the case of poultry, meat production under stall-fed condition in general is not economical in
Kerala. However, there is scope for fostering this activity in selected areas largely by utilising
the bio wastes available. The annual production of poultry meat shows a continuous decline
from 32704 tonne (2004-05) to 19268 tonne (2008-09) whereas the non-poultry meat shows an
increase from 162567 tonne (2004-05) to 181103 tonne (2008-09).
There is no authentic data regarding the number of cattle and poultry slaughtered in the State
and hence the total value and quantity of meat produced in the state not accessible. As per
survey conducted by the Dept. of Economics and Statistics in 2006, there are 4904 slaughter
houses in Kerala of which the authorised slaughter houses were only 1490 (30.38%. Also of the
total 6489 poultry stalls registered were only 2124 (32%). A wide gap is existing between the
requirement and production of animal products. A comprehensive strategy needs to be put in
place to augment production of major livestock products in the state.
In order to reduce morbidity and mortality, better health care efforts are being taken through
a network for veterinary health care now in the State comprising 210 Veterinary hospitals, 883
veterinary dispensaries, 47 veterinary poly clinics, 14 District Veterinary Centres, 9 mobile
hospitals/dispensaries at district level, 13 district level clinical labs, four diagnostic labs and
other related health care institutions. The state is implementing programme for Foot and
Mouth disease control. Brucellosis, Helminthiasis, worms and other internal parasites are also
threat to the livestock wealth of the State. The reports of minor attacks of major diseases like
Anthrax, and Hemorrhagic Septicemia are also reported. The State has eradicated the dreadful
disease of Rinderpest and no outbreak was reported after 1994. Among the other diseases the
major one affecting cattle, buffaloe, goat, pig and poultry are digestive system disorders (34%
of the total cases), parasitism (40%), reproductory disorders (5%) etc. According to report on
Animal Disease Surveillance Scheme, 2006 the economic loss due to various diseases arrived at
Rs.620.94 Cr. i.e., 23% of total worth of Livestock population in State. Of the total loss, 66% is
for cattle.
4.2.6 Fisheries
India has been a major contributor to the world marine fish production and second largest
producer of inland fish. The west coast was the highest contributor among regions and Kerala
among states (21%) followed by Gujarat (19%). Presently, fisheries and aquaculture contribute
1.07% to the national GDP and 5.3% to agriculture and allied activities. Fisheries sector
contribute 3% of the economy of Kerala State. The fishing Industry occupies an important
position in the economy of Kerala and its share in the national marine fish production is about
20-25%. The water resources of this state comprise of a coastline of 590 km length

152
Environmental Assessment Report
Kerala Local Government Strengthening Project
Suchitwa Mission, Thiruvananthapuram
having a continental shelf area of the sea adjoining the state. The Inland water bodies of
Kerala comprising of 44 rivers (85000 ha) 53 reservoirs (44289 ha) and 53 back waters and
other brakish water bodies (65213 ha) also play a major role in the fishery sector. The polders
of Kuttanadu having a water spread of 35000 ha and 17000 ha of kole lands of Thrissur are also
very ideal for various aquaculture development activities. The estimated fisher folk population
of Kerala during 2008-09 is about 11.33 lakh, of which 77% dwells in the coastal area and the
rest in the inland sector.
Kerala is a coastal state and is bordered on the West by the marine flora and fauna rich
Arabian sea. The Kerala Marine Fisheries Regulation Act was enacted with a view to enforce
strict regulatory measures following the induction of more number of crafts and consequent
increase in the level of unrestricted fishing. According to this Act, the inshore area coming
within the depth range of 50 meters has been demarcated for fishing by the traditional
fishermen using country crafts and the area beyond the limit in the economic zones can be
utilised by motorized boats and large vessels. As this restriction is not being strictly followed,
monsoon trawling has been banned as a preventive measure. The ban on monsoon trawling has
been in force from 1980 onwards.
Marine fish landing in the state during 2008-09 was 5.83 lakh tonnes and showed an increase of
8% over the previous year. The maximum sustainable yield was estimated about 6.99 lakh
tonnes. The fish catches from the Kerala coast include more than 300 different species, the
commercially important number is about 40 only. The high value species among the fish
catches are still few; prominent among them are Seer fish, Prawn, Ribbon fish and Mackerel.
High value fish like coastal tuna and oceanic tuna registered a growth of 23% and 39%
respectively. During 2008-09 the catch of Ribbon fish was 16118 metric tonnes and penaeid
prawn was 49351 metric tonnes. The quality of these high value species in the total catch
ultimately decides the income of the fishermen. Oil sardine accounted for the major share of
landings (71%), heavy landing of juvenile oil sardine in ring seine was also recorded. The catch
of Oil sardine was 156511 MT during 2008-09, the most important variety consumed mainly by
the poorer sections of the society exceeded the potential in recent years. The marine fishery
resources of the state have almost attained the optimum level of production. The inland fish
production reached peak share of 13% of the total fish production of the state during 2000-01
and thereafter declined slightly. During 2008-09, the share of inland fish production to the
total fish production of the state was 12.59%. The current level of Inland fish production is
about 0.83 lakh tonnes/year
District wise data for marine fish landings in Kerala for the year 1998 are given in Table 4.13.
More recent but aggregated data for the whole state for marine fish ladings as well as inland
fish landings is provided subsequently in Tables 4.14 and 4.15.

153
Chapter 4
Environmental Analysis of Developmental Interventions at Local Level
Suchitwa Mission, Thiruvananthapuram
Table 4.13

154
Environmental Assessment Report
Kerala Local Government Strengthening Project
Suchitwa Mission, Thiruvananthapuram
Table 4.14 Species wise composition of Marine fish landings in Kerala (2004-2005 to 2006-2007) (Tonnes)
Source: Directorate of Fisheries
Table 4.15 Species-wise Inland Fish Production in Kerala (2003-04 to 2006-07)
Sl.No Species 2003-04 2004-05 2005-06 2006-07
Production % Production % Production % Production %
1 Prawns 16,136 21 16,334 21 14,812 19 16,226 20
2 Etroplus 4,510 6 4,458 6 4,626 6 4,452 6
3 Murrels 3,657 5 4,133 5 4,287 6 4,081 5
4 Tilapia 7,739 10 7,490 10 7,965 10 7,555 10
5 Catfish 4,359 6 4,740 6 4,922 6 4,484 6
6 Jew Fish 2,795 4 2,765 4 2,871 4 2,745 3
7 Others 37,083 48 36,531 48 38,497 49 39,564 50
Total 76,279 100 76,451 100 77,980 100 79,110 100 Source: Directorate of Fisheries
Sl.No Species 2004-05 2005-06 2006-07
1 Elasmobranchs 3,044 3,159 3,074
2 Eels 148 168
3 Cat Fish 154 168
4 Chirocenrtrus 258 265
5. a Oil Sardine 1,72,754 1,49,949
b Lesser Sardine 98,303 65,268 2,14,773
c Amchorilla 35,312 30,167 33,853
d Trissocles 2,308 3,175
e Other Clupeids 12,791 15,533
6 Saurida&Saurus 5,916 5,551 6,158
7 Hemirhamphus&Belone 642 691
8 Perches 30,437 30,400 32,971
9 Red Mullets 1,616 1,676
10 Polynrmides 21 67
11 Sciaenides 8,992 9,887 8,232
13 a Caranx 25,419 26,987 25,258
b Chornemus 1,049 985
c Othetr Carangids 24,171 20,766
14 Leiognathus 5,136 5,306
15 Lactrious 3,907 3,525
16 Pomfrets 1,393 1,501
17 Mackerel 43,017 44,202 45,904
18 Seerfish 2,371 2,475 2,648
19 Tunnies 11,208 11,923 12,248
20 Sphyraena 1,582 2,094
21 Mugil 29 42
22 Soles 8,061 13,951
23 a Penaeid Prawn 53,402 48,006
b Non Penaeid Prawn 3,315 1,738 56,779
c Lobsters 0 398
d Crabs 3,418 4,515
e Stomatopods 332 9,547
24 Cephalapoods 15,939 14,203
25 Miscellanious 6,761 14,948 100,988
TOTAL 6,01,863 5,58,913 5,61,028

155
Chapter 4
Environmental Analysis of Developmental Interventions at Local Level
Suchitwa Mission, Thiruvananthapuram
The Tsunami of 2004 caused extensive damage in Southern regions of India affecting a total of
2260 km of coastline. In Kerala, Fisherfolk were affected along 250 km of coastline. The
disaster had damaged the infrastructure, assets, outputs, and services and disrupted the
economic activity in the coast of Kerala. In order to rehabilitate and reconstruct public and
community based infrastructure and restore the livelihood of the affected population
Government of Kerala with the support of Government of India have formulated Tsunami
Emergency Assistance Project (TEAP) and Tsunami Rehabilitation Programme (TRP). The
livelihood programme has contributed a lot in the social empowerment to the coastal people
especially the fisherwomen of coastal Kerala and this will remain as a strong basement blocks
by a sustainable livelihood development programme for the coastal Kerala.
There are 9 completed fishing harbours in the state and the works of other 10 harbours are
progressing. The completed fishing harbours are Thangassery, Neendakara, Kayamkulam,
Munambam, Beypore, Puthiyappa, Chombal, Moplabay, Azheekal. There are 38 fish landing
centres in the coastal zone of Kerala. Out of this 15 landing centres are for traditional
fisheries.
4.2.9 Sanitation & Waste management
Kerala raised to the need of community sanitation efforts through its basic strength of social
capital. Kerala achieved the distinction of being the first State to fully do away with the
dehumanizing practice of scavenging as a culmination of people‟s movement for basic human
dignity. The history of sanitation in Kerala stride out from 1920 when the Maharaja of
Travancore initiated a move for sanitation with simple squat pits without running water in
selected pockets of his kingdom. From the late 50‟s, Kerala led the nation in the provision of
household toilets through the Environmental Sanitation Programme (ESP). In the initial days,
through successful campaign, single leach pit latrines with water seal bowls known as ESP
latrines were constructed on an extensive scale. Later under the Central Rural Sanitation
Programme launched in 1986 and People‟s Plan launched in 1996, the coverage increased
manifold reaching 96% as per the latest estimate (NFHS- 3rd round: 2005), the highest in the
country and far above the national average of 44.5%. It is also significant to note that the
coverage is more or less same in urban areas (98.3%) and rural areas (94.9%), showing the
equitable spread. Correspondingly, there has been substantial improvement in personal
cleanliness, home sanitation, food hygiene, safety of drinking water, solid and liquid waste
management and overall environmental scenario. Thus, 869 out of the 999 Village Panchayats
in the State have won the prestigious national award of Nirmal Grama Puraskar. It highlights
the fact that at least 87% of the province is free from open defecation, the schools and
balwadis are provided with toilet facilities and an overall cleanliness prevail in the area.
Historically, Kerala has been ahead of others in providing toilet facilities to schools and
balwadis. The state is also the acknowledged leader in the country in reduction of water borne
diseases and sanitation-related vector-borne diseases like malaria and filaria. These successes
have contributed to the high human development of the State. Though the rich natural
resource diversity and natural resources have contributed to the achievement, the dynamism
has been achieved mainly through the literacy, public action, responsive state

156
Environmental Assessment Report
Kerala Local Government Strengthening Project
Suchitwa Mission, Thiruvananthapuram
Government and vibrant Local Governments. In general, the population has a natural instinct
for maintaining cleanliness. The homestead habitation practice, rich vegetation surrounding
the residences, secured drinking water and sanitation facilities, etc can be seen as reflections
of societal instinct for cleanliness in Kerala. During the 80s and beginning of 90s, Kerala
experienced very massive campaigns for total literacy. This has opened up various avenues of
learning and inspired self-confidence and wisdom and lead to intensive interventions in sectors
like sanitation by pooling resources. The initial phase of decentralization, especially the
coordinating efforts of District Panchayats, enabled significant progress. Since then, sanitation
has been a priority sector for local governments. Thus, by the time the Total Sanitation
Campaign (TSC) was launched in the country, the state had precise target, strategy and
approach in the sector. Towards the nineties, the issue of solid waste has come up appreciably
in the major urban centres of the State. Some of the cities like Thiruvananthapuram and
Kozhikkode initiated action for collection and disposal of wayside accumulation of solid
wastes. By the end of the decade, both these cities initiated actions for establishing
composting plants as a strategy for managing biodegradable municipal wastes.
In order to push sanitation as an important agenda in the development discourse of the State,
sustained local action through the local governments involving citizens, elected leaders,
officials, professionals, activists and students was the strategy adopted. In order to implement
the strategy, a mission approach was adopted in the beginning of 2000. Accordingly, the Kerala
Total Sanitation and Health Mission was formed to focus on rural areas and Clean Kerala
Mission was formed to attend the solid waste management requirements. These missions were
essentially conceived as enablers to the local governments especially for providing technical
and monitoring support. As a result, there has been significant coverage in various sanitation
components. The temporal progress in toilet coverage since 1991 is given in Table 4.16. Similar
progress has also been achieved in providing toilet facilities in Schools and Balwadis (Table
4.17). The implementation of TSC since 2001 has further improved the coverage. The target
and achievement of various components envisaged in TSC is given in Table 4.18.
Table 4.16. Household latrine coverage: Access to Sanitation facilities
Time Line 1991(1) 1995(2) 2001(3) 2005(4)
Rural households with toilet (%) 44 73.4 81.3 94.9
Urban households with toilets (%) 73 90.0 92.0 98.3
Source – (1) Census of India, 1991, (2) NSSO 1995 (3) Census of India 2001 (4) NFHS 3rd round - 2005
Table 4.17. School toilet coverage (2005)
Item LP UP HS Total
Number of Govt. schools 2565 960 986 4511
Number of schools having toilets 1785 759 790 3334
Percentage of schools having toilets 69.59 79.06 80.12 73.90

157
Chapter 4
Environmental Analysis of Developmental Interventions at Local Level
Suchitwa Mission, Thiruvananthapuram
Table 4.18. Progress of TSC- Target and Achievement (2010)
No Components Target Achievement Percentage
1 Individual House Hold Latrines 1073742 1098320 100
2 School Toilets 3600 3570 99
3 Anganwadi Toilets 4957 4464 90
4 Community Sanitary Complex 1090 872 80
In the coastal areas, particularly, it is estimated that about one million m3 sewage is generated
per day and about 30000 m3 of this reaches the surface water bodies in the coastal areas in the
State. This quantity of sewage contributes about 7000 kg of BOD load into the coastal water
bodies (KSPCB, 2002). This estimate by the Kerala State Pollution Control Board is based on
1991 census updated to 2002 using the average decennial population growth rate of 10 %. On
an average, 33% of the households in the coastal area are without any sanitary facilities and it
is estimated that 10% of the sewage generation from those reaches the coastal water bodies
(KSPCB, 2002). District wise data on sewage generation in the coastal areas of Kerala are given
in Table 4.19.
The Municipal Solid Waste (MSW) management got a fillip in the state through the setting up of
9

158
Environmental Assessment Report
Kerala Local Government Strengthening Project
Suchitwa Mission, Thiruvananthapuram
Clean Kerala Mission in 2003. This was to enable, primarily the Urban Local Governments
(ULGs) and secondarily the rural local governments (RLGs), to tackle the increasing solid waste
accumulation in compliance to the Municipal Solid Waste (Management & Handling) Rules, 2000
as well as the provisions in Municipal and Panchayati Raj Acts. Consequently, appreciable
progress was achieved in the MSW management sector (Table 4.8). There are also certain best
practices developed in the sector.
Table 4.18 Progress in municipal solid waste management sector
No Item Total %
1 No of ULGs having land for MSW management 55 95
2 No. of ULGs with MSW management system in place 38 66
3 No. of ULGs where MSW management system is being developed 20 34
4 No. of RLGs with MSW management system 103 10
5 No. of RLGs where MSW management system is being developed 125 13
Though the state could address effectively the first generation issues with respect to human
excreta disposal, there are serious second generation issues of water pollution. The high
density of population in
homestead type of
habitation poses
technological issues. The
basic standard of living in
the state is relatively high
and therefore, the level of
solid and liquid waste
generation is high even in
rural areas. The magnitude
of land, water and air
pollution is high leading to
dwindling environmental
assimilative capacity.
Consequently, the disease
burden in increasing as can
be understood from Figure 4.4. Therefore, there is an immediate necessity of upgrading the
environmental management systems especially for waste generation hotspots. These include
solid waste management facilities, improved slaughter houses, facilities for treating septage
and common engineered landfills.
The state has developed specific action plans for tackling the issues in sanitation sector and
placed an institutional framework with professional competence.
A sectoral status study on MSW management in Kerala indicates that the total MSW generation
in the state is about 8300 tpd (Table 4.20). These studies indicated that 70-80% of the total
580000
600000
620000
640000
660000
680000
700000
720000
1999 2000 2001 2002 2003 2004 2005
Dis
ea
se
s
0
50
100
150
200
250
De
ath Cases
Death
Figure 4. 1: Disease Burden

159
Chapter 4
Environmental Analysis of Developmental Interventions at Local Level
Suchitwa Mission, Thiruvananthapuram
waste generated is biodegradable in nature and these putrescible waste needs to be managed
within 24 hours. 13% of the waste is generated by the five City Corporations, 23% by the 53
Municipalities and the rest by the 999 Gram Panchayats. Though nominal facilities are provided
in 38 Municipalities, there are gross inadequacy in terms of capacity and abatement of
pollution. There are also issues with respect to plastic discards, e-waste and engineered
landfill. The management of plastic discards and e-waste are proposed to be handled by
establishing Resource Recovery Centres for disposing the reusable, and outsourcing the
disposal of the hazardous part.
Table 4.20. Waste Generation in Kerala
Local Governments Population 2001
Per capita
waste
generation (g)
Waste generation
per day
2001
(tpd)
2006
(tpd)
5 City Corporations 24,56,618 400 983 1,091
53 Municipalities 58,10,307 300 1,743 1,935
999 Grama Panchayats 2,35,74,449 200 4,715 5,312
Total 7,441 8,338
In the coastal areas of Kerala including panchayats, municipalities and corporations it is
estimated that about 1,677 tonnes of solid waste is generated per day assuming 300 gram per
capita in major cities and 200 gram elsewhere. This estimate is based on the 1991 census
updated to 2002 using the decennial population growth of 10%. The biodegradable solid waste
is estimated to be about 553 tonnes per day assuming that 1kg of waste contains 0.3 kg of
biodegradable waste. BOD load of solid waste reaching the coastal waters of Kerala is
estimated to be about 91 kg/ day assuming that 20% of the biodegradable solid wastes get
carried in to the inland water bodies and 10% of that reaches the coastal waters. District wise
details on solid waste and BOD load reaching the marine coastal waters are presented in Table
4.21.

160
Environmental Assessment Report
Kerala Local Government Strengthening Project
Suchitwa Mission, Thiruvananthapuram
Consumption of Fertilizers and Pesticides
Annual consumption of fertilizers in Kerala is about 210,596 tonnes. Breakup of this is as
follows: N = 87,016 tonnes, P = 43,107 tonnes, K= 80,473tonnes. It is presumed that 1% of the
fertilizers applied on land reaches the coastal waters (KSPCB, 2002). About 1340 tonnes of
different types of pesticides is used for agricultural purpose in Kerala per year. An account of
various pesticides used in the State is given in Table 4.22. As in the case of fertilizers, it is
presumed that 1%of this reaches the coastal waters.
21
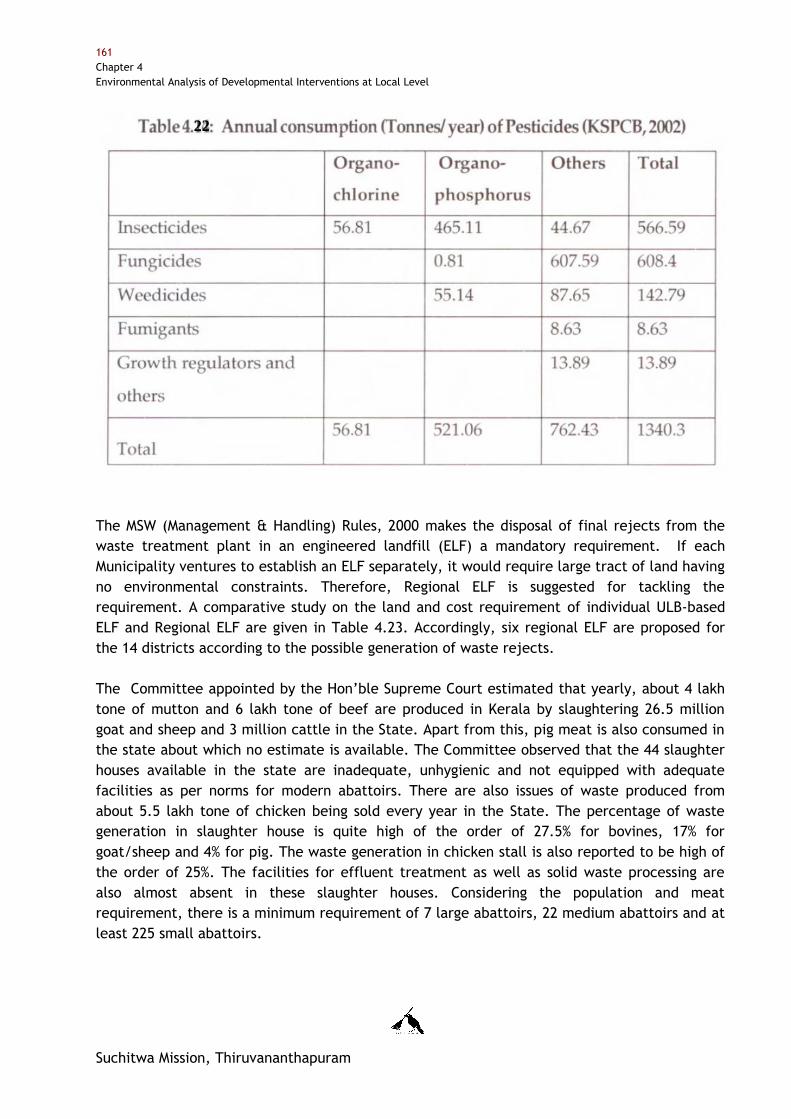
161
Chapter 4
Environmental Analysis of Developmental Interventions at Local Level
Suchitwa Mission, Thiruvananthapuram
The MSW (Management & Handling) Rules, 2000 makes the disposal of final rejects from the
waste treatment plant in an engineered landfill (ELF) a mandatory requirement. If each
Municipality ventures to establish an ELF separately, it would require large tract of land having
no environmental constraints. Therefore, Regional ELF is suggested for tackling the
requirement. A comparative study on the land and cost requirement of individual ULB-based
ELF and Regional ELF are given in Table 4.23. Accordingly, six regional ELF are proposed for
the 14 districts according to the possible generation of waste rejects.
The Committee appointed by the Hon‟ble Supreme Court estimated that yearly, about 4 lakh
tone of mutton and 6 lakh tone of beef are produced in Kerala by slaughtering 26.5 million
goat and sheep and 3 million cattle in the State. Apart from this, pig meat is also consumed in
the state about which no estimate is available. The Committee observed that the 44 slaughter
houses available in the state are inadequate, unhygienic and not equipped with adequate
facilities as per norms for modern abattoirs. There are also issues of waste produced from
about 5.5 lakh tone of chicken being sold every year in the State. The percentage of waste
generation in slaughter house is quite high of the order of 27.5% for bovines, 17% for
goat/sheep and 4% for pig. The waste generation in chicken stall is also reported to be high of
the order of 25%. The facilities for effluent treatment as well as solid waste processing are
also almost absent in these slaughter houses. Considering the population and meat
requirement, there is a minimum requirement of 7 large abattoirs, 22 medium abattoirs and at
least 225 small abattoirs.
22

162
Environmental Assessment Report
Kerala Local Government Strengthening Project
Suchitwa Mission, Thiruvananthapuram
Table 4.23 Individual ELF Vs Regional ELF Facility
No Item Individual ELF for
each UBS
Regional ELF
1 Land requirement (Ha) 2316 957
2 Cost of land (Rs. per Ha) 0.40 Crore 0.18 Crore
3 Savings on land cost (Rs) 754 Crore
4 O&M cost per ton (Rs) 555 388
5 Savings per annum on O&M (Rs) 13 Crore
The coverage of sewerage facilities, even in the City Corporations, is extremely low of the
order of 30% in Thiruvananthapuram and 5% in Kochi Corporation areas, probably one of the
lowest in the country. Even in this system, the provision for treating the black liquor is almost
absent. Rest of the Municipal and rural areas do not have even such a facility. Due to land
constraints the septic tanks have volume constraints and due to high water table scenario, the
leach pits overflows, especially during rainy season which extend up to about 150 days in a
year. Therefore, there is a requirement of clearance and removal of septage, the facilities for
which are not available anywhere in the state. The practice now is to collect the septage using
vacuum suction into tankers which are then emptied into open spaces and even water bodies,
one of the most dangerous practices. Therefore, there is an immediate necessity of installing
Sewage Treatment Plants, at least for treating the septage collected from septic tanks and
leach pits.
Considerinng these issues, the Government of Kerala formulated and launched a
comprehensive action plan namely „Malinya Mukta Keralam (Waste-free Kerala)‟ action plan in
2007 envisaging the following output to be achieved during the current plan period.
Total coverage of household sanitary latrines
Total coverage of latrines in public institutions like Anganwadis, Schools and Hospitals
Putting in place household and institutional waste treatment systems
Segregation of household and institutional waste
Developing decentralized common treatment facilities
Development of common sanitary land-fill sites for inert waste as required
Making Colonies clean and neat
Introducing litter-free public places
Plan for liquid waste management
Extending sewerage facilities
These action plans are being implemented in a time-bound manner.

163
Chapter 4
Environmental Analysis of Developmental Interventions at Local Level
Suchitwa Mission, Thiruvananthapuram
4.3 Functions of Local Governmets and their Environmental implications
The Kerala Panchatayi Raj Act and the Kerala Municipalites Act, outlines the functions of
various tiers of Local Government in detail. The functions are classified as mandatory
functions, general functions and sectoral functions. The sectoral functions include agriculture,
fisheries, animal husbandry, dairy development, minor irrigation, social forestry, small
industries, housing, waters supply, electricity and energy, education, public works, public
health and sanitation, social welfare, poverty alleviation, SC /ST development , sports and
cultural affairs , PDS, natural calamities relief, and Cooperation.
Some of these functions include interventions on ecosystem resources, and hence have
environmental implications. For instance, the activities associated with the mandatory
function „regulating building construction‟ can cause adverse environmental impact due to
resource consumption and waste generation. There are many functions which have beneficial
impacts if appropriate protocols are observed. An example for this is the the secoral
responsibility of „putting into practice water conservation‟. In many such cases, poor
implementation or service delivery can also cause adverse environmtal impact.
The environmental impacts of functions of Local Governmetns has been analysed using an
activity-impact matrix. For analysis in matrix method, causative factors or activites associated
with the function are listed. The environmental impact can be either due to the activites
related to the function per se, or poor service delivery in performing the function. In some
cases, the environmental impact of the function is not clear at this stage as it will be
subjective and depends on the boundary conditions, scale, type and duration of the activity
etc. Futher, the adverse effects due to the causative factors or activites related to the
function are enumerated. It examines whether a particular function, has no environmental
impact, or has beneficial environmental impact or has adverse environmental impact. It also
tries to qualify the level of adverse impact as High, Medium, Low or Insignificant. The
following notations are used to denote the impact type and magnitude: H for High Adverse
Impact, M for Medium Adverse Impact, L for Low Adverse Impact, I for Insignificant Impact, N
for No Impact, B for Beneficial Impact and S, if the impact is Subjective. The matrix also
outines the mitigation measures for adverse impacts or measures for positive enhamcement of
beneficial impacts wherever applicable.
The detailed activity-impact matrices for all the madatory, general and sectoral functions of
Grama panchayats, Block panchayats, District Panchayats and Municipalites is presented in
Annexure V. The projects dealing with Infrastructure, industries, intensive landuses, high
magnitude resource consumption and some of the service sectors like sanitation are found to
be the causing adverse impacts of high magnitude and intensity. This is mainly due to
inadequate compliance to the stipulated protocols and poor environmental management
measures.
The outcomes of the activity impact matrix anayisis has been incorporated into the
Environmental and Social Management Framework in Chapter 5. Based on the level and type of
impact, functions requiring environmental regulation have been classified under a
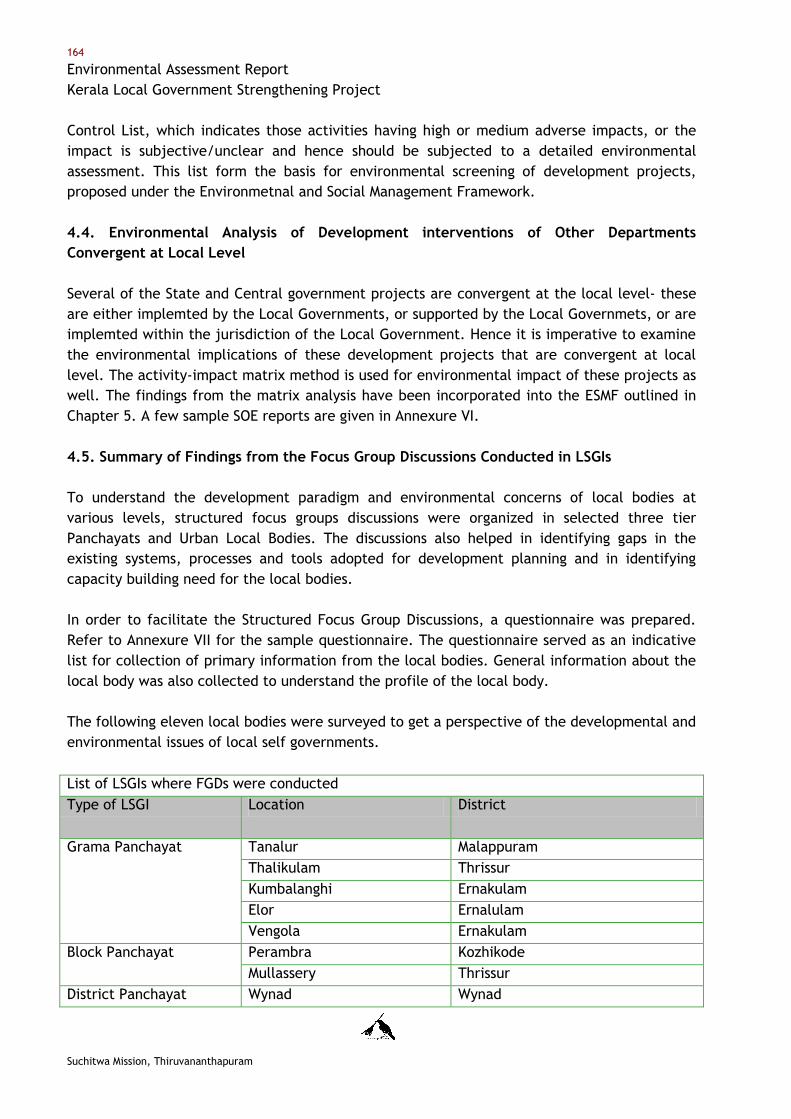
164
Environmental Assessment Report
Kerala Local Government Strengthening Project
Suchitwa Mission, Thiruvananthapuram
Control List, which indicates those activities having high or medium adverse impacts, or the
impact is subjective/unclear and hence should be subjected to a detailed environmental
assessment. This list form the basis for environmental screening of development projects,
proposed under the Environmetnal and Social Management Framework.
4.4. Environmental Analysis of Development interventions of Other Departments
Convergent at Local Level
Several of the State and Central government projects are convergent at the local level- these
are either implemted by the Local Governments, or supported by the Local Governmets, or are
implemted within the jurisdiction of the Local Government. Hence it is imperative to examine
the environmental implications of these development projects that are convergent at local
level. The activity-impact matrix method is used for environmental impact of these projects as
well. The findings from the matrix analysis have been incorporated into the ESMF outlined in
Chapter 5. A few sample SOE reports are given in Annexure VI.
4.5. Summary of Findings from the Focus Group Discussions Conducted in LSGIs
To understand the development paradigm and environmental concerns of local bodies at
various levels, structured focus groups discussions were organized in selected three tier
Panchayats and Urban Local Bodies. The discussions also helped in identifying gaps in the
existing systems, processes and tools adopted for development planning and in identifying
capacity building need for the local bodies.
In order to facilitate the Structured Focus Group Discussions, a questionnaire was prepared.
Refer to Annexure VII for the sample questionnaire. The questionnaire served as an indicative
list for collection of primary information from the local bodies. General information about the
local body was also collected to understand the profile of the local body.
The following eleven local bodies were surveyed to get a perspective of the developmental and
environmental issues of local self governments.
List of LSGIs where FGDs were conducted
Type of LSGI Location District
Grama Panchayat
Tanalur Malappuram
Thalikulam Thrissur
Kumbalanghi Ernakulam
Elor Ernalulam
Vengola Ernakulam
Block Panchayat Perambra Kozhikode
Mullassery Thrissur
District Panchayat Wynad Wynad

165
Chapter 4
Environmental Analysis of Developmental Interventions at Local Level
Suchitwa Mission, Thiruvananthapuram
Municipality
Koilandy Kozhikode
Perinthalmanna Malappuram
Nedumangad Thiruvananthapuram
Five Grama Panchayats, two Block Panchayats, one District Panchayat and three Municipalities
were included in the sample. Local bodies from coastal plain areas, mid land and high land
stretches of the state were part of the sample. The surveys were conducted during April- May
2009.
The focus group discussions were attended by elected representatives as well as staff from
LSGI or other government departments who are associated with the development planning
process. More than fifty elected representatives were consulted through these discussions and
approximately 26% of them were women. One district panchayat, one block panchayat and one
grama panchayat were led by women representatives. In addition, more than 20 government
staff involved in planning and implementation of development projects participated in the
survey.
Detailed minutes of the surveys in various LSGIs is provided in Annexure VII. The findings from
the field surveys is summarised in the following section.
4.5.1. Summary of Findings
4.5.1.1. Developmental activities undertaken by the LSGI
The following table summarizes the development projects undertaken by the LSGI. This is an
indicative list of activities based on the inferences from the field survey.

166
Environmental Assessment Report
Kerala Local Government Strengthening Project
Suchitwa Mission, Thiruvananthapuram
Related to functions of LSGI State / central/ line
department projects
Gra
ma P
anchayat
Permission for building construction
Solid waste management
Health and sanitation
Soil and water conservation
Drinking water supply
Market places
Burning and burial Grounds
Various Licenses, certificates, tax
Collection of statistics
Poverty alleviation and employment- Kudumbasree
Promotion of cultivation in waste/fallow/marginal lands
Diary development
Fisheries sector development
Implementation of housing schemes
Electrification
Promotion of bio-gas
Improvement of amenities and quality of education in
Schools
Construction and maintenance of Panchayat roads
Construction and maintenance of govt buildings
Management of health centres, ICDS centres
Construction of Play grounds and cultural centres
Housing schemes: IAY,
VAMBAY, Special
Schemes for SC/ST
Employment Schemes:
SGSY, SGSY Special
Projects. NREGP,
Kudumbasree
Watershed and Soil and
water conservation:
IWDP/ Hariyali
WASH: Clean Kerala
Mission, TSP
Energy conservation:
ANERT
Blo
ck P
anchayat
Coordination with Grama Panchayats
Solid waste management
Soil and water conservation, Watershed projects
Drinking water supply
Market places
Burning and burial Grounds
Promotion of cultivation in waste/fallow/marginal lands
Fisheries sector development
Skill development training, local enterprise development
Improvement of amenities in schools and hospitals
Road construction and maintenance
Lift irrigation schemes
Energy conservation
Implementation of employment schemes
Implementation of housing schemes for SC/ST population
Employment Schemes:
SGSY, SGSY Special
Projects, NREGP,
Kudumbasree
Watershed and Soil and
water conservation:
IWDP/ Hariyali
WASH: Clean Kerala
Mission, TSP
Energy conservation:
ANERT

167
Chapter 4
Environmental Analysis of Developmental Interventions at Local Level
Suchitwa Mission, Thiruvananthapuram
4.5.1.2. Innovative approach/ projects
This section highlights a few of the initiatives from the aforementioned LSGIs which are
noteworthy for their innovativeness and could be replicated and up-scaled.
IT and Governance
Citizen Charter, Perinthalmanna Municipality:
A commendable governance initiative is the “citizen charter” prepared by the Perinthalmanna
Municipality. The citizen charter document outlines the procedure for availing a list of thirty
nine services offered by the municipality. The document also specifies the time limit for
Dis
tric
t Panchayat Coordination with Block, Grama panchayats
Promotion of agriculture
Construction and maintenance of district roads
Education
Health
SC/ST welfare
Munic
ipality
Permission for building construction
Solid waste management
Health and sanitation
Soil and water conservation
Drinking water supply
Storm water drainage and sewerage networks
Market places, bus stands, cultural centres, libraries, town
halls
Burning and burial Grounds
Various Licenses, certificates and tax collection
Collection of statistics
Poverty alleviation and employment- Kudumbasree
Skills development training and promotion of enterprises/
industries
Promotion of cultivation in waste/fallow/marginal lands
Diary development
Fisheries sector development
Implementation of housing schemes
Electrification , energy conservation
Promotion of bio-gas
Improvement of amenities in schools and hospitals
Construction and maintenance of roads
Construction and maintenance of govt buildings
Management of health centres, ICDS centres, hospitals and
schools
Employment Schemes:
SGSY, SGSY Special
Projects, NREGP,
Kudumbasree
Watershed and Soil and
water conservation:
IWDP/ Hariyali
WASH: Clean Kerala
Mission, TSP
Energy conservation:
ANERT
UIDSMT
JNURM

168
Environmental Assessment Report
Kerala Local Government Strengthening Project
Suchitwa Mission, Thiruvananthapuram
processing applications for these services. If the service is not delivered with in the specified
time limit, the applicant can bring it to the notice of Municipal Secretary and Chairman. The
citizen charter booklet was provided to all households in the municipality.
Computerisation and Governance reforms, Tanalur Grama Panchayat:
Computerisation of Tanalur Grama Panchayat was supplemented by several other initiatives to
improve the service delivery of the Grama Panchayat. The Pachayat conducted a detailed
socio economic survey , where in details of each land parcel(with details of land use, type and
use of buildings), household (details of members, occupation, asset ownership, amenities,
details of agriculture, animal husbandry, details of water supply and sanitation facilities,
income sources, birth and death in last one year, health status, details of earning members
who are working abroad, participation in Grama Sabha, details of govt schemes from which the
household has benefited) and commercial establishments/ enterprises (type , asset ownership,
details of licenses, employees etc) were collected and collated to a database. Computerisation
and automation of certain business processes was another initiative. Any citizen, who submits
a grievance or application for availing a specific service offered by the Grama Panchayat,
receives a receipt which will specify the application number and time limit for processing the
application. The status of the application and details of officials responsible for addressing the
grievance can be tracked by entering the application number in information kiosk.
Private Sector Partnerships
Investors meet, Mullassery Block Panchayat:
In the case of Mullassery Block panchayat in Thrissur district, majority of the households have
at least one earning member who is employed abroad. The Block panchayat organized an
investor‟s meet to mobilize their support for promoting small and medium enterprises in the
Block panchayat. 30 small enterprises were started with support mobilised through this event.
Partnership with NRIs and local NGO (Vikas Trust), Thalikulam Grama Panchayat :
The Panchayat has been able to successfully mobilize financial support from an NRI
businessman who hail from this Panchayat for various development interventions. Vikas trust,
an NGO floated by one of them is also complementing and supporting these interventions. The
Panchayat conducted an employability survey in the Panchayat and found that there are at
least three thousand people who need a job. The Panchayat organized job oriented training
programmes for them and 2000 beneficiaries have been employed so far. The panchayat also
mobilized additional financial resources from the trust for implementing housing schemes.
Drinking water supply by Industries, Elor Grama Panchayat:
Elor Panchayat faced severe drinking water shortage due to the pollution of ground water
caused by four industries in the Panchayat. 2144 families in 6 wards of the Panchyat are
provided with free drinking water supply by pooling in financial resources from the four
industries. The FACT‟s water treatment plant supplies treated potable water to these areas.
The fixed cost on establishing the water supply network and the recurring cost on pumping,

169
Chapter 4
Environmental Analysis of Developmental Interventions at Local Level
Suchitwa Mission, Thiruvananthapuram
treating and supplying are met by these industries.
Cataract camps, Perinthalmanna Municipality:
The Perinthalmanna municipality successfully organized a campaign to identify and support the
treatment of those affected by Cataract. The project was implemented with the support of
Kudumbasree members (who facilitated the initial screening of beneficiaries),Aalsalam
hospital, (a private ophthalmic hospital in Perinthalmanna who facilitated the detailed check-
up and operations), and Rotary Club (who provided financial support for the entire
programme). 2000 people benefited from this scheme.
Resource Mobilization
Construction of bus stand cum shopping complex, Koilandy Municipality:
The bus stand cum shopping complex was constructed at a total cost of INR 6.65 crores. The
entire cost of the project was moblised by renting out the 79 shop rooms in the shopping
complex for office/ commercial spaces in advance and collecting the caution deposit. The
Municipality has constructed a public market as well. The LSG now owns approximately 6000 sq
m of built up area, which is a major source of recurring income. In the year 2007-08 , the
income from assets (rent on land and buildings, markets and comfort station, sand auction)
owned by the Municipality was INR 3,51,40,000, which is roughly 30% of the total municipal
budget.
Chairman‟s relief fund, Perinthalmanna Municipality:
When ever a major development activitey is implemented, for instance a major road, or bye
pass road, industrial park etc- the land vale in the fringe areas of the project generally
appreciates. So the Municipality is proposing to levy a one time „Development tax‟ on
beneficiaries of major projects. The money will be used for other development activities
through the Chairman‟s Relief fund.
Carbon Trading, Perinthalmanna Municipality:
As part of the Total Sanitation Project, the municipality implemented the Integrated Low Cost
Sanitation project where in approximately 800 toilets which are attached to bio gas plants,
were constructed. It is proposed to trade the carbon saving from this initiative.
Housing Scheme in Tanalur Grama Panchayat:
The project was conceptualized when the Panchayat received more applications for housing
schemes than it could possibility fund through the annual plan. The Panchayat obtained special
sanction for mobilizing additional resources through bank loan. 470 houses were constructed in
the last five years through this scheme. The Panchayat is presently repaying the principal
through annual installments from their development fund and the general purpose fund. The
interest on the loan is borne by the beneficiaries. This project was a precursor of the
ambitious EMS housing scheme mooted by state govt this year
Mobilising Technical Support

170
Environmental Assessment Report
Kerala Local Government Strengthening Project
Suchitwa Mission, Thiruvananthapuram
Inadequacy of technical support is an excuse oft-quoted for delay in development and
implementation of various development projects. But on the contrary, several of the LSGIs
mobilized technical support from with in the LSGI or from various departments or from
resource institutions of repute. To quote a few:
Indian Institute of Management, Kozhikode developed the business plan for Subhiksha,
the Women‟s cooperative movement implemented by Perambra Block Panchayat.
Integrated Rural Technology Centre (IRTC) Palakkad provided technical support for
development of watershed master plan for Perambra Block.
IRTC Palakkad provided technical supported to several LSGIs for implementation of the
Solid Waste management projects
Mythri is providing technical support for the drainage and sewerage network design for
Koilandy Municipality
The inland fisheries related initiatives of Kumbalangi Grama Panchayat are supported
by ADAC.
Livelihood Enhancement and Diversification
Local Employment Directory, Perinthalmanna Municipality:
The Municipality conducted a survey to identify the local employment opportunities in the
region. For instance, the Municipality has 20 private hospitals, which can provide employment
for local population. It was found that approximately 1000 jobs are available locally. Based for
the survey, the municipality facilitated skill development programmes for gainful employment
in these sectors. 330 women have been already employed through this initiative.
Subhiksha Project, Perambra Block panchayat:
Subhiksha, is a Women Cooperative Producing Value Added Coconut Products. The project was
developed and implemented by Perambra Block Panchayat with technical support from Indian
Institute of Management, Kozhikode. The project was supported under the SGSY scheme and
had a funding of central and state contribution of INR 8 crore, INR 4 crore mobilized through
bank loans, besides the beneficiary contribution. The project has successfully established more
than 500 small units benefiting around 7000 women below poverty line. The units are engaged
in production and marketing 41 value added items based on coconut. The production chain and
activities of these units are interconnected. 23 units procure coconut directly from farmers.
Husk is taken to units dealing in mechanized fibre production and the coir pith from these
units are used for producing manure through composting. Coconut is taken to copra drier unit.
The coconut water is given to units producing squash, vinegar etc. Dried copra is handed over
to coconut oil producing units. Shell is given to units specializing in charcoal production. In
addition to selling coconut oil, a part of it is used for producing soap. Parallel to this, there
are unit which produce value added food products from coconut, like coconut pickle, jam,
candy, tender coconut cake, hair oil, wholesome tender coconut as a snowball etc. Subhiksha
has entered into an agreement with Rubco to extract virgin oil from undried coconut. In
addition, one of the units produces coconut saplings. The women‟s collectives take up door to
door marketing of these value added products.

171
Chapter 4
Environmental Analysis of Developmental Interventions at Local Level
Suchitwa Mission, Thiruvananthapuram
Community Participation
Aarogya Sena, Koilandy Municipality:
Koilandy Municipality has trained a group of Community Health Volunteers or Aarogya Sena‟s at
ward level. The volunteers are involved in monitoring of preparedness level against health
hazards as well as in awareness generation programmes related to water, sanitation and
hygiene.
Jana Maithri Suraksha , Perinthalmanna Municipality:
This state level community policing initiative is being implemented in Perinthalmanna
Municipality. The project envisages the formation of people‟s committees comprising of
elected representatives and heads of educational institutions at the police station level for
implementing the scheme. The committees would help law enforcers devise location-specific
policing strategies. Beats comprising 500 to 1,000 households with a police officer of either
head-constable or assistant sub-inspector rank interacting with the members have been
formed. Any citizen can contact the beat officer for help, round the clock. There has been
considerable reduction in the crime rate in the Municipal area post implementation of this
project.
Water Supply, Sanitation and Hygiene
Kudumbasree in Solid Waste Management:
Solid waste collection enterprise initiated by Kudumbashree is highly beneficial not only to
solve the problem of environmental pollution, but also as a means of livelihood to the
urban/rural poor especially women, and without any additional financial burden to the urban
local bodies. For collecting waste from the households, the entrepreneurs charge Rs 30/- per
month from each household. The women entrepreneurs engaged in solid waste collection are
earning Rs 3,000 to Rs 5,000 per month. Now 155 Kudumbashree solid waste management
groups are in operation in 18 urban local bodies in the State. In addition to door to door
collection in Urban/ semi urban areas, units which handle waste from market places and from
meat/chicken stalls are also coming up.
Natural Resource Management
Watershed Master Plan, Perambra Block panchayat:
To operationalise the government guideline for preparation of an integrated watershed master
plan, the Perambra Block Panchayat got in touch with IRTC for technical hand holding. IRTC
conducted a ToT programme for 101 master trainers from different walks of life like farmers,
activists, politicians, students, professionals, officials and elected representatives for 4 days.
The master trainers in turn facilitated the preparation of the map delineating 46 micro
watersheds and training of selected persons from each watershed at the local level. Two
survey teams of seven persons each were formed for each micro watershed. A Watershed
Committee as formed at the level of the Village Panchayat. Community moblisation

172
Environmental Assessment Report
Kerala Local Government Strengthening Project
Suchitwa Mission, Thiruvananthapuram
for watershed planning was facilitated by these filed level volunteers. This included a special
Grama Sabhas, discussion in school assemblies, banners and posters, conduct of Jala Jatha etc.
Special surveys of gullies and streams and transect walks were conducted. Intensive meetings
of Neighbourhood Groups of farmers were organized and Watershed Mahasabha constituted in
each micro watershed. Action plans for watershed based interventions were prepared. With
expert interventions in respect of agriculture, fisheries, soil conservation and special
problems, the watershed master plan was finalized. The whole exercise took 16 1/2 months. In
order to plan and implement the programmes, farmers‟ group called Karshaka Koottaima has
been formed. The plans are to be implemented converging funds from the local governments,
State Government and Central Government.
Jala Samrithi Nagaram Campaign, Koilandy Municipality:
The municipality organized “Jala samrithi nagaram” campaign for promoting water
conservation. One lakh mazhakuzhi (water recharge structures) as well as several tadayana
(check dam) were constructed. Based on the request from municipality, 11 private ponds were
handed over to LSGI to be converted to rainwater harvesting structures. Cleaning up of canals
and streams were also taken up as a priority activity. Social forestry initiatives were also
campaigned for. The concept of “jaiva veli”- compound wall with local plant varieties -was
promoted. Several other campaigns - Mazha utsavam, tiruvatira njattuvelaye swikarikkuka ,
kaliyane sweekarikkuka were orgnised to soil and water conservation practices. Studies show
that there is a 4% increase in ground water level post implementation of the water
conservation initiatives.
4.5.1.3. Environmental issues
The major environmental issues identified by the LSGIs during the survey are listed below.
Issue Root cause
Water logging Filling up of canals, ponds and wetlands affecting the natural
drainage pattern.
Siltation in canals and water bodies.
Absence of storm water drainage network
Wetland conversion Construction of roads, houses and other buildings
Solid waste management Littering in public places
Dumping of solid waste into water bodies
Problems in identifying solid waste management sites
Inadequate capacity and efficiency of collection
No facilities or inadequate capacity for processing bio degradable
waste from market places, slaughter houses, meat and chicken
stalls etc
No facility for handling plastic waste, construction debris
No facility for handing bio-medical waste

173
Chapter 4
Environmental Analysis of Developmental Interventions at Local Level
Suchitwa Mission, Thiruvananthapuram
Shortage of drinking
water
Salinity intrusion in coastal areas
Ground water contamination from polluting industries
Depletion of ground water sources
Depletion and contamination of surface water sources
Inadequacy or absence of water supply network
Use of pesticides contaminating water sources
Discharge of industrial and urban waste into water bodies
Erosion Coastal erosion
Bank erosion in rivers, streams, rivulets and canals
Top soil erosion due to deforestation
Mining and quarrying Sand mining from rivers
Mining of granite and laterite
Mining of hillocks for soil
4.5.1.4. Planning and implementation of developmental activities
Development interventions are identified through needs assessments done at Grama Sabhas.
Most of the approved projects emanated from the needs articulated at the Grama Sabhas. In
general, most of the LSGIs were able to organize Grama Sabhas at the stipulated intervals. Ten
to fifteen percent participation was reported. Inadequate capacity of the Grama Sabhas and
working groups to address technical queries related to sector interventions is a lacuna.
4.5.1.5. Reasons for deviations in plan implementation
The following are the typical reasons for deviations in project implementation.
Process related:
Changes in projected number of beneficiaries – if a scheme doesn‟t attract enough
number of beneficiaries or more number of people apply for a scheme.
Delays in approval of the plan by TAG/ DPC
Inconsistency in recommendations/ guidelines/ executive orders and their suitability
for local conditions
Delays in finalization of departmental projects and fund allocation. This is extremely
important in sectors like agriculture, aquaculture etc were activities are seasonal and
timeliness of intervention is crucial.
Need for flexible guidelines while implementing pilot innovative projects and local
specific projects
Need for more devolution of power in deciding sectoral priorities and fund allocation
Lack of coordination in cases of projects implemented by other departments like
Revenue, Tourism & Irrigation departments, as well as lack of coordination between
interventions of three tier panchayats.
Too many audits and trivial audit objections
Code of conduct after the declaration of elections (national, state or local elections) or
bye-elections cause delay in implementation

174
Environmental Assessment Report
Kerala Local Government Strengthening Project
Suchitwa Mission, Thiruvananthapuram
Resource related
Lack of funds
Changes in subsidy norms
Capacity related:
Inadequacy of technical support for sectoral interventions.
Dearth of adequately qualified/ trained staff has been a common grievance in both
ULBs and three tier panchayats (ex: sharing of agricultural officers/engineers/other
technical staff between Panchayats, posting of engineers from irrigation department on
deputation in village Panchayats, lack of staff with expertise in Town Planning in
Municipalities, frequent staff changes).