THE KENYA POWER LIGHTING COMPANY LIMITED ... - · PDF fileUPDATED RETAIL TARIFFS APPLICATION...
59
THE KENYA POWER & LIGHTING COMPANY LIMITED UPDATED RETAIL TARIFFS APPLICATION TO ENERGY REGULATORY COMMISSION INITIAL SUBMISSION ON 4 TH FEBRUARY 2011 UPDATED VERSION DATED 7 TH FEBRUARY 2013
-
Upload
truongngoc -
Category
Documents
-
view
223 -
download
0
Transcript of THE KENYA POWER LIGHTING COMPANY LIMITED ... - · PDF fileUPDATED RETAIL TARIFFS APPLICATION...
THE KENYA POWER & LIGHTING COMPANY LIMITED
UPDATED RETAIL TARIFFS APPLICATION
TO
ENERGY REGULATORY COMMISSION
INITIAL SUBMISSION ON 4TH FEBRUARY 2011
UPDATED VERSION DATED 7TH FEBRUARY 2013

i
TABLE OF CONTENTS
1. ............ Performance of the Company since the last Tariffs Review 1 1.1. ......... Introduction 1 2. ............ Power Supply Situation 2 2.1. ......... Projected Demand/Medium –Term Committed Generation Projects 3 3. ............ Revenue Requirements for Committed Power plants 4 3.1. ......... Committed KenGen Power Plants 4 3.2. ......... Outstanding existing bulk PPA issues needing re‐negotiation between KPLC and
KenGen 4 3.3. ......... Committed Independent Power Producers Power Plants 5 4. ............ Revenue Requirements for Transmission and Distribution Business 5 4.1. ......... Historical Expansions of Transmission and Distribution Network 5 4.2. ......... Number of Customers per Tariff Category 5 4.3. ......... Staff Analysis 5 4.4. ......... System Losses Projections 6 4.5. ......... Transmission and Distribution Investment Projects 7 4.6. ......... T&D Operations and Maintenance Costs 7 4.7. ......... Existing Rural Electrification Schemes Operating Framework 8 4.8. ......... Transmission and Distribution Wheeling Arrangement 8 4.9. ......... Proposal for Low Voltage System Expansion 9 4.10. ....... Proposal by ERC to Implement a Hydro‐Risk Mitigation Fund 10 4.11. ....... Proposed implementation of Time of use tariffs 11 4.12. ....... Way leave Levies & charges demand by Government Institutions 11 4.13. ....... Other Proposed Government Institutions Levies 12 4.14. ....... Rate Asset Base and Revenue Requirement 13 4.15. ....... Average Revenue Requirement Per Unit of Electricity Sales 14 4.16. ....... Breakdown of Average per Unit Projected Retail Tariffs 15 4.17. ....... Financial Projections 15 4.17.1. .... Energy Balance 15 4.17.2. .... Projected Financial Results 16 4.18. ....... Pre‐paid Metering 17 5. ............ Tariff Design 17 5.1. ......... Proposed Retail Tariff Rates 17 5.2. ......... Proposed Retail Tariffs by Customer Categories 18 5.3. ......... Proposed changes in FCC, FERFA and INFA formulae 19 5.4. ......... Effective Date 20 6. ............ Conclusion and Recommendation 20 6.1. ......... Conclusion 20 6.2. ......... Recommendation 20 APPENDICES 21 Appendix 1: Proposed Schedule of Tariffs & Rates 2013 21 Appendix 2 – Financial Projections Assumptions 44 Appendix 3: Tables 15, 16, 17, 18, 19 and 20 (as described below) 47

ii
LIST OF TABLES Table 1 Financial Projection Vs. Actual Performance 1 Table 2: Committed Generation Projects 3 Table 3: Committed KenGen Power Plants Charge Rates 4 Table 4: IPP Committed Power Plants Charge Rates 5 Table 5: Staff Analysis (Permanent & Contract) 6 Table 6: Customer Power Connection Costs Vs Capital Contribution 2007/08 to
2011/12 9 Table 7: Wayleave Levies Demanded by Local Authorities and GoK Agencies 11 Table 8: Total Revenue Requirement for KPLC 13 Table 9: KPLC Revenue Requirement (In September 2012 prices) KShs/kWh 14 Table 10: Breakdown of Revenue Requirement in KShs/kWh (in Sept 2012 prices) 15 Table 11: Projected Financial Performance 2012/13 to 2015/16 16 Table 12: Proposed Retail Tariff Rates 17 Table 13: Distribution of Proposed Tariff Revenue Requirement Yield Change in
Percentage Per Applicable Period 18 Table 14: CBK Mean Exchange Rates of Major Currencies 19 Table 15: Number of customers by Tariff Categories 47 Table 16: Medium Term Capacity Balance for Average Hydrology (MW) 48 Table 17: Medium Term Energy Balance for Average hydrology (GWh) 50 Table 18: Transmission and Distribution Investment Plan 52 Table 19: Transmission and Distribution Lines, Circuit Lengths in Kilometres 54 Table 20: Transformers in Service, Total Installed Capacity in MVA 55

iii
Acronyms and abbreviations EDF Electricitè De France EPZ Export Processing Zone ERC Energy Regulatory Commission F.I.T. Feed‐in‐ Tariff FCC Fuel Cost Charge FERFA Foreign Exchange Rate Fluctuation Adjustment FOM fixed operation and Maintenance G.T. Gas Turbine GoK Government of Kenya GWh Gigawatt hour IPPs Independent Power Producers: KEEP Kenya Electricity Expansion Project KenGen Kenya Electricity Generating Company KETRACO Kenya Electricity Transmission Company KPLC The Kenya Power & Lighting Company Limited kV Kilovolt kVA Kilovolt Ampere kWh Kilowatt Hour kW‐yr Kilowatts per year LCPD Least Cost Power Development LRMC Long Run Marginal Cost MSD Medium Speed Diesel MVA mega Volts Amperes MW Mega Watt NBV Net Business Value NDZ New Development Zones O&M Operations and Maintenance Opex Operation Expenditure p.a. Per Annum PPAs Power Purchase Agreements PRG Partial Risk Guarantee RAB Regulated Rate Base RE Rural Electrification REA Rural Electrification Authority REP Rural Electrification Programme T&D Transmission & Distribution V Voltage VOM Variable operation and Maintenance
1
1. Performance of the Company since the last Tariffs Review
1.1. Introduction
This submission is an update of the Retail Tariff Review Application dated 4th February
2011 and submitted to the Energy Regulatory Commission (ERC) on the same date, in accordance with the agreement reached at various meetings between the Government of Kenya, KPLC and the Commission, to enable the Commission process our requests for retail electricity tariff review for the tariff control period 2011/12 to 2013/14 (now to cover 2012/13 to 2015/16).
KPLC purchases electric power capacity and/or energy from the Kenya Electricity Generating Company Limited (KenGen) and six Independent Power Producers (IPPs), who currently are, Iberafrica Power (EA), Tsavo Power Company Limited (TPC), Rabai Power Limited, OrPower4 Inc. (OrPower4), Mumias Sugar Company Limited and Imenti Tea Factory Small hydros. The Company also purchases energy from Tanzania Electricity Supply Company Limited (TANESCO) and Uganda Electricity Transmission Company Limited (UETCL) and Ethiopian Electric Power Corporation (EEPCO). The purchase of generating capacity and/or energy from all of these generators is made under Power Purchase Agreements (PPAs) approved by ERC.
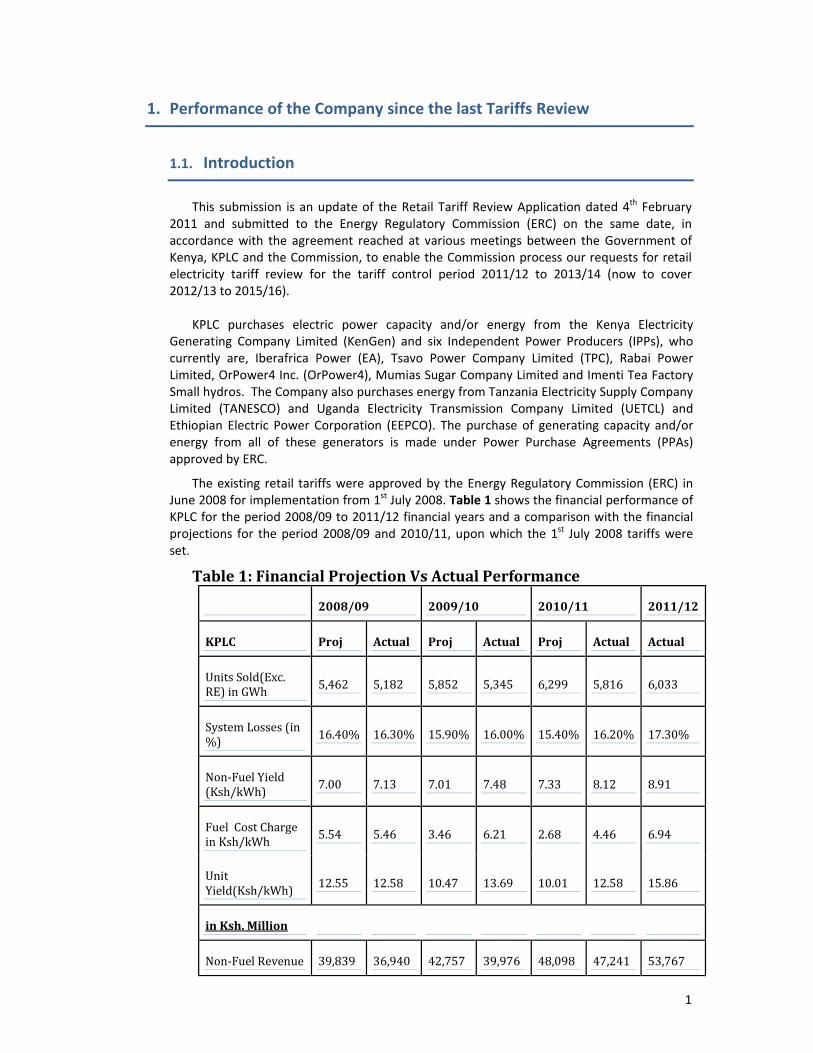
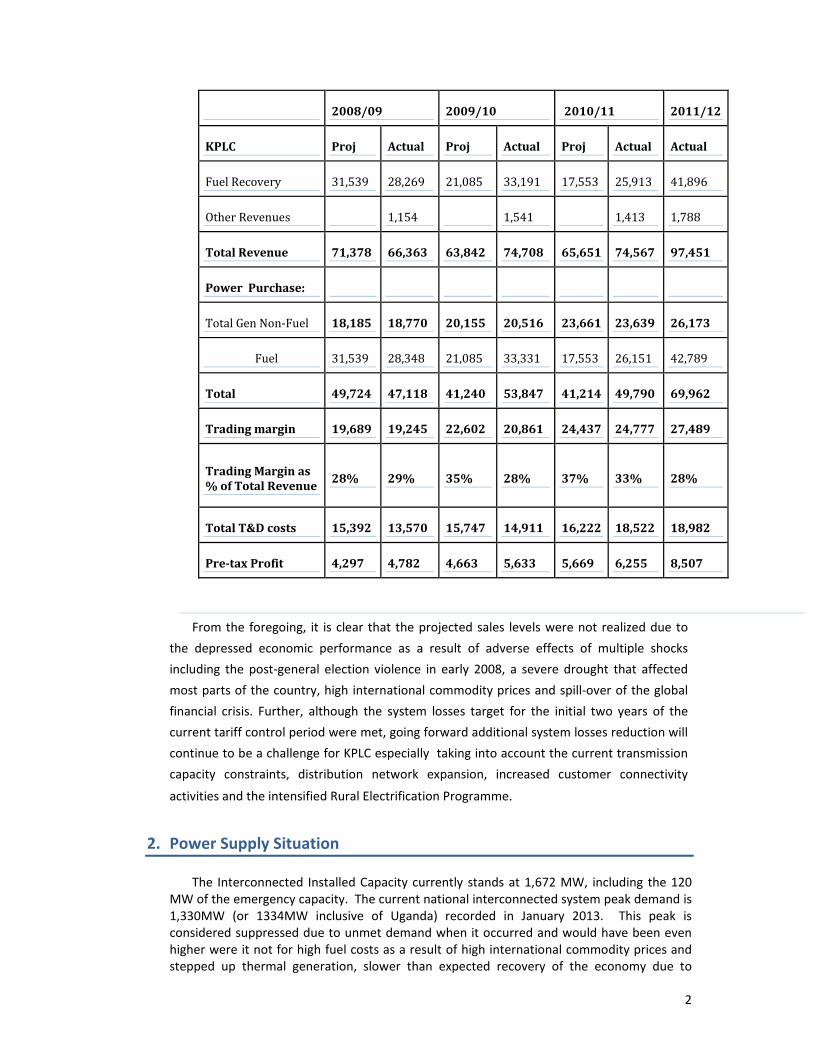
The existing retail tariffs were approved by the Energy Regulatory Commission (ERC) in June 2008 for implementation from 1st July 2008. Table 1 shows the financial performance of KPLC for the period 2008/09 to 2011/12 financial years and a comparison with the financial projections for the period 2008/09 and 2010/11, upon which the 1st July 2008 tariffs were set.
Table 1: Financial Projection Vs Actual Performance
2008/09 2009/10 2010/11 2011/12
KPLC Proj Actual Proj Actual Proj Actual Actual
Units Sold(Exc. RE) in GWh 5,462 5,182 5,852 5,345 6,299 5,816 6,033
System Losses (in %) 16.40% 16.30% 15.90% 16.00% 15.40% 16.20% 17.30%
Non‐Fuel Yield (Ksh/kWh) 7.00 7.13 7.01 7.48 7.33 8.12 8.91
Fuel Cost Charge in Ksh/kWh 5.54 5.46 3.46 6.21 2.68 4.46 6.94
Unit Yield(Ksh/kWh) 12.55 12.58 10.47 13.69 10.01 12.58 15.86
in Ksh. Million
Non‐Fuel Revenue 39,839 36,940 42,757 39,976 48,098 47,241 53,767
2
2008/09 2009/10 2010/11 2011/12
KPLC Proj Actual Proj Actual Proj Actual Actual
Fuel Recovery 31,539 28,269 21,085 33,191 17,553 25,913 41,896
Other Revenues 1,154 1,541 1,413 1,788
Total Revenue 71,378 66,363 63,842 74,708 65,651 74,567 97,451
Power Purchase:
Total Gen Non‐Fuel 18,185 18,770 20,155 20,516 23,661 23,639 26,173
Fuel 31,539 28,348 21,085 33,331 17,553 26,151 42,789
Total 49,724 47,118 41,240 53,847 41,214 49,790 69,962
Trading margin 19,689 19,245 22,602 20,861 24,437 24,777 27,489
Trading Margin as % of Total Revenue
28% 29% 35% 28% 37% 33% 28%
Total T&D costs 15,392 13,570 15,747 14,911 16,222 18,522 18,982
Pretax Profit 4,297 4,782 4,663 5,633 5,669 6,255 8,507
From the foregoing, it is clear that the projected sales levels were not realized due to
the depressed economic performance as a result of adverse effects of multiple shocks
including the post‐general election violence in early 2008, a severe drought that affected
most parts of the country, high international commodity prices and spill‐over of the global
financial crisis. Further, although the system losses target for the initial two years of the
current tariff control period were met, going forward additional system losses reduction will
continue to be a challenge for KPLC especially taking into account the current transmission
capacity constraints, distribution network expansion, increased customer connectivity
activities and the intensified Rural Electrification Programme.
2. Power Supply Situation
The Interconnected Installed Capacity currently stands at 1,672 MW, including the 120 MW of the emergency capacity. The current national interconnected system peak demand is 1,330MW (or 1334MW inclusive of Uganda) recorded in January 2013. This peak is considered suppressed due to unmet demand when it occurred and would have been even higher were it not for high fuel costs as a result of high international commodity prices and stepped up thermal generation, slower than expected recovery of the economy due to

3
multiple local factors and spillover of the global financial crisis and some customers being out of supply due to power outages and load shedding. There was no reserve margin when the peak demand was recorded but measures are on‐going to fast‐track implementation of generation projects aimed at boosting the reserve margin to at least 15% which is necessary to take care of unplanned system outages. The lack of reserve margin continues to expose the power system to instability and national blackouts in the event of unplanned outages of larger generating units.
Several committed power generation projects are currently under implementation. These will displace the 120 MW of emergency power, improve security of supply, reduce cost impact to customers and assist in meeting the forecast demand in the medium to long term.
2.1. Projected Demand/Medium –Term Committed Generation Projects
The overall generation expansion projects for the next five years will entail an additional 1,248 MW to meet growth in electricity demand which has averaged 5% annually in the last 4 years. Under the Government medium term‐ fiscal framework, real gross domestic product is expected to have increased by between 3.5% and 4.5% in 2012 calendar year compared to the World Bank forecast of 4.3%. KPLC estimates that in 2012/13 electricity demand growth rate will be 4% based on trends recorded upto December 2012 and the economic growth forecast for the current financial year riding on on‐going economic recovery. In the years 2013/14, 2014/15 and 2015/16 the demand growth rate is assumed to be 6% per year.
As shown in Table 2, generation capacity of 851MW is planned to be developed by IPPs
and 397MW by KenGen, respectively. The plants are expected to be commissioned between 2013 and 2016.
Table 2: Committed Generation Projects
Project Type Capacity (MW)
Est. Commissioning Date
KENGEN
Wellhead Units Geothermal 10 Jun‐2013
Wellhead Units Geothermal 15 Dec‐2013
Wellhead Units Geothermal 40 Dec‐2014
Ngong phase II Wind 13.6 Jul‐2014
Ngong 1 phase II Wind 6.8 Jul‐2014
Kindaruma 3rd unit Hydro 32 June 2012‐June 2013
Olkaria IV Geothermal 140 Sep‐2014
Olkaria 1 –Life Extension Geothermal 140 Jun‐2014
Sub‐Total 397
IPPs
Athi River 1 Diesel 80 Jan‐2014
Athi River 2 Diesel 83 Feb‐2014
Thika 1 Diesel 87 Jun‐2013
Lake Turkana Wind 300 Jul‐2015
Aeolus wind Wind 60 Jan‐2015
Orpower4 Geothermal 36 Mar‐2013
4
Project Type Capacity (MW)
Est. Commissioning Date
Orpower4 Geothermal 16 Mar‐2014
Kipeto Wind 100 Jul‐2015
Prunus Wind 50 Jul‐2015
Kwale Sugar Co. Ltd Biomass 18 Dec‐2014
Small Hydros (Genpro, Gura and Hydel) hydro 21 Jul‐2015
Sub‐ Total 851
Total 1,248
3. Revenue Requirements for Committed Power plants
3.1. Committed KenGen Power Plants
The Least Cost Power Development Plan has committed KenGen plants that are expected to be commissioned in the Review Period and whose estimated charge rates would entail a review of the KPLC revenue requirement so as to meet the incremental power purchase cost for the next tariff control period as shown in Table 3.
Table 3: Committed KenGen Power Plants Charge Rates
Cap. Charge FOM VOM
Capacity KSh/kW‐yr Comm.
KSh/kW‐yr
KSh/kWh
Plant MW Year (escal.) (escal.)
1 Olkaria 1‐ Extension (Units & 5) 140 19,463 Jun‐14 5,551 0.9252
2 Olkaria 1V 140 22,156 Sep‐14 5,536 0.9282
3 Olkaria 1 Interim Jun‐14 3.2562
Energy Plants in US$/kWh
4 Well heads units 75 Jun‐11 0.085
Kshs/kWh
Esc Non‐Escal Total
5 Sangoro 20 1.60 5.189 6.789
6 Eburru Geothermal 2.2 2.00 5.44 7.44
7 Ngong Phase II* 13.6 1.30 4.79 6.09
8 Ngong 1 Phase II* 6.8 1.30 4.79 6.09
*The rate assumed for Ngong phase II are those of existing 5MW
3.2. Outstanding existing bulk PPA issues needing re‐negotiation between KPLC and KenGen
This application does not take into account the outstanding issues between KPLC and
KenGen on existing PPAs. KPLC proposes the Commission to issue advice and guidance on the way forward.
5
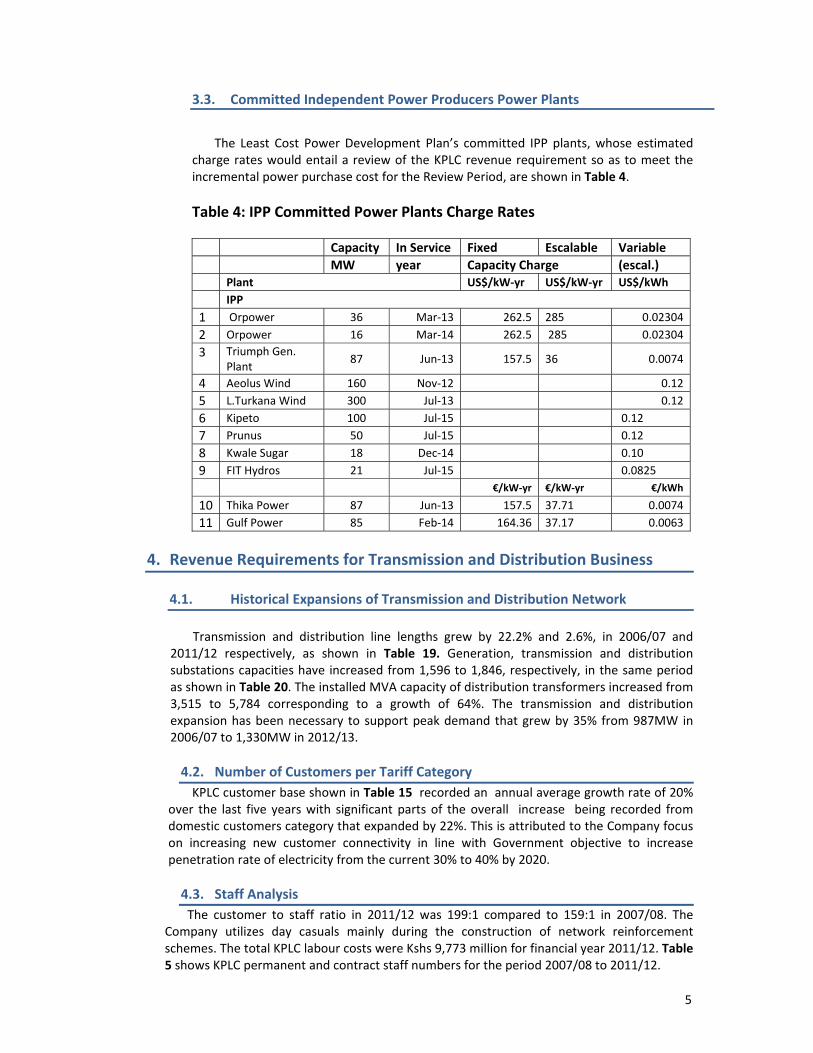
3.3. Committed Independent Power Producers Power Plants
The Least Cost Power Development Plan’s committed IPP plants, whose estimated
charge rates would entail a review of the KPLC revenue requirement so as to meet the incremental power purchase cost for the Review Period, are shown in Table 4.
Table 4: IPP Committed Power Plants Charge Rates
Capacity In Service Fixed Escalable Variable MW year Capacity Charge (escal.) Plant US$/kW‐yr US$/kW‐yr US$/kWh IPP 1 Orpower 36 Mar‐13 262.5 285 0.02304 2 Orpower 16 Mar‐14 262.5 285 0.02304 3 Triumph Gen.
Plant 87 Jun‐13 157.5 36 0.0074
4 Aeolus Wind 160 Nov‐12 0.12 5 L.Turkana Wind 300 Jul‐13 0.12 6 Kipeto 100 Jul‐15 0.12 7 Prunus 50 Jul‐15 0.12 8 Kwale Sugar 18 Dec‐14 0.10 9 FIT Hydros 21 Jul‐15 0.0825 €/kW‐yr €/kW‐yr €/kWh
10 Thika Power 87 Jun‐13 157.5 37.71 0.0074 11 Gulf Power 85 Feb‐14 164.36 37.17 0.0063
4. Revenue Requirements for Transmission and Distribution Business 4.1. Historical Expansions of Transmission and Distribution Network
Transmission and distribution line lengths grew by 22.2% and 2.6%, in 2006/07 and 2011/12 respectively, as shown in Table 19. Generation, transmission and distribution substations capacities have increased from 1,596 to 1,846, respectively, in the same period as shown in Table 20. The installed MVA capacity of distribution transformers increased from 3,515 to 5,784 corresponding to a growth of 64%. The transmission and distribution expansion has been necessary to support peak demand that grew by 35% from 987MW in 2006/07 to 1,330MW in 2012/13. 4.2. Number of Customers per Tariff Category KPLC customer base shown in Table 15 recorded an annual average growth rate of 20%
over the last five years with significant parts of the overall increase being recorded from domestic customers category that expanded by 22%. This is attributed to the Company focus on increasing new customer connectivity in line with Government objective to increase penetration rate of electricity from the current 30% to 40% by 2020.
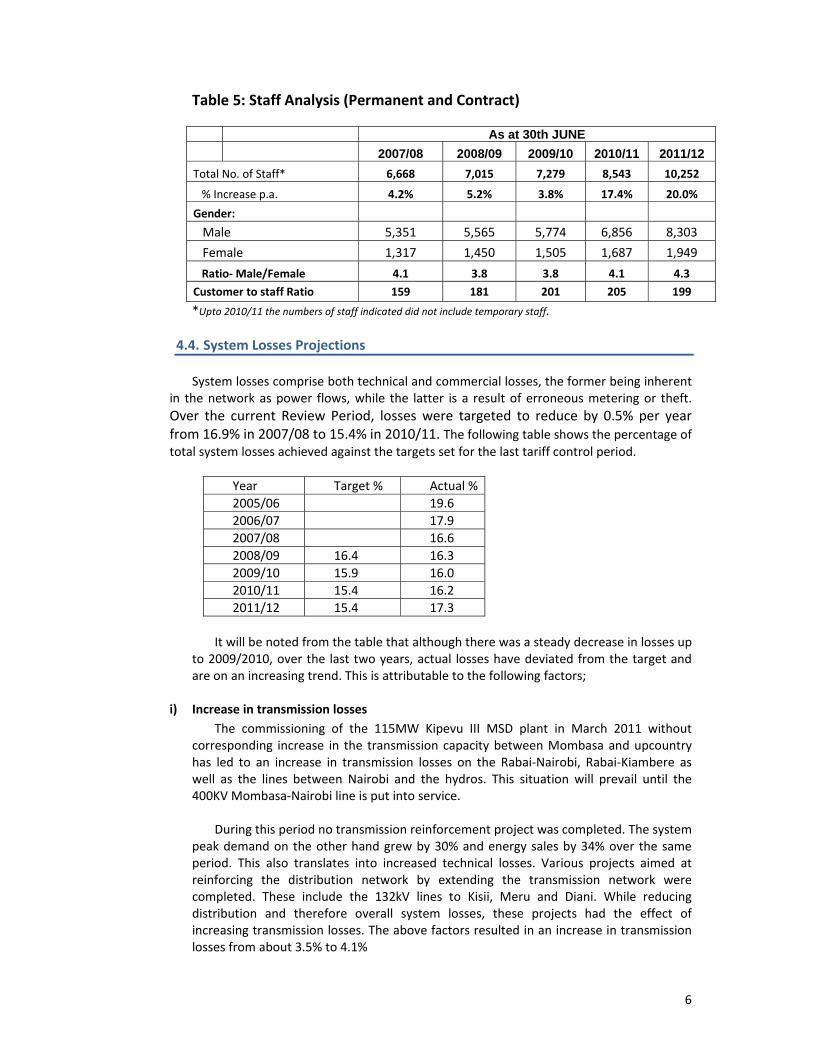
4.3. Staff Analysis The customer to staff ratio in 2011/12 was 199:1 compared to 159:1 in 2007/08. The
Company utilizes day casuals mainly during the construction of network reinforcement schemes. The total KPLC labour costs were Kshs 9,773 million for financial year 2011/12. Table 5 shows KPLC permanent and contract staff numbers for the period 2007/08 to 2011/12.
6
Table 5: Staff Analysis (Permanent and Contract)
As at 30th JUNE 2007/08 2008/09 2009/10 2010/11 2011/12 Total No. of Staff* 6,668 7,015 7,279 8,543 10,252
% Increase p.a. 4.2% 5.2% 3.8% 17.4% 20.0%
Gender: Male 5,351 5,565 5,774 6,856 8,303
Female 1,317 1,450 1,505 1,687 1,949
Ratio‐ Male/Female 4.1 3.8 3.8 4.1 4.3
Customer to staff Ratio 159 181 201 205 199
*Upto 2010/11 the numbers of staff indicated did not include temporary staff. 4.4. System Losses Projections
System losses comprise both technical and commercial losses, the former being inherent in the network as power flows, while the latter is a result of erroneous metering or theft. Over the current Review Period, losses were targeted to reduce by 0.5% per year from 16.9% in 2007/08 to 15.4% in 2010/11. The following table shows the percentage of total system losses achieved against the targets set for the last tariff control period.
Year Target % Actual %2005/06 19.6 2006/07 17.9 2007/08 16.62008/09 16.4 16.3 2009/10 15.9 16.0 2010/11 15.4 16.2 2011/12 15.4 17.3
It will be noted from the table that although there was a steady decrease in losses up
to 2009/2010, over the last two years, actual losses have deviated from the target and are on an increasing trend. This is attributable to the following factors;
i) Increase in transmission losses
The commissioning of the 115MW Kipevu III MSD plant in March 2011 without corresponding increase in the transmission capacity between Mombasa and upcountry has led to an increase in transmission losses on the Rabai‐Nairobi, Rabai‐Kiambere as well as the lines between Nairobi and the hydros. This situation will prevail until the 400KV Mombasa‐Nairobi line is put into service.
During this period no transmission reinforcement project was completed. The system
peak demand on the other hand grew by 30% and energy sales by 34% over the same period. This also translates into increased technical losses. Various projects aimed at reinforcing the distribution network by extending the transmission network were completed. These include the 132kV lines to Kisii, Meru and Diani. While reducing distribution and therefore overall system losses, these projects had the effect of increasing transmission losses. The above factors resulted in an increase in transmission losses from about 3.5% to 4.1%
7
ii) Accelerated connection of new customers The number of electricity customers has more than doubled from 924,324 at the end
of 2007/08 to 2,060,449 in 2011/12. The bulk of these new customers are on the low voltage network. Although a lot has been invested in the medium voltage system especially in the urban and peri‐urban areas, the increase in the low voltage losses due to extensions has exceeded the reduction in medium voltage losses due to these efforts.
iii) Extension of medium voltage network for rural electrification
The rapid expansion of the rural electrification program by REA has had two effects on the distribution losses
a) A large number of long medium voltage and low voltage lines b) A large number of lightly loaded distribution transformers which have high
percentage losses due to the proportion of fixed iron losses. This situation will continue until the demand in these areas pick up.
The above factors affecting transmission and distribution losses are expected to prevail over the next two to three years. Projects in the pipeline for reinforcing the transmission and distribution system will assist to contain the rise in losses but no reduction is expected before 2014/2015. The commissioning of the Mombasa‐Nairobi 400KV line, expected in the last quarter of 2013/2014 is expected to reduce transmission losses by about 0.2%. It is estimated that other reinforcement projects to be completed starting 2014/2015 will result into 0.2% reduction of losses annually resulting into the following trend.
Year Proposed System losses reduction path % 2011/12 (Actual) 17.3 2012/13 17.5 2013/14 17.32014/15 17.1 2015/16 16.9
4.5. Transmission and Distribution Investment Projects
Transmission and distribution medium‐term investment plan for the period 2012/13‐
2015/16 is as shown in Table 18. KPLC plans to spend US$ 210 million on electricity expansion project (KEEP) being the second distribution upgrade project, US$ 529.5 million in other distribution projects and support equipment and US$ 199.5 million on refurbishing the existing KPLC owned transmission system. At the same period, KETRACO and REA will implement new transmission and Rural Distribution network at an approximate cost of US$ 2.261 billion and US$ 1 billion, respectively with funding from the Government during the Review Period.
4.6. T&D Operations and Maintenance Costs
The operating and maintenance costs of providing transmission and distribution services
to improve power reliability and general efficiency for the next tariff control period has been assumed as follows;
i.) Current T&D costs provided in KPLC audited accounts has been assumed as base cost for the next tariff control period.

8
ii.) Additional operating and maintenance cost for existing transmission and distribution networks is assumed at 2.5% and 3.5% respectively, of the additional increase in gross investment plant in service value.
iii.) Rural Electrification Scheme is assumed to operate as described in Section 4.7 of this application.
iv.) Additional operating and maintenance cost for new Ketraco transmission lines assumed at 2.5% of the capital cost on the next year following the commissioning of a transmission project.
v.) Phasing of X‐factor of 50% in local inflation adjustment formulae since the introduction of the indices calculated using Geometric mean by Kenya National Bureau of Statistics was intended to remove the volatility of the inflation indices basket.
4.7. Existing Rural Electrification Schemes Operating Framework
Under the Energy Act 2006 that became operational in July 2007, the management of RE
schemes was fully transferred to the Rural Electrification Authority (REA) with effect from July 2008. The RE Schemes assets are owned by REA and KPLC signed a service level agreement to operate and maintain the RE distribution system. Further, the MOE directed that current revenues and attendant operation losses for RE schemes except off‐Grid isolated power plants to be assumed as factored in the retail tariffs, effective July 2008. Consequently, the revenue requirement necessary to cover transferred RE schemes operating and attendant losses estimated at Kshs 1,364 million as incurred in 2009/10 has been factored in the Application. However, if the actual operation and maintenance costs for RE‐Schemes exceed the current available revenue as a result of the accelerated rural electrification programme during the Review Period, then KPLC proposes to bill the Government for any deficits.
It is assumed that the REP levy shall remain at the current level of 5% of revenue from
electricity units sales and that if more funding of REA became necessary, the same would not be sourced from electricity customers.
Continued improvement in KPLC operations requires substantial investment in terms of
capital, and operation and maintenance expenditures. In order to access the resources necessary to support these investments, it is imperative that the Company remains financially viable. Efficiency improvement measures must therefore, be complemented by an opportunity to recover a fair return on investment while attracting new capital.
4.8. Transmission and Distribution Wheeling Arrangement
The Commission is undertaking a Cost of Service Study through SNC Lavalin Consultants which will inform the setting of both transmission and distribution network wheeling tariff. The planned introduction of Transmission and Distribution Wheeling tariffs is expected to be developed using annual revenue requirements of utilities mandated to provide transmission and distribution system capacity. KPLC opines that expected wheeling tariffs should be adequate to promote efficient use of the transmission and distribution system and attract continued investment in the power system. In the KPLC Retail Tariff Application dated 4th February 2011 which is pending with the Commission, we had proposed 2.5 % of Ketraco transmission lines Project cost taking into account the target commissioning dates as estimated operation and maintenance cost for Ketraco transmission assets as part of the revenue requirement. Given that the Cost of Service Study is almost complete, Transmission

9
and Distribution wheeling tariffs setting for this retail tariff control period may be guided by the outcome of this Study.
4.9. Proposal for Low Voltage System Expansion
The current electricity connection policy came into operation in 2004 in an effort to
facilitate accelerated connectivity country wide. As tabulated below, cumulative connections countrywide in the last 8 years (2004‐2011) grew from 735,000 to 2,060,449 representing 280% growth. New additions have increased annually from 48,949 in 2004/05 to 307,101 in 2011/12.
Year 2004/ 05
2005/ 06
2006/ 07
2007/08 2008/09 2009/10 2010/11 2011/12
Annual Connections
48,949 67,105 122,080 136,054 206,815 196,441 289,709 307,101
Total Connections
735,144 802,249 924,329 1,060,383 1,267,198 1,463,639 1,753,348 2,060,449
The driving policy was a fixed customer cost of Kshs 32,480 (Kshs 28,000+ 16% VAT of Kshs 4,480) and Kshs 44,080 (Kshs 38,000 +16% VAT of Ksh 6,080) for a single phase and a three phase connection, respectively, for those customers within 600 meters from existing transformers. In addition customers also pay refundable accounts deposit of Kshs. 2,500/= and Kshs. 5,000/= for single phase and three phase, respectively. This raises the total initial payments of single phase connection to Kshs 34,980/= and Kshs 49,080/= for three phase connection. At the inception of the policy, these charges were adequate to expand the LV network and connect customers within the 600 meters transformer coverage radius. Since then, the costs of materials, labour and transport have significantly increased progressively with key items’ prices over the last 5 years rising as follows:‐Diesel by 47%, Poles by 45%, Transformers by 100%, Copper and aluminium cables by 220%.
The aggregated impact of the above items’ price change would be to increase the
connection of service cost to Kshs 75,580 for single phase and Kshs 89,680 for a three phase connection inclusive of VAT. As shown in Table 6 below, the growing difference in actual cost and customer contributions has been met by Kenya Power. This cost to Kenya Power has risen from Kshs 1.05 Billion in 2007/08 to Kshs 7.5 Billion in 2011/12. Table 6: Customer Power Connection Costs Versus Capital Contribution 2007/08
to 2011/12
Year 2007/08 2008/09 2009/10 2010/11 2011/12 No of Connections 38,484 69,757 82,519 111,727 123,495 Actual connection costs Kshs m’ 2,392 4,870 6,233 9,846 11,856
Capital Contribution Kshs m’ 1,339 2,581 3,179 3,889 4,327 Net Costs/required Funding Kshs m’ 1,052 2,289 3,054 5,957 7,528
As a result, KPLC has had to divert funds borrowed or raised for critical capital projects
meant to improve the quality of power supply to meet part of the subsidy in projects whose return on investment are very long term. Some of the funds utilised included medium term loans of Shs. 7 billion and Shs. 10 billion in 2011. Currently, the Company is sustaining its operations with overdraft/short term facilities from banks which amount to about Shs.5.3 billion. Additionally, KPLC has fallen back on payments to material suppliers amounting to

10
KShs. 2.1 billion and has delayed payments to power suppliers by over 10 days beyond the contractual credit period
Kenya power is unable to sustain the financing to maintain the connection momentum which is one of the key economic drivers in Vision 2030 as it has heavily impacted on its liquidity and profitability (due to rising financial costs). The adverse impact of reduced liquidity and profitability will erode lenders’ confidence due to non‐compliance of existing financial covenants with World Bank and other multilateral financial institutions, some of which Kenya Power has already defaulted. Operations to maintain electricity supply will not be sustainable.
Section 56 of the Energy Act obligates licensees to construct, operate and maintain
suitable and sufficient distribution network to enable supply to be provided in the licence area. If the development of electricity network was being implemented in accordance with the Energy Act, applicants for new electricity connections would be within reasonable distances from the reticulation. Currently, it is a recognised fact that cost of new connections is prohibitive to most Kenyans. In order to continue with the current rate of new connections to increase electricity access to many Kenyans, KPLC requires additional revenue of Kshs 7.5 billion. Kenya Power therefore proposes the following to raise this amount;
i) To increase the connection charges for single phase connection with demand of less than
8KVA from the current Kshs 34,980 to Kshs 60,000; ii) Require that three phase customers pay full cost of extension; iii) Customers requiring more than 8KVA continue paying full cost of extension as is the
current practice; iv) The above measures will leave a deficit of approximately KShs 5,025 million per annum.
Kenya Power proposes that this amount be raised through a charge to electricity consumers of Kshs 0.70 per KWh. This charge has been included in the revenue requirement.
4.10. Proposal by ERC to Implement a Hydro‐Risk Mitigation Fund
During the last tariff review, there were proposals to set up a hydro risk mitigation fund for securing dependable supply during dry hydrology as a tariff rates stabilization mechanism. At the time, the commission indicated that the issue would be subjected to stake holders’ review at a separate process from the retail tariffs review. KPLC’s initial comment is that, if utilities were asked to contribute a significant portion of the proposed fund requirement, this would largely erode the rate of return on regulated asset base and reduce the ability of the Company to attract investment.
KPLC notes that the Commission at her own volition has indicated the intention to
implement this Review objective. However, the Company has no specific proposal on this issue and will therefore wait for the Commission guidance on the way forward.
11
4.11. Proposed implementation of Time of use tariffs
Capacity charge regime exposes KPLC to significant fixed costs and we propose that the plan by the Commission to introduce Time‐of‐Use tariffs should be preceded by a separate study on the impact of capacity regime to electricity consumers and the off‐taker. This Study should analyse in detail power consumption patterns of commercial and industrial customer categories to estimate the amount of consumption that could be shifted to low load times and the level of tariff reduction required to motivate such shifting. In the end when Time ‐of‐Use rates will be fully implemented, KPLC’s only concern is to be left revenue neutral even after the adoption of Time ‐of‐Use rates. In the interim, we would request the Commission to factor in a 20% discount on consumption between 23.00Hrs and 07.00Hrs and a 10% premium for other times (for industrial and commercial customers) on non‐fuel tariff only as a pilot scheme while the results of the study are awaited. This will help to provide real‐time and practical information and complement the results of the pilot study.
4.12. Way leave Levies & charges demand by Government Institutions
Some Local Authorities, Kenya Wildlife Service, Kenya Forest Services and Kenya Railways have variously imposed fees and charges for way‐leave rights that may be granted within their jurisdiction. The demand by local authorities and other government agencies, including the effect of the Roads Act, and the estimated expected claims from individual landowners would demand extra revenue of approximately Kshs 4.5 billion as detailed in Table 7 which would result to an increase in the retail tariff energy charge of Kshs 0.81/kWh. This revenue requirement does not include the extrapolated debt arrears of Kshs 8.2 billion which also need to be considered in the resolution of this issue. Although the company is currently facing operational and legal challenges due to existing demand of levies/charges, this requirement has not been factored in our Review Period application as the Company has requested the Government to intervene with a view to having the demand by Local Authorities and other GoK agencies resolved through the National Budget. This is in line with earlier advice from the Government and also the guidance given by ERC on levies by Government Institutions and Agencies during the last Tariff Review process. The Company will continue to use all efforts pursue the resolution of these charges and levies with the Government and to defend suits brought by claimants. However, should a court of law compel the Company to pay any of the amounts, we propose that such charges will be passed through to customers.
Table 7: Wayleave Levies Demand by Local Authorities & GoK Agencies
WAYLEAVES LEVIES DEMANDS BY GOVERNMENT INSTITUTIONS DESCRIPTION
A Government Institutions that have demanded Way leaves levies 1 Local Council Authorities 2 Kenya Wildlife Service 3 Kenya Forest Service 4 Kenya Railways B 1
The Local Councils pole levies demand is estimated by extrapolating alleged arrears totaling Kshs3.6 billion as at July 2007 to‐date, figures using 227% growth of Nairobi City Council demand from Kshs 164,000,000 in 2007 to Kshs 372,184,800 to date.
2 Estimated that 4% or 1,972km of 33kV and11kV power lines pass through the Kenya Forests Service areas.

12
WAYLEAVES LEVIES DEMANDS BY GOVERNMENT INSTITUTIONS DESCRIPTION
3 Estimated that 6% or 2,958km of 33kV and11kV of power lines pass through the Kenya Wildlife Service areas.
4 Estimated that there are 300 rail crossings in the country at the moment.
5 Estimated that out of existing 220kV and 132kV lines 30% or 1063km and 10% or 531km pass through KWS and KFS land areas, respectively
6 Estimated that Kshs1.6 billion annually is required to meet the Roads Act
C ESTIMATED TOTAL COST OF WAYLEAVES LEVIES DEMANDED ON KPLC
Amount (Kshs)
Annual Amount (Kshs)
1 Local Council Authorities‐ ( total alleged arrears of 3.6 billion by 2007 extrapolated by 227%
8,172,000,000
1,021,500,000
2
Kenya Wildlife Service levies assuming trace area of 5 square metres for the 2,958km at a rental charge of Kshs 24 per square metre
354,960,000
3
Kenya Forest Service levies assuming trace area of 10 square metres for the 1,972km at a rental charge of Kshs 2.50 per square metre
49,300,000
4
Kenya Railways levies assuming 300 crossings at application fee of Kshs 120,000 per railway crossing
36,000,000
5 Estimated effect of 220 kv / 132 kv charges (assume 30% in KWS and 10% in KFS lands)
965,325,000
6 Estimated effect of the Roads Act 1,600,000,000
Sub‐total 4,027,085,000
7 Likely estimated individual demand if Government Institutions were to be paid
500,000,000
Total Annual Wayleave Levies Cost Required 4,527,085,000
D TARIFF REQUIREMENT
Assuming annual electricity sales of 5,600 GWh in Kshs/kWh 0.81
i ANNUAL TARIFF REQUIREMENT in Kshs 4,527,085,000
ii Required Tariff increase to meet current level of levies in Kshs/kWh 0.81
iii Likely arrears exposure for past period (extrapolated debt) in Kshs
8,172,000,000.00
4.13. Other Proposed Government Institutions Levies
The Water Resources Management Authority has charged KenGen a water levy of Kshs 0.05/kWh for electricity generation from hydro sources. KPLC has included this charge to the energy charge rate for KenGen hydros in determination of the proposed base revenue requirement.
13
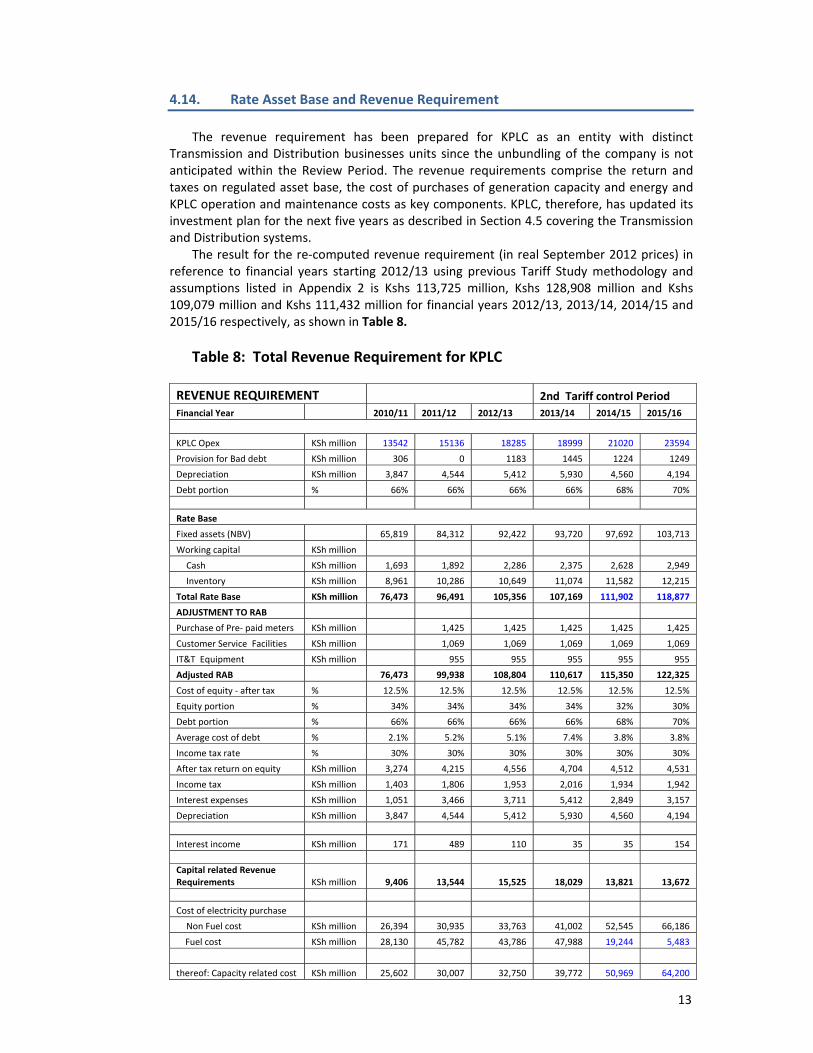
4.14. Rate Asset Base and Revenue Requirement
The revenue requirement has been prepared for KPLC as an entity with distinct Transmission and Distribution businesses units since the unbundling of the company is not anticipated within the Review Period. The revenue requirements comprise the return and taxes on regulated asset base, the cost of purchases of generation capacity and energy and KPLC operation and maintenance costs as key components. KPLC, therefore, has updated its investment plan for the next five years as described in Section 4.5 covering the Transmission and Distribution systems.
The result for the re‐computed revenue requirement (in real September 2012 prices) in reference to financial years starting 2012/13 using previous Tariff Study methodology and assumptions listed in Appendix 2 is Kshs 113,725 million, Kshs 128,908 million and Kshs 109,079 million and Kshs 111,432 million for financial years 2012/13, 2013/14, 2014/15 and 2015/16 respectively, as shown in Table 8.
Table 8: Total Revenue Requirement for KPLC
REVENUE REQUIREMENT 2nd Tariff control Period Financial Year 2010/11 2011/12 2012/13 2013/14 2014/15 2015/16 KPLC Opex KSh million 13542 15136 18285 18999 21020 23594
Provision for Bad debt KSh million 306 0 1183 1445 1224 1249
Depreciation KSh million 3,847 4,544 5,412 5,930 4,560 4,194
Debt portion % 66% 66% 66% 66% 68% 70%
Rate Base
Fixed assets (NBV) 65,819 84,312 92,422 93,720 97,692 103,713
Working capital KSh million
Cash KSh million 1,693 1,892 2,286 2,375 2,628 2,949
Inventory KSh million 8,961 10,286 10,649 11,074 11,582 12,215
Total Rate Base KSh million 76,473 96,491 105,356 107,169 111,902 118,877
ADJUSTMENT TO RAB
Purchase of Pre‐ paid meters KSh million 1,425 1,425 1,425 1,425 1,425
Customer Service Facilities KSh million 1,069 1,069 1,069 1,069 1,069
IT&T Equipment KSh million 955 955 955 955 955
Adjusted RAB 76,473 99,938 108,804 110,617 115,350 122,325
Cost of equity ‐ after tax % 12.5% 12.5% 12.5% 12.5% 12.5% 12.5%
Equity portion % 34% 34% 34% 34% 32% 30%
Debt portion % 66% 66% 66% 66% 68% 70%
Average cost of debt % 2.1% 5.2% 5.1% 7.4% 3.8% 3.8%
Income tax rate % 30% 30% 30% 30% 30% 30%
After tax return on equity KSh million 3,274 4,215 4,556 4,704 4,512 4,531
Income tax KSh million 1,403 1,806 1,953 2,016 1,934 1,942
Interest expenses KSh million 1,051 3,466 3,711 5,412 2,849 3,157
Depreciation KSh million 3,847 4,544 5,412 5,930 4,560 4,194
Interest income KSh million 171 489 110 35 35 154 Capital related Revenue Requirements KSh million 9,406 13,544 15,525 18,029 13,821 13,672
Cost of electricity purchase
Non Fuel cost KSh million 26,394 30,935 33,763 41,002 52,545 66,186
Fuel cost KSh million 28,130 45,782 43,786 47,988 19,244 5,483
thereof: Capacity related cost KSh million 25,602 30,007 32,750 39,772 50,969 64,200

14
REVENUE REQUIREMENT 2nd Tariff control Period Financial Year 2010/11 2011/12 2012/13 2013/14 2014/15 2015/16
thereof: Energy related cost KSh million 28,922 46,710 44,799 49,218 20,821 7,468
Actual /Allowed losses % of energy purchased 16.2% 17.3% 17.5% 17.3% 17.1% 16.9%
Allowed energy related cost KSh million 28,922 46,710 44,799 49,218 20,821 7,468 Operation and maintenance cost
KPLC Opex KSh million 13,848 15,136 19,468 20,444 22,245 24,843
Provision for Bad debt KSh million 306 0 1,183 1,445 1,224 1,249
Total Operating Cost KSh million 68,679 91,853 98,200 110,879 95,258 97,761
Revenue Requirement KSh million 78,084 105,397 113,725 128,908 109,079 111,432
Energy sold GWh 6,123 6,341 6,581 6,993 7,430 7,895 Average Revenue Requirement KSh / kWh 12.75 16.62 17.28 18.43 14.68 14.15
4.15. Average Revenue Requirement Per Unit of Electricity Sales
Table 9 summarizes KPLC revenue requirements per unit.
Table 9: KPLC Revenue Requirement (in Sept 2012 prices) Kshs/kWh
Financial Year 2011/12 2012/13 2013/14 2014/15 2015/16
4 Years (2012 – 2015) Levelized Tariff
Non‐Fuel revenue requirements
10.63 11.61 12.09 13.45 12.01
System Expansion Revenue 0.7 0.7 0.7 0.7 0.7
Adjusted Non Fuel Revenue 9.40 11.33 12.31 12.79 14.15 12.71
% Increase 21% 9% 4% 11% 35%
Average Overall Revenue Requirements
17.28 18.47 14.68 14.15 16.04
System Expansion Revenue 0.7 0.7 0.7 0.7 0.7
Adjusted Overall Revenue Requirements
16.62 17.98 19.17 15.38 14.85 16.74
% Increase 8% 7% ‐20% ‐3% 1%
It can be observed that there will be an increase in required non‐fuel revenue yield from Kshs 9.40/kWh in 2011/12 to a three year levelised yield of Kshs 12.71 equivalent to 35%, and an increase in overall yield (including fuel costs) from Kshs 16.62/kWh in 2011/12 to a three year levelised yield 16.74/kWh equivalent to 1%. The increased cost of power purchase, rising from the additional committed generating capacity by KenGen and Independent Power Producers, additional operating costs as a result of inflation‐related escalation, as well as financial requirements to sustain the implementation of the
15
transmission and distribution electricity network expansion programme has necessitated the need to generate additional revenue from the proposed retail tariffs. 4.16. Breakdown of Average per Unit Projected Retail Tariffs
The revenue requirement power purchase component is expected to evolve from the 2011/12 actual level of Kshs 4.88/kWh to a four year‐ levelized of Kshs 6.70/kWh during the Review Period to take into account the expected capacity payment for committed KenGen and IPPs Power plants, this will constitute the main cause of revenue requirement increase being sought by the company as shown in Table 10. The Transmission and Distribution component will remain relatively stable during the Review Period and is expected to change from the 2011/12 actual level of Kshs 4.52/kWh to a four year‐levelized of Kshs 5.32/kWh to cater for the expanded network operation and maintenance. The fuel component is expected to slightly reduce overtime as more long term non‐fuel base power plants are developed. Table 10: Breakdown of Revenue requirement in Kshs/kWh (in Sept 2012 prices)
REVENUE REQUIREMENT 4‐yrs
Levelised
2010/11 2011/12 2012/13 2013/14 2014/15 2015/16 2012‐15
Power Purchase Component Actual Actual
Non‐ Fuel KSh / kWh 4.31 4.88 5.13 5.86 7.07 8.38 6.70
Fuel KSh / kWh 4.59 7.22 6.65 6.86 2.59 0.69 4.03
Sub‐Total KSh / kWh 8.90 12.10 11.78 12.73 9.66 9.08 10.73
T& D Component
KPLC Capital Related KSh / kWh 1.54 2.14 2.36 2.61 1.86 1.76 2.13
KPLC O&M KSh / kWh 2.29 2.37 3.12 3.09 2.92 2.84 2.99
Ketraco Lines O&M KSh / kWh 0.02 0.02 0.01 0.05 0.24 0.46 0.20
Sub‐Total KSh / kWh 3.85 4.52 5.50 5.74 5.02 5.07 5.32
Overall Revenue Requirement KSh / kWh 12.75 16.62 17.28 18.47 14.68 14.15 16.04
Non‐fuel Revenue Requirement KSh / kWh 8.16 9.40 10.63 11.61 12.09 13.45 12.01
System Expansion Revenue 0.70 0.70 0.70 0.70 0.70
Adjusted Revenue Requirement
Overall 12.75 16.62 17.98 19.17 15.38 14.85 16.74
Non‐Fuel 8.16 9.40 11.33 12.31 12.79 14.15 12.71
Overall % change 8.2% 6.6% ‐19.8% ‐3.5% ‐3.5% Non‐Fuel % change 20.5% 8.7% 3.9% 10.6% 35.2%
4.17. Financial Projections
4.17.1. Energy Balance
The projected capacity and energy balances for the financial years 2011/12 to 2016/17 is as shown in Tables 16 and 17, respectively. The power balance in Table 16 shows that the planned project will be more than adequate to meet the projected interconnected demand. The projected capacity surplus assumes full availability of hydros and about 15 % reserve margin for maintenance and spinning allowance.

16
4.17.2. Projected Financial Results
The summary financial projections based on assumptions in Appendix 2 are shown in Table 11. Assuming the proposed retail adjustment is granted as requested, then the KPLC’s financial performance in the medium‐term is expected to be satisfactory and the Company will continue to operate as a commercially viable enterprise that is able to attract capital investment to fund the planned expansions and customer growth.
Table 11: Projected Financial Performance 2012/13 to 2015/16
2011/12 2012/13 2013/14 2014/15 2015/16 Actual Projected Units purchased (GWh) 7,670 7,977 8,456 8,963 9,501 System Losses 17.3% 17.5% 17.3% 17.1% 16.9% Total Sales ‐GWh 6,341 6,581 6,993 7,430 7,895 Profit & Loss Accounts Revenue ‐ Electricity Non‐Fuel 45,008 62,520 81,747 90,353 106,190 Fuel Recovery 41,896 43,129 47,268 18,956 5,346 Forex Adjustment 8,759 0 0 0 0 ‐ Others 1,788 2,100 500 500 500 Total revenue 97,451 107,750 129,515 109,809 112,036 Operating costs Power purchases Non‐Fuel 24,787 33,763 41,002 52,545 66,186 Fuel 45,175 43,786 47,988 19,244 5,483 Sub‐Total 69,962 77,549 88,990 71,789 71,669 Gross margin 27,488 30,201 40,525 38,020 40,368 T&D cost 15,136 19,468 20,444 22,245 24,843 Depreciation 4,544 5,412 5,930 4,560 4,194 Sub‐Total 19,680 24,881 26,373 26,804 29,037 Gross margin as % Sales 28.2% 28.0% 31.3% 34.6% 36.0% Total operating cost 89,642 102,429 115,364 98,594 100,705 Operating surplus 7,809 5,320 14,151 11,215 11,331 Net Finance (income)/cost (698) 1,357 3,139 1,005 184 Profit/(Loss) before tax 8,507 3,963 11,012 10,211 11,147 Balance Sheet Fixed and Current Assets Current assets 28,359 28,153 32,190 38,745 44,911 Fixed assets 105,773 111,026 123,378 143,045 168,086 Total assets 134,132 139,178 155,568 181,791 212,997 Equity and Liabilities Current liabilities 37,010 29,759 21,044 18,850 33,731 Non current liabilities 51,866 62,792 81,598 104,304 114,316 Capital and Reserves 45,256 46,628 52,926 58,637 64,950 Total equity and liabilities 134,132 139,178 155,568 181,791 212,997
17
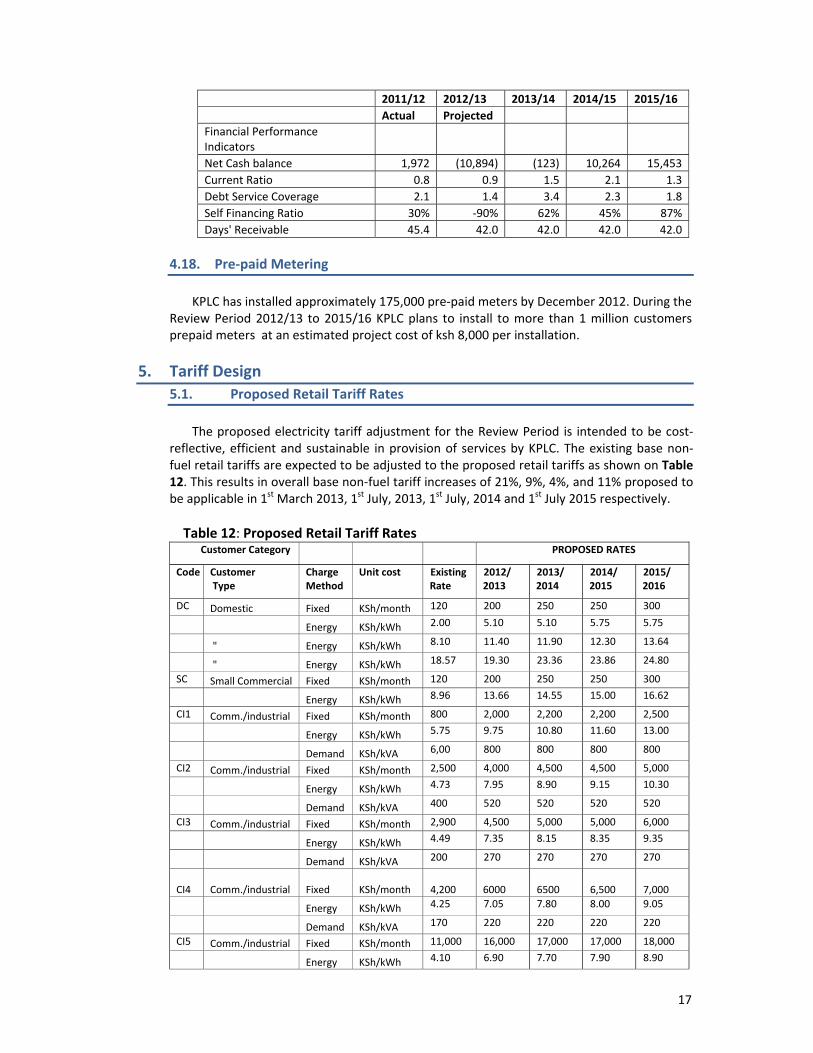
2011/12 2012/13 2013/14 2014/15 2015/16 Actual Projected Financial Performance Indicators Net Cash balance 1,972 (10,894) (123) 10,264 15,453 Current Ratio 0.8 0.9 1.5 2.1 1.3 Debt Service Coverage 2.1 1.4 3.4 2.3 1.8 Self Financing Ratio 30% ‐90% 62% 45% 87% Days' Receivable 45.4 42.0 42.0 42.0 42.0
4.18. Pre‐paid Metering
KPLC has installed approximately 175,000 pre‐paid meters by December 2012. During the
Review Period 2012/13 to 2015/16 KPLC plans to install to more than 1 million customers prepaid meters at an estimated project cost of ksh 8,000 per installation.
5. Tariff Design 5.1. Proposed Retail Tariff Rates
The proposed electricity tariff adjustment for the Review Period is intended to be cost‐reflective, efficient and sustainable in provision of services by KPLC. The existing base non‐fuel retail tariffs are expected to be adjusted to the proposed retail tariffs as shown on Table 12. This results in overall base non‐fuel tariff increases of 21%, 9%, 4%, and 11% proposed to be applicable in 1st March 2013, 1st July, 2013, 1st July, 2014 and 1st July 2015 respectively. Table 12: Proposed Retail Tariff Rates
Customer Category PROPOSED RATES
Code Customer Type
Charge Method
Unit cost Existing Rate
2012/2013
2013/2014
2014/ 2015
2015/2016
DC Domestic Fixed KSh/month 120 200 250 250 300
Energy KSh/kWh 2.00 5.10 5.10 5.75 5.75
" Energy KSh/kWh 8.10 11.40 11.90 12.30 13.64
" Energy KSh/kWh 18.57 19.30 23.36 23.86 24.80
SC Small Commercial Fixed KSh/month 120 200 250 250 300
Energy KSh/kWh 8.96 13.66 14.55 15.00 16.62
CI1 Comm./industrial Fixed KSh/month 800 2,000 2,200 2,200 2,500
Energy KSh/kWh 5.75 9.75 10.80 11.60 13.00
Demand KSh/kVA 6,00 800 800 800 800
CI2 Comm./industrial Fixed KSh/month 2,500 4,000 4,500 4,500 5,000
Energy KSh/kWh 4.73 7.95 8.90 9.15 10.30
Demand KSh/kVA 400 520 520 520 520
CI3 Comm./industrial Fixed KSh/month 2,900 4,500 5,000 5,000 6,000
Energy KSh/kWh 4.49 7.35 8.15 8.35 9.35
Demand KSh/kVA 200 270 270 270 270
CI4 Comm./industrial Fixed KSh/month
4,200
6000
6500
6,500
7,000
Energy KSh/kWh 4.25 7.05 7.80 8.00 9.05
Demand KSh/kVA 170 220 220 220 220
CI5 Comm./industrial Fixed KSh/month 11,000 16,000 17,000 17,000 18,000
Energy KSh/kWh 4.10 6.90 7.70 7.90 8.90

18
Customer Category PROPOSED RATES
Code Customer Type
Charge Method
Unit cost Existing Rate
2012/2013
2013/2014
2014/ 2015
2015/2016
Demand KSh/kVA 170 220 220 220 220
IT Interruptible Fixed KSh/month 120 200 250 250 300
Energy KSh/kWh 4.85 13.50 14.50 15.30 16.60
DC IT " Fixed KSh/month
240 400 500 500 600
SC IT " Fixed KSh/month
240 400 500 500 600
SL Street Lighting Fixed KSh/month 120 200 250 250 300
Energy KSh/kWh 7.50 11.20 12.30
12.80
14.00
5.2. Proposed Retail Tariffs by Customer Categories
This results in an average base non‐fuel retail tariff increase of 21% from the 2011/12 derived average non‐fuel tariff yield level of Kshs 9.40/kWh. The distribution of the average retail tariff per customer category is as shown on Table 13 and the increase would range from 17% to 25% on various new consumer categories except for water heating Interruptible tariff which has been adjusted to be in line with current customers’ consumption characteristic.
Table 13: Distribution of the Proposed Tariff revenue requirement yield change in
percentage per applicable period
New Tariff Rates % increase
Base Tariff Proposed increases
1st Mar‐ 2013
1st Jul‐ 2013
1st Jul‐ 2014
1st Jul‐ 2015
Domestic DC 9.96 17% 13% 4% 11%
SC 11.32 25% 10% 3% 11%
Commercial/Industrial CI1 10.24 21% 15% 6% 10%
CI2 7.79 21% 13% 2% 11%
CI3 6.79 21% 12% 2% 11%
CI4 6.34 21% 12% 2% 12%
CI5 6.31 21% 13% 2% 12%
Off‐Peak IT
DC,IT
SC,IT
12.88 21% 15% 5% 10%
Street Lighting SL 9.60 21% 15% 4% 10%
Overall Tariff 9.40 21% 9% 4% 11%

19
The levelised retail tariffs described in the above sections are base rates in constant September 2012 prices. 5.3. Proposed changes in FCC, FERFA and INFA formulae
Through this tariff application, KPLC proposes the retention of the current Fuel Cost Charge (FCC), Foreign Exchange Rate Fluctuation Adjustment (FERFA) and inflation adjustment formulae with the following amendments.
i.) The loss factor be allowed at estimated actual level of 17.5% in base year 20112/13, thereafter, the allowed target losses level have been assumed arrived after taking to account a reduction of 0.2% in overall system losses to be in line with the proposed loss reduction path shown in Section 4.4 (iii).
ii.) Take into consideration additional fuel displacement charge rates for wind and feed‐in‐tariff geothermal renewable generation sources
iii.) To take into account the specific fuel consumption for new Medium speed diesel being developed by KenGen/IPPs and also those related to new off‐grid system generation
iv.) Change of base inflation indices basket from February 2009 that was derived using Geometric mean methodology mean of September 2012
v.) To take into account changes in Base Exchange rates for major foreign currencies since 2008. We propose setting of Base Exchange rates for selected major currencies at CBK mean exchange rate as shown in Table 14.
Table 14: CBK Mean Exchange Rates of Major Currencies
FOREIGN CURRENCY September 2012 May 2009 March 2008
US Dollar 84.6133 77.8614 64.9242
STG Pound 136.2555 120.0302 130.0783
Euro 108.7977 106.2277 100.7930
SA Rand 10.2256 9.2839 8.1443
AE Dirham 23.0367 21.1988 17.6814
Can $ 86.4971 67.5520 65.0696
Swiss Francs 90.0162 70.2685 64.1707
JPY(100) 108.2463 80.6318 64.0416
SW Kroner 12.8098 10.0445 10.6474
NOR Kroner 14.7146 12.0684 12.8074
DAN Kroner 14.5971 14.2576 13.4244
IND Rupee 1.5516 1.6044 1.6104
Hongkong Dollar 10.9119 10.0450 8.3401
Saudi Riyal 22.5626 20.7623 17.3168
Chinese Yuan 13.3844 11.4092 9.1613
Australian Dollar 87.9535 59.4860 60.0525
20
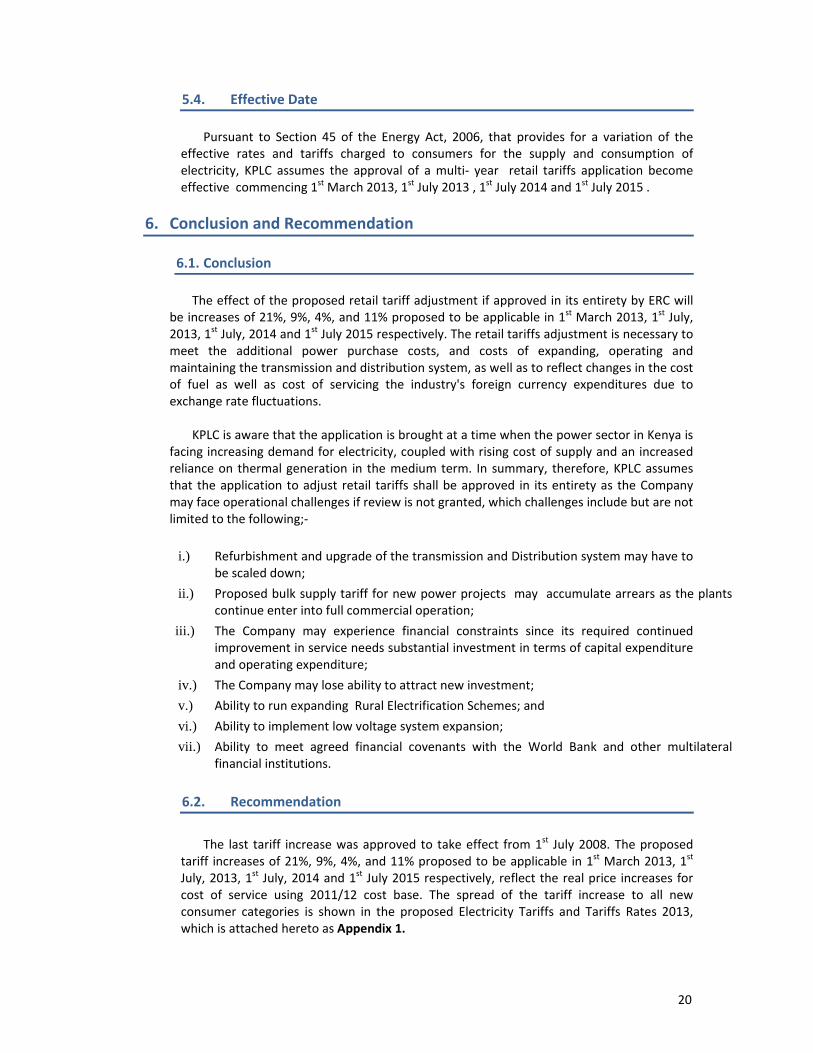
5.4. Effective Date
Pursuant to Section 45 of the Energy Act, 2006, that provides for a variation of the effective rates and tariffs charged to consumers for the supply and consumption of electricity, KPLC assumes the approval of a multi‐ year retail tariffs application become effective commencing 1st March 2013, 1st July 2013 , 1st July 2014 and 1st July 2015 .
6. Conclusion and Recommendation 6.1. Conclusion
The effect of the proposed retail tariff adjustment if approved in its entirety by ERC will be increases of 21%, 9%, 4%, and 11% proposed to be applicable in 1st March 2013, 1st July, 2013, 1st July, 2014 and 1st July 2015 respectively. The retail tariffs adjustment is necessary to meet the additional power purchase costs, and costs of expanding, operating and maintaining the transmission and distribution system, as well as to reflect changes in the cost of fuel as well as cost of servicing the industry's foreign currency expenditures due to exchange rate fluctuations.
KPLC is aware that the application is brought at a time when the power sector in Kenya is
facing increasing demand for electricity, coupled with rising cost of supply and an increased reliance on thermal generation in the medium term. In summary, therefore, KPLC assumes that the application to adjust retail tariffs shall be approved in its entirety as the Company may face operational challenges if review is not granted, which challenges include but are not limited to the following;‐
i.) Refurbishment and upgrade of the transmission and Distribution system may have to be scaled down;
ii.) Proposed bulk supply tariff for new power projects may accumulate arrears as the plants continue enter into full commercial operation;
iii.) The Company may experience financial constraints since its required continued improvement in service needs substantial investment in terms of capital expenditure and operating expenditure;
iv.) The Company may lose ability to attract new investment;
v.) Ability to run expanding Rural Electrification Schemes; and
vi.) Ability to implement low voltage system expansion;
vii.) Ability to meet agreed financial covenants with the World Bank and other multilateral financial institutions.
6.2. Recommendation
The last tariff increase was approved to take effect from 1st July 2008. The proposed
tariff increases of 21%, 9%, 4%, and 11% proposed to be applicable in 1st March 2013, 1st July, 2013, 1st July, 2014 and 1st July 2015 respectively, reflect the real price increases for cost of service using 2011/12 cost base. The spread of the tariff increase to all new consumer categories is shown in the proposed Electricity Tariffs and Tariffs Rates 2013, which is attached hereto as Appendix 1.

21
APPENDICES
Appendix 1: Proposed Schedule of Tariffs & Rates 2013
APPROVAL OF SCHEDULE OF TARIFFS FOR SUPPLY OF ELECTRICITY BY THE KENYA POWER AND LIGHTING COMPANY LIMITED SET BY THE ENERGY REGULATORY COMMISSION UNDER POWERS CONFERRED UNDER SECTION 45 OF THE ENERGY ACT, 2006
NOTICE is hereby given that pursuant to section 45 of the Energy Act, 2006, the Energy
Regulatory Commission has set out the following Schedule of Tariffs, 2013, prescribing the Tariffs, Charges, Prices and Rates to be charged by The Kenya Power and Lighting Company Limited to the consumers for electrical energy consumed by them.
PART I
GENERAL
1. This Schedule of Tariffs, 2013, hereby set shall take effect on 1stMarch, 2013 and shall for each consumer become effective so as to apply to all bills raised based on meter readings taken on or after that date.
2 In this document, unless the context otherwise requires, the following words and
expressions shall have the following meanings:
"Act" means the Energy Act No. 12 of 2006 and any Act or Acts amending or replacing the same;
"Billing Period" means the period of time elapsing between the issuing of two
consecutive bills by the Company but with the exception of their first and last period; each such period of time shall be as near to thirty days as possible;
“Commission” means the Energy Regulatory Commission established under Section 4of
the Act;
"Company" means The Kenya Power and Lighting Company Limited;
“Consumer” means any person supplied with electrical energy, but does not include a person supplied with electrical energy for delivery or supply to another person;
"Contract" means the agreement made by a Consumer with the Company for a supply
of electrical energy, in force on the date of commencement of this Schedule of Tariffs and includes all contracts entered into with consumers after this date;

22
"Demand" means the maximum electric power demand drawn by a Consumer in each Billing Period;
“Electric Power Producer” means a person who owns or operates facilities for
generation of electrical energy pursuant to a generating licence issued by the Commission; "Fixed Charge" means the charge to be made per Billing Period in addition to those
charges accruing in respect of Units and, when applicable, demand supplied;
"Interconnected System" means those works inclusive of power stations, transmission and distribution lines electrically interconnected forming the main supply grid in the Republic of Kenya;
“KenGen” means the Kenya Electricity Generating Company Limited;
"kVA" means Kilovolt Ampere;
"Meter" means any and every kind of machine, device or instrument used for the
measurement of the quantity of electrical energy, and includes such auxiliary appliances as resistors, shunts, reactance, current transformers, voltage transformers and time switches, external and necessary to the meter;
"Off‐Grid System" means those works inclusive of power stations, and distribution lines
electrically and physically separate from the Interconnected System; "Power factor" means the decimal fraction obtained by dividing the Demand in
kilowatts by the Demand in kilovolt amperes and shall be ascertained by suitable apparatus installed by the Company;
“Tariff” means the prices, rates, costs and all other charges including adjustments,
formulae and other terms, conditions and information contained in parts II, III and IV of this Schedule of Tariffs, 2013.
"Unit" means one kilowatt hour (kWh);
“Units Sent Out” means electricity measured in kWh generated by the Company’s
Power Plants or Electric Power Producers Power Plants delivered to and purchased by the Company;
23
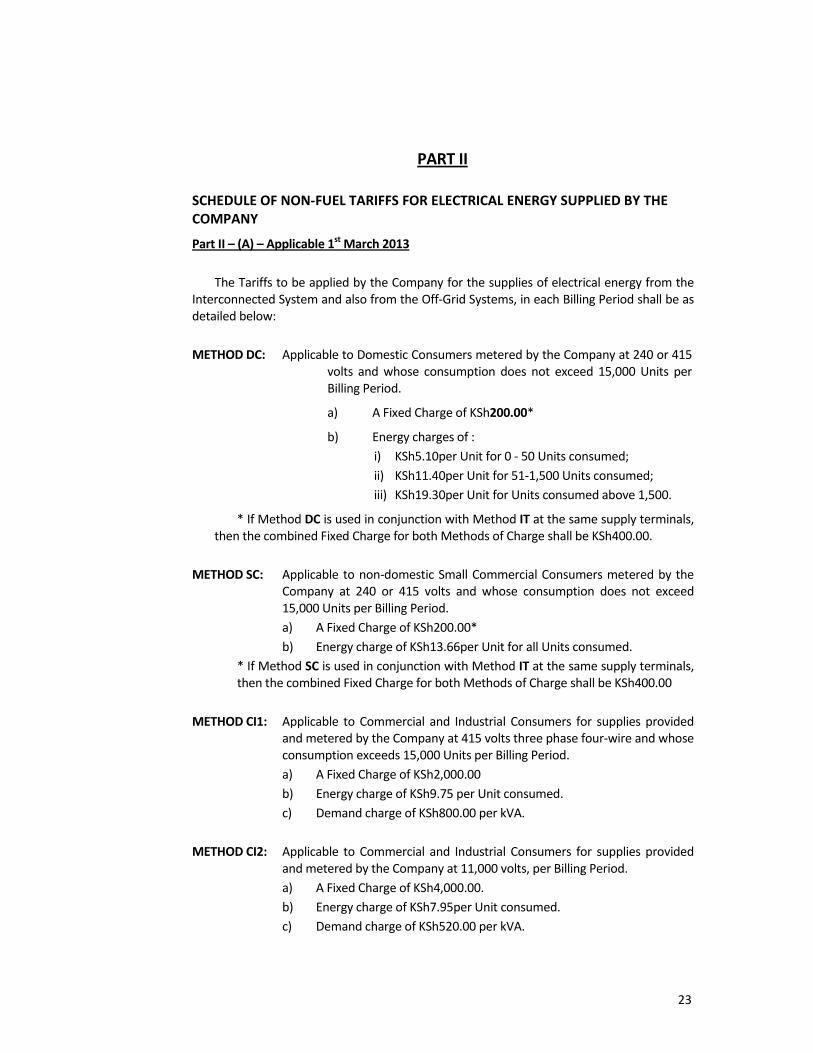
PART II
SCHEDULE OF NON‐FUEL TARIFFS FOR ELECTRICAL ENERGY SUPPLIED BY THE COMPANY
Part II – (A) – Applicable 1st March 2013 The Tariffs to be applied by the Company for the supplies of electrical energy from the
Interconnected System and also from the Off‐Grid Systems, in each Billing Period shall be as detailed below:
METHOD DC: Applicable to Domestic Consumers metered by the Company at 240 or 415
volts and whose consumption does not exceed 15,000 Units per Billing Period.
a) A Fixed Charge of KSh200.00*
b) Energy charges of : i) KSh5.10per Unit for 0 ‐ 50 Units consumed; ii) KSh11.40per Unit for 51‐1,500 Units consumed; iii) KSh19.30per Unit for Units consumed above 1,500.
* If Method DC is used in conjunction with Method IT at the same supply terminals, then the combined Fixed Charge for both Methods of Charge shall be KSh400.00.
METHOD SC: Applicable to non‐domestic Small Commercial Consumers metered by the
Company at 240 or 415 volts and whose consumption does not exceed 15,000 Units per Billing Period. a) A Fixed Charge of KSh200.00* b) Energy charge of KSh13.66per Unit for all Units consumed.
* If Method SC is used in conjunction with Method IT at the same supply terminals, then the combined Fixed Charge for both Methods of Charge shall be KSh400.00
METHOD CI1: Applicable to Commercial and Industrial Consumers for supplies provided and metered by the Company at 415 volts three phase four‐wire and whose consumption exceeds 15,000 Units per Billing Period. a) A Fixed Charge of KSh2,000.00 b) Energy charge of KSh9.75 per Unit consumed. c) Demand charge of KSh800.00 per kVA.
METHOD CI2: Applicable to Commercial and Industrial Consumers for supplies provided
and metered by the Company at 11,000 volts, per Billing Period. a) A Fixed Charge of KSh4,000.00. b) Energy charge of KSh7.95per Unit consumed. c) Demand charge of KSh520.00 per kVA.
24
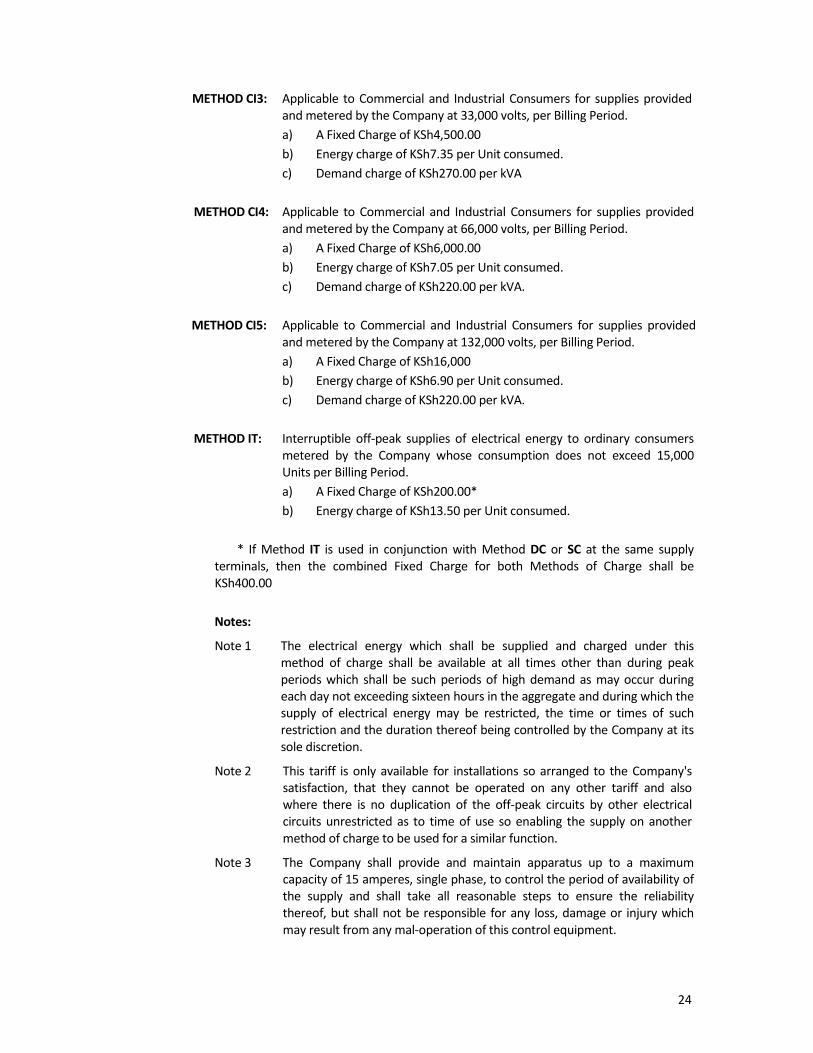
METHOD CI3: Applicable to Commercial and Industrial Consumers for supplies provided and metered by the Company at 33,000 volts, per Billing Period. a) A Fixed Charge of KSh4,500.00 b) Energy charge of KSh7.35 per Unit consumed. c) Demand charge of KSh270.00 per kVA
METHOD CI4: Applicable to Commercial and Industrial Consumers for supplies provided
and metered by the Company at 66,000 volts, per Billing Period. a) A Fixed Charge of KSh6,000.00 b) Energy charge of KSh7.05 per Unit consumed. c) Demand charge of KSh220.00 per kVA.
METHOD CI5: Applicable to Commercial and Industrial Consumers for supplies provided
and metered by the Company at 132,000 volts, per Billing Period. a) A Fixed Charge of KSh16,000 b) Energy charge of KSh6.90 per Unit consumed. c) Demand charge of KSh220.00 per kVA.
METHOD IT: Interruptible off‐peak supplies of electrical energy to ordinary consumers
metered by the Company whose consumption does not exceed 15,000 Units per Billing Period. a) A Fixed Charge of KSh200.00* b) Energy charge of KSh13.50 per Unit consumed.
* If Method IT is used in conjunction with Method DC or SC at the same supply
terminals, then the combined Fixed Charge for both Methods of Charge shall be KSh400.00
Notes:
Note 1 The electrical energy which shall be supplied and charged under this method of charge shall be available at all times other than during peak periods which shall be such periods of high demand as may occur during each day not exceeding sixteen hours in the aggregate and during which the supply of electrical energy may be restricted, the time or times of such restriction and the duration thereof being controlled by the Company at its sole discretion.
Note 2 This tariff is only available for installations so arranged to the Company's satisfaction, that they cannot be operated on any other tariff and also where there is no duplication of the off‐peak circuits by other electrical circuits unrestricted as to time of use so enabling the supply on another method of charge to be used for a similar function.
Note 3 The Company shall provide and maintain apparatus up to a maximum capacity of 15 amperes, single phase, to control the period of availability of the supply and shall take all reasonable steps to ensure the reliability thereof, but shall not be responsible for any loss, damage or injury which may result from any mal‐operation of this control equipment.
25
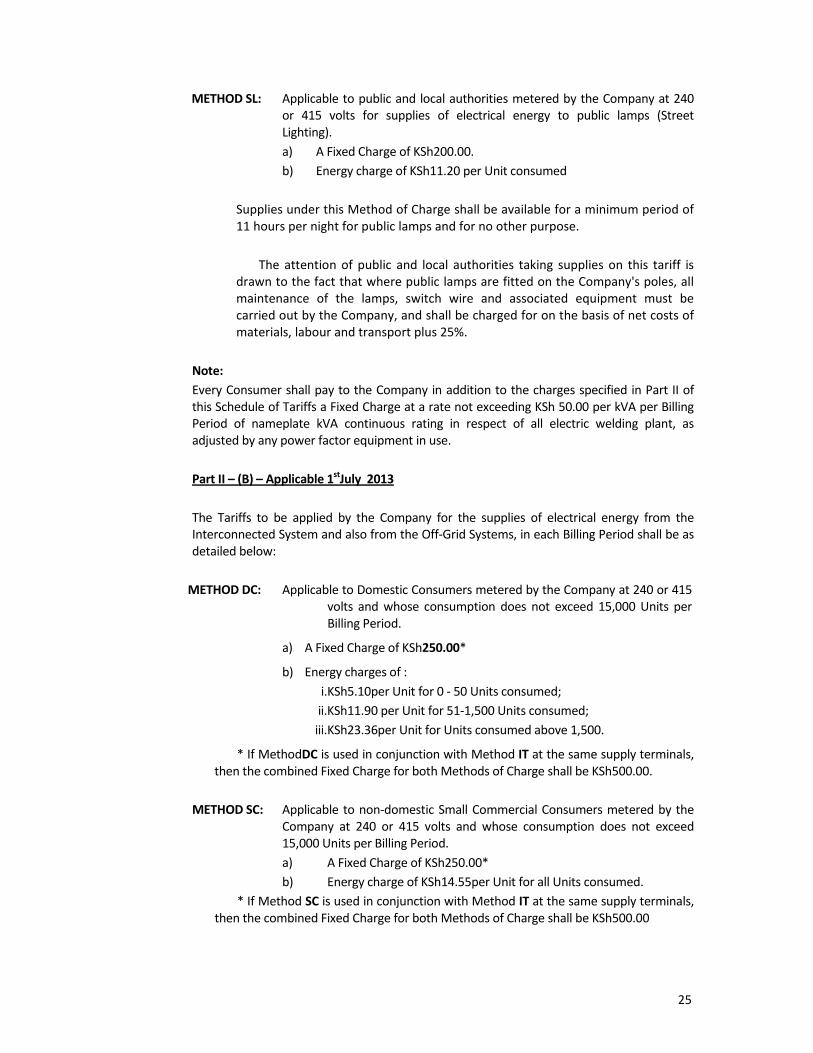
METHOD SL: Applicable to public and local authorities metered by the Company at 240 or 415 volts for supplies of electrical energy to public lamps (Street Lighting). a) A Fixed Charge of KSh200.00. b) Energy charge of KSh11.20 per Unit consumed
Supplies under this Method of Charge shall be available for a minimum period of 11 hours per night for public lamps and for no other purpose.
The attention of public and local authorities taking supplies on this tariff is
drawn to the fact that where public lamps are fitted on the Company's poles, all maintenance of the lamps, switch wire and associated equipment must be carried out by the Company, and shall be charged for on the basis of net costs of materials, labour and transport plus 25%.
Note: Every Consumer shall pay to the Company in addition to the charges specified in Part II of this Schedule of Tariffs a Fixed Charge at a rate not exceeding KSh 50.00 per kVA per Billing Period of nameplate kVA continuous rating in respect of all electric welding plant, as adjusted by any power factor equipment in use.
Part II – (B) – Applicable 1stJuly 2013
The Tariffs to be applied by the Company for the supplies of electrical energy from the Interconnected System and also from the Off‐Grid Systems, in each Billing Period shall be as detailed below:
METHOD DC: Applicable to Domestic Consumers metered by the Company at 240 or 415
volts and whose consumption does not exceed 15,000 Units per Billing Period.
a) A Fixed Charge of KSh250.00*
b) Energy charges of : i.KSh5.10per Unit for 0 ‐ 50 Units consumed; ii.KSh11.90 per Unit for 51‐1,500 Units consumed; iii.KSh23.36per Unit for Units consumed above 1,500.
* If MethodDC is used in conjunction with Method IT at the same supply terminals, then the combined Fixed Charge for both Methods of Charge shall be KSh500.00.
METHOD SC: Applicable to non‐domestic Small Commercial Consumers metered by the
Company at 240 or 415 volts and whose consumption does not exceed 15,000 Units per Billing Period. a) A Fixed Charge of KSh250.00* b) Energy charge of KSh14.55per Unit for all Units consumed.
* If Method SC is used in conjunction with Method IT at the same supply terminals, then the combined Fixed Charge for both Methods of Charge shall be KSh500.00
26
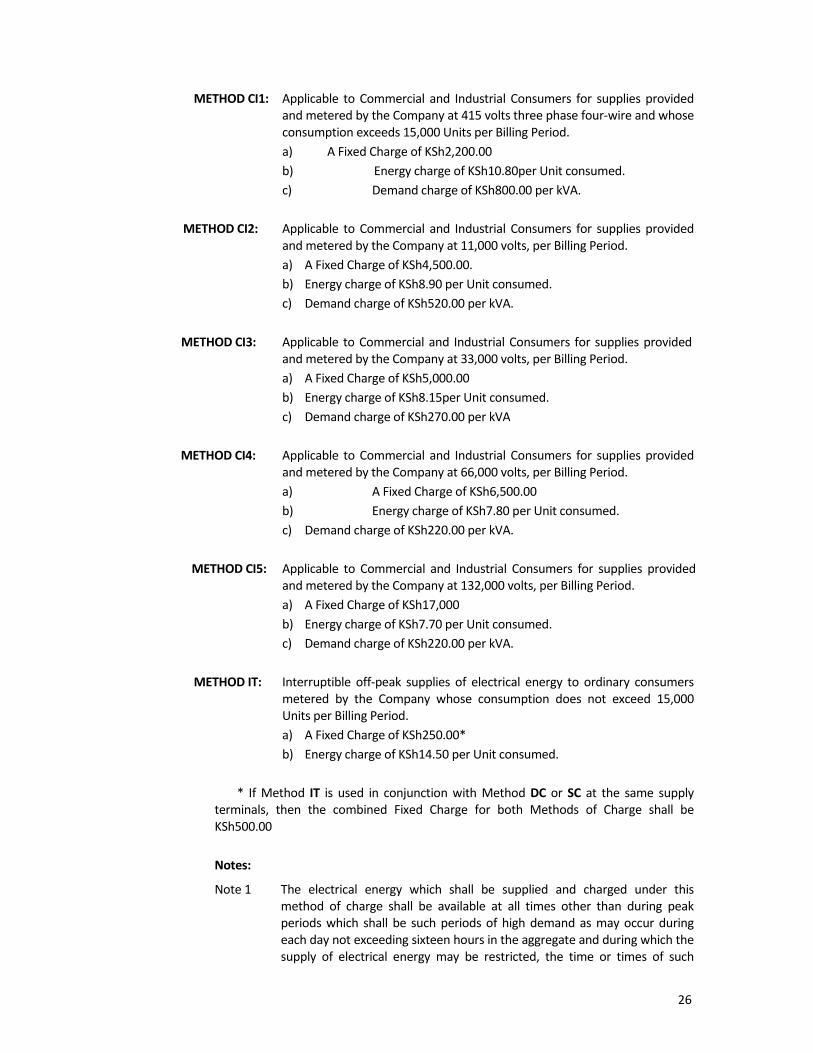
METHOD CI1: Applicable to Commercial and Industrial Consumers for supplies provided and metered by the Company at 415 volts three phase four‐wire and whose consumption exceeds 15,000 Units per Billing Period. a) A Fixed Charge of KSh2,200.00
b) Energy charge of KSh10.80per Unit consumed. c) Demand charge of KSh800.00 per kVA.
METHOD CI2: Applicable to Commercial and Industrial Consumers for supplies provided
and metered by the Company at 11,000 volts, per Billing Period. a) A Fixed Charge of KSh4,500.00. b) Energy charge of KSh8.90 per Unit consumed. c) Demand charge of KSh520.00 per kVA.
METHOD CI3: Applicable to Commercial and Industrial Consumers for supplies provided
and metered by the Company at 33,000 volts, per Billing Period. a) A Fixed Charge of KSh5,000.00 b) Energy charge of KSh8.15per Unit consumed. c) Demand charge of KSh270.00 per kVA
METHOD CI4: Applicable to Commercial and Industrial Consumers for supplies provided
and metered by the Company at 66,000 volts, per Billing Period. a) A Fixed Charge of KSh6,500.00 b) Energy charge of KSh7.80 per Unit consumed. c) Demand charge of KSh220.00 per kVA.
METHOD CI5: Applicable to Commercial and Industrial Consumers for supplies provided
and metered by the Company at 132,000 volts, per Billing Period. a) A Fixed Charge of KSh17,000 b) Energy charge of KSh7.70 per Unit consumed. c) Demand charge of KSh220.00 per kVA.
METHOD IT: Interruptible off‐peak supplies of electrical energy to ordinary consumers
metered by the Company whose consumption does not exceed 15,000 Units per Billing Period. a) A Fixed Charge of KSh250.00* b) Energy charge of KSh14.50 per Unit consumed.
* If Method IT is used in conjunction with Method DC or SC at the same supply
terminals, then the combined Fixed Charge for both Methods of Charge shall be KSh500.00
Notes:
Note 1 The electrical energy which shall be supplied and charged under this method of charge shall be available at all times other than during peak periods which shall be such periods of high demand as may occur during each day not exceeding sixteen hours in the aggregate and during which the supply of electrical energy may be restricted, the time or times of such

27
restriction and the duration thereof being controlled by the Company at its sole discretion.
Note 2 This tariff is only available for installations so arranged to the Company's satisfaction, that they cannot be operated on any other tariff and also where there is no duplication of the off‐peak circuits by other electrical circuits unrestricted as to time of use so enabling the supply on another method of charge to be used for a similar function.
Note 3 The Company shall provide and maintain apparatus up to a maximum capacity of 15 amperes, single phase, to control the period of availability of the supply and shall take all reasonable steps to ensure the reliability thereof, but shall not be responsible for any loss, damage or injury which may result from any mal‐operation of this control equipment.
METHOD SL: Applicable to public and local authorities metered by the Company at 240
or 415 volts for supplies of electrical energy to public lamps (Street Lighting). a) A Fixed Charge of KSh250.00. b) Energy charge of KSh12.30 per Unit consumed
Supplies under this Method of Charge shall be available for a minimum period of 11 hours per night for public lamps and for no other purpose.
The attention of public and local authorities taking supplies on this tariff is drawn to the fact that where public lamps are fitted on the Company's poles, all maintenance of the lamps, switch wire and associated equipment must be carried out by the Company, and shall be charged for on the basis of net costs of materials, labour and transport plus 25%.
Note: Every Consumer shall pay to the Company in addition to the charges specified in Part II of
this Schedule of Tariffs a Fixed Charge at a rate not exceeding KSh 50.00 per kVA per Billing Period of nameplate kVA continuous rating in respect of all electric welding plant, as adjusted by any power factor equipment in use.
Part II – (C) – Applicable 1stJuly 2014
The Tariffs to be applied by the Company for the supplies of electrical energy from the Interconnected System and also from the Off‐Grid Systems, in each Billing Period shall be as detailed below:
METHOD DC: Applicable to Domestic Consumers metered by the Company at 240 or 415
volts and whose consumption does not exceed 15,000 Units per Billing Period.
a) A Fixed Charge of KSh250.00*
b) Energy charges of : i.KSh5.75per Unit for 0 ‐ 50 Units consumed; ii.KSh12.30per Unit for 51‐1,500 Units consumed; iii. KSh23.86per Unit for Units consumed above 1,500.

28
* If Method DC is used in conjunction with Method IT at the same supply terminals, then the combined Fixed Charge for both Methods of Charge shall be KSh500.00.
METHOD SC: Applicable to non‐domestic Small Commercial Consumers metered by the
Company at 240 or 415 volts and whose consumption does not exceed 15,000 Units per Billing Period. a) A Fixed Charge of KSh250.00* b) Energy charge of KSh15.00 per Unit for all Units consumed.
* If Method SC is used in conjunction with Method IT at the same supply terminals, then the combined Fixed Charge for both Methods of Charge shall be KSh500.00
METHOD CI1: Applicable to Commercial and Industrial Consumers for supplies provided
and metered by the Company at 415 volts three phase four‐wire and whose consumption exceeds 15,000 Units per Billing Period. a) A Fixed Charge of KSh2,200.00
b) Energy charge of KSh11.60per Unit consumed. c) Demand charge of KSh800.00 per kVA.
METHOD CI2: Applicable to Commercial and Industrial Consumers for supplies provided
and metered by the Company at 11,000 volts, per Billing Period. a) A Fixed Charge of KSh4,500.00. b) Energy charge of KSh9.15 per Unit consumed. c) Demand charge of KSh520.00 per kVA.
METHOD CI3: Applicable to Commercial and Industrial Consumers for supplies provided
and metered by the Company at 33,000 volts, per Billing Period. a) A Fixed Charge of KSh5,000.00 b) Energy charge of KSh8.35 per Unit consumed. c) Demand charge of KSh270.00 per kVA
METHOD CI4: Applicable to Commercial and Industrial Consumers for supplies provided
and metered by the Company at 66,000 volts, per Billing Period. a) A Fixed Charge of KSh6,500.00 b) Energy charge of KSh8.00per Unit consumed. c) Demand charge of KSh220.00 per kVA.
METHOD CI5: Applicable to Commercial and Industrial Consumers for supplies provided
and metered by the Company at 132,000 volts, per Billing Period. a) A Fixed Charge of KSh17,000 b) Energy charge of KSh7.90 per Unit consumed. c) Demand charge of KSh220.00 per kVA.
METHOD IT: Interruptible off‐peak supplies of electrical energy to ordinary consumers
metered by the Company whose consumption does not exceed 15,000 Units per Billing Period. a) A Fixed Charge of KSh250.00* b) Energy charge of KSh15.30 per Unit consumed.
29
* If Method IT is used in conjunction with Method DC or SC at the same supply terminals, then the combined Fixed Charge for both Methods of Charge shall be KSh500.00
Notes:
Note 1 The electrical energy which shall be supplied and charged under this method of charge shall be available at all times other than during peak periods which shall be such periods of high demand as may occur during each day not exceeding sixteen hours in the aggregate and during which the supply of electrical energy may be restricted, the time or times of such restriction and the duration thereof being controlled by the Company at its sole discretion.
Note 2 This tariff is only available for installations so arranged to the Company's satisfaction, that they cannot be operated on any other tariff and also where there is no duplication of the off‐peak circuits by other electrical circuits unrestricted as to time of use so enabling the supply on another method of charge to be used for a similar function.
Note 3 The Company shall provide and maintain apparatus up to a maximum capacity of 15 amperes, single phase, to control the period of availability of the supply and shall take all reasonable steps to ensure the reliability thereof, but shall not be responsible for any loss, damage or injury which may result from any mal‐operation of this control equipment.
METHOD SL: Applicable to public and local authorities metered by the Company at 240
or 415 volts for supplies of electrical energy to public lamps (Street Lighting). a) A Fixed Charge of KSh250.00. b) Energy charge of KSh12.80 per Unit consumed
Supplies under this Method of Charge shall be available for a minimum
period of 11 hours per night for public lamps and for no other purpose.
The attention of public and local authorities taking supplies on this tariff is drawn to the fact that where public lamps are fitted on the Company's poles, all maintenance of the lamps, switch wire and associated equipment must be carried out by the Company, and shall be charged for on the basis of net costs of materials, labour and transport plus 25%.
Note: Every Consumer shall pay to the Company in addition to the charges specified in Part II of
this Schedule of Tariffs a Fixed Charge at a rate not exceeding KSh 50.00 per kVA per Billing Period of nameplate kVA continuous rating in respect of all electric welding plant, as adjusted by any power factor equipment in use.
Part II – (D) – Applicable 1stJuly 2015
30
METHOD DC: Applicable to Domestic Consumers metered by the Company at 240 or 415 volts and whose consumption does not exceed 15,000 Units per Billing Period.
a) A Fixed Charge of KSh300.00*
b) Energy charges of : i. KSh5.75 per Unit for 0 ‐ 50 Units consumed; ii. KSh13.64 per Unit for 51‐1,500 Units consumed; iii. KSh24.80 per Unit for Units consumed above 1,500.
* If Method DC is used in conjunction with Method IT at the same supply terminals, then the combined Fixed Charge for both Methods of Charge shall be KSh600.00.
METHOD SC: Applicable to non‐domestic Small Commercial Consumers metered by the
Company at 240 or 415 volts and whose consumption does not exceed 15,000 Units per Billing Period. a) A Fixed Charge of KSh300.00* b) Energy charge of KSh16.62 per Unit for all Units consumed.
* If Method SC is used in conjunction with Method IT at the same supply terminals, then the combined Fixed Charge for both Methods of Charge shall be KSh600.00
METHOD CI1: Applicable to Commercial and Industrial Consumers for supplies provided
and metered by the Company at 415 volts three phase four‐wire and whose consumption exceeds 15,000 Units per Billing Period. a) A Fixed Charge of KSh2,500.00 b) Energy charge of KSh13.00per Unit consumed. c) Demand charge of KSh800.00 per kVA.
METHOD CI2: Applicable to Commercial and Industrial Consumers for supplies provided
and metered by the Company at 11,000 volts, per Billing Period. a) A Fixed Charge of KSh5,000.00. b) Energy charge of KSh10.30 per Unit consumed. c) Demand charge of KSh520.00 per kVA.
METHOD CI3: Applicable to Commercial and Industrial Consumers for supplies provided
and metered by the Company at 33,000 volts, per Billing Period. a) A Fixed Charge of KSh6,000.00 b) Energy charge of KSh9.35 per Unit consumed. c) Demand charge of KSh270.00 per kVA
METHOD CI4: Applicable to Commercial and Industrial Consumers for supplies provided
and metered by the Company at 66,000 volts, per Billing Period. a) A Fixed Charge of KSh7,000.00 b) Energy charge of KSh9.05 per Unit consumed. c) Demand charge of KSh220.00 per kVA.
METHOD CI5: Applicable to Commercial and Industrial Consumers for supplies provided
and metered by the Company at 132,000 volts, per Billing Period. a) A Fixed Charge of KSh18,000
31
b) Energy charge of KSh8.90 per Unit consumed. c) Demand charge of KSh220.00 per kVA.
METHOD IT: Interruptible off‐peak supplies of electrical energy to ordinary consumers
metered by the Company whose consumption does not exceed 15,000 Units per Billing Period. a) A Fixed Charge of KSh300.00* b) Energy charge of KSh16.60 per Unit consumed.
* If Method IT is used in conjunction with Method DC or SC at the same supply
terminals, then the combined Fixed Charge for both Methods of Charge shall be KSh600.00
Notes:
Note 1 The electrical energy which shall be supplied and charged under this method of charge shall be available at all times other than during peak periods which shall be such periods of high demand as may occur during each day not exceeding sixteen hours in the aggregate and during which the supply of electrical energy may be restricted, the time or times of such restriction and the duration thereof being controlled by the Company at its sole discretion.
Note 2 This tariff is only available for installations so arranged to the Company's satisfaction, that they cannot be operated on any other tariff and also where there is no duplication of the off‐peak circuits by other electrical circuits unrestricted as to time of use so enabling the supply on another method of charge to be used for a similar function.
Note 3 The Company shall provide and maintain apparatus up to a maximum capacity of 15 amperes, single phase, to control the period of availability of the supply and shall take all reasonable steps to ensure the reliability thereof, but shall not be responsible for any loss, damage or injury which may result from any mal‐operation of this control equipment.
METHOD SL: Applicable to public and local authorities metered by the Company at 240
or 415 volts for supplies of electrical energy to public lamps (Street Lighting). a) A Fixed Charge of KSh300.00. b) Energy charge of KSh14.00 per Unit consumed
Supplies under this Method of Charge shall be available for a minimum period of 11 hours per night for public lamps and for no other purpose.
The attention of public and local authorities taking supplies on this tariff is drawn to the fact that where public lamps are fitted on the Company's poles, all maintenance of the lamps, switch wire and associated equipment must be carried out by the Company, and shall be charged for on the basis of net costs of materials, labour and transport plus 25%.
Note:
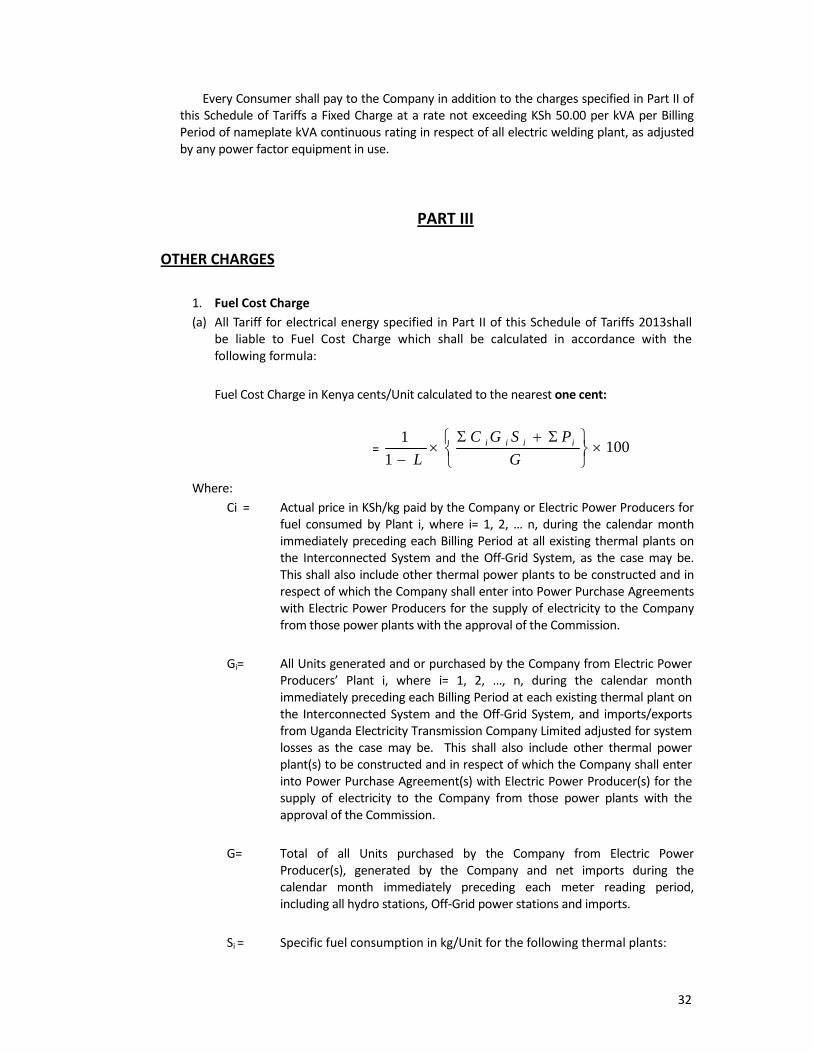
32
Every Consumer shall pay to the Company in addition to the charges specified in Part II of this Schedule of Tariffs a Fixed Charge at a rate not exceeding KSh 50.00 per kVA per Billing Period of nameplate kVA continuous rating in respect of all electric welding plant, as adjusted by any power factor equipment in use.
PART III
OTHER CHARGES
1. Fuel Cost Charge (a) All Tariff for electrical energy specified in Part II of this Schedule of Tariffs 2013shall
be liable to Fuel Cost Charge which shall be calculated in accordance with the following formula: Fuel Cost Charge in Kenya cents/Unit calculated to the nearest one cent:
= 1001
1×
⎭⎬⎫
⎩⎨⎧ Σ+Σ
×− G
PSGCL
iiii
Where: Ci = Actual price in KSh/kg paid by the Company or Electric Power Producers for
fuel consumed by Plant i, where i= 1, 2, … n, during the calendar month immediately preceding each Billing Period at all existing thermal plants on the Interconnected System and the Off‐Grid System, as the case may be. This shall also include other thermal power plants to be constructed and in respect of which the Company shall enter into Power Purchase Agreements with Electric Power Producers for the supply of electricity to the Company from those power plants with the approval of the Commission.
Gi= All Units generated and or purchased by the Company from Electric Power
Producers’ Plant i, where i= 1, 2, …, n, during the calendar month immediately preceding each Billing Period at each existing thermal plant on the Interconnected System and the Off‐Grid System, and imports/exports from Uganda Electricity Transmission Company Limited adjusted for system losses as the case may be. This shall also include other thermal power plant(s) to be constructed and in respect of which the Company shall enter into Power Purchase Agreement(s) with Electric Power Producer(s) for the supply of electricity to the Company from those power plants with the approval of the Commission.
G= Total of all Units purchased by the Company from Electric Power
Producer(s), generated by the Company and net imports during the calendar month immediately preceding each meter reading period, including all hydro stations, Off‐Grid power stations and imports.
Si = Specific fuel consumption in kg/Unit for the following thermal plants:
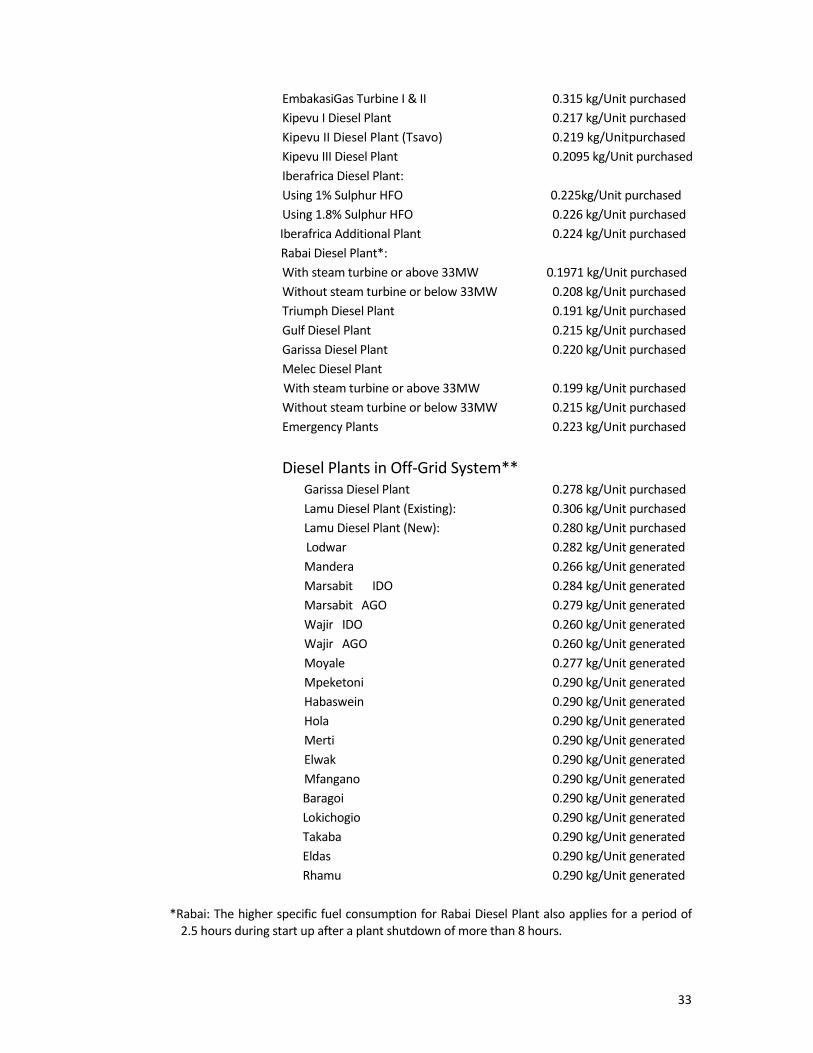
33
EmbakasiGas Turbine I & II 0.315 kg/Unit purchased Kipevu I Diesel Plant 0.217 kg/Unit purchased Kipevu II Diesel Plant (Tsavo) 0.219 kg/Unitpurchased Kipevu III Diesel Plant 0.2095 kg/Unit purchased Iberafrica Diesel Plant: Using 1% Sulphur HFO 0.225kg/Unit purchased Using 1.8% Sulphur HFO 0.226 kg/Unit purchased Iberafrica Additional Plant 0.224 kg/Unit purchased Rabai Diesel Plant*:
With steam turbine or above 33MW 0.1971 kg/Unit purchased Without steam turbine or below 33MW 0.208 kg/Unit purchased Triumph Diesel Plant 0.191 kg/Unit purchased Gulf Diesel Plant 0.215 kg/Unit purchased Garissa Diesel Plant 0.220 kg/Unit purchased Melec Diesel Plant
With steam turbine or above 33MW 0.199 kg/Unit purchased Without steam turbine or below 33MW 0.215 kg/Unit purchased Emergency Plants 0.223 kg/Unit purchased
Diesel Plants in Off‐Grid System**
Garissa Diesel Plant 0.278 kg/Unit purchased Lamu Diesel Plant (Existing): 0.306 kg/Unit purchased Lamu Diesel Plant (New): 0.280 kg/Unit purchased Lodwar 0.282 kg/Unit generated Mandera 0.266 kg/Unit generated Marsabit IDO 0.284 kg/Unit generated Marsabit AGO 0.279 kg/Unit generated Wajir IDO 0.260 kg/Unit generated Wajir AGO 0.260 kg/Unit generated Moyale 0.277 kg/Unit generated Mpeketoni 0.290 kg/Unit generated Habaswein 0.290 kg/Unit generated Hola 0.290 kg/Unit generated Merti 0.290 kg/Unit generated Elwak 0.290 kg/Unit generated Mfangano 0.290 kg/Unit generated Baragoi 0.290 kg/Unit generated Lokichogio 0.290 kg/Unit generated Takaba 0.290 kg/Unit generated Eldas 0.290 kg/Unit generated Rhamu 0.290 kg/Unit generated
*Rabai: The higher specific fuel consumption for Rabai Diesel Plant also applies for a period of 2.5 hours during start up after a plant shutdown of more than 8 hours.
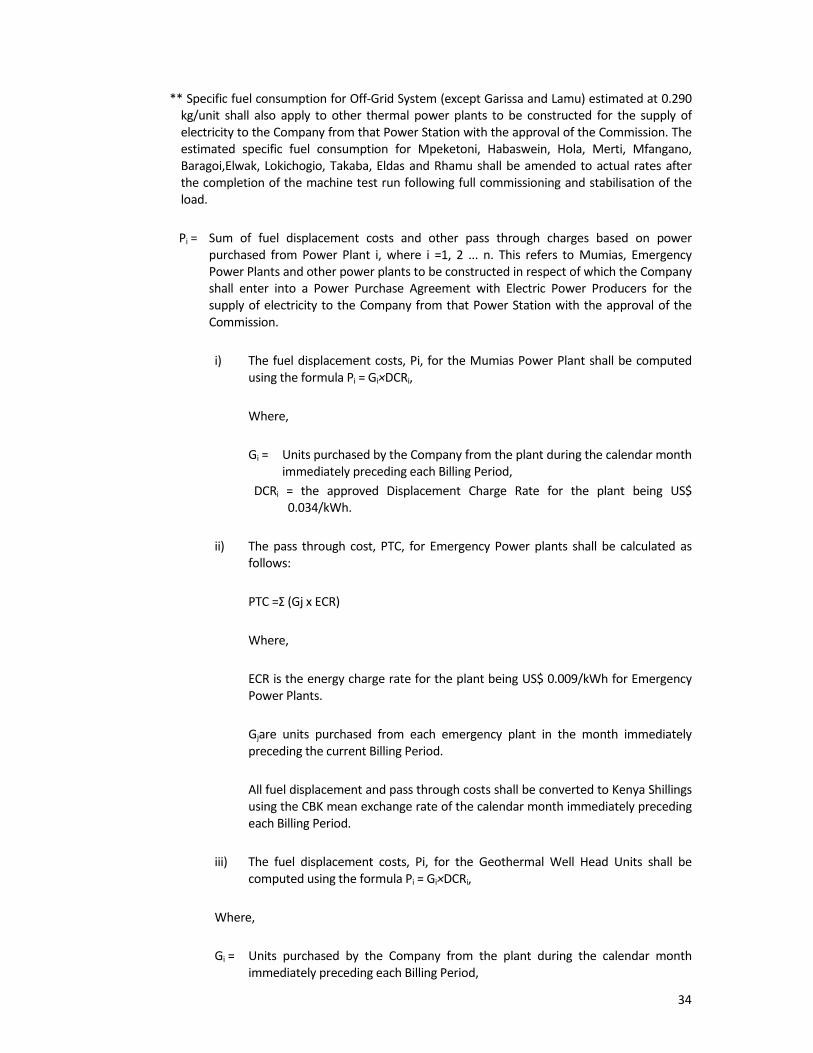
34
** Specific fuel consumption for Off‐Grid System (except Garissa and Lamu) estimated at 0.290 kg/unit shall also apply to other thermal power plants to be constructed for the supply of electricity to the Company from that Power Station with the approval of the Commission. The estimated specific fuel consumption for Mpeketoni, Habaswein, Hola, Merti, Mfangano, Baragoi,Elwak, Lokichogio, Takaba, Eldas and Rhamu shall be amended to actual rates after the completion of the machine test run following full commissioning and stabilisation of the load.
Pi = Sum of fuel displacement costs and other pass through charges based on power purchased from Power Plant i, where i =1, 2 ... n. This refers to Mumias, Emergency Power Plants and other power plants to be constructed in respect of which the Company shall enter into a Power Purchase Agreement with Electric Power Producers for the supply of electricity to the Company from that Power Station with the approval of the Commission. i) The fuel displacement costs, Pi, for the Mumias Power Plant shall be computed
using the formula Pi = Gi×DCRi,
Where,
Gi = Units purchased by the Company from the plant during the calendar month immediately preceding each Billing Period,
DCRi = the approved Displacement Charge Rate for the plant being US$ 0.034/kWh.
ii) The pass through cost, PTC, for Emergency Power plants shall be calculated as
follows: PTC =Σ (Gj x ECR) Where, ECR is the energy charge rate for the plant being US$ 0.009/kWh for Emergency
Power Plants. Gjare units purchased from each emergency plant in the month immediately
preceding the current Billing Period. All fuel displacement and pass through costs shall be converted to Kenya Shillings
using the CBK mean exchange rate of the calendar month immediately preceding each Billing Period.
iii) The fuel displacement costs, Pi, for the Geothermal Well Head Units shall be
computed using the formula Pi = Gi×DCRi, Where, Gi = Units purchased by the Company from the plant during the calendar month
immediately preceding each Billing Period,

35
DCRi = the approved Displacement Charge Rate for the plant being US$ 0.0595/kWh
iv) The fuel displacement costs, Pi, for the Aeolus, Kipeto and Prunus Power
Plants shall be computed using the formula Pi = Gi×DCRi, Where, Gi = Units purchased by the Company from the plant during the calendar month
immediately preceding each Billing Period, DCRi = the approved Displacement Charge Rate for the plant being US$
0.084/kWh v) The fuel displacement costs, Pi, for Power Plant plants procured through
the FiT Policyshall be computed using the formula Pi = Gi×DCRi, Where, Gi = Units purchased by the Company from the plant during the calendar month
immediately preceding each Billing Period, DCRi = the approved Displacement Charge Rate for the plant being 70% of the
applicable FiT tariff vi) The fuel displacement costs, Pi, for the Lake Turkana Wind Power Plant
shall be computed using the formula Pi = Gi×DCRi, Where, Gi = aggregate of NEOp1 +0.5*NEOp2 + DGEp NEOp1 = the aggregate Net Electrical Output (kWh) of the Plant in that month, when
the cumulative sum of the Net Electrical Output and the Deemed Generated Energy in the Operating Year to date that is already invoiced for is equal to or less than 1,445,400,000 KWh.
NEOp2 = the aggregate Net Electrical Output (kWh) of the wind farm in that month, when the
cumulative sum of the Net Electrical Output and the Deemed Generated Energy in the Operating Year to date that is already payable is greater than 1,445,400,000 KWh.
DGEp = the aggregate Deemed Generated Energy (kWh) of the Plant in that month, when
the cumulative sum of the Net Electrical Output and the Deemed Generated Energy in the Operating Year to date that is already payable for is equal to or less than 1,445,400,000 KWh.

36
DCRi = aggregate of DCRi1 + DCRi2 DCRi1 = the approved Displacement Charge Rate for the plant being
€0.05264/kWh DCRi2 = the approved Displacement Charge Rate for the plant being €0.023/kWh
to cater for the difference between Feed‐in‐Tariff and energy plant converted using base exchange rate
L = Target System loss factor in transmission and distribution equal to 17.5% in
2012/13, 17.3% in 2013/14,17.1% in 2014/15 and 16.9% in 2015/16.
(b) The Company shall publish each month a notice in the Kenya Gazette showing the Fuel Cost Charge rate applicable to all Units billed during the month of publication of such notice.
2. Foreign Exchange Rate Fluctuation Adjustment
(a) All prices for electrical energy specified in Part II of the Schedule of Tariffs shall be liable
to Foreign Exchange Rate Fluctuation Adjustment which shall be calculated in accordance with the following formula:
Foreign Exchange Rate Fluctuation Adjustment in Kenya cents/Unit calculated to the nearest one cent
tFERFA =L−1
1×{ ( ( ) ) (( ) ) ( ( ) )
GXZIPPXZHXZF ottottott ××Σ+××Σ+××Σ −−− 111 }×100
Where,
1−tF = Sum of the foreign currency costs incurred by KenGen in the calendar month
immediately preceding current Billing Period.
1−tH = Sum of the foreign currency costs incurred by the Company other than those costs
relating to Electric Power Producers in the calendar month immediately preceding current Billing Period.
1−tIPP = Sum of the foreign currency costs paid by the Company to Electric Power Producers
(except KenGen) in the calendar month immediately preceding current Billing Period.
The factor Zt is the proportionate change in the exchange rate (Xt) in the current
Billing Period t from the Base Exchange rate (Xo) in the base period and shall be determined according to the following formula:
Zt= o
ot
XXX −

37
Where;
tX = CBK mean exchange rate for the calendar month immediately
preceding current Billing Period.
oX = CBK mean exchange rate as tabulated below.
CBK Mean Exchange Rates
Foreign Currency September
2012 May 2009 March 2008
US Dollar 84.6133 77.8614 64.9242STG Pound 136.2555 120.0302 130.0783 Euro 108.7977 106.2277 100.7930 SA Rand 10.2256 9.2839 8.1443 AE Dirham 23.0367 21.1988 17.6814Canadian Dollar 86.4971 67.5520 65.0696Swiss Francs 90.0162 70.2685 64.1707 JPY(100) 108.2463 80.6318 64.0416 SW Kroner 12.8098 10.0445 10.6474 NOR Kroner 14.7146 12.0684 12.8074 DAN Kroner 14.5971 14.2576 13.4244IND Rupee 1.5516 1.6044 1.6104 Hongkong Dollar 10.9119 10.0450 8.3401 Saudi Riyal 22.5626 20.7623 17.3168
Chinese Yuan 13.3844 11.4092 9.1613
Australian Dollar 87.9535 59.4860 60.0525
Note: The CBK mean exchange rates for May 2009 and March 2008 shall only apply to
KenGen Kenya shillings denominated charge rates as stipulated in the Power Purchase Agreements.
G= Total of all Units purchased by the Company from Electric Power Producer(s), generated by the Company and net imports during the calendar month immediately preceding each meter reading period, including all hydro stations, Off‐Grid power stations and imports.
L = Target System loss factor in transmission and distribution equal to 17.5% in 2012/13, 17.3% in 2013/14, 17.1% in 2014/15 and 16.9% in 2015/16.
(b) The Company shall publish a notice in the Kenya Gazette showing the amount of the
Foreign Exchange Rate Fluctuation Adjustment applicable to all Unit charges specified in Part II of the Schedule of Tariffs for all meter readings taken during the month of publication of the said notice.
3. Inflation Adjustment
(a) All prices for electrical energy specified in Part II of the Schedule of Tariffs shall be liable
to an Automatic adjustment for inflation at the end of every six month period starting from 1st July, 2011.
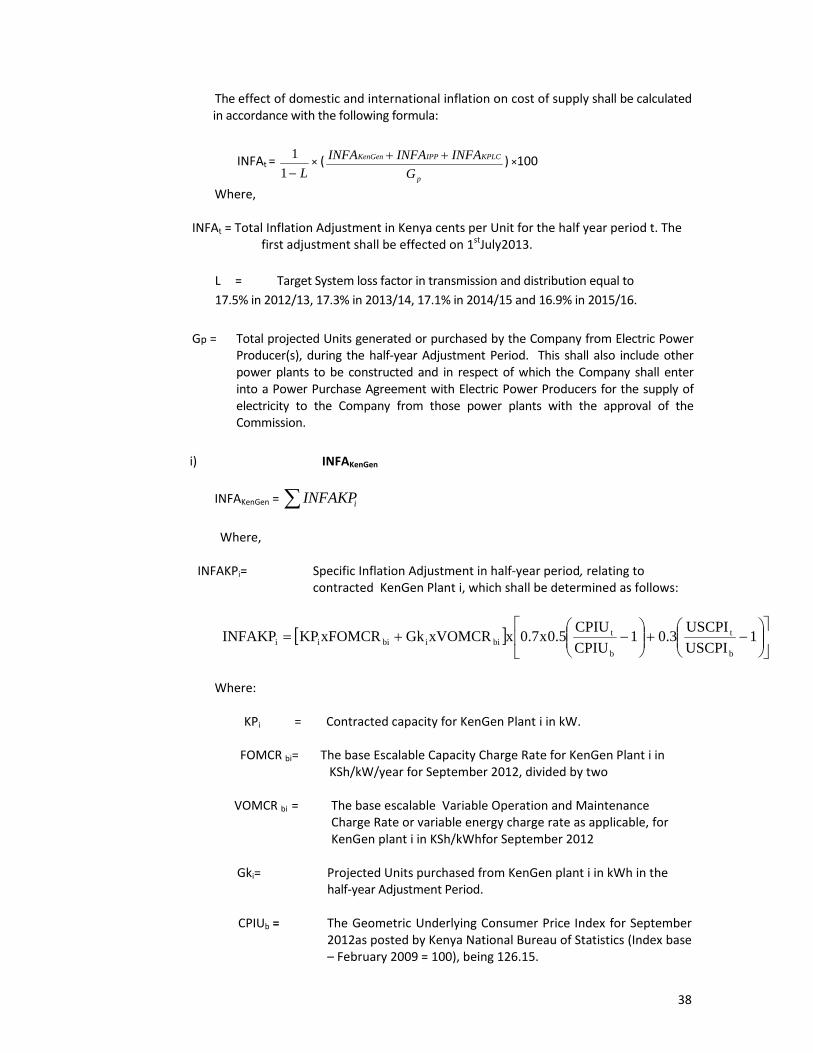
38
The effect of domestic and international inflation on cost of supply shall be calculated in accordance with the following formula:
INFAt = L−1
1× (
p
KPLCIPPKenGen
GINFAINFAINFA ++ ) ×100
Where,
INFAt = Total Inflation Adjustment in Kenya cents per Unit for the half year period t. The first adjustment shall be effected on 1stJuly2013.
L = Target System loss factor in transmission and distribution equal to 17.5% in 2012/13, 17.3% in 2013/14, 17.1% in 2014/15 and 16.9% in 2015/16.
Gp = Total projected Units generated or purchased by the Company from Electric Power
Producer(s), during the half‐year Adjustment Period. This shall also include other power plants to be constructed and in respect of which the Company shall enter into a Power Purchase Agreement with Electric Power Producers for the supply of electricity to the Company from those power plants with the approval of the Commission.
i) INFAKenGen
INFAKenGen = ∑ iINFAKP
Where,
INFAKPi= Specific Inflation Adjustment in half‐year period, relating to
contracted KenGen Plant i, which shall be determined as follows:
[ ] ⎥⎦
⎤⎢⎣
⎡⎟⎟⎠
⎞⎜⎜⎝
⎛−+⎟⎟
⎠
⎞⎜⎜⎝
⎛−+= 1
USCPIUSCPI3.01
CPIUCPIU5.0x7.0xxVOMCRGkxFOMCRKPINFAKP
b
t
b
tbiibiii
Where:
KPi = Contracted capacity for KenGen Plant i in kW.
FOMCR bi= The base Escalable Capacity Charge Rate for KenGen Plant i in
KSh/kW/year for September 2012, divided by two
VOMCR bi = The base escalable Variable Operation and Maintenance Charge Rate or variable energy charge rate as applicable, for KenGen plant i in KSh/kWhfor September 2012
Gki= Projected Units purchased from KenGen plant i in kWh in the
half‐year Adjustment Period. CPIUb = The Geometric Underlying Consumer Price Index for September
2012as posted by Kenya National Bureau of Statistics (Index base – February 2009 = 100), being 126.15.
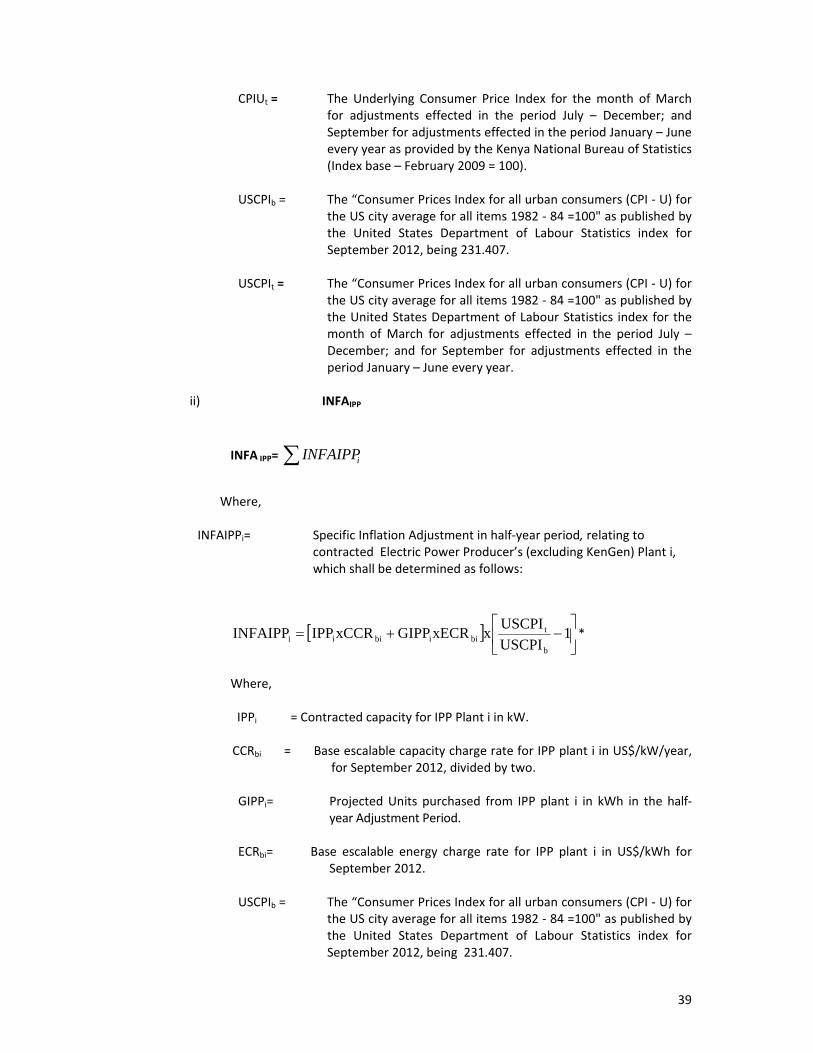
39
CPIUt = The Underlying Consumer Price Index for the month of March for adjustments effected in the period July – December; and September for adjustments effected in the period January – June every year as provided by the Kenya National Bureau of Statistics (Index base – February 2009 = 100).
USCPIb = The “Consumer Prices Index for all urban consumers (CPI ‐ U) for
the US city average for all items 1982 ‐ 84 =100" as published by the United States Department of Labour Statistics index for September 2012, being 231.407.
USCPIt = The “Consumer Prices Index for all urban consumers (CPI ‐ U) for
the US city average for all items 1982 ‐ 84 =100" as published by the United States Department of Labour Statistics index for the month of March for adjustments effected in the period July – December; and for September for adjustments effected in the period January – June every year.
ii) INFAIPP
INFA IPP= ∑ iINFAIPP
Where,
INFAIPPi= Specific Inflation Adjustment in half‐year period, relating to contracted Electric Power Producer’s (excluding KenGen) Plant i, which shall be determined as follows:
[ ] ⎥⎦
⎤⎢⎣
⎡−+= 1
USCPIUSCPIxxECRGIPPxCCRIPPINFAIPP
b
tbiibiii *
Where,
IPPi = Contracted capacity for IPP Plant i in kW.
CCRbi = Base escalable capacity charge rate for IPP plant i in US$/kW/year,
for September 2012, divided by two. GIPPi= Projected Units purchased from IPP plant i in kWh in the half‐
year Adjustment Period.
ECRbi= Base escalable energy charge rate for IPP plant i in US$/kWh for September 2012.
USCPIb = The “Consumer Prices Index for all urban consumers (CPI ‐ U) for
the US city average for all items 1982 ‐ 84 =100" as published by the United States Department of Labour Statistics index for September 2012, being 231.407.
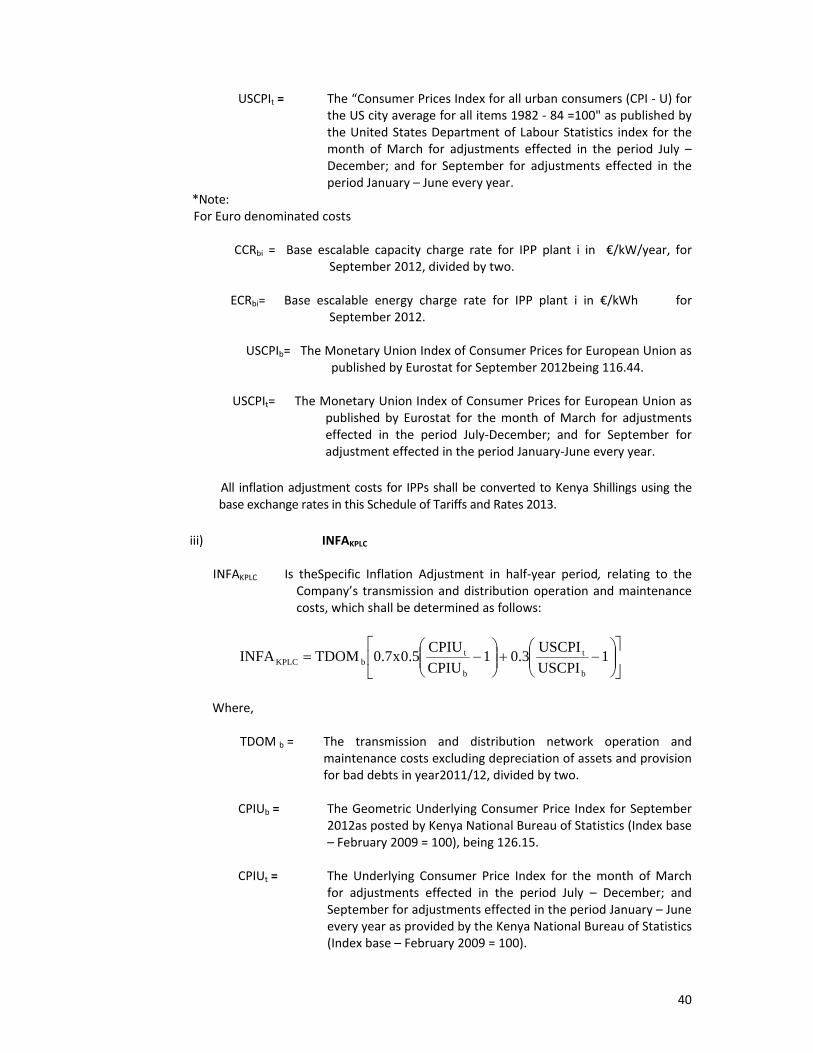
40
USCPIt = The “Consumer Prices Index for all urban consumers (CPI ‐ U) for the US city average for all items 1982 ‐ 84 =100" as published by the United States Department of Labour Statistics index for the month of March for adjustments effected in the period July – December; and for September for adjustments effected in the period January – June every year.
*Note: For Euro denominated costs
CCRbi = Base escalable capacity charge rate for IPP plant i in €/kW/year, for September 2012, divided by two.
ECRbi= Base escalable energy charge rate for IPP plant i in €/kWh for
September 2012.
USCPIb= The Monetary Union Index of Consumer Prices for European Union as published by Eurostat for September 2012being 116.44.
USCPIt= The Monetary Union Index of Consumer Prices for European Union as
published by Eurostat for the month of March for adjustments effected in the period July‐December; and for September for adjustment effected in the period January‐June every year.
All inflation adjustment costs for IPPs shall be converted to Kenya Shillings using the base exchange rates in this Schedule of Tariffs and Rates 2013.
iii) INFAKPLC
INFAKPLC Is theSpecific Inflation Adjustment in half‐year period, relating to the
Company’s transmission and distribution operation and maintenance costs, which shall be determined as follows:
⎥⎦
⎤⎢⎣
⎡⎟⎟⎠
⎞⎜⎜⎝
⎛−+⎟⎟
⎠
⎞⎜⎜⎝
⎛−= 1
USCPIUSCPI3.01
CPIUCPIU5.0x7.0TDOMINFA
b
t
b
tbKPLC
Where,
TDOM b = The transmission and distribution network operation and
maintenance costs excluding depreciation of assets and provision for bad debts in year2011/12, divided by two.
CPIUb = The Geometric Underlying Consumer Price Index for September
2012as posted by Kenya National Bureau of Statistics (Index base – February 2009 = 100), being 126.15.
CPIUt = The Underlying Consumer Price Index for the month of March
for adjustments effected in the period July – December; and September for adjustments effected in the period January – June every year as provided by the Kenya National Bureau of Statistics (Index base – February 2009 = 100).
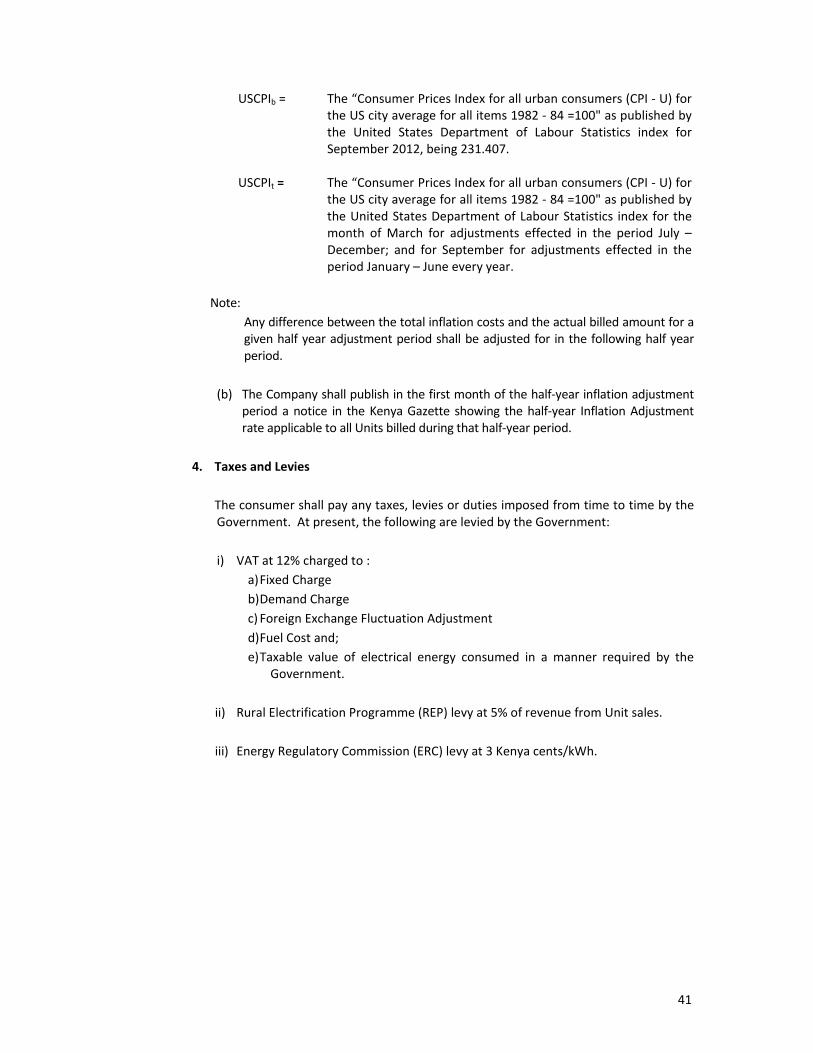
41
USCPIb = The “Consumer Prices Index for all urban consumers (CPI ‐ U) for the US city average for all items 1982 ‐ 84 =100" as published by the United States Department of Labour Statistics index for September 2012, being 231.407.
USCPIt = The “Consumer Prices Index for all urban consumers (CPI ‐ U) for
the US city average for all items 1982 ‐ 84 =100" as published by the United States Department of Labour Statistics index for the month of March for adjustments effected in the period July – December; and for September for adjustments effected in the period January – June every year.
Note: Any difference between the total inflation costs and the actual billed amount for a
given half year adjustment period shall be adjusted for in the following half year period.
(b) The Company shall publish in the first month of the half‐year inflation adjustment
period a notice in the Kenya Gazette showing the half‐year Inflation Adjustment rate applicable to all Units billed during that half‐year period.
4. Taxes and Levies
The consumer shall pay any taxes, levies or duties imposed from time to time by the Government. At present, the following are levied by the Government:
i) VAT at 12% charged to :
a) Fixed Charge b) Demand Charge c) Foreign Exchange Fluctuation Adjustment d) Fuel Cost and; e) Taxable value of electrical energy consumed in a manner required by the
Government.
ii) Rural Electrification Programme (REP) levy at 5% of revenue from Unit sales.
iii) Energy Regulatory Commission (ERC) levy at 3 Kenya cents/kWh.

42
PART IV
OTHER IMPORTANT CONDITIONS
a) In the event of the supply of electrical energy to the installation of any Consumer
having a Power Factor of less than 0.90, then the Company may give to such Consumer thirty days notice in writing requiring him to improve the Power Factor of his installation to or in excess of 0.90.
b) If a Consumer fails to comply with such notice as aforesaid, then and in any such case,
the Company shall be at liberty until such time as the Power Factor of such Consumer’s installation is, or is in excess of 0.90 to impose a surcharge as follows:‐
i) for Consumers charged under Methods DC, SC, SL and IT, the payment for electrical energy consumed in each Billing Period (exclusive of VAT, Fuel Cost, Foreign Exchange Rate Fluctuation Adjustment, REP and ERC levies) shall be increased by 2 per cent for each complete 1 per cent by which the power factor is below 0.90.
ii) for Consumers charged under Methods CI ‐ the payment for electrical energy
consumed and chargeable KVA of Demand in each Billing Period (exclusive of VAT, Fuel Cost, Foreign Exchange Rate Fluctuation Adjustment, REP and ERC levies) shall be increased by 2 per cent for each complete 1 per cent by which the Power Factor is below 0.90.
c) Any apparatus installed by the Company for the purpose of ascertaining the power factor of any Consumer's installation or of any part thereof shall be installed and maintained at the sole expense of the Company.
d) The Company shall determine the voltage at which a supply of electrical energy shall be
provided to any Consumer’s supply terminals and this voltage shall be maintained by the Company subject to the permissible variations as provided for in the Act.
43
REPUBLIC OF KENYA THE ENERGY ACT 2006
Pursuant to Section 45 of The Energy Act 2006 I hereby approve the Schedule of Tariffs and
Rates 2013 for supply of electricity by KPLC attached hereto, to come into force on the
............... day of ..................., 2013.
APPROVED................................................ ENG. JOHN MWIRICHIA DIRECTOR GENERAL ENERGY REGULATORY COMMISSION
Dated at NAIROBI this ..................... day of ........................................., 2013
Pursuant to the above Approval, the Schedule of Tariffs and Rates 2011 are made this .............................. day of .............................................., 2013
MANAGING DIRECTOR & CEO THE KENYA POWER & LIGHTING COMPANY LIMITED
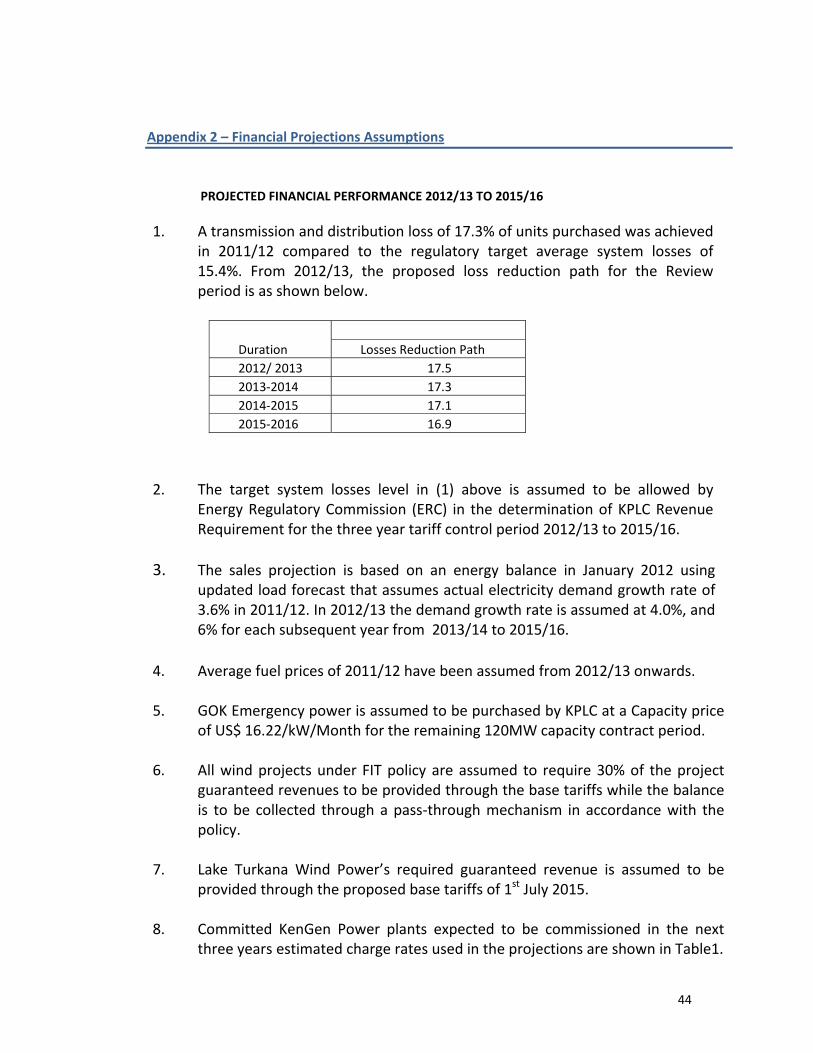
44
Appendix 2 – Financial Projections Assumptions
PROJECTED FINANCIAL PERFORMANCE 2012/13 TO 2015/16
1. A transmission and distribution loss of 17.3% of units purchased was achieved in 2011/12 compared to the regulatory target average system losses of 15.4%. From 2012/13, the proposed loss reduction path for the Review period is as shown below.
2. The target system losses level in (1) above is assumed to be allowed by Energy Regulatory Commission (ERC) in the determination of KPLC Revenue Requirement for the three year tariff control period 2012/13 to 2015/16.
3. The sales projection is based on an energy balance in January 2012 using
updated load forecast that assumes actual electricity demand growth rate of 3.6% in 2011/12. In 2012/13 the demand growth rate is assumed at 4.0%, and 6% for each subsequent year from 2013/14 to 2015/16.
4. Average fuel prices of 2011/12 have been assumed from 2012/13 onwards.
5. GOK Emergency power is assumed to be purchased by KPLC at a Capacity price
of US$ 16.22/kW/Month for the remaining 120MW capacity contract period.
6. All wind projects under FIT policy are assumed to require 30% of the project guaranteed revenues to be provided through the base tariffs while the balance is to be collected through a pass‐through mechanism in accordance with the policy.
7. Lake Turkana Wind Power’s required guaranteed revenue is assumed to be
provided through the proposed base tariffs of 1st July 2015.
8. Committed KenGen Power plants expected to be commissioned in the next three years estimated charge rates used in the projections are shown in Table1.
Duration
Losses Reduction Path 2012/ 2013 17.5 2013‐2014 17.3 2014‐2015 17.1 2015‐2016 16.9
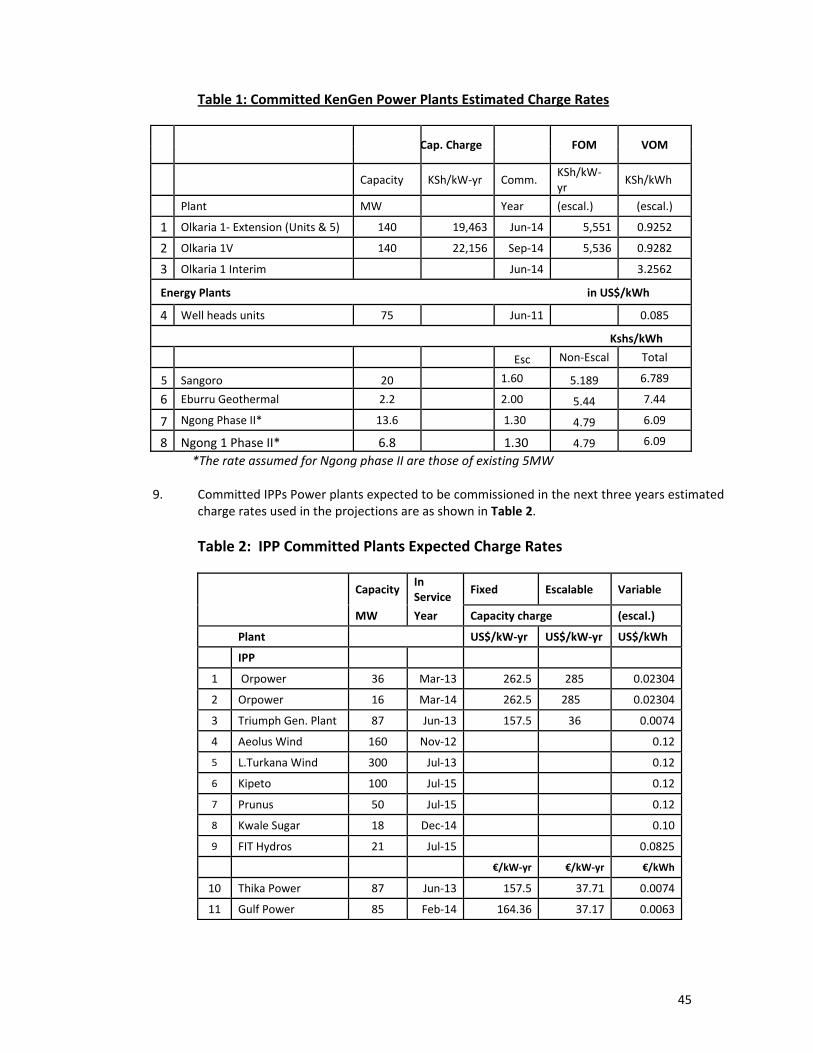
45
Table 1: Committed KenGen Power Plants Estimated Charge Rates
Cap. Charge FOM VOM
Capacity KSh/kW‐yr Comm.
KSh/kW‐yr
KSh/kWh
Plant MW Year (escal.) (escal.)
1 Olkaria 1‐ Extension (Units & 5) 140 19,463 Jun‐14 5,551 0.9252
2 Olkaria 1V 140 22,156 Sep‐14 5,536 0.9282
3 Olkaria 1 Interim Jun‐14 3.2562
Energy Plants in US$/kWh
4 Well heads units 75 Jun‐11 0.085
Kshs/kWh
Esc Non‐Escal Total
5 Sangoro 20 1.60 5.189 6.789
6 Eburru Geothermal 2.2 2.00 5.44 7.44
7 Ngong Phase II* 13.6 1.30 4.79 6.09
8 Ngong 1 Phase II* 6.8 1.30 4.79 6.09
*The rate assumed for Ngong phase II are those of existing 5MW
9. Committed IPPs Power plants expected to be commissioned in the next three years estimated charge rates used in the projections are as shown in Table 2. Table 2: IPP Committed Plants Expected Charge Rates
Capacity In Service
Fixed Escalable Variable
MW Year Capacity charge (escal.)
Plant US$/kW‐yr US$/kW‐yr US$/kWh
IPP
1 Orpower 36 Mar‐13 262.5 285 0.02304
2 Orpower 16 Mar‐14 262.5 285 0.02304
3 Triumph Gen. Plant 87 Jun‐13 157.5 36 0.0074
4 Aeolus Wind 160 Nov‐12 0.12
5 L.Turkana Wind 300 Jul‐13 0.12
6 Kipeto 100 Jul‐15 0.12
7 Prunus 50 Jul‐15 0.12
8 Kwale Sugar 18 Dec‐14 0.10
9 FIT Hydros 21 Jul‐15 0.0825
€/kW‐yr €/kW‐yr €/kWh
10 Thika Power 87 Jun‐13 157.5 37.71 0.0074
11 Gulf Power 85 Feb‐14 164.36 37.17 0.0063

46
10. Local and foreign inflation rates recorded upto September 2012 was used to project costs in September 2012 prices. Thereafter, any escalation in cost is assumed to be recovered in future by the allowed a pass‐through mechanism formula.
11. CBK mean Exchange rates for major currencies for month of September 2012 have been
assumed as base rates from 2012/13 onwards. There have not been escalated for future period because inflation impact is now provided for as a pass‐through element.
12. Local interest rate/overdraft rate for the entire period from 2012/13 is assumed at 14%,
whereas the foreign interest rate has been pegged to 9%.
13. A 20% Ordinary stock dividend payment has been assumed from 2012/13 onwards.
14. Bad debts have been assumed at 2.5% of total electricity revenue for 2012/13 onwards.
15. The recorded stock level in 2011/12 was Kshs.10,286 million. The stock balance grows by 5% of additional plant in service on average from 2012/13 onwards to take into account the resources required for the accelerated new customer creation initiative.
16. The creditors’ period has been assumed to be an average of 35 days.
17. Electricity debtors are assumed to be sustained at 42 days of total electricity revenue in
2012/13 annually. The collection from Government Ministries, Local Authorities and Parastatals will be pursued with assistance from Ministry of Energy.
18. Debtors, other than electricity ones and Rural Electrification Schemes, are assumed to be
equal to approximately 19% the level of electricity debtors based on five years average historical
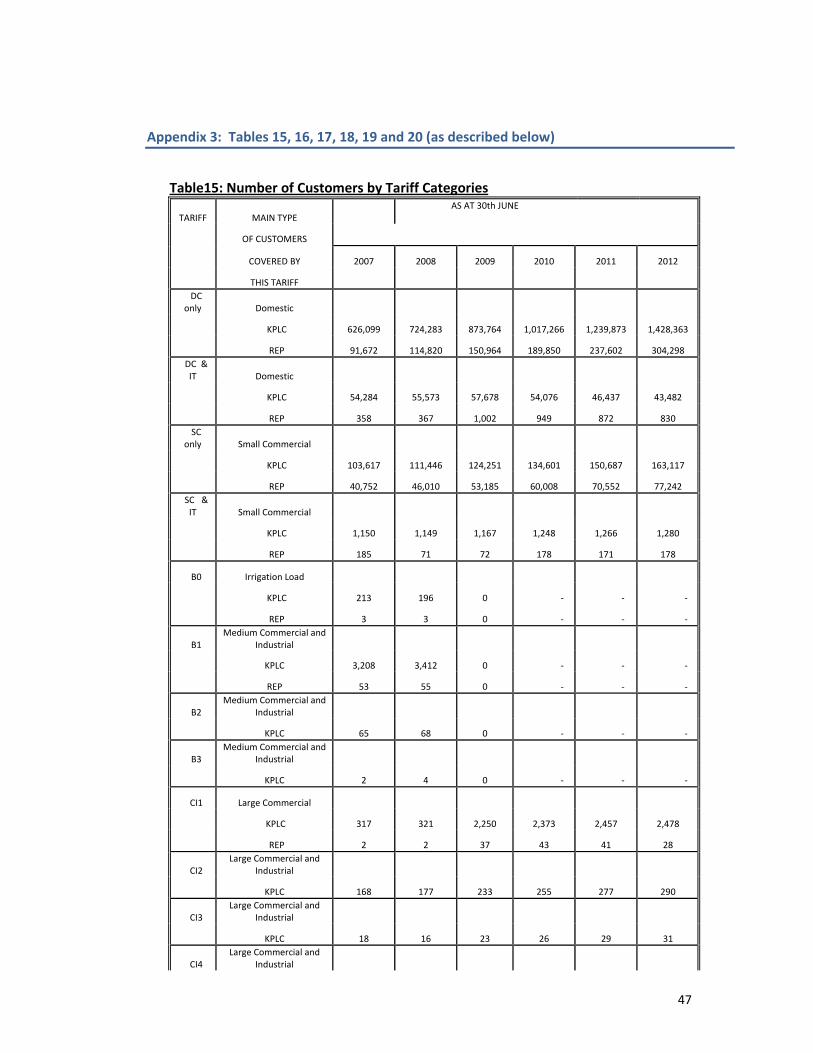
47
Appendix 3: Tables 15, 16, 17, 18, 19 and 20 (as described below)
Table15: Number of Customers by Tariff Categories
TARIFF MAIN TYPE AS AT 30th JUNE
OF CUSTOMERS
COVERED BY 2007 2008 2009 2010 2011 2012
THIS TARIFF DC only Domestic
KPLC 626,099 724,283 873,764 1,017,266 1,239,873 1,428,363
REP 91,672 114,820 150,964 189,850 237,602 304,298 DC &
IT Domestic
KPLC 54,284 55,573 57,678 54,076 46,437 43,482
REP 358 367 1,002 949 872 830 SC only Small Commercial
KPLC 103,617 111,446 124,251 134,601 150,687 163,117
REP 40,752 46,010 53,185 60,008 70,552 77,242 SC &
IT Small Commercial
KPLC 1,150 1,149 1,167 1,248 1,266 1,280
REP 185 71 72 178 171 178
B0 Irrigation Load
KPLC 213 196 0 ‐ ‐ ‐
REP 3 3 0 ‐ ‐ ‐
B1 Medium Commercial and
Industrial
KPLC 3,208 3,412 0 ‐ ‐ ‐
REP 53 55 0 ‐ ‐ ‐
B2 Medium Commercial and
Industrial
KPLC 65 68 0 ‐ ‐ ‐
B3 Medium Commercial and
Industrial
KPLC 2 4 0 ‐ ‐ ‐
CI1 Large Commercial
KPLC 317 321 2,250 2,373 2,457 2,478
REP 2 2 37 43 41 28
CI2 Large Commercial and
Industrial
KPLC 168 177 233 255 277 290
CI3 Large Commercial and
Industrial
KPLC 18 16 23 26 29 31
CI4 Large Commercial and
Industrial
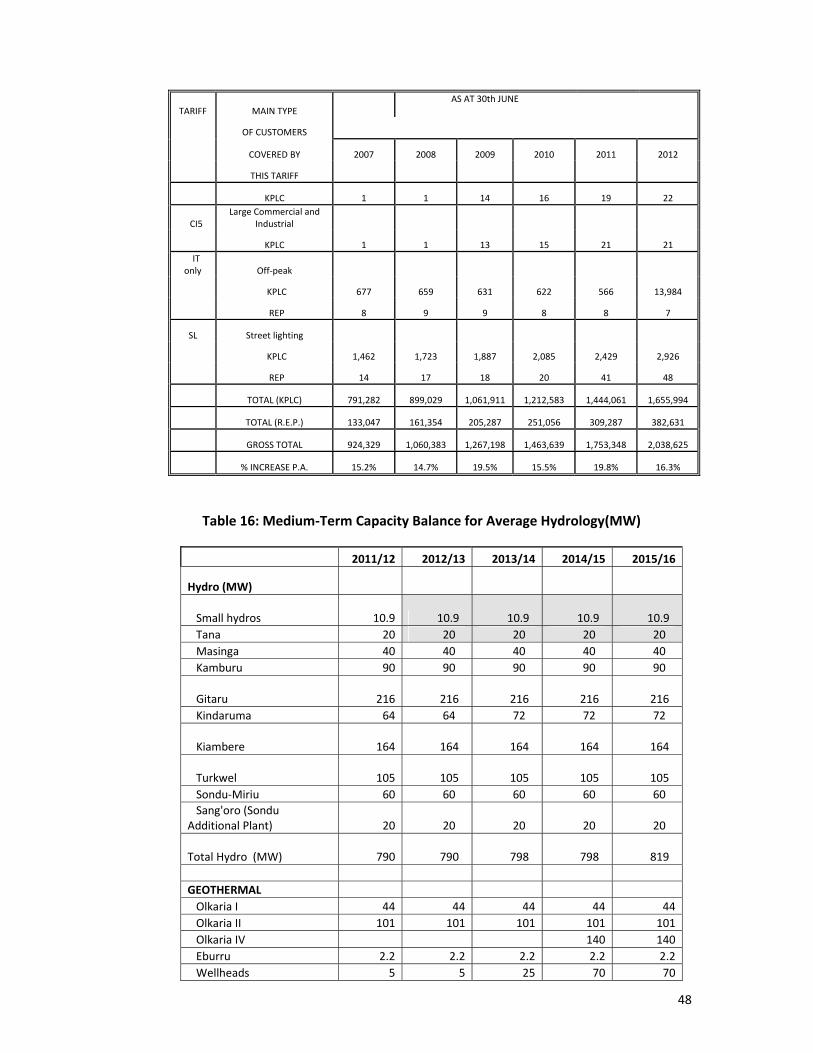
48
TARIFF MAIN TYPE AS AT 30th JUNE
OF CUSTOMERS
COVERED BY 2007 2008 2009 2010 2011 2012
THIS TARIFF
KPLC 1 1 14 16 19 22
CI5 Large Commercial and
Industrial
KPLC 1 1 13 15 21 21 IT only Off‐peak
KPLC 677 659 631 622 566 13,984
REP 8 9 9 8 8 7
SL Street lighting
KPLC 1,462 1,723 1,887 2,085 2,429 2,926
REP 14 17 18 20 41 48
TOTAL (KPLC) 791,282 899,029 1,061,911 1,212,583 1,444,061 1,655,994
TOTAL (R.E.P.) 133,047 161,354 205,287 251,056 309,287 382,631
GROSS TOTAL 924,329 1,060,383 1,267,198 1,463,639 1,753,348 2,038,625
% INCREASE P.A. 15.2% 14.7% 19.5% 15.5% 19.8% 16.3%
Table 16: Medium‐Term Capacity Balance for Average Hydrology(MW)
2011/12 2012/13 2013/14 2014/15 2015/16
Hydro (MW)
Small hydros
10.9 10.9 10.9 10.9 10.9 Tana 20 20 20 20 20 Masinga 40 40 40 40 40 Kamburu 90 90 90 90 90
Gitaru
216 216 216 216 216 Kindaruma 64 64 72 72 72
Kiambere
164 164 164 164 164
Turkwel
105 105 105 105 105 Sondu‐Miriu 60 60 60 60 60 Sang'oro (Sondu Additional Plant) 20 20 20 20 20
Total Hydro (MW)
790 790 798 798 819 GEOTHERMAL Olkaria I 44 44 44 44 44 Olkaria II 101 101 101 101 101 Olkaria IV 140 140 Eburru 2.2 2.2 2.2 2.2 2.2 Wellheads 5 5 25 70 70

49
2011/12 2012/13 2013/14 2014/15 2015/16 Olkaria I Life Extension 140 140 Total KenGen Geothermal 152 152 172 497 497 THERMAL Kipevu I Diesel 60 60 60 60 60 Kipevu Kvaener GT 1 30 30 30
Kipevu Kvaener GT 2 30 30 30 30 30
Kipevu III MSD
115 115 115 115 115
Total KenGen Thermal
205 205 235 235 235
Aggreko Embakasi 8 60 60 60
Aggreko Embakasi 7 30 30 30
Aggreko Muhoroni 30 30 30
Total EPP 120 120 120 0 0
WIND
Ngong 1& 2 5.1 5.1 5.1 25.5 25.5
Total Wind 5 5 5 26 26 Total KenGen + EPP Interconnected
1,272 1,272 1,330 1,556 1,577
IPPs
Iberafrica Diesel 56 56 56 56 56
Iberafrica II
52.5 52.5 52.5 52.5 52.5
Tsavo Power 74 74 74 74 74
Orpower 4 geothermal 52 52 52 52 52
Orpower 4 geothermal 2 36 36 52 52
Rabai MSD 90 90 90 90 90
Athi River 1‐Triumph 83 83 83
Athi River 2‐Gulf 80 80 80
Thika MSD‐Melec 87 87 87 87
Mumias Bagasse 26 26 26 26 26
Turkana Wind 300
Aeolus Wind‐Kinangop 60 60 Kwale International Sugar Company Ltd 18 18
Prunus 50
Kipeto 100 FiT projects(genpro,gura and hydel) 21
Total IPPs
351 474 637 731 1,181

50
2011/12 2012/13 2013/14 2014/15 2015/16 Total Interconnected System
1,623 1,746 1,967 2,286 2,457
Maintenance & Spinning Allowance 15% of Projected Peak Demand
185 200 207 219 232
Peak demand (Actual )
1,236 Projected Interconnected System Peak
1,236 1,330 1,379 1,462 1,549
Table 17: Medium‐Term Energy Balance for Average Hydrology (GWh)
THE INTERCONNECTED SYSTEM
2011/12 2012/13 2013/14 2014/15 2015/16
KenGen Interconnected
Small hydros
66
66
66 66
66 Sang'oro (Sondu Additional Plant) 7
102
102 102
102
Main hydros
3,379 3,282 3,067 3,067 3,067
Total Hydro GWh 3,452 3,450 3,235 3,235 3,235
GEOTHERMAL
Olkaria I 279 362 327 308 251
Olkaria II 819 832 832 814 796
Olkaria IV ‐ 0 0 846 1,042
Eburru 5 17 15 15 15
Wellhead Units 3 39 138 263 184 Olkaria I Rehab/Optimization ‐ 0 0 1,128 1,042
Total Geothermal 1,107 1,251 1,312 3,375 3,331
THERMAL
Kipevu I Diesel 256 263 263 74 26
Kipevu Kvaener GT 1 ‐ ‐ 26 13 ‐
Kipevu Kvaener GT 2 33 39 26 13 ‐
Kipevu III MSD 525 604 554 181 32
‐
Total KenGen Thermal 814 907 869 281 58
Aggreko Embakasi 8 253 173 39 ‐ ‐
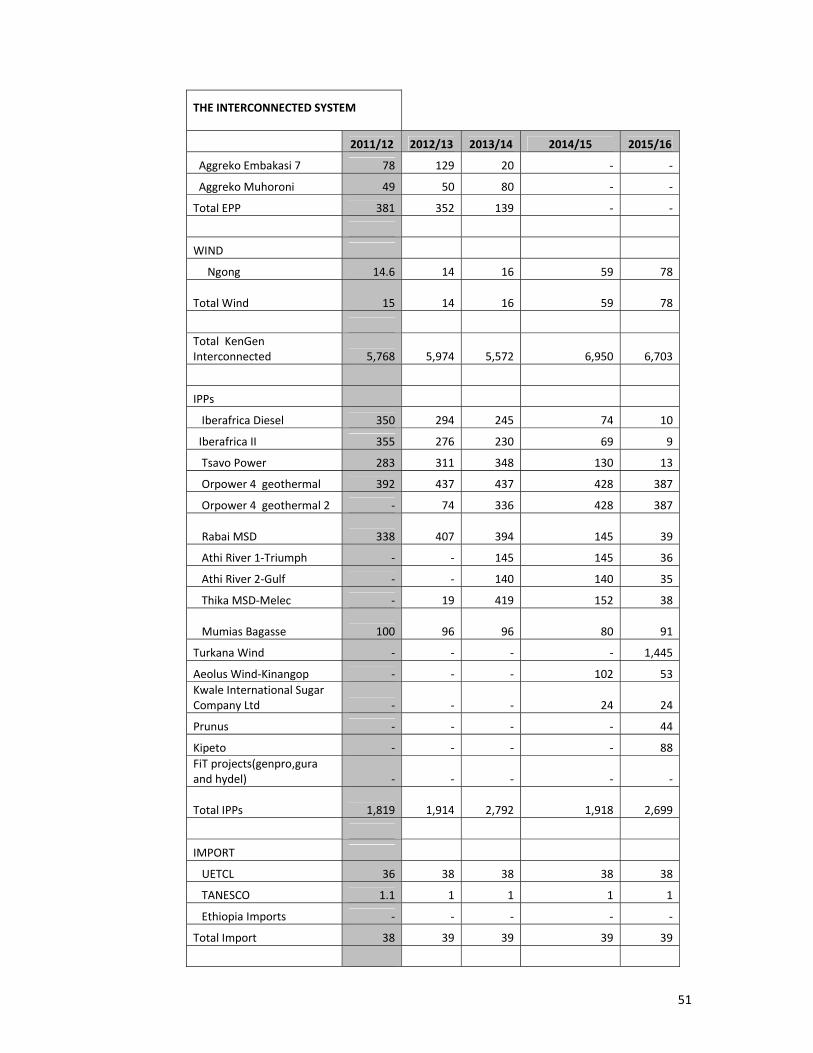
51
THE INTERCONNECTED SYSTEM
2011/12 2012/13 2013/14 2014/15 2015/16
Aggreko Embakasi 7 78 129 20 ‐ ‐
Aggreko Muhoroni 49 50 80 ‐ ‐
Total EPP 381 352 139 ‐ ‐
WIND
Ngong 14.6 14 16 59 78
Total Wind
15 14 16 59 78
Total KenGen Interconnected
5,768
5,974
5,572 6,950
6,703
IPPs
Iberafrica Diesel 350 294 245 74 10
Iberafrica II 355 276 230 69 9
Tsavo Power 283 311 348 130 13
Orpower 4 geothermal 392 437 437 428 387
Orpower 4 geothermal 2 ‐ 74 336 428 387
Rabai MSD
338 407 394 145 39
Athi River 1‐Triumph ‐ ‐ 145 145 36
Athi River 2‐Gulf ‐ ‐ 140 140 35
Thika MSD‐Melec ‐ 19 419 152 38
Mumias Bagasse
100 96 96 80 91
Turkana Wind ‐ ‐ ‐ ‐ 1,445
Aeolus Wind‐Kinangop ‐ ‐ ‐ 102 53 Kwale International Sugar Company Ltd ‐ ‐ ‐ 24 24
Prunus ‐ ‐ ‐ ‐ 44
Kipeto ‐ ‐ ‐ ‐ 88 FiT projects(genpro,gura and hydel) ‐ ‐ ‐ ‐ ‐
Total IPPs
1,819 1,914 2,792 1,918 2,699
IMPORT
UETCL 36 38 38 38 38
TANESCO 1.1 1 1 1 1
Ethiopia Imports ‐ ‐ ‐ ‐ ‐
Total Import 38 39 39 39 39
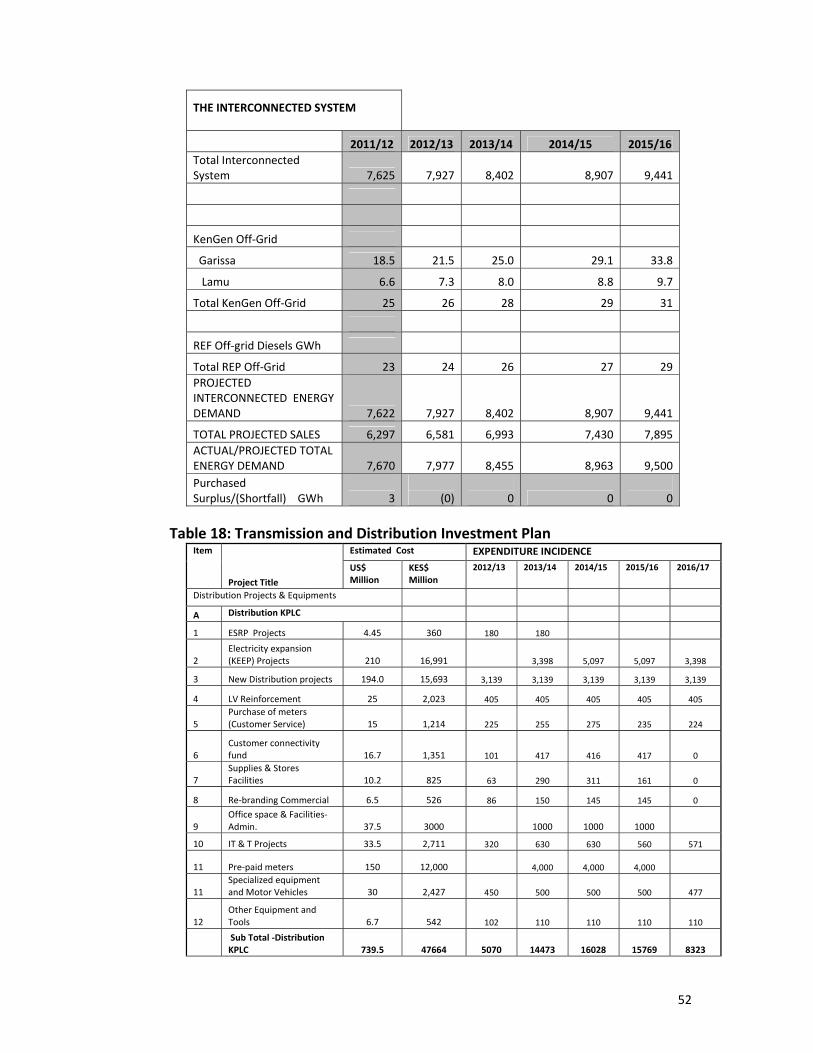
52
THE INTERCONNECTED SYSTEM
2011/12 2012/13 2013/14 2014/15 2015/16 Total Interconnected System 7,625 7,927 8,402 8,907 9,441
KenGen Off‐Grid
Garissa 18.5 21.5 25.0 29.1 33.8
Lamu 6.6 7.3 8.0 8.8 9.7
Total KenGen Off‐Grid 25 26 28 29 31
REF Off‐grid Diesels GWh
Total REP Off‐Grid 23 24 26 27 29 PROJECTED INTERCONNECTED ENERGY DEMAND 7,622 7,927 8,402 8,907 9,441
TOTAL PROJECTED SALES 6,297 6,581 6,993 7,430 7,895 ACTUAL/PROJECTED TOTAL ENERGY DEMAND 7,670 7,977 8,455 8,963 9,500 Purchased Surplus/(Shortfall) GWh 3
(0)
0 0
0
Table 18: Transmission and Distribution Investment Plan
Item
Project Title
Estimated Cost EXPENDITURE INCIDENCE US$ Million
KES$ Million
2012/13 2013/14 2014/15 2015/16 2016/17
Distribution Projects & Equipments
A Distribution KPLC
1 ESRP Projects 4.45 360 180 180
2 Electricity expansion (KEEP) Projects 210 16,991 3,398 5,097 5,097 3,398
3 New Distribution projects 194.0 15,693 3,139 3,139 3,139 3,139 3,139
4 LV Reinforcement 25 2,023 405 405 405 405 405
5 Purchase of meters (Customer Service) 15 1,214 225 255 275 235 224
6 Customer connectivity fund 16.7 1,351 101 417 416 417 0
7 Supplies & Stores Facilities 10.2 825 63 290 311 161 0
8 Re‐branding Commercial 6.5 526 86 150 145 145 0
9 Office space & Facilities‐Admin. 37.5 3000 1000 1000 1000
10 IT & T Projects 33.5 2,711 320 630 630 560 571
11 Pre‐paid meters 150 12,000 4,000 4,000 4,000
11 Specialized equipment and Motor Vehicles 30 2,427 450 500 500 500 477
12 Other Equipment and Tools 6.7 542 102 110 110 110 110
Sub Total ‐Distribution KPLC 739.5 47664 5070 14473 16028 15769 8323
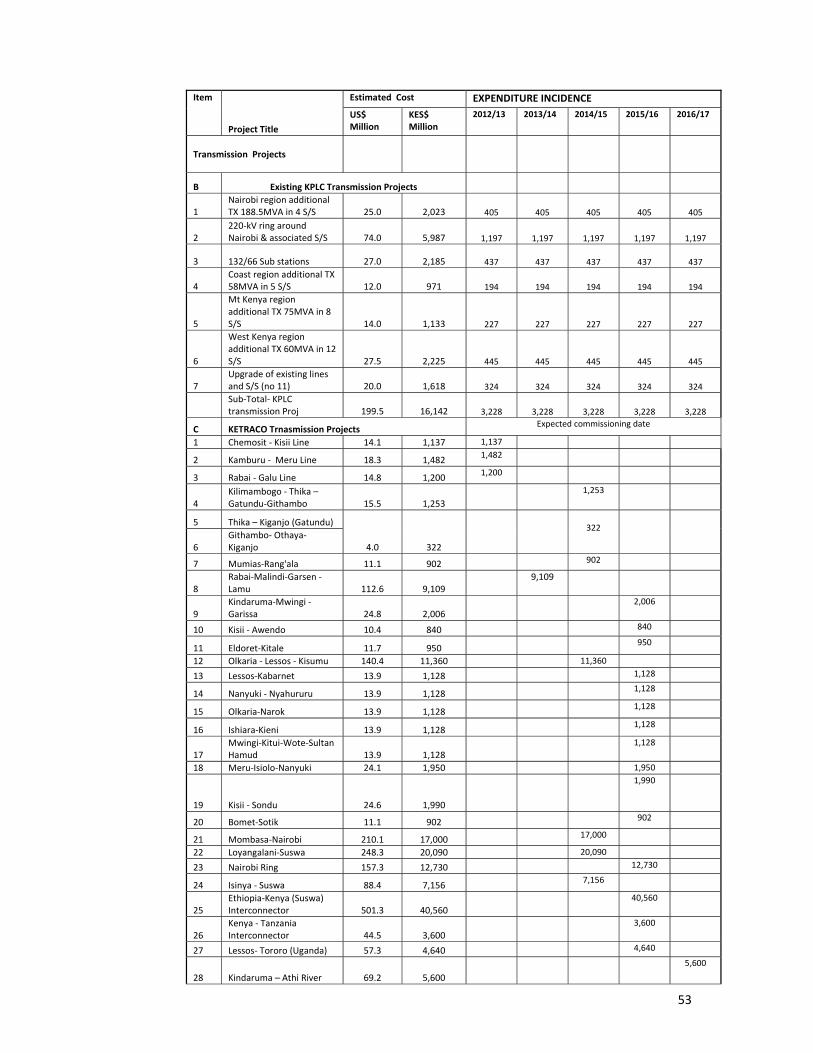
53
Item
Project Title
Estimated Cost EXPENDITURE INCIDENCE US$ Million
KES$ Million
2012/13 2013/14 2014/15 2015/16 2016/17
Transmission Projects
B Existing KPLC Transmission Projects
1 Nairobi region additional TX 188.5MVA in 4 S/S 25.0 2,023 405 405 405 405 405
2 220‐kV ring around Nairobi & associated S/S 74.0 5,987 1,197 1,197 1,197 1,197 1,197
3 132/66 Sub stations 27.0 2,185 437 437 437 437 437
4 Coast region additional TX 58MVA in 5 S/S 12.0 971 194 194 194 194 194
5
Mt Kenya region additional TX 75MVA in 8 S/S 14.0 1,133 227 227 227 227 227
6
West Kenya region additional TX 60MVA in 12 S/S 27.5 2,225 445 445 445 445 445
7 Upgrade of existing lines and S/S (no 11) 20.0 1,618 324 324 324 324 324
Sub‐Total‐ KPLC transmission Proj 199.5 16,142 3,228 3,228 3,228 3,228 3,228
C KETRACO Trnasmission Projects Expected commissioning date
1 Chemosit ‐ Kisii Line 14.1 1,137 1,137
2 Kamburu ‐ Meru Line 18.3 1,482 1,482
3 Rabai ‐ Galu Line 14.8 1,200 1,200
4 Kilimambogo ‐ Thika – Gatundu‐Githambo 15.5 1,253
1,253
5 Thika – Kiganjo (Gatundu)
4.0 322
322
6 Githambo‐ Othaya‐Kiganjo
7 Mumias‐Rang'ala 11.1 902 902
8 Rabai‐Malindi‐Garsen ‐ Lamu 112.6 9,109
9,109
9 Kindaruma‐Mwingi ‐ Garissa 24.8 2,006
2,006
10 Kisii ‐ Awendo 10.4 840 840
11 Eldoret‐Kitale 11.7 950 950
12 Olkaria ‐ Lessos ‐ Kisumu 140.4 11,360 11,360
13 Lessos‐Kabarnet 13.9 1,128 1,128
14 Nanyuki ‐ Nyahururu 13.9 1,128 1,128
15 Olkaria‐Narok 13.9 1,128 1,128
16 Ishiara‐Kieni 13.9 1,128 1,128
17 Mwingi‐Kitui‐Wote‐Sultan Hamud 13.9 1,128
1,128
18 Meru‐Isiolo‐Nanyuki 24.1 1,950 1,950
19 Kisii ‐ Sondu 24.6 1,990
1,990
20 Bomet‐Sotik 11.1 902 902
21 Mombasa‐Nairobi 210.1 17,000 17,000
22 Loyangalani‐Suswa 248.3 20,090 20,090
23 Nairobi Ring 157.3 12,730 12,730
24 Isinya ‐ Suswa 88.4 7,156 7,156
25 Ethiopia‐Kenya (Suswa) Interconnector 501.3 40,560
40,560
26 Kenya ‐ Tanzania Interconnector 44.5 3,600
3,600
27 Lessos‐ Tororo (Uganda) 57.3 4,640 4,640
28 Kindaruma – Athi River 69.2 5,600
5,600

54
Item
Project Title
Estimated Cost EXPENDITURE INCIDENCE US$ Million
KES$ Million
2012/13 2013/14 2014/15 2015/16 2016/17
29 Meru‐ Maua 21.0 1,700 1,700
30 Nyahururu ‐ Maralal 36.8 2,980 2,980
31 Awendo – Migori – Isabenia 23.5 1,900
1,900
32 Sondu – Homa Bay – Ndhiwa ‐ Awendo 29.7 2,400
2,400
33 Turkwel – Ortum 36.3 2,940 2,940
34 Sultan Hamud – Loiitokitok 41.5 3,360
3,360
35 Konza – Machakos 15.6 1,260 1,260
36 Konza – Kajiado – Namanga 41.8 3,380
3,380
37 Garsen ‐ Hola ‐ Garissa 49.7 4,020 4,020
38 Garissa ‐ Wajir 58.6 4,740 4,740
39 Galu ‐ Lunga Lunga 23.5 1,900 1,900
Sub‐Total KETRACO 2,261.7 183,000 3,819 9,109 58,083 75,809 36,180
Table 19: Transmission & Distribution Lines, Circuit length in Kilometers
VOLTAGE
AS AT 30th JUNE
2007 2008 2009 2010 2011 2012 220 kV 1,323 1,323 1,331 1,331 1,331 1,331 132 kV 2,085 2,085 2,112 2,211 2,343 2,343 66 kV 632 632 649 655 655 758 40 kV 29 29 29 0 0 0 33 kV 11,163 12,633 13,031 13,812 15,271 15,384 11 kV 21,918 23,573 24,334 25,485 26,250 27,219 TOTAL 37,149 40,274 41,486 43,494 45,850 47,035 % INCREASE P.A. 22.2% 8.4% 3.0% 4.8% 5.4% 2.6%

55
Table 20: Transformers in Service, Total Installed Capacity in MVA
AS AT 30th JUNE 2007 2008 2009 2010 2011 2012 Generation Substations 11/220kV 472 472 544 544 544 544 11/132kV 675 675 694 694 889 889 11/66kV 146 183 121 121 171 171 11/33kV 280 280 238 238 238 238 11/40kV 5 5 0 0 0 0 3.3/11/40kV 10 10 0 0 0 0 3.3/40kV 4 4 0 0 0 0 3.3/33kV 4 4 4 4 4 4 TOTAL 1,596 1,633 1,601 1,601 1,846 1,846 Transmission Substations
132/220kV 620 620 620 620 620 620 220/132kV 730 730 730 730 730 730 220/66kV 360 360 360 360 450 450 132/66kV 375 375 375 375 375 375 132/33kV 629 652 687 756 779 801 TOTAL 2,714 2,737 2,772 2,841 2,954 2,976 Distribution Substations
66/11kV 1,058 1,114 1,206 1,206 1,206 1,288 66/33kV 77 77 77 90 90 90 40/11kV 11 11 11 11 11 11 33/11kV 729 750 823 934 937 1053 TOTAL 1,874 1,951 2,117 2,241 2,244 2,442Distribution Transformers 11/0.415kV and 33/0.415kV 3,515 4,138 4,307 4,688 5,069 5,784