
The Kansas Impact Survey: Making a Difference for Families Jean Ann Summers Hasheem Mannan Kansas...
26
Survey: Survey: Making a Making a Difference for Difference for Families Families Jean Ann Summers Jean Ann Summers Hasheem Mannan Hasheem Mannan Kansas Division for Early Kansas Division for Early Childhood Childhood February 2005 February 2005
-
date post
19-Dec-2015 -
Category
Documents
-
view
212 -
download
0
Transcript of The Kansas Impact Survey: Making a Difference for Families Jean Ann Summers Hasheem Mannan Kansas...

The Kansas Impact The Kansas Impact Survey:Survey:
Making a Difference for Making a Difference for FamiliesFamilies
Jean Ann SummersJean Ann SummersHasheem MannanHasheem Mannan
Kansas Division for Early ChildhoodKansas Division for Early ChildhoodFebruary 2005February 2005
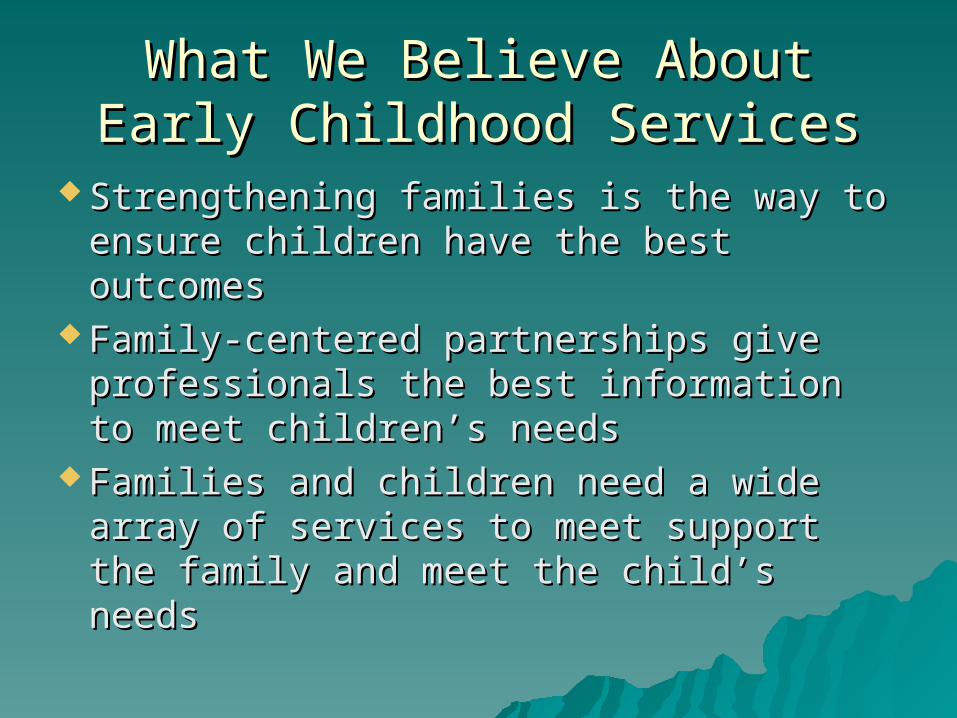
What We Believe About Early What We Believe About Early Childhood ServicesChildhood Services
Strengthening families is the way to Strengthening families is the way to ensure children have the best ensure children have the best outcomesoutcomes
Family-centered partnerships give Family-centered partnerships give professionals the best information to professionals the best information to meet children’s needsmeet children’s needs
Families and children need a wide Families and children need a wide array of services to meet support the array of services to meet support the family and meet the child’s needsfamily and meet the child’s needs

What we Don’t KnowWhat we Don’t Know
Whether families believe they are Whether families believe they are getting enough of the services they getting enough of the services they needneed
Whether families are happy with Whether families are happy with their partnerships with professionalstheir partnerships with professionals
Whether partnerships and services Whether partnerships and services make a difference in families’ quality make a difference in families’ quality of lifeof life
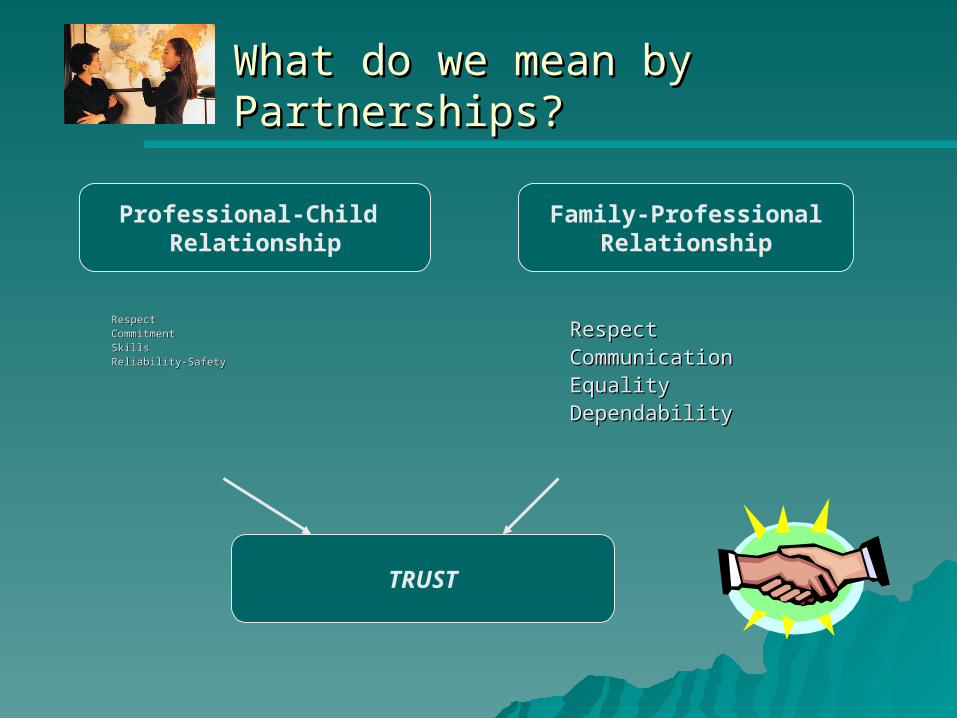
What do we mean by Partnerships?What do we mean by Partnerships?
RespectRespectCommitmentCommitmentSkillsSkillsReliability-SafetyReliability-Safety
RespectRespect CommunicationCommunication EqualityEquality DependabilityDependability
TRUST
Professional-Child Relationship
Family-ProfessionalRelationship
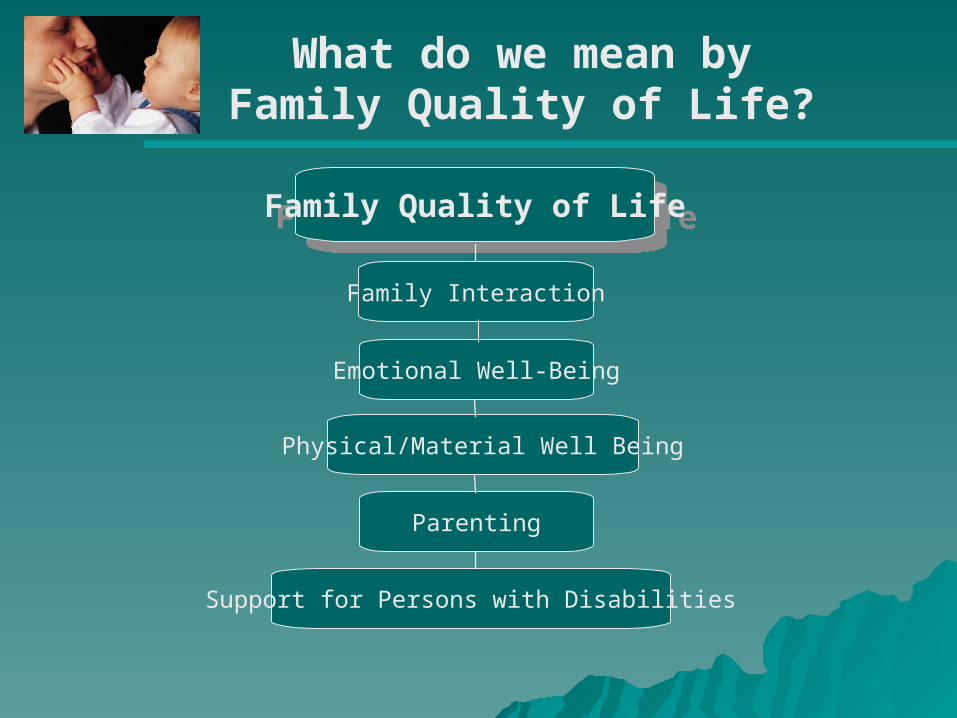
What do we mean by Family Quality of Life?
Support for Persons with Disabilities
Parenting
Family Quality of LifeFamily Quality of Life
Physical/Material Well Being
Emotional Well-Being
Family Interaction
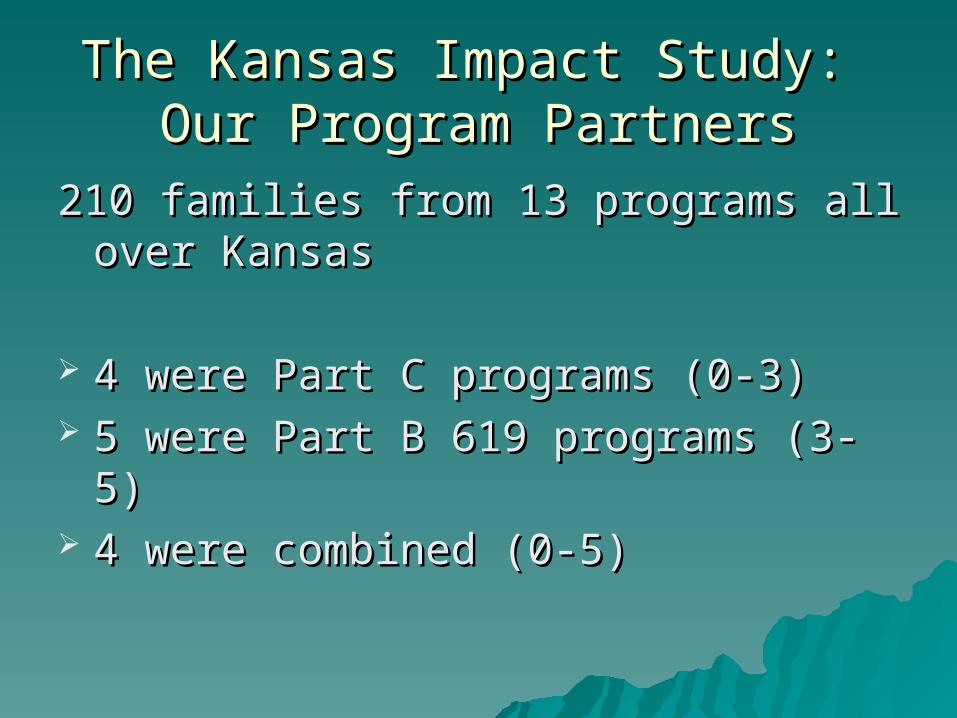
The Kansas Impact Study: Our The Kansas Impact Study: Our Program PartnersProgram Partners
210 families from 13 programs all over 210 families from 13 programs all over KansasKansas
4 were Part C programs (0-3)4 were Part C programs (0-3) 5 were Part B 619 programs (3-5)5 were Part B 619 programs (3-5) 4 were combined (0-5)4 were combined (0-5)

Our families: Ethnic Backgrounds Our families: Ethnic Backgrounds (Percents in groups)(Percents in groups)
0
10
20
30
40
50
60
70
80
90
Af. Amer. Asian Hispanic White

Our Families: Community Size Our Families: Community Size (Percent in groups)(Percent in groups)
0
5
10
15
20
25
30
35
40
Urban Suburban Town Rural

Educational Backgrounds: Educational Backgrounds: (Percents in Groups)(Percents in Groups)
0
5
10
15
20
25
30
35
> HS HS orGED
SomeColl.
AA BA Graduate

Severity of Child’s Disability: Severity of Child’s Disability: (Percents in groups)(Percents in groups)
0
10
20
30
40
50
60
Mild Moderate Severe Very Sev. Unknown
Our Measures:Our Measures:
Services InventoryServices Inventory Beach Center Family Professional Beach Center Family Professional
Partnership ScalePartnership Scale Beach Center Family Quality of Life Beach Center Family Quality of Life
ScaleScale
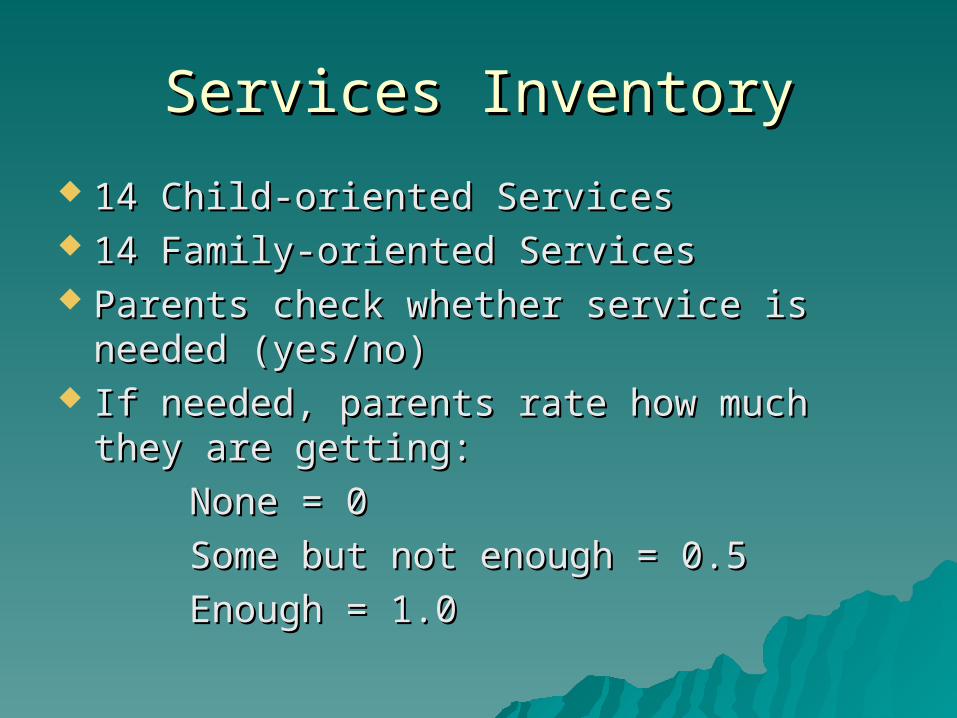
Services InventoryServices Inventory
14 Child-oriented Services14 Child-oriented Services 14 Family-oriented Services14 Family-oriented Services Parents check whether service is needed Parents check whether service is needed
(yes/no)(yes/no) If needed, parents rate how much they are If needed, parents rate how much they are
getting:getting:
None = 0None = 0
Some but not enough = 0.5Some but not enough = 0.5
Enough = 1.0Enough = 1.0

Family-Professional PartnershipsFamily-Professional Partnerships
9 items for Child-Oriented relationships9 items for Child-Oriented relationships 9 items for Family-Oriented relationships9 items for Family-Oriented relationships Parents think of provider who works Parents think of provider who works
most with them and their childmost with them and their child Parents rate satisfaction on a scale of 1-Parents rate satisfaction on a scale of 1-
55– 1 = Very Dissatisfied1 = Very Dissatisfied– 5 = Very Satisfied5 = Very Satisfied

Partnerships: Sample items (Child-Partnerships: Sample items (Child-oriented relationships)oriented relationships)
How satisfied are you that your child’s How satisfied are you that your child’s service provider:service provider:
. . . Has the skills to help your child . . . Has the skills to help your child succeedsucceed
. . . Speaks up for your child’s best . . . Speaks up for your child’s best interestsinterests
. . . Treats your child with dignity. . . Treats your child with dignity
. . . Builds on your child’s strengths. . . Builds on your child’s strengths

Partnerships Sample items (Family-Partnerships Sample items (Family-oriented relationships)oriented relationships)
How satisfied are you that your child’s How satisfied are you that your child’s service provider:service provider:
. . . Uses words that you understand. . . Uses words that you understand
. . . Protects your family’s privacy. . . Protects your family’s privacy
. . . Shows respect for your family’s . . . Shows respect for your family’s values and beliefsvalues and beliefs
. . . Is a person you can depend on and . . . Is a person you can depend on and trusttrust

Family Quality of LifeFamily Quality of Life
25 items in 5 domains or areas:25 items in 5 domains or areas:
-- Family Interaction (6 items)-- Family Interaction (6 items)
-- Emotional well-being (4 items)-- Emotional well-being (4 items)
-- Parenting (6 items)-- Parenting (6 items)
-- Physical/Material Well-being (5 items)-- Physical/Material Well-being (5 items)
-- Disability-related support (4 items) -- Disability-related support (4 items) Families rate satisfaction AND importance Families rate satisfaction AND importance
on a scale of 1 to 5on a scale of 1 to 5

Family Quality of Life: Sample Family Quality of Life: Sample ItemsItems
For my family to have a good life together, how For my family to have a good life together, how satisfied am I thatsatisfied am I that
. . . My family enjoys spending time together.. . . My family enjoys spending time together.
. . . My family members have friends or others who . . . My family members have friends or others who provide support.provide support.
. . . My family members have transportation.. . . My family members have transportation.
. . . Adults in my family have time to take care of . . . Adults in my family have time to take care of needs of every child.needs of every child.
. . . My family member with a disability has support . . . My family member with a disability has support to accomplish goals at school.to accomplish goals at school.

What do Families Think About What do Families Think About Services for their children?Services for their children?
Families, on average, believe they are Families, on average, believe they are getting the services their child needs. getting the services their child needs.
Highest rating:Highest rating:Transportation and/or mobility: 0.90Transportation and/or mobility: 0.90
Lowest rating:Lowest rating:Counseling/psychological: 0.67Counseling/psychological: 0.67
Behavior support: 0.67Behavior support: 0.67

What do Families Think about What do Families Think about Services for Themselves?Services for Themselves?
Except for Child Care (0.60) and Except for Child Care (0.60) and Transportation (0.73), all ratings Transportation (0.73), all ratings were below 0.5were below 0.5
Highest ratingHighest rating
Information about services (0.49)Information about services (0.49)
Lowest ratingLowest rating
Respite care (0.16)Respite care (0.16)

What do families think about their What do families think about their Partnerships?Partnerships?
Families on average were highly satisfied:Families on average were highly satisfied:
child-relationship rating = 4.46child-relationship rating = 4.46
family-relationship rating = 4.60family-relationship rating = 4.60
No differences between Part B and Part CNo differences between Part B and Part C Slightly more satisfaction with therapists Slightly more satisfaction with therapists
than with educatorsthan with educators No differences in satisfaction on any family No differences in satisfaction on any family
characteristicscharacteristics

What do Families Think About their What do Families Think About their Quality of Life?Quality of Life?
On average, families rated themselves On average, families rated themselves fairly satisfied with their lives:fairly satisfied with their lives:
Family Interaction – 4.17Family Interaction – 4.17
Parenting – 4.22Parenting – 4.22
Physical Well-Being – 4.32Physical Well-Being – 4.32
Emotional Well-being – 3.71Emotional Well-being – 3.71
Support for Disability – 4.35Support for Disability – 4.35
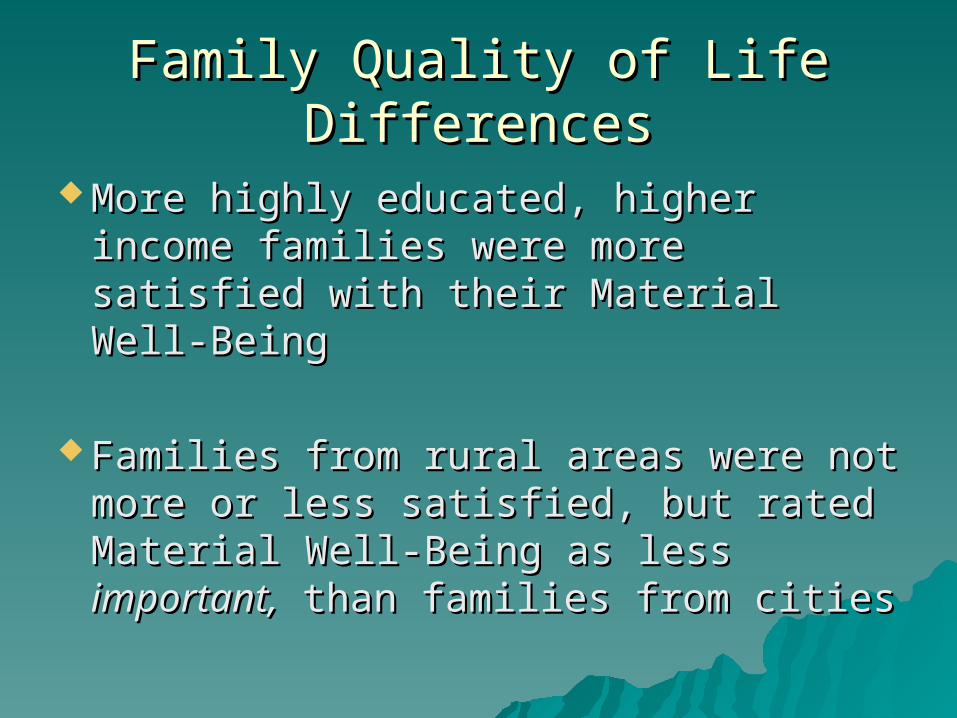
Family Quality of Life DifferencesFamily Quality of Life Differences
More highly educated, higher income More highly educated, higher income families were more satisfied with families were more satisfied with their Material Well-Being their Material Well-Being
Families from rural areas were not Families from rural areas were not more or less satisfied, but rated more or less satisfied, but rated Material Well-Being as less Material Well-Being as less important,important, than families from cities than families from cities
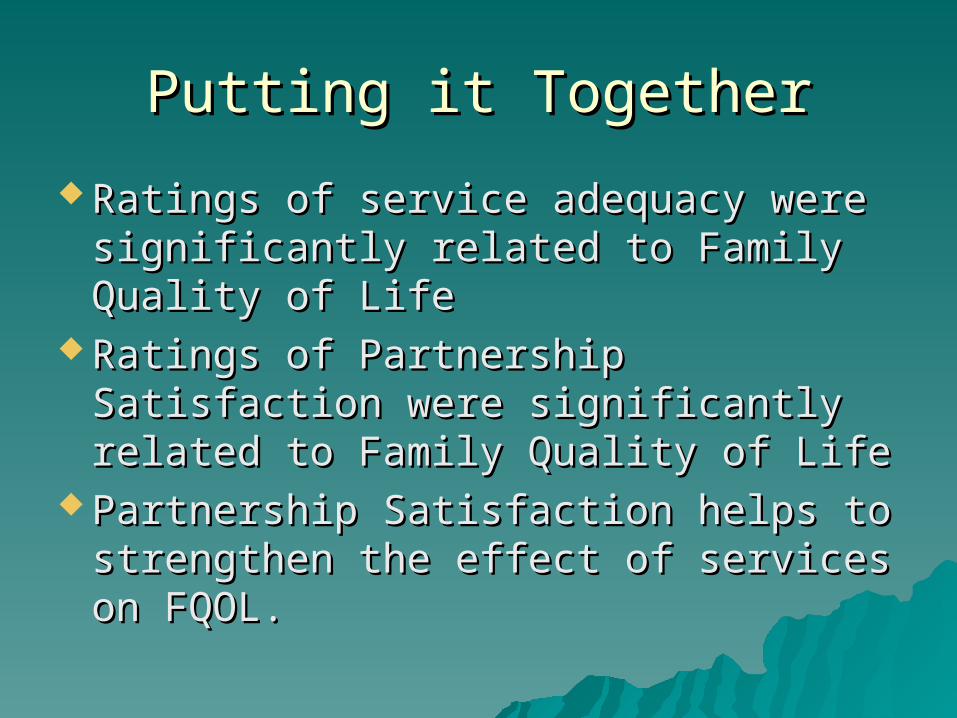
Putting it TogetherPutting it Together
Ratings of service adequacy were Ratings of service adequacy were significantly related to Family Quality significantly related to Family Quality of Lifeof Life
Ratings of Partnership Satisfaction Ratings of Partnership Satisfaction were significantly related to Family were significantly related to Family Quality of LifeQuality of Life
Partnership Satisfaction helps to Partnership Satisfaction helps to strengthen the effect of services on strengthen the effect of services on FQOL.FQOL.
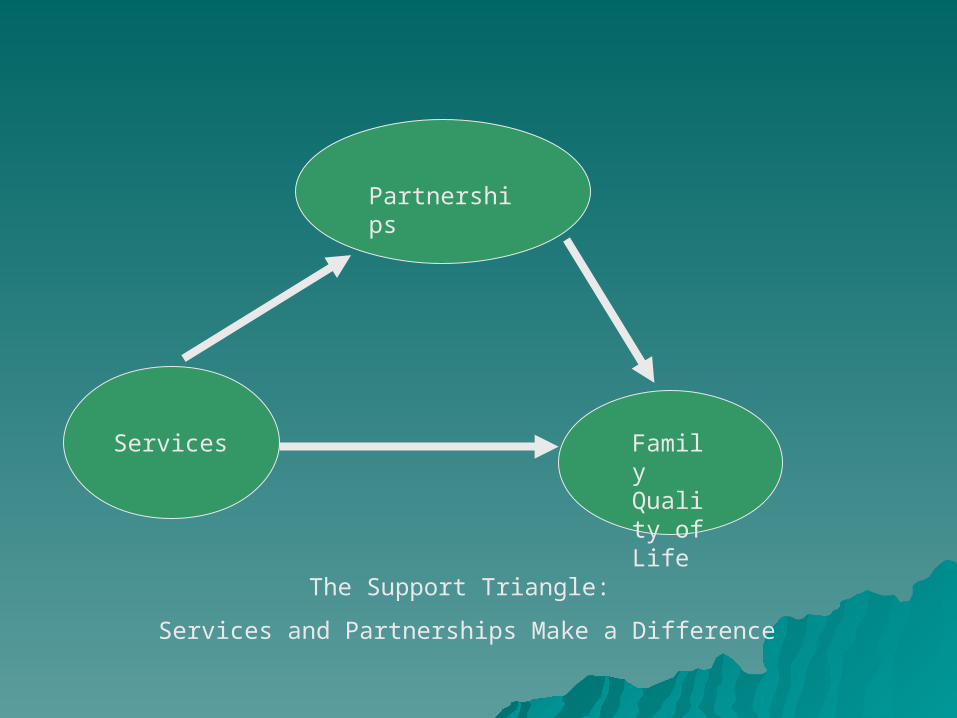
Partnerships
Services Family Quality of Life
The Support Triangle:
Services and Partnerships Make a Difference

What Does it Mean?What Does it Mean?
There’s room for improvement in There’s room for improvement in providing family-oriented servicesproviding family-oriented services
Services DO make a difference to Services DO make a difference to families’ quality of lifefamilies’ quality of life
The way you treat families ALSO The way you treat families ALSO makes a difference in their quality of makes a difference in their quality of lifelife

Thank you for your Participation and your Thoughts!
For more information, Please Contact:
Jean Ann Summers,
Or go to our website:
www.beachcenter.org