The Journal of Population Research
10
The Journal of Population Research 2347 – 1816 Volume 8 Number 2 June 2020 | 56 The Journal of Population Research Dasson Publication www.dassonpublication.com
Transcript of The Journal of Population Research

The Journal of Population Research 2347 – 1816
Volume 8 Number 2 June 2020 | 56
The Journal of Population Research
Dasson Publication www.dassonpublication.com

The Journal of Population Research 2347 – 1816
Volume 8 Number 2 June 2020 | 57
Spatial patterns of sex ratio in Rajasthan, 2011: A Geographical
analysis
Prem chand
Indian council of social science research fellow
Department of Geography
Panjab University, Chandigarh
Abstract
Among the various qualitative attributes of population, sex ratio holds an important place as it is a reliable
index of the socio-economic conditions prevailing in an area and it is a useful tool for regional analysis. The
present paper is an attempt to analyse the trends in sex ratio, spatial patterns, and rural- urban differences
in sex ratio in Rajasthan. Sex ratio of Rajasthan is mainly the outcome of interplay of sex differentials in
mortality, sex selective migration, sex ratio at birth and at times the sex differences in population
enumeration. Sex ratio of Rajasthan is fluctuating in narrow band in last five decades. If keenly observe that
the decadal difference in sex ratio is very little, 7 to 11 points only. In other words, there were wide regional
differences in rural – urban sex ratio in the state at district level. The area having excess of females over
males were characteristic of areas from where male population are out migrated. Whereas area having low
sex ratio was associated with, high female mortality rates during infancy and high male selective in
migration in response to growing development. It also tries to investigate the possible cause such high-level
gap of between rural- urban sex ratio and to suggest some measure to minimize the gap.
Key words: 1.Sex Ratio, 2.Trends, 3.Spatial pattern, 4.Rural-Urban, 5.Rajasthan.
Introduction
Sex composition of human population is one of the basic demographic characteristics, which is
extremely important for meaningful demographic analysis. Population of any society is divided into two
segments, the males and the females on the basis of their gender. the Both the sexes are complimentary
to each other and play their distinctive roles in the social and economic activities in a community. The
ratio between the two sexes has its bearing on the other demographic characteristics of the region
(Shryock, 1976, p.105). The balance between the two sexes affects the social and the economic
relationship within a community.
Sex ratio is a noteworthy demographic and culture index. The ratio can reflect biological, social,
economic, migrational characteristics of population. A vast imbalance in sex ratio would tend to result in
lower fertility and slower growth. Important deviation from a balanced sex ratio originates from various
social and demographic factors. An analysis of sex ratio is important for a proper understanding of
various demographic characteristics of any region, while sex ratio is an index to the economy prevailing
in an area and useful tool for regional analysis of other demographic element like, population growth,
marriage rates, occupational structure, fertility rate, etc. (Franklin,1956, p. 168).
Changes in sex composition largely reflect the underlying socio-economic and cultural pattern of a
society in different ways. It is an important social indicator to measure the extent of prevailing equity
between males and females at a given point of time. In the Indian census, the term ‘Sex Ratio’ is used to
denote the number of females per 1000 males. It is common practice to express sex composition of
population in terms of ratio. It is also an index of socio-economic conditions prevailing in an area and it is
a useful tool for regional analysis (Chandna & Sidhu, 1980, p.78). Therefore, the pattern of sex ratio
reflects the social and cultural background of an area. Sex ratio is function of three basic factors namely,
sex ratio at birth, differential in mortality of two sexes at different, and stages of life and sex selectivity
among migrants.
According to census of India in 2011, out of total population of 1,210 millions, 623 millions are males and
587 millions are females. It was revealed that the population ratio of India in 2011 is 943 females per 1000

The Journal of Population Research 2347 – 1816
Volume 8 Number 2 June 2020 | 58
of males. The Sex Ratio 2011 shows an upward trend from the census 2001 data (Fig.1). Since the last, two
of the decades there has been in slight increase in the sex ratio. Since the last five decades, the sex ratio
has been moving around 930 of females to that of 1000 of males. Thus, the overall sex ratio for Indian
population comes to be 943. In the list of sex ratio, the rank of Rajasthan is at the 23th place among the
states and union territories (Table 1). Sex ratio of Rajasthan is mainly the outcome of interplay of sex
differentials in mortality, sex selective migration, sex ratio at birth and at times the sex differences in
population enumeration.
Table: 1
India: Sex Ratio, 2011
Sr.No. State/Union Territory Sex Ratio
1 Kerala 1084
2 Tamil Nadu 996
3 Andhra Pradesh 993
4 Chhattisgarh 991
5 Meghalaya 989
6 Manipur 985
7 Odisha 979
8 Mizoram 976
9 Goa 973
10 Karnataka 973
11 Himachal Pradesh 972
12 Uttarakhand 963
13 Tripura 960
14 Assam 958
15 West Bengal 950
16 Jharkhand 948
17 Arunachal Pradesh 938
18 Madhya Pradesh 931
19 Nagaland 931
20 Maharashtra 929
21 Rajasthan 928
22 Gujarat 919
23 Bihar 918
24 Uttar Pradesh 912
25 Punjab 895
26 Sikkim 890
27 Jammu & Kashmir 889
28 Haryana 879
Union Territories
1 Puducherry 1037
2 Lakshadweep 946
3 Andaman & Nicobar Islands 876
4 Nct of Delhi 868
5 Chandigarh 818
6 Dadra & Nagar Haveli 774
7 Daman & Diu 618
India 943
Source: Primary Census Abstract Total Table For India 2011, Computed by the Author

The Journal of Population Research 2347 – 1816
Volume 8 Number 2 June 2020 | 59
Objectives, Data Source and Methodology
The main objectives of the study are:
To describe, analyze and interpret the spatial patterns of sex ratio of Rajasthan.
To examine the rural- urban differences in sex ratio of Rajasthan.
To achieve the above stated objectives the Tehsil has been considered to the most appropriate unit of
study, for which data are available. This study primarily based on secondary source of data, which
obtained in the form of Primary Census Abstract Total for Rajasthan, 2011 from census of India. The
quantitative techniques have been used in the present study to understand the patterns of sex ratio. For
this purpose, the census data has been tabulated, calculated to derive representative figures, averages
and percentages. Sex composition is expressed with the help of a ratio known as sex ratio. Sex ratio in
India is defined as “number of females per 1000 males in the population”. It is expressed in the following
formula:
Sex ratio = (number of Females / Number of Males)* 1000
Tehsil-wise, spatial patterns of sex ratio have been depicted on maps by using the choropleth technique
with the help of Arc GIS 9.3 software.
Trends in Sex Ratio
Fig. 1 reveals that the Sex ratio in the Rajasthan from 1901 to 2011 can be divided into two phases, i.e.
pre- Independence phase and post Independence. In the first phase, the Sex ratio was showing low and
fluctuating trend as compare to India, while in the post Independence it started to decrease 13 point until
1961. After that there was gradual growth in sex ratio has been noticed (except the 1981-91 decade). The
population composition of the state by the sex reveals preponderance of males. Rajasthan has registered
a significant increase in the sex ratio from 910 in 1991 census to 921
Fig.1
in 2001 and 928 in 2011 census, which the highest ever recorded since 1901 except in 1951when it was
also 921.
872
964 956
952 947 948
943
931 934 927
933
943
905 908
896
907 906
921
908 911 919
910
921 928
820
840
860
880
900
920
940
960
980
1901 1911 1921 1931 1941 1951 1961 1971 1981 1991 2001 2011
Fem
ale
s p
er
Tho
usa
nd
Mal
es
Census Year
Trend in Sex Ratio of Rajasthan and India: 1901-2011
INDIA
Rajasthan
The Journal of Population Research 2347 – 1816
Volume 8 Number 2 June 2020 | 60
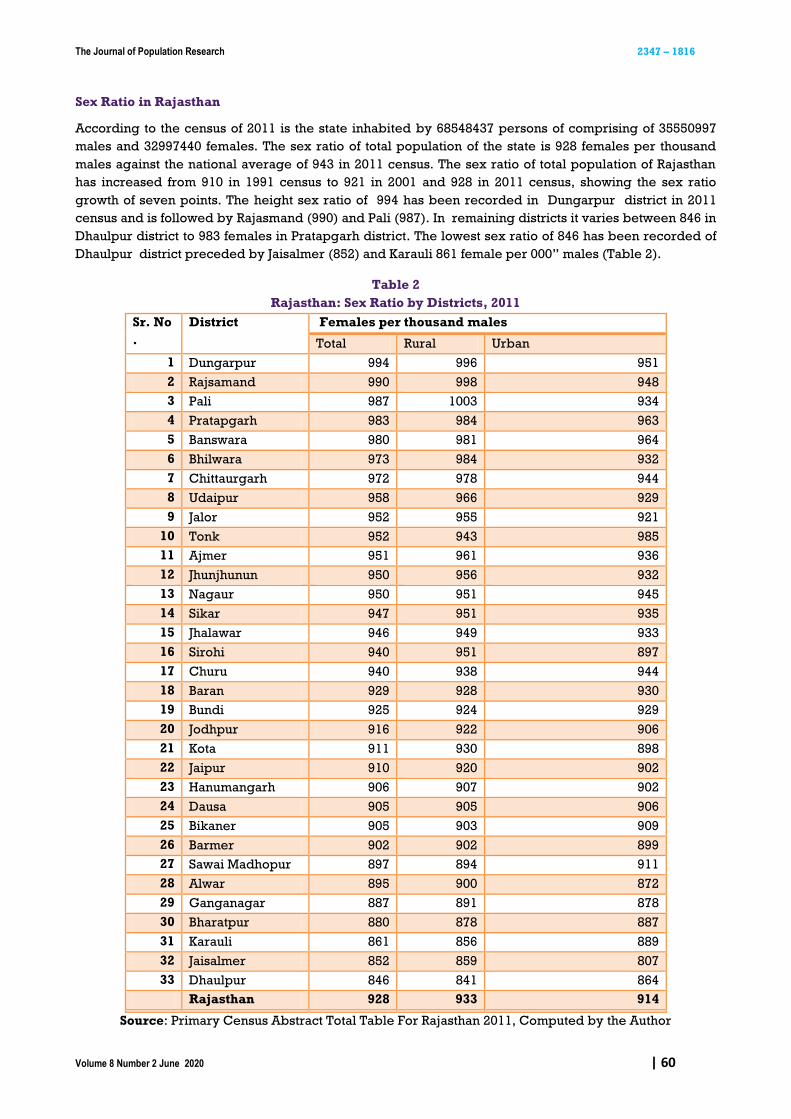
Sex Ratio in Rajasthan
According to the census of 2011 is the state inhabited by 68548437 persons of comprising of 35550997
males and 32997440 females. The sex ratio of total population of the state is 928 females per thousand
males against the national average of 943 in 2011 census. The sex ratio of total population of Rajasthan
has increased from 910 in 1991 census to 921 in 2001 and 928 in 2011 census, showing the sex ratio
growth of seven points. The height sex ratio of 994 has been recorded in Dungarpur district in 2011
census and is followed by Rajasmand (990) and Pali (987). In remaining districts it varies between 846 in
Dhaulpur district to 983 females in Pratapgarh district. The lowest sex ratio of 846 has been recorded of
Dhaulpur district preceded by Jaisalmer (852) and Karauli 861 female per 000” males (Table 2).
Table 2
Rajasthan: Sex Ratio by Districts, 2011
Sr. No
.
District
Females per thousand males
Total Rural Urban
1 Dungarpur 994 996 951
2 Rajsamand 990 998 948
3 Pali 987 1003 934
4 Pratapgarh 983 984 963
5 Banswara 980 981 964
6 Bhilwara 973 984 932
7 Chittaurgarh 972 978 944
8 Udaipur 958 966 929
9 Jalor 952 955 921
10 Tonk 952 943 985
11 Ajmer 951 961 936
12 Jhunjhunun 950 956 932
13 Nagaur 950 951 945
14 Sikar 947 951 935
15 Jhalawar 946 949 933
16 Sirohi 940 951 897
17 Churu 940 938 944
18 Baran 929 928 930
19 Bundi 925 924 929
20 Jodhpur 916 922 906
21 Kota 911 930 898
22 Jaipur 910 920 902
23 Hanumangarh 906 907 902
24 Dausa 905 905 906
25 Bikaner 905 903 909
26 Barmer 902 902 899
27 Sawai Madhopur 897 894 911
28 Alwar 895 900 872
29 Ganganagar 887 891 878
30 Bharatpur 880 878 887
31 Karauli 861 856 889
32 Jaisalmer 852 859 807
33 Dhaulpur 846 841 864
Rajasthan 928 933 914
Source: Primary Census Abstract Total Table For Rajasthan 2011, Computed by the Author

The Journal of Population Research 2347 – 1816
Volume 8 Number 2 June 2020 | 61
Fig. 2
Spatial Patterns of Sex Ratio
The spatial pattern of sex ratio of the total population in the year 2011 is based on what has emerged on a
choropleth map (Figure.2) made from Tehsil wise data for 2011. The distribution pattern of sex ratio of
the population at Tehsil level data reveals a diverse pattern. Three types of areas are clearly identifiable
on the map:
A. Areas of high sex ratio (with 950 and more females per 1000 males)
B. Areas of moderate sex ratio (with 900 to 950 females per 1000 males)
C. Areas of low sex ratio (with less than 900 females per 1000 males)
A. Areas of High Sex Ratio – Out of total 244 Tehsils, 86 tehsils (approx. 35 per cent) fall under this
category. These Tehsils falls in the districts of Jhunjhunun , Sikar, Churu, Nagaur, Ajmer, Pali,
Sirohi, Udaipur, Dungarpur, Banswara, Pratapgarh, Chittaurgarh and Bhilwara. It is observed
according to data that there are eleven Tehsils having sex ratio more than 1000 females per

The Journal of Population Research 2347 – 1816
Volume 8 Number 2 June 2020 | 62
thousand males viz. Kumbhalgarh (1050), Deogarh (1005) Tehsil of Rajasmand district; Marwar
Junction (1025) and Desuri (1025) Tehsil of Pali district; Sahara (1021), Mandal (1036) and Raipur
(1028) tehsisl of Bhilwara district; Sagwara (1023) of Dungarpur district; and Rashmi (1017)
Tehsil of Chittaurgarh district; Ahore (1014) Tehsil of Jalor district and Dhariwad (1009) Tehsil of
Pratapgarh. In these areas sex ratio increases due to economic development, urbanization,
better conditions in literacy and migration from neighbouring states like Haryana and Punjab
have dropped its positive impact on sex ratio. There is improvement in the public and private
health facilities in their area. Therefore, the death rate has declined. Due to the family and health
programs there is an increase in the birth rate and due to literacy and education in rural areas,
the age at marriage has also increased which has its positive impact on the sex ratio. These areas
are rich in agriculture as well as in industrial sector.
B. Areas of Moderate Sex Ratio – 46 percent tehsils fall under category of moderate sex ratio. In
which we can include tehsils of the districts; Sikar, Tonk, Kota, Sirohi, Ajmer, Jhalwara, Churu,
Nagaur, Dausa, Jalor, Jhunjhunun, Chittaurgarh, Pali, Jaipur, Baran, Jodhpur, Barmer, Bundi,
Hanumangarh, Bikaner, Ganganagar and Alwar etc.
C. Areas of Low Sex Ratio – 45 Tehsils fall under this category. These tehsils represented the
worse conditions for women survival. It appears that the decline in sex ratio in the last decade is
due to combination of follwing factors:
a. Female Foeticide
b. Neglect of girl child leading to her death, and
c. Improvement of survival of male children due to a greater access to elementary medical
facilities.
d. In the state, employment opportunities for females are limited. Majority of Rajput, Jat and
other upper caste Hindus still prohibit their wives and daughter from outdoor work in
factories and commercial activities.
Rural – Urban Differences in Sex Ratio
The rural- urban differences in sex ratio are of tremendous importance. The rural sex ratio for Rajasthan
is 933 as against an urban sex ratio of 914 according to 2011 census and the difference between the two
ratios is 19 points. In Rajasthan, the rural – urban gap in sex ratio is slightly high. While Rajasthan is, a
less developed state of India because latter it urbanized and industrialized. The selectivity of male our
migration from rural to urban areas within the state and similar selective in migration from outside the
state to urban areas mainly accounts for the wide gap between the two ratios is not a new phenomena in
Rajasthan. It may be noted that in 2001 the sex ratio gap between rural – urban was 41 point but there is
positive change in its (state) sex ratio, according to 2011 census this gap reduced up to only 19 points.
The sex ratio of rural and urban varies a great deal in accordance with their function and possibilities of
female employment. Out of the determinants of sex ratio, it is assumed that rural – urban differences with
regard to natural sex ratio, differential mortality rates for males and females are minimum. It means that
sex selectivity among migrants from rural to urban is the main determinant of rural –urban differences in
sex ratio. So rural – urban sex ratio does not confirm to the general observation i.e. sex ratio in urban
areas lower than rural areas, these are two types of areas which emerged on the basis of rural- urban
differences in sex ratio (Figure 3 & 4).

The Journal of Population Research 2347 – 1816
Volume 8 Number 2 June 2020 | 63
Fig.3 Fig. 4
A. High Sex Ratio in Rural Areas than Urban – In general sex ratio is lower in urban areas than in
the countryside. There are 161 tehsils in Rajasthan where the rural sex ratio is higher than the
Urban. Ganganagar, Karanpur, Raisinghnagar, Anupgarh, Gharsana, Khajuwala, Kolayat,
Pokaran, Jaisalmer and Sheo tehsils are very close to the international border with Pakistan. So
far, the security of the country some permanent military establishment have been increases
there. During the Kargil war, many new army posts were created to strengthen the military force
and increased the security of Indian border, which resulted in further lowering of sex ratio,
mainly in urban areas. Dungarpur, Banswara. Chittaurgarh, Sirohi, Udaipur and Pali district lies
in the tribal belt and have high rural sex ratio. Tribal population inhabits all these areas, which
is overwhelmingly rural. Secondly, these areas have relatively high sex ratio in rural area than
in urban area due to selective male out migration from the abroad. A large number of males
have migrated to the industrial and commercial towns of Gujarat. In Northwestern, parts
including the districts of Ganganagar also have rural sex ratio higher than urban areas. The
lower urban sex ratio is due to male selective in migration to these areas. Similarly in the central
parts and Eastern tehsils of the state rural sex ratio are higher than urban areas. The lower
urban sex ratio is due to industrial centres, mining and administrative headquarters.
B. High Sex Ratio in Urban Areas than Rural – it is very interesting to note that urban sex ratio is
higher than that of surrounding rural areas in 75 tehsils located in the districts of Tonk,
Banswara, Dungarpur, Sikar, Jhunjhunun, Pali, Bhilwara, Udaipur, Rajsamand, Churu,
Pratapgarh,Chittaurgarh, Bundi, Jaipur, Nagaur, Ajmer, Kota and Jhalawar. However, at the
districts level only the eleven districts viz. Tonk, Banswara, Dungarpur, Partapgarh, Nagaur,
Sikar, Pali, Rajsamand, Ajmer, Churu and Chittaurgarh have the urban ratio higher than rural
areas. Higher urban sex ratio is characteristic of areas dominated by the Marwaris, the Rajputs
and the Jats. The Marwaris dominated areas over 10 tehsils namely Ratangarh, Sardarshahar,
Sujangarh, Taranagar, of Churu district, Fatehpur, Lachhmangarh of Sikar district, Nokha of
The Journal of Population Research 2347 – 1816
Volume 8 Number 2 June 2020 | 64
Bikaner, Phalodi of Jodhpur district Dungarpur of Dungarpur District and Ladnu Tehsil of Nagaur
district. All these tehsils are inhabited by the famous Marwaris noted for their commercial
activities. Excess in small urban areas of this area of this region is the result of large scale out
migration as well as of Gujarat and Delhi etc. in search of better economic opportunities and
jobs. Rajput dominated areas includes the tehsils of Chaksu of Jaipur district, Jahazpur of
Bhilwara district, Pipalda of Kota district, Pirwa of Jhalwara district, Chhotisadri of Partapgarh
district, Bundi of Bundi and Tonk Tehsil of Tonk district. In this region especially among Rajputs
female infanticide neglect of female children and repeated pregnancies are the reasons of
female mortality in rural areas creating lower sex ratio. In nutshell , high sex ratio in urban
areas may be mainly related to the:
a. Selective male out migration from small urban centres to big urban centres, for business
purposes and in search of jobs.
b. Impact of literacy in urban areas resulted in high sex ratio while low sex ratio in rural
areas.
Conclusion
Sex ratio of population of a state or region is mainly the outcome of the interplay of sex differential in
mortality, sex selective migration, sex ratio at birth and at times the sex differential in population
enumeration. The following points have emerged from the study of the sex ratio of the states:
In Rajasthan, the sex ratio fluctuating in a narrow band and always remained at a low level. Presently, its
sex ratio is same as in 1951 and it is highest in the twentieth century. Since independence, sex ratio is
fluctuating 908 to 928. In Rajasthan, number of females was never more than males. In the study of
population one attribute always effected by the other. It generally perceived that if the one attribute
deviate from the normal pattern then certainly it would be cumulative effect of the other attributes and
certainly will produces anomaly in other attributes. The factors awing to which the state has low sex ratio
are enumerated here. Firstly, low sex ratio in Rajasthan is due to low literacy rate. It is needless to say
that education create awareness among society and help to eradicate the orthodoxy and conventional
thinking by revolutionizing the human mind with rational ideas.
Secondly, in Rajasthan, women status is much degraded and due to this, the neglect of girl child leads to
her death. Besides this negligence during parturition, also create a life hazard for the mother’s life.
Thirdly, female foeticide and infanticide is more prominent in developed and less developed areas
respectively. This is mainly due to social factors. Less awareness, more orthodoxy and a strong
patriarchal society give birth to such type heinous crimes; this further lowers the sex ratio. Fourthly, in
improvement of survival of male child due to greater access to elementary medical facilities and on the
other hand denial of these elementary facilities to a female child has further worsened the situation. High
sex ratio in rural areas than in urban areas is due to selective male out migration for the abroad. A large
number of males have migrated to the industrial and commercial towns of Gujarat. The lower urban sex
ratio is due outnumber of male workforce to industrial centres, mining and administrative headquarters.
References
1. Bhutani, S. (1997): “Spatial Patterns of Change in Indian Sex Ratio: 1981 – 1991”, Asian Profile, vol.
25, No. 2, pp. 157 – 168
2. Chandna, R. C. (1986): Population Geography – Concept, Determinants and Patterns, Kalyani
Publishers, New Delhi.
3. Chandna, R. C. (2006): Population Geography - Concepts, Determinants, and Patterns, Kalayani
Publishers, New Delhi.
4. Chandna,R. C. & Sidhu, M. S. (1980): “Introduction of Population Geography”, New Delhi, p78.
5. Clarke, J. I. (1960): “Rural and Urban Sex Ratio in England and Wales”, Tij Descriptor, Economic
and Social Geographic, p.29.

The Journal of Population Research 2347 – 1816
Volume 8 Number 2 June 2020 | 65
6. Franklin, S. H. (1956): “The Pattern of Sex Ratio in New Zealand”,
Economic Geography, Vol. 32, p. 168.
7. Ghosh, B. N. (1985): Fundamentals of Population Geography, Sterling Publishers Pvt. Ltd., New
Delhi, p.97
8. Gill, M.S. (2000): “Sex Ratio Differentials in Northwest India”, Population Geography, vol 22, Nos. 1
& 2, pp. 71 – 86.
9. Gosal, G.S. (1961): “Regionalism of Sex Composition of India’s Population”, Rural Sociology, vol.
26, No. 4, pp. 123 – 137.
10. Gupta, H.S. (1996): “Sex Preference and Fertility in Haryana”, Population Geography, vol. 18, Nos 1
& 2, pp. 37 – 46.
11. Sangwan, S. And Sangwan, R. S. (2002): “Spatial Patterns of Rural – Urban Differentials in Sex Ratio
of India”, Population Geography, vol. 24, Nos. 1 & 2, pp. 47 – 58.
12. Sharma, J. C. (1966): Sex Composition of the Urban Population in Rajasthan”, Geographical Review
of India, vol. 28.
13. Sharma, P. R. (1978): “Spatio-Temporal Patterns of Population Growth and Distribution – A
Regional Analysis”, The Deccan Geographer, Vol. XVI, NO.1, p.373
14. Shryock, H. S. (1976): The Methods and Materials in Demography, Academic Press, New York.
15. Singh, R. N. and Chaturvedi, R. B. (1983): “Dynamics of Population in Bundelkhand Region: A Case
Study”, Journal of Association of Population Geographers, India.
16. Trewartha, G. T. (1953): “A Case for Population Geography”, Annals of association of American
Geographers, Vol. 43, Pp71-97
17. Trewartha, G. T. (1969): A Geography of Population: World Patterns, John Wiley and Sons, Inc.
New York, P.114