The JLL Global Premium Office Rent Tracker · The JLL Global Premium Office Rent Tracker Q1 2016...
5
The JLL Global Premium Office Rent Tracker Q1 2016 Globalisation and city competition We are in a new era of city competition, where cities are fighting to secure the world’s most dynamic corporations, attract the best talent and pull in footloose capital. Increasingly, the commercial real estate sector is playing a pivotal role in this battle as the combined forces of globalisation and technological disruption reshape the world’s urban hierarchy and urban form. Trophy assets, premium rents, top companies Perhaps nowhere is this intense competition between cities better epitomised than in the demand for premium office buildings in the world’s most prestigious commercial office districts. To capture this dynamic, JLL’s Premium Office Rent Tracker compares occupancy costs across a broad range of the world’s major cities. In this first edition, our focus is on office occupation costs across 24 cities of differing function and evolution, ranging from Established World Cities (such as New York, London and Tokyo) through to Emerging World Cities (like Shanghai, Moscow and Mumbai) and New World Cities (as typified by San Francisco, Boston and Toronto). The Tracker includes the key elements of occupancy costs – net effective rent, service charges and property tax – all standardised to enable true international comparisons. The Premium Office Rent Tracker Provides a snapshot of the rarefied world of the premium office market. While only a fraction of a city’s corporate base will pay such premium rents, the tracker does benchmark office occupation costs on a like-for-like basis. It provides a useful barometer of relative city attraction, as well as highlighting the intense strains that many cities are now facing as their real estate markets try to accommodate growth.
Transcript of The JLL Global Premium Office Rent Tracker · The JLL Global Premium Office Rent Tracker Q1 2016...

The JLL Global Premium Office Rent TrackerQ1 2016
Globalisation and city competitionWe are in a new era of city competition, where cities are fighting to secure the world’s most dynamic corporations, attract the best talent and pull in footloose capital. Increasingly, the commercial real estate sector is playing a pivotal role in this battle as the combined forces of globalisation and technological disruption reshape the world’s urban hierarchy and urban form.
Trophy assets, premium rents, top companiesPerhaps nowhere is this intense competition between cities better epitomised than in the demand for premium office buildings in the world’s most prestigious commercial office districts. To capture this dynamic, JLL’s Premium Office Rent Tracker compares occupancy costs across a broad range of the world’s major cities.
In this first edition, our focus is on office occupation costs across 24 cities of differing function and evolution, ranging from Established World Cities (such as New York, London and Tokyo) through to Emerging World Cities (like Shanghai, Moscow and Mumbai) and New World Cities (as typified by San Francisco, Boston and Toronto). The Tracker includes the key elements of occupancy costs – net effective rent, service charges and property tax – all standardised to enable true international comparisons.
The Premium Office Rent TrackerProvides a snapshot of the rarefied world of
the premium office market. While only a fraction of a city’s corporate base will pay such
premium rents, the tracker does benchmark office occupation costs on a like-for-like basis. It provides a useful barometer of relative city attraction, as well as highlighting the intense
strains that many cities are now facing as their real estate markets try to accommodate growth.
The JLL Global Premium Office Rent Tracker
Hong Kong
London
Beijing
New York
Shanghai
Tokyo
San Francisco
Moscow
Delhi
Dubai
Singapore
Mumbai
Washington DC
Paris
Boston
Los Angeles
Frankfurt
Seoul
Chicago
Sydney
Toronto
Houston
Madrid
Amsterdam
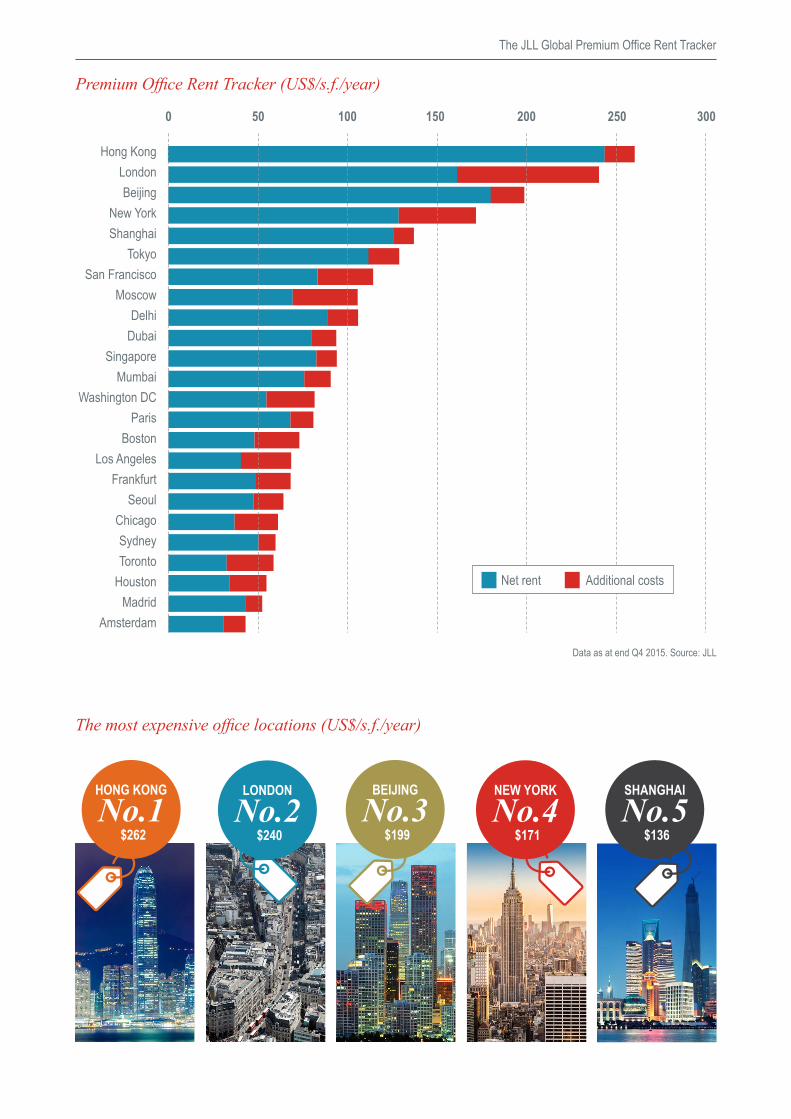
0 50 100 150 200 250 300
Net rent Additional costs
Premium Office Rent Tracker (US$/s.f./year)
The most expensive office locations (US$/s.f./year)
BEIJING
No.3 $199
NEW YORK
No.4 $171
LONDON
No.2 $240
SHANGHAI
No.5 $136
HONG KONG
No.1 $262
Data as at end Q4 2015. Source: JLL
The JLL Global Premium Office Rent Tracker
Emerging World Cities make their markCompetition from several Emerging World Cities is heating up, with China’s Alpha cities – Beijing (3rd) and Shanghai (5th) – fast-tracking to maturity and extending their global business networks. This city duo is showing a remarkable capacity to absorb high levels of additional office space, supported by the growth of a new breed of domestic private companies.
This is reflected in occupancy costs that are now ahead of the Established World Cities of Tokyo (6th) and Paris (14th), as well as Singapore (11th), where new supply is helping affordability.
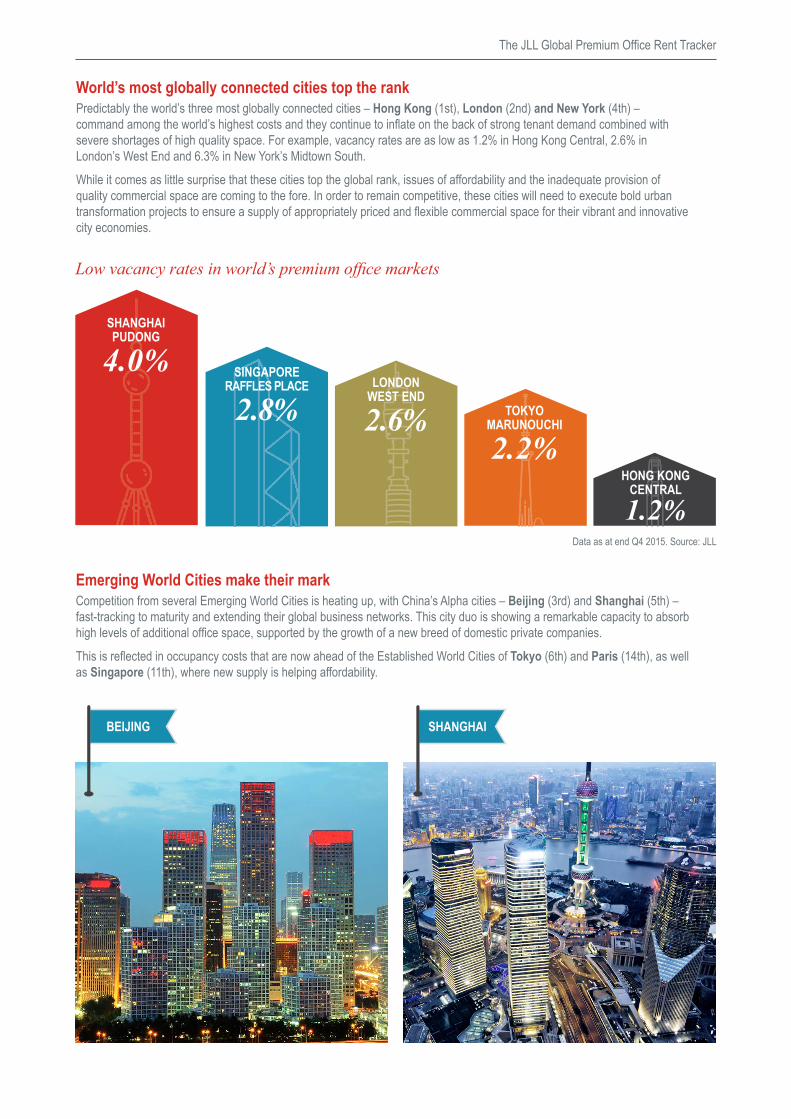
World’s most globally connected cities top the rankPredictably the world’s three most globally connected cities – Hong Kong (1st), London (2nd) and New York (4th) – command among the world’s highest costs and they continue to inflate on the back of strong tenant demand combined with severe shortages of high quality space. For example, vacancy rates are as low as 1.2% in Hong Kong Central, 2.6% in London’s West End and 6.3% in New York’s Midtown South.
While it comes as little surprise that these cities top the global rank, issues of affordability and the inadequate provision of quality commercial space are coming to the fore. In order to remain competitive, these cities will need to execute bold urban transformation projects to ensure a supply of appropriately priced and flexible commercial space for their vibrant and innovative city economies.
HONG KONG CENTRAL
1. 2%
TOKYOMARUNOUCHI
2. 2%
SHANGHAIPUDONG
4.0% SINGAPORERAFFLES PLACE
2.8%
Low vacancy rates in world’s premium office markets
SHANGHAIBEIJING
Data as at end Q4 2015. Source: JLL
LONDONWEST END
2.6%
The JLL Global Premium Office Rent Tracker
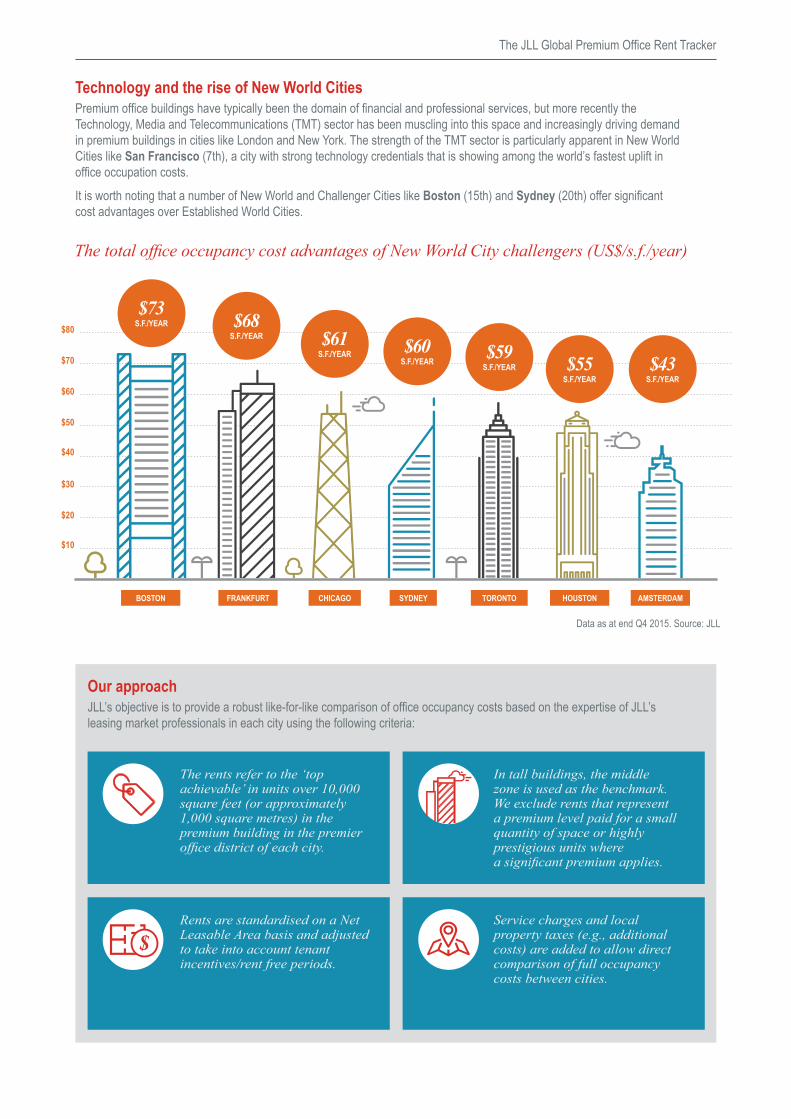
Technology and the rise of New World CitiesPremium office buildings have typically been the domain of financial and professional services, but more recently the Technology, Media and Telecommunications (TMT) sector has been muscling into this space and increasingly driving demand in premium buildings in cities like London and New York. The strength of the TMT sector is particularly apparent in New World Cities like San Francisco (7th), a city with strong technology credentials that is showing among the world’s fastest uplift in office occupation costs.
It is worth noting that a number of New World and Challenger Cities like Boston (15th) and Sydney (20th) offer significant cost advantages over Established World Cities.
The total office occupancy cost advantages of New World City challengers (US$/s.f./year)
$10
$20
$30
$40
$50
$60
$70
$80
BOSTON FRANKFURT CHICAGO SYDNEY TORONTO HOUSTON AMSTERDAM
$73S.F./YEAR $68
S.F./YEAR $61S.F./YEAR $60
S.F./YEAR$59
S.F./YEAR $55S.F./YEAR
$43S.F./YEAR
Our approachJLL’s objective is to provide a robust like-for-like comparison of office occupancy costs based on the expertise of JLL’s leasing market professionals in each city using the following criteria:
The rents refer to the ‘top achievable’ in units over 10,000 square feet (or approximately 1,000 square metres) in the premium building in the premier office district of each city.
In tall buildings, the middle zone is used as the benchmark. We exclude rents that represent a premium level paid for a small quantity of space or highly prestigious units where a significant premium applies.
Rents are standardised on a Net Leasable Area basis and adjusted to take into account tenant incentives/rent free periods.
Service charges and local property taxes (e.g., additional costs) are added to allow direct comparison of full occupancy costs between cities.
Data as at end Q4 2015. Source: JLL

Americas
Gavin Morgan
Vice ChairmanNew [email protected]
Gregory Green
Head of U.S. Agency LeasingNew [email protected]
Steve Smith
Regional Leasing [email protected]
Asia Pacific
Chris Archibold
Head of Commercial [email protected]
Tim O’Connor
Head of Australia Leasing [email protected]
EMEA
Neil Prime
Head of UK Office [email protected]
Marie-Laure de Sousa
Head of France Office [email protected]
International Desk
Valentin Stobetsky
Managing DirectorNew [email protected]
www.jll.com/premiumrents
© 2016 Jones Lang LaSalle IP, Inc. All rights reserved. The information contained in this document is proprietary to Jones Lang LaSalle and shall be used solely for the purposes of evaluating this proposal. All such documentation and information remains the property of Jones Lang LaSalle and shall be kept confidential. Reproduction of any part of this document is authorized only to the extent necessary for its evaluation. It is not to be shown to any third party without the prior written authorization of Jones Lang LaSalle. All information contained herein is from sources deemed reliable; however, no representation or warranty is made as to the accuracy thereof.
Jeremy Kelly
Director – Global [email protected]
Megan Walters
Head of Research – Asia Pacific Capital Markets [email protected]
The JLL Global Office Leasing Group (GOLG) is the world’s most connected global office team providing our clients with powerful insights and knowledge. We work together to successfully connect landlords and tenants in offices across the globe. Contact any of the team to find out more.