The Isolation and Electrochemical Studies of Flavanoids from ...
191
The Isolation and Electrochemical Studies of Flavanoids from Galenia africana and Elytropapus rhinocerotis from the North Western Cape By Khumo Gwendoline Maiko A thesis submitted in fulfillment of the requirements for the degree of Magister Scientiae in the Department of Chemistry University of the Western Cape Cape Town/South Africa Principal supervisor: Prof. Ivan R. Green Co-supervisor: Prof. Emmanuel I. Iwuoha December 2010.
Transcript of The Isolation and Electrochemical Studies of Flavanoids from ...

The Isolation and Electrochemical Studies of Flavanoids from Galenia africana
and Elytropapus rhinocerotis from the North Western Cape
By
Khumo Gwendoline Maiko
A thesis submitted in fulfillment of the requirements for the degree of
Magister Scientiae in the Department of Chemistry
University of the Western Cape
Cape Town/South Africa
Principal supervisor: Prof. Ivan R. Green
Co-supervisor: Prof. Emmanuel I. Iwuoha
December 2010.

ii
KEY WORDS
Flavanoids
Glassy carbon electrode
Antioxidants
Oxidation potentials
Radicals
Preparative layer chromatography
Column chromatography
Purification
Nuclear magnetic resonance
Cyclic voltammetry
Square wave voltammetry

iii
ABSTRACT
In this study two medicinal plant species, namely Galenia africana and
Elytropapus rhinocerotis, the former belonging to the family Aizoceae and the
latter belonging to the family Asteraceae, have been investigated and different
compounds isolated and characterized. Both species are important plants used in
traditional medicine in Africa and particularly in South Africa. Flavanoids are
secondary metabolites found in plants. They have a protective function against
UV radiation and have a defence against invading illnesses due to their
important antioxidant activity. Much of the food we eat and some beverages we
drink contain flavonoids. The aim of this study was to investigate the
electrochemistry of flavanoids isolated from these species. Elytropapus
rhinocerotis contained two compounds viz., 5-hydroxy-7-methoxy-2-(4’-
hydroxyphenyl chromone and 5-hydroxy-7-methoxy-2-(4’-hydroxy-3’-
methoxyphenyl chromone, were isolated. From Galenia africana four known
compounds, dihydroxychalcone, dihydroxy-dihydrochalcone, pinocembrin and
isoliquiritigenin, were isolated. The flavanoids were isolated from the plants
using column chromatography, thin layer chromatography and preparative
layer chromatography in an array of solvents. The structures of the flavanoids
were determined using Proton (1H) and Carbon (13C) Nuclear Magnetic
Resonance (NMR). Electrochemical analyses on both the natural and synthetic
flavanoids were performed by Cyclic Voltammetry (CV) and Square Wave
Voltammetry (SWV) to give information on the accessible redox couples
identified by their oxidation potentials.

iv
DECLARATION
“I declare that The Isolation and Electrochemical Studies of Flavonoids from Galenia
africana and Elytropapus rhinocerotis from the North Western Cape is completely my
work and that all information obtained from external sources has been indicated and
acknowledged by means of references”.
Khumo Gwendoline Maiko
Signed: …………… Date: ……………..

v
ACKNOWLEDGEMENTS
Firstly, I would like to thank the most important presence in my life, God for all
the blessings, strength, perseverance, security his has given me throughout this
year. I would like to also thank my supervisors, Professor Emmanuel Iwuoha
and Professor Ivan Green, who gave me advice, direction and support from the
beginning of my project right until the end. Rasaq Oluwu and Dr. Waryo
Tesfaye are sincerely acknowledged for assisting and guiding me throughout my
project. All my sensor lab colleagues, and all friends, your support, contributions
and caring attitude made feel at home in a place which was too far to be home.
To my mother, Miss L.G. Maiko, my grandmother, Mrs. S.M. Maiko, the
greatest women in my life, I would like to thank you for your prayers, support
and love. I would also like to acknowledge Mr. K.S. Maiko (my uncle), Mr. I.G.
Maiko (cousin) and Mr. T.K. Maiko (brother) for the encouragement and
support.
I would also like to thank the National Research Foundation (NRF) of South
Africa, for the funding for completion of this study.

vi
ABBREVIATIONS
AcO Acetate
Ag/AgCl Silver/Silver chloride
CHCl3 Chloroform
CV Cyclic voltammetry
DNA Deoxyribonucleic acid
EtOAc Ethyl acetate
GCE Glassy carbon electrode
LDL Low density lipoprotein
LPO Lipid peroxidation
MeOH Methanol
NMR Nuclear magnetic resonance
PLC Preparative layer chromatography
PG prostaglandins
Rf Retardation factor
TLC Thin layer chromatography
SWV Square wave voltammetry
UV Ultraviolet

vii
TABLE OF CONTENTS
TITLE PAGE ................................................................. Error! Bookmark not defined.
KEY WORDS ............................................................................................................... ii
ABSTRACT ................................................................................................................ iii
DECLARATION......................................................................................................... iv
ACKNOWLEDGEMENTS ........................................................................................ v
ABBREVIATIONS ..................................................................................................... vi
TABLE OF CONTENTS .......................................................................................... vii
LIST OF FIGURES ................................................................................................... xii
LIST OF SCHEMES ................................................................................................. xx
LIST OF TABLES .................................................................................................... xxi
CHAPTER 1 ................................................................................................................. 1
1.1. General Introduction ................................................................................... 1
1.2. Rationale of project ...................................................................................... 3
1.2.1. Radicals ................................................................................................. 3
1.2.2. Antioxidants.......................................................................................... 4
1.2.3. Flavonoids as antioxidants .................................................................. 5
1.3. Objectives...................................................................................................... 9
1.3.1. Main objective ...................................................................................... 9
1.3.2. Objectives of the project ...................................................................... 9
Chapter 2 .................................................................................................................... 10
Literature review ....................................................................................................... 10
2.1. Medicinal uses of plants ............................................................................ 10
2.1. Namaqualand ............................................................................................. 11
2.1.1. Galenia africana ................................................................................. 12
2.1.2. Elytropapus rhinocerotis ................................................................... 14

viii
2.2. Chalcones and dihydrochalcones.............................................................. 15
2.2.1. Natural abundance and structural variation .................................. 15
2.2.2. Applications of chalcones .................................................................. 16
2.3. Flavonoids ................................................................................................... 17
2.3.1. Natural abundance and structural variation .................................. 17
2.3.2. Chemistry of flavonoids ..................................................................... 18
2.3.3. Flavonoids and plants ........................................................................ 20
2.3.4. Flavonoids and humans ..................................................................... 24
2.3.5. Electrochemistry of flavonoids ......................................................... 31
2.4. Review of natural and synthesized flavonoids and chalcones ................ 34
2.4.1. 1-(2’,4’-dihydroxyphenyl)-3-phenyl propan-1-one (1) ................... 34
2.4.2. 2,3-dihydro-5,7-dihydroxy-2-phenyl-4H-1-benzopyran-4-one (2). 34
2.4.3. 2,3-dihydro-5,7-dihydroxy-2-(2’-methoxyphenyl)-4H-1-
benzopyran-4-one (3) .......................................................................................... 35
2.4.4. 1-(2’,4’-diacetoxyphenyl)-3-phenyl-2-propen-1-one (4) ................. 35
2.4.5. 1-(2’,4’-dihydroxyphenyl)-3-phenyl-2-propen-1-one (5) ................ 35
2.4.6. 5-acetoxy-2,3-dihydro-7-hydroxy-2-(2’-methoxyphenyl)-4H-1-
Benzopyran-4-one (6) ......................................................................................... 36
2.4.7. 2,3-dihydro-7-hydroxy-2-phenyl-4H-1-Benzopyran-4-one (7) ...... 36
2.4.8. 5,7-(diacetoxy)-2,3-dihydro-2-phenyl-4H-1-benzopyran-4-one (8)36
2.4.9. 5,7-(diacetoxy)-2,3-dihydro-2-(2’-methoxyphenyl)-4H-1-
benzopyran-4-one (9) .......................................................................................... 36
2.4.10. 2,3-dihydro-5-hydroxy-2-(4’-hydroxy-3’-methoxyphenyl)-7-
methoxy-4H-1-benzopyran-4-one (10) .............................................................. 37
2.4.11. 2,3-dihydro-5-hydroxy-2-(4’-hydroxyphenyl)-7-methoxy-4H-1-
benzopyran-4-one (11) ........................................................................................ 37
2.5. Characterization techniques ..................................................................... 38
2.5.1. Electrochemical characterization ..................................................... 38

ix
2.5.2. Nuclear magnetic resonance ............................................................. 46
Chapter 3 .................................................................................................................... 50
Experimental .............................................................................................................. 50
3.1. Apparatus and reagents .................................................................................. 50
3.2. Organic experimental ..................................................................................... 51
3.2.1. Isolation ..................................................................................................... 51
3.2.2. Synthesis .................................................................................................... 54
3.3. Electrochemistry .............................................................................................. 57
3.3.1. Preparation of solutions ........................................................................... 57
3.3.2. Voltammetric measurements ................................................................... 57
Chapter 4 .................................................................................................................... 59
Organic results and discussion ................................................................................. 59
4.1. Flavanoids from Galenia africana ................................................................. 59
4.1.1 Compound 1: 1-(2’,4’-dihydroxyphenyl)-3-phenyl propan-1-one (1) ... 59
4.1.2 Compound 2: 2,3-dihydro-5,7-dihydroxy-2-phenyl-4H-1-benzopyran-4-
one (2)................................................................................................................... 61
4.1.3 Compound 3: 2,3-dihydro-5,7-dihydroxy-2-(2’-methoxyphenyl)-4H-1-
benzopyran-4-one (3) .......................................................................................... 63
4.1.4 Compound 4: 1-(2’,4’-diacetoxyphenyl)-3-phenyl-2-propen-1-one (4) . 66
4.1.5 Compound 5: (1-(2’,4’-dihydroxyphenyl)-3-phenyl-2-propen-1-one (5)
.............................................................................................................................. 68
4.1.6 Compound 6: 5-acetoxy-2,3-dihydro-7-hydroxy-2-(2’-methoxyphenyl)-
4H-1-Benzopyran-4-one (6) ............................................................................... 71
4.1.7 Compound 7: 2,3-dihydro-7-hydroxy-2-phenyl-4H-1-Benzopyran-4-one
(7).......................................................................................................................... 74
4.1.8.Compound 8: 5,7-(diacetoxy)-2,3-dihydro-2-phenyl-4H-1-benzopyran-
4-one (8) .............................................................................................................. 77

x
4.1.9 Compound 9: 5,7-(diacetoxy)-2,3-dihydro-2-(2’-methoxyphenyl)-4H-1-
benzopyran-4-one (9) .......................................................................................... 80
4.2. Flavanoids of Elytropapus rhinocerotis ................................................... 83
4.2.1. Compound 10: 2,3-dihydro-5-hydroxy-2-(4’-hydroxy-3’- .................... 83
methoxyphenyl)-7-methoxy-4H-1-benzopyran-4-one (10) .............................. 83
4.2.2. Compound 11: 2,3-dihydro-5-hydroxy-2-(4’-hydroxyphenyl)-7-
methoxy-4H-1-benzopyran-4-one (11) .............................................................. 86
CHAPTER 5 ............................................................................................................... 90
Electrochemical results and discussion .................................................................... 90
5.1. Flavanoids from Galenia Africana ........................................................... 90
5.1.1.Compound 1: 1-(2’,4’-dihydroxyphenyl)-3-phenyl propan-1-one (1) .. 90
5.1.2.Compound 2: 2,3-dihydro-5,7-dihydroxy-2-phenyl-4H-1-benzopyran-4-
one (2) .............................................................................................................. 97
5.1.3. Compound 3: 2,3-dihydro-5,7-dihydroxy-2-(2’-methoxyphenyl)-
4H-1-benzopyran-4-one (3) .............................................................................. 102
5.1.4. Compound 4: 1-(2’,4’-diacetyloxyphenyl)-3-phenyl-2-propen-1-one
(4) ............................................................................................................ 106
5.1.5. Compound 5: 1-(2’,4’-dihydroxyphenyl)-3-phenyl-2-propen-1-one
(5) ............................................................................................................ 112
5.1.6. Compound 6: 5-acetoxy-2,3-dihydro-7-hydroxy-2-(2’-
methoxyphenyl)-4H-1-Benzopyran-4-one (6) ................................................ 115
5.1.7. Compound 7: 2,3-dihydro-7-hydroxy-2-phenyl-4H-1-Benzopyran-
4-one (7) ............................................................................................................ 119
5.1.8. Compound 8: 5,7-(diacetoxy)-2,3-dihydro-2-phenyl-4H-1-
benzopyran-4-one (8) ........................................................................................ 124
5.1.9. Compound 9: 5,7-(diacetoxy)-2,3-dihydro-2-(2-methoxyphenyl)-
4H-1-benzopyran-4-one (9) .............................................................................. 128
5.2. Flavanoids from Elytropapus rhinocerotis ............................................ 132

xi
5.2.1. Compound 10: 2,3-dihydro-5-hydroxy-2-(4’-hydroxy-3’-
methoxyphenyl)-7-methoxy-4H-1-benzopyran-4-one (10) ............................ 132
5.2.2. Compound 11: 2,3-dihydro-5-hydroxy-2-(4-hydroxyphenyl)-7-
methoxy-4H-1-benzopyran-4-one (11) ............................................................ 137
Chapter 6 .................................................................................................................. 145
CONCLUSION ........................................................................................................ 145
6.1. Determination of antioxidant activity .................................................... 146
6.2. Relationship between antioxidant activity and structure .................... 147
REFERENCES ......................................................................................................... 149
xii
LIST OF FIGURES
Figure 1: Flavonoid base structure. .............................................................................. 1
Figure 2: Illustration to show the difference between a flavonoid and a flavanoid. ..... 2
Figure 3: Free Radical Damage in the body ................................................................ 4
Figure 4: Antioxidant behaviour. .................................................................................. 5
Figure 5 : Structure of the flavonol, quercetin showing features important in defining
the classical antioxidant potential of flavonoids ........................................................... 7
Figure 6: Illustration showing the boundaries of Namaqualand ............................... 12
Figure 7: Illustration of the aerial parts of Galenia Africana .................................... 13
Figure 8: Illustrations of Elytropapus rhinocerotis .................................................... 15
Figure 9: Main classes of flavonoids and related compounds. .................................... 19
Figure 10: Continuation of main classes of flavonoids and related compounds ......... 20
Figure 11: Flavonoids co-pigments that influence the colour of flower species ......... 21
Figure 12: Illustration of synthesis of prostaglandins ................................................ 27
Figure 13: Illustration of Bas Epsilon electrochemical analyzer ................................ 39
Figure 14: Illustration of setup of a three electrode system ........................................ 40
Figure 15: Illustration of the different types and sizes of glassy carbon electrodes .... 41
Figure 16 : Schematic representation of the silver-silver chloride electrode .............. 42
Figure 17: Typical cyclic voltammogram where ipc and ipa show the peak cathodic and
anodic current respectively for a reversible reaction ................................................. 44
Figure 18: Illustration of a general NMR spectrometer .............................................. 48
Figure 19: Flavanoids isolated from Galenia Africana. .............................................. 52
Figure 20: Chemical structure of 1-(2’,4’-dihydroxyphenyl)-3-phenyl propan-1-one
(1) ................................................................................................................................. 59

xiii
Figure 21: 1H NMR spectrum of 1-(2’,4’-dihydroxyphenyl)-3-phenyl propan-1-one (1)
...................................................................................................................................... 60
Figure 22: Chemical structure of 2,3-dihydro-5,7-dihydroxy-2-phenyl-4H-1-
benzopyran-4-one(2) .................................................................................................... 61
Figure 23: 1H NMR spectrum of 2,3-dihydro-5,7-dihydroxy-2-phenyl-4H-1-
benzopyran-4-one(2) .................................................................................................... 62
Figure 24: Chemical structure of 2,3-dihydro-5,7-dihydroxy-2-(2’-methoxyphenyl)-
4H-1-benzopyran-4-one (3) ......................................................................................... 63
Figure 25: 1H NMR spectrum of 2,3-dihydro-5,7-dihydroxy-2-(2’-methoxyphenyl)-4H-
1-benzopyran-4-one (3) ............................................................................................... 64
Figure 26: 13C NMR spectrum of 2,3-dihydro-5,7-dihydroxy-2-(2’-methoxyphenyl)-
4H-1-benzopyran-4-one (3) ......................................................................................... 65
Figure 27: Chemical structure of 1-(2’,4’-diacetoxyphenyl)-3-phenyl-2-propen-1-one
(4). ................................................................................................................................ 66
Figure 28: 1H NMR spectrum of 1-(2’,4’-diacetoxyphenyl)-3-phenyl-2-propen-1-one
(4) ................................................................................................................................. 67
Figure 29: Chemical structure of 1-(2’,4’dihydroxyphenyl)-3-phenyl-2-propen-1-one
(5) ................................................................................................................................. 68
Figure 30: 1H NMR spectrum of 1-(2’,4’dihydroxyphenyl)-3-phenyl-2-propen-1-one
(5) ................................................................................................................................. 69
Figure 31: 13C NMR spectrum of 1-(2’,4’dihydroxyphenyl)-3-phenyl-2-propen-1-one
(5) ................................................................................................................................. 70
Figure 32: Chemical structure of 5-acetoxy-2,3-dihydro-7-hydroxy-2-(2’-
methoxyphenyl)-4H-1-Benzopyran-4-one (6) .............................................................. 71

xiv
Figure 33: 1H NMR spectrum of 5-acetoxy-2,3-dihydro-7-hydroxy-2-(2’-
methoxyphenyl)-4H-1-Benzopyran-4-one (6) .............................................................. 72
Figure 34: 13C NMR spectrum of 5-acetoxy-2,3-dihydro-7-hydroxy-2-(2’-
methoxyphenyl)-4H-1-Benzopyran-4-one (6) .............................................................. 73
Figure 35: Chemical structure of 2,3-dihydro-7-hydroxy-2-phenyl-4H-1-Benzopyran-
4-one (7) ....................................................................................................................... 74
Figure 36: 1H NMR spectrum of 2,3-dihydro-7-hydroxy-2-phenyl-4H-1-Benzopyran-
4-one (7) ....................................................................................................................... 75
Figure 37: 13C NMR spectrum of of 2,3-dihydro-7-hydroxy-2-phenyl-4H-1-
Benzopyran-4-one (7) .................................................................................................. 76
Figure 38: Chemical structure of 5,7-(diacetoxy)-2,3-dihydro-2-phenyl-4H-1-
benzopyran-4-one (8) ................................................................................................... 77
Figure 39: 1H NMR spectrum of 5,7-(diacetoxy)-2,3-dihydro-2-phenyl-4H-1-
benzopyran-4-one (8) ................................................................................................... 78
Figure 40: 13C NMR spectrum of 5,7-(diacetoxy)-2,3-dihydro-2-phenyl-4H-1-
benzopyran-4-one (8) ................................................................................................... 79
Figure 41: Chemical structure of 5,7-(diacetoxy)-2,3-dihydro-2-(2’-methoxyphenyl)-
4H-1-benzopyran-4-one (9) ......................................................................................... 80
Figure 42: 1H NMR spectrum of 5,7-(diacetoxy)-2,3-dihydro-2-(2’-methoxyphenyl)-
4H-1-benzopyran-4-one (9) ......................................................................................... 81
Figure 43: 13C NMR spectrum of 5,7-(diacetoxy)-2,3-dihydro-2-(2’-methoxyphenyl)-
4H-1-benzopyran-4-one (9) ......................................................................................... 82
Figure 44 : Chemical structure of 2,3-dihydro-5-hydroxy-2-(4’-hydroxy-3’-
methoxyphenyl)-7-methoxy-4H-1-benzopyran-4-one (10) ........................................... 83

xv
Figure 45 : 1H NMR spectrum of 2,3-dihydro-5-hydroxy-2-(4’-hydroxy-3’-
methoxyphenyl)-7-methoxy-4H-1-benzopyran-4-one (10) ........................................... 84
Figure 46: 13C NMR spectrum 2,3-dihydro-5-hydroxy-2-(4’-hydroxy-3’-
methoxyphenyl)-7-methoxy-4H-1-benzopyran-4-one (10) ........................................... 85
Figure 47: Chemical structure of 2,3-dihydro-5-hydroxy-2-(4’-hydroxyphenyl)-7-
methoxy-4H-1-benzopyran-4-one (11) ......................................................................... 86
Figure 48: 1H NMR spectrum of 2,3-dihydro-5-hydroxy-2-(4’-hydroxyphenyl)-7-
methoxy-4H-1-benzopyran-4-one (11) ......................................................................... 87
Figure 49 : 13C NMR spectrum 2,3-dihydro-5-hydroxy-2-(4’-hydroxyphenyl)-7-
methoxy-4H-1-benzopyran-4-one (11) ......................................................................... 88
Figure 50: Cyclic voltammogram of compound 1, scan rate 100 mV/s. ...................... 90
Figure 51: Square wave voltammogram of compound 1, scan rate 20 mV/s. ............. 91
Figure 52: Linear regression of compound 1. ............................................................. 91
Figure 53: Cyclic voltammogram of resorcinol, scan rate 100 mV/s. ......................... 93
Figure 54: Square wave voltammogram of resorcinol, scan rate 20 mV/s. ................. 93
Figure 55: Cyclic voltammogram of 2-butanone, scan rate 100 mV/s. ....................... 94
Figure 56: Cyclic voltammogram of benzene, scan rate 100 mV/s.............................. 94
Figure 57: Cyclic voltammograms of resorcinol, 2-butanone, benzene and compound
1.................................................................................................................................... 95
Figure 58: Square wave voltammograms of resorcinol, 2-butanone, benzene and
compound 1. ................................................................................................................. 95
Figure 59: Cyclic voltammogram of compound 2, scan rate of 100 mV/s. .................. 97
Figure 60: Square wave voltammogram of compound 2, scan rate 20mV/s. .............. 98
Figure 61: Linear regression of compound 2. ............................................................. 98
Figure 62: Cyclic voltammogram of tetrahydrofuran, scan rate 100 mV/s. .............. 100

xvi
Figure 63: Cyclic voltammograms of resorcinol, benzene, tetrahydrofuran and
compound 2. ............................................................................................................... 100
Figure 64: Square wave voltammograms of resorcinol, benzene, tetrahydrofuran and
compound 2. ............................................................................................................... 101
Figure 65: Cyclic voltammogram of compound 3, scan rate 100 mV/s. .................... 102
Figure 66: Square wave voltammogram of compound 3, scan rate 20 mV/s. ........... 102
Figure 67: Linear regression compound 3................................................................. 103
Figure 68: Cyclic voltammogram of anisole, scan rate 100 mV/s. ............................ 104
Figure 69: Square wave voltammogram of anisole, scan rate 20 mV/s. ................... 104
Figure 70: Cyclic voltammograms of resorcinol, tetrahydrofuran, anisole and
compound 3. ............................................................................................................... 105
Figure 71: Square wave voltammograms of resorcinol, tetrahydrofuran, anisole and
compound 3. ............................................................................................................... 105
Figure 72: Cyclic voltammogram of compound 3, scan rate 100 mV/s. .................... 106
Figure 73: Square wave voltammogram of compound 3, scan rate 20 mV/s. ........... 107
Figure 74: Linear regression of compound 4. ........................................................... 107
Figure 75: Cyclic voltammogram of diacetoxybenzene, scan rate 100 mV/s ............ 108
Figure 76: Square wave voltammogram of diacetobenzene, scan rate 20mV/s. ....... 109
Figure 77: Cyclic voltammogram of 2-pentenone, scan rate 100mV/s. ..................... 109
Figure 78: Square wave voltammogram of 2-pentenone, scan rate 20mV/s. ............ 110
Figure 79: Cyclic voltammogram of diacetoxybenzene, 2-pentenone, benzene and
compound 4. ............................................................................................................... 110
Figure 80: Square wave voltammograms of diacetoxybenzene, 2-pentenone, benzene
and compound 4. ........................................................................................................ 111
Figure 81: Cyclic voltammogram of compound 5, scan rate 100 mV/s. .................... 112

xvii
Figure 82: Square wave voltammogram of compound 5, scan rate 20 mV/s. ........... 112
Figure 83: Linear regression of compound 5. ........................................................... 113
Figure 84: Cyclic voltammograms of resorcinol, 2-pentenone, benzene and compound
5.................................................................................................................................. 114
Figure 85: Square wave voltammograms of resorcinol, 2-pentenone, benzene and
compound 5. ............................................................................................................... 114
Figure 86: Cyclic voltammogram of compound 6, scan rate100 mV/s. ..................... 115
Figure 87: Square wave voltammogram of compound 6, scan rate 20 mV/s. ............ 116
Figure 88: Linear regression of compound 6. ............................................................ 116
Figure 89: Cyclic voltammogram of 1,3-acetoxy phenol, scan rate100 mV/s. .......... 117
Figure 90: Cyclic voltammograms of 1,3-acetoxy phenol ,tetrahydrofuran, methoxy
benzene and compound 6. .......................................................................................... 118
Figure 91: Cyclic voltammogram of compound 7, scan rate100 mV/s. ..................... 119
Figure 92: Square wave voltammogram of compound 7, scan rate 20 mV/s. ............ 119
Figure 93: Linear regression of compound 7. ............................................................ 120
Figure 94: Cyclic voltammogram of phenol, scan rate100 mV/s. .............................. 121
Figure 95: Square wave voltammogram of phenol, scan rate 20 mV/s. .................... 122
Figure 96: Cyclic voltammogram of phenol, tetrahydrofuran, benzene and compound
7.................................................................................................................................. 122
Figure 97: Square wave voltammograms of phenol, tetrahydrofuran, benzene and
compound 7. ............................................................................................................... 123
Figure 98: Cyclic voltammogram of compound 8, scan rate100 mV/s. ..................... 124
Figure 99: Square wave voltammogram of compound 8, scan rate 20 mV/s. ............ 125
Figure 100: Linear regression of compound 8. .......................................................... 125

xviii
Figure 101: Cyclic voltammograms of diacetoxybenzene, tetrahydrofuran, benzene
and compound 8. ........................................................................................................ 126
Figure 102: Square wave voltammograms of diacetoxybenzene, tetrahydrofuran,
benzene and compound 8. .......................................................................................... 127
Figure 103: Cyclic voltammogram of compound 9, scan rate100 mV/s. ................... 128
Figure 104: Square wave voltammogram of compound 9, scan rate 20 mV/s. .......... 129
Figure 105: Linear regression graph of compound 9. ............................................... 129
Figure 106: Cyclic voltammograms of diacetoxybenzene, tetrahydrofuran, anisole and
compound 9. ............................................................................................................... 130
Figure 107: Square wave voltammograms of diacetoxybenzene, tetrahydrofuran,
anisole and compound 9. ........................................................................................... 131
Figure 108: Cyclic voltammogram of compound 10, scan rate100 mV/s. ................. 132
Figure 109 : Square wave voltammogram of compound 10, scan rate 20 mV/s. ....... 133
Figure 110: Linear regression graph of compound 10. ............................................. 133
Figure 111: Cyclic voltammogram of 1,2 methoxy phenol, scan rate100 mV/s. ....... 134
Figure 112: Cyclic voltammogram of 1,3 methoxy phenol, scan rate100 mV/s. ....... 135
Figure 113: Cyclic voltammograms of 1,3 methoxy phenol, tetrahydrofuran, 1,2
methoxy phenol and compound 10. ........................................................................... 135
Figure 114: Magnified diagram of area labelled 1 on figure 123. ............................ 136
Figure 115: Cyclic voltammogram of compound 11, scan rate100 mV/s. ................. 137
Figure 116: Square wave voltammogram of compound 11, scan rate 20 mV/s. ........ 137
Figure 117: Linear regression graph of compound 11. ............................................. 138
Figure 118: Cyclic voltammogram of 1,3 methoxy phenol, tetrahydrofuran, phenol
and compound 11. ...................................................................................................... 139
Figure 119: Magnified graph of area labelled 1 on figure129. ................................. 139

xix
Figure 120: Cyclic voltammograms of all 11 compounds scan rate 100 mV/s. ......... 140
Figure 121: Square wave voltammograms of all 11 compounds, scan rate 20 mV/s 141

xx
LIST OF SCHEMES
Scheme 1: Mechanism of reaction of flavonoids with radicals. ......................................... 7
Scheme 2: Acylation of 1-(2’,4’-dihydroxyphenyl)-3-phenyl-2-propen-1-one (5). .......... 54
Scheme 3: Acylation of 2,3-dihydro-5,7-dihydroxy-2-phenyl-4H-1-benzopyran-4-one
(2). ..................................................................................................................................... 55
Scheme 4: Acylation of 2,3-dihydro-5,7-dihydroxy-2-(2’-methoxyphenyl)-4H-1-
benzopyran-4-one (3) ....................................................................................................... 55
Scheme 5: Cyclization 1-(2’,4’-dihydroxyphenyl)-3-phenyl-2-propen-1-one (5). ............ 56

xxi
LIST OF TABLES
Table 1: Flavonoid complexes found in different plant species that influence colour. .... 22
Table 2: Plant species in which UV protective flavonoids have been identified. ............. 23
Table 3: Applications of flavonoids in human systems. .................................................... 25
Table 4: The six major fractions isolated from first separation. ...................................... 52

1
CHAPTER 1
1.1.General Introduction
Flavonoids constitute one of the most characteristic classes of compounds in higher
plants. Many flavonoids are easily recognized as flower pigments in most angiosperm
families. Their occurrence is not restricted to flowers but include all parts of the plant.
In addition to various fruits and vegetables, flavonoids are found in seeds, nuts,
grains, spices and different medicinal plants as well as in beverages such as wine, tea
and beer [1-4]. Therapeutic effects of many traditional medicines maybe due to the
presence of flavonoids [5]. Flavonoids are polyphenolic compounds possessing fifteen
carbon atoms, and comprise of two benzene rings joined by a linear three carbon
chain [6]. Flavonoids differ from flavonoids in that the bond between C2-C3 is
saturated in the former and unsaturated in the latter as shown in figure 2.
A
B
O
2
3
4
5
6
2 '
3 '
4 '
5 '
6 '
Figure 1: Flavonoid base structure.

2
OO
OO
R1
R2
R3
R4R4
R3
R2
R1
FlavonoidFlavanoid
Figure 2: Illustration to show the difference between a flavonoid and a flavanoid.
Flavonoids have gained interest because of their broad pharmacological activity and
their possible application in the field of nutrition. They effectively suppress lipid
peroxidation (LPO) in biological tissues and sub-cellular fractions such as
mitochondria, microsomes, low density lipoprotein (LDL) and erythrocyte membrane.
They also have significant antioxidant, anti-inflammatory, anti-allergic, anti-platelet,
anti-osteoporotic, anti-hepatotoxic, anti-viral and anti-diabetic effects and the
prevention of cardio vascular disease [7-10].
Antioxidants are of great interest because of their involvement in important biological
and industrial processes. It is accepted worldwide that a natural product is healthier
than that of a synthetic origin. This question is still open for discussion and many
studies on this subject are being carried out [11-12].

3
1.2. Rationale of project
To be able to understand the importance of flavonoids in our bodies we have to first
understand the effect of free radicals which have a negative effect on our body.
1.2.1. Radicals
Radicals are atoms, molecules, or ions with unpaired electrons with an open shell
configuration. Free radicals may have positive, negative or zero charge. Even though
they have unpaired electrons, by convention, metals and their ions or complexes with
unpaired electrons are not radicals. With some exceptions, the unpaired electrons
cause radicals to be highly chemically reactive [13]. Free radicals play an important
role in a number of biological processes, some of which are necessary for life, such as
the intracellular killing of bacteria by phagocytic cells such as granulocytes and
macrophages. The two most important oxygen-centered free radicals are super oxide
and hydroxyl radical. They are derived from molecular oxygen after reduction
processes. Free radicals because of their high reactivity can participate in unwanted
side reactions resulting in cell damage. Excessive amounts of these free radicals can
lead to cell injury and death, which results in many diseases such as cancer, stroke,
myocardial infarction, diabetes and major disorders. Many forms of cancer are
believed to be the result of reactions between free radicals and DNA, resulting in
mutations that can affect the cell cycle and potentially lead to malignancy. Some of
the symptoms of aging such as atherosclerosis are also attributed to free-radical
induced oxidation of many of the chemicals making up the body [13].

4
Figure 3: Free Radical Damage in the body [14]
Free radicals are necessary for life and the body has a number of mechanisms to
minimize free radical induced damage and to repair damage that is caused by them,
such as the enzymes super oxide dismutase, catalase, glutathione-peroxidase and
glutathione reductase. Antioxidants play a key role in these defence mechanisms. The
three vitamins, vitamin A, vitamin C and vitamin E and polyphenol antioxidants
which include flavonoids are believed to behave as antioxidants [13].
1.2.2. Antioxidants
Antioxidants are compounds that protect cells against the damaging effects of reactive
oxygen species, such as singlet oxygen, super oxide, peroxyl radicals, hydroxyl
radicals and peroxynitrite which are collectively known as radicals. An imbalance
between antioxidants and reactive oxygen species (ROS) results in oxidative stress

5
and this then leads to cellular damage. Oxidative stress has been linked to cancer,
aging, atherosclerosis, inflammation and neurodegenerative diseases like Parkinson's
and Alzheimer's. Flavonoids help provide protection against these diseases by
contributing, along with antioxidant vitamins and enzymes, to the total antioxidant
defence system of the human body. Epidemiological studies have shown that
flavonoid intake is inversely related to mortality from coronary heart disease and to
the incidence of heart attacks [15-17].
Figure 4: Antioxidant behaviour [18].
1.2.3. Flavonoids as antioxidants
Flavonoids have been shown to act as scavengers of various oxidizing, species i.e.
super oxide anion, hydroxyl radical or peroxyl radicals. They may also act as
quenchers of singlet oxygen. The capacity of flavonoids to act as antioxidants
depends upon their molecular structure. The position of hydroxyl groups and other

6
features in the chemical structure of flavonoids are important for their antioxidant and
free radical scavenging activities. Quercetin, the most abundant dietary flavonol, is a
potent antioxidant because it has all the right structural features for free radical
scavenging activity [19]. The chemical properties of polyphenols in terms of the
availability of phenolic hydrogen’s as hydrogen – donating radical scavengers
suggests they will have antioxidant activity. To be defined as an antioxidant a
polyphenol must satisfy two basic conditions [20]:
i. When present in low concentration relative to substrate to be oxidized, it
should prevent auto – oxidation or free radical mediated oxidation [21].
ii. Resulting radical formed after scavenging must be stable through
intermolecular hydrogen bonding [21].
Das and Pereira (1990) have shown that a carbonyl group at C-4 and a double bond
between C-2 and C-3 are important features for high antioxidant activity in flavonoids
[22].
The reactive structural groups for flavonoids are:
The pyrogallol group.
The catechol group.
The 2,3 double bond in conjugation with the 4 – oxo and 3 – hydroxyl group.
Additional resonance effect substituents [1, 20].

7
O
O
HO
OH
OH
OH
OH
Figure 5 : Structure of the flavonol, quercetin showing features important in
defining the classical antioxidant potential of flavonoids. The most important of
these is the catechol (dihydroxylated B-ring – shaded blue). Other important
features include the presence of unsaturation in the C-ring (shaded red) and the
presence of a 4-oxo function in the C ring (shaded purple) [23]
OH
OH
O
OH
O
OH
O
O
R
R
RH
RH
Scheme 1: Mechanism of reaction of flavonoids with radicals (R·)

8
Flavonoids always present in all plants, and are very diverse as well as relatively easy
to separate with modern chromatographic techniques. The increased interest in
flavonoids is because the pharmaceutical industry is always on the lookout for new
and novel medicinal herbs in which the functional compounds can serve as a starting
point for the development of series of both analogues and derivatives. Another reason
for their study is due the growing activity in the field of flavonoid biochemistry with
numerous claims by many practitioners of the beneficial effects of treatment with
natural products, which proved to be rich in flavonoids [24]. Studying the
electrochemistry of flavonoids by recording their oxidation potentials will allow us to
be able to tell which flavonoids have more health benefits. In the food industry it is
important to be able to determine the concentrations of and the identities of the
flavonoids a certain plant or fruit may contain. The antioxidant activity of phenolic
compounds is inversely proportional to their oxidation potential, the lower the
potential the higher the ability of an antioxidant compound to donate an electron [25].

9
1.3.Objectives
1.3.1. Main objective
The aim of the project is to develop a rapid electrochemical procedure to
determine flavanoid contents of plants from a single extraction by their
oxidation potentials.
1.3.2. Objectives of the project
i. To isolate flavanoids using column chromatography, thin layer
chromatography and preparative layer chromatography.
ii. To synthesize other analogues from the already isolated compounds.
iii. To elucidate the structures of the flavanoids using proton and carbon
nuclear magnetic resonance
iv. To do electrochemical evaluations of both the natural and synthesized
flavanoids using cyclic voltammetry and square wave voltammetry.

10
Chapter 2
Literature review
2.1. Medicinal uses of plants
Many plants produce substances that are useful to the maintenance of health in
humans and other animals. These include aromatic substances, most of which are
phenols or their oxygen-substituted derivatives. Many are secondary metabolites, of
which thousands have been isolated. In many cases, substances such as alkaloids
serve as plant defence mechanisms against predation by micro-organisms, insects, and
herbivores. Many of the herbs and spices used by humans to season food yield useful
medicinal compounds [26]. Many drugs listed as conventional medication were
originally derived from plants [27]. Morphine, the most important alkaloid of the
opium poppy, remains the standard against which new synthetic analgesic drugs are
measured [28]. The use of bee products such as honey, wax and pollen in treatment of
human diseases is very old. This is due to a high concentration of flavonoids found in
these products. Our ancestors discovered that inflammation of the skin and throat
healed rapidly when treated with honey. Early evidence in the use of honey as a
healing agent was discovered by archaeologists who found resins containing
flavonoids at ancient burial sites and fire places. These residues with high flavonoid
content where also found in Egypt on tombs of pharaohs and are also believed to have
been used for balsaming mummies. Due to oxidation of the flavonoids, these
mummies acquire a black colour [29-30]. Other drugs include betulinic acid isolated
from Betula alba which has an anti-tumor activity; caffeine extracted from Camelia
sinensis which acts as central nervous system stimulant; digitalin, digitoxin and
digoxin all isolated from Digitalis purpurea which have cardiotonic action [31].

11
Many South African plants have ethno-botanical uses for the treatment of tuberculosis
and related symptoms such as coughing, respiratory ailments and fever. Extracts
prepared from some of these plants as well as others selected on a random basis have
been screened by South African researchers for activity against several
Mycobacterium species using various methods [32].
2.1. Namaqualand
The Namaqualand desert falls within the succulent Karoo biome which is recognized
as one of the only two biodiversity hotspots within the semi – arid areas. The winter
rainfall is typically predictable while the summer rainfall is less predictable [33]. The
lowland Namaqualand, in the north-western cape, South Africa has spectacular
botanical diversity and because the land is used primarily as natural rangeland most of
it is relatively un-reformed. It is specifically renowned for mass floral displays in
winter and spring and for incredibly high number and abundance of succulent plants.
More than 6300 vascular plant species occur in the succulent Karoo biome [34].
Lowland Namaqualand covers predominantly flat sandy plains from the Oliphant’s
river in the south to the orange river in the north which is approximately 400 km and
from the Atlantic coastline to the west to the base of the escarpment in the east which
is approximately 50 km. Mean annual rainfall decreases from 145mm in the south
near Vredendal to 40 mm in the north at Alexandra bay [35]. The flat sandy plain
consists of complex sequence of marine deposits. Generally, these sands change
colour from pale-grey to yellow to red with increasing age and distance from the coast
[36]. The vegetation is dominated by erect and scrambling dwarf leaf-succulent
shrubs. Mesembryanthemaceae/Aizoceae and Asteraceae are the most abundant
families but during winter annuals like geophytes are also common [37]. The plants

12
that were involved in my project, i.e. Galenia africana and Elytropapus rhinocerotis
were isolated from the lowland Namaqualand.
Figure 6: Illustration showing the boundaries of Namaqualand [38]
2.1.1. Galenia africana
Galenia africana is belonging to the family Aizoceae. It is a dominant plant
throughout Namaqualand, South Africa. Galenia africana is an aromatic perennial
sub-shrub growing 0.5 – 1 m high with oppositely arranged leaves which are linearly
lanceolate, attenuated at the base. The flowers are sessile, disposed in a terminal and
large panicle. The branches are woody, greyish and erect [39]. In South Africa,
Galenia africana has a wide distribution on dry flats and lower slopes from the
Northern Cape and Namaqualand to Uniondale, the Karoo and Eastern Cape

13
Province; often on disturbed ground and road verges. In Lowland namaqualand, it is
found in fields and among shrubs in the Cape flats, Hottentottsholland, Breede-
rivierspoort in Wupperthal [39].
Figure 7: Illustration of the aerial parts of Galenia Africana [40]
Vries and Green (2001) extracted dried samples of Galenia africana using various
solvents. The ethanol extracts showed antifungal activity with agar diffusion method.
Ethanol extracts were then purified and four of the extracts showed anti fungal
activity showed by clear zone inhibition. One of the fractions inhibited growth of
Alterna sp., Fusarium equiseti, Fusarium graminearum, Fusarium verticilliodes and
Phaeomomella chlamydospoia as the most sensitive. Spectroscopic analysis of
bioactive component of Galenia africana resulted in identification of flavanoid
structures as major components of full fraction [41].

14
2.1.2. Elytropapus rhinocerotis
Elytropapus rhinocerotis belongs to the family Asteraceae. Elytropapus rhinocerotis
is a single-stemmed, usually smallish shrub up to about 2 m high. The very old
branches are gnarled and the bark is smooth and grayish. Older branches are bare of
leaves but bear many thin, whip-like twigs which are held erect and covered with tiny,
triangular leaves pressed tightly to the stem [42]. Elytropapus rhinocerotis is very
branched grey to grey-green aromatic shrub 0,6 - 2,5m in height with young stems
densely woolly; leaves minute, numerous, pressed onto the stem, usually woolly on
both surfaces; it blooms between March and September with a inconspicuous, yellow,
tubular, capitula of mostly 3 florets, pappus well developed; fruit an achene with
prominent longitudinal ribs [43]. Each capitulum contains several tiny purple flowers
called florets. Seeds are tiny and are wind-dispersed by means of a feathery pappus.
The natural range of Elytropapus rhinocerotis is widespread in the Cape Floristic
Region and occurs throughout the Namaqualand and as far north as the Richtersveld.
It is also found as far east as the great escarpment around Molteno in the Eastern
Cape, and in the southern part of the Eastern Cape to East London [42].

15
Figure 8: Illustrations of Elytropapus rhinocerotis [44].
2.2.Chalcones and dihydrochalcones
The phenyl group plays an important role in the antioxidant activity of certain
flavonoids. A flavonoid chalcone (chalconaringenin) and a flavanone (naringenin)
with no phenyl groups act as pro-oxidants, i.e. they promote rather than limit the
oxidation of LDL by copper. However, adding a phenyl group to these flavonoid
molecules counteracted their pro-oxidant activities [45]. Butein and other 3,4-
dihydroxychalcones are more active than analogous flavones because of their ability
to achieve greater electron delocalization [46].
2.2.1. Natural abundance and structural variation
Most chalcones are mono-phenylated compounds with simple dimethylallyl,
dimethylchromeno, and furano or geranyl substitutions. Others consist of di- and/or
tri-phenyl derivatives. Both the dimethylchromeno and furano derivatives represent
50% of the chalcone derivatives, which are substituted at almost all positions of ring
A, whereas the frequency of other phenylations involves positions 3’, 5’, 5, 3, 2.

16
About one-third of the iso-phenylated chalcones are mono-methylated at positions 2’,
4’, 6’, 4 with few di-methyl derivatives. By contrast with the chalcones, the iso-
phenylated dihydro chalcones are much less abundant, although they share most of
the characteristics of phenylated chalcones. Both groups of compounds occur mostly
in the Leguminosae but are also represented in the Moraceae, Asteraceae, Lauraceae
and Platanaceae [47].
2.2.2. Applications of chalcones
Chalcones are important intermediates in the metabolic pathway of converting
tyrosine to flavonoids. Chalcones have the general structure consisting of two phenyl
groups both with hydroxyl group(s), connected by a C – 3 bridge [- C=C – (CO)-].
Chalcones are polyphenols so are expected to act as antioxidants. Compounds with a
chalcone based structure have shown anti-protozoal, antifungal, antibacterial, anti-
inflammatory, xanthine oxidase and tyrosinase inhibitory, phytoestrogenic,
antipyretic, analgesic, cyto-protective, antioxidant and anti cancer pharmacological
properties [48-55].
Chalcones are expected to have both antioxidant and photo-oxidant activity due to the
presence of both p-coumaric acid and 2-hydroxybenzoyl moieties. The 2-hydroxyl
group does not act as an antioxidant but rather as a photo-antioxidant. The 4-hydroxyl
group at the para position to the carbonyl group, does not show any peroxy radical
trapping activity because it is generally accepted in antioxidant chemistry, of the
decrease in electron density on the hydroxyl group as a result of the electron
withdrawing carbonyl group at the para position. Results showed that a chalcone with
hydroxyl group(s) on the A ring cannot act as a radical trapping compound but as a

17
UV absorber but a chalcone with hydroxyl group(s) on the B ring especially on
positions 2 and 4 had an increased anti-oxidant activity [56]. Zampini and colleagues
determined the genotoxicity and anti-genotoxicity of Zuccagnia punctata extracts and
2,4-dihydroxychalcone and they determined that the chalcones has a higher
genotoxicity activity than the Zuccagnia punctata extracts [57]. 2,4-dihydroxy
dihydrochalcone (1), 2,4-dihydroxy chalcone (5) and 7-hydroxyl flavanones (7) have
been analyzed in extract of Ixeridium gracile by Micellar Electrokinetic
Chromatography (MEKC) which shows that it is a suitable and powerful technique to
study flavonoid components in extracts of medicinal plants [58-59].
2.3.Flavonoids
2.3.1. Natural abundance and structural variation
Flavanones represent the most abundant class of iso-phenylated flavonoids with a rich
variety of structures, almost half of which occur in the (2S) configuration. Although a
number of phenyl flavanones have been reported as natural products; it was only
recently that complete proof of their identification has been provided. For example,
dehydroisoderricin, which was first characterized in 1980 [60], has been fully
identified, including its stereochemistry at C-2, four years later [61] . As with
chalcones, iso-phenylated flavanones occur mostly in the Leguminosae, Moraceae,
and Asteraceae and to a lesser extent in the Rutaceae, Euphorbiaceae and
Scrophulariaceae. Flavones are of common occurrence in the Moraceae and
Leguminosae, but are also represented in the Berberidaceae, Cannabinaceae and
Rutaceae to a much lower extent [47].

18
2.3.2. Chemistry of flavonoids
The existence of a great variety of structurally related flavonoids suggests that their
reduction and oxidation potentials would differ. Since a large number of flavanoids
and flavonoids co-exist in plant cells, in the transport system of the plant sap, and in
plant products, a spectrum of electron transfer catalysts would be expected, which
would accelerate physiological oxidation systems. This might reflect on an important
physiological function that flavonoids might exhibit and would thus confirm their
claimed importance of the well documented proven beneficial influence on our health
[62].
Flavonoids are divided into various sub-groups which include flavanones, flavones;
flavans, flavanols, flavonols and their iso-flavonoid counter parts including other
closely related compounds which include anthocyanidines, coumarins and chalcones.
The heterocyclic moiety attached to the benzene ring on the left hand side occurs
either as the unsaturated pyrone or its dihydro analogue and is described as having a
C6-C3-C6 skeleton. The position of attachment of the second phenyl rings separates
the flavonoid class into the flavonoids (2-phenyl) and the iso-flavonoid (3-phenyl).
Flavonols on the other hand differ from flavones by a hydroxyl group which is almost
always in the 3-position and having the C2-C3 double bond. Chalcones are closely
related to flavonoids and differ in that the pyran ring exists in the open chain form.
However the biological properties are more often than not very similar and are in
some cases even much better. Flavonoids are often hydroxylated in positions 3, 5, 7,
3’, 4’ and 5’ and either mono, di, tri and tetrahydroxylated [63].

19
HO OH
OH O
O
O
HO
OH
C h alch on es
F lavon e, 5 ,7 -d ih y d roxy -2 -p h en y l-2 ,3 -d ih y d ro-4H -ch rom en -4 -on e
OHO
OH O
Iso -flavon e,5 ,7 -d ih y d roxy -3 -p h en y l-2 ,3 -d ih y do-4H -ch rom en -4 -on e
OHO
OH O
F lavon o l,3 ,5 ,7 -tr ih y d roxy -2 -p h en y l-4H -1 -b en zop y ran -4 -on e
OHO
OH
OH
Iso -flavon o l,2 ,5 ,7 -tr ih y d roxy -3 -p h en y l-4H -1en z op y ran -4 -on e
OH
HO
OH
O
O
1
3
45
6
7
8
B en z op y ran
2
1 '
2 '
3 '
4 '
5 '
6 '
Figure 9: Main classes of flavonoids and related compounds.

20
OHO
OH O
Flavanone 5,7-dihydro-2,3-dihydroxy-2-phenyl -4H -1-Benzopyran-4-one
HO
OH
O
O
Isoflavanone5,7-d ihydro-2,3-dihydroxy-3-phenyl-4H-1-Benzopyran-4-one
O
O
Coum arin2H -chrom en-2-one
HO
OH O
OH
Anthocyanin
O
Figure 10: Continuation of main classes of flavonoids and related compounds
2.3.3. Flavonoids and plants
2.3.3.1.Flavonoids as colorant
The blue flower colour is due to the presence of anthocyanins in delphinidin but since
most delphinidin glycosides are mauve in colour the shift to the blue colour is most
likely due to the flavone co-pigments. This blue colour has been demonstrated to be
the preferred attractant of bee pollinators [19]. Many more primitive families have
floral anthocyanins in the red to magenta range. Commelinin, a blue pigment from the
blue flowers of Commelina communis , it was shown to be a complex composed of a
reddish purple anthocyanin, a pale yellow flavone and magnesium [64-65]. The X-ray

21
crystal structure of natural commelinin demonstrate that commelinin is a tetra nuclear
(4 X Mg2+) metal complex, in which two magnesium ions chelate to six anthocyanin
molecules, while the other two magnesium ions bind to six flavone molecules,
stabilizing the commelinin complex, a new type of supramolecular complex [65-66].
Figure 11: Flavonoids co-pigments that influence the colour of flower species

22
Table 1: Flavonoid complexes found in different plant species that influence colour
[67] [68]
Plant species Pigment, co-pigment
1. Compositae
a. Centaurea
cyanus
Succinylcyanin, apigenin 7-glucutonide-4’-malonyl glucoside
2. Ranunculaceae
a. Aconitum
chinense
Delphinidin, 3-rutinoside-7-(di-p-coumaryl diglucoside)
b. Delphinium
hybridum
Delphinidin, 3-rutinoside-7-(tetra-p-hydrobenzoyl
pentaglucoside)
3.Ponetederiaceae
a.Eichhomia
crassipes
Delphinidin, 3-gentiobroside, apienin-7-malonylglucoside
4. Leguminosae
a. Lupinus cv. Delphinidin, 3-malonylglucoside, apigenin-7-malonylglucoside
2.3.3.2.Flavonoids and UV protection in plants
Ultraviolet light (UV) is electromagnetic radiation with a wavelength shorter than that
of visible light but than that of X-rays in the range 10nm to 400nm UV light consists
of electromagnetic waves with frequencies higher than those humans can identify as
colour. UV spectrum has many effect many beneficial and others damaging [69]. The
sun emits radiation in the UV-A, UV-B and UV-C range. Each UV band has different
energy and ecological significance. The three bands are UV-C at 100nm to 280 nm,

23
UV-B at 280nm to 315 and UV-A at 315nm to 400nm [70]. UV-C rays have the
highest energy, and hence the most dangerous type of UV light. Little attention has
been given to UV-C rays because they are filtered out by the atmosphere. UV-A rays
were considered less harmful but today they are known to contribute to skin cancer by
indirect DNA damage through free radicals and reactive oxygen species. UV-B rays
can penetrate the ozone layer and cause damage to plants. Most plants have a built-in
UV-B resistance due in large part to the presence of flavonoid pigments which act as
UV absorption filters. Flavonoids which are present in green leaves have been shown
to absorb in the 280 – 315 nm region of the UV spectrum and consequently act as
powerful UV filters, therefore preventing photosynthetic tissue damage [71-75].
Table 2: Plant species in which UV protective flavonoids have been identified [71-
75]
Plant species
Flavonoid
location Protective flavonoid
1. Arabidopsis thaliana Epidermal cells
Kaempferol, 3-gentiobioside-7-
rhamnoside
Epidermal cells 3,7-dirhamnoside
2.Zea mays (Corn) Epidermal cells Anthocyanin
3.Sinapis alba (Mustard) Epidermal cells anthocyanin, quercetin glycoside
4.Gnaphaliumvira-vira Leaf wax 7-O-methylaraneol
5. Brassica oleracea
(cabbage) Epidermal cells Cyanin glycosides, sinapyl ester
24
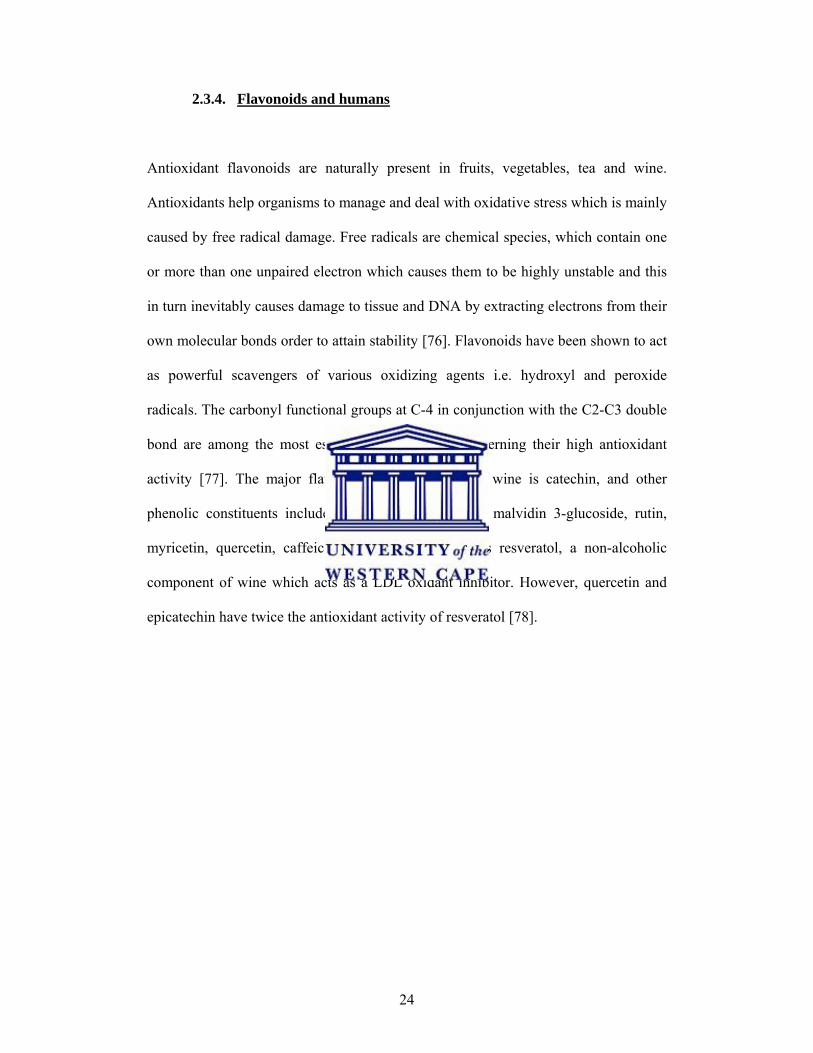
2.3.4. Flavonoids and humans
Antioxidant flavonoids are naturally present in fruits, vegetables, tea and wine.
Antioxidants help organisms to manage and deal with oxidative stress which is mainly
caused by free radical damage. Free radicals are chemical species, which contain one
or more than one unpaired electron which causes them to be highly unstable and this
in turn inevitably causes damage to tissue and DNA by extracting electrons from their
own molecular bonds order to attain stability [76]. Flavonoids have been shown to act
as powerful scavengers of various oxidizing agents i.e. hydroxyl and peroxide
radicals. The carbonyl functional groups at C-4 in conjunction with the C2-C3 double
bond are among the most essential functionalities governing their high antioxidant
activity [77]. The major flavonoid component in red wine is catechin, and other
phenolic constituents include gallic acid, epicatechin, malvidin 3-glucoside, rutin,
myricetin, quercetin, caffeic acid and resveratol. It is resveratol, a non-alcoholic
component of wine which acts as a LDL oxidant inhibitor. However, quercetin and
epicatechin have twice the antioxidant activity of resveratol [78].

25
Table 3: Applications of flavonoids in human systems [24].
Disease Target Flavonoids Results proven
Inflammation eicosanoid
synthesis Quercetin
Local pain
relieved,
Body temperature
normalized
Diabetes mellitus Aldose reductase Quercetin
Pressure in eye
reduced
Rutin, Citrin Bleeding ceased
Allergy H-ATPase of mast
cells
Disodium
chromoglycate
Secretion of
histamine
prevented
Quercetin
Symptoms
disappeared
Headache
eicosanoids
synthesis Quercetin Pain relief
Virus infection
H-ATPase of
lysosome Quercetin
Coat removal
prevented
Bee sting
eicosanoid
synthesis Quercetin Local pain relieved
Oral surgery
eicosanoid
synthesis Quercetin Local pain relieved
Stomach/ duodenal
ulcer
eicosanoid
synthesis Quercetin
Bleeding ceased,
Pain relieved
Cancer (Na-K) ATPase Quercetin
Cells normalized
(tissue culture
tested)

26
2.3.4.1.Inflammation
The treatment of sore throats and fevers by an ethanol extract of propolis plant family
is an example of a quick treatment by flavonoids. This is an example is the therapeutic
application of flavonoids as an anti-inflammatory agent [29-30]. Essentially
inflammation is the integrated response of many defence systems of the body to the
invasion of a foreign body of any kind such as bacteria, viruses and even wooden
splinters. The release and oxygenation of arachidonic acid is a critical event in
regulating key processes in host defence and inflammation [79-80].Oxygenation of
arachidonic acid catalyzed by either cyclo-oxygenase (COX) or lipoxygenase (LO)
initiates the biosynthesis of potent bioactive mediators: i.e., prostaglandins,
thromboxanes, prostacyclins, mono and dihydroxy acids, leukotrienes and lipoxins,
collectively known eicosanoids [81]. Eicosanoids are able to be synthesized by all
cells forming part of the immune system, and especially by monocytes and
macrophages which are the first line of defence against infection. Macrophages
contain both COX and LO activities and are capable of generating large amounts of
prostanoids, leukotrienes and different hydroxyl fatty acids [82]. The generation of
eicosanoids by macrophages is relevant to their activity in, and regulation of, the
immune and inflammatory responses. The eicosanoids are important intercellular
signalling agents which affect cell behaviour and cell-to-cell interactions and they are
said to be the key mediators of inflammation [80, 83]. Since eicosanoids possess
important biological activities, the control or inhibition of their biosynthesis has been
an area of intense investigation and could open new approaches to the treatment of a
variety of human diseases [84-85].

27
Figure 12: Illustration of synthesis of prostaglandins [86]
The eicosanoids’ activity is able to be inhibited by flavonoids. The PG’s are
transported in the blood to the brain where neurons that have receptors in the mid-
brain allow interneuron communication to occur. A granular containing pain
substance together with bradykinin are released which then diffuse to the neurons
which are responsible for pain. The subsequent swelling of tissue is due to the process
of osmosis. In normal circumstances plasma membranes are water resistant but when
there is tissue damage, water retention occurs. All these processes that lead up to pain
and inflammation can easily be stopped by inhibition of the key enzyme by flavonoids
[79].

28
2.3.4.2.Anti-bacterial, anti-fungal and antimicrobial activity
Flavonoids are also efficiently used to address bacterial, protozoan and fungal
infections, by killing the bacterial and fungal cells and also counteracting the effects
of bacterial toxins. Apart from the active role that flavonoids play in the eradication of
infectants, they additionally strengthen loose connective tissue by inhibiting some of
the enzymes that are able to hydrolyze their proteoglycan and protein meshwork
whose primary task is to sterically hinder the diffusion of infectants through the
tissue. One such an example is the inhibition of hyaluronidase by flavonoids and in
this way contributes to the immobilization and encapsulation of the infectants which
are then gradually decomposed by the scavenging and repair processes [87].
Alcarad et al (2000) proved that flavonoids showing the highest anti-Methicillin-
resistance to Staphylococcus aureus activity belong to the structural pattern of
chalcones. Chalcones are open-chain flavonoids whose basic structure includes two
aromatic rings bound by a α, β -unsaturated carbonyl group. In chalcones, the
unsaturated carbonyl group linking aromatic rings A and B favours the delocalization
of π electrons. For this reason, the carbonyl group looses part of its individual
character and partially integrates into the adjacent olefinic group. This phenomenon
originates transference of electronic deficiency from the carbonyl carbon atom to the
C-β, which is increased in 2’ (OH)-chalcones. These structural characteristics are
similar to those exhibited by other antioxidant flavonoids [88-89].
Reverse transcriptase is a polymerase that forms a DNA complementary to RNA.
When this polymerase is inhibited, replication is inhibited and thus the virus cannot

29
multiply. Flavonoids are also believed to have anti-viral properties e.g. Quercetin has
been shown to be an inhibitor of the reverse transcriptase of RNA viruses [90].
Another process that occurs once the virus particle penetrates the plasma membrane is
that it becomes fused with the lysosome to allow the proteases in the lysosome to
hydrolyze the protein capsid around the viral genome because the viral genome
encapsulated in the protein capsid is inactive. Flavonoids and related polymers can
have different types of interaction with membranes. The more hydrophobic flavonoids
can partition the hydrophobic core of membranes while the hydrophilic flavonoids
can interact by hydrogen bonding with the polar head groups of the lipid-water
interface of membranes. It is this ability of flavonoids to bind with membrane that
prevents the fusion between the lysosome and virus particle hence preventing the
protein capsid from being removed and rendering the virus particle inactive [91-92].
The antifungal and antimicrobial effect of flavonoids is mainly attributed to the
presence of phenolic hydroxyl groups which have high affinity for proteins and,
therefore, act as inhibitors of microbial enzymes [93]. It is generally agreed that at
least one phenolic hydroxyl group and a certain degree of lipophilicity are required
for the biocidal activity of flavonoid compounds [94].
2.3.4.3.Gastro protection
Ares and Outt (1996) raised the question as to whether other types of flavonoids
might possess gastro-protective properties and what types of structural changes can be
tolerated on the core flavone structure without loss of the gastro-protective activity.
They found that in the rat ethanol-induced gastric damage model, flavone gastro-

30
protection requires a C2 – C3 double bond and an intact C ring. The phenyl ring at the
2 – position cannot be moved to the 3 – position but can be replaced by a variety of
smaller and larger substituents [95].
2.3.4.4.Anti-Cancer activity
Consumption of a diet rich in soy containing foods is known to be rich in phyto-
oestrogen such as iso-flavones has been proposed as a chemo preventive factor
against breast cancer in asian populations [62]. Loa, Chow and Zhang (2009)
analyzed the structure–activity relationships of flavonoids and chalcones and the
following were found to be required for their inhibitory potencies:
i. Of the six sub-classes of the polyphenols tested, the unique backbone structure
of chalcones with a open C-ring,
ii. Within the chalcone group, hydroxyl substitution at 2-carbon of B-ring,
iii. Hydroxyl substitution at 3-carbon in B-ring of Xavones.
This data is valuable for development of plant polyphenols as possible anti-
proliferation agents of cancer cells and for design and modification for new anticancer
agents as well. In other studies, the most potent chalcone, 2,2-dihydroxychalcone was
found to induce apoptosis of the cancer cells. These processes may be involved in
their inhibitory effects on the cancer cells [96].

31
2.3.4.5.Flavonoid inhibition of enzymes
In a number of structure-activity studies, flavonoids have been tested for their ability
to inhibit key enzymes in mitochondrial respiration. It was found that a C2,3- double
bond, a C4-keto group and a 3’, 4’, 5’-trihydroxy B-ring are significant features of
those flavonoids which show strong inhibition of NADH-oxidase. The order of
potency for inhibition of NADH-oxidase activity was robinetin, rhamnetin, eupatorin,
baicalein, 7,8-dihydroxyflavone and norwogonin with IC50 values of 19,42, 43, 77,
277 and 340 nmol/mg protein, respectively [97].
2.3.5. Electrochemistry of flavonoids
Electrochemical detection is an attractive alternative method for electrochemically
active species detection, because of its inherent advantages of simplicity, ease of
miniaturization, high sensitivity and relatively low cost. Electrochemical methods
such as differential pulse, cyclic and square wave voltammetry have been intensively
utilizing for analysis of certain flavonoids [17, 98-101]. Cyclic voltammetry at an
inert glassy carbon electrode has been successfully applied to analyze antioxidants in
wine [102-105]. Several papers, where the authors utilized glassy carbon electrode for
determination of phenolic compounds, were published [20, 106-115]. Zou, Kilmartin,
Inglis and Frost (2002) employed cyclic voltammetry as a qualitative tool to measure
the level of galloyl and catechol groups present in wine, which correlated with other
total phenol measures. The appearance of individual phenolics at electrode potentials
expected for each one of them, was matched with peaks in cyclic voltammograms of
wine samples [116].

32
Volikakis and Efstathiou (2005) published a novel approach for a fast screening of
total flavonoids (quercetin, kaemferol, myricetin) in wines, tea – infusions and tomato
juice using adsorptive stripping voltammetry in a flow injection system. The proposed
method was based on the property of flavonols to be pre – concentrated on carbon
paste electrode where diphenylether was used as pasting liquid [116]. Hodek and
Hanustiak (2006) studied the toxicological effect of flavonoids during interaction with
nucleic acids using carbon paste electrode (CPE). The use of carbon paste electrode
compared to other analytical techniques gives great simplification of the analysis.
This method can be used for designing a simple DNA sensor. The in vitro study of
DNA and flavonoid compound (rutin, quercetin) interaction by using square wave
voltammetry revealed that ingestion of flavonoids should be taken with caution since
they can interact with DNA [117]. Korbut et al (2001) carried out voltammetric
investigation of selected flavonoids (quercetin, rutin, epigallocatechingallate and
catechin) and their antioxidative properties using an electrically heated carbon paste
electrode with the surface confined DNA. The system of a copper(II) complex with
1,10-phenanthroline, [Cu(phen)2]2+, in the presence of hydrogen peroxide and
ascorbic acid was used as the cleavage mixture producing reactive oxygen species
(ROS). A portion of original double stranded DNA on the sensor surface was
quantified using the [Co(phen)3]3+ complex as DNA redox indicator. The evaluation
of temperature effect on the flavonoid anodic signal and DNA degradation and
protection by flavonoids was the aim of the study. Flavonoids under study were found
to associate with double stranded DNA confined to the CPE surface. A concentration
dependent antioxidative effect of flavonoids in the DNA cleavage mixture was
detected using the DNA/CPE sensor [118].

33
Maoela et al (2009) identified catechin in C. mellei and C. Quadrifidus. They also
determined mechanism of reaction of catechin using square wave and cyclic
voltammetry. Other extracts that were isolated from C. mellei and C. Quadrifidus
were also studied in a similar manner as for catechin. Cyclic voltammetric results of
catechin showed two oxidation peaks, occurring at the potentials of +197.0 mV and
+612.7 mV. These oxidation peaks are associated with oxidation of the hydroxyl
groups. A reduction peak at +70.7 mV corresponds to the reduction of oxidation
products formed in the first peak [119].
Vaya et al (2003) selected flavonoid compounds of five different subclasses and the
relationship of their structure to the inhibition of LDL oxidation in vitro was
investigated. The most effective inhibitors, by either copper ion or 2,20-azobis(2-
amidino-propane) dihydrochloride (AAPH) induction, were flavonols and/or
flavonoids with two adjacent hydroxyl groups at ring B. In the presence of the later
catechol group, the contribution of the double bond and the carbonyl group at ring C
was negligible. Iso-flavonoids were more effective inhibitors than other flavonoid
subclasses with similar structure. Substituting ring B with hydroxyl group(s) at 2’
position resulted in a significantly higher inhibitory effect than by substituting ring A
or ring B at other positions. Position 3 was favoured only in the presence of
conjugated double bond between rings A and B. This study makes it possible to
assign the contribution of different functional groups among the flavonoid subclasses
to in vitro inhibition of LDL oxidation [120].
Cyclic voltammetry has been used for the evaluation of antioxidant capacity for
several polyphenols and their mixtures [20, 121-122]. The redox properties of

34
polyphenols have been used as a measure of antioxidant properties of wines on the
basis of measurement of oxidation current at constant potential by HPLC with
electrochemical detection [20].
2.4.Review of natural and synthesized flavonoids and chalcones
2.4.1. 1-(2’,4’-dihydroxyphenyl)-3-phenyl propan-1-one (1)
The above mentioned chalcones is found in the leaves of Ceratiola ericoides and in
black crowberry scientifically known as Empetrum rigrum L, Empetraceae which is
widely distributed in the northern hemisphere and in the Russian federation [123]. It
was synthesized as an intermediate in a reaction to form tetrahydroflemichapparin-A
using Adam’s catalyst and ethanol with a boiling point of approximately 91 ºC [124].
2.4.2. 2,3-dihydro-5,7-dihydroxy-2-phenyl-4H-1-benzopyran-4-one (2)
The above mentioned compound is known as pinocembrin. The UV – Vis spectra of
this flavonoid as studied by Gregon and Stevanato (2010) showed an absorption peak
at 275 < λ < 300 nm [125]. Pinocembrin has been fractionated from Portuguese
propolis high performance liquid chromatography and identification was done using
electrospray mass spectrometry in negative mode and it was found to have a retention
time of 40.8 min with fragmentation pattern with peaks at 213, 211, 151 [67, 126].

35
2.4.3. 2,3-dihydro-5,7-dihydroxy-2-(2’-methoxyphenyl)-4H-1-benzopyran-4-
one (3)
Only three references were found which were inaccessible. This compound has not
been extensively studied.
2.4.4. 1-(2’,4’-diacetoxyphenyl)-3-phenyl-2-propen-1-one (4)
The only accessible information in literature mentions this compound as an
intermediate in the reaction to form phenylated flavanones using BF3-OEt to
regioselectively de protect the acetyl group on C – 2 of the A ring [127].
2.4.5. 1-(2’,4’-dihydroxyphenyl)-3-phenyl-2-propen-1-one (5)
The above mentioned compound is also known as isoliquiritigenin. The 2,4-dihydroxy
chalcone was reported as one of the major constituents isolated from the leaf resin of
Zuccagnia punctata and Flemingia chappar [124]. It showed protective effects on the
ethanol induced gastro-duodenal tract injury in rats [128], antimicrobial activity
against multi – resistant gram-negative bacteria [54]. It was isolated as one of the
extracts of Ononis natrix sub species ramosissima [129]. The above 2,4-
dihydroxychalcone was previously isolated from the leaves of M. calabura collected
in Thailand and was found to be cytotoxic against a small panel of human tumour cell
lines [130].

36
2.4.6. 5-acetoxy-2,3-dihydro-7-hydroxy-2-(2’-methoxyphenyl)-4H-1-
Benzopyran-4-one (6)
There is no information in literature on this compound.
2.4.7. 2,3-dihydro-7-hydroxy-2-phenyl-4H-1-Benzopyran-4-one (7)
This compound has been isolated from Clerodendron phlomidis [131], the roots of
Virolasurinamensis and was found to have antifungal activity [132]. It was also
isolated from the aerial parts of Ceratiola ericoides [123], the wood of
Platymiscium praecox Mart [133]. Yang et al (2008) found that 7-
hydroxyflavanone, 5,6,7-trihydroxyflavanone, and 4’,5,7-trihydroxyflavanone
could be applicable to be a potential anti-metastatic agent of SCC-4 cancer cells
[134].
2.4.8. 5,7-(diacetoxy)-2,3-dihydro-2-phenyl-4H-1-benzopyran-4-one (8)
This compound is also known as acetylpinocembrin. It was studied as one of the thirty
five plant-derived secondary metabolites against one sensitive and three multidrug-
resistant clinical isolates of Mycobacterium tuberculosis are reported [135].
2.4.9. 5,7-(diacetoxy)-2,3-dihydro-2-(2’-methoxyphenyl)-4H-1-benzopyran-
4-one (9)
No information was available for this compound.

37
2.4.10. 2,3-dihydro-5-hydroxy-2-(4’-hydroxy-3’-methoxyphenyl)-7-methoxy-
4H-1-benzopyran-4-one (10)
This compound is also known as 5,4’-dihydroxy-7,3’-dimethoxyflavanone (DDF), it
was detected with three other flavonoids in extracts of the flowers of Paulownia
tomentosa using high performance liquid chromatographic (HPLC) technique
coupled with photodiode array (PDA) detection was developed for the simultaneous
determination of the four flavonoids [136]. DDF was also isolated in Mariscus
psilostachys together with five flavans and two flavanones. Antimicrobial activity
against Candida albicans and Cladosporium cucumerinum were determined for all
compounds. DDF was found to inhibit the growth of and Cladosporium cucumerinum
only at concentration higher than 5μg but was found to be inactive on the growth of
Candida albicans [137]. The above compound was isolated as one of the six
flavanones in chaparral sub shrub, Mimulus aurantiacus [138]. It was also isolated in
the crude methanolic extract of the aerial parts of Tillandsia streptocarpa was
investigated for their acute toxicity and anti-oedematogenic, antioxidant and
antimicrobial activities [139].
2.4.11. 2,3-dihydro-5-hydroxy-2-(4’-hydroxyphenyl)-7-methoxy-4H-1-
benzopyran-4-one (11)
This compound was prepared as one of the O-methyl analogues of naringenin using
narinenin as a starting material [140]. It was present as an intermediate in the
synthesis of flavocommelin, a component of the blue supramolecular pigment,
commelinin, from Commelina communis [141].

38
2.5. Characterization techniques
2.5.1. Electrochemical characterization
2.5.1.1. Voltammetric techniques
The more attractive features of voltammetric methods are high sensitivity, low
cost, simplicity and relatively short measurement time [116, 142] [143].
Limitations include that the sample must be dissolved, it provides little
information on species identification, detection limits vary from parts per
thousand to parts per trillion. Advantages include the uses of wide range of
solvents and electrolytes, temperatures, has rapid analysis time, allows
simultaneous determination of various analytes, has ability to determine kinetic
and mechanical parameters, allows adsorption processes on surfaces and transport,
speciation and thermodynamic properties of solvated species.
2.5.1.1.1. Instrumentation
Basic components in electrochemical system are a potentiostat, computer and
an electrochemical cell.

39
Figure 13: Illustration of Bas Epsilon electrochemical analyzer
Potentiostat
The potentiostat functions by maintaining the potential of the working electrode at a
constant level with respect to the reference electrode by adjusting the current at an
counter/auxiliary electrode [144].
Electrode and cell
The normal material for cell construction is Pyrex glass for reasons both of visibility
and general chemical inertness. The photograph below (Figure 14) shows a
conventional three electrode cell showing the working electrode (left, glassy carbon),
reference electrode (middle, Ag/AgCl) and auxiliary electrode (right, Pt-disk
electrode). A gas line for purging the solution with nitrogen is also evident [145].

40
Figure 14: Illustration of setup of a three electrode system
Working electrode
The working electrode has various geometries and materials ranging from mercury
drops to platinum disks. Others include gold, platinum and glassy carbon electrodes.
Glassy carbon electrode
Glassy carbon, as shown below (Figure 15) also called vitreous carbon, can be
fabricated as different shapes, sizes and sections. It is a non-graphitizing carbon which
combines glassy and ceramic properties with those of graphite. The most important
properties are high temperature resistance, hardness (7 Mohs), low density, low
electrical resistance, low friction, low thermal resistance and impermeable to gases
and liquids [146-147].

41
Figure 15: Illustration of the different types and sizes of glassy carbon
electrodes (GCE) [146]
Reference electrode
This is an electrode which has a stable and well-known electrode potential. The high
stability of the electrode potential is usually reached by employing a redox system
with constant (buffered or saturated) concentrations of each participants of the redox
reaction. The major requirements of a reference electrode are that it be easy to
assemble and maintain, provide a reversible half reaction with Nernstian behaviour
and that its potential be stable [148].

42
Silver-silver chloride electrode
Figure 16 : Schematic representation of the silver-silver chloride electrode [149]
The overall reaction can be written:
Ag0(s) + Cl− ↔ AgCl(s) + e-
This electrode usually takes the form of a piece of silver wire coated with silver
chloride. The coating is done by making the silver the anode in an electrolytic cell
containing hydrochloric acid ; the silver ions combine with chloride ions as fast as
they are formed at the silver surface. This reaction is characterized by fast electrode
kinetics, meaning that a sufficiently high current can be passed through the electrode
with the 100% efficiency of the redox reaction (dissolution of the metal or cathodic
deposition of the silver-ions). The reaction has been proved to obey these equations in
solutions with pH’s of between 0 and 13.5 [150].

43
Auxiliary/counter electrode
The only condition of a counter electrode is, that is must not dissolve in the
electrolyte. Only noble metals and carbon fulfil this condition perfectly. The above
mentioned electrode consists of a thin platinum, gold wire or graphite [31].
2.5.1.1.2. Cyclic voltammetry
Cyclic voltammetry is used for study of redox processes rather than quantification, to
understand reaction intermediates and obtaining stability of reaction products. The
current at the working electrode is plotted versus the voltage. During the experiment
the working potential is ramped linearly versus time, when the cyclic voltammogram
reaches a set potential, the working electrode ramp is inverted. This technique is
based on varying potential at the working electrode in both the forward and reversible
directions at some scan rate while monitoring current. The important parameters are
the peak potentials (Epa, Epc) and peak currents (Ipa,Ipc) of the anodic and cathodic
peaks [148].

44
Figure 17: Typical cyclic voltammogram where ipc and ipa show the peak cathodic
and anodic current respectively for a reversible reaction [151]
Ep = Epa – Epc = 2.303 RT/nF
For a reversible reaction at 25º C with n electrons ΔEp should be 0.0592/nV or 60 mV
for one electron. Irreversibility due to slow electron transfer rate ΔEp > 0.0592/nV or
greater than 70 mV for one electron.
The formal potential for reversible couple is Ef = (Epc + Epa)/2. And for an
irreversible reaction, the peak current is:
Ip = 2.686 * 105 n3/2 A. C0.D1/2.υ1/2
Where, Ip – peak current (Amps), A – area of electrode (cm2), D – diffusion
coefficient (cm2s-1), C0 – concentration (mol.cm-3), υ- scan rate (V.s-1).

45
Experimental method
As the electrode potential ramps linearly versus time, this known as the scan rate
(V.s-1). The potential is measured between the reference and working electrodes and
the current is measured between the working and reference electrodes and data is
plotted as current (Ip) versus potential (V). The current will increase as the potential
reaches the reduction or oxidation potential of the analyte and start falling as the
concentration of the analyte is depleted close to the electrode surface. If redox couple
is reversible, when applied potential is reversed it will reach a potential that will re
oxidize the product formed in reduction reaction. Current peak will be proportional to
the square root of the scan rate, if electronic transfer is fast and current is limited by
diffusion of species on the electrode surface [151].
Experimental setup
A reference electrode, working electrode and counter electrode are used in what is
known as a three electrode setup. Electrolyte is added to test solution to ensure
conductivity. Working electrode material and solvent determines range of potential.
Electrodes sit in unstirred solution during measurement. Still solution allows for
diffusion controlled peaks. Stirring solution between measurements supplies the
electrode with fresh analyte for each new experiment. Sometimes analyte precipitates
on the electrode surface because the cyclic voltammetry alters the charge of the
analyte. The working electrode is enclosed in a rod of inert insulator with disk
exposed at one end. The counter electrode is any material which conducts readily and
does not react with solution [151].

46
2.5.1.1.3. Square wave voltammetry
The excitation signal in square wave voltammetry consists of symmetrical square
wave of amplitude (Esw). The net current, Inet is obtained by taking the difference
between the forward and reverse currents and is centred on the redox potential. The
peak height is directly proportional to the concentration of the electro active species
and the detection limits are as low as 10-8 M. Advantages of square wave voltammetry
include speed, excellent sensitivity, reflection of background currents and allows
repetitive scanning and increased signal to noise ratio [152-154]. SWV has shorter
analysis time, decrease in potential associated with fouling of the electrode surface
and increased sensitivity when compared to CV [106].
2.5.2. Nuclear magnetic resonance
2.5.2.1. Fundamental concepts of NMR spectroscopy
2.5.2.1.1. Spin of the nucleus
The atomic nucleus can be viewed as a positively charged sphere that is
spinning on its axis. The spin is an inherent property of the nucleus and
because charge is being moved it creates a small magnetic field aligned
with the axis of spinning. The resonance frequency (γ) is proportional to
the magnetic field strength (B0). This relationship is the basis of nearly
every phenomena in NMR [155].
ω0 = 2π υ0 = γ B0
47
2.5.2.1.2. Chemical shift
At any given field strength each nucleus has a characteristic resonant
frequency do we can choose the nucleus we are interested in observing.
The nucleus is located at the centre of a cloud of electrons, and we know
that the electrons are easily pulled or pushed away toward an atom
changing the electron density around that nucleus. The nucleus can
perceive a slight difference in field depending on its position within a
molecule [155]. The shielding constant reflects the extent to which
electrons cloud around the nucleus and shield it from the external magnetic
field. These differences are what we call chemical shifts.
Beff = B0 (1 – σ)
V0 = γ Beff = γ B0 (1 – σ) where, σ is the shielding constant in parts per
million (ppm),
2.5.2.1.3. Continuous wave spectrometer
The technique where radio frequency is applied continuously as
frequency is gradually changed is known as continuous wave
spectrometry. The continuous wave spectrometer consists of a
transmitter with weak radio frequency (RF) energy; the frequency is
gradually decreased with constant magnetic field (B0). A detector then
monitors the amount of RF energy absorbed and this signal is recorded.

48
The result is an NMR spectrum which is a graph of RF energy versus
frequency, where the position of the absorption peak on the spectrum
tells us about the chemical environment of the spin within the molecule
[155].
Figure 18: Illustration of a general NMR spectrometer [156]
2.5.2.1.4. Pulsed fourier transform
A very brief pulse of high-power RF energy is used to excite all the nuclei
in the sample. Immediately after the pulse is over, the nuclei are organized
in such a way that their preceding magnets sum together to form a net
magnetization of the sample, which rotates at Larmor frequency. The coil
49
used to transmit RF is now used as a receiver, and the frequency is
observed at the precise Larmor frequency, υ0. This signal which oscillates
in time at Larmor frequency is recorded by the computer and a
mathematical calculation called Fourier transform measures the frequency
of oscillation of the signal [155].
2.5.2.2. Proton nuclear magnetic resonance (NMR)
Each resonance in the 1H spectrum is paired with a hydrogen or group of
equivalent hydrogens. A resonance is a single chemical shift position in
the spectrum and maybe be a single peak or maybe split into a complex
pattern of peaks. To uniquely assign peaks we need to correlate protons to
other protons using their coupling constants (J) by through-bond
relationship. The magnitude of the coupling constants tells us about the
geometrical relationship of the bonds connecting the atoms. Three bond
(vicinal) relationships are the most useful because the coupling constant is
related to the dihedral angle between the bonds attached to the protons. J
coupling is transmitted through bonds and more specifically through
electron in bonding orbitals. The magnitude of the coupling constant
depends on orbital overlap. Minimum J values are observed for dihedral
angles near 90º. Two or more protons may have the same chemical
equivalence but may not have the same coupling constant. The relationship
between the dihedral angle and coupling constant is represented by a
mathematical equation:
J = 7 – cos φ + 5 cos (2φ) where φ is the dihedral angle [155]

50
Chapter 3
Experimental
3.1. Apparatus and reagents
Galenia africana and Elytropapus rhinocerotis extracts were sourced from Prof
Green’s laboratory as 20% solutions of the total masticated plant in ethanol. The
standards benzene, anisole, resorcinol, phenol, 2-butanone, 4H-pyran-4-one, 1,3-
methoxyphenol, 1,2-methoxyphenol and 2-penten-2-one were purchased from Sigma
Aldrich (Cape Town, South Africa). All reagents are of analytical grade. All aqueous
solutions were made up with ultra pure water from a Millipore Milli-Q system (South
Africa). The pH of the phosphate buffer was measured using a pH meter (Hanna
instrument, HI 221 Calibration Check Microprocessor pH meter with accuracy of ±
0.05). Thin layer chromatography (TLC) was performed on smaller plates cut from
20x20cm aluminium plates coated with Merck Silica gel 60 F254 with a thickness of
0.1 mm. Preparative layer chromatography (PLC) was performed on 20x20cm glass
plates coated with Merck silica gel 60 F254 with thickness of 1 mm. The silica gel
used to pre absorb the sample was silica gel 60 (35 – 70 mesh) with a particles size of
0.2 – 0.5 mm purchased from Kimix (Cape town, South Africa) while the silica gel
used to pack the column was silica gel 60 (70 – 230 mesh) with a particle size of
0.063 – 0.200 mm) purchased from Merck (Cape town, South Africa). Aluminium
oxide Fluka type 504C was also used as stationary phase (Merck). All materials were
weighed using Mettler Toledo AB104 analytical scale. The NMR spectra were
recorded on a GEMINI 200MHz NMR spectrometer. The spectra were recorded using
5 mm tubes using CHCl3 as internal standard and deutereochloroform as solvent

51
unless otherwise stated. The chemical shifts were recorded in parts per million (ppm)
downfield from TMS. An Epsilon electrochemical analyzer (Bioanalytical Systems,
West Lafayette, Indiana) was used for cyclic and square wave voltammetry
measurements.
3.2. Organic experimental
3.2.1. Isolation
The 20% ethanol extracts of Galenia africana and Elytropapus rhinocerotis which
were known to exhibit a very high degree of biological activity (private
communication from Prof Green) were the primary focus of this project. The ethanol
extracts were obtained as pre-columned olive-yellow solids. The following discussion
applies to the G. Africana solid material. The crude material (400 mg) was dissolved
in acetone and spotted for thin layer chromatography (TLC) analysis in an eluent of
ethyl acetate: hexane (1:4). This indicated approximately six different components
were present which could be clearly seen either according to differences in colour or
retardation factor (Rf ) after being sprayed with a 1% solution of vanillin in sulphuric
acid according to standard procedures of heating the plate afterwards. The crude solid
material ~ 1g was then pre-absorbed on silica gel (particle size 0.2 – 0.5 mm) using a
small amount of acetone to dissolve the sample. The column (1m x 20 mm) was then
packed with silica gel (particle size 0.063 – 0.200 mm) with the sample plug on top
and eluted with EtOAc: hexane (1:4). Various fractions were collected in tubes using
a fraction collector. Fractions were analyzed by TLC and were grouped together into
sub fractions according to behavioural similarities on TLC plates as visualized under
UV light and vanillin spray giving a yellow to red spot for the flavanoids.

52
O
HO
OH
OHO
OH O
O
HO
OH
OHO
OH O
OCH3
2
5 3
1
Figure 19: Flavanoids isolated from Galenia Africana.
Table 4: The six major fractions isolated from first separation.
Fraction Compounds
1 2 5 3
1 + - - -
2 + + - -
3 + + - -
4 - + + +
5 - - + +
6 - - + +
7 - - + +
+ shows presence of flavanoids in fraction; - shows absence of flavanoids in fraction

53
The first fraction contained compound 1 and some impurities as shown by the 1H
NMR data. This fraction showed a single spot with a retardation factor of 0.56 and
when sprayed with vanillin spray a red spot was observed. The first fraction was then
separated on a preparative plate using EtOAc: hexane (1:4) as solvent. Three sub-
fractions were obtained the first containing oil and solvent, the second containing the
pure compound 1 and the third containing impure compound 1. The third sub fraction
was re-plated in the same solvent system and further pure compound 1 was obtained
(20 mg). Fractions 2 and 3 contained similar compounds. However in the second
fraction compound 1 made up 60% of the mixture while compound 5 made up 40% of
the mixture and in the third fraction compound 1 made up 33% of the mixture while
compound 2 made 66% of the mixture as shown and calculated using 1H NMR
spectroscopy. The two fractions showed two red spots when sprayed with vanillin
with retardation factors of approximately 0.55 and 0.47. Fractions 2 and 3 were
separately re-chromatographed on a column using EtOAc: hexane (1:4) as a solvent.
For each of the fractions 2 and 3 sub-fractions were obtained and using PLC were
purified to obtain pure compounds 1 (12 mg) and 2 (22 mg). Fraction 4 which
contained compounds 2, 3 and 5 was re-chromatographed on a column and eluted
with EtOAc: hexane (3:7). Fractions collected were submitted to TLC and the first to
elute when sprayed with vanillin indicated two spots, the one spot was red in colour
with a retardation factor of 0.58 and the other yellow in colour with a retardation
factor of 0.52. Compound 2 was separated successfully in later fractions (13 mg)
while compound 3 and 5 were obtained as a mixture. The remaining fractions 5, 6 and
7 all consisted of the same mixture of compound 3 and 5 which was very difficult to
separate using the same solvent system as above even when using PLC. Separation
was thus attempted using acidic aluminium oxide as a stationary phase, and as a

54
mobile phase the following combinations were used EtOAc: hexane (1:4), EtOAc:
hexane (3:7), MeOH: CH2Cl2 (9:1) and 100% MeOH but the crude sample to be
separated remained adsorbed on the aluminium oxide regardless of solvent used. The
separation was then attempted using basic aluminium oxide as a stationary phase and
MeOH: CH2Cl2 (9:1) and 100% ethyl acetate and still no movements were observed.
A mixture of EtOAc: hexane: CH2Cl2 was then tried with the following ratios 70:30:5,
70:30:10, 70:30:20, 70:30:30, and finally 70:30:45 which managed to separate
compound 5 (21 mg) and 3 (12 mg) after multiple re-runs on preparative layer plate
on silica gel backed plates.
3.2.2. Synthesis
O
HO
OHO
AcO
OAc
N
Ac2O,
16 hrs, rt
5 4
Scheme 2: Acylation of 1-(2’, 4’-dihydroxyphenyl)-3-phenyl-2-propen-1-one (5)

55
O
HO
OHO
AcO
OAc
N
Ac2O,
16 hrs, rt
OO
2 8
Scheme 3: Acylation of 2,3-dihydro-5,7-dihydroxy-2-phenyl-4H-1-benzopyran-4-
one (2)
O
HO
OH
O
AcO
OAc
N
Ac2O,
16 hrs, rt
O
O
O
AcO
OH
O
OCH3
OCH3
OCH3
3
9
6
Scheme 4: Acylation of 2,3-dihydro-5,7-dihydroxy-2-(2’-methoxyphenyl)-4H-1-
benzopyran-4-one (3)
Fraction 4 (0.2765g) containing compounds 2,3 and 5 was added to a solution of 10
ml glacial acetic anhydride and 3 ml pyridine and the resultant solution was stirred at
room temperature for 16 hours. The basic pyridine removes the hydrogen atom from

56
the hydroxyl group and allows the electrophylic O-acylation with acetic anhydride to
occur. After stirring, the solution was treated with ice water and stirred for an hour. A
sticky slurry formed at the bottom of the beaker and the aqueous solution was then
extracted with dichloromethane and rinsed with 5% NaHCO3 to remove any
remaining acetic acid. The dried extract (anhydrous magnesium sulphate) was filtered
and evaporated to leave a residue. After spotting trials on TLC plates the spots were
eventually resolved when eluted with the solvent system EtOAc: hexane (3:7). The
residue was then separated by PLC using the same solvent system and pure acylated
products were obtained after a few repeated elutions to afford the acetates 8, 9 and 6
(40 mg, 45 mg and 35 mg respectively).
O
HO
OHO
HO
KOH, MeOH,
48 hrs, rt
5
O
7
Scheme 5: Cyclization 1-(2’, 4’-dihydroxyphenyl)-3-phenyl-2-propen-1-one (5).
Compound 5 (50 mg) was then cyclised, using a concentrated solution of 50%
potassium hydroxide in methanol with stirring at room temperature for 48 hours.
After stirring, mixture was poured into water and then acidified with 10%
hydrochloric acid. The aqueous mixture was then extracted with EtOAc and dried
with magnesium sulphate. Chromatographic purification using EtOAc: hexane (1:4)
as eluent afforded the flavanoid (30 mg; 60%).

57
3.3. Electrochemistry
3.3.1. Preparation of solutions
Phosphate buffer solution was prepared by mixing appropriate volumes of 0.1M
sodium dihydrogen phosphate (NaH2PO4) and 0.1M sodium hydrogen phosphate
(Na2HPO4) with ultra pure water with a conductivity of 5.5 X 10⁻⁶ S.m-1 to produce
the desired pH. Ethanol was selected as the most suitable solvent, all flavonoids and
their acetate derivatives were dissolved in absolute ethanol to produce various
concentration ranges between 0.029 and 0.142 M.
3.3.2. Voltammetric measurements
For electrochemical measurements, a three electrode cell consisting of a 3 mm
diameter glassy carbon working electrode, a platinum wire auxiliary electrode, and an
Ag/AgCl (3 M NaCl) reference electrode were used. The surface of the glassy carbon
electrode was freshly polished with 1.0 um, 0.05 μm and 0.3 μm alumina powder on a
micro cloth pad, rinsed with distilled water and degreased with ethanol in an
ultrasonic bath because of possible film formation and memory effects [5, 157]. The
GCE was also electrochemically cleaned with 1M H2SO4 and rinsed with distilled
water. After electrochemical cleaning of the GCE, the required volume of sample was
added by micropipette into supporting electrolyte. The potentials were recorded
against the silver-silver chloride electrode as a reference electrode used in conjunction
with the platinum electrode placed in a 50 ml volume glass cell together with the
glassy carbon electrode. Phosphate buffer (5ml) of pH ~ 7 was used as the supporting

58
electrolyte. The scan was taken in a potential range of – 1500 mV and + 1500 mV
with the following scan rates 20, 50 and 100 mV/s for cyclic voltammetric
measurement and the scan was taken in the same potential window with a frequency
of 15 hertz for square wave measurements. Prior to each measurement, the
background currents were measured in phosphate buffer alone and subtracted from
the currents measured with compound added in phosphate buffer. In order to
minimize adsorption onto the electrode surface, measurements were performed
immediately after the addition of the compound. The sample in the electrochemical
cell was de-aerated by purging with high purity argon during electrochemical
measurements. All experiments were carried out at room temperature. For square
wave measurements, determination of the flavonoids was carried out at a frequency of
15 Hz, step potential 20 mV/s with phosphate buffer of pH 7 as supporting electrolyte.
For smoothing and baseline correction the software Origin 7.0 and Sigma plot were
employed.

59
Chapter 4
Organic results and discussion
Fractionation of the ethanol-soluble extract of Galenia africana on a silica gel packed
column followed by PLC led to the purification of two known flavanoids, two known
chalocones. From the isolated compounds two new compounds were synthesized and
the other three were known compounds. From the ethanol-soluble extract of
Elytropapus rhinocerotis two known compounds were isolated. The structures of
these flavanoids were determined by physical spectroscopic data measurements which
included 1H and 13C NMR spectroscopy.
4.1. Flavanoids from Galenia africana
4.1.1 Compound 1: 1-(2’,4’-dihydroxyphenyl)-3-phenyl propan-1-one (1)
Formula: C15H14O3
Molecular mass: 242 g/mol
O
12
36'
5'HO
OH
4'
3'2'
1'
Figure 20: Chemical structure of 1-(2’,4’-dihydroxyphenyl)-3-phenyl propan-1-one
(1)

60
NMR: δH = 3.03 (t, 2H, J = 7.0 Hz, H - 3); 3.21 (t, 2H, J = 7.0 Hz, H - 2); 6.33 (m,
2H, H – 3’ and H – 5’), 7.24 (m, 5H, 3 – Ar) and 7.60 (d, 1H, J = 9.6 Hz, H – 6’).
Calculated spectrum:
HO
OH O
6.28
7.55
6.375.0
5.0
2.88
2.74
7.12
7.21
7.08
7.21
7.12
01234567PPM
Figure 21: 1H NMR spectrum of 1-(2’,4’-dihydroxyphenyl)-3-phenyl propan-1-one
(1)
The 1H NMR spectra of compound 1 shows two triplets at δ of 3.03 and 3.21
belonging to protons 2 and 3 which corresponds to the values in literature of 3.02 and
3.22. A multiplet was observed for the 5 aromatic protons of ring B at 7.21 – 7.32

61
ppm as well as doublet at 7.60 for H – 6’ which is coupled to H – 5’ with a coupling
constant of 9.6 Hertz which characteristic of ortho aromatic protons [130, 158].
4.1.2 Compound 2: 2,3-dihydro-5,7-dihydroxy-2-phenyl-4H-1-benzopyran-4-one
(2)
Formula: C15H12O4
Molecular mass: 256 g/mol
O
HO
OH
O1
2
3
44a
56
78
8a1'
2'
3'
4'
5'
6'
Figure 22: Chemical structure of 2,3-dihydro-5,7-dihydroxy-2-phenyl-4H-1-
benzopyran-4-one(2)
NMR: δH = 2.82 (dd, 1H, J = 17.3, 3.1 Hz, H – 3e), 3.09 (dd, 1H, J = 17.3, 13.0 Hz,
H – 3a), 5.42 (dd, 1H, J = 13.0, 3.1 Hz, H – 2a), 6.00 (s, 2H, H – 6 and H – 8), 7.42
(m, 5H, Ar), 12.04 (s, 1H, 5-OH).

62
Calculated spectrum:
OHO
OH O
5.84
5.88
3.38;3.13
5.51
5.0
5.0
7.19
7.19
7.19
7.19
7.19
01234567PPM
Figure 23: 1H NMR spectrum of 2,3-dihydro-5,7-dihydroxy-2-phenyl-4H-1-
benzopyran-4-one(2)
The spectrum of compound 2 displayed signals of the three oxygenated methine and
methylene doublet-doublets at δ of 5.42 (dd, 1H, 13.0 and 3.1 Hz, H – 2a), 2.82 (dd,
1H, J = 17.3, 3.1 Hz, H – 3e), 3.09 (dd, 1H, J = 17.3, 13.0 Hz, H – 3a), which
demonstrate geminal and vicinal coupling. The geminal coupling between proton H –
3a and H – 3e is 17.3 Hz while the axial – axial vicinal coupling between H - 3a and
H – 2 is 13.0 Hz. Axial – equatorial coupling constant between H – 3e and H – 2a is
3.1 Hz due to the dihedral angle of almost 90o. A surprising finding was that H – 6

63
and H – 8), appeared as a singlet at δ 6.00. A 5-proton multiplet for the unsubstituted
ring B appeared at 7.42. [158-160]. Also observed was a downfield exchangeable
singlet at 12.04 (s, 1H, OH – 5) which is characteristic of the chelated OH – 5 of
flavones and flavanones. According to the above spectrum compound 2 is a flavanoid
with an unsubstituted B ring [159, 161].
4.1.3 Compound 3: 2,3-dihydro-5,7-dihydroxy-2-(2’-methoxyphenyl)-4H-1-
benzopyran-4-one (3)
Formula: C16H14O5
Molecular mass: 286 g/mol
O
HO
OH
O1
2
3
44a
56
78
8a1'
3'
4'
5'
6'
OCH3
2'
Figure 24: Chemical structure of 2,3-dihydro-5,7-dihydroxy-2-(2’-methoxyphenyl)-
4H-1-benzopyran-4-one (3)
NMR: δH = 2.92 (dd, 1H, J = 17.4 ,3.6 Hz, H – 3e), 3.15 (dd, 1H, J = 17.4 , 12.5,Hz,
H – 3a), 3.82 (s, 3H, - OCH3), 5.71 (dd, 1H, J = 12.5 , 3.6 Hz, H – 2a ), 5.96 ( broad s,
1H, 7 – OH), 6.09 (d, 1H, J = 2.2 Hz, H – 6 ), 6.11 (d, 1H, J = 2.2 Hz, H – 8), 6.89
(dd, 1H, J = 8.0, 2.0 Hz, H – 3’), 6.98 (dt, 1H, J = 8.0, 2.0 Hz, H – 5’), 7.27 (m, 1H, H
– 4’), 7.33 (dd, 1H, J = 7.6, 1.8 Hz, H – 6’), 12.05 (s, 1H, 5 – OH).

64
Calculated spectrum:
OHO
OH O
O
5.84
5.88
3.38;3.13
5.51
5.0
5.0
6.70
7.08
6.75
7.08
3.73
01234567PPM
Figure 25: 1H NMR spectrum of 2,3-dihydro-5,7-dihydroxy-2-(2’-methoxyphenyl)-
4H-1-benzopyran-4-one (3)
The 1H NMR spectrum of compound 3 is similar to that of compound 2 because they
share a similar structural backbone scaffold. There are thus similarities in values for
H-2 and H-3 viz., δH 5.71 (dd, 1H, J = 12.5, 3.6 Hz, H – 2a), 2.92 (dd, 1H, J = 17.4,
12.5 Hz, H – 3e) and 3.15 (dd, 1H, J = 17.4, 3.6 Hz, H – 3a). The spectrum indicated
the existence of two meta coupled protons at δH 6.09 (d, 1H, J = 2.2 Hz, H – 6), 6.11

65
(d, 1H, J = 2.2 Hz, H – 8), a methoxy group at 3.82 (s, 3H, - OCH3) and a hydroxyl
group at 12.05 (s, 1H, 5 – OH) [162].
NMR: δC = 43.0 (C – 3 ), 55.9 (- OCH3), 77.8 (C – 2 ), 94.6 (C – 8), 95.6 (C – 6),
103.3 (C – 4a), 116.8 (C – 3’), 121.8 (C – 5’), 124.3 (C – 1’), 127.07 (C – 6’), 130.1
(C – 4’), 153.6 (C – 2’), 165.5 (C – 5), 165.9, (C – 8a), 168.0 (C – 7), 196.1 (C – 4).
Calculated spectrum:
OHO
OH O
O164.9
95.1
162.7
102.9
159.794.6
196.9 43.4
69.1
127.0
156.8114.5
128.7
121.3
128.2
56.2
020406080100120140160180200PPM
Figure 26: 13C NMR spectrum of 2,3-dihydro-5,7-dihydroxy-2-(2’-methoxyphenyl)-
4H-1-benzopyran-4-one (3)

66
The 13C NMR spectra of compound 3 on average showed a pattern comprising a
minimum of 15 carbon signals for each of the compounds isolated strongly suggesting
a flavanoid nucleus. The spectra further all displayed an oxygenated methines at δC
77.8 (C – 2) and a methylene carbon having a carbonyl functionality attached viz.,
43.0 (C – 3). Signals for the mono-substituted aromatic ring for compound 3 are
assigned as follows: δC 116.8 (C – 3’), 121.8 (C – 5’), 124.3 (C – 1’), 127.07 (C – 6’),
130.1 (C – 4’), 153.6 (C – 2’) and an aryl- conjugated ketone at δC 196.1 (C – 4) [158-
159].
4.1.4 Compound 4: 1-(2’,4’-diacetoxyphenyl)-3-phenyl-2-propen-1-one (4)
Formula: C19H15O5
Molecular mass: 323 g/mol
O
AcO
OAc
1''3''
4''
5''
6''
2''
1
2
3
1'2'
3'
4'
5'
6'
Figure 27: Chemical structure of 1-(2’,4’-diacetoxyphenyl)-3-phenyl-2-propen-1-
one (4).
NMR: δH = 2.24 (s, 3H, CH3CO), 2.32 (s, 3H, CH3CO), 7.02 (d, 1H, J = 2.2 Hz, H –
3’), 7.13 (dd, 1H, J = 8.4, 2.2 Hz, H – 5’ ), 7.17 (d, 1H, J = 16.0 Hz, H – 2), 7.42 (m,
3H, H – 3’’, H – 4’’ and H – 5’’), 7.60 (m, 2H, H – 2’’ and H – 6’’), 7.63 (d, 1H, J =
16.0 Hz, H – 3), 7.75 (d, 1H, J = 8.4 Hz, H – 6’).

67
Calculated spectrum:
O
O O
O
O
H
H
7.07
7.75
7.07
7.30
7.21
7.14
7.21
7.30
2.08
2.087.56
7.90
012345678PPM
Figure 28: 1H NMR spectrum of 1-(2’,4’-diacetoxyphenyl)-3-phenyl-2-propen-1-
one (4)
The proton spectrum of this compound displayed similarities to that of compound 5
viz., with a pair of trans-coupled doublets at δH 7.17 (d, 1H, J = 16.0 Hz, H – 2) and
7.63 (d, 1H, J = 16.0 Hz, H – 3). Signals observed for the aromatic protons on ring A
are 7.02 (d, 1H, J = 2.2 Hz, H – 3’), 7.13 (dd, 1H, J = 8.4, 2.2 Hz, H – 5’) and 7.75
(d, 1H, J = 8.4 Hz, H – 6’). Two multiplets were observed at 7.60 and 7.42 for the
protons on the un-substituted phenyl ring B. Also observed in the spectrum are two

68
singlets at 2.24 (s, 3H, CH3CO) and 2.32 (s, 3H, CH3CO) belonging to the two acyl
groups on the A ring.
4.1.5 Compound 5: (1-(2’,4’-dihydroxyphenyl)-3-phenyl-2-propen-1-one (5)
Formula: C15H12O3
Molecular mass: 240 g/mol
OH
HO
O
1
2
3 1''2''
3''
4''
5''
6''
1'2'
3'
4'
5'
6'
Figure 29: Chemical structure of 1-(2’,4’dihydroxyphenyl)-3-phenyl-2-propen-1-
one (5)
NMR: δH = 6.45 (m, 2H, H – 3’ and H – 5’ ), 7.43 (m, 3H, H – 3’’, H – 4’’ and H –
5’’), 7.57 (d, 1H, J = 15.8, H – 2), 7.65 (m, 2H, H – 2’’ and H – 6’’ ), 7.84 (d, 1H, J =
9.2 Hz, H – 6’), 7.89 (d, 1H, J = 15.8 Hz, H – 3).

69
Calculated spectrum:
HO
OH O
H
H
6.39
7.47
6.485.0
5.0
7.30
7.21
7.14
7.21
7.30
7.56
7.90
012345678PPM
Figure 30: 1H NMR spectrum of 1-(2’,4’dihydroxyphenyl)-3-phenyl-2-propen-1-
one (5)
In the proton spectrum two trans-coupled doublets were observed at 7.57 and 7.89
ppm belonging to H – 2 and H – 3 respectively, which were coupled to each other
with a coupling constant of 15.8 Hz which is characteristic of trans-coupled alkenes.
A doublet and multiplet were observed at 6.45 and 7.84 respectively belonging to
the protons on the substituted phenyl ring A. Two multiplets were observed at 7.43
and 7.65 for the protons on the unsubstituted B phenyl ring. The values obtained

70
compared well with those given in literature [56, 123, 158]. The pattern of the peaks
also corresponds with those observed in the calculated spectra as shown above.
NMR: δC = 103.9 (C – 3’ ), 107.9 (C – 5’), 114.7 (C – 1’ ), 120.4 (C – 3), 128.7 (C –
3’’ and C – 5’’), 129.1 (C – 2’’ and C – 6’’) , 130.8 (C – 4’’), 132.1 (C – 6’), 134.9 (C
– 1’’), 144.7 (C – 2), 162.9 (C – 2’), 166.6 (C – 4’), 192.1 (C – 1).
Calculated spectrum:
HO
OH O
H
H
165.7
104.1
163.2 115.3
132.7
109.0
189.7
121.4
145.2
135.2
126.4
128.7
128.0
128.7
126.4
020406080100120140160180200PPM
Figure 31: 13C NMR spectrum of 1-(2’,4’-dihydroxyphenyl)-3-phenyl-2-propen-1-
one (5)
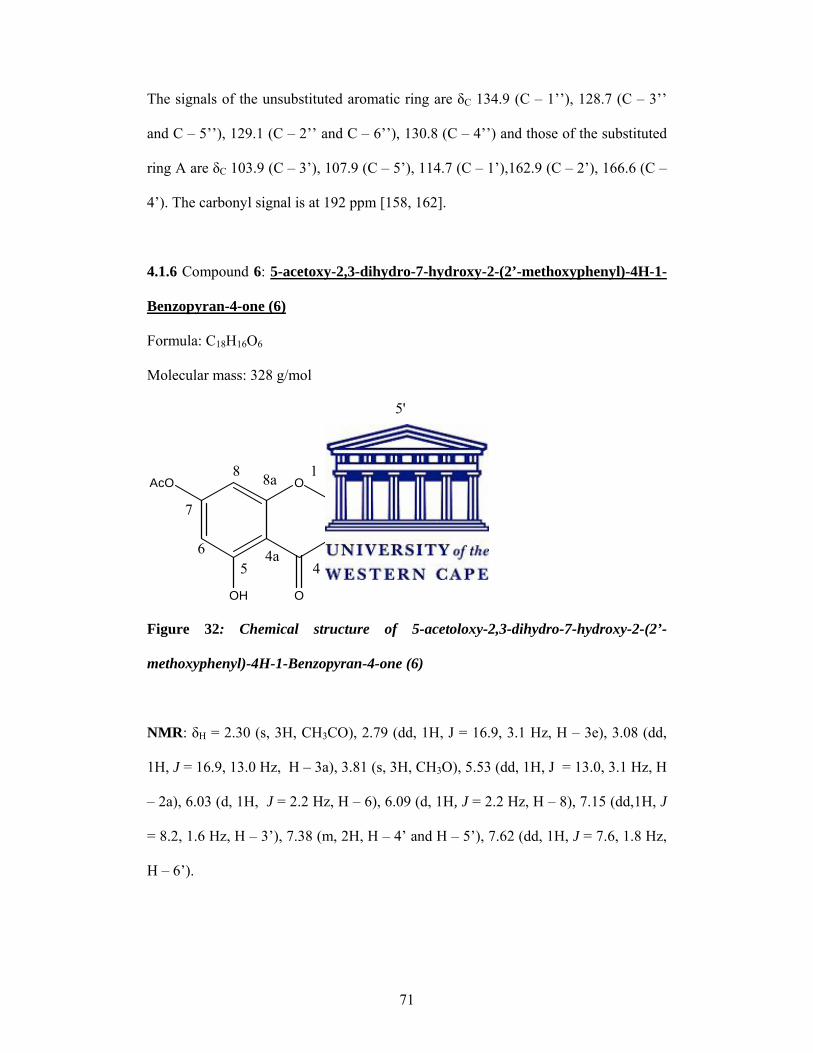
71
The signals of the unsubstituted aromatic ring are δC 134.9 (C – 1’’), 128.7 (C – 3’’
and C – 5’’), 129.1 (C – 2’’ and C – 6’’), 130.8 (C – 4’’) and those of the substituted
ring A are δC 103.9 (C – 3’), 107.9 (C – 5’), 114.7 (C – 1’),162.9 (C – 2’), 166.6 (C –
4’). The carbonyl signal is at 192 ppm [158, 162].
4.1.6 Compound 6: 5-acetoxy-2,3-dihydro-7-hydroxy-2-(2’-methoxyphenyl)-4H-1-
Benzopyran-4-one (6)
Formula: C18H16O6
Molecular mass: 328 g/mol
OAcO
OH O
OMe
1
2
3
44a
56
7
88a
1'2'
3'
4'
5'
6'
Figure 32: Chemical structure of 5-acetoloxy-2,3-dihydro-7-hydroxy-2-(2’-
methoxyphenyl)-4H-1-Benzopyran-4-one (6)
NMR: δH = 2.30 (s, 3H, CH3CO), 2.79 (dd, 1H, J = 16.9, 3.1 Hz, H – 3e), 3.08 (dd,
1H, J = 16.9, 13.0 Hz, H – 3a), 3.81 (s, 3H, CH3O), 5.53 (dd, 1H, J = 13.0, 3.1 Hz, H
– 2a), 6.03 (d, 1H, J = 2.2 Hz, H – 6), 6.09 (d, 1H, J = 2.2 Hz, H – 8), 7.15 (dd,1H, J
= 8.2, 1.6 Hz, H – 3’), 7.38 (m, 2H, H – 4’ and H – 5’), 7.62 (dd, 1H, J = 7.6, 1.8 Hz,
H – 6’).

72
Calculated spectrum:
OO
OH
O
O
O6.22
6.18 3.38;3.13
5.51
5.0
6.70
7.08
6.75
7.08
3.732.08
01234567PPM
Figure 33: 1H NMR spectrum of 5-acetoxy-2,3-dihydro-7-hydroxy-2-(2’-
methoxyphenyl)-4H-1-Benzopyran-4-one (6)
The proton spectrum displays a singlet at 2.30 (s, 3H, CH3CO) for the acetyl group.
A methoxy signal is observed at 3.81 (s, 3H, CH3O). The arrangement of the
remainder of the spectrum is similar to that of compound 3.
NMR: δC = 21.1 (CH3, CH3CO), 42.4 (C – 3), 55.8 (CH3O), 74.6 (C – 2), 94.4 (C –
8), 95.4 (C – 6) , 103.2 (C – 4a), 123.2 (C – 3’), 126.7 (C – 5’), 127.4(C – 6’), 129.9

73
(C – 4’), 130.5 (C – 1’), 147.9 (C – 2’), 164.3 ( C – 7 and C – 8a), 168.2 (C – 5),
169.2 (C=O, CH3CO), 195.7 (C – 4).
Calculated spectrum:
OO
OH
O
O
O
107.1
158.7
100.3
157.8
100.8161.7 196.9 43.4
69.1
127.0
156.8
114.5
128.7
121.3
128.2
169.0
56.220.3
020406080100120140160180200PPM
Figure 34: 13C NMR spectrum of 5-acetoloxy-2,3-dihydro-7-hydroxy-2-(2’-
methoxyphenyl)-4H-1-Benzopyran-4-one (6)
The 13C NMR spectrum of compound 6 displayed 17 signals suggesting a flavanoid
nucleus with two additional carbons. The typical methine signal at δC 74.6 (C – 2) and
42.4 (C – 3) supported the C-ring scaffold. Observed signals of the B ring are more or

74
less similar to those of compound 3 with a slight variations and a characteristic aryl-
conjugated ketone at δC 195.7 (C – 4) completes the assignment. [159]
4.1.7 Compound 7: 2,3-dihydro-7-hydroxy-2-phenyl-4H-1-Benzopyran-4-one (7)
Formula: C15H12O3
Molecular mass: 210 g/mol
OHO
O
1
2
3
44a6
7
88a
1'3'
4'
5'
6'
5
2'
Figure 35: Chemical structure of 2,3-dihydro-7-hydroxy-2-phenyl-4H-1-
Benzopyran-4-one (7)
NMR: δH = 2.84 (dd, 1H, J = 17.2, 3.4 Hz, H – 3e), 3.06 (dd, 1H, J = 17.2, 13.0 Hz,
H – 3a), 5.47 (dd, 1H, J = 13.0, 3.1 Hz, H – 2a), 6.48 (d, 1H, J = 2.2 Hz, H – 8), 6.56
(dd, 1H, J = 8.4, 2.2 Hz, H – 6), 7.44 (m, 5H, Ar), 7.62 (bs, 1H, 7 – OH), 7.85 (d, 1H,
J = 8.4 Hz, H – 5).

75
Calculated spectrum:
OHO
O
6.377.61
6.32
3.38;3.13
5.51
5.0
7.19
7.19
7.19
7.19
7.19
01234567PPM
Figure 36: 1H NMR spectrum of 2,3-dihydro-7-hydroxy-2-phenyl-4H-1-
Benzopyran-4-one (7)
The proton spectrum of this compound is also similar to that of compound 2 except
that in this spectra we observe a doublet at δH 7.85 (d, 1H, J = 8.4 Hz, H – 5) assigned
to the aromatic proton at C – 5 which was not observed in compound 2 due to the
presence of the hydroxyl group at position 5. In the above spectrum we managed to
observe a broad singlet at δH 7.62 (bs, 1H, 7 – OH) for the hydroxyl on ring A at
position 7 which also is supported on biosynthetic grounds [161].

76
NMR: δC = 44.4 (C – 3), 80.0 (C – 2), 103.57 (C – 8), 110.71 (C – 6) , 115.3 (C – 4a),
126.3 (C – 2’ and C – 6’), 128.9 (C – 3’ and C – 5’), 129.1 (C –1’), 129.5 (C – 5),
138.8 (C – 4’), 162.8 (C – 8a), 163.7( C – 7), 190.8 (C – 4 ) [159].
Calculated spectrum:
OHO
O
163.5
107.4
130.8113.0
158.3
102.0
196.9
42.8
79.0
140.7
127.2
129.0
127.7
129.0
127.2
020406080100120140160180200PPM
Figure 37: 13C NMR spectrum of of 2,3-dihydro-7-hydroxy-2-phenyl-4H-1-
Benzopyran-4-one (7)
In the carbon spectra we have the same number of signals as for compound 2 with a
slight shift in chemical shift values [159].

77
4.1.8. Compound 8: 5,7-(diacetoxy)-2,3-dihydro-2-phenyl-4H-1-
benzopyran-4-one (8)
Formula: C19H16O6
Molecular mass: 340 g/mol
OAcO
O
1
2
3
44a6
7
88a
1'3'
4'
5'
6'
2'
OAc
5
Figure 38: Chemical structure of 5,7(diacetoxy)-2,3-dihydro-2-phenyl-4H-1-
benzopyran-4-one (8)
NMR: δH = 2.30 (s, 3H, CH3CO), 2.39 (s, 3H, CH3CO), 2.78 (dd, 1H, J = 16.7, 2.8
Hz, H – 3e), 3.06 (dd, 1H, J = 16.7, 13.2 Hz, H – 3a), 5.49 (dd, 1H, J = 13.2, 2.8 Hz,
H – 2a), 6.54 (d, 1H, J = 2.2 Hz, H – 6), 6.54 (d, 1H, J = 2.2 Hz, H – 8), 7.43 (m, 5H,
Ar).
Calculated spectrum:
OO
OO
O
O
6.52
6.47
3.38;3.13
5.51 7.19
7.19
7.19
7.19
7.192.08
2.08

78
01234567PPM
Figure 39: 1H NMR spectrum of 5,7(diacetoxy)-2,3-dihydro-2-phenyl-4H-1-
benzopyran-4-one (8)
The spectrum of compound 8 displayed signals of the three oxygenated methine and
methylene doublet-doublets at δ of 5.49 (dd, 1H, J = 13.2, 2.8 Hz, H – 2a), 2.78 (dd,
1H, J = 16.7, 2.8 Hz, H – 3e), 3.06 (dd, 1H, J = 16.7, 13.2 Hz, H – 3a), which
demonstrate geminal and vicinal coupling. The geminal coupling between proton H –
3a and H – 3e is 16.7 Hz while the axial – axial vicinal coupling between H - 3a and
H – 2 is 13.2 Hz. Axial – equatorial coupling constant between H – 3e and H – 2a is
2.8 Hz due to the dihedral angle of approximately 90o The spectrum indicated the
existence of two meta coupled protons at δH 6.54 (d, 1H, J = 2.2 Hz, H – 6), 6.54 (d,
1H, J = 2.2 Hz, H – 8) and two singlets at δH 2.30 (s, 3H, CH3CO), 2.39 (s, 3H,
CH3CO) for the two acetyl groups on aromatic ring A.
NMR: δC = 21.1 (CH3, CH3CO), 21.2 (CH3, CH3CO), 45.3 (C – 3), 79.7 (C – 2),
109.2 (C – 8), 110.6 (C – 6) , 111.9 (C – 4a), 126.2 (C – 2’ and C – 6’), 129.0 (C – 3’

79
and C – 5’), 129.1 (C – 1’), 138.2 (C – 4’), 151.4 (C – 7),156.0 (C – 5), 163.4 (C –
8a), 168.1 (C=O, 7 – CH3CO), 169.4 (C=O, CH3CO), 189.3 (C – 4).
Calculated spectrum:
OO
OO
O
O
156.8
106.5153.6
112.8
157.7
104.5
196.9
42.8
79.0
140.7
127.2
129.0
127.7
129.0
127.2
169.0
169.0
20.3
20.3
020406080100120140160180200PPM
Figure 40: 13C NMR spectrum of 5,7(diacetoxy)-2,3-dihydro-2-phenyl-4H-1-
benzopyran-4-one (8)

80
The 13C NMR spectrum of compound 8 indicated two acetyl signals at δC 21.1 and
21.2 (CH3, CH3CO) in conjunction with the corresponding two carbonyl signals at δC
168.1 and ,169.4 (C=O, CH3CO).
4.1.9 Compound 9: 5,7-(diacetoxy)-2,3-dihydro-2-(2’-methoxyphenyl)-4H-
1-benzopyran-4-one (9)
Formula: C20H19O7
Molecular mass: 371 g/mol
OAcO
OOAc
OMe
Figure 41: Chemical structure of 5,7-(diacetoxy)-2,3-dihydro-2-(2’-
methoxyphenyl)-4H-1-benzopyran-4-one (9)
NMR: δH = 2.29 (s, 3H, CH3CO), 2.39 (s, 3H, CH3CO), 2.69 (dd, 1H, J = 16.9, 2.9
Hz, H – 3e), 3.61 (dd, 1H, J = 16.9, 13.3 Hz, H – 3a), 3.82 (s, 3H, CH3O), 5.59 (dd,
1H, J = 13.3, 2.9 Hz, H – 2a), 6.29 (d, 1H, J = 2.4 Hz, H – 6), 6.40 (d, 1H, J = 2.4 Hz,
H – 8), 7.13 (dd, 1H, J = 7.8, 1.6 Hz, H – 3 ’), 7.38 (m, 2H, H – 5’ and H – 4’), 7.62
(dd, 1H, J = 7.8, 1.6 Hz, H – 6’).

81
Calculated spectrum:
OO
OO
O
O
O6.52
6.47
3.38;3.13
5.51
6.70
7.08
6.75
7.082.08
2.08
3.73
01234567PPM
Figure 42: 1H NMR spectrum of 5,7(diacetoxy)-2,3-dihydro-2-(2’-methoxyphenyl)-
4H-1-benzopyran-4-one (9)
This compound has displayed the two singlets for the acetyl groups as seen in
compound 8 at δH 2.29 (s, 3H, CH3CO) and 2.39 (s, 3H, CH3CO) as well as the
methoxy signal at 3.82 (s, 3H, CH3O).

82
NMR: δC = 21.1 (CH3, CH3CO), 21.2 (CH3, CH3CO), 44.0 (C – 3), 55.9 (CH3O),
74.7(C – 2), 99.6 (C – 8), 105.1 (C – 6), 108.1 (C – 4a), 123.1 (C – 3’), 126.6 (C – 5’),
127.3 (C – 1’), 129.8 (C – 6’), 130.5 (C – 4’), 147.9 (C – 2’), 152.1 (C – 7), 164.2 (C
– 5), 165.6 (C – 8a), 169.2 (C=O, CH3CO),169.6 (C=O, CH3CO),188.6 (C – 4).
Calculated spectrum:
OO
OO
O
O
O
156.8
106.5153.6
112.8
157.7
104.5
196.9
43.1
69.1
127.0156.8 114.5
128.7
121.3
128.2
169.0
169.0
20.3
20.3
56.2
020406080100120140160180200PPM
Figure 43: 13C NMR spectrum of 5,7-(diacetoxy)-2,3-dihydro-2-(2’-
methoxyphenyl)-4H-1-benzopyran-4-one (9)

83
Similarly in this spectrum the two acyl methyl signals at δC 21.1 (CH3, CH3CO), 21.2
(CH3, CH3CO) and the two corresponding carbonyl signals at δC 169.2 and 169.6
confirm the presence of the two acetate groups in ring A.
4.2. Flavanoids of Elytropapus rhinocerotis
4.2.1. Compound 10: 2,3-dihydro-5-hydroxy-2-(4’-hydroxy-3’-
methoxyphenyl)-7-methoxy-4H-1-benzopyran-4-one (10)
Formula: C17H16O6
Molecular mass: 316 g/mol
OMeO
OH O
OH
OMe
Figure 44 : Chemical structure of 2,3-dihydro-5-hydroxy-2-(4’-hydroxy-3’-
methoxyphenyl)-7-methoxy-4H-1-benzopyran-4-one(10)
NMR: δH = 2.84 (dd, 1H, J = 16.8, 3.2 Hz, H – 3e), 3.08 (dd, 1H, J = 16.8, 12.8 Hz,
H – 3a), 3.52 (s, 3H, 7-OMe), 3.79 (s, 3H, 3’ – OMe), 5.48 (dd, 1H, J =12.8, 3.2 Hz,
H – 2a), 6.17 (d, 1H, J = 1.2 Hz, H – 8), 6.21 (d, 1H, J = 1.2 Hz, H – 6), 6.79 (d, 1H, J
= 8.8 Hz, H – 5’), 6.93 (dd, 1H, J = 8.8, 1.8 Hz, H – 6 ’), 7.11 (d, 1H, J = 1.8 Hz, H –
2’), 9.50 (s, 1H, 4’ - OH).

84
Calculated spectrum:
O
OH O
OH
OO
5.88
5.92
3.38;3.13
5.516.53
6.55
6.58
5.0
5.03.73
3.73
0123456PPM
Figure 45 : 1H NMR spectrum of 2,3-dihydro-5-hydroxy-2-(4’-hydroxy-3’-
methoxyphenyl)-7-methoxy-4H-1-benzopyran-4-one (10)
The spectrum of compound 10 displayed signals of the three oxygenated methine and
methylene doublet-doublets at δ of 5.48 (dd, 1H, J =12.8, 3.2 Hz, H – 2a), 2.84 (dd,
1H, J = 16.8, 3.2 Hz, H – 3e), 3.08 (dd, 1H, J = 16.8, 12.8 Hz, H – 3a), which
demonstrate geminal and vicinal coupling. The geminal coupling between proton H –
3a and H – 3e is 16.8 Hz while the axial – axial vicinal coupling between H - 3a and
H – 2 is 12.8 Hz. Axial – equatorial coupling constant between H – 3e and H – 2a is
3.2 Hz . Two singlets with chemical shift of 3.52 and 3.79 where observed for the

85
hydrogens on methoxy groups 7 and 3’ respectively. A single peak was observed for
the hydroxyl proton on carbon 4’ at a chemical shift of 9.50.
NMR: δC = 42.29 (C – 3), 55.7 (CH3O), 78.7(C – 2), 93.7 (C – 8), 94.6 (C – 6), 102.5
(C – 4a), 111.3 (C – 2’), 115.2 (C – 5’), 119.7 (C – 6’), 129.1 (C – 1’), 147.0 (C – 4’),
147.5 (C – 3’), 163.1 (C – 8a), 163.1 (C – 5), 167.4 (C – 7), 196.6 (C – 4).
Calculated spectrum:
O
OH O
OH
OO
167.1
93.5162.3
102.6
159.3
93.0
196.943.1
79.3
134.3
112.6
151.6
144.6
117.1
120.9
55.9
56.2
020406080100120140160180200PPM
Figure 46: 13C NMR spectrum 2,3-dihydro-5-hydroxy-2-(4’-hydroxy-3’-
methoxyphenyl)-7-methoxy-4H-1-benzopyran-4-one (10)

86
The 13C NMR spectra of compound 10 showed a pattern comprising a minimum of 15
carbon signals for each of the compounds isolated strongly suggesting a flavanoid
nucleus. The spectra further all displayed a peak at δC 55.7 (C – 2) for the methoxy
carbons on ring A and C.
4.2.2. Compound 11: 2,3-dihydro-5-hydroxy-2-(4’-hydroxyphenyl)-7-
methoxy-4H-1-benzopyran-4-one (11)
Formula: C16H14O5
Molecular mass: 286 g/mol
OMeO
OH O
OH
Figure 47: Chemical structure of 2,3-dihydro-5-hydroxy-2-(4’-hydroxyphenyl)-
7-methoxy-4H-1-benzopyran-4-one (11)
NMR: δH = 2.77 (dd, 1H, J = 16.7, 3.2 Hz, H – 3e), 3.19 (dd, 1H, J = 16.7, 12.7 Hz, H
– 3a), 5.50 (dd, 1H, J = 12.7, 3.2 Hz, H – 2a), 6.18 (d, 1H, J = 1.2 Hz, H – 8), 6.20 (d,
1H, J = 1.2 Hz, H – 6), 6.88 (d, 2H, J = 8.8 Hz, H – 3 ’ and H – 5’), 7.37 (d, 2H, J =
8.8 Hz, H – 2’ and H – 6’), 10.4 (s, 1H, 4’ – OH), 12.13 (s, 1H, 5 – OH).

87
Calculated spectrum:
O
OH O
OH
O
5.88
5.92
3.38;3.13
5.517.02
6.66
6.66
7.02
5.0
5.03.73
01234567PPM
Figure 48: 1H NMR spectrum of 2,3-dihydro-5-hydroxy-2-(4’-hydroxyphenyl)-
7-methoxy-4H-1-benzopyran-4-one (11)
The proton spectrum of this compound displayed similarities to that of compound 10
with displayed signals of the three oxygenated methine and methylene doublet-
doublets at δ of 2.77 (dd, 1H, J = 16.7, 3.2 Hz, H – 3e), 3.19 (dd, 1H, J = 16.7, 12.7
Hz, H – 3a), 5.50 (dd, 1H, J = 12.7, 3.2 Hz, H – 2a), which demonstrate geminal and
vicinal coupling. The geminal coupling between proton H – 3a and H – 3e is 16.7 Hz
while the axial – axial vicinal coupling between H - 3a and H – 2 is 12.7 Hz. Axial –
equatorial coupling constant between H – 3e and H – 2a is 3.2 Hz . Two singlet peaks

88
were observed at chemical shifts of 10.5 and 12.13 for the hydroxyl protons on
carbons 4’ and 5.
NMR: δC = 42.3 (C – 3), 55.4 (7 - CH3O), 78.8(C – 2), 94.3 (C – 8), 95.5 (C – 6),
103.2 (C – 4a), 115.5 (C – 3’ and C – 5’), 128.5 (C – 2’ and C – 6’), 129.0 (C – 1’),
157.5 (C – 4’), 163.1 (C – 8a), 164.1 (C – 5), 168.1 (C – 7), 196.3 (C – 4).
Calculated spectrum:
O
OH O
OH
O
167.1
93.5162.3
102.6
159.3
93.0
196.9 43.1
79.0
133.3
128.6
116.1
157.4
116.1
128.6
55.9
020406080100120140160180200PPM
Figure 49 : 13C NMR spectrum 2,3-dihydro-5-hydroxy-2-(4’-hydroxyphenyl)-7-
methoxy-4H-1-benzopyran-4-one (11)

89
The 13C NMR spectra of compound 11 showed a pattern comprising a minimum of 15
carbon signals for each of the compounds isolated strongly suggesting a flavanoid
nucleus. The 13C spectrum of compound 11 has similarities to the peaks for compound
10 with only a slight shift in the chemical shifts.

90
CHAPTER 5
Electrochemical results and discussion
Cyclic Voltammetry and square wave voltammetry were used to investigate flavanoid
characteristics by the peak potential, number and position of peaks at those potentials,
the current heights at each peak potential for all 11 flavanoids.
5.1. Flavanoids from Galenia Africana
5.1.1. Compound 1: 1-(2’,4’-dihydroxyphenyl)-3-phenyl propan-1-one (1)
-1000 -500 0 500 1000 1500
-20
-10
0
10
20
30
40
50
60
70
80
O
12
36'
5'HO
OH
4'
3'2'
1'
Pe
ak
curr
en
t (
Potential (mV)
0M 69 M M 207 M 276 M 346 M
1
2
Figure 50: Cyclic voltammogram of compound 1, scan rate 100 mV/s.
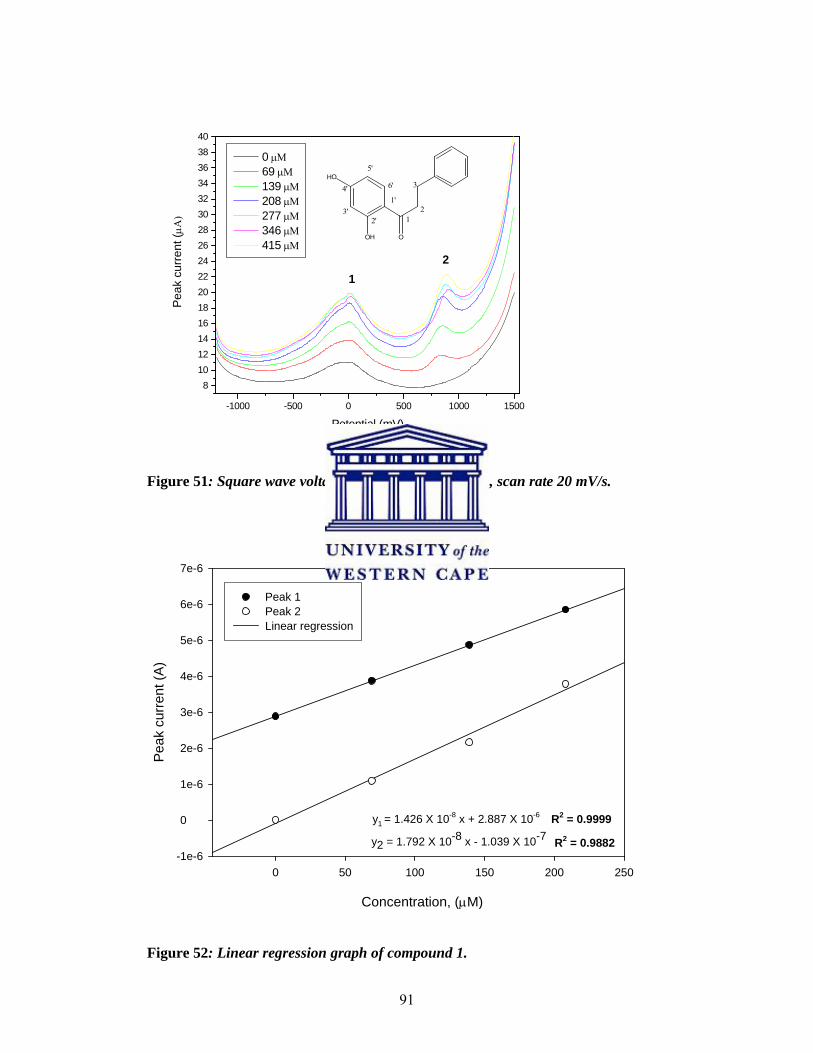
91
-1000 -500 0 500 1000 1500
8
10
12
14
16
18
20
22
24
26
28
30
32
34
36
38
40
O
12
36'
5'HO
OH
4'
3'2'
1'
Pe
ak
curr
en
t (
Potential (mV)
0 69 139 208 277 346 415
1
2
Figure 51: Square wave voltammogram of compound 1, scan rate 20 mV/s.
Concentration, (M)
0 50 100 150 200 250
Pe
ak
curr
en
t (A
)
-1e-6
0
1e-6
2e-6
3e-6
4e-6
5e-6
6e-6
7e-6
Peak 1Peak 2Linear regression
R2 = 0.9999
R2 = 0.9882
y1 = 1.426 X 10⁻⁸ x + 2.887 X 10⁻⁶
y2 = 1.792 X 10⁻⁸ x - 1.039 X 10⁻⁷
Figure 52: Linear regression graph of compound 1.

92
Figure 50 shows the cyclic voltammogram of compound 1, recorded when potential
sweep was began from -1500 mV to +1500 mV and reversed at a scan rate of 100
mV/s. The square wave voltammogram of compound 1 (Figure 51) shows two sets of
defined peaks one at 24.4 mV and the other at 843 mV. The linear regression graphs
for both of both peaks were constructed by a plot of oxidative peak current (Ip) versus
concentration (C0). This showed that the Ip1 and Ip2 of compound 1 increase with
increasing concentration and after Ip had achieved its maximum value it tends to
fluctuate with further addition of the compound. The first and second oxidation peaks
(Ip1, Ip2) were used as additional variables to analyze the effect of concentration by
extracting the linear region between 0 and 208 µM and a multiple regression analysis
was performed (Figure 52). The regression equation for peak 1 Ip1 = 1.426 X 10⁻⁸ C0
+ 2.887 X 10⁻⁶ with a correlation coefficient of 0.9999 and peak 2 has a regression
equation of Ip2 = 1.792 X 10⁻⁸ C0 + (-1.039) X 10-7 with a correlation coefficient of
0.9882.
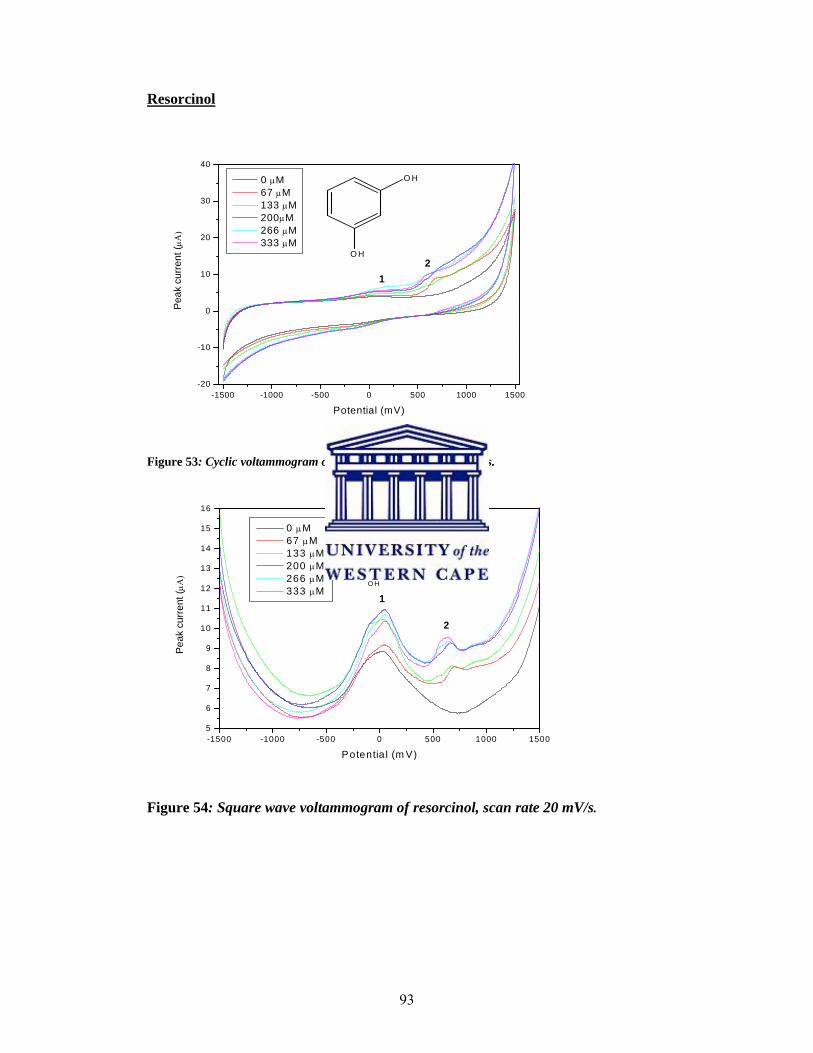
93
Resorcinol
-1500 -1000 -500 0 500 1000 1500-20
-10
0
10
20
30
40
O H
O H
Pe
ak
curr
en
t (
Potential (mV)
0 M 67 M 133 M 200M 266 M 333 M
1
2
Figure 53: Cyclic voltammogram of resorcinol, scan rate 100 mV/s.
-1500 -1000 -500 0 500 1000 15005
6
7
8
9
10
11
12
13
14
15
16
O H
O H
Pe
ak c
urr
ent
(
Potentia l (m V)
0 M 67 M 133 M 200 M 266 M 333 M
1
2
Figure 54: Square wave voltammogram of resorcinol, scan rate 20 mV/s.

94
2 - butanone
-1500 -1000 -500 0 500 1000 1500
0
50
100
H3C CH3
O
Pea
k cu
rre
nt (
Potential (mV)
0 M 28 M 84 M 168 M 307 M 500 M 693 M 912 M
1
Figure 55: Cyclic voltammogram of 2-butanone, scan rate 100 mV/s.
Benzene
-1500 -1000 -500 0 500 1000 1500-20
0
20
40
60
80
Pe
ak
curr
en
t (
Potential (mV)
0 43 129 222 283 383 762
1
Figure 56: Cyclic voltammogram of benzene, scan rate 100 mV/s.

95
0 600 1200
0
10
20
Pe
ak c
urre
nt (
Potential (mV)
415 Compound 1 307 2-Butanone 283 Benzene 333Resorcinol
670 mV880 mV
Figure 57: Cyclic voltammograms of resorcinol, 2-butanone, benzene and compound 1.
-900 0 9000
10
20
30
Pe
ak
curr
en
t (
Potential (mV)
333 Resorcinol 307 2-butanone 283 benzene 415 Compound 1
880 mV
670 mV
15 mV
57mV
81 mV
Figure 58: Square wave voltammograms of resorcinol, 2-butanone, benzene and
compound 1.
In this analysis peak 1 will be the main focus as it is said in literature that the first
anodic peak is the most important in telling us about the antioxidant activity of a

96
compound. They mention that the lower the oxidation potential of the first peak the
greater the ability of a compound to donate an electron and hence behave as an
antioxidant [17, 163]. Peak 2 for resorcinol is present at approximately 663 mV which
corresponds to half peak potential found in literature at 632 mV [164]. This peak is
absent for benzene and 2-butanone but is present for compound 1 but has shifted to
more positive potentials at 882 mV. In literature, the higher the number of hydroxyl
groups the more enhanced the flavonoid activity. This was demonstrated when the
number of hydroxyl groups was compared to IC50 value which depicts the strength of
the antioxidant activity of a compound [165]. Since benzene and 2-butanone do not
possess hydroxyl groups, oxidation peak 2 was absent. In resorcinol and compound 1
hydroxyl groups were present and hence the presence of peak 2. The shift of peak 2
from 663 mV in resorcinol to 882 mV in compound 1 shows a reduction antioxidant
ability of compound 1 by the substituents namely benzene and 2-butanone.
In figure 58, considering the first oxidation peak, benzene and tetrahydrofuran will be
disregarded as the presence of a hydroxyl group is necessary assign a compound as an
antioxidant [165]. Comparing the oxidation peak potential of peak 1 for resorcinol at
81 mV with that of compound 1 at 15 mV we can assume that compound 1 is a better
antioxidant than resorcinol [17, 164].

97
5.1.2. Compound 2: 2,3-dihydro-5,7-dihydroxy-2-
phenyl-4H-1-benzopyran-4-one (2)
Formula: C15H12O4
Molecular mass: 256 g/mol
-1500 -1000 -500 0 500 1000 1500
-10
0
10
20
30
40
50
60
O
HO
OH
O1
2
3
44a
56
78
8a1'
2'
3'
4'
5'
6'
Pe
ak
curr
en
t (A
)
Potential (mV)
0 95 189 284 378 472
2
1
Figure 59: Cyclic voltammogram of compound 2, scan rate of 100 mV/s.

98
-1500 -1000 -500 0 500 1000 1500
5
10
15
20
25
O
HO
OH
O1
2
3
44a
56
78
8a1'
2'
3'
4'
5'
6'
Pea
k cu
rre
nt (
Potential (mV)
0 95 189 284 378 472
1
2
Figure 60: Square wave voltammogram of compound 2, scan rate 20mV/s.
Concentration ()
0 100 200 300 400 500
Pea
k cu
rren
t (A
)
6.0e-7
8.0e-7
1.0e-6
1.2e-6
1.4e-6
1.6e-6
1.8e-6
2.0e-6
2.2e-6
2.4e-6
2.6e-6
2.8e-6
Peak 1Peak 2Linear regression
y1 = 1.86 X 10⁻⁹ + 6.83 X 10⁻⁷ R2= 0.9856
y2 = -3.56 X 10⁻⁹ + 2.74 X 10⁻⁶ R2 = 0.9514
Figure 61: Linear regression graph of compound 2.

99
Figure 59 shows the cyclic voltammogram of compound 2 shows one anodic peak at
972.6 mV. When dealing with compounds that behave as antioxidants anodic peaks
are assigned to individual compounds based on the oxidation potentials (Epa) while
their concentrations are proportional to the current density (Ipa) [105]. The absence of
a corresponding reduction peak points to the irreversibility of the oxidation reaction
product produced in this reaction. It is known that oxidation of mono phenol group
occurs at high positive potentials forming a phenoxy radical or phenoxium ion and
can successively under go different secondary reactions [166]. The square wave
voltammogram of compound 2 shows two sets of peaks one at 49 mV and the other at
952mV. This showed that the Ip1 was increasing while Ip2 was decreasing with
increasing concentration. The first and second oxidation peaks (Ip1, Ip2) were used as
additional variables to analyze the effect of concentration by extracting the linear
region between 100 and 472 µM and a multiple regression analysis was performed.
The regression equation for peak 1 Ip1 = 1.86 X 10⁻⁹ C0 + 6.83 X 10⁻⁷ with a
correlation coefficient of 0.9856 and peak 2 has a regression equation of Ip2 = -3.56 X
10-9 C0 + 2.74 X 10⁻⁶ with a correlation coefficient of 0.9514.

100
Tetrahydrofuran
-1500 -1000 -500 0 500 1000 1500-20
0
20
40
60
80
100
O
O
Pe
ak
curr
en
t (
Potential (mV)
0 80 200 359 557
1
Figure 62: Cyclic voltammogram of tetrahydrofuran, scan rate 100 mV/s.
-1000 -500 0 500 1000 1500
-20
0
20
40
60
80
100
Pe
ak c
urre
nt (
Potential (mV)
200 M Resorcinol 283 M Benzene 200 M Tetrahydrofuran 378 M Compund 2
663 mV946 mV
Figure 63: Cyclic voltammograms of resorcinol, benzene, tetrahydrofuran and
compound 2.

101
-1000 0 10000
10
20
30
40
Pe
ak
curr
en
t (A
)
Potential (mV)
283 Benzene 200 Tetrahydrofuran 378 Compound 2 200 Resorcinol
946 mv663 mV49 mV55 mV
77mV
Figure 64: Square wave voltammograms of resorcinol, benzene, tetrahydrofuran
and compound 2.
The second oxidative peak is absent for benzene and tetrahydrofuran. As discussed
for compound 1 the number of hydroxyl groups the affects the activity of the
compound [165]. Since tetrahydrofuran does not possess any hydroxyl groups,
oxidation peak 2 was absent just as was seen for benzene and 2-butanone. There is a
shift in peak potential of peak 2 from 663 mV in resorcinol to 946 mV in compound 2
due to the presence of substituents namely benzene and tetrahydrofuran [17]. Peak 1
for resorcinol has a first oxidation peak potential of 77 mV while compound 2 has an
oxidation peak potential of 15 mV, making compound 2 a better antioxidant than
resorcinol [99, 163].

102
5.1.3. Compound 3: 2,3-dihydro-5,7-dihydroxy-2-
(2’-methoxyphenyl)-4H-1-benzopyran-4-one (3)
Formula: C16H14O5
Molecular mass: 286 g/mol
-1500 -1000 -500 0 500 1000 1500
-20
-10
0
10
20
30
40
50
60
70
O
H O
O H
O1
2
3
44 a
56
78
8 a1 '
3 '
4 '
5 '
6 '
O C H 3
2 '
Pe
ak
curr
ent (
Potentia l (m V)
0 34 68 101 135 169
1 23
Figure 65: Cyclic voltammogram of compound 3, scan rate 100 mV/s.
-1500 -1000 -500 0 500 1000 15004
6
8
10
12
14
16
18
20
22
24
26
O
H O
O H
O1
2
3
44 a
56
78
8 a1 '
3 '
4 '
5 '
6 '
O C H 3
2 '
Pe
ak
curr
en
t (A
)
Potential (mV)
0 M 34 M 68 M 101 M 135 M 169 M 1
2
3
Figure 66: Square wave voltammogram of compound 3, scan rate 20 mV/s.

103
Concentration (M)
0 20 40 60 80 100 120
Pe
ak
curr
ent
(A
)
0
1e-6
2e-6
3e-6
4e-6
5e-6
Peak 1Peak 2Linear regression
y1 = 3.20 X 10⁻⁶ x + 1.25 X 10⁻⁸ R2 = 0.9307
y2 = 1.11 X 10⁻⁷ x + 3.48 X 10⁻⁹ R2 = 0.6201
Figure 67: Linear regression compound 3.
The square wave voltammogram of compound 3 (Figure 66) shows three sets of
peaks at 48 mV, 710 mV and 919 mV respectively. The faradaic current for peak 1 is
larger than that of peak 2 and peak 3. The first and second oxidation peaks (Ip1, Ip2)
were used to analyze the effect of concentration by extracting the linear region
between 0 and 169 µM and a multiple regression analysis was performed (Figure 67).
The regression equation for peak 1 Ip1 = 3.20 X 10⁻⁶ C0 + 1.25 X 10⁻⁸ with a
correlation coefficient of 0.9307 and peak 2 has a regression equation of Ip2 = -1.11 X
10-7 C0 + 3.48 X 10⁻⁹ with a correlation coefficient of 0.6201.

104
Anisole
-1500 -1000 -500 0 500 1000 1500-20
-10
0
10
20
30
40
50
60
70
OCH 3
Pea
k cu
rre
nt (A
)
Potential (mV)
0 M 28 M 83 M 166 M 277 M 414 M
1
Figure 68: Cyclic voltammogram of anisole, scan rate 100 mV/s.
-1500 -1000 -500 0 500 1000 15004
6
8
10
12
14
16
18
20
22
24
26
28
30
OCH 3
Pe
ak
curr
en
t (A
)
Potential (mV)
0 M 28 M 83 M 166 M 277 M 414 M
1
Figure 69: Square wave voltammogram of anisole, scan rate 20 mV/s.

105
-1500 -1000 -500 0 500 1000 1500-30
-20
-10
0
10
20
30
40
50
60
70
80
90
100
Pe
ak
curr
en
t (A
)
Potential (mV)
133 M Resorcinol 200 M Tetrahydrofuran 166 M Anisole 165 M Compound 3
621 mV919 mV
Figure 70: Cyclic voltammograms of resorcinol, tetrahydrofuran, anisole and
compound 3.
-1000 0 10000
10
20
30
40
Pe
ak
curr
ent
(
Potential (mV)
133 M Resorcinol 200 M Tetrahydrofuran 166 M Anisole 165 M Compound 3
621 mV
710 mV
47 mV
58 mV77 mV
919 mV
Figure 71: Square wave voltammograms of resorcinol, tetrahydrofuran, anisole
and compound 3.
The first oxidative peak which gives us information about the antioxidant activity of
the compound , we will consider compound 3 and resorcinol which both contain

106
hydroxyl groups which can behave as electron donors [165]. Compound 3 is a better
antioxidant than resorcinol as it has a lower oxidation potential of 47 mV as compared
to that of resorcinol at 77 mV for the first peak. For peak 2, resorcinol has its
characteristic peak at 621 mV [99, 164]. Peak 2 for compound 3 could be attributed to
the presence of the resorcinol moiety in the structure and the shift in potential could
be due to the substituents namely tetrahydrofuran and anisole which do not have an
antioxidant activity themselves.
5.1.4. Compound 4: 1-(2’,4’-diacetyloxyphenyl)-3-phenyl-2-propen-1-one (4)
Formula: C19H15O5
Molecular mass: 323 g/mol
-1500 -1000 -500 0 500 1000 1500-20
-10
0
10
20
30
O
AcO
OAc
1''3''
4''
5''
6''
2''
1
2
3
1'2'
3'
4'
5'
6'
Pe
ak
curr
ent
(A
)
Potential (mV)
0 nM 290 nM 581 nM 871 nM 1160 nM 1430 nM
1
Figure 72: Cyclic voltammogram of compound 3, scan rate 100 mV/s.

107
-1500 -1000 -500 0 500 1000 15006
8
10
12
14
16
18
20
O
AcO
OAc
1''3''
4''
5''
6''
2''
1
2
3
1'2'
3'
4'
5'
6'
Pe
ak
curr
ent
(
Potential (mV)
0 nM 291 nM 581 nM 871 nM 1160 nM 1430 nM
1
Figure 73: Square wave voltammogram of compound 3, scan rate 20 mV/s.
Concentration (nM)
0 200 400 600 800 1000 1200 1400 1600
Pe
ak c
urre
nt (
A)
3.5e-6
4.0e-6
4.5e-6
5.0e-6
5.5e-6
6.0e-6
Peak 1Linear regression
y1 = 3.98 X 10⁻⁶ x + 1.21 X 10⁻⁹ R2 = 0.9782
Figure 74: Linear regression graph of compound 4.

108
Figure 73 shows the square wave voltammogram of compound 4 which shows only
one sets of peaks one at 26 mV. The first oxidation peak (Ip1) was used as additional
variable to analyze the effect of concentration and a simple regression analysis was
performed (Figure 74). The regression equation for peak 1 Ip1 = 3.98 X 10⁻⁶ C0 + 1.21
X 10-9 with a correlation coefficient of 0.9782.
Diacetoxy benzene
-1500 -1000 -500 0 500 1000 1500-20
0
20
40
60A c O
O A c
Pe
ak
curr
ent (A
)
Potential (mV)
0 M 28 M 83 M 166 M 277 M 415 M
1 2
Figure 75: Cyclic voltammogram of diacetoxybenzene, scan rate 100 mV/s

109
-1500 -1000 -500 0 500 1000 1500
4
6
8
10
12
14
16
18
20
22
24
26
28
A c O
O A c
Pe
ak
curr
en
t (A
)
Potential (mV)
0 M 28 M 83 M 166 M 277 M 415 M
12
Figure 76: Square wave voltammogram of diacetobenzene, scan rate 20mV/s.
2-penten-1-one
-1500 -1000 -500 0 500 1000 1500-10
0
10
20
30
40
H3C
CH3
O
Pe
ak
curr
ent
(A
)
Potential (mV)
0 M 27 M 84 M 140 M 390 M 667 M
1
Figure 77: Cyclic voltammogram of 2-pentenone, scan rate 100mV/s.
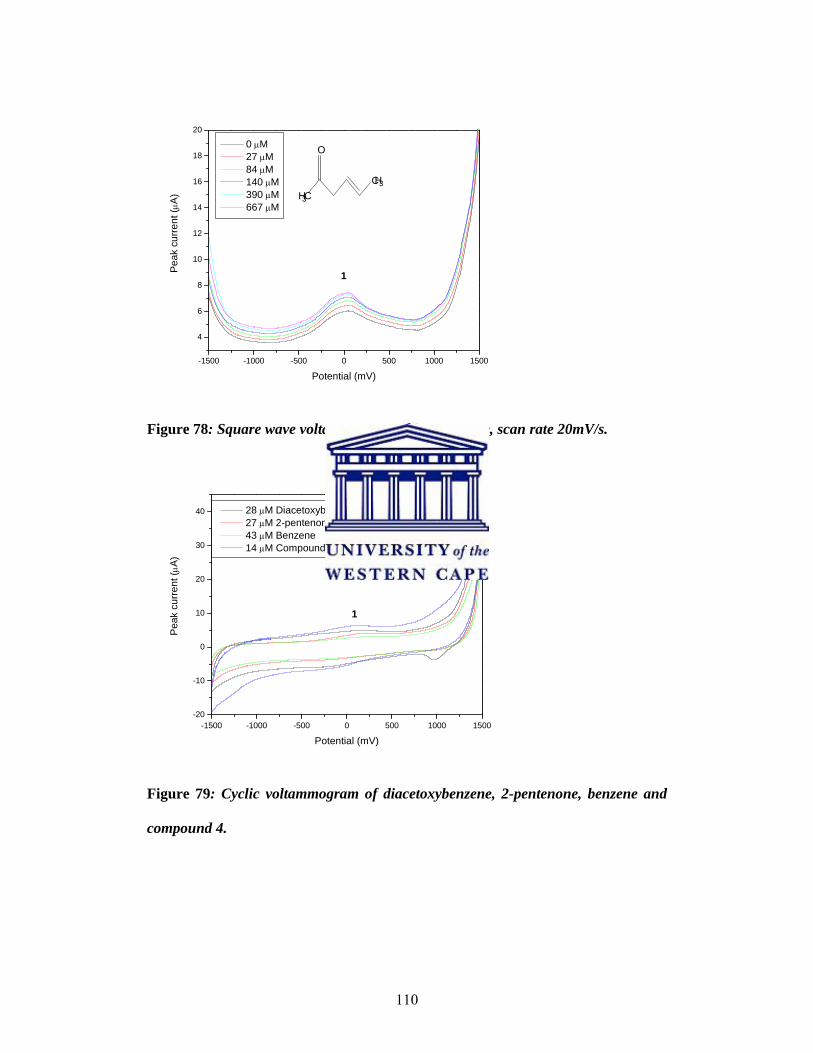
110
-1500 -1000 -500 0 500 1000 1500
4
6
8
10
12
14
16
18
20
H3C
CH3
O
Pe
ak
curr
en
t (A
)
Potential (mV)
0 M 27 M 84 M 140 M 390 M 667 M
1
Figure 78: Square wave voltammogram of 2-pentenone, scan rate 20mV/s.
-1500 -1000 -500 0 500 1000 1500-20
-10
0
10
20
30
40
Pea
k cu
rre
nt (A
)
Potential (mV)
28 M Diacetoxybenzene 27 M 2-pentenone 43 M Benzene 14 M Compound 4
1
Figure 79: Cyclic voltammogram of diacetoxybenzene, 2-pentenone, benzene and
compound 4.
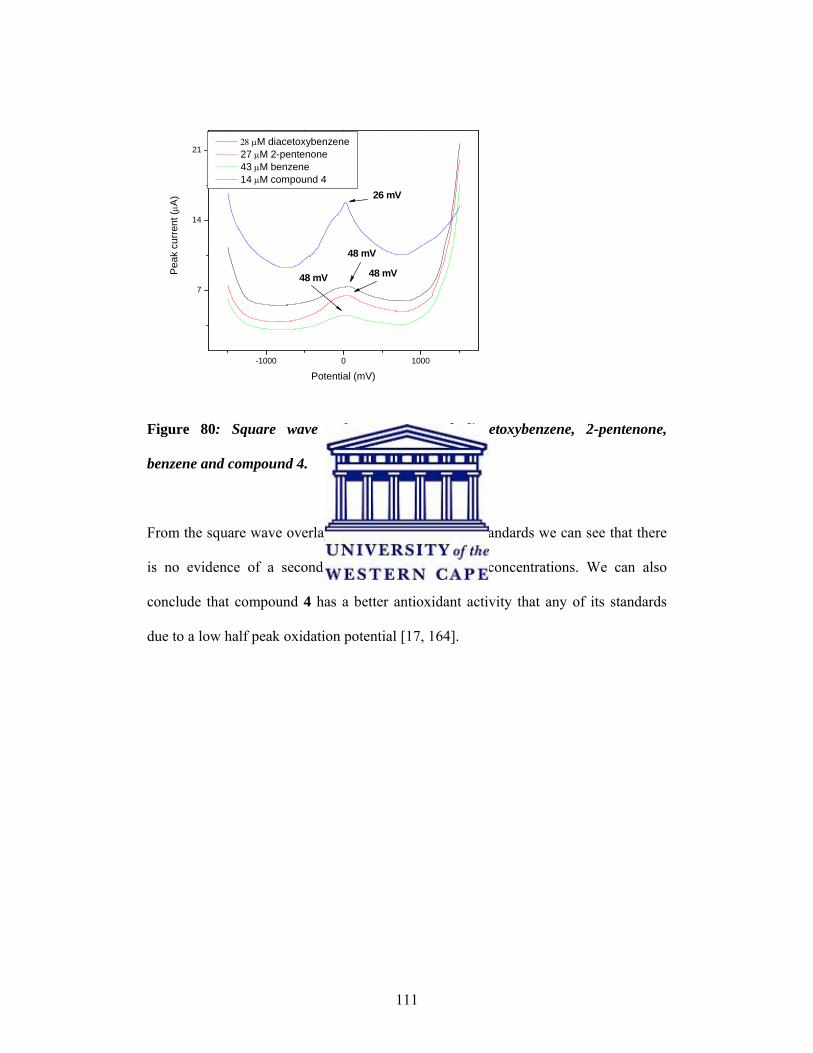
111
-1000 0 1000
7
14
21
Pe
ak c
urre
nt (A
)
Potential (mV)
M diacetoxybenzene 27 M 2-pentenone 43 M benzene 14 M compound 4
26 mV
48 mV
48 mV48 mV
Figure 80: Square wave voltammograms of diacetoxybenzene, 2-pentenone,
benzene and compound 4.
From the square wave overlay of compound 4 and its standards we can see that there
is no evidence of a second oxidation peak at those concentrations. We can also
conclude that compound 4 has a better antioxidant activity that any of its standards
due to a low half peak oxidation potential [17, 164].

112
5.1.5. Compound 5: 1-(2’,4’-dihydroxyphenyl)-3-phenyl-2-propen-1-one (5)
Formula: C15H12O3
Molecular mass: 240 g/mol
-1500 -1000 -500 0 500 1000 1500-20
-10
0
10
20
30
40
O H
HO
O
1
2
3 1''2''
3''
4''
5''
6''
1'2'
3'
4'
5'
6'
Pe
ak
curr
ent
(A
)
Potential (mV)
0 M 39 M 77 M 116 M 154 M 193 M
1
2
Figure 81: Cyclic voltammogram of compound 5, scan rate 100 mV/s.
-1500 -1000 -500 0 500 1000 15008
10
12
14
16
18
20
OH
HO
O
1
2
3 1''2''
3''
4''
5''
6''
1'2'
3'
4'
5'
6'
Pe
ak
curr
en
t (A
)
Potential (mV)
0 M 39 M 77 M 116 M 154 M 193 M
1
2
Figure 82: Square wave voltammogram of compound 5, scan rate 20
mV/s.

113
Concentration (
60 80 100 120 140 160
Cur
rent
(
0
1e-6
2e-6
3e-6
4e-6
5e-6
6e-6
Peak 1Peak 2Linear regression
y1 = 4.62 X 10⁻⁶ + 5.68 X 10⁻⁹ R2 = 0.9995
y2 = 1.38 X10⁻⁶ - 3.86 X 10⁻⁹ R2 = 0.5117
Figure 83: Linear regression graph of compound 5.
Figure 81 shows the cyclic voltammogram of compound 5 shows one anodic peak at
916 mV. When dealing with compound that behave as antioxidants anodic peaks are
assigned to individual compounds based on the oxidation potentials [105]. The
absence of a corresponding reduction peak for this oxidation peak at 916 mV shows
the irreversibility of the oxidation reaction product produced in this reaction. The
oxidation of mono phenol group occurs at high positive potentials forming a phenoxy
radical or phenoxium ion and can successively undergo different secondary reactions
[166]. The square wave voltammogram of compound 5 shows two sets of peaks one
at 43 mV and the other at 916 mV. The first and second oxidation peaks were used as
additional variables to analyze the effect of concentration by extracting the linear
region between 77 and 154 µM and a multiple regression analysis was performed.
The regression equation for peak 1 Ip1 = 5.68 X 10⁻⁹ C0 + 6.83 X 10⁻⁷ with a

114
correlation coefficient of 0.9995 and peak 2 has a regression equation of Ip2 = 1.38 X
10-6 C0 – 3.86 X 10⁻⁹ with a very low correlation coefficient of 0.5117.
-1500 -1000 -500 0 500 1000 1500-20
-10
0
10
20
30
40
50
P
ea
k cu
rren
t (A
)
Potential (mV)
133 Resorcinol 140 M 2-pentenone 133 M Benzene 154 M Compound 5
843 mV
916 mV
Figure 84: Cyclic voltammograms of resorcinol, 2-pentenone, benzene and
compound 5.
-1000 0 10000
10
20
30
Pe
ak
curr
en
t (A
)
Potential (mV)
133 M Resorcinol 140 M 2-pentenone 133 M Benzene 154 M Compound 5
12 mV 43 mV
37 mV37 mV
843 mV
916 mV
Figure 85: Square wave voltammograms of resorcinol, 2-pentenone, benzene and
compound 5.

115
Compound 5 has the same number of oxidation peaks as resorcinol which can lead us
to assume that the electrochemically active part of compound 5 is the resorcinol
moiety due to the presence of hydroxyl groups which can act as electron donors [165].
The comparison of peak 1 and 2 of resorcinol, at 12 mV and 843 mV respectively,
with those of compound 5, at 43 mV and 916 mV shows us that resorcinol has a better
antioxidant activity than compound 5 [17, 164].
5.1.6. Compound 6: 5-acetoxy-2,3-dihydro-7-hydroxy-2-(2’-methoxyphenyl)-
4H-1-Benzopyran-4-one (6)
Formula: C18H16O6
Molecular mass: 328 g/mol
-1500 -1000 -500 0 500 1000 1500-20
-10
0
10
20
30
40
50
OAcO
OH O
OMe
1
2
3
44a
56
7
88a
1'2'
3'
4'
5'
6'
Pe
ak
curr
en
t (A
)
Potential (mV)
0 M 37 M 77 M 116 M 154 M 193 M
1
2
Figure 86: Cyclic voltammogram of compound 6, scan rate100 mV/s.

116
-1500 -1000 -500 0 500 1000 15008
10
12
14
16
18
20
22
OAcO
OH O
OMe
1
2
3
44a
56
7
88a
1'2'
3'
4'
5'
6'
Pe
ak
curr
ent (A
)
Potential (mV)
0 37 77 116 154 193
1
2
Figure 87: Square wave voltammogram of compound 6, scan rate 20 mV/s.
Concentration (M)
20 40 60 80 100 120 140 160
Pea
k cu
rren
t (A
)
-2e-6
0
2e-6
4e-6
6e-6
8e-6
Peak 1Peak 2Linear egression
y1 = 4.8 X 10⁻⁶ x + 4.12 X 10⁻⁹ R2 = 0.9200
y2 = -1.64 X 10⁻⁶ x + 4.37 X 10⁻⁸ R2 = 0.5477
Figure 88: Linear regression graph of compound 6.

117
Figure 86 shows the cyclic voltammogram of compound 6 shows two anodic peaks.
The absence of a corresponding reduction peak for this oxidation peak at 944 mV
shows the irreversibility of the oxidation reaction product produced in this reaction.
The square wave voltammogram of compound 6 shows two sets of peaks one at 122
mV and 916 mV respectively (Figure 87). The first and second oxidation peaks were
used as additional variables to analyze the effect of concentration by extracting the
linear region between 37 and 154 µM and a multiple regression analysis was
performed. The regression equation for peak 1 Ip1 = 4.8 X 10⁻⁶ C0 + 4.12 X 10⁻⁹ with a
correlation coefficient of 0.9200 and peak 2 has a regression equation of Ip2 = -1.74 X
10-6 C0 + 4.37 X 10⁻⁸ with a low correlation coefficient of 0.5477.
1,3 acetoxy phenol
-1500 -1000 -500 0 500 1000 1500-10
0
10
20
30
A c O
O H
Pe
ak
curr
ent (A
)
Potential (mV)
0 M 28 M 83 M 138 M 248 M 385 M
1
2
Figure 89: Cyclic voltammogram of 1,3-acetoxy phenol, scan rate100 mV/s.

118
-700 0 700
0
20
40
Pe
ak c
urre
nt (A
)
Potential (mV)
138 M 1,3-acetoxy phenol 200 M tetrahydrofuran 166 M methoxy benzene 154 M Compound 6
790 mV
944 mV
151 mV122 mV
121 mV
Figure 90: Cyclic voltammograms of 1,3-acetoxy phenol ,tetrahydrofuran,
methoxy benzene and compound 6.
The first and second oxidation peaks for compound 6 have higher oxidation potentials
than all of the compounds in figure 90. This means that compound 6 has low
antioxidant activity than all its standard solutions [17, 164]. The second oxidation
peak of compound 6 is due to the irreversible oxidation of phenol in 1,3-
acetoxyphenol at a potential of 790 mV [167].

119
5.1.7. Compound 7: 2,3-dihydro-7-hydroxy-2-phenyl-4H-1-Benzopyran-4-one
(7)
Formula: C15H12O3
Molecular mass: 210 g/mol
-1500 -1000 -500 0 500 1000 1500-20
0
20
40
60
OHO
O
1
2
3
44a6
7
88a
1'3'
4'
5'
6'
5
2'
Pe
ak
curr
ent
(A
)
Potential (mV)
0 M 25 M 50 M 75 M 100 M 125 M
12
Figure 91: Cyclic voltammogram of compound 7, scan rate100 mV/s.
-1500 -1000 -500 0 500 1000
5
10
15
20
OHO
O
1
2
3
44a6
7
88a
1'3 '
4'
5'
6'
5
2'
Pe
ak
curr
ent
(A
)
Potential (mV)
0 M 25 M 50 M 75 M 100 M 125 M
1
2
Figure 92: Square wave voltammogram of compound 7, scan rate 20 mV/s.

120
Concentration (M)
20 40 60 80 100 120 140
Pea
k cu
rren
t (A
)
-5.0e-7
0.0
5.0e-7
1.0e-6
1.5e-6
2.0e-6
2.5e-6
Peak 1Peak 2Linear regression
y1 = 1.28 X 10⁻⁶ x + 6.64 X 10⁻⁹ R2 = 0.9448
y2 = 7.73 X 10⁻⁷ x - 6.44 X 10⁻⁹ R2 = 0.8635
Figure 93: Linear regression graph of compound 7.
Figure 91 shows the cyclic voltammogram of compound 7 shows two anodic peaks.
The presence reduction peak for this oxidation peak at 1012 mV shows the
reversibility of the oxidation reaction product produced in this reaction. Filipiak
(2001) carried out some studies on 7-hydroxyflavone and he reported peak 2 as
dependant on pH, and for 7-hydroxyflavone at even higher potentials when reaction
was ran at pH 7 [168]. The square wave voltammogram of compound 7 shows two
sets of peaks one at 70 mV and 1012 mV respectively (Figure 92). The first and
second oxidation peaks (Ip1, Ip2) were used as additional variables to analyze the effect
of concentration by extracting the linear region between 25 and 125 µM and a
multiple regression analysis was performed. The current of peak 1 (Ip1) increased with

121
increasing while the opposite occurs for the current of peak 2 (Ip2) which experiences
a decrease with increasing concentration. The regression equation for peak 1 Ip1 =
1.28 X 10⁻⁶ C0 + 6.64 X 10⁻⁹ with a correlation coefficient of 0.9448 and peak 2 has a
regression equation of Ip2 = 7.73 X 10⁻⁷ C0 + 6.44 X 10⁻⁹ with a low correlation
coefficient of 0.8635.
Phenol
-1500 -1000 -500 0 500 1000 1500-20
0
20
40
O H
Pea
k cu
rre
nt (
Potential (mV)
0 28 84 168 279 418
12
Figure 94: Cyclic voltammogram of phenol, scan rate100 mV/s.

122
-1500 -1000 -500 0 500 1000 15004
6
8
10
12
14
16
18
20
O H
Pea
k cu
rre
nt(A
)
Potential (mV)
0 M 28 M 168 M 279 M 418 M
1
2
Figure 95: Square wave voltammogram of phenol, scan rate 20 mV/s.
-1500 -1000 -500 0 500 1000 1500-20
-10
0
10
20
30
40
50
60
84 M phenol 80 M tetrahydrofuran 129 M benzene 84 M compound 7
Pea
k cu
rre
nt (A
)
Potential (mV)
12
Figure 96: Cyclic voltammogram of phenol, tetrahydrofuran, benzene and
compound 7.

123
-1000 0 1000
5
10
15
Pe
ak
curr
en
t (A
)
Potential (mV)
84 M phenol 80 M tetrahydrofuran 129 M benzene 100 M Compound 7
746 mV
1012 mV
122 mV
70 mv
52 mV52 mV
Figure 97: Square wave voltammograms of phenol, tetrahydrofuran, benzene
and compound 7.
Although tetrahydrofuran and benzene have peak 1 they can not be considered as
antioxidants because they do not contain hydroxyl groups which could behave as
electron donors [165]. Compound 7 and phenol both contain hydroxyl groups so are
able to behave as antioxidants, considering peak 1, compound 7 has a lower oxidation
potential of 70 mV than phenol which has an oxidation potential of 122 mV proving
that compound 7 is a better antioxidant than phenol [17, 164]. Peak 2 for compound 2
at 1012 mV is due to the oxidation of phenol and it shifts from a potential of 746 mV
due to the presence of other substituents on the compound. In literature the oxidation
potential of phenol is at 540 mV, the change in peak potential could be due to the
solution used because when it comes to polyphenolic compounds a change in the pH
of the solution leads to a shift of the peak potentials of the compounds [111].

124
5.1.8. Compound 8: 5,7-(diacetoxy)-2,3-dihydro-2-phenyl-4H-1-benzopyran-
4-one (8)
Formula: C19H16O6
Molecular mass: 340 g/mol
-1500 -1000 -500 0 500 1000 1500-20
0
20
40
60
80
OAcO
O
1
2
3
44a6
7
88a
1'3 '
4 '
5 '
6 '
2 '
OA c
5
Pea
k cu
rren
t (A
)
Potentia l (m V)
12 23 M 35 46 58
1
Figure 98: Cyclic voltammogram of compound 8, scan rate100 mV/s.

125
-1500 -1000 -500 0 500 10005
10
15
20
25
30
35
OAcO
O
1
2
3
44a6
7
88a
1'3'
4'
5'
6'
2'
OAc
5
Pea
k cu
rre
nt (
Potential (mV)
12 23 35 46 58
1
Figure 99: Square wave voltammogram of compound 8, scan rate 20 mV/s.
Concentration (M)
10 15 20 25 30 35 40 45 50
Pea
k cu
rren
t (A
)
2.9e-6
3.0e-6
3.1e-6
3.2e-6
3.3e-6
3.4e-6
3.5e-6
3.6e-6
3.7e-6
Peak 1Linear regression
y1 = 2.88 X 10⁻⁶ + 1.50 X 10⁻⁸ R2 = 0.9261
Figure 100: Linear regression graph of compound 8.

126
The square wave voltammogram of compound 8 (Figure 99) shows one sets of peaks
at 50 mV. The first oxidation peaks (Ip1) was used to analyze the effect of
concentration by extracting the linear region between 12 and 46 µM and a multiple
regression analysis was performed. The regression equation for peak 1 was Ip1 = 2.88
X 10-6 C0 + 1.50 X 10⁻⁸ with a correlation coefficient of 0.9261.
-1500 -1000 -500 0 500 1000 1500-20
-10
0
10
20
30
40
50
60
70
80
90
Pe
ak
curr
ent (A
)
Potential (mV)
83 M Diacetoxy benzene 80 M tetrahydrofuran 43 M benzene 58 M compound 8
Figure 101: Cyclic voltammograms of diacetoxybenzene, tetrahydrofuran,
benzene and compound 8.

127
-1000 0 1000
10
20
30
83 M Diacetoxy benzene 80 M tetrahydrofuran 43 M benzene 58 M compound 8
Pe
ak
curr
en
t (A
)
Potential (mV)
31 mV
31 mV38 mV
50 mV
Figure 102: Square wave voltammograms of diacetoxybenzene, tetrahydrofuran,
benzene and compound 8.
Cao (1997) proved that the presence of hydroxyl group is necessary for the
antioxidant activity of a compound hence compound 8 is assumed not to have any
antioxidant activity due to absence of a hydroxyl group that will behave as an electron
donor. [165].

128
5.1.9. Compound 9: 5,7-(diacetoxy)-2,3-dihydro-2-(2-methoxyphenyl)-4H-1-
benzopyran-4-one (9)
Formula: C20H19O7
Molecular mass: 371 g/mol
-1000 -500 0 500 1000 1500-15
-10
-5
0
5
10
15
20
25
30
35
40
45
50
OA cO
O
1
2
3
44 a6
7
88 a
1 '3 '
4 '
5 '
6 '
O A c
5
O M e
2 '
Pe
ak c
urr
ent
(
P oten tia l (m V )
25 .1 n 75 .4 n 151 n 251 n 377 n
1
Figure 103: Cyclic voltammogram of compound 9, scan rate100 mV/s.
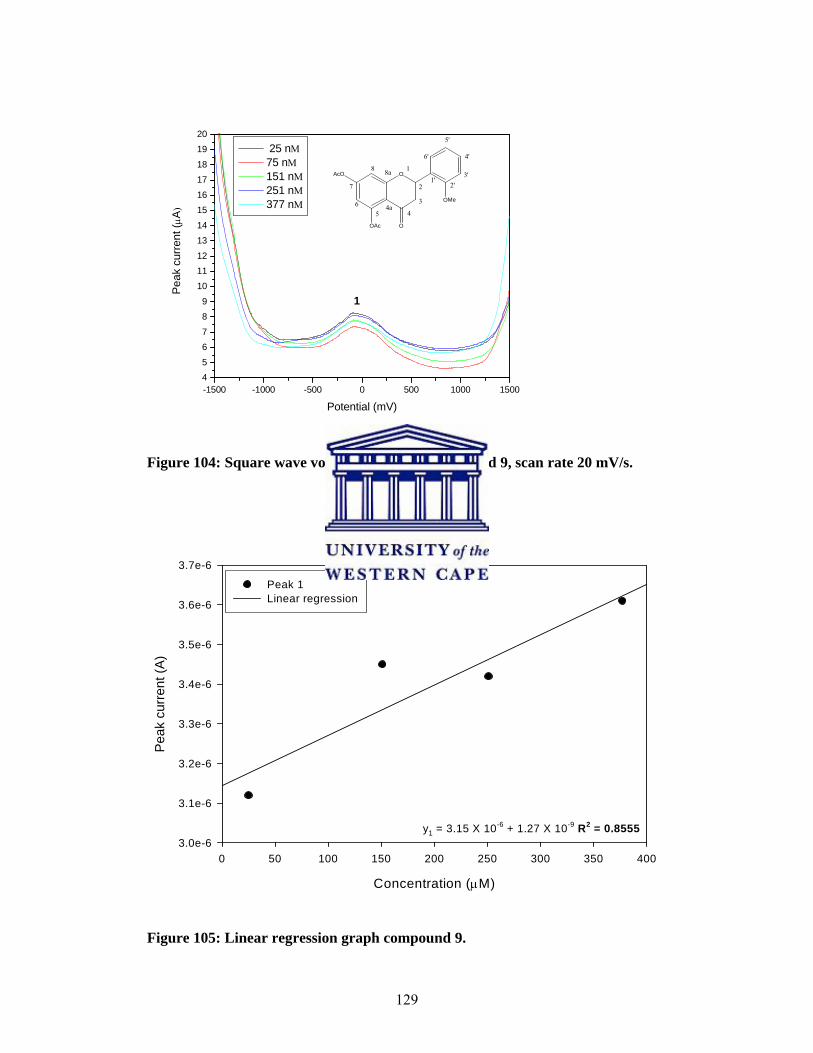
129
-1500 -1000 -500 0 500 1000 15004
5
6
7
8
9
10
11
12
13
14
15
16
17
18
19
20
OAcO
O
1
2
3
44a6
7
88a
1'3'
4'
5'
6'
OAc
5
OMe
2'
Pe
ak c
urre
nt (A
Potential (mV)
25 n 75 n 151 n 251 n 377 n
1
Figure 104: Square wave voltammogram of compound 9, scan rate 20 mV/s.
Concentration (M)
0 50 100 150 200 250 300 350 400
Pea
k cu
rren
t (A
)
3.0e-6
3.1e-6
3.2e-6
3.3e-6
3.4e-6
3.5e-6
3.6e-6
3.7e-6
Peak 1Linear regression
y1 = 3.15 X 10⁻⁶ + 1.27 X 10⁻⁹ R2 = 0.8555
Figure 105: Linear regression graph compound 9.

130
The square wave voltammogram of compound 9 (Figure 104) has one set of peaks at
-85 mV. The first oxidation peak (Ip1) was used to analyze the effect of concentration
by extracting the linear region between 25 and 377 nM and a simple regression
analysis was performed. The regression equation for peak 1 Ip1 = 3.15 X 10⁻⁶ C0 +
1.27 X 10⁻⁸ with a correlation coefficient of 0.8555.
-1500 -1000 -500 0 500 1000 1500-20
-10
0
10
20
30
40
50
60
138 M Diacetoxy benzene 200 M Tetrahydrofuran 166 M methoxy benzene 151 M Compound 9
Pe
ak c
urre
nt (A
)
Potential (mV)
1
Figure 106: Cyclic voltammograms of diacetoxybenzene, tetrahydrofuran,
anisole and compound 9.

131
-1000 0 1000
10
20
Pe
ak
curr
en
t (A
)
Potential (mV)
138 M Diacetoxy benzene 200 M Tetrahydrofuran 166 M methoxy benzene 151 M Compound 9
64 mV
40 mV45 mV 759 mV
Figure 107: Square wave voltammograms of diacetoxybenzene, tetrahydrofuran,
anisole and compound 9.
The absence of peak two, between 600 mV and 750 mV, shows the absence of a
hydroxyl group in the structure of compound 9. Considering the antioxidant activity
of a flavonoid that does not contain hydroxyl group as it is the main functional group
that behaves as an electron donor [165]. If this compound contained a electron
donating group it would the best antioxidant out of the group of flavanoids studied as
it has an oxidation peak potential of – 85 mV for peak 1 [25].

132
5.2. Flavanoids from Elytropapus rhinocerotis
5.2.1. Compound 10: 2,3-dihydro-5-hydroxy-2-(4’-hydroxy-3’-
methoxyphenyl)-7-methoxy-4H-1-benzopyran-4-one (10)
Formula: C17H16O6
Molecular mass: 316 g/mol
-1500 -1000 -500 0 500 1000 1500-20
0
20
40
60
O
O
OH
OMe
OH
MeO
1
2
3
44a5
6
78
8a1'
2'3'
4'
5'
6'
Pea
k cu
rre
nt (
n
P oten tia l (m V )
16 n 47 n 95 n 158 n 236 n
1
Figure 108: Cyclic voltammogram of compound 10, scan rate100 mV/s.

133
-1500 -1000 -500 0 500 1000 15005
10
15
20
25
O
O
OH
OMe
OH
MeO1
2
3
44a5
6
78
8a1'
2'3'
4'
5'
6'
Pe
ak c
urre
nt (A
)
Potential (mV)
0 nM 16 nM 47 nM 95 nM 158 nM 236 nM
1
Figure 109 : Square wave voltammogram of compound 10, scan rate 20 mV/s.
Concentration (nM)
0 20 40 60 80 100 120 140 160 180
Pea
k cu
rren
t (A
)
2.05e-6
2.10e-6
2.15e-6
2.20e-6
2.25e-6
2.30e-6
2.35e-6
2.40e-6
2.45e-6
Peak 1Linear egression
y1 = 2.11 X 10⁻⁶ + 1.95 X 10⁻⁹ R2 = 0.9349
Figure 110: Linear regression graph of compound 10.

134
The square wave voltammogram of compound 10 (Figure 109) shows one set of
peaks at 89 mV. The first oxidation peak (Ip1) was used to analyze the effect of
concentration by extracting the linear region between 0 and 158 µM and a simple
regression analysis was performed. The regression equation for peak 1 is Ip1 = 2.11 X
10-6 C0 + 1.95 X 10⁻⁹ with a correlation coefficient of 0.9349.
1,3-methoxy phenol
-1500 -1000 -500 0 500 1000 1500-20
0
20
40
60
80 MeO
HO
Pe
ak
curr
ent
(A
)
Potential (mV)
0 M 40 M 120 M 239 M 398 M 596 M
1
23
Figure 111: Cyclic voltammogram of 1,2 methoxy phenol, scan rate100 mV/s.

135
-1500 -1000 -500 0 500 1000 1500-20
-10
0
10
20
30
40
50
60
70
80M e O
O H
0 M 40 M 120 M 239 M 398 M 596 M
Pe
ak
curr
ent
(
Potential (mV)
1
2
Figure 112: Cyclic voltammogram of 1,3 methoxy phenol, scan rate100 mV/s.
-1000 0 1000
0
30
60
Pe
ak c
urre
nt (A
)
Potential (mV)
239 M 1,3-methoxy phenol 200 M tetrahydrofuran 239 M 1,2-methoxy phenol 236 nM Compound 10
538 mV808 mV
1
Figure 113: Cyclic voltammograms of 1,3 methoxy phenol, tetrahydrofuran, 1,2
methoxy phenol and compound 10.
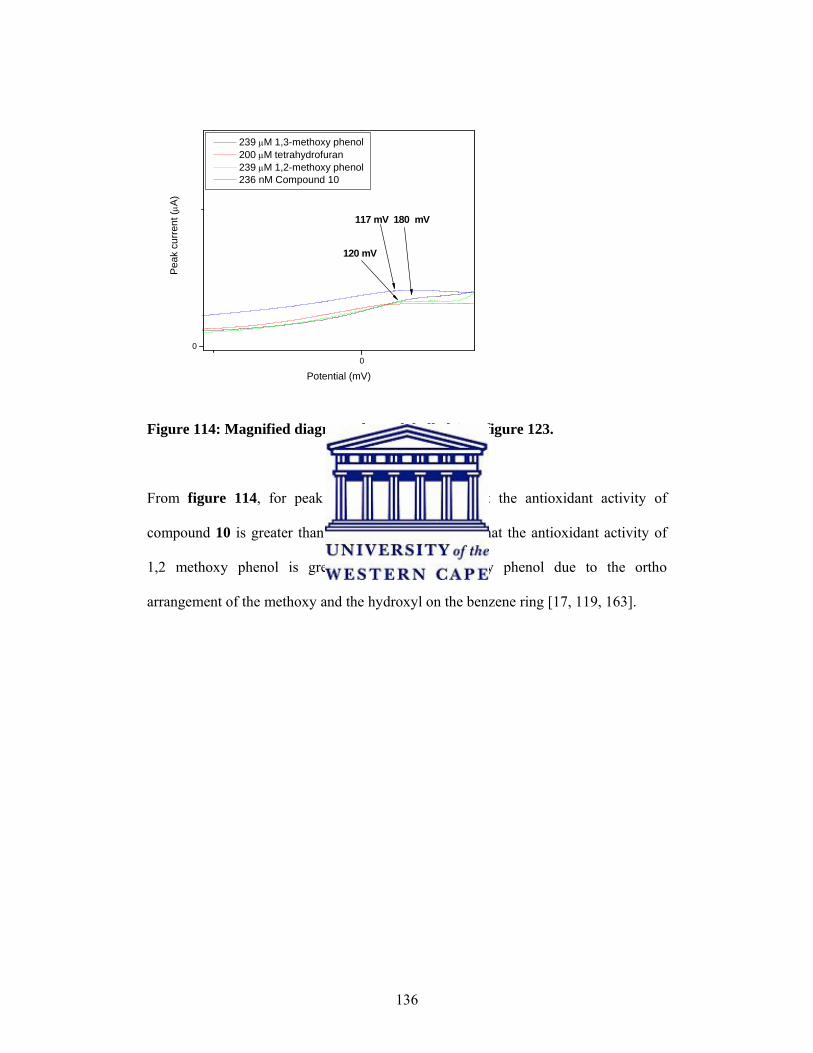
136
0
0
Pe
ak c
urre
nt (A
)
Potential (mV)
239 M 1,3-methoxy phenol 200 M tetrahydrofuran 239 M 1,2-methoxy phenol 236 nM Compound 10
117 mV
120 mV
180 mV
Figure 114: Magnified diagram of area labelled 1 on figure 123.
From figure 114, for peak 1, we can conclude that the antioxidant activity of
compound 10 is greater than of all the standards and that the antioxidant activity of
1,2 methoxy phenol is greater than of 1,3-methoxy phenol due to the ortho
arrangement of the methoxy and the hydroxyl on the benzene ring [17, 119, 163].

137
5.2.2. Compound 11: 2,3-dihydro-5-hydroxy-2-(4-hydroxyphenyl)-
7-methoxy-4H-1-benzopyran-4-one (11)
Formula: C16H13O5
Molecular mass: 285 g/mol
-1500 -1000 -500 0 500 1000 1500-20
0
20
40
60
O
O
OH
OH
MeO
1
2
3
44a5
6
78
8a1'
2'
3'
4'
5'
6' 0 nM 24 nM 72 nM 144 nM 240 nM 359 nM
Pe
ak
curr
en
t (A
)
Potential (mV)
12
Figure 115: Cyclic voltammogram of compound 11, scan rate100 mV/s.
-1500 -1000 -500 0 500 1000 15005
10
15
20
25
O
O
OH
OH
MeO1
2
3
44a5
6
78
8a1'
2'
3'
4'
5'
6'
Pe
ak
curr
ent
(A
)
Potential (mV)
0 nM 24 nM 240 nM 359 nM
12
Figure 116: Square wave voltammogram of compound 11, scan rate 20 mV/s.

138
Concentration (nM)
0 50 100 150 200 250 300 350 400
Pea
k cu
rren
t (A
)
0.0
5.0e-7
1.0e-6
1.5e-6
2.0e-6
2.5e-6
Peak 1Peak 2Linear regression
y1= 1.95 X 10⁻⁶ x+ 8.45 X 10⁻⁸ R2 = 0.9789
y2 = 3.28 X 10⁻⁷ x+ 1.79 X 10⁻⁹ R2 = 0.9914
Figure 117: Linear regression of compound 11.
The square wave voltammogram of compound 11 (Figure 116) shows two sets of
peaks at 98 mV and 782 mV respectively. The first and second oxidation peaks were
used to analyze the effect of concentration by extracting the linear region between 24
and 359 µM and a multiple regression analysis was performed. The regression
equation for peak 1 Ip1 = 1.95 X 10⁻⁶ C0 + 8.45 X 10⁻⁸ with a correlation coefficient of
0.9789 and peak 2 has a regression equation of Ip2 = 3.28 X 10⁻⁷ C0 + 1.79 X 10⁻⁹ with
a correlation coefficient of 0.9914.

139
-1000 0 1000
0
30
60
Pea
k cu
rre
nt (A
)
Potential (mV)
239 M 1,3-methoxy phenol 200 M tetrahydrofuran 279 M phenol 240 M compound 11
804 mV806 mV
818 mV
1
Figure 118: Cyclic voltammogram of 1,3 methoxy phenol, tetrahydrofuran,
phenol and compound 11.
0
4
8
12
Pe
ak
curr
en
t (A
)
Potential (mV)
239 M 1,3-methoxy phenol 200 M tetrahydrofuran 279 M phenol 240 M compound 11
71 mV
162 mV
166 mV
225 mV
Figure 119: Magnified graph of area labelled 1 on figure129.

140
From figure 118 we can observe that phenol, compound 11 and 1,3-methoxy phenol
all have peak two at oxidation potentials of 818, 806 and 804 mV respectively. From
figure 130 we can see that compound 11 has a higher oxidation peak potential than its
standards and hence would be not be a good antioxidant as compared to the standards
[17, 163].
-1500 -1000 -500 0 500 1000 1500-20
0
20
40
60
80
100
Pe
ak c
urre
nt (A
)
Potential (mV)
1 2 3 4 5 6 7 8 910 11
Figure 120: Cyclic voltammograms of all 11 compounds scan rate 100 mV/s.

141
-1500 -1000 -500 0 500 1000
5
10
15
20
25
30
35
40
1 2 3 4 5 6 7 8 910 11
Pe
ak c
urre
nt (A
)
Potential (mV)
Figure 121: Square wave voltammograms of all 11 compounds, scan rate 20
mV/s.
Cyclic voltammetry is useful in determining the antioxidant activity of antioxidants
due to their ability to donate electrons and produce an anodic peak. The current
response due to phosphate buffer blank was measured before each experiment of
sample solution and subtracted away from the response of the sample. Cyclic
voltammetry is important as it helps us determine the antioxidant activity of low
molecular weight antioxidant as is not the case with other techniques which determine
antioxidant activity [169]. Square wave voltammetry was used to its high speed of
analysis and low consumption of electrochemically active species. Square wave gave
the best resolution of peaks as compared to C.V [107]. Vojtek et al (2007) proved that
acetate buffer was not a suitable solution for determination of flavanoid compounds
but instead that the best solution was phosphate buffer of pH 7 which gave a better
signal , hence this solution was used for all my experiments [170].All flavonoids were
prepared in 0.1 M phosphate buffer saline solution (PBS) at varying concentrations.

142
Linear regression curves were constructed to analyze current responses on increase of
concentration for both standards and flavanoids. A scan rate of 100 mV/s was chosen
as opposed to 50 mV/s and 20 mV/s due to the peak being more visible than with the
other two scan rates. The faster the scan rate, the lower the amount of time that allows
formation of a film on the electrode surface and the higher the current signal [148].
Flavanoids can electrochemically oxidised behave as antioxidants due to their ability
to scavenge free radicals by an electron transfer process which involves the hydroxyl
groups attached to either the A or B ring thereby forming an oxidation peak. In this
reaction the phenol is converted into a phenoxy radical [1, 111]. In a scavenging
reaction hydrogen atoms are donated to the radical and this involves the breaking of
an O – H bond. It is generally believed that the presence of O – H is essential, for this
reason compounds 4, 8 and 9 which do not contain of any hydroxyl groups will be
excluded from discussion involving antioxidant activity [5, 88]. Electrochemistry
allows us to investigate the ability of flavanoids to donate electrons [119]. Cren-olive
and colleagues (2002) showed that the resorcinol group is difficult to oxidise as it has
high oxidation potentials as was evident in my results were compound 1, 2,3 and 5
which contain the resorcinol group all had a second oxidation peak at potentials
higher than 880 mV [111, 171]. In flavanoids that have an OH in ring B e.g.
compound 10 and 11, the rest of the flavonoid structure seems to be more important
for the antioxidant activity. The presence of a methoxy in ring B as in compound 11
can activate the OH group hence the lower potential of compound 11 as compared to
compound 10 [5]. Cren-olive et al (2002) and Slabbert (1977) proved that the
ionisation of OH groups of ring system do not influence the ionisation of the other
system if they are not conjugated as is the case with flavonoids involved in this

143
investigation and that the hydroxyl groups in Ring B are easily oxidizable as it is
more basic than those in ring A. Since compound 10 and 11 are the only compounds
which have hydroxyl groups in ring B. For compound 11, we can assume that peak 1
at lower potential of 83 mV, is due to the hydroxyl on ring B and the second peak at a
higher potential of 782 mV is due to the hydroxyl group on ring A [171-172].
Antioxidants can be oxidised on the surface of the electrode and the more powerful
the reducing agent the lower its positive oxidation potential. Deprotonation increases
the antioxidant action because during the reaction of the antioxidant the ionisation
potential lowers instead of the bond dissociation energy and this leads us to the
assumption that electron donation is important for antioxidant action. The oxidation
potential determines the ability of a compound to act as a reducing agent and thus to
function as an antioxidant and this depends on the chemical structure of the molecule
[20, 25]. This is the principle I will use to arrange the remainder of my compounds in
order from highest antioxidant activity to the lowest. The order would be as follows: 1
> 5 > 3 > 2 > 7 > 11 > 10 > 6. Antioxidants may show more than one peak if further
oxidations occur as in the case with square wave voltammograms of compounds 1, 2,
3, 5, 6, 7, 11 [25, 122, 169, 173]. Most flavanoids showed an obvious oxidation peak
with square wave voltammetry between 15 mV to 122 mV for the first oxidation
peak. The oxidation potential of flavonoids depended on the structure of flavonoids
were flavanoids with two hydroxyl groups had the lowest oxidation potential than
those with acetoxy groups. For most flavanoids there was a decrease in current of the
second and third oxidation peaks and this maybe attributed to increase in
concentration which results in adsorption of flavonoid to the electrode surface,
blocking the surface after each scan [111]. Calibration of all 11 compounds (R2 >

144
0.5117) was carried out. Of the 11 compounds, seven were successful calibrated at
two oxidation potentials (R2 > 0.9200). The calibration curve also gave information
on the optimum oxidation potential suitable at certain concentrations.

145
Chapter 6
CONCLUSION
The intake of flavonoid-containing foods is beneficial to assist your body to combat
the effect of free radicals in our bodies. In this study, the tested natural flavanoids are
commonly found in plants, the flavanoids belonged to the sub classes of flavanones,
flavones and chalcones. The data presented shows that the electrochemical
characteristics of flavanoids may play an important role in their antioxidant activity
and hence cyclic voltammetry and square wave voltammetry were used for the
screening of the flavanoid antioxidant activity and for the estimation of the
antioxidant activity of flavanoid containing plants. Column chromatography (CC),
thin layer chromatography (TLC) and preparative layer chromatography (PLC) were
successfully applied to isolate the 6 natural flavanoids namely, 1-(2,4-
dihydroxyphenyl)-3-phenyl propan-1-one (1); 2,3-dihydro-5,7-dihydroxy-2-phenyl-
4H-1-benzopyran-4-one (2); 2,3-dihydro-5,7-dihydroxy-2-(2’-methoxyphenyl)-4H-1-
benzopyran-4-one (3); 1-(2’,4’-dihydroxyphenyl)-3-phenyl-2-propen-1-one (5); 2,3-
dihydro-5-hydroxy-2-(4’-hydroxy-3’-methoxyphenyl)-7-methoxy-4H-1-benzopyran-
4-one (10); 2,3-dihydro-5-hydroxy-2-(4’-hydroxyphenyl)-7-methoxy-4H-1-
benzopyran-4-one (11) which are all known compounds. The structures of the above
flavanoids were determined using proton and carbon nuclear magnetic resonance
spectroscopy. The separation of compounds 2,3-dihydro-5,7-dihydroxy-2-(2’-
methoxyphenyl)-4H-1-benzopyran-4-one (3) and 1-(2’,4’-dihydroxyphenyl)-3-
phenyl-2-propen-1-one (5) gave a little difficulty during separation. A special mixture
of EtOAc: hexane: CH2Cl2 in the ratio of 70: 30: 45 was discovered, it was this
mixture of compounds that allowed successful separation of the two compounds after
multiple re-runs using preparative layer chromatography (PLC). Of the five

146
synthesized compounds, 1-(2’,4’-diacetoxyphenyl)-3-phenyl-2-propen-1-one (4); 2,3-
dihydro-7-hydroxy-2-phenyl-4H-1-Benzopyran-4-one (7) and 5,7-(diacetoxy)-2,3-
dihydro-2-phenyl-4H-1-benzopyran-4-one (8) were known but not extensively
studied. Compounds, 5-acetoxy-2,3-dihydro-7-hydroxy-2-(2’-methoxyphenyl)-4H-1-
Benzopyran-4-one (6) and 5,7-(diacetoxy)-2,3-dihydro-2-(2’-methoxyphenyl)-4H-1-
benzopyran-4-one (9) are novel compounds which have not been studied in literature.
From all the eleven compounds studied only compounds 2, 7 and 10 have been
studied electrochemically.
6.1.Determination of antioxidant activity
Many methods have been developed to study the antioxidant activity of flavanoids. In
general the antioxidant activity of flavanoids is related to its ability to donate
electrons to free radicals and this is shown by its redox potentials. The mid point
potentials (E½) of the flavanoids were determined by cyclic and square wave
voltammetry. When using cyclic voltammetry, some flavanoids were irreversibly
oxidized, adsorption together with kinetic reaction lead to a change in cyclic
voltammograms. In the case of square wave voltammetry due to the fast analysis time,
a better current response was observed and therefore less interference was expected
on the electrode process as compared to cyclic voltammetry. Hence the data from the
square wave voltammograms was used to plot the linear regression graphs to relate
current to concentration. CV and SWV have advantages because they require small
amounts of sample, are easy to operate and have short analysis time as compared to
other methods. These advantages made this the best method to screen flavanoids in
plant extracts and to estimate the antioxidant activity of natural compounds. For
flavonoids studied there was a range of oxidation potentials from the easiest to

147
oxidize at – 85 mV for compound 9 to the most difficult to oxidize at 1112 mV for
compound 7. It was evident that there are differences in oxidation potential for
flavonoids having different structures. Flavonoids with oxidation potentials between
200 mV and 100 mV belong are considered moderate antioxidants and it is to this
group that my compounds belong. An understanding of redox potentials of functional
groups will allow us to improve the properties of new synthesized compounds.
6.2.Relationship between antioxidant activity and structure
Many researchers have tried to establish the relationship between flavonoid structure
and antioxidant activity, i.e. the structure – antioxidant relationship of quercitin has
been established and it showed that the ortho – dihydroxy groups of ring B were the
most important for the antioxidant activity of this compound.
In this study, the important determinants of antioxidants flavanoids are the presence
and number of hydroxyl groups as seen from the arrangement of compounds
according to oxidation potential from the one with the lowest oxidation potential
which would be the strongest antioxidant, i.e. compound 1 namely, 1-(2’,4’-
dihydroxyphenyl)-3-phenyl propan-1-one (1), which has two hydroxyl groups, a
carbonyl and an open chain joining the A and B ring. While the compound with the
highest oxidation potential which would be the weakest antioxidant , i.e. compound 6,
namely, 5-acetoxy-2,3-dihydro-7-hydroxy-2-(2’-methoxyphenyl)-4H-1-Benzopyran-
4-one (6), has only one hydroxyl group, a 4 – oxo group and a closed C – ring. The
open chain allows ease of delocalization of electrons across the molecule and this
contributes to the stability of the products formed hence the irreversibility as seen for
the second oxidation peak compound 1. The opposite occurs with compound 7, the 7
– hydroxy flavone which has the highest oxidation potential than compound 1 making

148
it a weaker antioxidant than compound 1. Due to the closed C – ring in compound 7
electron delocalization does not occur easily due to instability of the products formed,
hence the reversibility of the second oxidation peak of compound 7. Flavanoids with a
close ring that do not contain of ortho – dihydroxy groups in the B – ring or a 3 –
hydroxyl group will have lower antioxidant activity than chalcones with an open
chain joining the rings A and B and this will influence the ability of the compound to
donate an electron. Compounds 1, 5, 3 and 2 have the strongest antioxidant activity
because of the presence of two hydroxyl groups in those compounds as oppose to
compound 7, 6, 10 and 11 which have a lower antioxidant activity than the first group
as they only have one hydroxyl group. Compounds 4, 8 and 9 are assumed to have
little or no antioxidant activity due of absence of hydroxyl groups which can behave
as electron donors although compound 9, namely 5,7-(diacetoxy)-2,3-dihydro-2-(2’-
methoxyphenyl)-4H-1-benzopyran-4-one (9), has the lowest oxidation potential of -85
mV, it is the low positive potentials that are important for the analysis of antioxidant
activity of flavonoids.

149
REFERENCES
1. Yang, B., Kotani, A., Arai,K., and Kusu, F., Estimation of antioxidant
activities of flavonoids from their oxidation potentials. Analytical sciences,
2001. 17.(5): p. 599-604.
2. Pietta, P., Simonetti P., Gardana C., and Mauri P., Trolox equivalent
antioxidant capacity (TEAC) of Ginkgo biloba flavonol and Camellia sinensis
catechin metabolites. Journal of Pharmaceutical and Biomedical Analysis,
2000. 23(1): p. 223-226.
3. Salah, N., Miller, N.J., Paganga, G., Tijburg, L., Bolwell, G.P. and Rice-
Evans, C., Polyphenolic Flavanols as Scavengers of Aqueous Phase Radicals
and as Chain-Breaking Antioxidants. Archives of Biochemistry and
Biophysics, 1995. 322(2): p. 339-346.
4. Ng, T.B., Liu, F. and Wang, Z.T., Antioxidative activity of natural products
from plants. Life Sciences, 2000. 66(8): p. 709-723.
5. Van Acker, S.A.B.E., van den Berg, D.J., Tromp, M.N., Griffioen, D.H., van
Bennekom, W.P., van der Vijgh, W.J., and Bast, A., Structural aspects of
antioxidant activity of flavonoids. Free Radical Biology and Medicine, 1996.
20(3): p. 331-342.
6. http://www.friedli.com/herbs/phytochem/flavonoids.html.
7. Peng, Z.F., Strack, D., Baumert, A., Subramaniam, R., Goh, N.K., Chia, T.F.,
Tan, S.N., and Chia, L.S., Phytochemistry, 2003. 62(2):219-28., Antioxidant
flavonoids from leaves of Polygonum hydropiper L. Phytochemistry. 2003,
62(2): p. 219-928.

150
8. Yamamura, S.; Ozawa, K.; Ohtani, K.; Kasai, R.; and Yamasaki, K.,
Antihistaminic flavones and aliphatic glycosides from Mentha spicata.
Phytochemistry. 1998. 48(1): p. 131-136.
9. Du, J., He, Z.D., Jiang, R.W., Ye, W.C., Xu, H.X., and But, P.P., Antiviral
flavonoids from the root bark of Morus alba L. Phytochemistry, 2003. 62(8):
p. 1235-1238.
10. Karakaya, S. and Nehir El, S., Quercetin, luteolin, apigenin and kaempferol
contents of some foods. Food Chemistry, 1999. 66(3): p. 289-292.
11. Lim, C.F., Loidl, N.M., Kennedy, J.A., Topliss, D.J., and Stokigt, J.R., Effect
of loop diuretics and nonsteroidal antiinflammatory drugs on thyrotropin
release by rat anterior pituitary cells in vitro. Metabolism, 1995. 44(8): p.
1008-1012.
12. http://ezinearticles.com/?Nutrition---Learn-Why-Flavonoid-Rich-Foods-
Should-Be-Part-of-Your-Daily-Food-Menu&id=3728509.
13. http://en.wikipedia.org/wiki/Radical_(chemistry).
14. http://www.google.co.za/imgres?imgurl=http://shop.goji.co.za/UserFiles/
Image/freeradicals.jpg&imgrefurl=http://shop.goji.co.za/custom.aspx%3Fid%
3D2&usg.
15. Heim, K.E., Tagliaferro, A.R.and Bobilya, D.J., Flavonoid antioxidants:
chemistry, metabolism and structure-activity relationships. The Journal of
Nutritional Biochemistry, 2002. 13(10): p. 572-584.
16. Rice-Evans, C.A., N.J. Miller, and Paganga, G., Structure-antioxidant activity
relationships of flavonoids and phenolic acids. Free Radical Biology and
Medicine, 1996. 20(7): p. 933-956.

151
17. Van Acker, S.A.B.E., van den Berg, D.J., Tromp, M.N., Griffioen, D.H., van
Bennekom, W.P., van der Vijgh, W.J., and Bast, A., Structural aspects of
antioxidant activity of flavonoids. Free Radical Biology and Medicine, 1996.
20(3): p. 331-342.
18. http://www.google.co.za/imgres?imgurl=http://www.knowabouthealth.com/wp-
content/uploads/2009/08/antioxidant_diag.gif&imgrefurl=http://www.knowab.
19. Harborne, J.B. and Williams, C.A., Advances in flavonoid research since
1992. Phytochemistry, 2000. 55(6): p. 481-504.
20. Janeiro, P., and Brett, A.M.O., Catechin electrochemical oxidation
mechanisms. Analytica Chimica Acta, 2004. 518(2): p. 109-115.
21. Long, L.H., Evans, P.J., and Halliwell, B., Hydrogen Peroxide in Human
Urine: Implications for Antioxidant Defense and Redox Regulation.
Biochemical and Biophysical Research Communications, 1999. 262(3): p.
605-609.
22. Pereira, T.A., and Das, N.P., The effects of flavonoids on the thermal
autoxidation of palm oil and other vegetable oils determined by differential
scanning calorimetry. Thermochimica Acta, 1990. 165(1): p. 129-137.
23. Spencer, J.P.E., Schroeter, H., Crossthwaithe, A.J., Kuhnle, G., Williams, R.J.,
and Rice-Evans, C., Contrasting influences of glucuronidation and O-
methylation of epicatechin on hydrogen peroxide-induced cell death in
neurons and fibroblasts. Free Radical Biology and Medicine, 2001. 31(9): p.
1139-1146.
24. Havsteen, B., Flavonoids, a class of natural products of high pharmacological
potency. Biochemical Pharmacology, 1983. 32(7): p. 1141-1148.

152
25. Kilmartin, P.A., and Wright, G.A., Photoeffects to characterise polypyrrole
electrodes and bilayers with polyaniline. Electrochimica Acta, 2001. 46(18):
p. 2787-2794.
26. http://en.wikipedia.org/wiki/Herbalism.
27. Gurib-Fakim, A., Medicinal plants: Traditions of yesterday and drugs of
tomorrow. Molecular Aspects of Medicine, 2006. 27(1): p. 1-93.
28. Phillipson, J.D., Phytochemistry and medicinal plants. Phytochemistry, 2001.
56(3): p. 237-243.
29. Brandão, M.G.L., Antimalarial activity of extracts and fractions from Bidens
pilosa and other Bidens species (Asteraceae) correlated with the presence of
acetylene and flavonoid compounds. Journal of Ethnopharmacology, 1997.
57(2): p. 131-138.
30. Bracke, M.E., Castronovo, V., Van Cauwenberge, R.M., Coopman, P.,
Vakaet, L. Jr., Strojny, P., Foidart, J.M., and Mareel, M.M., The anti-invasive
flavonoid (+)-catechin binds to laminin and abrogates the effect of laminin on
cell morphology and adhesion. Experimental Cell Research, 1987. 173(1): p.
193-205.
31. http://bank-ic.de/en/zellen-e.html.
32. McGaw, L.J., Lall, N., Meyer, J.J., and Eloff, J.N., The potential of South
African plants against Mycobacterium infections. Journal of
Ethnopharmacology, 2008. 119(3): p. 482-500.
33. Anderson, P.M.L., Hoffmann M.T., and O'Farrell, P.J., Above ground
perennial plant biomass across an altitudinal and land-use gradient in
Namaqualand, South Africa. South African Journal of Botany, 2010. 76(3): p.
471-481.

153
34. Rutherford, M.C., and Powrie, L.W., Severely degraded rangeland:
Implications for plant diversity from a case study in Succulent Karoo, South
Africa. Journal of Arid Environments, 2010. 74(6): p. 692-701.
35. Desmet, P.G. and Cowling, R.M., Patch creation by fossorial rodents: a key
process in the revegetation of phytotoxic arid soils. Journal of Arid
Environments, 1999. 43(1): p. 35-45.
36. Francis, M.L., Fey, M.V., Prinsloo, H.P., Ellis, F., Mills, A.J., and Medinski,
T,V., Soils of Namaqualand: Compensations for aridity. Journal of Arid
Environments, 2007. 70(4): p. 588-603.
37. Botha, M.S., Carrick, P.J., and Allsopp, N., Capturing lessons from land-users
to aid the development of ecological restoration guidelines for lowland
Namaqualand. Biological Conservation, 2008. 141(4): p. 885-895.
38. http://www.google.co.za/imgres?imgurl=http://www.whalewatching.
co.za/images/namaqualandmap.gif.
39. http://plants.jstor.org/flora/floc004655.
40. http://www.google.co.za/imgres?imgurl=http://www.up.ac.za/
dspace/bitstream/2263/8535/2/toxp_206.JPG
41. Vries, F.A, Green, I.R., Klaasen, J.A., Mabusela, W.T., Bodo, B., and
Johnson, Q., An antifungal active extract from the aerial parts of Galenia
africana. 11th NAPRECA Symposium Book of Proceedings, Antananarivo,
Madagascar, 2001: p. 123-131.
42. http://www.plantzafrica.com/plantefg/elytrorhino.htm.
43. Levyns, M.R., A revision of Elytropappus Cass. ournal of South African
Botany, 1935. 1: p. 89-103.

154
44. http://www.google.co.za/imgres?imgurl=http://sophy.u-3mrs.fr/Afriqsud/
PhotocpAFS/E/Elytropappus_rhinocerotis___03_09_2008_2.JPG
45. Rodriguez, R.J., Miranda, C.L., Stevens, J.F., Deinzer, M.L., Buhler, D.R.,
Influence of prenylated and non-prenylated flavonoids on liver microsomal
lipid peroxidation and oxidative injury in rat hepatocytes. Food and Chemical
Toxicology, 2001. 39(5): p. 437-445.
46. Dziedzic, S.Z., and Hudson, B.J.F., Hydroxy isoflavones as antioxidants for
edible oils. Food Chemistry, 1983. 11(3): p. 161-166.
47. Barron, D., and Ibrahim, R.K, Isophenylated flavonoids. A survey.
Phytochemistry, 1996. 43(5): p. 921-982.
48. Edenharder, R., and Tang, X., Inhibition of the mutagenicity of 2-
nitrofluorene, 3-nitrofluoranthene and 1-nitropyrene by flavonoids,
coumarins, quinones and other phenolic compounds. Food and Chemical
Toxicology. 35(3-4): p. 357-372.
49. De la Rocha, N., María, A.O., Gianello, J.C., and Pelzer, L., Cytoprotective
effects of chalcones from Zuccagnia punctata and melatonin on the
gastroduodenal tract in rats. Pharmacological Research, 2003. 48(1): p. 97-
99.
50. Uchiumi, F., Transcriptional suppression of the HIV promoter by natural
compounds. Antiviral Research, 2003. 58(1): p. 89-98.
51. Wu, J.H., Wang, X.H., Yi, Y.H., and Lee, K.H., Anti-AIDS agents 54. A potent
anti-HIV chalcone and flavonoids from genus Desmos. Bioorganic &
Medicinal Chemistry Letters, 2003. 13(10): p. 1813-1815.

155
52. Nerya, O., Musa, R., Khatib, S., Tamir, S., and Vaya, J., Chalcones as potent
tyrosinase inhibitors: the effect of hydroxyl positions and numbers.
Phytochemistry, 2004. 65(10): p. 1389-1395.
53. Canesi, L., Canesi, L., Lorusso, L.C., Ciacci, C., Betti, M., Zampini, M., and
Gallo, G., Environmental estrogens can affect the function of mussel
hemocytes through rapid modulation of kinase pathways. General and
Comparative Endocrinology, 2004. 138(1): p. 58-69.
54. Zampini, I.C., Vattuone, M.A., and Isla, M.I., Antibacterial activity of
Zuccagnia punctata Cav. ethanolic extracts. Journal of Ethnopharmacology,
2005. 102(3): p. 450-456.
55. Nowakowska, Z., A review of anti-infective and anti-inflammatory chalcones.
European Journal of Medicinal Chemistry, 2007. 42(2): p. 125-137.
56. Dobashi, Y., Hirano, T., Hirano, M., and Ohkatsu, Y., Antioxidant and photo-
antioxidant abilities of catechins. Journal of Photochemistry and Photobiology
A: Chemistry, 2008. 197(2-3): p. 141-148.
57. Zampini, I.C., Villarini, M., Moretti, M., Dominici, L., and Isla, M.I.,
Evaluation of genotoxic and antigenotoxic effects of hydroalcoholic extracts of
Zuccagnia punctata Cav. Journal of Ethnopharmacology, 2008. 115(2): p.
330-335.
58. Zhang, Y., and Huang, KK., On the interactions of hydrated metal cations
(Mg2+, Mn2+, Ni2+, Zn2+) with guanine-cytosine Watson-Crick and guanine-
guanine reverse-Hoogsteen DNA base pairs. Journal of Molecular Structure:
Theochem, 2007. 812(1-3): p. 51-62.
156
59. Zhang, Y., Chen, J., Ma, X.M., and Shi, Y.P., Simultaneous determination of
flavonoids in Ixeridium gracile by micellar electrokinetic chromatography.
Journal of Pharmaceutical and Biomedical Analysis, 2007. 45: p. 742-746.
60. Kumar Gupta, D., Krishnamurti, M., and Parthasarathi, L., Purpurin, a new
flavanone from Tephrosia purpurea seeds. Phytochemistry, 1980. 19(6): p.
1264-1264.
61. Rao, E.V., Murthy, M.S.R., and Ward, R.S., Nine isoflavones from Tephrosia
maxima. Phytochemistry, 1984. 23(7): p. 1493-1501.
62. Havsteen, B.H., The biochemistry and medical significance of the flavonoids.
Pharmacology & Therapeutics, 2002. 96: p. 67-202.
63. Cody, V., Computer graphic modelling in rug design: conformational analysis
of dihydrofolate reductase inhibitors. Journal of Molecular Graphics, 1986.
4(1): p. 69-73.
64. Saitô, N., Ôsawa,Y., and Hayashi, K., Platyconin, a new acylated anthocyanin
in Chinese bell-flower, Platycodon grandiflorum. Phytochemistry, 1971.
10(2): p. 445-447.
65. Shiono, M., Matsugaki, N., and Takeda, K., Structure of commelinin, a blue
complex pigmentfrom the blue flowers of Commelina communis. Proc. Jpn.
Acad Phys Biol Scie. 2008, 84(10): p. 452-456.
66. Yoshida, K., Kondo, T., and Goto, T., Intramolecular stacking conformation
of gentiodelphin, a diacylated anthocyanin from Gentiana makinoi.
Tetrahedron, 1992. 48(21): p. 4313-4326.
67. Mori, M., Kondo, T., and Yoshida, K., Cyanosalvianin, a supramolecular blue
metalloanthocyanin, from petals of Salvia uliginosa. Phytochemistry, 2008.
69(18): p. 3151-3158.

157
68. Takeda, K., Harborne, J.B., and Waterman, P.G., Malonylated flavonoids and
blue flower colour in lupin. Phytochemistry, 1993. 34(2): p. 421-423.
69. Basu-Modak, S., Gordon, M.J., Dobson, L.H., Spencer, J.P., Rice-Evans, C.,
and Tyrrell, R.M., Epicatechin and its methylated metabolite attenuate UVA-
induced oxidative damage to human skin fibroblasts. Free Radical Biology
and Medicine, 2003. 35(8): p. 910-921.
70. http://en.wikipedia.org/wiki/Ultraviolet.
71. Hao, X., Hale, B.A., Ormrod, D.P., and Papadopoulos, A.P., Effects of pre-
exposure to ultraviolet-B radiation on responses of tomato (Lycopersicon
esculentum cv. New Yorker) to ozone in ambient and elevated carbon dioxide.
Environmental Pollution, 2000. 110(2): p. 217-224.
72. Cartwright, H.N., Baucom, C., Singh, P., Smith, K.L., and Stapleton, A.E.,
Intraspecific comparisons reveal differences in the pattern of ultraviolet
radiation responses in four maize (Zea mays L.) varieties. Journal of
Photochemistry and Photobiology B: Biology, 2001. 62(1-2): p. 88-96.
73. Walenzyk, T., Carola, C., Buchholz, H., and König, B., Chromone derivatives
which bind to human hair. Tetrahedron, 2005. 61(31): p. 7366-7377.
74. Cuadra, P., Harborne, J.B., and Waterman, P.G., Increases in surface
flavonols and photosynthetic pigments in Gnaphalium luteo-album in response
to UV-B radiation. Phytochemistry, 1997. 45(7): p. 1377-1383.
75. Gitz Iii, D.C., Liu, L., and McClure, J.W., Phenolic metabolism, growth, and
uv-b tolerance in phenylalanine ammonia-lyase-inhibited red cabbage
seedlings. Phytochemistry, 1998. 49(2): p. 377-386.

158
76. Valko, M., Rhodes, C.J.,Moncol, J.,Izakovic, M., and Mazur, M., Free
radicals, metals and antioxidants in oxidative stress-induced cancer.
Chemico-Biological Interactions, 2006. 160(1): p. 1-40.
77. Kuppusamy, U.R., Khoo, H.E., and Das, N.P., Structure-activity studies of
flavonoids as inhibitors of hyaluronidase. Biochemical Pharmacology, 1990.
40(2): p. 397-401.
78. Frankel, E.N., Waterhouse, A.L., and Kinsella, J.E., Inhibition of human LDL
oxidation by resveratrol. The Lancet, 1993. 341(8852): p. 1103-1104.
79. Sri Kantha, S., Matsumura, H., Kubo, E., Kawase, K., Takahata, R., Serhan,
C.N., and Hayaishi, O., Effects of prostaglandin D2, lipoxins and leukotrienes
on sleep and brain temperature of rats. Prostaglandins, Leukotrienes and
Essential Fatty Acids, 1994. 51(2): p. 87-93.
80. Samuelsson, B., Borgeat, P., Hammarstrom, S., and Murphy, R.C.,
Introduction of a nomenclature: Leukotrienes. Prostaglandins, 1979. 17(6): p.
785-787.
81. Barnes, P.J., Anti-leukotrienes: the promise for asthma?: Novel Inhibitors of
Leukotrienes [Series: Progress in Inflammation Research (edited by Michael
J. Parnham)] edited by G. Folco, B. Samuelsson and R.C. Murphy. Trends in
Pharmacological Sciences, 2000. 21(5): p. 194-194.
82. German, J.B., Lokesh, B., and Kinsella, J.E., The effect of dietary fish oils on
eicosanoid biosynthesis in peritoneal macrophages is influenced by both
dietary n-6 polyunsaturated fats and total dietary fat. Prostaglandins,
Leukotrienes and Essential Fatty Acids, 1988. 34(1): p. 37-45.

159
83. Higgs, G.A. and Salmon, G.A., Cyclo-oxygenase products in carrageenin-
induced inflammation. Prostaglandins, 1979. 17(5): p. 737-746.
84. Higgs, E.A., Moncada, S., and Vane, J.R., Prostaglandins and thromboxanes
from fatty acids. Progress in Lipid Research, 1986. 25: p. 5-11.
85. Hamel, R., and Ford-Hutchinson, A.W., Leukotriene A4-induced
bronchoconstriction in the guinea pig. Prostaglandins, 1985. 30(6): p. 935-
947.
86. http://themedicalbiochemistrypage.org/eicosanoids.html.
87. Harborne, J.B., Journal of Chemical Ecology : ed. by R. M. Silverstein and J.
B. Simeone, Vol. I, No. 1, January 1975. Phytochemistry, 1976. 15(1): p. 245-
245.
88. Bors, W., Heller, W., Michel, C., and Saran, M., Flavonoids as antioxidants:
Determination of radical-scavenging efficiencies, in Methods in Enzymology,
A.N.G. Lester Packer, Editor. 1990, Academic Press. p. 343-355.
89. Alcaraz, L.E., Blanco, S.E., Puig, O.N., Tomas, F., and Ferretti, F.H.,
Antibacterial Activity of Flavonoids Against Methicillin-resistant
Staphylococcus aureus strains. Journal of Theoretical Biology, 2000. 205(2):
p. 231-240.
90. Ono, K., Nakane, H., Fukushima, M., Chermann, J.C., and Barre-Sinoussi, F.,
Differential inhibition of the activities of reverse transcriptase and various
cellular DNA polymerases by a traditional Kampo drug, Sho-saiko-to.
Biomedecine & Pharmacotherapy, 1990. 44(1): p. 13-16.

160
91. Hendrich, A.B., Flavonoid-membrane interactions: possible consequences for
biological effects of some polyphenolic compounds. Acta Pharmacologica
Sinica, 2006. 27(1): p. 27-40.
92. Movileanu, L., Neagoe, I., and Flonta, M.L., Interaction of the antioxidant
flavonoid quercetin with planar lipid bilayers. International Journal of
Pharmaceutics, 2000. 205(1-2): p. 135-146.
93. Kobiler, I., Prusky, D., Midland, S., Sims, J.J., and Keen, N.T.,
Compartmentation of antifungal compounds in oil cells of avocado fruit
mesocarp and its effect on susceptibility to Colletotrichum gloeosporioides.
Physiological and Molecular Plant Pathology, 1993. 43(5): p. 319-328.
94. Laks, P.E., and Pruner, M.S., Flavonoid biocides: Structure/activity relations
of flavonoid phytoalexin analogues. Phytochemistry, 1989. 28(1): p. 87-91.
95. Ares, J.J., Outt, P.E., Randall, J.L., Johnston, J.N., Murray, P.D., O'Brien,
L.M., Weisshaar, P.S., and Ems, B.L., Synthesis and biological evaluation of
flavonoids and related compounds as gastroprotective agents. Bioorganic &
Medicinal Chemistry Letters, 1996. 6(8): p. 995-998.
96. Loa, J., Chow, P., and Zhang, K., Studies of structure–activity relationship on
plant polyphenol-induced suppression of human liver cancer cells. Cancer
Chemother Pharmacol, 2009. 63.(6): p. 1007-1016.
97. Hodnick, W.F., Duval, D.L., and Pardini, R.S., Inhibition of mitochondrial
respiration and cyanide-stimulated generation of reactive oxygen species by
selected flavonoids. Biochemical Pharmacology, 1994. 47(3): p. 573-580.

161
98. De Rijke, E., Out, P., Niessen, W.M.A., Ariese, F.,Goiijer, C., and Brinkman,
U.A.T., Analytical separation and detection methods for flavonoids. Journal of
Chromatography A, 2006. 1112(1-2): p. 31-63.
99. Hendrickson, H.P., Sahafayen, M., Bell, M.A., Kaufman, A.D., Hadwiger,
M.E., and Lunte, C.E., Relationship of flavonoid oxidation potential and effect
on rat hepatic microsomal metabolism of benzene and phenol. Journal of
Pharmaceutical and Biomedical Analysis, 1994. 12(3): p. 335-341.
100. Pyrzynska, K., and Biesaga, M., Analysis of phenolic acids and flavonoids in
honey. TrAC Trends in Analytical Chemistry, 2009. 28(7): p. 893-902.
101. Sousa, F., Guebitz, G.M., and Kokol, V., Antimicrobial and antioxidant
properties of chitosan enzymatically functionalized with flavonoids. Process
Biochemistry, 2009. 44(7): p. 749-756.
102. Makhotkina, O. and Kilmartin, P.A., Uncovering the influence of antioxidants
on polyphenol oxidation in wines using an electrochemical method: Cyclic
voltammetry. Journal of Electroanalytical Chemistry, 2009. 633(1): p. 165-
174.
103. Martinez, S., Valek, L., Petrovic, Z., Metikos-Hukovic, M., and Piljac, J.,
Catechin antioxidant action at various pH studied by cyclic voltammetry and
PM3 semi-empirical calculations. Journal of Electroanalytical Chemistry,
2005. 584(2): p. 92-99.
104. Piljac-Zegarac, J., Valek, L., Martinez, S., and Belscak, A., Fluctuations in the
phenolic content and antioxidant capacity of dark fruit juices in refrigerated
storage. Food Chemistry, 2009. 113(2): p. 394-400.

162
105. Piljac-Zegarac, J., Valek, L., Stipcevic, T., and Martinez, S., Electrochemical
determination of antioxidant capacity of fruit tea infusions. Food Chemistry,
2010. 121(3): p. 820-825.
106. Oliveira-Brett, A.M., Diculescu, V., and Piedade, J.A.P., Electrochemical
oxidation mechanism of guanine and adenine using a glassy carbon
microelectrode. Bioelectrochemistry, 2002. 55(1-2): p. 61-62.
107. Brett, C.M.A., Oliveira Brett, A.M., and Serrano, S.H.P., On the adsorption
and electrochemical oxidation of DNA at glassy carbon electrodes. Journal of
Electroanalytical Chemistry, 1994. 366(1-2): p. 225-231.
108. Diculescu, V.C., Kumbhat, S., and Oliveira-Brett, A.M., Electrochemical
behaviour of isatin at a glassy carbon electrode. Analytica Chimica Acta,
2006. 575(2): p. 190-197.
109. Diculescu, V.C., Piedade, J.A.P., and Oliveira-Brett, A.M., Electrochemical
behaviour of 2,8-dihydroxyadenine at a glassy carbon electrode.
Bioelectrochemistry, 2007. 70(1): p. 141-146.
110. Ghalkhani, M., Fernandes, I.P., Oliveira, S.C., Shahrokhian, S., and Oliveira-
Brett, A.M., Anodic behaviour of clioquinol at a glassy carbon electrode.
Bioelectrochemistry. In Press, Accepted Manuscript.2010.
111. Janeiro, P. and Oliveira Brett, A.M., Catechin electrochemical oxidation
mechanisms. Analytica Chimica Acta, 2004. 518(1-2): p. 109-115.
112. Manuela Garrido, E.,Costa-Lima, J.L., Delerue-Matos, M.C., and Oliveira-
Brett, A.M., Electrochemical oxidation of bentazon at a glassy carbon
electrode: Application to the determination of a commercial herbicide.
Talanta, 1998. 46(5): p. 1131-1135.

163
113. Oliveira Brett, A.M., Macedo, T.R.A., Raimundo, D., Marques, M.H., and
Serrano, S.H.P., Electrochemical oxidation of mitoxantrone at a glassy carbon
electrode. Analytica Chimica Acta, 1999. 385(1-3): p. 401-408.
114. Oliveira Brett, A.M. and Matysik, F.M., Voltammetric and sonovoltammetric
studies on the oxidation of thymine and cytosine at a glassy carbon electrode.
Journal of Electroanalytical Chemistry, 1997. 429(1-2): p. 95-99.
115. Rebelo, I., Piedade, J.A.P., and Oliveira Brett, A.M., Electrochemical
determination of 8-oxoguanine in the presence of uric acid.
Bioelectrochemistry, 2004. 63(1-2): p. 267-270.
116. Airado-Rodríguez, D., Galeano-Diaz, T., and Durán-Merás, I., Determination
of trans-resveratrol in red wine by adsorptive stripping square-wave
voltammetry with medium exchange. Food Chemistry, 2010. 122 (4): p. 1320-
1326.
117. Hodek, P., Hanustiak, P., Krizkova, J., Mikelova, R., Krizkova, S., Stiborova,
M., Trnkova, L., Horna, L., Beklova, M., and Kizek, R., Toxicological aspects
of flavonoid interaction with biomacromolecules. Neuroendocrinol Lett, 2006.
27: p. 14-17.
118. Korbut, O., Buckova, P., Tarapcik, P., Labuda, J., and Grundler, P., Damage
to DNA indicated by an electrically heated DNA-modified carbon paste
electrode. Journal of Electroanalytical Chemistry, 2001. 506(2): p. 143-148.
119. Maoela, M.S.,Arotiba, O.A., Baker, P.G.L., Mabusela, W.T., Jahed, N.,
Iwuoha, E.I., and Songa, E.A., Electroanalytical Determination of Catechin
Flavonoid in EthylAcetate Extracts of Medicinal Plants. Int. J. Electrochem.
Sci., 2009. 4: p. 1497-1510.

164
120. Vaya, J., Mahmood, S., Goldblum, A., Aviram, A., Volkova, N., Shaalan, A.,
Musa, R., and Tamir, S., Inhibition of LDL oxidation by flavonoids in relation
to their structure and calculated enthalpy. Phytochemistry, 2003. 62(1): p. 89-
99.
121. Hotta, H.,Sakamoto, H., Nagano, S., Osakai, T., and Tsujino, Y., Unusually
large numbers of electrons for the oxidation of polyphenolic antioxidants.
Biochimica et Biophysica Acta (BBA) - General Subjects, 2001. 1526(2): p.
159-167.
122. Chevion, S., Roberts, M.A., and Chevion, M.,The use of cyclic voltammetry
for the evaluation of antioxidant capacity. Free Radical Biology and Medicine,
2000. 28(6): p. 860-870.
123. Tanrisever, N., Fronczek, F.R., Fischer, N.H., and Williamson, G.B.,
Ceratiolin and other flavonoids from Ceratiola ericoides. Phytochemistry,
1986. 26(1): p. 175-179.
124. Adityachaudhury, N., Aurentiacin, a new chalcone from Didymocarpus
aurentiaca. Phytochemistry, 1976. 15(1): p. 229-230.
125. Gregoris, E., and Stevanato, R., Correlations between polyphenolic
composition and antioxidant activity of Venetian propolis. Food and Chemical
Toxicology, 2010. 48(1): p. 76-82.
126. Falcão S.I., Vilas-Boas, M., Barros, C., Domingues, R.M., and Cardoso, S.M.,
Phenolic characterization of Northeast Portuguese propolis: usual and
unusual compounds. Anal Bioanal Chem, 2010. 396 (2): p. 887-897.
127. Narender, T., Papi Reddy, R., and Kumar, B., BF3·OEt2 mediated
regioselective deacetylation of polyacetoxyacetophenones and its application

165
in the synthesis of natural products. Tetrahedron Letters, 2008. 49(28): p.
4409-4415.
128. Rotelli, A.E., Guardia, T., Juarez, A.O., De la rocha, N.E., and Pelzer, L.E.,
Comparative study of flavonoids in experimental models of inflammation.
Pharmacological Research, 2003. 48(6): p. 601-606.
129. Barrero, A.F., Sánchez, J.F., and Rodríguez, I., N-[Delta]13-
Docosenoylanthranilic acid and alkylresorcinols from Ononis natrix subsp.
Hispanica. Phytochemistry, 1990. 29(6): p. 1967-1969.
130. Bao-Ning Sua, E.J.P., Vigob, J.S., Grahama, J.G., Cabiesesb, F., Fonga,
H.H.S., Pezzutoa, J.M., and Kinghorna, A.D., Activity-guided isolation of the
chemical constituents of Muntingia calabura using a quinone reductase
induction assay. Phytochemistry, 2003. 63.(3): p. 335-341.
131. Roy, R. and Pandey, V.B., A chalcone glycoside from Clerodendron
phlomidis. Phytochemistry, 1994. 37(6): p. 1775-1776.
132. Lopes, N.P., Kato, M.J., and Yoshida, M., Antifungal constituents from roots
of Virolasurinamensis. Phytochemistry, 1999. 51(1): p. 29-33.
133. Braga de Oliveira, A., Fonseca e Silva, L.G., and Gottlieb, O.R., Flavonoids
and coumarins from Platymiscium praecox. Phytochemistry, 1972. 11(12): p.
3515-3519.
134. Yang, S. F., Yang, W.E., Kuo, W.H., Chang, H.R., Chu, S.C., and Hsieh, Y.S.,
Antimetastatic potentials of flavones on oral cancer cell via an inhibition of
matrix-degrading proteases. Archives of Oral Biology, 2008. 53(3): p. 287-
294.

166
135. Si-Ahmed, K., Tazerouti, F., Badjah-Hadj-Ahmed, A.J., Aturki, Z., D'Orazio,
G., Rocco, A., and Fanali, S., Optical isomer separation of flavanones and
flavanone glycosides by nano-liquid chromatography using a phenyl-
carbamate-propyl-[beta]-cyclodextrin chiral stationary phase. Journal of
Chromatography A, 2010. 1217(7): p. 1175-1182.
136. Del Rayo Camacho-Corona, M., De .Jesus Favela-Hernandez, J.M., González-
Santiago, O., Garza-González, E., Said-Fernández, S., Delgado, G., and Luna-
Herrerae, J., Evaluation of Some Plant-derived Secondary Metabolites Against
Sensitive and Multidrug-resistant Mycobacterium tuberculosis. J. Mex. Chem.
Soc., 2009. 53(2): p. 71-75.
137. Chen, J., Liu, Y., and Shi, Y.P., Determination of flavonoids in the flowers of
Paulownia tomentosa by high-performance liquid chromatography. Journal of
Analytical Chemistry, 2009. 64(3): p. 282-288.
138. Garo, E., Maillard, M., Antus, S., Mavi, S., and Hostettmann, K., Five flavans
from Mariscus psilostachys. Phytochemistry, 1996. 43(6): p. 1265-1269.
139. Hare, J.D., Seasonal variation in the leaf resin components of Mimulus
aurantiacus. Biochemical Systematics and Ecology, 2002. 30(8): p. 709-720.
140. Delaportea, D.H., Sarragiotto, M.H., Takemuraa, O.S., S´anchezc, G.M., and
Filhod, B.P.,Evaluation of the antioedematogenic, free radical scavenging and
antimicrobial activities of aerial parts of Tillandsia streptocarpa Baker –
Bromeliaceae. Journal of Ethnopharmacology, 2004. 95: p. 229-233.
141. Jinyoung, K., Chaewoon L., and Chong, Y., Synthesis of a Complete Series of
O-Methyl Analogues of Naringenin and Apigenin. Bull. Korean Chem. Soc.,
2007. 28(12).

167
142. Oyama, K., and Kondo, T., Total Synthesis of Flavocommelin, a Component of
the Blue Supramolecular Pigment from Commelina communis, on the Basis of
Direct 6-C-Glycosylation of Flavan. The Journal of Organic Chemistry, 2004.
69(16): p. 5240-5246.
143. Malakhova, N.A., Miroshnikova, E.G., Stojko, N,Y., and Brainina, K.Z.,
Long-lived sensors with replaceable surface for stripping voltammetric
analysis: part II. Analytica Chimica Acta, 2004. 516(1-2): p. 49-60.
144. De Andrade, D.F., Fernandes, D.R., and Miranda, J.L., Methods for the
determination of conjugated dienes in petroleum products: A review. Fuel,
2010. 89(8): p. 1796-1805.
145. http://en.wikipedia.org/wiki/Potentiostat.
146. Rezai, S. http://www.chem.ucla.edu/~bacher/CHEM174/equipment/CV1.html.
2003.
147. http://www.als-japan.com/1037.html.
148. http://en.wikipedia.org/wiki/Glassy_carbon.
149. Bard, A.J.F., Larry R, Electrochemical Methods: Fundamentals and
Applications. 2nd edition. 2000, Wiley.
150.http://www.google.co.za/imgres?imgurl=http://chemwiki.ucdavis.edu/%40api/de
ki/files/6146/%3Drefelect.gif.
151. Lower, S.K., Electrochemistry. Chemical reactions at an electrode, galvanic
and electrolytic cells.
152. http://en.wikipedia.org/wiki/Cyclic_voltammetry#cite_note-0.
153. http://www.abc.chemistry.bsu.by/vi//.
154. Lundquist, J.J.T. and Nicholson, R.S., Theory of the potential step-linear scan
electrolysis method with a comparison of rate constants determined

168
electrochemically and by classical methods. Journal of Electroanalytical
Chemistry, 1968. 16(4): p. 445-456.
155. Heinze, J., Störzbach, M., and Mortensen, J., Digital simulation of cyclic
voltammetric curves by the implicit Crank-Nicolson technique. Journal of
Electroanalytical Chemistry, 1984. 165(1-2): p. 61-70.
156. Jacobsen, N.E., NMR spectroscopy explained: simplified theory, aplications
and examples for organic and structural biology. 2007: Wiley -interscience.
157. http://www.offresonance.com/?p=9.
158. Hagerman, A.E., Riedl, K.M., Jones, G.A., Sovik, K.N., Ritchard,
N.T.,Hartzfeld, P.W., and Riechel, T.L., High Molecular Weight Plant
Polyphenolics (Tannins) as Biological Antioxidants. Journal of Agricultural
and Food Chemistry, 1998. 46(5): p. 1887-1892.
159. Vries, F.A., Green, I.R., Klaasen, J.A., Mabusela , W.T., Bodo B., and
Johnson, Q., An antifungal active extract from the aerial parts of Galenia
africana, in 11th NAPRECA Symposium Book of Proceedings, Antananarivo,
Madagascar. p. 123-131.
160. Ichino, K., Tanaka, H., and Ito, K., Two novel flavonoids from the leaves of
var. and. Tetrahedron, 1988. 44(11): p. 3251-3260.
161. Areche, C., San-Martin, A., Rovirosa, J., Soto-Delgado, J., and Contreras, R.,
An unusual halogenated meroditerpenoid from Stypopodium flabelliforme:
Studies by NMR spectroscopic and computational methods. Phytochemistry,
2009. 70(10): p. 1315-1320.
162. Yaw-Lung, H., Jim-Min, F., and Yu-Shia, C., Terpenoids and flavonoids from
Pseudotsuga wilsoniana. Phytochemistry, 1998. 47(5): p. 845-850.

169
163. Zhang, P., Feng, Z., and Wang, Y., Flavonoids, including an unusual
flavonoid-Mg2+ salt, from roots of Cudrania cochinchinensis.
Phytochemistry, 2005. 66(23): p. 2759-2765.
164. Vestergaard, M.d., Kerman, K., and Tamiya, E., An electrochemical approach
for detecting copper-chelating properties of flavonoids using disposable pencil
graphite electrodes: Possible implications in copper-mediated illnesses.
Analytica Chimica Acta, 2005. 538(1-2): p. 273-281.
165. Hotta, H., Nagano, S., Ueda, M., Tsujino, Y., Koyama, J., and Osakai, T.,
Higher radical scavenging activities of polyphenolic antioxidants can be
ascribed to chemical reactions following their oxidation. Biochimica et
Biophysica Acta (BBA) - General Subjects, 2002. 1572(1): p. 123-132.
166. Cao, G., Sofic, E., and Prior, R.L., Antioxidant and Prooxidant Behavior of
Flavonoids: Structure-Activity Relationships. Free Radical Biology and
Medicine, 1997. 22(5): p. 749-760.
167. Firuzi, O., Lacanna, A., Petrucci, R., and Saso, L., Evaluation of the
antioxidant activity of flavonoids by "ferric reducing antioxidant power" assay
and cyclic voltammetry. Biochimica et Biophysica Acta (BBA) - General
Subjects, 2005. 1721(1-3): p. 174-184.
168. Corduneanu, O., Chiorcea-Paquim, A.M., Garnett, M., and Oliveira-Brett,
A.M., Lipoic acid-palladium complex interaction with DNA, voltammetric and
AFM characterization. Talanta, 2009. 77(5): p. 1843-1853.
169. Filipiak, M., Electrochemical analysis of polyphenolic compounds. Anal. Sci,
2001. 17: p. 1667–1670.

170
170. Sun-Waterhouse, D., Smith, B.G., O'Connor, C.J., and Melton, L.D., Effect of
raw and cooked onion dietary fibre on the antioxidant activity of ascorbic acid
and quercetin. Food Chemistry, 2008. 111(3): p. 580-585.
171. Adam, V., Mikelova, R., Hubalek, J., Hanustiak, P., Beklova, M., Hodek, P.,
Horna, A., and Trnkova, L., Utilizing of Square Wave Voltammetry to Detect
Flavonoids in the Presence of Human Urine. Sensors, 2007. 7(10): p. 2402-
2418.
172. Cren-Olivé, C., Wieruszeski, J.M., Maes, E., and Rolando, C., Catechin and
epicatechin deprotonation followed by 13C NMR. Tetrahedron Letters, 2002.
43(25): p. 4545-4549.
173. Slabbert, N.P., Ionisation of some flavanols and dihydroflavonols.
Tetrahedron, 1977. 33(7): p. 821-824.
174. Blasco, A.J., González, M.C., and Escarpa, A., Electrochemical approach for
discriminating and measuring predominant flavonoids and phenolic acids
using differential pulse voltammetry: towards an electrochemical index of
natural antioxidants. Analytica Chimica Acta, 2004. 511(1): p. 71-81.