The Iraq War: Key Trends and Developments Second Edition · PDF fileMajor gains against Al...
178
www.csis.org | The Iraq War: Key Trends and Developments Second Edition Anthony H. Cordesman Arleigh A. Burke Chair in Strategy July 9, 2008 1800 K Street, NW Suite 400 Washington, DC 20006 Phone: 1.202.775.3270 Fax: 1.202.775.3199 Web: www.csis.org/burke/reports
Transcript of The Iraq War: Key Trends and Developments Second Edition · PDF fileMajor gains against Al...

www.csis.org |
The Iraq War: Key Trends and Developments
Second EditionAnthony H. CordesmanArleigh A. Burke Chair in Strategy
July 9, 2008
1800 K Street, NW Suite 400
Washington, DC 20006
Phone: 1.202.775.3270Fax: 1.202.775.3199
Web:www.csis.org/burke/reports

2
Introduction • This briefing is an attempt to summarize key maps, trends, and
recent polling data on Iraq. • It draws heavily on official sources and the reader should clearly
recognize that much of the data are selected to portray a favorable view of the war.
• The Iraqi War is also volatile and time sensitive. • The briefing does, however, attempt to provide perspective in some
areas, particularly in assessing the strength and weakness of the “surge,” by providing polling data, by projecting war costs, and by showing the limits to the US aid process

The Challenge of Afghanistan vs. Iraq
AFGHANISTAN
• Land Mass – 647,500 sq km
• Population – 31,900,000 people; 28% literacy
• Land locked, primarily agrarian economy: $35.B GDP, $1,000 PC
•Budget: $2.6; $8.9B in aid pledges
• Lacks both transportation and information infrastructure: 34,782 Km of roads, 8,229 KM paved
• Restrictive terrain dominates the country
IRAQ
• Land Mass – 432,162 sq km
• Population – 27,500,000 people; 84% literacy
• Economy dominated by the oil sector: $100.0B GDP, $3,600 PCI
• Budget $48.4 billion; $33B+ in aid pledges
•Comparatively developed transportation and information infrastructure; 45,5502 Km of roads, 38,399 Km paved
TOTAL US AND COALITION FORCES
~176,000
TOTAL US AND COALITION FORCES
~49,000
AFGHANISTAN
IRAQ

Source: CENTAF CAOC, 5 December 2007
Iraq vs. Afghanistan

StrategyStrategy• No real picture of the way ahead from the Administration since early 2007
• General strategy slide shown by General Petraeus in April 2008 testimony to Congress.
• Broad picture of potential US force cuts and shift of US role to strategic overwatch presented in September 2007, but with little details.
• No clear timelines: All US plans are “conditions based.”
• Both the Iraqi MoD and head of MNSTC-I said in February 2008 that Iraqi forces would not be ready to assume full counterinsurgency role before 2012.
• No meaningful development or aid strategy reflecting cuts in aid and massive increases in Iraqi oil export revenues.

6Source: MNF-I, April 9, 2008


Sectarian and Ethnic Divisions, Sectarian and Ethnic Divisions, and Political Accommodationand Political Accommodation
• Current CIA and other estimates of Arab Shi’ite,Arab Sunni, Kurdish, and minority shares of population have no clear source and uncertain credibility.
• Data on sectarian and ethnic violence only reflect deaths, not patterns of low level violence, intimidation, kidnappings, and displacement (cleansing).
•Data on refugees and displacements uncertain by may reach more than 2 million internally and 2 million driven outside country in nation of 28 million. Some estimates reach 5+ million.
• Polling data precede Maliki offensive in Basra and fight against Sadr; Shi’ite public opinion now far more uncertain.
• Option data show growing Sunni support for government, but date back to February 2008, and there has been significant progress since then.


Sectarian, Ethnic, and Tribal Challenges
11
Sectarian ChallengesAfghanistan: 80% Sunni, 19% Shi’a. 1% OtherIraq: 60-65% Shi’a, 32-37% Sunni, 3%
Christian or OtherEthnic Challenges
Afghanistan: Pashtun 42%, Tajik 27%, Hazara9%, Uzbek 9%, Aimak 4%, Turkmen 3%, Baloch2%, Other 4%
Iraq: Arab 75-80%, Kurdish 15-20%, Turcoman, Assyrian & Other 3%
Tribal ChallengesAfghanistan: Fragmented, rural, dividedIraq: Confederations, broad area, heavily
urbanized.

12
Iraqi Sectarian & Ethnic Divisions

Three sources:CIA World Factbook, unsourced;“Iraq: a Country Study,” Federal Research Division, Library of
Congress, 1988, unsourced (“knowledgeable observers”);Average ABC News polls ‘07-‘08, N=6,652 via 1,386 points.
CIA WFB LoC ABCShiites 60-65% 60-65% 49% Sunni Arabs 12-22* 13 33Kurds 15-20 NA 15Non Muslims 3 NA 3
*ExtrapolatedSource: ABC/BBC/ARD/NHK POLL - IRAQ FIVE YEARS LATER: WHERE THINGS STAND, Monday, March 17, 2008, and Gary Langer, Director
of Polling ABC News, “War in Iraq: The Public Perspective,” presentation to the CSIS, April 30, 2008.
Real World Ethno-Sectarian Population Parameters?
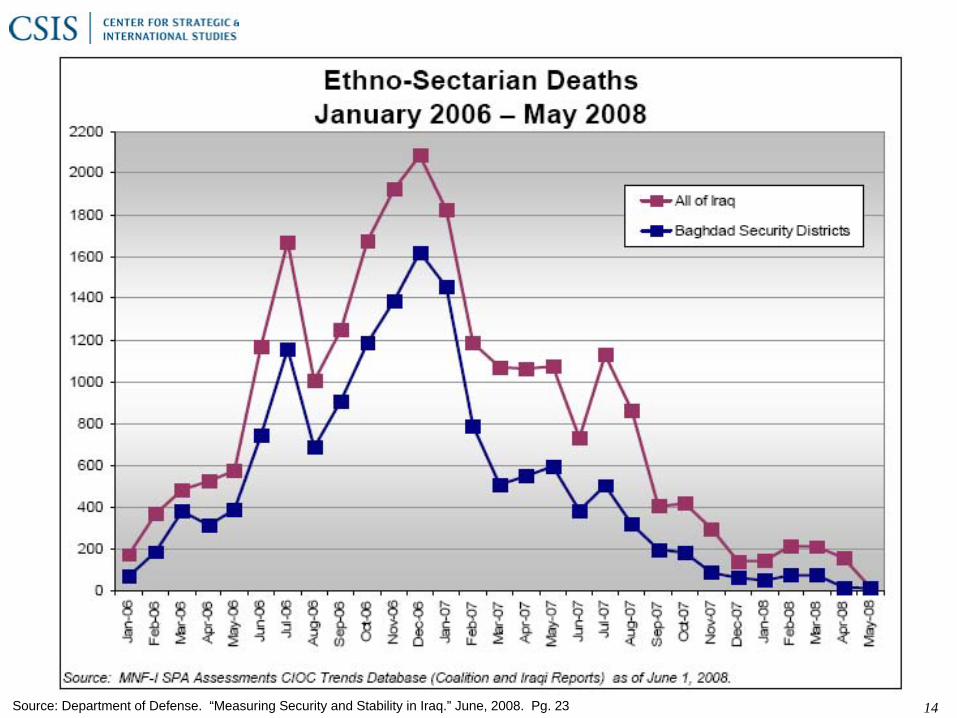
14
Source: MNF-I, April 2008
Source: Department of Defense. “Measuring Security and Stability in Iraq.” June, 2008. Pg. 23

Copright Anthony H. Cordesman, all rights reserved 15
Movement of Iraqi Refugees•Some 2.7
million displaced within Iraq
•1.2 million before
February 2007
•1.5 million since
•300,000 in first three months of
2008
Source: SIGIR, Quarterly Report, April 30, 2008, p. 143, 144.

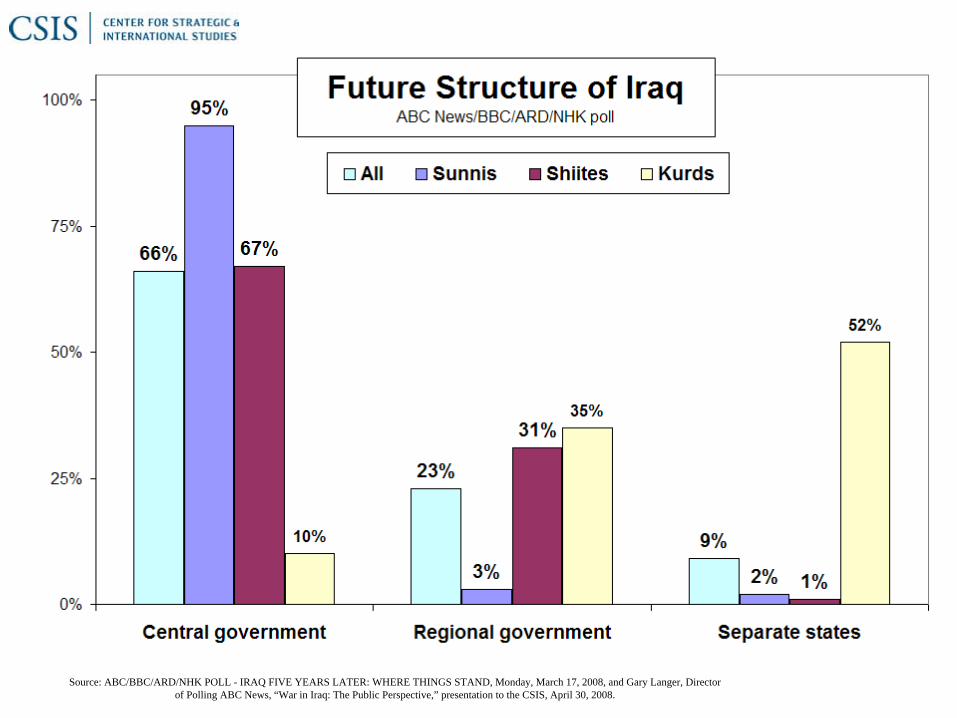
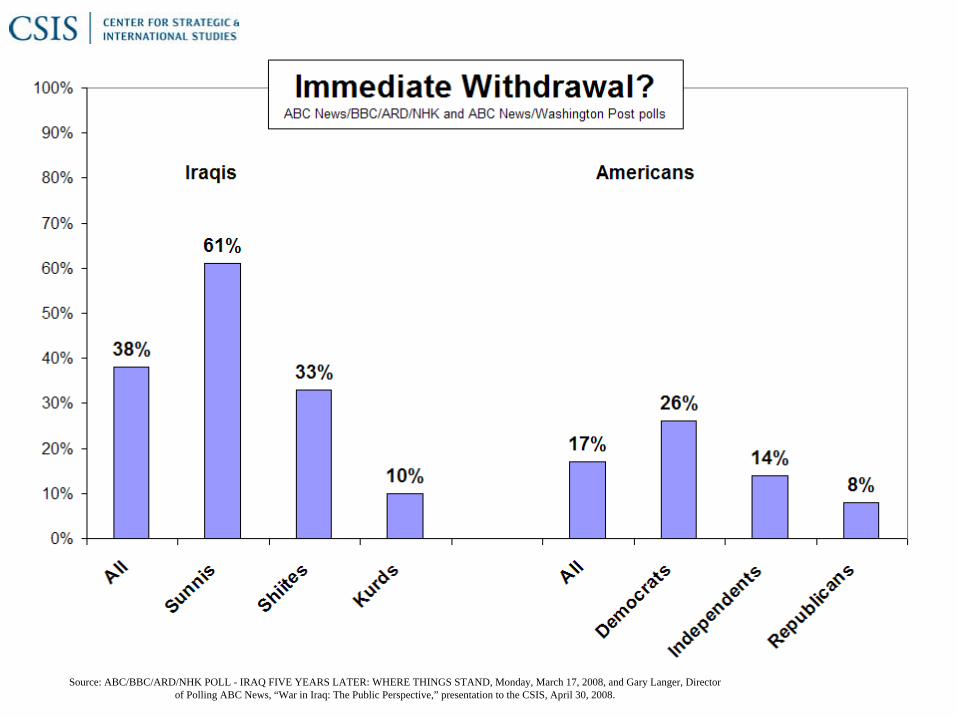
Source: ABC/BBC/ARD/NHK POLL - IRAQ FIVE YEARS LATER: WHERE THINGS STAND, Monday, March 17, 2008, and Gary Langer, Director of Polling ABC News, “War in Iraq: The Public Perspective,” presentation to the CSIS, April 30, 2008.

Source: ABC/BBC/ARD/NHK POLL - IRAQ FIVE YEARS LATER: WHERE THINGS STAND, Monday, March 17, 2008, and Gary Langer, Director of Polling ABC News, “War in Iraq: The Public Perspective,” presentation to the CSIS, April 30, 2008.
March 2008

March 2008

Source: ABC/BBC/ARD/NHK POLL - IRAQ FIVE YEARS LATER: WHERE THINGS STAND, Monday, March 17, 2008, and Gary Langer, Director of Polling ABC News, “War in Iraq: The Public Perspective,” presentation to the CSIS, April 30, 2008.
March 2008

Source: ABC/BBC/ARD/NHK POLL - IRAQ FIVE YEARS LATER: WHERE THINGS STAND, Monday, March 17, 2008, and Gary Langer, Director of Polling ABC News, “War in Iraq: The Public Perspective,” presentation to the CSIS, April 30, 2008.
Source: ABC/BBC/ARD/NHK POLL - IRAQ FIVE YEARS LATER: WHERE THINGS STAND, Monday, March 17, 2008, and Gary Langer, Director of Polling ABC News, “War in Iraq: The Public Perspective,” presentation to the CSIS, April 30, 2008.

22
2002 2003 2004 2005 2006Control of Corruption 1.9 8.7 2.4 5.3 3.4Voice and Accountability 0.0 4.3 2.4 8.2 7.7
Political Stability 3.8 0.0 0.0 0.0 0.0
Government Effectiveness 0.5 2.4 4.7 1.9 1.4Regulatory Quality 0.0 5.9 4.4 5.4 7.3Rule of Law 3.3 1.4 0.5 0.5 1.0
Little Progress in Governance: World Bank Rating: 2003-2006
Source: SIGIR, Quarterly Report, April 30, 2008, p. 34
23
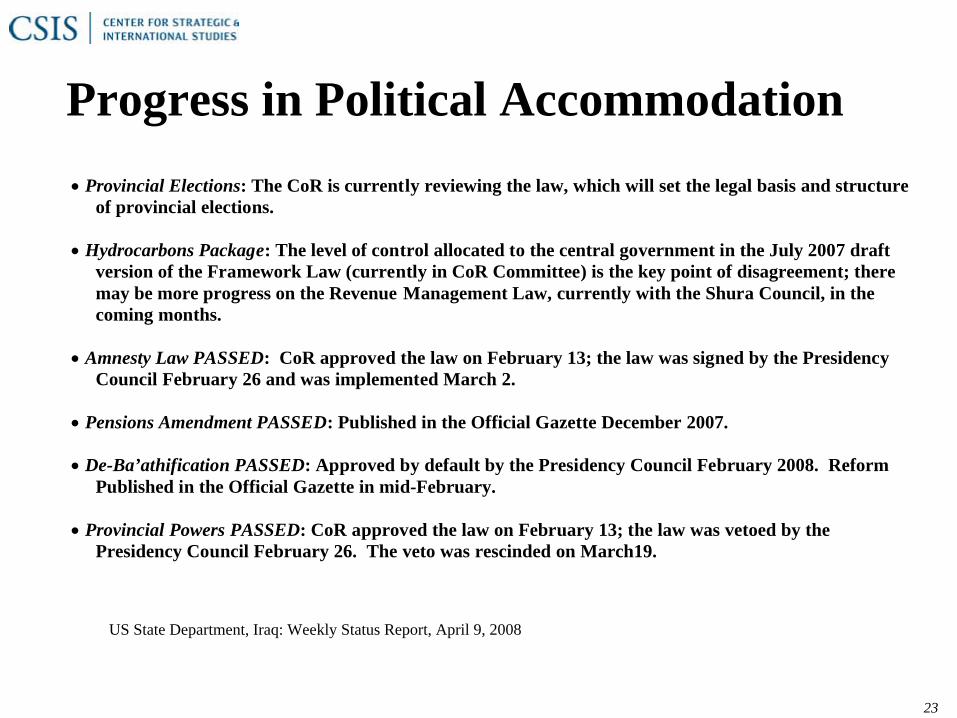
Progress in Political Accommodation
• Provincial Elections: The CoR is currently reviewing the law, which will set the legal basis and structureof provincial elections.
• Hydrocarbons Package: The level of control allocated to the central government in the July 2007 draft
version of the Framework Law (currently in CoR Committee) is the key point of disagreement; there may be more progress on the Revenue Management Law, currently with the Shura Council, in the coming months.
• Amnesty Law PASSED: CoR approved the law on February 13; the law was signed by the Presidency
Council February 26 and was implemented March 2.
• Pensions Amendment PASSED: Published in the Official Gazette December 2007.
• De-Ba’athification PASSED: Approved by default by the Presidency Council February 2008. Reform Published in the Official Gazette in mid-February.
• Provincial Powers PASSED: CoR approved the law on February 13; the law was vetoed by the
Presidency Council February 26. The veto was rescinded on March19.
US State Department, Iraq: Weekly Status Report, April 9, 2008

Status of Iraqi Legislation to Promote Reconciliation: May 2008
GAO, Securing, Stabilizing, and Rebuilding Iraq, GAO- 08-837June 23, 2008, p. 37

The Course of the FightingThe Course of the Fighting• Major gains against Al Qa’ida in Iraq from mid-2007 onwards, but now face major uncertainties over impact of Maliki offensive, fighting with Sadr, and role of Iran.
•Iraqi government data indicate major rise in violence in Baghdad in March and April of 2008.
• Maps cover al Qa’ida,but not pattern of clashes with extreme Shi’ite groups, elements of Mahdi Army.
•Attack data reflect sharp cuts in the level of insurgent attacks, but have risen again, and do no reflect overall climate of violence: crime, ethnic and sectarian cleansing, etc.
•Casualty data only reflect killing, not wounded,kidnapped, disappearances, impact of “cleansing, etc.
• Casualty counts uncertain.

26
Mapping the Overall Pattern: Enemy-Initiated Attacks by Month, May 2003 to May 2008
GAO analysis of DIA-reported Multi-National Force-Iraq data, May 2008.
Source: GAO. “SECURING, STABILIZING, AND REBUILDING IRAQ: Progress Report: Some Gains Made, Updated Strategy Needed” June, 2008. Pg. 12

Rising Violence: 2003-2007

Iraqi Civilians Killed: 2003-2007
Source: Iraqi Body Count, as of June 24, 2008

Iraqi Civilian Deaths Per Day from Vehicle Bombs, Gunfire & Executions: 2003-2007
Source: Iraqi Body Count, as of June 24, 2008

Rise in Terrorism in Iraq: 2005- 2007 Attacks Targeting Non-Combatants
Adapted from US State Department, Country Reports on Terrorism. April 30, 2008, and www.nctc.gov

Source: ABC/BBC/ARD/NHK POLL - IRAQ FIVE YEARS LATER: WHERE THINGS STAND, Monday, March 17, 2008, and Gary Langer, Director of Polling ABC News, “War in Iraq: The Public Perspective,” presentation to the CSIS, April 30, 2008.

Source: ABC/BBC/ARD/NHK POLL - IRAQ FIVE YEARS LATER: WHERE THINGS STAND, Monday, March 17, 2008, and Gary Langer, Director of Polling ABC News, “War in Iraq: The Public Perspective,” presentation to the CSIS, April 30, 2008.

The Military Course and Impact of the Surge

US Shifts in Strategy in December 2007: The Surge
GAO, Securing, Stabilizing, and Rebuilding
Iraq, GAO-08-837June 23, 2008, p. 10

US Troop Levels: March 2003 to May 2008
GAO, Securing, Stabilizing, and Rebuilding Iraq, GAO-08-837June 23, 2008, p. 19
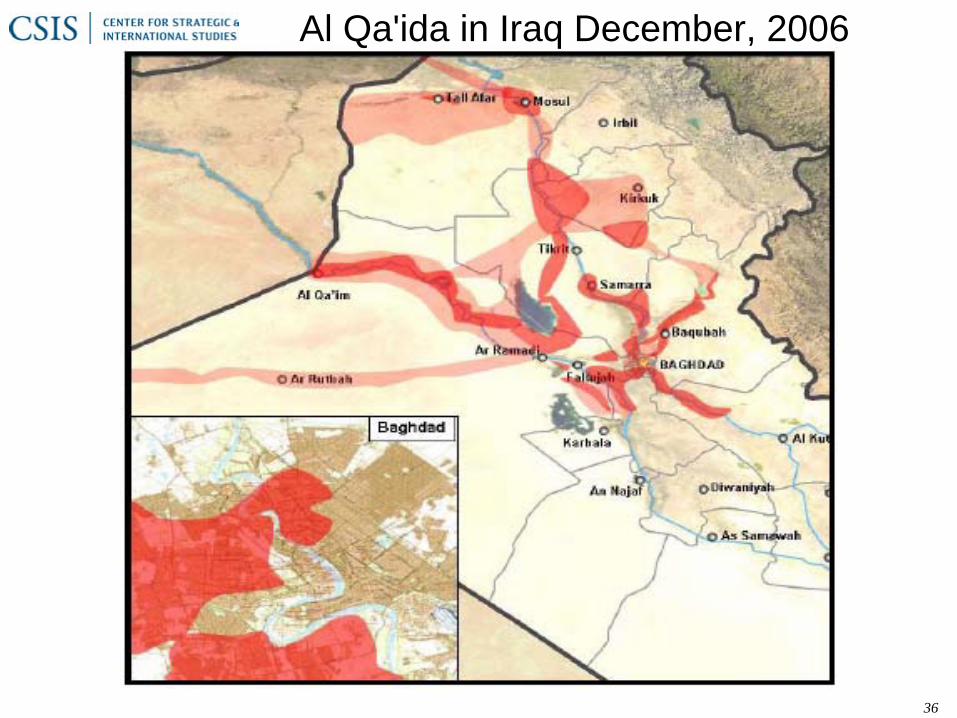
36
Al Qa'ida in Iraq December, 2006

37

Source: CENTAF CAOC, 5 December 2007
OEF Close Air Support Sorties With Munitions Dropped, 2004-2007
(Excluding 20mm and 20mm rounds and unguided rockets)

Copyright Anthony H. Cordesman, all rights reserved 39

Copyright Anthony H. Cordesman, all rights reserved 40

41

42
Al Qa'ida in Iraq March, 2008
Source for slides 18 and 19: MNF-I,
April 9, 2008

Patterns in Violence As Result of the Surge and Campaign Against
Sadr

44Source: Department of Defense. “Measuring Security and Stability in Iraq.” June, 2008. Pg. 26

45Source: Department of Defense. “Measuring Security and Stability in Iraq.” June, 2008. Pg. 20

AVERAGE DAILY ATTACKS: MAY 2003 TO MAY 2008
46Source: GAO. “SECURING, STABILIZING, AND REBUILDING IRAQ: Progress Report: Some Gains Made, Updated Strategy Needed” June, 2008. Pg. 13
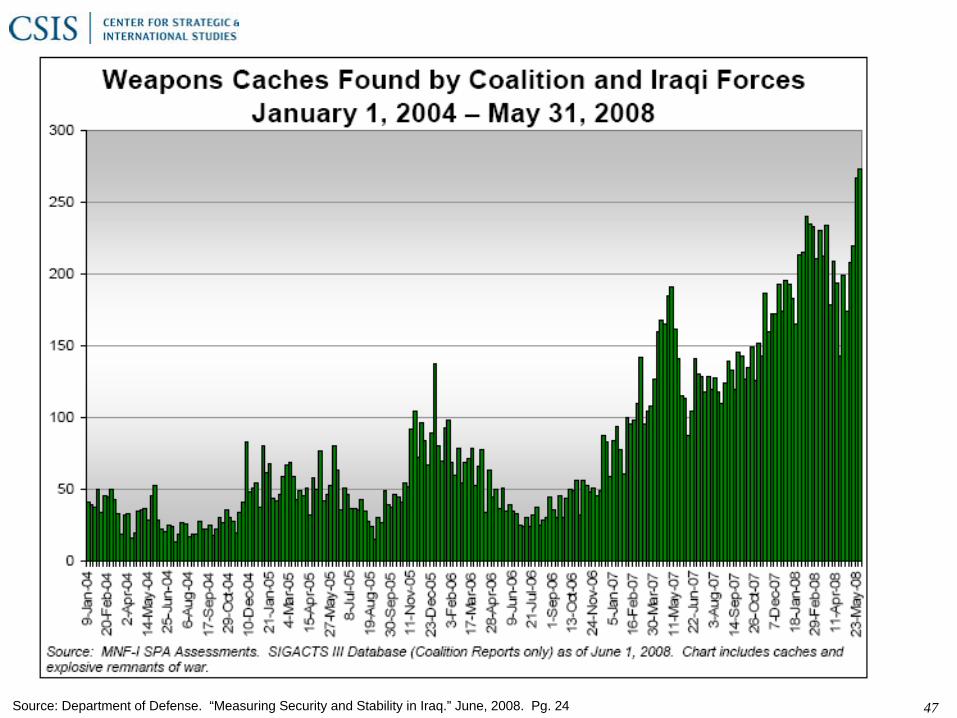
47Source: Department of Defense. “Measuring Security and Stability in Iraq.” June, 2008. Pg. 24

Trends in Baghdad: US and Iraqi Views

US Joint Security Stations and Outposts in Baghdad: July 2007
GAO, Securing, Stabilizing, and Rebuilding Iraq, GAO-08-837June 23, 2008, p. 20

50

Baghdad: Major Incidents of Violence in 2007-2008
(Trend in Total Incidents per Month by Type)
Source: Iraqi Official
050
100150200250300350400450
Katyusha 0 0 2 1 1 0 3 0 0 0 0 9 16 23 15 32 21 0Suicide Bomb 0 0 2 1 1 0 3 0 0 0 0 0 5 4 2 1 3 2Assasination 0 21 13 13 23 15 16 0 0 9 12 16 21 16 15 22 31 25Bicycle Bomb 0 0 0 0 0 1 0 0 0 0 0 1 0 0 0 0 0 0Car Bomb 26 23 19 38 35 20 35 15 24 20 15 16 6 13 13 13 13 11Mortar 87 74 43 83 90 190 138 89 76 54 48 46 82 62 228 216 98 63IED 55 65 33 82 63 133 96 84 63 78 73 71 103 77 131 118 107 96
Jan Feb Mar Apr May Jun Jul Aug Sep Oct Nov Dec Jan Feb Mar Apr May Jun

Baghdad: Major Incidents of Violence in 2007-2008
(Monthly Distribution of Incidents by Type)
Source: Iraqi Official
0
50
100
150
200
250
IED 55 65 33 82 63 133 96 84 63 78 73 71 103 77 131 118 107 96 0
Mortar 87 74 43 83 90 190 138 89 76 54 48 46 82 62 228 216 98 63 0
Car Bomb 26 23 19 38 35 20 35 15 24 20 15 16 6 13 13 13 13 11 0
Bicycle Bomb 0 0 0 0 0 1 0 0 0 0 0 1 0 0 0 0 0 0 0
Assasination 0 21 13 13 23 15 16 0 0 9 12 16 21 16 15 22 31 25 0
Suicide Bomb 0 0 2 1 1 0 3 0 0 0 0 0 5 4 2 1 3 2 0
Katyusha 0 0 2 1 1 0 3 0 0 0 0 9 16 23 15 32 21 0 0
Jan Feb Mar Apr May Jun Jul Aug Sep Oct Nov Dec Jan Feb Mar Apr May Jun Total

Baghdad: Major Iraqi Casualties in 2007-2008
(Trend in Total Casualties per Month by Type)
Source: Iraqi Official
0
500
1000
1500
2000
2500
Body Found 395 365 324 411 726 548 596 421 324 174 165 126 123 116 135 117 123 103
ISF Dead 28 36 33 25 32 35 69 22 23 41 26 29 31 28 42 64 59 24
ISF Wounded 55 45 69 100 88 95 119 40 31 58 54 84 77 72 121 141 94 81
Dead Civilian 255 256 198 495 344 190 300 235 219 143 98 104 153 197 322 531 233 178
Wounded Civilian 206 512 403 1104 999 530 893 507 437 461 287 329 311 453 941 1525 938 468
Jan Feb Mar Apr May Jun Jul Aug Sep Oct Nov Dec Jan Feb Mar Apr May Jun

Baghdad: Major Iraqi Casualties in 2007-2008
(Monthly Distribution of Casualties by Type)
Source: Iraqi Official
0
200
400
600
800
1000
1200
1400
1600
Wounded Civilian 206 512 403 1104 999 530 893 507 437 461 287 329 311 453 941 1525 938 468 0
Dead Civilian 255 256 198 495 344 190 300 235 219 143 98 104 153 197 322 531 233 178 0
ISF Wounded 55 45 69 100 88 95 119 40 31 58 54 84 77 72 121 141 94 81 0
ISF Dead 28 36 33 25 32 35 69 22 23 41 26 29 31 28 42 64 59 24 0
Body Found 395 365 324 411 726 548 596 421 324 174 165 126 123 116 135 117 123 103 0
Jan Feb Mar Apr May Jun Jul Aug Sep Oct Nov Dec Jan Feb Mar Apr May Jun Total

Perceptions of the Surge: US and Iraqi
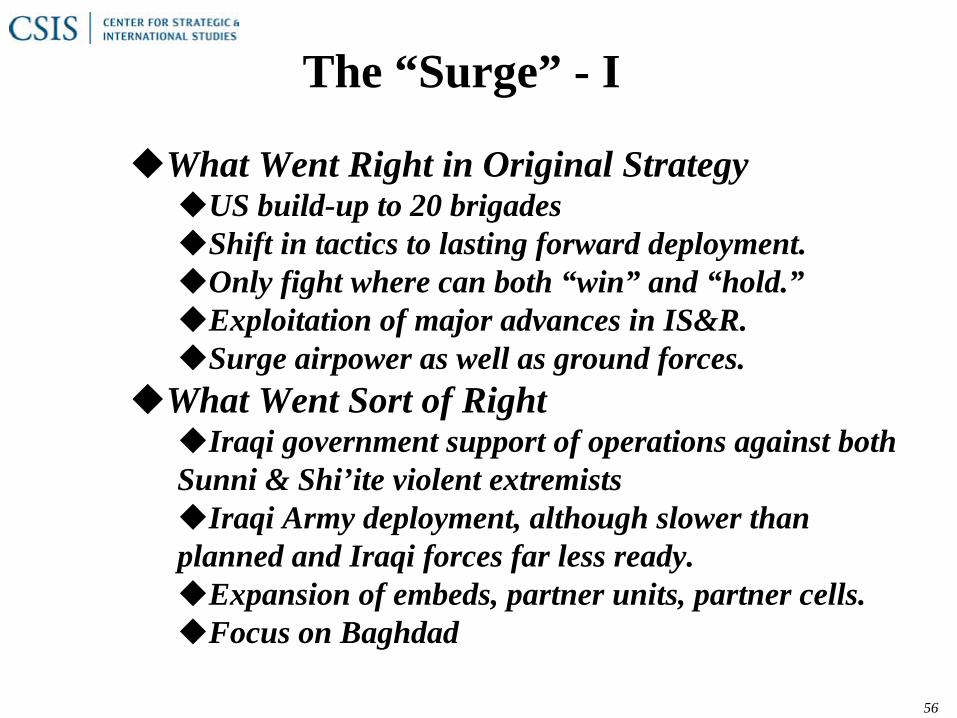
The “Surge” - I
56
What Went Right in Original StrategyUS build-up to 20 brigadesShift in tactics to lasting forward deployment.Only fight where can both “win” and “hold.”Exploitation of major advances in IS&R.Surge airpower as well as ground forces.
What Went Sort of RightIraqi government support of operations against both
Sunni & Shi’ite violent extremistsIraqi Army deployment, although slower than
planned and Iraqi forces far less ready.Expansion of embeds, partner units, partner cells.Focus on Baghdad

The “Surge” - II
57
Synergy and SerendipityAl Qa’ida extremism alienates many Sunnis and tribesTribal uprising in Anbar is transformed into sons of IraqSadr declares and keeps ceasefire.Kurds wait on Article 140
What Went WrongCentral government did not reach out to Sunnis, “Sons of
Iraq”. Police generally fell short, did not perform.Negligible progress in rule of lawExtremely slow progress in political accommodation.US civilian role and aid impact fell far short of goal.Iraqi government spending on development, services, and
security.Did not reduce impact of British defeat in the south, growing
intra-Shi’ite tensions.Growing Iranian role and influenceDid not affect Arab-Kurdish-Turkish tensions.Little progress in strengthening ties to other neighbors.

58
70% 68% 70%65% 67%
53%49%
43% 44% 42%
0%
10%
20%
30%
40%
50%
60%
70%
80%
90%
100%
Security whereforces sent
Security inother areas
Politicaldialogue
Ability ofIraqi gov't
Economicdevelopment
August Now
Impact of Troop SurgeABC News/BBC/ARD/NHK poll
% saying it's worse
Source: ABC/BBC/ARD/NHK POLL - IRAQ FIVE YEARS LATER: WHERE THINGS STAND, Monday, March 17, 2008

59
11%
61%
28%
36%
26%
37%
0%
10%
20%
30%
40%
50%
60%
70%
80%
90%
Better Worse Same
August Now
Security in the Past Six Months ABC News/BBC/ARD/NHK poll
. Source: ABC/BBC/ARD/NHK POLL - IRAQ FIVE YEARS LATER: WHERE THINGS STAND, Monday, March 17, 2008

Source: ABC/BBC/ARD/NHK POLL - IRAQ FIVE YEARS LATER: WHERE THINGS STAND, Monday, March 17, 2008, and Gary Langer, Director of Polling ABC News, “War in Iraq: The Public Perspective,” presentation to the CSIS, April 30, 2008.

Source: ABC/BBC/ARD/NHK POLL - IRAQ FIVE YEARS LATER: WHERE THINGS STAND, Monday, March 17, 2008, and Gary Langer, Director of Polling ABC News, “War in Iraq: The Public Perspective,” presentation to the CSIS, April 30, 2008.

Source: ABC/BBC/ARD/NHK POLL - IRAQ FIVE YEARS LATER: WHERE THINGS STAND, Monday, March 17, 2008, and Gary Langer, Director of Polling ABC News, “War in Iraq: The Public Perspective,” presentation to the CSIS, April 30, 2008.

After the “Surge”
63
Reducing the Uncertainties of a “Long War”Sunni-Shi’a and Arab-Kurd political
accommodation.Sons of IraqSadr vs. ISCIStable autonomy for Kurds.
Open list and air elections at national, provincial, and local level.
Creation of Effective governance and services at at national, provincial, and local level.
Resolving petroleum and national budget issues.
Move from aid and government subsidies to sustained development and employment.
Neighbors: Iran, Syria, Turkey, GulfUS and Iraqi domestic politics

Patterns of Violence by Province Patterns of Violence by Province and Transfer of Responsibilityand Transfer of Responsibility
• Violence varies sharply by province.
•Violence by province diminished from mid-2007 to April 2008, but Maliki offensive in Basra and fighting with Sadr that began in March 2008 has since radically increased the level of violence and areas impacted.
• Polling data date back to February 2008.
• Reporting on transfer of responsibility to Iraqi forces have consistently bordered on the absurd. Transfers have been cosmetic and Iraqi forces are not ready for the mission.
• Iraqi government cannot provide effective governance or presence in many areas supposedly under its control.

65Source: Department of Defense. “Measuring Security and Stability in Iraq.” June, 2008. Pg. 30

66
QuickTime™ and a decompressor
are needed to see this picture.

67Source: Department of Defense. “Measuring Security and Stability in Iraq.” June, 2008. Pg. 27

68
Average Number of Daily Attacks in Iraq for Selected Provinces, August 2005 through
Early May 2008
Note: Each data point represents the average number of daily attacks for the specified period of time, as reported in DOD’s quarterly reports to Congress.
GAO analysis of DOD’s quarterly reports to Congress, Measuring Stability and Security in Iraq, January 2006 through February 2008; and data provided by MNF-I for March 2008 through May 2008
Source: GAO. “SECURING, STABILIZING, AND REBUILDING IRAQ: Progress Report: Some Gains Made, Updated Strategy Needed” June, 2008. Pg. 13

Car bombs/suicide attacks 27% Baghdad 61%
Snipers/crossfire 24% Mosul 58%
Sectarian fighting 22% Diyala 58%
Unnecessary violence by U.S. forces 28% Anbar 54% by militia 18% Basra 60%
Forced separation 14% Baghdad 28%Basra 29%
Saw Local Violence During Past 6 Months: August 2007-February 2008
ABC News/BBC/ARD/NHK Poll
Source: ABC/BBC/ARD/NHK POLL - IRAQ FIVE YEARS LATER: WHERE THINGS STAND, Monday, March 17, 2008, and Gary Langer, Director of Polling ABC News, “War in Iraq: The Public Perspective,” presentation to the CSIS, April 30, 2008.

70
Petraeus briefing Slides, April 2008
Transferring Provincial Control
Source: Petraeus Briefing Slides, April 9, 2008

71Source: Department of Defense. “Measuring Security and Stability in Iraq.” June, 2008. Pg. 33

Slipping Deadlines for Transfer of Provincial Security Control to Iraq
Source: SIGIR, Quarterly Report, April 30, 2008, p. 104.

73
Current Timeline for Transfer of Security Responsibilities to Provincial Iraqi Control
Source: GAO. “SECURING, STABILIZING, AND REBUILDING IRAQ: Progress Report: Some Gains Made, Updated Strategy Needed” June, 2008. Pg. 34

74
Date FOBs # Transferred %TransferredOctober 2006 110 52 47.3%June 2007 122 61 50.0%September 2007 125 61 48.8%November 2007 125 61 48.8%January 2008 125 63 50.4%
Source: DoD, Measuring Stability and Security in Iraq, November 2006, June 2007, September 2007,December 2007, and March 2008.Note: DoD did not report on FOBs in March 2007.
Transfer of Forward Operating Bases to Iraqis
Source: SIGIR, Quarterly Report, April 30, 2008, p. 105

Iraqi Casualty Patterns

76Source: MNF-I, April 9, 2008

Iraqi Body Count: Iraqi Civilians Killed During the “Surge” and Afterwards by Month of Combat
Source: Iraq Body Count: http://www.iraqbodycount.org/analysis/beyond/enforced-security June 24, 2007
Jan Feb Mar Apr May Jun Jul Aug Sep Oct Nov Dec Jan Feb Mar April May Jun Jul Aug Sep Oct Nov Dec Jan Feb Mar
Deaths 1,4 144 1,7 1,5 2,0 2,4 3,1 2,7 2,3 2,9 2,9 2,6 2,7 2,4 2,5 2,4 2,7 2,0 2,5 2,3 1,2 1,1 986 856 767 962 153
-200
300
800
1,300
1,800
2,300
2,800
3,300

Icasualties: Iraqi ISF & Civilians Killed During the “Surge” and Afterwards by Month of Combat
Source: Icasualties, http://icasualties.org/oif/IraqiDeaths.aspx

US & Coalition Casualty Patterns

US Killed and Wounded in Combat in Various Wars
Source: Defense Manpower Data Center, Statistical Analysis Division, as of April 8, 2008
Civil War is Union only; Confederate dead were 74,524 battle and 59,297 other;
wounded unknon.

Total US Killed and Wounded in Iraq: 2003-May 3, 2008
Source: Defense Manpower Data Center, Statistical analysis Division, as of May 5, 2008

US Killed and Wounded in Combat in Iraq by Cause: March 2003-April 5, 2008
Source: Defense Manpower Data Center, Statistical Analysis Division, as of April 8, 2008
Killed in Actio
0
500
1000
1500
2000
2500
Killed in Action 15 17 190 2076 655 40 110 7 155
Drowning
Burns/Smoke
Artllery/Mortar/
Explosive Device
GrenadeGunshotNBC
AgentsOther
WeaponRPG
Air/Veh.Crash
Fall, Cut,
Unknown
Total of 3,267 hostile deaths,
738 Non-hostile deaths, and
29, 676 wounded =
33,681 Total

Monthly US Casualties – Operation Iraqi Freedom: March 2003-April 2008
0
200
400
600
800
1000
1200
1400
1600
Mar
Apr
May Jun Jul
Aug Sep
Pct
Nov Dec Jan
Feb
Mar
Apr
May Jun Jul
Aug Sep
Oct
Nov Dec Jan
Feb
Mar
Apr
May Jun Jul
Aug Sep
Oct
Nov Dec Jan
Feb
Mar
Apr
May Jun Jul
Aug Sep
Oct
Nov Dec Jan
Feb
Mar
Apr
May Jun Jul
Aug Sep
Oct
Nov Dec Jan
Feb
Mar
Apr
May
2003 2004 2005 2006 2007 2008
Wounded
Killed in Action
Non-Combat Deaths
Note: Accidents includes “other deaths; Killed in Action includes “died of wounds”. Source: Defense Manpower Data Center

84Source: Department of Defense. “Measuring Security and Stability in Iraq.” June, 2008. Pg. 22

Total US and Allied Killed During the “Surge” and Afterwards
Source: Icasualties: Iraq Coalition Casualty Count, accessed, May 4, 2008
0
20
40
60
80
100
120
140
Other 2 2 2 0 1 0 1 2 0 1 0 2 1 1 0 0 0 2 0 2UK 2 6 1 3 3 1 12 3 7 8 4 2 1 2 1 0 1 1 0 0US 106 70 112 83 81 81 104 126 101 78 84 65 38 37 23 40 29 52 52 19
Oct Nov Dec Jan Feb Mar Apr May Jun Jul Aug Sep Oct Nov Dec Jan Feb Mar Apr May

Monthly US Casualties – “Surge” and Afterwards: January 2007- May 2008
Jan Feb Mar Apr May Jun Jul Aug Sep Oct Nov Dec Jan Feb Mar April May
2007 2008Wounded 647 519 618 653 658 753 616 565 361 297 203 212 234 215 328 330 195
Killed in Action 78 70 71 96 120 93 66 55 42 29 28 14 34 25 36 42 15Non-Combat
Deaths 5 11 10 8 6 8 12 29 23 9 8 9 6 4 3 10 4
0
100
200
300
400
500
600
700
800
900
1000 Wounded
Killed in ActionNon-Combat Deaths
Note: Accidents includes “other deaths; Killed in Action includes “died of wounds”. Source: Defense Manpower Data Center

Iraqi views of US Role in IraqIraqi views of US Role in Iraq• Trend has been more favorable, since victories in 2007 but…
• Iraqi public opinion data date back to February 2008. Events since that time may have increase Sunni tolerance and support of US forces and reduced it for Shi’ites.
• Data on Iraqi perceptions show clear conflict between nationalism, desire for US to leave,and understanding US presence still necessary.
• Sharp polarization of Iraqi opinion along sectarian and ethnic lines.
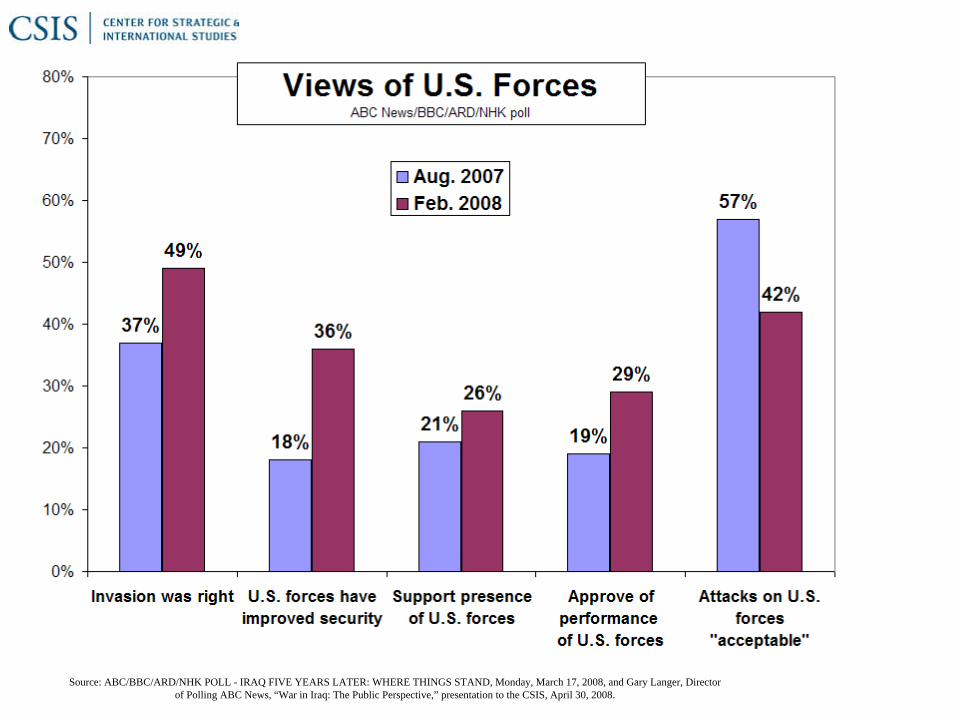
Source: ABC/BBC/ARD/NHK POLL - IRAQ FIVE YEARS LATER: WHERE THINGS STAND, Monday, March 17, 2008, and Gary Langer, Director of Polling ABC News, “War in Iraq: The Public Perspective,” presentation to the CSIS, April 30, 2008.
89
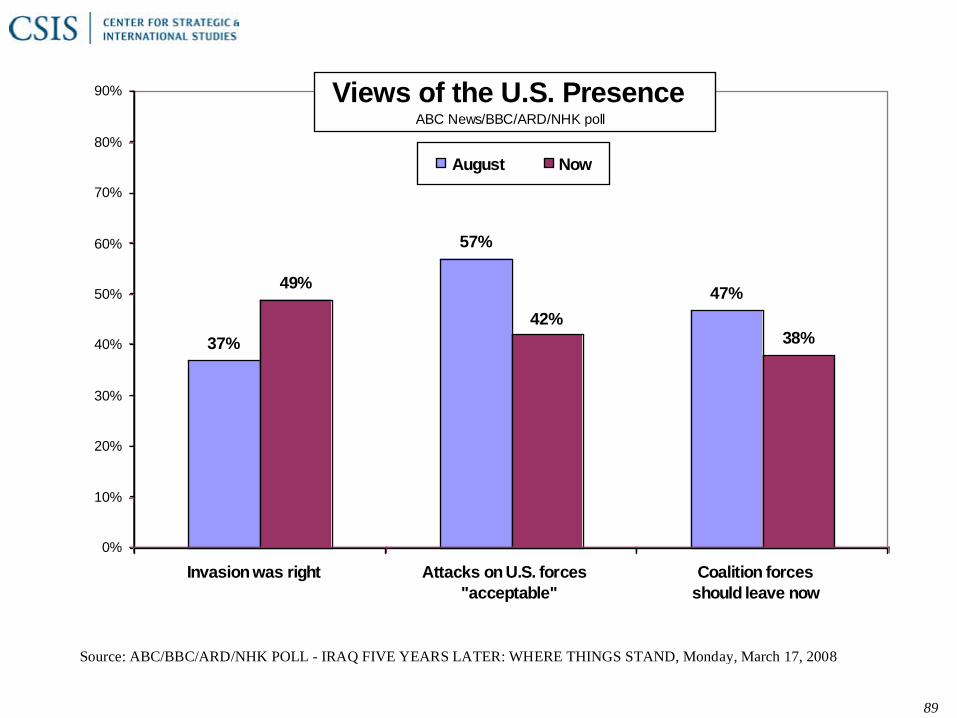
37%
57%
47%49%
42%38%
0%
10%
20%
30%
40%
50%
60%
70%
80%
90%
Invasion was right Attacks on U.S. forces"acceptable"
Coalition forces should leave now
August Now
Views of the U.S. PresenceABC News/BBC/ARD/NHK poll
Source: ABC/BBC/ARD/NHK POLL - IRAQ FIVE YEARS LATER: WHERE THINGS STAND, Monday, March 17, 2008

Source: ABC/BBC/ARD/NHK POLL - IRAQ FIVE YEARS LATER: WHERE THINGS STAND, Monday, March 17, 2008, and Gary Langer, Director of Polling ABC News, “War in Iraq: The Public Perspective,” presentation to the CSIS, April 30, 2008.

Source: ABC/BBC/ARD/NHK POLL - IRAQ FIVE YEARS LATER: WHERE THINGS STAND, Monday, March 17, 2008, and Gary Langer, Director of Polling ABC News, “War in Iraq: The Public Perspective,” presentation to the CSIS, April 30, 2008.

Source: ABC/BBC/ARD/NHK POLL - IRAQ FIVE YEARS LATER: WHERE THINGS STAND, Monday, March 17, 2008, and Gary Langer, Director of Polling ABC News, “War in Iraq: The Public Perspective,” presentation to the CSIS, April 30, 2008.

Source: ABC/BBC/ARD/NHK POLL - IRAQ FIVE YEARS LATER: WHERE THINGS STAND, Monday, March 17, 2008, and Gary Langer, Director of Polling ABC News, “War in Iraq: The Public Perspective,” presentation to the CSIS, April 30, 2008.

Source: ABC/BBC/ARD/NHK POLL - IRAQ FIVE YEARS LATER: WHERE THINGS STAND, Monday, March 17, 2008, and Gary Langer, Director of Polling ABC News, “War in Iraq: The Public Perspective,” presentation to the CSIS, April 30, 2008.
Source: ABC/BBC/ARD/NHK POLL - IRAQ FIVE YEARS LATER: WHERE THINGS STAND, Monday, March 17, 2008, and Gary Langer, Director of Polling ABC News, “War in Iraq: The Public Perspective,” presentation to the CSIS, April 30, 2008.
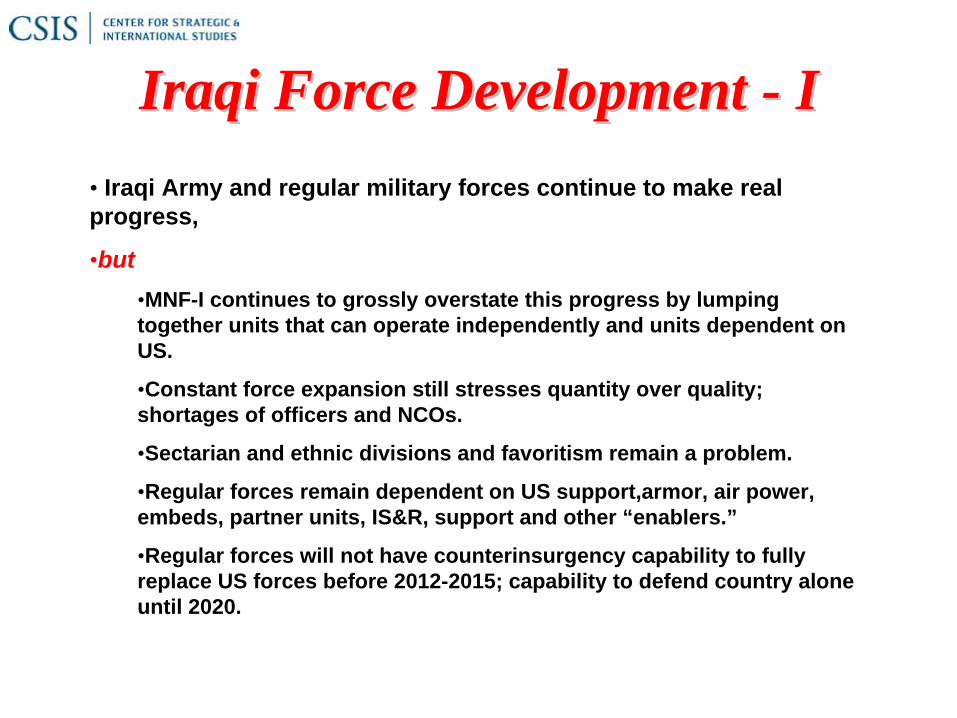
Iraqi Force Development Iraqi Force Development -- II• Iraqi Army and regular military forces continue to make real progress,
•but•MNF-I continues to grossly overstate this progress by lumping together units that can operate independently and units dependent on US.
•Constant force expansion still stresses quantity over quality; shortages of officers and NCOs.
•Sectarian and ethnic divisions and favoritism remain a problem.
•Regular forces remain dependent on US support,armor, air power, embeds, partner units, IS&R, support and other “enablers.”
•Regular forces will not have counterinsurgency capability to fully replace US forces before 2012-2015; capability to defend country alone until 2020.

Iraqi Force Development Iraqi Force Development -- IIII
• Data on police progress disguise reality that most police are now controlled at local and governorate level, many “trained and equipped” men are no longer in service, and embeds have not been provided or effective.
• Corruption and incompetence in MoD and MoI remain major problems. Prime minister’s office continues to provide ineffective guidance and management.
• The future role of the tribal militias and “Sons of Iraq” remains uncertain in spite of slow Iraqi government efforts to deal with issue.
•No clear plans for transferring funding responsibilities from US aid to Iraqi government budget, but progress is taking place.

Source: CBO, 2008
Comparative Cost of Aid to Afghan and Iraqi Forces
($US Current Billions)

99Source: SIGIR, Quarterly Report, April 30, 2008, p. 4
US and Iraqi Security Funding: 2003-2008In $US Billions

100Source: MNF-I, April 9, 2008
101
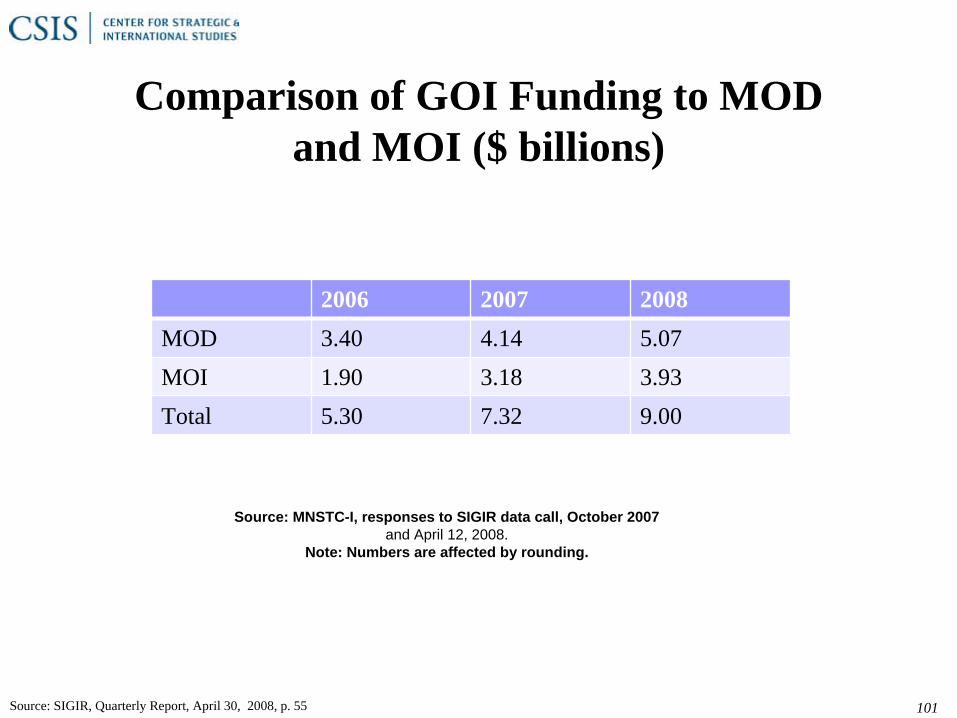
2006 2007 2008MOD 3.40 4.14 5.07MOI 1.90 3.18 3.93Total 5.30 7.32 9.00
Comparison of GOI Funding to MODand MOI ($ billions)
Source: MNSTC-I, responses to SIGIR data call, October 2007and April 12, 2008.
Note: Numbers are affected by rounding.
Source: SIGIR, Quarterly Report, April 30, 2008, p. 55

102
How US Iraqi Security Forces Aid Funds Have Been Spent
Source: SIGIR, Quarterly Report, April 30, 2008, p. 51.

103
Cumulative US Security Forces Fund Aid to Iraq ($US Billions)
Source: SIGIR, Quarterly Report, April 30, 2008, p. 36.

Source: USAID, US Overseas Loans and Grants, UN Population Prospects
US Military Assistance Per Capita Per Year(Constant Dollars)

105
Number of Iraqi Security Forces:March 2005, January 2007, and April 2008
Notes: a: The term “operational” refers to Ministry of Defense forces. The term “trained and equipped” refers to Ministry of Interior forces. Numbers are from the State Department’s March 9, 2005 and January 31, 2007 Iraq Weekly Status Report and Multinational Security Transition Command Iraqi Security Forces Update, January 26, 2007. b: The term “trained” refers to Ministry of Defense, Ministry of Interior and Counterterrorism Bureau forces. Numbers are from April 30, 2008 Iraq Weekly Status Report. c: Army numbers include Special Operations Forces and Support Forces. d: Army numbers include support forces. e: Unauthorized absent personnel are not included in Ministry of Defense numbers. f: The number in the Iraqi police service in 2005 includes highway patrol forces. g: Unauthorized absent personnel are included in Ministry of Interior numbers. h: Does not include the approximately 144,000 Facilities Protection Service personnel working in 27 ministries. i: Numbers reflect total Iraqi security forces trained to date, some of which are no longer assigned due to casualties, absence without leave, and normal separation.
Source: GAO. “SECURING, STABILIZING, AND REBUILDING IRAQ: Progress Report: Some Gains Made, Updated Strategy Needed” June, 2008. Pg. 24

Source: US State Department, Iraq Weekly Status Report, June 18, 2008, p. 10
Iraqi Security Forces
a Numbers do not include ministry staffs.b Numbers reflect Government of Iraq (GOI) authorizations.c Numbers are based upon GOI payroll data and do not reflect present for duty totals.d Numbers reflect assigned personnel that have received training.e Numbers reflect total ISF personnel trained to date, some of which are no longer assigned due to casualties, AWOL, and normal separation.f MoI strength does not reflect investigative and administrative forces, the MoI HQ, MoI Forensics, Dignitary Protection, or contracted guards.g MoI Police Support Unit, Provincial Security Force, and Emergency Response Unit personnel are part of the Iraqi Police Service and does not include other Ministry FPS.h MoD strength is derived from Modified Tables of Organization and Equipment (MTOEs).
**The decrease in authorized MoD forces from the April 30 Weekly Status Report with ISF data as of March 31 reflects a change in a temporary GOI policy to increase front line units to 120% of authorized end strength to maintain present-for-duty totals at 100% while soldiers took leave. This change will make ISF reporting consistent with standard military personnel accounting practices in other countries and provide a clearer representation of ISF manning levels.

107
Number of Trained Iraqi Security Forces: March 2005 through 2010
GAO analysis of U.S. State Department, Multinational Security Transition Command, and Department of Defense Reports.
Source: GAO. “SECURING, STABILIZING, AND REBUILDING IRAQ: Progress Report: Some Gains Made, Updated Strategy Needed” June, 2008. Pg. 26

108
•Grown 133,000 Police & Soldiers: Jan 07-Apr 08•Grow 50,000 more soldiers, 16 Army and Special Forces battalions, plus 23,000 police and 8 National Police Battalions by End 2008
109
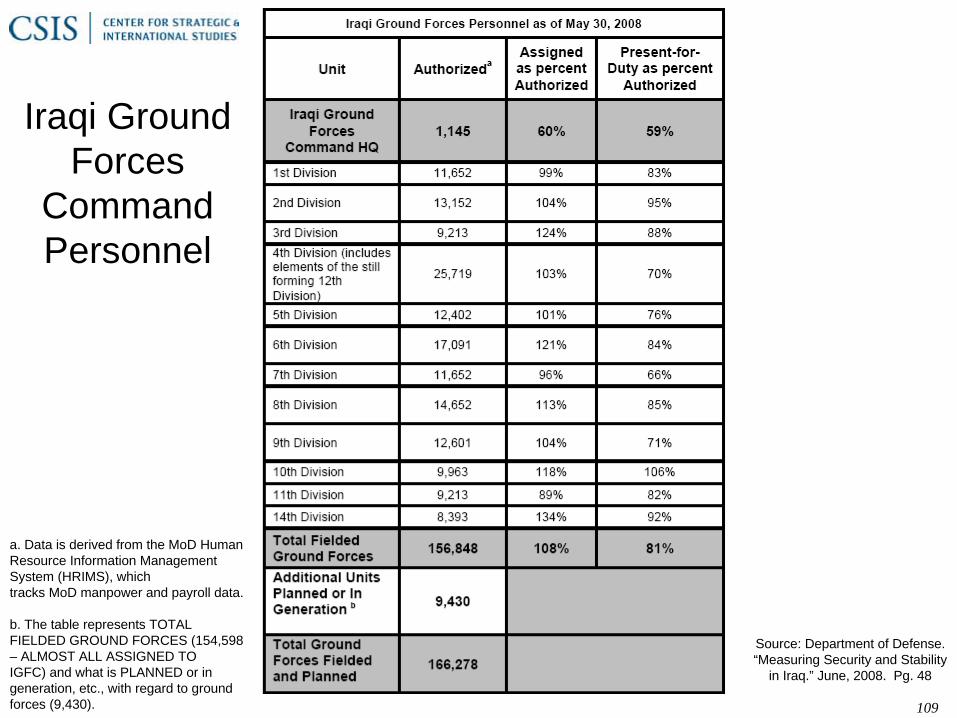
a. Data is derived from the MoD Human Resource Information Management System (HRIMS), whichtracks MoD manpower and payroll data.
b. The table represents TOTAL FIELDED GROUND FORCES (154,598 – ALMOST ALL ASSIGNED TOIGFC) and what is PLANNED or in generation, etc., with regard to ground forces (9,430).
Source: Department of Defense. “Measuring Security and Stability
in Iraq.” June, 2008. Pg. 48
Iraqi Ground Forces
Command Personnel

Copyright Anthony 110
Source: MNF-I April 9, 2008

111Source: Department of Defense. “Measuring Security and Stability in Iraq.” June, 2008. Pg. 55

112
Service 2007 First Quarter 2008
Iraqi Police Service Shurta 30,773 14,304Iraqi Police Service Officer 1,572 373IPS Total 32,345 14,677National Police Shurta 12,343 3,620National Police Officer 206 191NP Total 12,549 3,811Department of Border Enforcement Shurta 1,580 1,071
Department of Border Enforcement Officer 0 82DBE Total 1,580 1,153Facilities Protection Service Shurta 3,238 1,436Facilities Protection Service Officer 39 307FPS Total 3,277 1,743Total Shurta 47,934 20,431Total Officer 1,817 953
MOI Training: 2007-2008
Source: SIGIR, Quarterly Report, April 30, 2008, p. 100

113Source: Department of Defense. “Measuring Security and Stability in Iraq.” June, 2008. Pg. 46

114Source: MNF-I April 9, 2008

Source: ABC/BBC/ARD/NHK POLL - IRAQ FIVE YEARS LATER: WHERE THINGS STAND, Monday, March 17, 2008, and Gary Langer, Director of Polling ABC News, “War in Iraq: The Public Perspective,” presentation to the CSIS, April 30, 2008.

Source: ABC/BBC/ARD/NHK POLL - IRAQ FIVE YEARS LATER: WHERE THINGS STAND, Monday, March 17, 2008, and Gary Langer, Director of Polling ABC News, “War in Iraq: The Public Perspective,” presentation to the CSIS, April 30, 2008.

Source: ABC/BBC/ARD/NHK POLL - IRAQ FIVE YEARS LATER: WHERE THINGS STAND, Monday, March 17, 2008, and Gary Langer, Director of Polling ABC News, “War in Iraq: The Public Perspective,” presentation to the CSIS, April 30, 2008.

Iraqi Conditions of Life, Iraqi Conditions of Life, EconomicsEconomics
• Polling data show important improvements, but major problems remain.
•USG and Iraqi government reporting often meaningless. Macroeconomic data do not reflect distribution of income, distinction between oil export revenues and progress in development, and regional and local differences.
•Data on government spending has many conflicts, and the ability to spend is meaningless unless measures exist to show that spending is productive.
•Unemployment and underemployment figures have no credibility, do not reflect problem of you unemployment, and understate real world problems, Even so, underemployment is reported at 50% or more.
•Important sectarian and ethnic differences.

119
39%43%
23%
55%
62%
46%
0%
10%
20%
30%
40%
50%
60%
70%
80%
90%
Own life: Going well
Local security:Good
Iraq in a year:Expect better
August Now
Life in IraqABC News/BBC/ARD/NHK poll
Source: ABC/BBC/ARD/NHK POLL - IRAQ FIVE YEARS LATER: WHERE THINGS STAND, Monday, March 17,

120
12%
19%
30% 31%
38%
88%
81%
70% 68%62%
0%
10%
20%
30%
40%
50%
60%
70%
80%
90%
100%
Supply ofelectricity
Availabilityof fuel
Jobs Cleanwater
Medicalcare
Good Bad
Ratings of Local Conditions ABC News/BBC/ARD/NHK poll
Source: ABC/BBC/ARD/NHK POLL - IRAQ FIVE YEARS LATER: WHERE THINGS STAND, Monday, March 17, 2008

Source: ABC/BBC/ARD/NHK POLL - IRAQ FIVE YEARS LATER: WHERE THINGS STAND, Monday, March 17, 2008, and Gary Langer, Director of Polling ABC News, “War in Iraq: The Public Perspective,” presentation to the CSIS, April 30, 2008.

Source: ABC/BBC/ARD/NHK POLL - IRAQ FIVE YEARS LATER: WHERE THINGS STAND, Monday, March 17, 2008, and Gary Langer, Director of Polling ABC News, “War in Iraq: The Public Perspective,” presentation to the CSIS, April 30, 2008.

Source: ABC/BBC/ARD/NHK POLL - IRAQ FIVE YEARS LATER: WHERE THINGS STAND, Monday, March 17, 2008, and Gary Langer, Director of Polling ABC News, “War in Iraq: The Public Perspective,” presentation to the CSIS, April 30, 2008.

Source: ABC/BBC/ARD/NHK POLL - IRAQ FIVE YEARS LATER: WHERE THINGS STAND, Monday, March 17, 2008, and Gary Langer, Director of Polling ABC News, “War in Iraq: The Public Perspective,” presentation to the CSIS, April 30, 2008.

Source: ABC/BBC/ARD/NHK POLL - IRAQ FIVE YEARS LATER: WHERE THINGS STAND, Monday, March 17, 2008, and Gary Langer, Director of Polling ABC News, “War in Iraq: The Public Perspective,” presentation to the CSIS, April 30, 2008.

Source: ABC/BBC/ARD/NHK POLL - IRAQ FIVE YEARS LATER: WHERE THINGS STAND, Monday, March 17, 2008, and Gary Langer, Director of Polling ABC News, “War in Iraq: The Public Perspective,” presentation to the CSIS, April 30, 2008.

Source: ABC/BBC/ARD/NHK POLL - IRAQ FIVE YEARS LATER: WHERE THINGS STAND, Monday, March 17, 2008, and Gary Langer, Director of Polling ABC News, “War in Iraq: The Public Perspective,” presentation to the CSIS, April 30, 2008.

Iraqi Budgets and Development Spending

Source: SIGIR, Quarterly Report, January 30, 2008, p. 123.
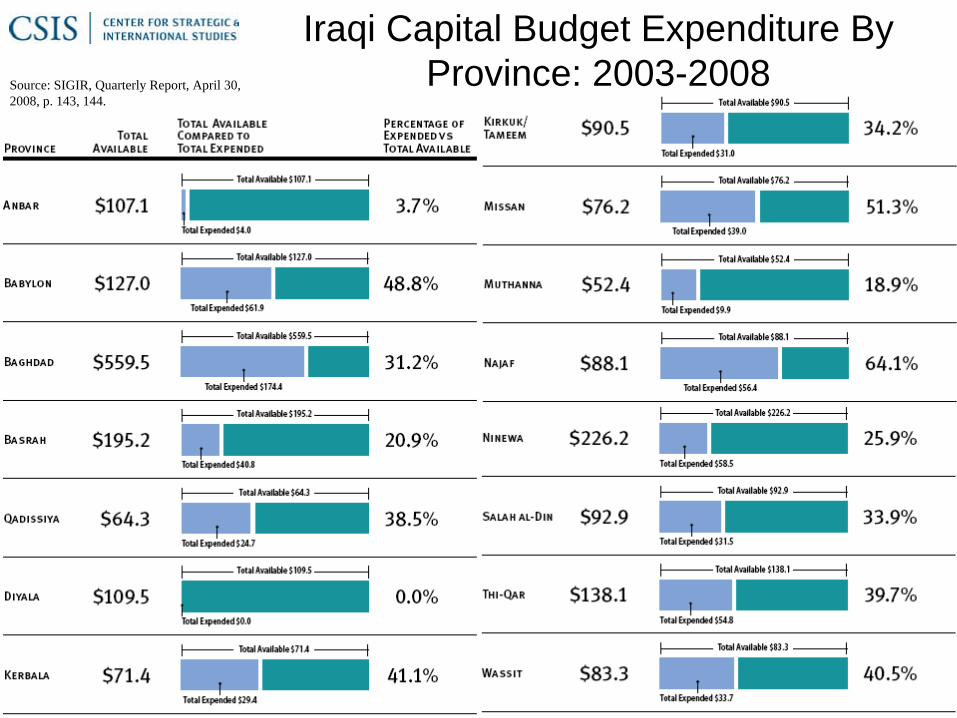
Uncertain Spending &Budget Sharing• Spend on salaries, central government operating costs, but not on capital development.
•At end 2007, had spent 71% of salary budget, 25% of capital budget.
•Total Capital budget for 2007 was $10.1 billion, or 25% of total vs. 18% in 2006.
•But, $6.4B of $10.1 billion was for central government ministries, $1.6 billion went to Kurdish region, and only $2.1 billion went to other provinces.
•Central government ministries get 76% of total budget, Finance Ministry gets 34%.

130
Calendar Year
Capital Budget (In Dinars
Conversion Rate (Dinar/USD)
Iraqi Capital Budget ($US)
Document Source
2003 Not Provided in Dinars
NA $609,500,000 “Republic of Iraq: Budget Revenues and Expenses 2003,July – December”
2004 5,114,323,000,000 1,500 $3,409,548,667 “Presidency of the Iraqi Interim National Assembly: TheState General Budget for 2005”
2005 7,550,000,000,000 1,500 $5,033,333,333 “Presidency of the Iraqi Interim National Assembly: TheState General Budget for 2005”
2006 9,272,000,000,000 1,500 $6,181,333,333 “GOI Budget” (as approved by TNA and written intolaw December 2005); U.S. Treasury, response to SIGIRdata call, 1/4/2008
2007 12,679,254,000,000 1,260 $10,062,900,000 “Approved Iraqi Federal Budget for 2008”; U.S.Treasury, response to SIGIR data call, 4/3/2008
2008 15,671,227,000,000 1,200 $13,059,000,000 “Approved Iraqi Federal Budget for 2008”; U.S.Treasury, response to SIGIR data call, 4/3/2008
Total $38,355,615,333
Iraqi Capital Budgets for Reconstruction: 2003-2008Source: SIGIR, Quarterly Report, April 30,
2008, p. 141.
131
Iraqi Capital Budget Expenditure By Province: 2003-2008Source: SIGIR, Quarterly Report, April 30,
2008, p. 143, 144.

Iraqi Investment Budget and Expenditures: 2005-2007
GAO, Securing, Stabilizing, and Rebuilding Iraq, GAO-08-837June 23, 2008, p. 45
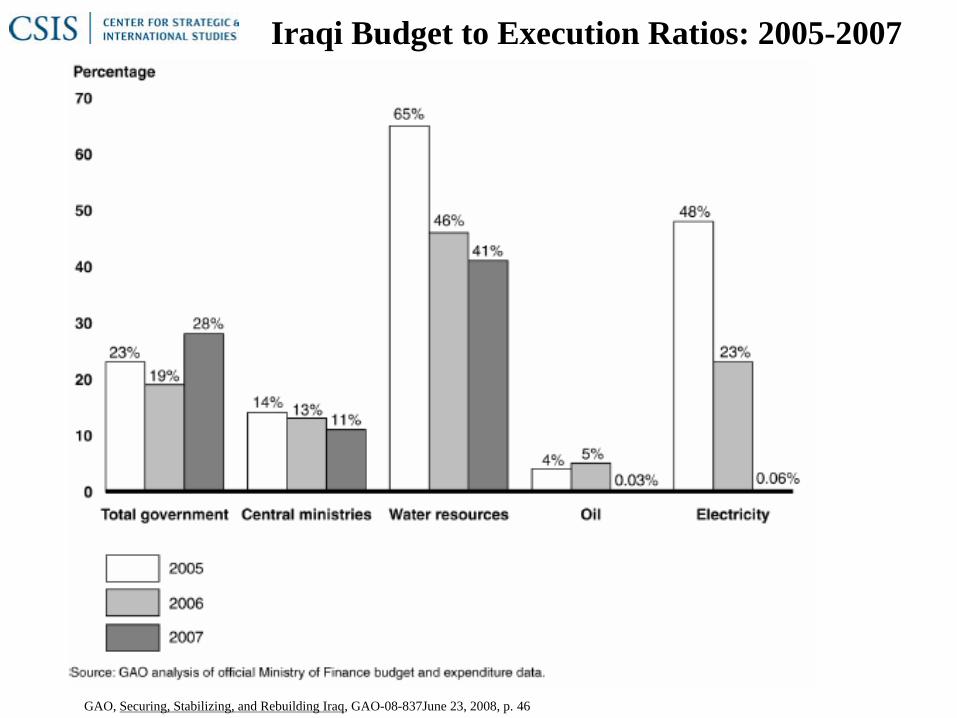
Iraqi Budget to Execution Ratios: 2005-2007
GAO, Securing, Stabilizing, and Rebuilding Iraq, GAO-08-837June 23, 2008, p. 46

Iraqi Oil Production and Oil Exports
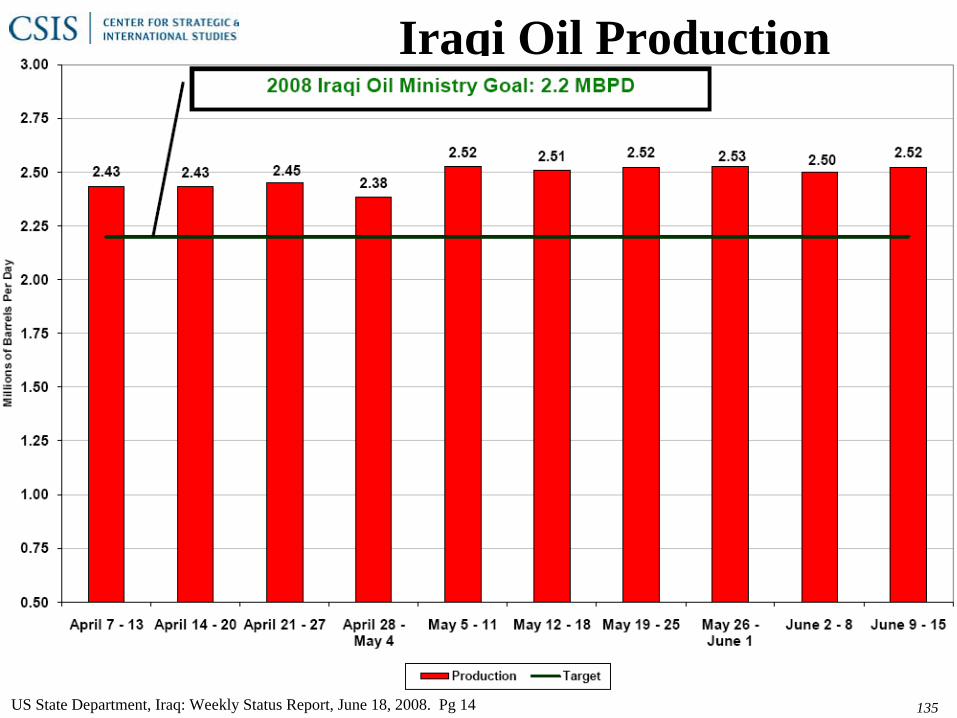
135
Iraqi Oil Production
US State Department, Iraq: Weekly Status Report, June 18, 2008. Pg 14

Iraqi Oil Production & Exports: 2003-2008
Special Inspector General for Iraqi Reconstruction, Quarterly Report to Congress,April 30, 2008, p. 113.
Note: NEA-I, response to SIGIR data call, April 16, 2008, noted that ITAO’s oil data for Iraq differs from NEA-I datafor production, exports, and refined fuels.a Iraq does not receive the OPEC average for its oil. Average price for Iraqi crude oil in 2003 was $25.91 per barrel and $91.66 per barrel in the first quarter of 2008. Source: NEA-I, response to SIGIR data call, April 16, 2008.

137
Iraqi Oil Exports
US State Department, Iraq: Weekly Status Report, June 18, 2008. Pg 15

138
Rise in Iraqi Oil Revenues: 2003-2008
Source: SIGIR, Quarterly Report, April 30, 2008, p. 5

139
The Iraqi Product Import Crisis
US State Department, Iraq: Weekly Status Report, June 18, 2008. Pg 16

Iraqi Electricity and Services

141
The Iraqi Electricity Crisis
US State Department, Iraq: Weekly Status Report, June 18, 2008. Pg 17

US Aid to IraqUS Aid to Iraq• Immense effort between 2001 and 2007 with many local successes.
•But,
•No meaningful measures of effectiveness ever provided.SIGIR has documented immense waste.
•Past major aid program now 95% dispersed.
•Details of combined State and DoD FY2008 and FY2009 plan, program, and budget request unclear. Congress unlikely to fully support request.
• Serious shortfalls in qualified aid, PRT, and EPRT personnel.
• No clear plan to transfer success to Iraqi government management and funding.

143
The Steady Declining Annual Cost of US Aid to IraqTimeline in $US Billions
Source: SIGIR, Quarterly Report, April 30, 2008, p. 36.

Source: SIGIR, Quarterly Report, April 30, 2008, p. 16.
112.5 Billion in Iraqi Reconstruction Funding
Note: Numbers are affected by rounding.a Includes August 11, 2004 transfer of $86 million cash from the Central Bank of Iraq for CERP at the authorization of the Ministry of Finance.b In previous Quarterly Reports, SIGIR reported approximately $20 billion in DFI cumulative deposits to fund Iraqi government operations andreconstruction programs. SIGIR has refined that number to reflect only reconstruction funding, which is approximately $7 billion, according toGAO Report 05-876 (July 28, 2005, p. 2).c For a breakdown of Iraqi capital budget expenditures, CY 2003-2008, see the Governance and Capacity Development section in this Report.d For the description of projects and programs funded by U.S. appropriations, see the endnote referenced in the first paragraph of this overview.e May include humanitarian aid or other types of assistance.
$50.3 Billionn in Iraqi Funds; $46.3
Billionn in US Funds

Source: SIGIR, Quarterly Report, January 30, 2008, p. 17.
Total Reconstruction Funds Now = $113.9 Billion
a. Includes August 11, 2004 transfer of $86 million cash from the Central Bank of Iraq for CERP at the authorization of the Ministry of Finance.b. In previous Quarterly Reports, SIGIR reported approximately $20 billion in DFI cumulative deposits to fund Iraqi government operations andreconstruction programs. SIGIR has redefined that number to include only reconstruction funding, which is approximately $7 billion, according to GAOReport 05-876 (July 28, 2005, p. 2).c. Table 2.1 includes a breakdown of Iraqi capital budget expenditures, CY 2003-2008.d. Where Iraq-only appropriations are unavailable, SIGIR assigned 85% for Iraq based on historical trends.e. May include humanitarian aid or other types of assistance.f. NEA-I, response to SIGIR data call, January 4, 2008.Note: This quarter, SIGIR changed methodology for reporting international donor pledges. Beginning with the January 2008 Quarterly and SemiannualReport to Congress, SIGIR will use the official U.S. government source — DoS:NEA-I — as the sources for pledge data. The dollar change from last quarteris due to the revised reporting method.

CRS Estimate of US Cost of Aid in Afghan and Iraq Wars(In $US Current Billions in Budget Authority)
Source: CRS RL-33110, February 8, 2008, pp. 11 & 13. Includes Foreign aid and diplomatic operations. Afghanistan includes GWOT.
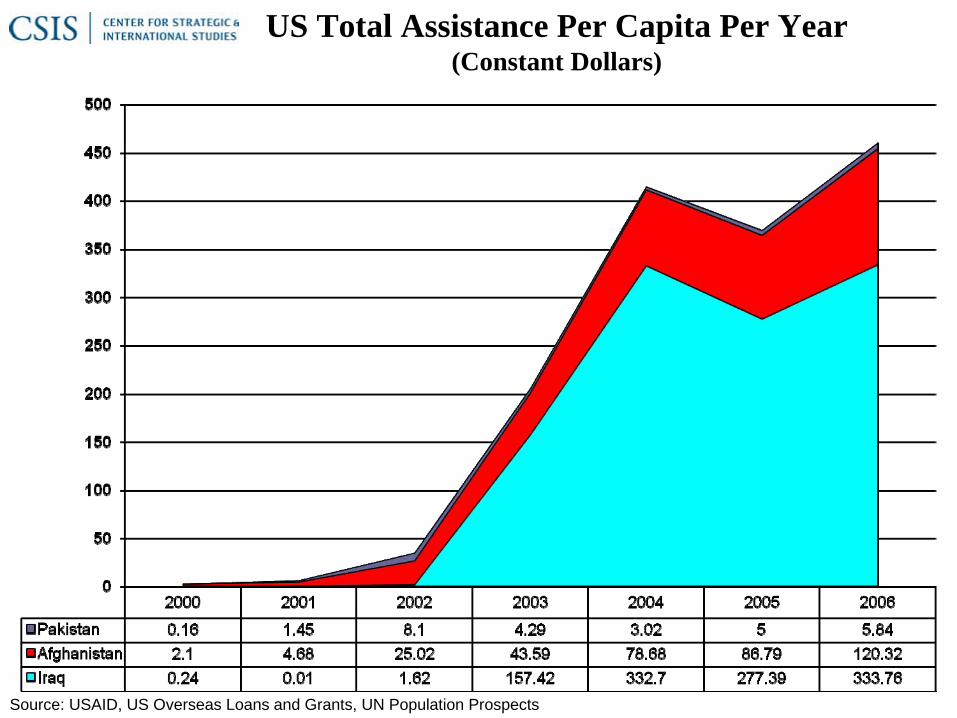
US Total Assistance Per Capita Per Year(Constant Dollars)
Source: USAID, US Overseas Loans and Grants, UN Population Prospects

Source: USAID, US Overseas Loans and Grants, UN Population Prospects
US Economic Assistance Per Capita Per Year(Constant Dollars)

US Aid Request: FY2007-FY2009
Source: US State Department, Congressional Budget Justification, FY2009, pp. 509-510

150
US Aid Spending vs. Projects Completed: 2003-2008
Source: SIGIR, Quarterly Report, April 30, 2008, p. 2

151
Core US Aid is Now 95% Disbursed
US State Department, Iraq: Weekly Status Report, June 18, 2008. Pg 20

Source: ABC/BBC/ARD/NHK POLL - IRAQ FIVE YEARS LATER: WHERE THINGS STAND, Monday, March 17, 2008, and Gary Langer, Director of Polling ABC News, “War in Iraq: The Public Perspective,” presentation to the CSIS, April 30, 2008.

153
PRT and EPRT Locations – March 2008
Source: SIGIR, Quarterly Report, April 30, 2008, p. 34

154
CERP AID Obligations: 2003-2008
Source: SIGIR, Quarterly Report, April 30, 2008, p. 77

155
CERP Project Completions: 2003-2008
Source: SIGIR, Quarterly Report, April 30, 2008, p. 77

Copyright Anthony
H. Cordesm
an, all rights
reserved
156
CERP Allocation by Function: FY 2004-FY 2008
Source: SIGIR, Quarterly Report, April 30, 2008, p. 78
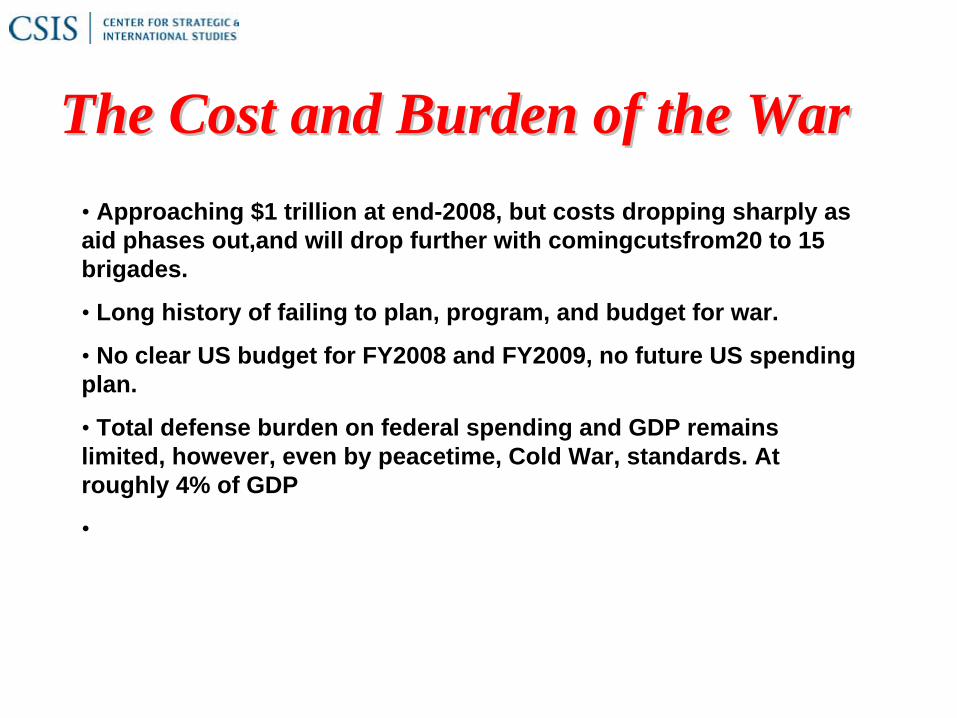
The Cost and Burden of the WarThe Cost and Burden of the War• Approaching $1 trillion at end-2008, but costs dropping sharply as aid phases out,and will drop further with comingcutsfrom20 to 15 brigades.
• Long history of failing to plan, program, and budget for war.
• No clear US budget for FY2008 and FY2009, no future US spending plan.
• Total defense burden on federal spending and GDP remains limited, however, even by peacetime, Cold War, standards. At roughly 4% of GDP
•

158
Annual Cost and Burden of Previous Wars
1 .4
3 7 .5
4 .3
1 4 .2
8 .9
9 .4
4 .9
4 .9
6 .2
5 .2
3 .7
3
3 .4
3 .9
1 1 .1
8 9 .5
3 2 .2
6 9 .4
4 8
4 6
2 3 .8
2 2 .7
2 8 .1
2 3 .9
1 7 .9
1 6 .2
1 7 .3
2 0
7 7 5
1 3 0
4 1 6
3 0 9
4 2 0
2 5 1
2 6 7
3 8 7
3 8 3
3 0 6
2 8 4
3 3 0
4 2 0
0 1 0 0 2 0 0 3 0 0 4 0 0 5 0 0 6 0 0 7 0 0 8 0 0
1 9 3 8 P r e W W I I
1 9 4 5 W W I I I
1 9 5 0
1 9 5 3 K o r e a
1 9 6 3 P r e V ie tn a m
1 9 6 8 P e a k V ie tn a m
1 9 7 7 P o s t V ie tn a m
1 9 8 0 C a r te r
1 9 8 7 P e a k R e a g a n
G u lf W a r 1 9 9 0
1 9 9 5 C lin to n
1 9 9 9 C lin to n L o w
2 0 0 2 G W O T
2 0 0 5 I r a q w a r
% G N P % F e d e r a l S p e n d in g F Y 2 0 0 0 $ U S B B O
Source: Office of the Under Secretary of Defense (Comptroller), National Defense Budget Estimates for FY2006, Washington, Department of Defense, April 2005, Table 7-2, and National Defense Budget Estimates for FY2007, March 2006, Table 7-2. Budget total is for entire national defense, not just the Department of Defense.

159
The Total Cost of Previous Wars (In Billions of $US Dollars)
0
500
1000
1500
2000
2500
3000
3500
Actual Dollars 33 296 67 111 61 384
Constant 2007 Dollars 642 3,211 691 650 92 439
World War I
World War II Korea Vietnam Gulf War
Iraq & War on
Terrorism
Source: Adapted by the author from data provided by the Congressional Research Service as quoted in Defense News, May 8, 2006, p. 3

160
The US Has Long Dealt with Much Higher National Security Burdens: Defense Spending as a
% of GDP Since WWIINational Defense Spending as a Percent of GDP: 1940-2009
(050 Total defense spending for DoD and all agencies as % of GDP)
0
5
1 0
1 5
2 0
2 5
3 0
3 5
4 0
40 45 50
555 60 65 70 75 80 85 90 95 0 5N o s t r a i n o n U S e c o n o m y b y h i s t o r i c a l s t a n d a r d s , e v e n i f
r a i s e d e f e n s e s p e n d i n g b y 1 - 2 % o f G N P
Source: Undersecretary of Defense (Comptroller). National Defense Budget
Estimate for the FY 2009 Budget (Greenbook. March 2008, pp. 216-127.

161
Source: CRS, The Cost of Iraq, Afghanistan, and Other Global War on Terror Operations Since 9/11, RL33110, 30 May 2008, p. 18-20.
CRS Estimate of Total Cost of War To US Through FY2008
CRS report indicates that CBO estimates that cost of next 10 years for both OIF and OEF would be $570 billion more if troops fell to 30,000 by 2010, or $1,055 billion if fell to 75,000 by 2013
By Operation and Funding Source
FY 01 & FY
02 FY 03 FY 04 FY 05 FY 06 FY 07 FY 08
Cum. Enacted
through FY 08 Consol.
Appropriatio ns
Pendi ng FY
08 Req.
Pendi ng
FY09 Req.
Cum. FY
01-FY 08
Req.
OPERATION IRAQI FREEDOM (OIF)
Department of Defense
0 50.0 56.4 83.4 98.5 129.6 72.9 490.3 81.0 49.9 621.2
Foreign Aid and Diplomatic Ops
0 3.0 19.5 2.0 3.2 3.2 0.9 31.7 2.5 1.8 36.0
VA medical 0 0 0 0.2 0.4 0.9 0.7 2.2 0 1.0 3.2
Total Iraq 0 53.0 75.9 85.5 102.0 133.6 74.5 524.2 83.5 52.7 660.4
OPERATION ENDURING FREEDOM (OEF)/Afghanistan and GWOT
Department of Defense
20.0 14.0 12.4 17.2 17.9 34.9 13.9 130.2 20.4 16.1 166.6
Foreign Aid and Diplomatic Ops
0.8 0.7 2.2 2.8 1.1 1.9 1.1 10.6 0.9 2.1 13.6
VA medical 0 0 0 0 0 0.1 0.2 0.3 0 0.3 0.6
Total OEF 20.8 14.7 14.5 20.0 19.0 36.9 15.3 141.1 21.2 18.4 180.8

162
CRS Estimate of US Cost of Afghan and Iraq WarsIncluding DoD, Foreign Aid and VA
(In $US Current Billions in Budget Authority)
2001 &2002
2003 2004 2005 2006 2007 2008
AfghanistanIraq
0
20
40
60
80
100
120
140
Afghanistan 20.8 14.7 14.5 20 19 36.9 15.3Iraq 0 53 75.9 85.8 102 133.6 74.5
2002 & 2001 2003 2004 2005 2006 2007 2008
Cumulative Afghanistan Iraq Cost ThroughFY 2008
Enacted 141.1 524.2
Pending 39.6 136.2
Total Request 180.8 660.4
Source: CRS, The Cost of Iraq, Afghanistan, and Other Global War on Terror Operations Since 9/11, RL33110, 30 May 2008, p. 18-20.

163
CRS Estimate of US DoD Cost of Afghan and Iraq Wars(In $US Current Billions in Budget Authority)
2001 &2002
2003 2004 2005 2006 2007 2008
AfghanistanIraq
0
20
40
60
80
100
120
140
Afghanistan 20 14 12.4 17.2 17 34.9 13.9Iraq 0 50 56.4 84.3 98.5 129.6 72.9
2002 & 2001 2003 2004 2005 2006 2007 2008
Cumulative Afghanistan Iraq Cost ThroughFY 2008
Enacted 130.2 490.3
Pending 36.5 130.9
Total Request 166.6 621.2
Source: CRS, The Cost of Iraq, Afghanistan, and Other Global War on Terror Operations Since 9/11, RL33110, 30 May 2008, p. 18-20.

Source: GAO-08- 423R, GWOT, January 30, 2008, p 5
GAO Estimate of Cost of War To DoD Through FY2007

CBO Estimate of Cost of Defense Activity in Afghanand Iraq Wars, and GWOT, by Category
(In Appropriations of $US Current Billions by Fiscal year)Source: CBO, “Analysis of the Growth in /funding for Operations in Iraq, Afghanistan, and Elsewhere in the War on Terrorism, February 11, 2008.
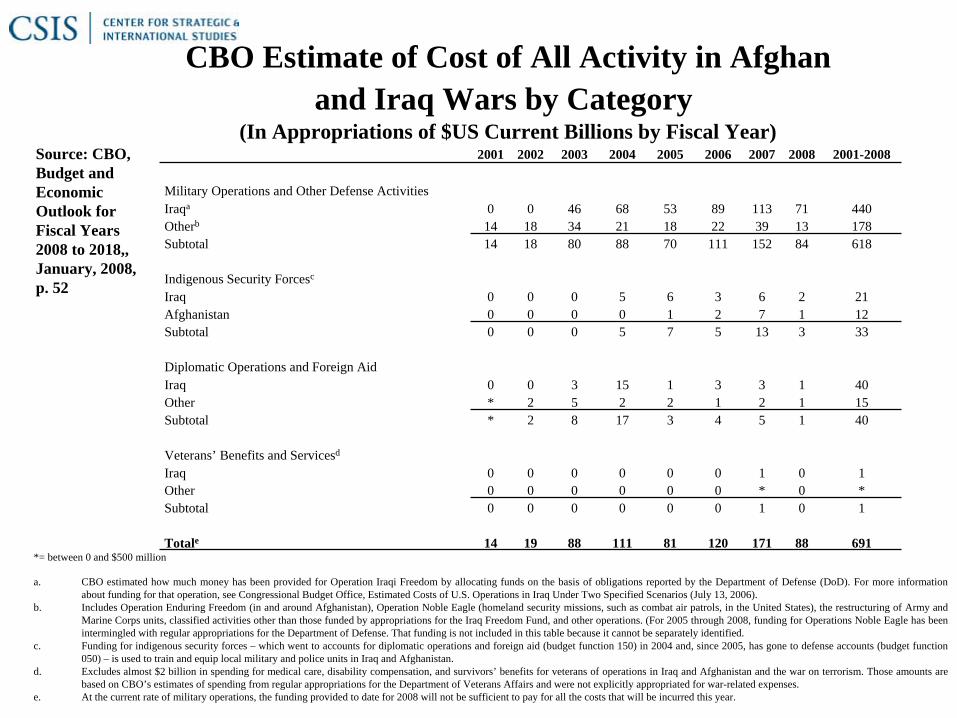
CBO Estimate of Cost of All Activity in Afghanand Iraq Wars by Category
(In Appropriations of $US Current Billions by Fiscal Year)Source: CBO, Budget and Economic Outlook for Fiscal Years 2008 to 2018,, January, 2008, p. 52
2001 2002 2003 2004 2005 2006 2007 2008 2001-2008
Military Operations and Other Defense ActivitiesIraqa 0 0 46 68 53 89 113 71 440Otherb 14 18 34 21 18 22 39 13 178Subtotal 14 18 80 88 70 111 152 84 618
Indigenous Security Forcesc
Iraq 0 0 0 5 6 3 6 2 21Afghanistan 0 0 0 0 1 2 7 1 12Subtotal 0 0 0 5 7 5 13 3 33
Diplomatic Operations and Foreign AidIraq 0 0 3 15 1 3 3 1 40Other * 2 5 2 2 1 2 1 15Subtotal * 2 8 17 3 4 5 1 40
Veterans’ Benefits and Servicesd
Iraq 0 0 0 0 0 0 1 0 1Other 0 0 0 0 0 0 * 0 *Subtotal 0 0 0 0 0 0 1 0 1
Totale 14 19 88 111 81 120 171 88 691*= between 0 and $500 million
a. CBO estimated how much money has been provided for Operation Iraqi Freedom by allocating funds on the basis of obligations reported by the Department of Defense (DoD). For more information about funding for that operation, see Congressional Budget Office, Estimated Costs of U.S. Operations in Iraq Under Two Specified Scenarios (July 13, 2006).
b. Includes Operation Enduring Freedom (in and around Afghanistan), Operation Noble Eagle (homeland security missions, such as combat air patrols, in the United States), the restructuring of Army and Marine Corps units, classified activities other than those funded by appropriations for the Iraq Freedom Fund, and other operations. (For 2005 through 2008, funding for Operations Noble Eagle has been intermingled with regular appropriations for the Department of Defense. That funding is not included in this table because it cannot be separately identified.
c. Funding for indigenous security forces – which went to accounts for diplomatic operations and foreign aid (budget function 150) in 2004 and, since 2005, has gone to defense accounts (budget function 050) – is used to train and equip local military and police units in Iraq and Afghanistan.
d. Excludes almost $2 billion in spending for medical care, disability compensation, and survivors’ benefits for veterans of operations in Iraq and Afghanistan and the war on terrorism. Those amounts are based on CBO’s estimates of spending from regular appropriations for the Department of Veterans Affairs and were not explicitly appropriated for war-related expenses.
e. At the current rate of military operations, the funding provided to date for 2008 will not be sufficient to pay for all the costs that will be incurred this year.

167
When You Truly and Sincerely Can’t or Won't Plan: The Growing Impact of Wartime Supplementals (in $US billions)
Source: Adapted by Anthony C. Cordesman from data provided by Office of the Undersecretary of Defense (Comptroller), “National Defense Budget Estimates for 2008”, Washington, Department of Defense, March 2007.
Of the FY2008 request over $189.3 billion, only $102.5 billion have been enacted by March 2008.

President’s Partly Funded Budget Request for FY2008 and Non-Request FY2009

169
FY 2008 Pending GWOT Request ($US 2009 in Millions)
010,000
20,00030,00040,00050,000
60,00070,00080,000
90,000100,000
Pending 16,767 34,934 44,438 2,946 5,373Enacted 1,072 57,599 27,159 0 0
Military Personnel Operation & Maintenance Procurement RDT&E Construction and
Housing
Source: Office of the Undersecretary of Defense (Comptroller), Defense Budget Materials, available at
http://www.defenselink.mil/comptroller/defbudget/fy2009/GWOT.html.
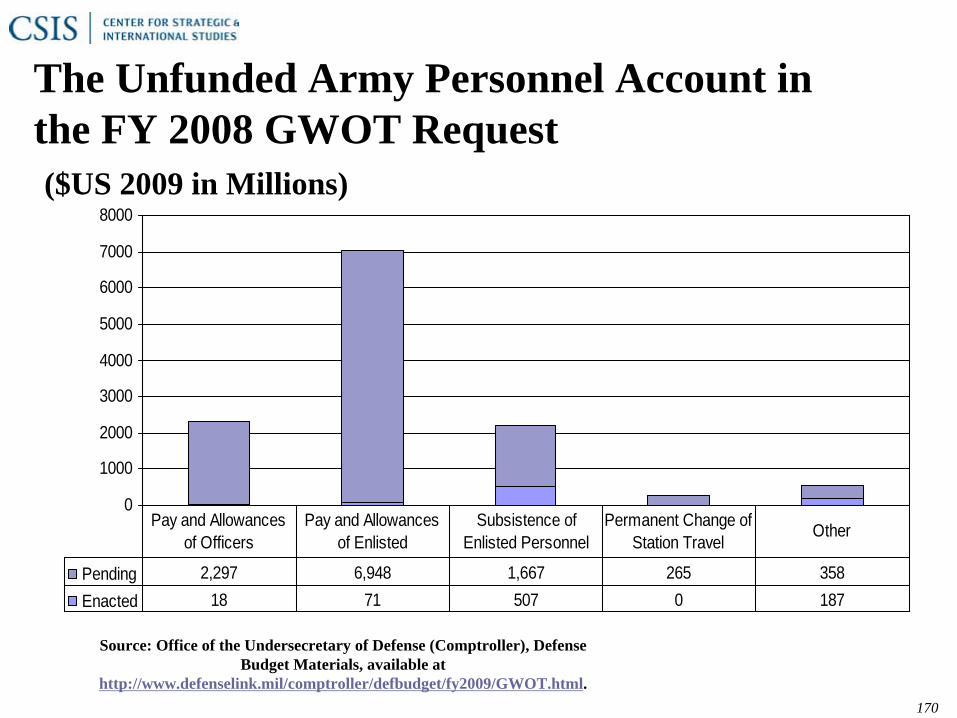
170
The Unfunded Army Personnel Account in the FY 2008 GWOT Request ($US 2009 in Millions)
0
1000
2000
3000
4000
5000
6000
7000
8000
Pending 2,297 6,948 1,667 265 358Enacted 18 71 507 0 187
Pay and Allowances of Officers
Pay and Allowances of Enlisted
Subsistence of Enlisted Personnel
Permanent Change of Station Travel
Other
Source: Office of the Undersecretary of Defense (Comptroller), Defense Budget Materials, available at
http://www.defenselink.mil/comptroller/defbudget/fy2009/GWOT.html.

171
JIEDD and MRAP Funds Are Procurement Priorities in FY2008 GWOT Request ($US 2009 in Millions)
0
5000
10000
15000
20000
25000
Pending 1,182 642 5,860 340 21,103 0 3,860 318 305 1,515 2,444 3,895 2 104 2,430 267 150 0
Enacted 944 0 1,429 154 2,028 4,269 49 0 305 91 703 51 0 0 31 275 0 16,830
Aircraft Procurement,
Missile Procurement,
Procurement of W&TCV,
Procurement of Ammunit
Other Procurement,
JIEDDAircraft Procurement,
Weapons
Procure
Procurement of Ammunit
Other Procurement,
Procurement, MC
Aircraft Procurmeent, Air
Missile Procurement,
Procurement of Ammunit
Other Procurement,
Procurement,
Defense-
Rapid Acquisition Fund
MRAP Fund
Source: Office of the Undersecretary of Defense (Comptroller), Defense Budget Materials, available at http://www.defenselink.mil/comptroller/defbudget/fy2009/GWOT.html.

172
Over $21 Billion Still Outstanding for Procurement of Critical War- Related Equipment
0
2,000
4,000
6,000
8,000
10,000
12,000
Pending 9,683 8,999 2,421
Enacted 1,396 178 454
Tactical and Support Vehicles
Communications and Electronics
Equipment
Other Support Equipment
Roughly 80% of the pending Tactical and Support Vehicles account is shared between four items:
$1.6 billion for 8469 HMMWVs$2.7 billion for 14,103 Medium Tactical Vehicles (FMTV)$2.4 billion for 4,506 Heavy Tactical Vehicles (FHTV)$1.1 billion for the modification of in-service equipment
The Communications and Electronics Equipment account includes critical combat communications gear such as:
$2.2 billion for 170,756 SINCGARS-family tactical radios$0.5 billion for improved high-frequency radios $2.7 billion for bridge to future networks,
all of which is still pending.
Source: Office of the Undersecretary of Defense (Comptroller), Defense Budget Materials, available at http://www.defenselink.mil/comptroller/defbudget/fy2009/GWOT.html.
($US 2009 in Millions)

FY2008 GWOT Spending Priorities, Well- Funded and Un-Funded Accounts (Selected)
($US 2009 in Millions)
0
10000
20000
30000
40000
50000
60000
Pending 11,535 1,734 1,278 18,720 306 1,350 1,500 104 0 0 2,444 3,895
Enacted 783 56 138 35,152 3,966 1,350 1,500 3,747 4,269 16,830 703 51
Military Personnel
, Army
Military Personnel, Marine
Military Personnel
, Air
O&M, Army
O&M, Marine Corps
Afghanistan
Security
Iraq Security Forces
Iraq Freedom
Fund
JIEDD Fund
MRAP Fund
Procurement,
Marine
Air Craft Procurement, Air
Source: Office of the Undersecretary of Defense (Comptroller), Defense Budget Materials, available at http://www.defenselink.mil/comptroller/defbudget/fy2009/GWOT.html.

The Defense Baseline May Understate Costs, But Growth in Federal Spending Will Still Be Driven by Civil Programs
(Trend in Total Spending in FY 2000 $US Billions)
Source: Office of the Undersecretary of Defense (Comptroller). National Defense Budget Estimate for the FY 2009 Budget (Greenbook). March 2008, p. 207.

175
The Between the DoD Projected Budget and Real World Probable Costs: The CBO Estimate
Source: CBO. The Long-Term Implications of Current Defense Plans: Detailed Update for Fiscal Year 2008. March 2009, p. 2.

176
Rising Operations and Support Costs if The US Cannot Cut Wartime Costs & Deployments
CBO: Long Term
Implication s of
Defense Spending,
March 2008, p 4.

177
CBO Estimate Indicates that Probable Cost Escalation Would Still have Limited Impact on Federal Spending and GDP
CBO: Long Term Implications of Defense Spending, March 2008, p.3.

178
CBO Estimate of the Impact of Mandatory Programs on GDP versus
Defense and Other Spending
CBO: The Budget and Economic Outlook: FY2008-2018, January, 2008, pp. 18-19


![the Path Forward in Iraq [COIN in Northern Iraq]](https://static.fdocuments.us/doc/165x107/58a2c7391a28ab724d8b5927/the-path-forward-in-iraq-coin-in-northern-iraq.jpg)