The Intersection of Big Data and Analytics
29
Philip Russom TDWI Research Director for Data Management May 5, 2011 The Intersection of Big Data and Analytics
Transcript of The Intersection of Big Data and Analytics
Philip Russom
TDWI Research Director for Data Management
May 5, 2011
The Intersection of
Big Data and Analytics

2
Sponsor
3
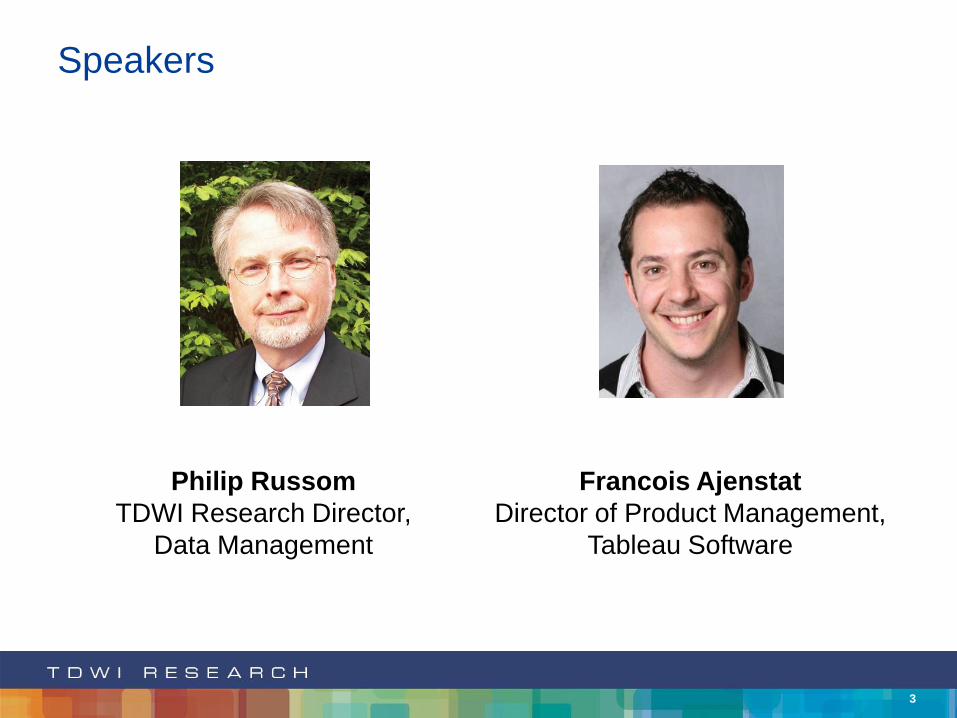
Speakers
Francois Ajenstat
Director of Product Management,
Tableau Software
Philip Russom
TDWI Research Director,
Data Management
4
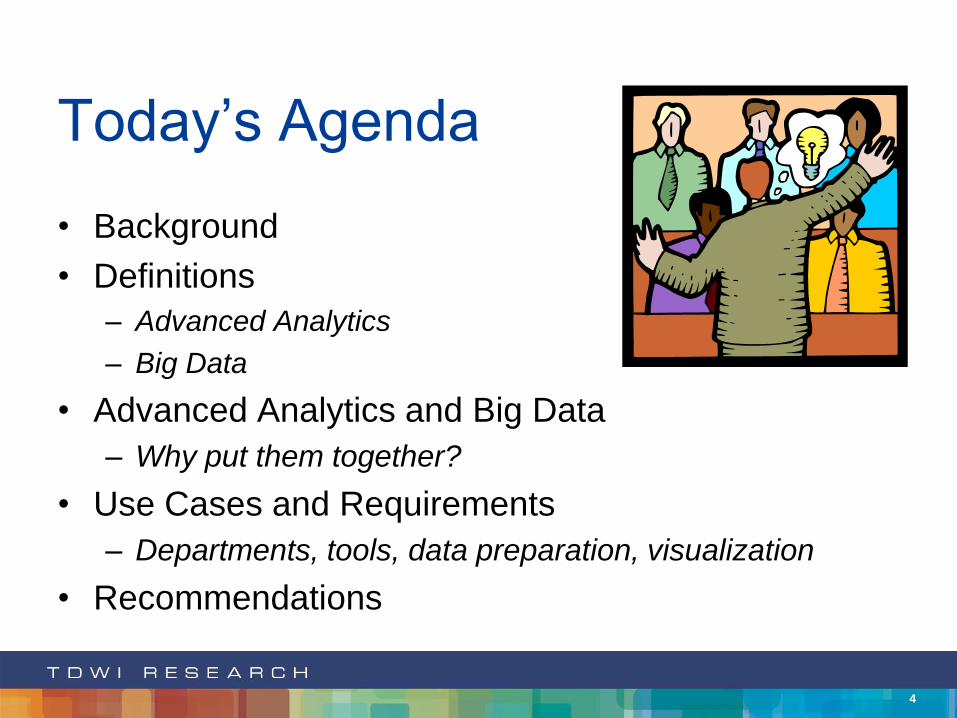
Today’s Agenda
• Background
• Definitions
– Advanced Analytics
– Big Data
• Advanced Analytics and Big Data
– Why put them together?
• Use Cases and Requirements
– Departments, tools, data preparation, visualization
• Recommendations
5
Background
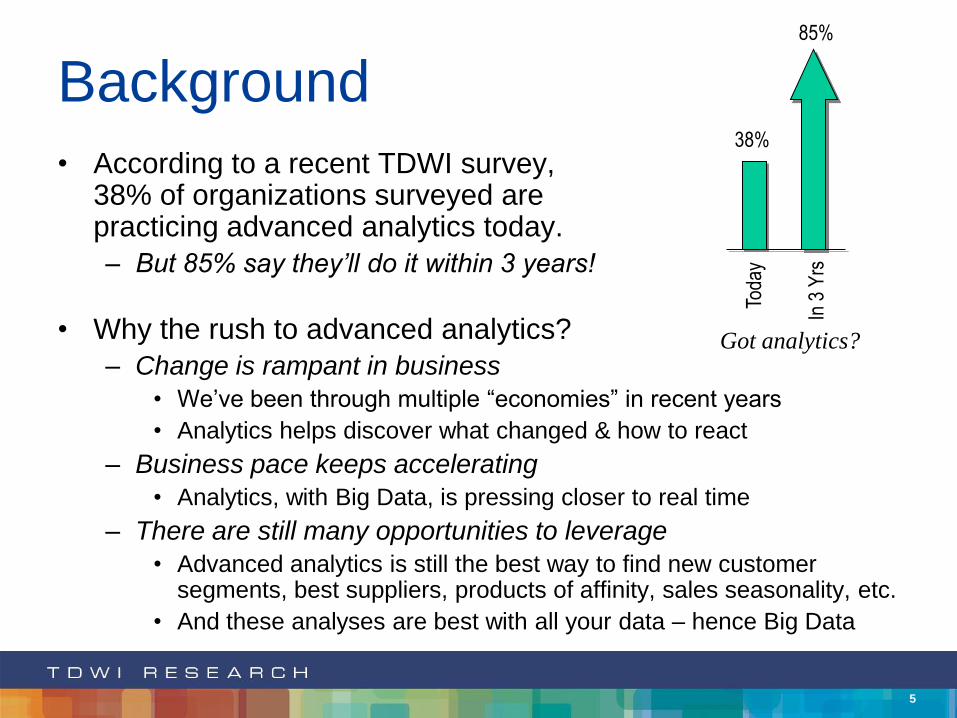
• According to a recent TDWI survey, 38% of organizations surveyed are practicing advanced analytics today.
– But 85% say they’ll do it within 3 years!
• Why the rush to advanced analytics?
– Change is rampant in business
• We’ve been through multiple “economies” in recent years
• Analytics helps discover what changed & how to react
– Business pace keeps accelerating
• Analytics, with Big Data, is pressing closer to real time
– There are still many opportunities to leverage
• Advanced analytics is still the best way to find new customer segments, best suppliers, products of affinity, sales seasonality, etc.
• And these analyses are best with all your data – hence Big Data
Toda
y
In 3
Yrs
38%
85%
Got analytics?

6
Multiple Analytic Methods
• There’s a cross-road intersection
where you choose an analytic
method – or multiple methods!
1. Online Analytic
Processing (OLAP)
2. Extreme SQL
3. Predictive Analytics
4. Other
7
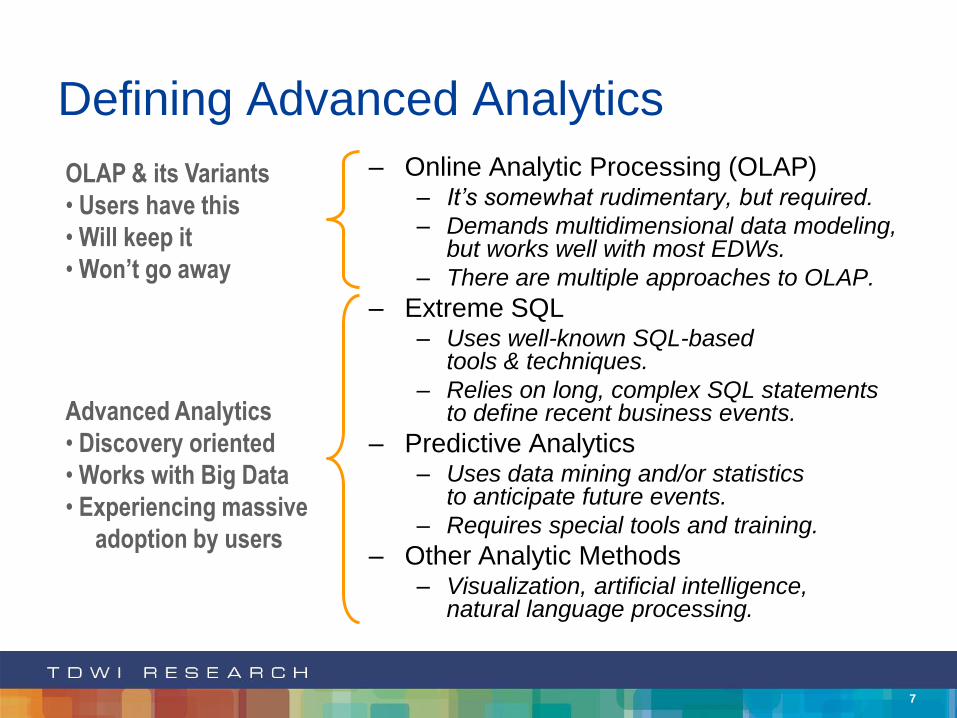
Defining Advanced Analytics
– Online Analytic Processing (OLAP)– It’s somewhat rudimentary, but required.
– Demands multidimensional data modeling,but works well with most EDWs.
– There are multiple approaches to OLAP.
– Extreme SQL– Uses well-known SQL-based
tools & techniques.
– Relies on long, complex SQL statements to define recent business events.
– Predictive Analytics– Uses data mining and/or statistics
to anticipate future events.
– Requires special tools and training.
– Other Analytic Methods– Visualization, artificial intelligence,
natural language processing.
Advanced Analytics
• Discovery oriented
• Works with Big Data
• Experiencing massive
adoption by users
OLAP & its Variants
• Users have this
• Will keep it
• Won’t go away
8
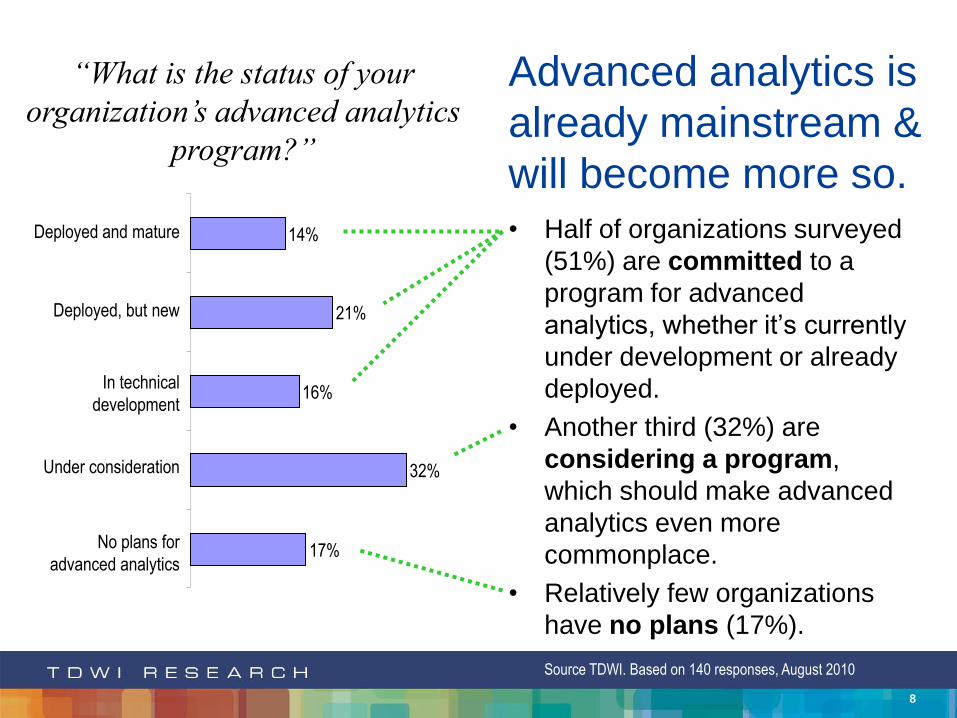
“What is the status of your
organization’s advanced analytics
program?”
Source TDWI. Based on 140 responses, August 2010
Advanced analytics is
already mainstream &
will become more so.• Half of organizations surveyed
(51%) are committed to a
program for advanced
analytics, whether it’s currently
under development or already
deployed.
• Another third (32%) are
considering a program,
which should make advanced
analytics even more
commonplace.
• Relatively few organizations
have no plans (17%).
17%
32%
16%
21%
14%
No plans for
advanced analytics
Under consideration
In technical
development
Deployed, but new
Deployed and mature
9
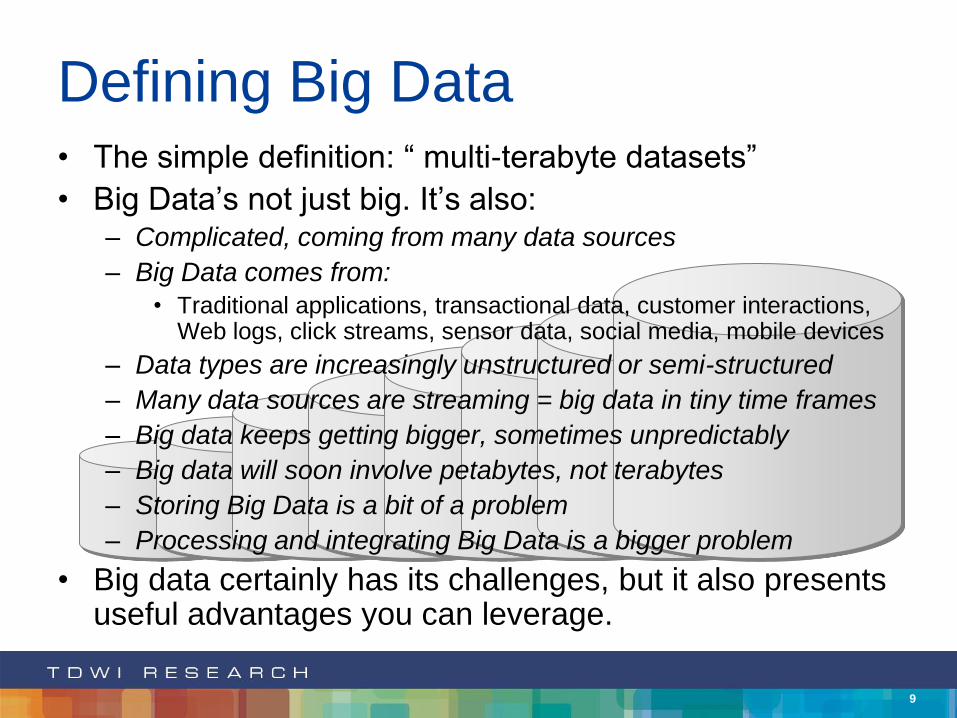
Defining Big Data• The simple definition: “ multi-terabyte datasets”
• Big Data’s not just big. It’s also:– Complicated, coming from many data sources
– Big Data comes from:
• Traditional applications, transactional data, customer interactions, Web logs, click streams, sensor data, social media, mobile devices
– Data types are increasingly unstructured or semi-structured
– Many data sources are streaming = big data in tiny time frames
– Big data keeps getting bigger, sometimes unpredictably
– Big data will soon involve petabytes, not terabytes
– Storing Big Data is a bit of a problem
– Processing and integrating Big Data is a bigger problem
• Big data certainly has its challenges, but it also presents useful advantages you can leverage.
10
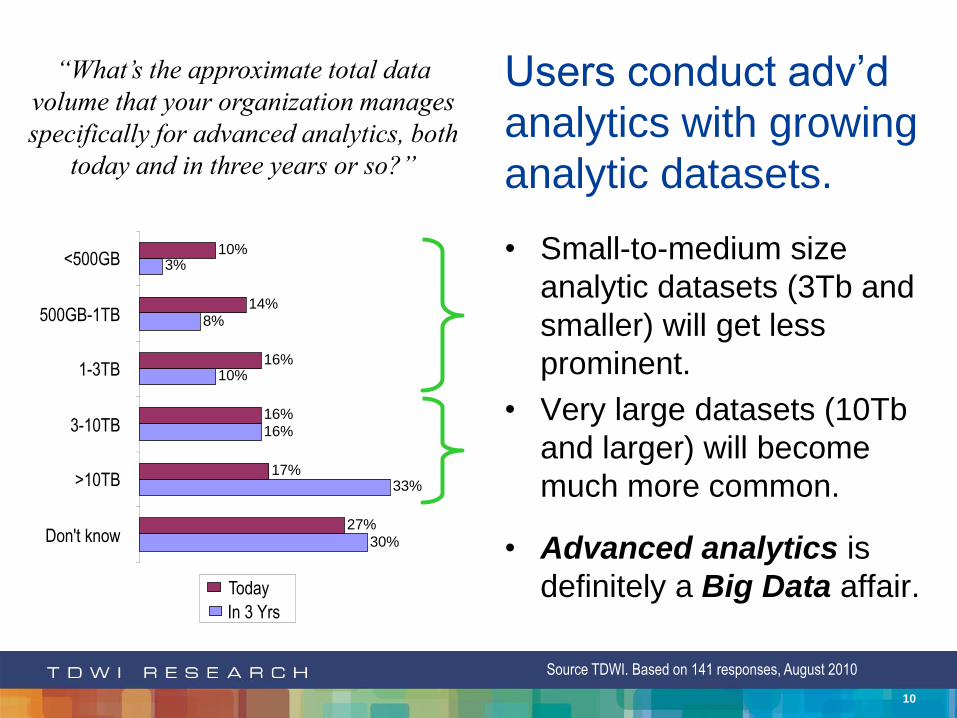
“What’s the approximate total data
volume that your organization manages
specifically for advanced analytics, both
today and in three years or so?”
Source TDWI. Based on 141 responses, August 2010
Users conduct adv’d
analytics with growing
analytic datasets.
• Small-to-medium size
analytic datasets (3Tb and
smaller) will get less
prominent.
• Very large datasets (10Tb
and larger) will become
much more common.
• Advanced analytics is
definitely a Big Data affair.
30%
33%
16%
10%
8%
3%
27%
17%
16%
16%
14%
10%
Don't know
>10TB
3-10TB
1-3TB
500GB-1TB
<500GB
In 3 Yrs
Today
11
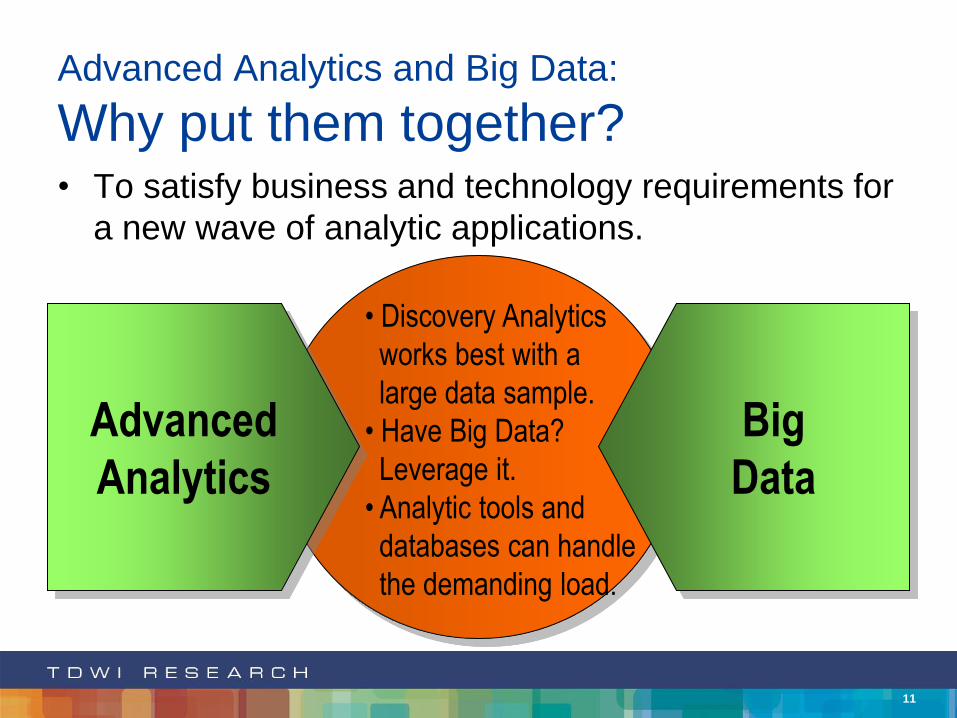
Advanced Analytics and Big Data:
Why put them together?• To satisfy business and technology requirements for
a new wave of analytic applications.
Advanced
Analytics
Big
Data
• Discovery Analytics
works best with a
large data sample.
• Have Big Data?
Leverage it.
• Analytic tools and
databases can handle
the demanding load.
12
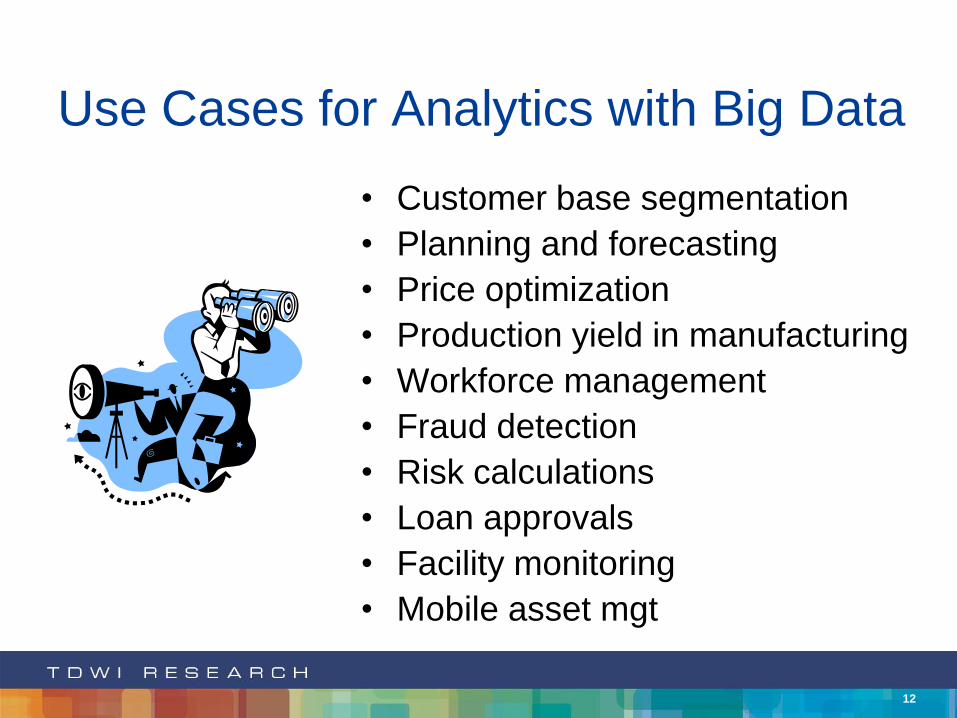
Use Cases for Analytics with Big Data
• Customer base segmentation
• Planning and forecasting
• Price optimization
• Production yield in manufacturing
• Workforce management
• Fraud detection
• Risk calculations
• Loan approvals
• Facility monitoring
• Mobile asset mgt
13
Analytics is a Departmental Requirement
• Analytic applications are, by nature, focused on tasks, data
domains, and opportunities.
– These are strongly associated with specific departments.
• For example:
– Customer base segmentation should be owned and executed by
marketing and sales departments
– The actuarial department does risk analysis
– The procurement department does supply & supplier analysis
• Users face a tough decision:
– Use enterprise BI platforms, designed for reports & OLAP?
– Acquire & build a departmental analytics infrastructure?
• TDWI sees more organizations deploying dep’t BI & analytics.
14
Analytic Tool Complexity is Potential Barrier
• For advanced analytics, does a department:
– Hire people with Ph.D.s in statistics; hand coders capable of
Extreme SQL; designers for predictive models?
– Buy complex, expensive tools for advanced analytics?
– Spend a year developing analytic models?
– Argue over data samples, analytic algorithms?
• To keep it simple and practical, many departments:
– Side step barriers inherent in complex tool deployments
– Acquire a straightforward analytic tool that’s usable by a wide
range of business and technology people in the department
– Adopt analytic methods that leverage advanced data visualization
15
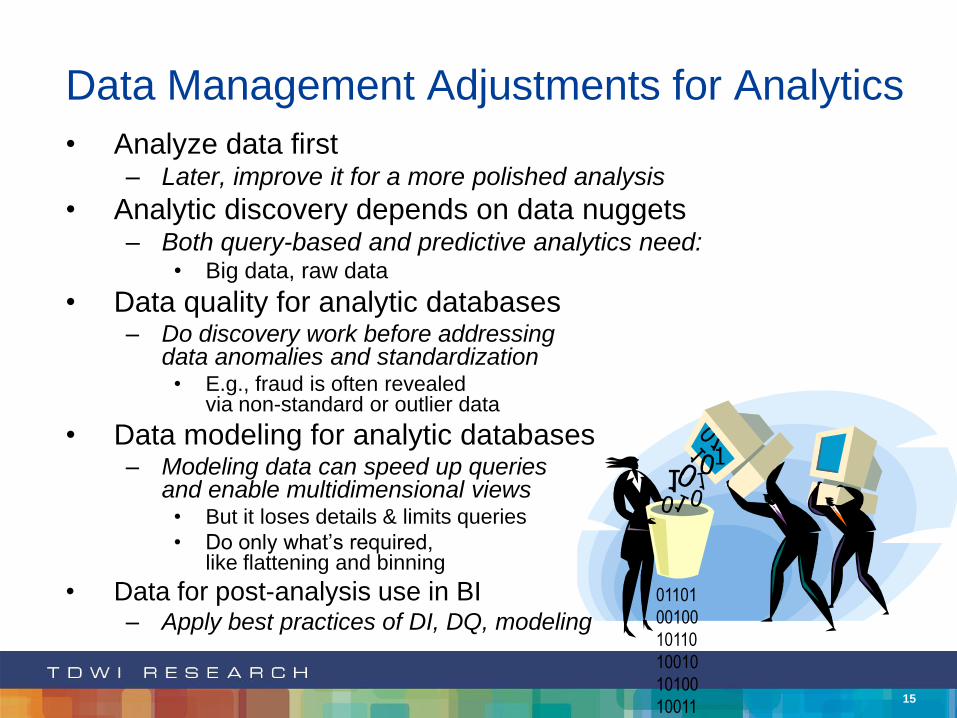
Data Management Adjustments for Analytics
• Analyze data first– Later, improve it for a more polished analysis
• Analytic discovery depends on data nuggets– Both query-based and predictive analytics need:
• Big data, raw data
• Data quality for analytic databases– Do discovery work before addressing
data anomalies and standardization• E.g., fraud is often revealed
via non-standard or outlier data
• Data modeling for analytic databases– Modeling data can speed up queries
and enable multidimensional views • But it loses details & limits queries
• Do only what’s required, like flattening and binning
• Data for post-analysis use in BI– Apply best practices of DI, DQ, modeling
01101
00100
10110
10010
10100
10011
16
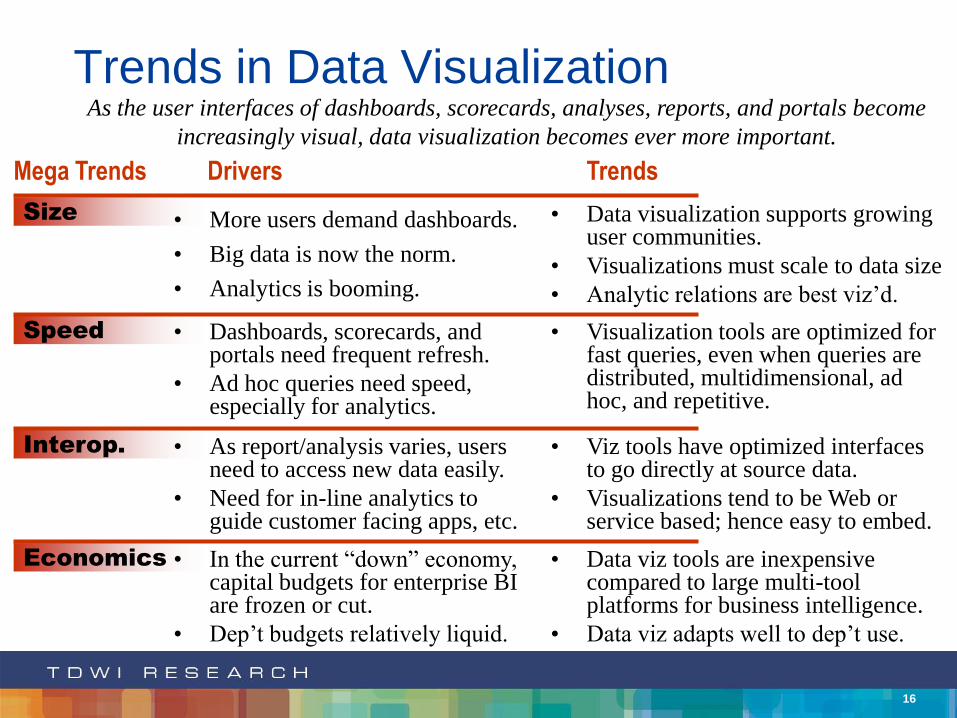
Trends in Data Visualization
Size
Mega Trends Drivers
As the user interfaces of dashboards, scorecards, analyses, reports, and portals become
increasingly visual, data visualization becomes ever more important.
Trends
• Data visualization supports growing user communities.
• Visualizations must scale to data size
• Analytic relations are best viz’d.
Speed • Dashboards, scorecards, and portals need frequent refresh.
• Ad hoc queries need speed, especially for analytics.
• Visualization tools are optimized for fast queries, even when queries are distributed, multidimensional, ad hoc, and repetitive.
Interop. • As report/analysis varies, users need to access new data easily.
• Need for in-line analytics to guide customer facing apps, etc.
• Viz tools have optimized interfaces to go directly at source data.
• Visualizations tend to be Web or service based; hence easy to embed.
Economics • In the current “down” economy, capital budgets for enterprise BI are frozen or cut.
• Dep’t budgets relatively liquid.
• Data viz tools are inexpensive compared to large multi-tool platforms for business intelligence.
• Data viz adapts well to dep’t use.
• More users demand dashboards.
• Big data is now the norm.
• Analytics is booming.
17
Recommendations
• Choose analytic approaches you need.– Select analytic tools that are
appropriate to methods chosen
• Assume that analytics and Big Data go together
– Discovery Analytics works best with a large data sample.
– Have Big Data? Leverage it.
– Analytic tools and databases can handle the demanding load.
• Note that analytics is a departmental affair
– Decide whether to use enterprise BI platforms or acquire tools strictly for departmental use
– Select tools that are appropriate for dept use
• Give the business what it needs
– Reporting and OLAP continue to serve us well
– Complement them with discovery analytics
All rights reserved. © 2011 Tableau Software Inc.
All rights reserved. © 2011 Tableau Software Inc.
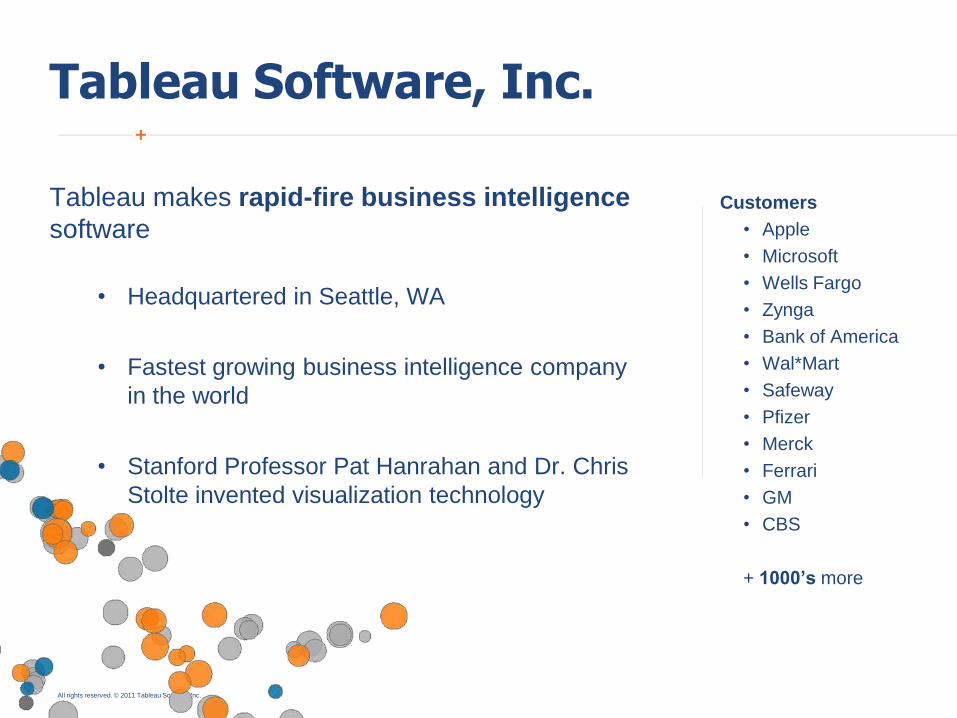
Tableau Software, Inc.
Tableau makes rapid-fire business intelligence
software
• Headquartered in Seattle, WA
• Fastest growing business intelligence company
in the world
• Stanford Professor Pat Hanrahan and Dr. Chris
Stolte invented visualization technology
Customers
• Apple
• Microsoft
• Wells Fargo
• Zynga
• Bank of America
• Wal*Mart
• Safeway
• Pfizer
• Merck
• Ferrari
• GM
• CBS
+ 1000’s more

All rights reserved. © 2011 Tableau Software Inc.
All rights reserved. © 2011 Tableau Software Inc.
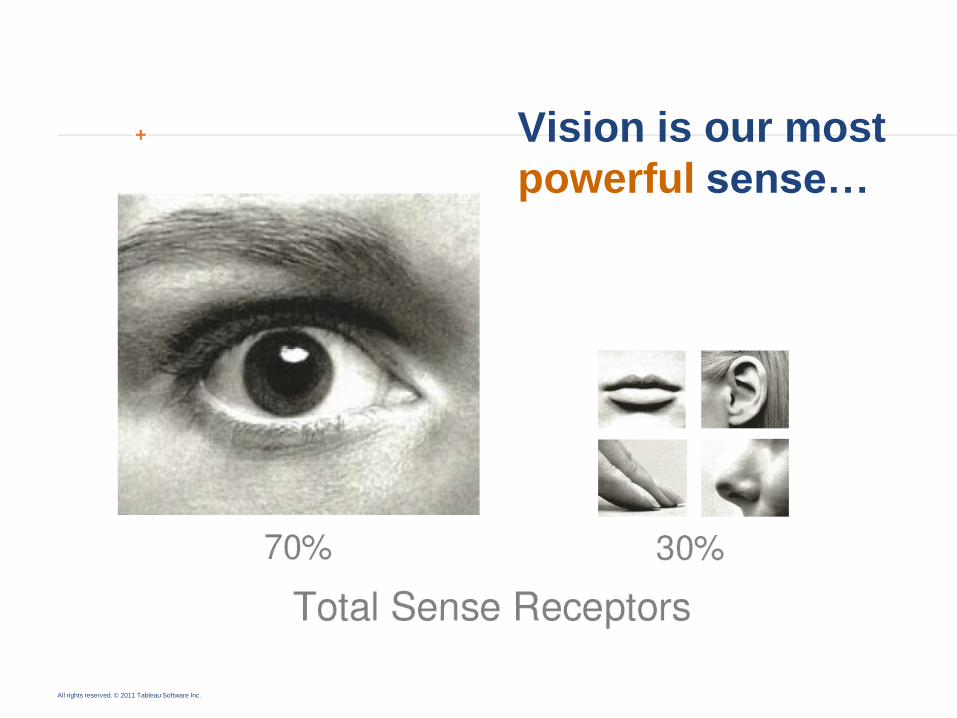
Vision is our most
powerful sense…
All rights reserved. © 2011 Tableau Software Inc.
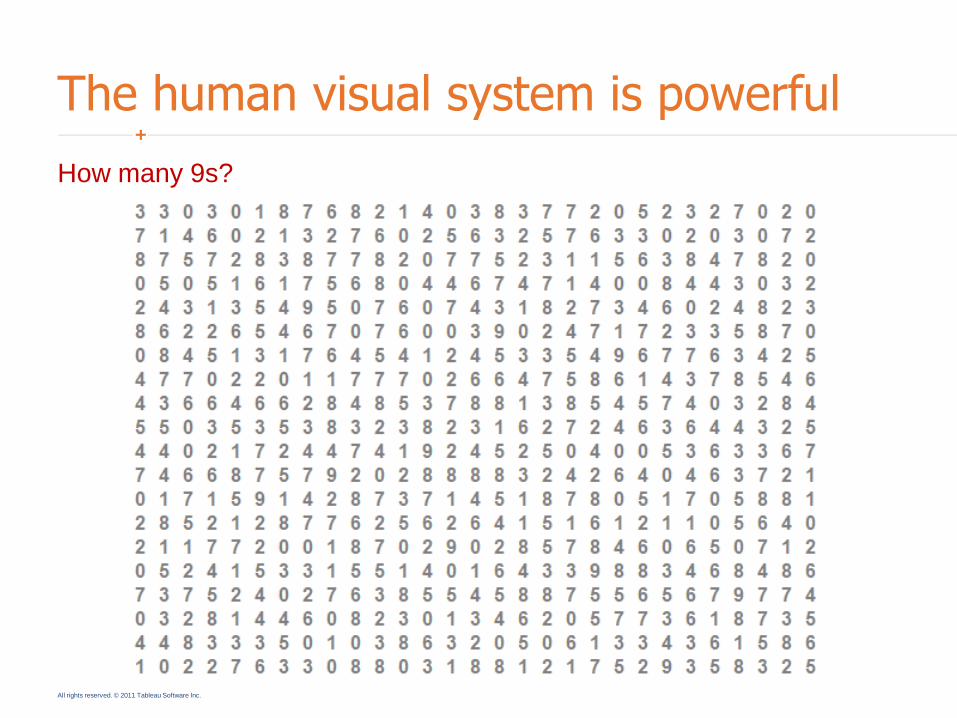
The human visual system is powerful
How many 9s?

All rights reserved. © 2011 Tableau Software Inc.
The human visual system is powerful
All rights reserved. © 2011 Tableau Software Inc.
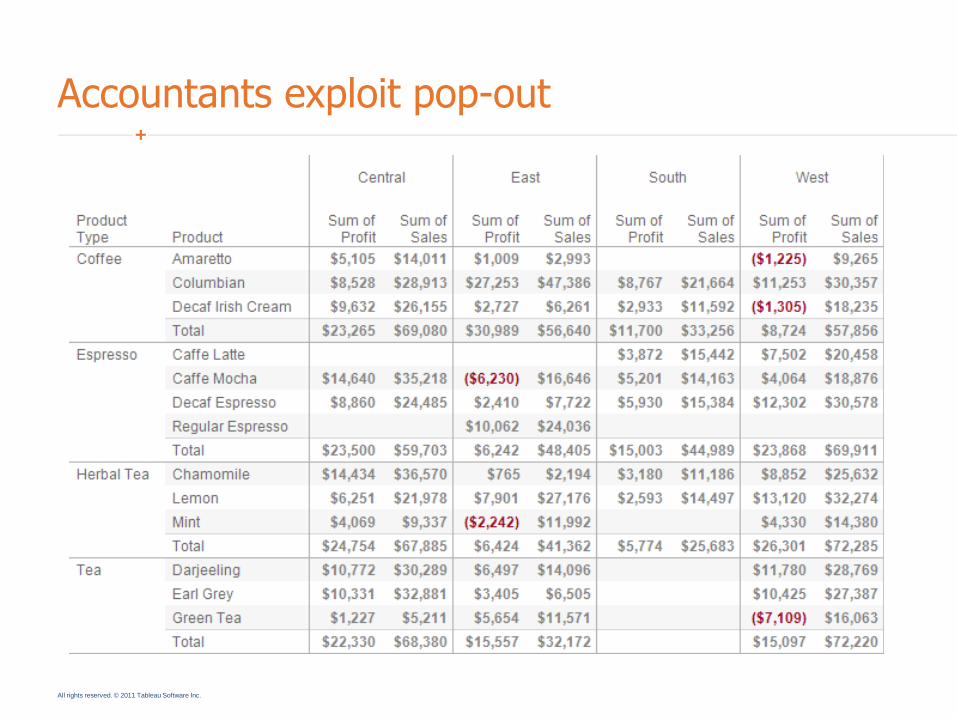
Accountants exploit pop-out

All rights reserved. © 2011 Tableau Software Inc.
The human visual system is powerful
All rights reserved. © 2011 Tableau Software Inc.
Tableau helps people
see and understand data.
All rights reserved. © 2011 Tableau Software Inc.
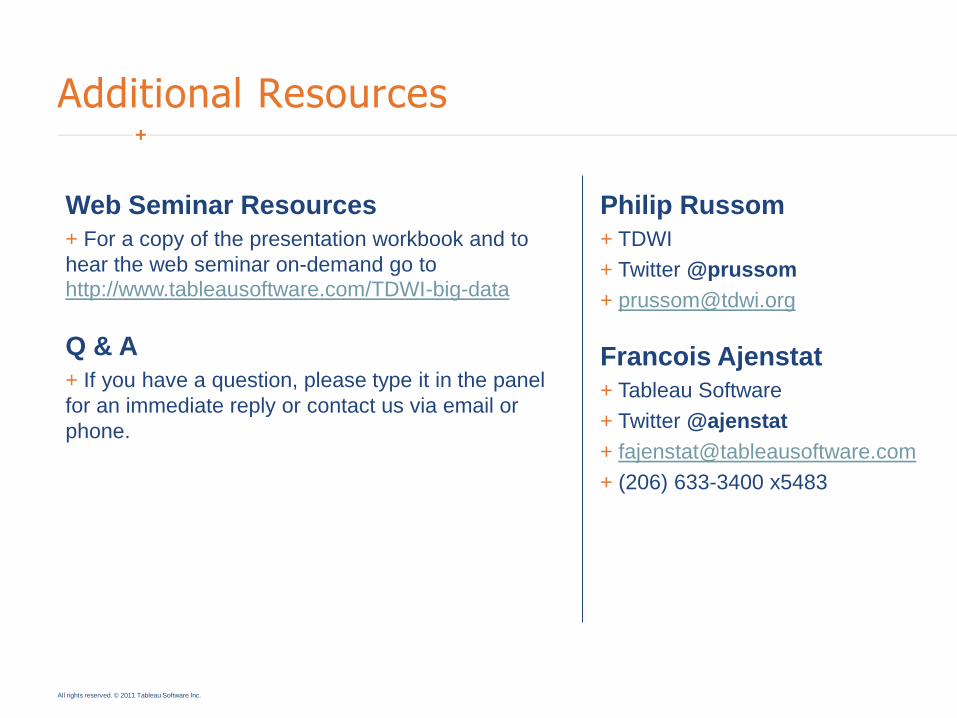
Philip Russom
+ TDWI
+ Twitter @prussom
Francois Ajenstat
+ Tableau Software
+ Twitter @ajenstat
+ (206) 633-3400 x5483
Additional Resources
Web Seminar Resources
+ For a copy of the presentation workbook and to
hear the web seminar on-demand go to http://www.tableausoftware.com/TDWI-big-data
Q & A
+ If you have a question, please type it in the panel
for an immediate reply or contact us via email or
phone.
28
Questions??

29
Contact Information
If you have further questions or comments:
Philip Russom, TDWI
Francois Ajenstat, Tableau