The interrelationship between the face and vocal tract ...
8
The interrelationship between the face and vocal tract configuration during audiovisual speech Chris Scholes a,1 , Jeremy I. Skipper b , and Alan Johnston a a Visual Neuroscience Group, School of Psychology, University of Nottingham, NG7 2RD Nottingham, United Kingdom; and b Experimental Psychology, University College London, WC1H 0AP London, United Kingdom Edited by Anne Cutler, University of Western Sydney, Penrith South, NSW, and approved November 5, 2020 (received for review April 6, 2020) It is well established that speech perception is improved when we are able to see the speaker talking along with hearing their voice, especially when the speech is noisy. While we have a good understanding of where speech integration occurs in the brain, it is unclear how visual and auditory cues are combined to improve speech perception. One suggestion is that integration can occur as both visual and auditory cues arise from a common generator: the vocal tract. Here, we investigate whether facial and vocal tract movements are linked during speech production by comparing videos of the face and fast magnetic resonance (MR) image sequences of the vocal tract. The joint variation in the face and vocal tract was extracted using an application of principal compo- nents analysis (PCA), and we demonstrate that MR image se- quences can be reconstructed with high fidelity using only the facial video and PCA. Reconstruction fidelity was significantly higher when images from the two sequences corresponded in time, and including implicit temporal information by combining contiguous frames also led to a significant increase in fidelity. A “Bubbles” technique was used to identify which areas of the face were important for recovering information about the vocal tract, and vice versa, on a frame-by-frame basis. Our data reveal that there is sufficient information in the face to recover vocal tract shape during speech. In addition, the facial and vocal tract regions that are important for reconstruction are those that are used to generate the acoustic speech signal. audiovisual | speech | PCA W hile speech is predominantly an acoustic signal, visual cues can provide valuable information about the timing and content of the signal. These visual cues become increasingly important when the acoustic signal is degraded, for example, in individuals with hearing problems (1, 2), or when the signal needs to be extracted from noise (3) or mixed competing speech sources, as may occur at a cocktail party (4). Audiovisual speech integration is predominantly discussed in the context of com- paring high-level acoustic and visual representations. For ex- ample, integration has been framed as a temporally focused lexical competition, in which visual information is used to con- strain the corpus of words indicated by the acoustic signal (5). While the neural loci of audiovisual speech integration have been studied extensively (6–11), the exact nature of the visual representation utilized in audiovisual speech integration remains unclear (12). Here, we address the questions of whether and how visual speech signals might provide information that is compat- ible with acoustic speech signals. One possibility is that visual speech cues are mapped onto an internal representation of the speech articulators before being combined with compatible representations derived from auditory information. There is a large amount of evidence for a ubiqui- tous role for sensorimotor systems in auditory and audiovisual speech perception (13). These results are more consistent with theories of speech perception in which contextual information across modalities is used to parse incoming speech [e.g., analysis by synthesis (14)], than either unisensory (15) or motor (16, 17) theories. In analysis by synthesis, a preliminary analysis is done making use of contextual information “derived from analysis of adjacent portions of the signal” which can presumably include visual information (18, p. 99). These are then used to derive the underlying motor commands used to produce that information which are, in turn, used in a predictive manner to constrain in- terpretation of acoustic information arriving in auditory cortex. Analysis by synthesis in particular, in that it contains a model of articulators, provides a clear focus of integration of auditory and visual information. This type of integration would require visual speech information to covary with information about both ob- servable and unobservable articulators during speech production. Here, principal components analysis (PCA) was applied to combinations of frontal image sequences of faces and sagittal fast magnetic resonance (MR) image scans of the vocal tract to assess the extent to which facial speech cues covary with artic- ulator dynamics. PCA has been applied to still images of multiple individuals for facial recognition (19–21) and to sequences of images to highlight regions that are important for dynamic face perception (22). It has also been used to quantify the degrees of correlation between user-defined points on the face and vocal tract during speech production (23). Our approach extends this previous work by applying PCA to whole-image sequences of the face and vocal tract during speech sentence production, rather than specifying regions of interest a priori. A clear benefit to the use of vocal tract MR imaging over electromagnetic articulog- raphy (EMA), which has been used in earlier work, is that it avoids the need for sensors on the tongue, velum, and lips, which may influence articulation. In addition, both the face and vocal tract are densely sampled, and recent work demonstrates that Significance Speech perception is improved when we are able to see the person who is speaking, but how visual speech cues are used to improve speech perception is currently unclear. Brain imaging has revealed that regions responsible for motor control are active during the perception of speech, opening up the possi- bility that visual cues are mapped onto an internal represen- tation of the vocal tract. Here, we show that there is sufficient information in the configuration of the face to recover the vocal tract configuration and that the key areas responsible for driving the correspondence vary in accordance with the artic- ulation required to form the acoustic signal at the appropriate point in a sentence. Author contributions: C.S., J.I.S., and A.J. designed research; C.S. performed research; C.S. contributed new reagents/analytic tools; C.S. analyzed data; and C.S., J.I.S., and A.J. wrote the paper. The authors declare no competing interest. This article is a PNAS Direct Submission. This open access article is distributed under Creative Commons Attribution License 4.0 (CC BY). 1 To whom correspondence may be addressed. Email: [email protected]. This article contains supporting information online at https://www.pnas.org/lookup/suppl/ doi:10.1073/pnas.2006192117/-/DCSupplemental. First published December 8, 2020. www.pnas.org/cgi/doi/10.1073/pnas.2006192117 PNAS | December 22, 2020 | vol. 117 | no. 51 | 32791–32798 PSYCHOLOGICAL AND COGNITIVE SCIENCES Downloaded by guest on December 23, 2021
Transcript of The interrelationship between the face and vocal tract ...
The interrelationship between the face and vocal tractconfiguration during audiovisual speechChris Scholesa,1, Jeremy I. Skipperb, and Alan Johnstona
aVisual Neuroscience Group, School of Psychology, University of Nottingham, NG7 2RD Nottingham, United Kingdom; and bExperimental Psychology,University College London, WC1H 0AP London, United Kingdom
Edited by Anne Cutler, University of Western Sydney, Penrith South, NSW, and approved November 5, 2020 (received for review April 6, 2020)
It is well established that speech perception is improved when weare able to see the speaker talking along with hearing their voice,especially when the speech is noisy. While we have a goodunderstanding of where speech integration occurs in the brain, itis unclear how visual and auditory cues are combined to improvespeech perception. One suggestion is that integration can occur asboth visual and auditory cues arise from a common generator: thevocal tract. Here, we investigate whether facial and vocal tractmovements are linked during speech production by comparingvideos of the face and fast magnetic resonance (MR) imagesequences of the vocal tract. The joint variation in the face andvocal tract was extracted using an application of principal compo-nents analysis (PCA), and we demonstrate that MR image se-quences can be reconstructed with high fidelity using only thefacial video and PCA. Reconstruction fidelity was significantlyhigher when images from the two sequences corresponded intime, and including implicit temporal information by combiningcontiguous frames also led to a significant increase in fidelity. A“Bubbles” technique was used to identify which areas of the facewere important for recovering information about the vocal tract,and vice versa, on a frame-by-frame basis. Our data reveal thatthere is sufficient information in the face to recover vocal tractshape during speech. In addition, the facial and vocal tract regionsthat are important for reconstruction are those that are used togenerate the acoustic speech signal.
audiovisual | speech | PCA
While speech is predominantly an acoustic signal, visual cuescan provide valuable information about the timing and
content of the signal. These visual cues become increasinglyimportant when the acoustic signal is degraded, for example, inindividuals with hearing problems (1, 2), or when the signalneeds to be extracted from noise (3) or mixed competing speechsources, as may occur at a cocktail party (4). Audiovisual speechintegration is predominantly discussed in the context of com-paring high-level acoustic and visual representations. For ex-ample, integration has been framed as a temporally focusedlexical competition, in which visual information is used to con-strain the corpus of words indicated by the acoustic signal (5).While the neural loci of audiovisual speech integration havebeen studied extensively (6–11), the exact nature of the visualrepresentation utilized in audiovisual speech integration remainsunclear (12). Here, we address the questions of whether and howvisual speech signals might provide information that is compat-ible with acoustic speech signals.One possibility is that visual speech cues are mapped onto an
internal representation of the speech articulators before beingcombined with compatible representations derived from auditoryinformation. There is a large amount of evidence for a ubiqui-tous role for sensorimotor systems in auditory and audiovisualspeech perception (13). These results are more consistent withtheories of speech perception in which contextual informationacross modalities is used to parse incoming speech [e.g., analysisby synthesis (14)], than either unisensory (15) or motor (16, 17)theories. In analysis by synthesis, a preliminary analysis is done
making use of contextual information “derived from analysis ofadjacent portions of the signal” which can presumably includevisual information (18, p. 99). These are then used to derive theunderlying motor commands used to produce that informationwhich are, in turn, used in a predictive manner to constrain in-terpretation of acoustic information arriving in auditory cortex.Analysis by synthesis in particular, in that it contains a model ofarticulators, provides a clear focus of integration of auditory andvisual information. This type of integration would require visualspeech information to covary with information about both ob-servable and unobservable articulators during speech production.Here, principal components analysis (PCA) was applied to
combinations of frontal image sequences of faces and sagittalfast magnetic resonance (MR) image scans of the vocal tract toassess the extent to which facial speech cues covary with artic-ulator dynamics. PCA has been applied to still images of multipleindividuals for facial recognition (19–21) and to sequences ofimages to highlight regions that are important for dynamic faceperception (22). It has also been used to quantify the degrees ofcorrelation between user-defined points on the face and vocaltract during speech production (23). Our approach extends thisprevious work by applying PCA to whole-image sequences of theface and vocal tract during speech sentence production, ratherthan specifying regions of interest a priori. A clear benefit to theuse of vocal tract MR imaging over electromagnetic articulog-raphy (EMA), which has been used in earlier work, is that itavoids the need for sensors on the tongue, velum, and lips, whichmay influence articulation. In addition, both the face and vocaltract are densely sampled, and recent work demonstrates that
Significance
Speech perception is improved when we are able to see theperson who is speaking, but how visual speech cues are used toimprove speech perception is currently unclear. Brain imaginghas revealed that regions responsible for motor control areactive during the perception of speech, opening up the possi-bility that visual cues are mapped onto an internal represen-tation of the vocal tract. Here, we show that there is sufficientinformation in the configuration of the face to recover thevocal tract configuration and that the key areas responsible fordriving the correspondence vary in accordance with the artic-ulation required to form the acoustic signal at the appropriatepoint in a sentence.
Author contributions: C.S., J.I.S., and A.J. designed research; C.S. performed research; C.S.contributed new reagents/analytic tools; C.S. analyzed data; and C.S., J.I.S., and A.J. wrotethe paper.
The authors declare no competing interest.
This article is a PNAS Direct Submission.
This open access article is distributed under Creative Commons Attribution License 4.0(CC BY).1To whom correspondence may be addressed. Email: [email protected].
This article contains supporting information online at https://www.pnas.org/lookup/suppl/doi:10.1073/pnas.2006192117/-/DCSupplemental.
First published December 8, 2020.
www.pnas.org/cgi/doi/10.1073/pnas.2006192117 PNAS | December 22, 2020 | vol. 117 | no. 51 | 32791–32798
PSYC
HOLO
GICALAND
COGNITIVESC
IENCE
S
Dow
nloa
ded
by g
uest
on
Dec
embe
r 23
, 202
1

high-resolution cues are important during audiovisual speechperception (24). MR imaging does, however, lack the temporalresolution of EMA (25). PCA operates as a kind of autoasso-ciative memory (26), allowing occluded regions of its inputs to bereconstructed (e.g., 21, 22). We leveraged this feature of PCA torecover vocal tract sequences from facial video sequences andshow that this approach results in reconstructions with highfidelity when compared to the original (ground truth) vocal tractsequence. This demonstrates that an unsupervised learningstrategy can be used to recover the whole vocal tract from theface alone and that this could, in principle, be used as an internalmodel during the process of speech perception.
ResultsReconstructing MR Images of Speech Production. PCA was per-formed on hybrid arrays of MR scans and frontal facial videos ofindividuals repeating the same sentence, as detailed in Materialsand Methods. Fig. 1A shows a frame from the facial video andMR sequence for an example actor (actor 8) and sentence(sentence 1: “Miss Black thought about the lap”), along with thevector field describing how to warp this frame to the referenceframe (see Materials and Methods). Full-sequence videos can befound in Movies S1–S9. The PCA captured regions of the faceand vocal tract that changed during the sentence, for example,the mouth and tongue, effectively ignoring features, such as thebrain and spinal cord, which remained stationary. As PCAoperates as a kind of autoassociative memory, MR sequencescould be reconstructed by projecting just the video input data(Fig. 1C) into the PCA space, and video sequences could bereconstructed by projecting just the MR data into the PCA space.Differences between the original (Fig. 1A) and reconstructed MR
sequences (Fig. 1D) were subtle and resulted from an underesti-mation of facial or vocal tract movement (for the full sequence,see Movie S10). This was reflected in the reconstructed loadings,which can be interpreted as the degree of similarity of the reducedinput vector to each of the principal components (PCs) (Fig. 1E).Since the magnitude of the vector is reduced, and the loadingreflects the projection of the reduced vector onto the PCs, thereconstructed loadings will always be smaller in magnitude thanthe original loadings. Irrespective of these small differences inmagnitude, the loading correlation was high (MR reconstruction:Pearson’s R = 0.85, P < 0.01; video reconstruction: R = 0.87, P <0.01), indicating that the frame sequences for both modalitiescould be reconstructed with high fidelity by projecting the inputdata for the other modality into the PCA space.Delving deeper into the PCA representation, Fig. 2A shows
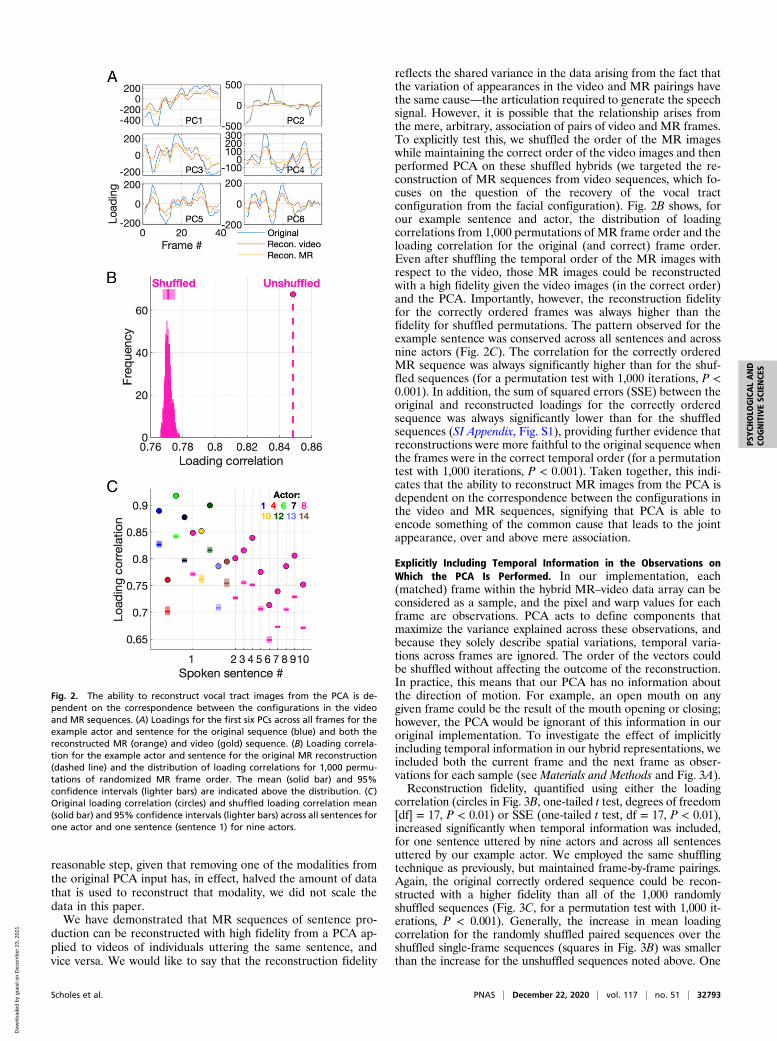
how the loadings for the first six PCs vary on each frame for eachreconstructed modality. For the majority of the PCs, the recon-structed loadings vary in a similar way to the original loadings,albeit at a lower magnitude. This suggests that these PCs accountfor feature variation that is shared across the two modalities, andthis can be visualized in videos reconstructed for each individualPC (Movie S11). In this example, PC 2 exclusively accounted forvariation in the MR sequence; however, as indicated by the highloading correlation, most PCs accounted for shared variationacross the two modalities. An interesting feature of this approachis that the sum of the reconstructed loadings for each frame andPC exactly equals the original loading, such that the recon-structed loadings differ only by a scaling factor from the originalloadings. While this scaling factor varies somewhat across framesand PCs, loadings can be augmented by applying a mean scalingfactor, computed across all PCs and frames. While this seems a
Fig. 1. Overview of image sequence reconstruction after application of PCA to hybrid video–MR images. (A) Example frame for actor 8 and sentence 1. Frameimages are shown for both facial video and MR sequences, with a depiction of the warp field necessary to transform this image to the reference image shownin the panel underneath. The bar to the right shows the 1D serial vector for a slice through this frame, taken column-wise from the RGB pixel values in theimage and the x and y warp vectors. (B) Serial vectors are concatenated across frames to create a 2D array which acts as the input to the PCA (slices througheach frame are depicted here, for display purposes, but the full frames were used in the PCA input). (C) One modality was reconstructed using the input forthe other modality and the PCA. The illustration shows the values for the MR modality have been set to zero. This array was then projected into the PCAspace, and the MR sequence was reconstructed. In the same way, but not depicted here, the video sequence was reconstructed from the MR sequence and thePCA. (D) Reconstructed images for the example frame shown in A. (E) Reconstructed loadings as a function of the original PCA loadings for all frames (bluedots) and for the example frame (red dots), with the reconstructed modality indicated in each panel (VID = facial video).
32792 | www.pnas.org/cgi/doi/10.1073/pnas.2006192117 Scholes et al.
Dow
nloa
ded
by g
uest
on
Dec
embe
r 23
, 202
1
reasonable step, given that removing one of the modalities fromthe original PCA input has, in effect, halved the amount of datathat is used to reconstruct that modality, we did not scale thedata in this paper.We have demonstrated that MR sequences of sentence pro-
duction can be reconstructed with high fidelity from a PCA ap-plied to videos of individuals uttering the same sentence, andvice versa. We would like to say that the reconstruction fidelity
reflects the shared variance in the data arising from the fact thatthe variation of appearances in the video and MR pairings havethe same cause—the articulation required to generate the speechsignal. However, it is possible that the relationship arises fromthe mere, arbitrary, association of pairs of video and MR frames.To explicitly test this, we shuffled the order of the MR imageswhile maintaining the correct order of the video images and thenperformed PCA on these shuffled hybrids (we targeted the re-construction of MR sequences from video sequences, which fo-cuses on the question of the recovery of the vocal tractconfiguration from the facial configuration). Fig. 2B shows, forour example sentence and actor, the distribution of loadingcorrelations from 1,000 permutations of MR frame order and theloading correlation for the original (and correct) frame order.Even after shuffling the temporal order of the MR images withrespect to the video, those MR images could be reconstructedwith a high fidelity given the video images (in the correct order)and the PCA. Importantly, however, the reconstruction fidelityfor the correctly ordered frames was always higher than thefidelity for shuffled permutations. The pattern observed for theexample sentence was conserved across all sentences and acrossnine actors (Fig. 2C). The correlation for the correctly orderedMR sequence was always significantly higher than for the shuf-fled sequences (for a permutation test with 1,000 iterations, P <0.001). In addition, the sum of squared errors (SSE) between theoriginal and reconstructed loadings for the correctly orderedsequence was always significantly lower than for the shuffledsequences (SI Appendix, Fig. S1), providing further evidence thatreconstructions were more faithful to the original sequence whenthe frames were in the correct temporal order (for a permutationtest with 1,000 iterations, P < 0.001). Taken together, this indi-cates that the ability to reconstruct MR images from the PCA isdependent on the correspondence between the configurations inthe video and MR sequences, signifying that PCA is able toencode something of the common cause that leads to the jointappearance, over and above mere association.
Explicitly Including Temporal Information in the Observations onWhich the PCA Is Performed. In our implementation, each(matched) frame within the hybrid MR–video data array can beconsidered as a sample, and the pixel and warp values for eachframe are observations. PCA acts to define components thatmaximize the variance explained across these observations, andbecause they solely describe spatial variations, temporal varia-tions across frames are ignored. The order of the vectors couldbe shuffled without affecting the outcome of the reconstruction.In practice, this means that our PCA has no information aboutthe direction of motion. For example, an open mouth on anygiven frame could be the result of the mouth opening or closing;however, the PCA would be ignorant of this information in ouroriginal implementation. To investigate the effect of implicitlyincluding temporal information in our hybrid representations, weincluded both the current frame and the next frame as obser-vations for each sample (see Materials and Methods and Fig. 3A).Reconstruction fidelity, quantified using either the loading
correlation (circles in Fig. 3B, one-tailed t test, degrees of freedom[df] = 17, P < 0.01) or SSE (one-tailed t test, df = 17, P < 0.01),increased significantly when temporal information was included,for one sentence uttered by nine actors and across all sentencesuttered by our example actor. We employed the same shufflingtechnique as previously, but maintained frame-by-frame pairings.Again, the original correctly ordered sequence could be recon-structed with a higher fidelity than all of the 1,000 randomlyshuffled sequences (Fig. 3C, for a permutation test with 1,000 it-erations, P < 0.001). Generally, the increase in mean loadingcorrelation for the randomly shuffled paired sequences over theshuffled single-frame sequences (squares in Fig. 3B) was smallerthan the increase for the unshuffled sequences noted above. One
Fig. 2. The ability to reconstruct vocal tract images from the PCA is de-pendent on the correspondence between the configurations in the videoand MR sequences. (A) Loadings for the first six PCs across all frames for theexample actor and sentence for the original sequence (blue) and both thereconstructed MR (orange) and video (gold) sequence. (B) Loading correla-tion for the example actor and sentence for the original MR reconstruction(dashed line) and the distribution of loading correlations for 1,000 permu-tations of randomized MR frame order. The mean (solid bar) and 95%confidence intervals (lighter bars) are indicated above the distribution. (C)Original loading correlation (circles) and shuffled loading correlation mean(solid bar) and 95% confidence intervals (lighter bars) across all sentences forone actor and one sentence (sentence 1) for nine actors.
Scholes et al. PNAS | December 22, 2020 | vol. 117 | no. 51 | 32793
PSYC
HOLO
GICALAND
COGNITIVESC
IENCE
S
Dow
nloa
ded
by g
uest
on
Dec
embe
r 23
, 202
1
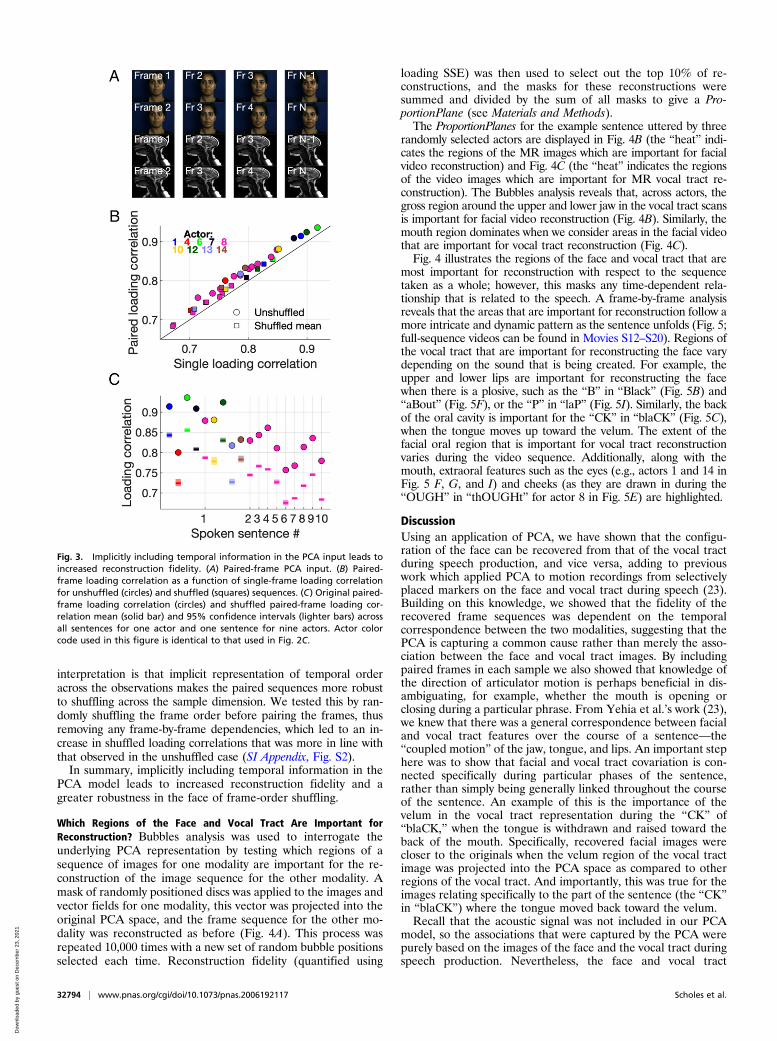
interpretation is that implicit representation of temporal orderacross the observations makes the paired sequences more robustto shuffling across the sample dimension. We tested this by ran-domly shuffling the frame order before pairing the frames, thusremoving any frame-by-frame dependencies, which led to an in-crease in shuffled loading correlations that was more in line withthat observed in the unshuffled case (SI Appendix, Fig. S2).In summary, implicitly including temporal information in the
PCA model leads to increased reconstruction fidelity and agreater robustness in the face of frame-order shuffling.
Which Regions of the Face and Vocal Tract Are Important forReconstruction? Bubbles analysis was used to interrogate theunderlying PCA representation by testing which regions of asequence of images for one modality are important for the re-construction of the image sequence for the other modality. Amask of randomly positioned discs was applied to the images andvector fields for one modality, this vector was projected into theoriginal PCA space, and the frame sequence for the other mo-dality was reconstructed as before (Fig. 4A). This process wasrepeated 10,000 times with a new set of random bubble positionsselected each time. Reconstruction fidelity (quantified using
loading SSE) was then used to select out the top 10% of re-constructions, and the masks for these reconstructions weresummed and divided by the sum of all masks to give a Pro-portionPlane (see Materials and Methods).The ProportionPlanes for the example sentence uttered by three
randomly selected actors are displayed in Fig. 4B (the “heat” indi-cates the regions of the MR images which are important for facialvideo reconstruction) and Fig. 4C (the “heat” indicates the regionsof the video images which are important for MR vocal tract re-construction). The Bubbles analysis reveals that, across actors, thegross region around the upper and lower jaw in the vocal tract scansis important for facial video reconstruction (Fig. 4B). Similarly, themouth region dominates when we consider areas in the facial videothat are important for vocal tract reconstruction (Fig. 4C).Fig. 4 illustrates the regions of the face and vocal tract that are
most important for reconstruction with respect to the sequencetaken as a whole; however, this masks any time-dependent rela-tionship that is related to the speech. A frame-by-frame analysisreveals that the areas that are important for reconstruction follow amore intricate and dynamic pattern as the sentence unfolds (Fig. 5;full-sequence videos can be found in Movies S12–S20). Regions ofthe vocal tract that are important for reconstructing the face varydepending on the sound that is being created. For example, theupper and lower lips are important for reconstructing the facewhen there is a plosive, such as the “B” in “Black” (Fig. 5B) and“aBout” (Fig. 5F), or the “P” in “laP” (Fig. 5I). Similarly, the backof the oral cavity is important for the “CK” in “blaCK” (Fig. 5C),when the tongue moves up toward the velum. The extent of thefacial oral region that is important for vocal tract reconstructionvaries during the video sequence. Additionally, along with themouth, extraoral features such as the eyes (e.g., actors 1 and 14 inFig. 5 F, G, and I) and cheeks (as they are drawn in during the“OUGH” in “thOUGHt” for actor 8 in Fig. 5E) are highlighted.
DiscussionUsing an application of PCA, we have shown that the configu-ration of the face can be recovered from that of the vocal tractduring speech production, and vice versa, adding to previouswork which applied PCA to motion recordings from selectivelyplaced markers on the face and vocal tract during speech (23).Building on this knowledge, we showed that the fidelity of therecovered frame sequences was dependent on the temporalcorrespondence between the two modalities, suggesting that thePCA is capturing a common cause rather than merely the asso-ciation between the face and vocal tract images. By includingpaired frames in each sample we also showed that knowledge ofthe direction of articulator motion is perhaps beneficial in dis-ambiguating, for example, whether the mouth is opening orclosing during a particular phrase. From Yehia et al.’s work (23),we knew that there was a general correspondence between facialand vocal tract features over the course of a sentence—the“coupled motion” of the jaw, tongue, and lips. An important stephere was to show that facial and vocal tract covariation is con-nected specifically during particular phases of the sentence,rather than simply being generally linked throughout the courseof the sentence. An example of this is the importance of thevelum in the vocal tract representation during the “CK” of“blaCK,” when the tongue is withdrawn and raised toward theback of the mouth. Specifically, recovered facial images werecloser to the originals when the velum region of the vocal tractimage was projected into the PCA space as compared to otherregions of the vocal tract. And importantly, this was true for theimages relating specifically to the part of the sentence (the “CK”in “blaCK”) where the tongue moved back toward the velum.Recall that the acoustic signal was not included in our PCA
model, so the associations that were captured by the PCA werepurely based on the images of the face and the vocal tract duringspeech production. Nevertheless, the face and vocal tract
Fig. 3. Implicitly including temporal information in the PCA input leads toincreased reconstruction fidelity. (A) Paired-frame PCA input. (B) Paired-frame loading correlation as a function of single-frame loading correlationfor unshuffled (circles) and shuffled (squares) sequences. (C) Original paired-frame loading correlation (circles) and shuffled paired-frame loading cor-relation mean (solid bar) and 95% confidence intervals (lighter bars) acrossall sentences for one actor and one sentence for nine actors. Actor colorcode used in this figure is identical to that used in Fig. 2C.
32794 | www.pnas.org/cgi/doi/10.1073/pnas.2006192117 Scholes et al.
Dow
nloa
ded
by g
uest
on
Dec
embe
r 23
, 202
1

configurations were intrinsically connected, being those requiredto produce a specific speech sound. Our work aligns with theo-ries on audiovisual integration based on joint causation. Threemodalities (the face, vocal tract, and sound) are all linked to asingle cause, and because of this they share correlated variation(e.g., 27). Note that the relationship uncovered here is based onthe configuration of both the face and the vocal tract, andtherefore the principal link relates to how the face and the vocaltract are structured. This implies that the face provides infor-mation implicitly or explicitly about how the vocal tract isstructured and how this structure changes during speech.Given that speech recognition is modulated (28) and improved
by having access to visual speech cues (3, 29), a comprehensivetheory of speech perception must include an explanation of howvisual speech cues are integrated with the acoustic signal. Themain theories of speech recognition allow for the mapping offacial articulators to an underlying motor representation but varyin the importance assigned to such a mapping. Both the motortheory of speech perception (16, 17) and analysis by synthesis(14) posit an internal representation of speech that is used forboth perception and production. The motor theory is under-scored by a process in which multisensory speech cues aremapped onto speech articulators. For analysis by synthesis, ar-ticulator movements are the “distinctive features” that are usedto synthesize predictions of speech which are then compared tothe analyzed acoustic signal. Other theories of speech perceptionare less reliant on an explicit connection between the vocal tractand face. Fowler’s direct realist theory of speech perception (30)posits that the information available across modalities is reducedto an underlying set of articulatory primitives that explicitly codethe distal event (in this case speech) holistically. How the artic-ulatory primitives are arrived at is still an open question, butneuroimaging work strongly favors a ubiquitous role for senso-rimotor systems (13). The work here provides an important stepby revealing that the full vocal tract configuration, includinghidden articulations, can be recovered from parts of the face.Our approach demonstrated which parts of the facial image
are most informative about vocal tract dynamics. Importantly,although the oral region dominated, extraoral regions such as thecheeks and eyes were also highlighted. Although further inves-tigation would be necessary to confirm whether the eye move-ments were meaningful with respect to the speech, it is likely thatthe cheeks were conveying useful information: they were high-lighted as important as they were drawn in during production of
the “OUGH” of “thOUGHt.” This indicates that visual infor-mation about speech is not limited to the mouth region, addingto previous work (31), and so any application for which speechrecognition is the goal should consider extraoral regions as wellas the mouth. Interestingly, eye-tracking studies have demon-strated that the eye and mouth regions are also those that aremost looked at during face-to-face speech, with the proportion oftime spent looking at each being dependent on task demands.Individuals spend more time looking at the mouth region whenthe task is difficult, for example, when the target speech is pre-sented in noise (32) or is in an unfamiliar language (33), andspeechreading performance has been shown to be positivelycorrelated with the time spent looking at the mouth in deaf andnormal-hearing children (34). Lansing and McConkie (35)showed that the eyes were attended more when analyzing emo-tional or prosodic content and the mouth more when speechsegmentation was the goal. The observation that some parts ofthe face carry more information than others may inform theoriesabout where people look when encoding facial speech.In summary, we show that there is information in the config-
uration of the face about the configuration of the vocal tract. Inaddition, the informative regions of the face and vocal tract varyin both time and space in a way that is consistent with the gen-eration of the speech signal. This is an important proof ofprinciple that the full vocal tract configuration can be reinstatedfrom parts of the face, complementing neuroimaging evidencethat sensorimotor systems are involved in speech perception.
Materials and MethodsActors. Data were collected from 13 actors who were paid an inconvenienceallowance for their participation. Of the 13 actors, only native Englishspeakers were used here (11 actors). The study was conducted under ethicsapproved by local departmental boards at both the University of Nottinghamand University College London. Nine of the eleven native English actors gavesigned consent to use their recordings for analysis and publication, and it isthose nine actors whose data are presented here.
Stimulus Materials and Procedure. The raw data consisted of color videos ofactors repeating a set of sentences and, in a different session, monochromeMR scans of the same actors speech-shadowing these sentences. Facial videowas captured simultaneously from five angles, ranging from side-on tofrontal, using Grasshopper GRAS-03K2C (FireWire) cameras (PointGrey;640 × 480 pixels [px], 30 frames per second [fps], red, green, and blue [RGB]24-bit px format) positioned using a purpose-built camera rig. Audio wascaptured simultaneously, and camera and microphone signals were collated
Fig. 4. A Bubbles analysis reveals the regions of the vocal tract that are important for reconstruction of the face and vice versa, across the whole sentence. (A)Example frame for actor 8 and sentence 1, with a random bubble mask applied to the single video frame (mask was also applied to the warp vector fieldswhich, for clarity, are not depicted here). The bars to the right show the 1D serial vector for this frame, taken column-wise from the RGB pixel values in theimage for the original PCA input (Left bar) and once the bubble mask has been applied to the reconstruction input (Right bar). (B) ProportionPlanes overlaidonto the first frame from the MR sequence (for display purposes only) for three randomly selected actors. (C) ProportionPlanes overlaid onto the first framefrom the video sequence (for display purposes only) for the three actors. In both B and C, the hotter the color, the more that region contributed to the top10% of reconstructions, based on the loading SSE.
Scholes et al. PNAS | December 22, 2020 | vol. 117 | no. 51 | 32795
PSYC
HOLO
GICALAND
COGNITIVESC
IENCE
S
Dow
nloa
ded
by g
uest
on
Dec
embe
r 23
, 202
1

on a Dell desktop computer. Actors were seated in front of a blue screen andread sentences from an autocue controlled by the experimenter.
Facial videos were collected in a single session, in which 10 sentences fromthe speech intelligibility in noise database (Table 1; and ref. 36) were re-peated 20 times. These sentences are from a corpus in which intelligibility,keyword predictability, phonetic content, and length have been balanced.The order of the sentences was randomized, but the same order was usedfor each actor. Subsequently, MR scans were collected across four runswithin which the 10 sentences were repeated 20 times. Speech-shadowingwas used during the MR scan to ensure the actors repeated the sentences ina way that was as similar as possible to the timing of the video recording.Specifically, the audio recording from the video was played back to the actorthrough headphones as they lay in the scanner, and the actor was requiredto reproduce what they heard as closely as possible.
MR Imaging. Vocal tract imaging was done on a 1.5T Siemens Avanto scannerat the Birkbeck–UCL Centre for Neuroimaging. T1-weighted anatomicalimages were collected with an acquisition time of 60 ms (sampling rate 16.67Hz) over a single 10-mmmidsagittal slice of the head and neck (2.125 × 2.125mm, field of view = 256 × 256 mm, repetition time = 56 ms, echo time = 1.24ms). Images were reconstructed using the Gadgetron framework and con-verted to audio video interleave (avi) for further processing.
Hybrid Video Creation. It is difficult to get an ideal view of the face in ascanner, and collecting multiple views from synchronized cameras wouldhave been impossible. In addition, it would be a challenge to completelyremove scanner noise from the speech signal. Thus, since facial video and MRscans were necessarily collected at different times, an initial alignment stagewas required to create hybrid facial–MR frame sequences for each actor and
Fig. 5. Frame-by-frame Bubbles analysis for selected phrases in the example sentence (indicated in bold beside each row) for three randomly selected actors(indicated above each column). ProportionPlanes overlaid onto each frame: the hotter the color, the more that region contributed to the top 10% of re-constructions for that frame, based on the loading SSE.
Table 1. The 10 sentences from the speech intelligibility in noisedatabase used in this paper
1) Miss Black thought about the lap.2) The baby slept in his crib.3) The watchdog gave a warning growl.4) Miss Black would consider the bone.5) The natives built a wooden hut.6) Bob could have known about the spoon.7) Unlock the door and turn the knob.8) He wants to know about the risk.9) He heard they called about the lanes.10) Wipe your greasy hands on the rag.
32796 | www.pnas.org/cgi/doi/10.1073/pnas.2006192117 Scholes et al.
Dow
nloa
ded
by g
uest
on
Dec
embe
r 23
, 202
1

sentence. First, the session-long facial video and MR scans were choppedinto individual sentences using a combination of proprietary automatedMatlab (Mathworks) scripts and ELAN annotation software (Version 5.5, MaxPlanck Institute for Psycholinguistics). We were able to leverage the outputof the Multichannel Gradient Model (outlined below) during this process.Specifically, a reference image was selected to be as close to resting aspossible. The output of the Multichannel Gradient Model (McGM) thendescribed how far each pixel in each frame was from the resting face. Foreach actor, we selected a region of interest around the mouth/vocal tractand summed the McGM vectors for all pixels within this region. Whenviewed across the complete session recording, this vector peaked duringeach speech phrase, and we used the findpeaks function in Matlab to selectout the 50 highest peaks. Custom Matlab code was used to cluster theframes from the speech phrase around each peak, and a video was createdin which each phrase was highlighted with a false color. The videos werethen inspected using the implay function in Matlab, and the start and endframes for each phrase were altered if the automated process had not beensuccessful. This process yielded 20 facial videos and 20 MR scans for eachsentence and actor. Second, each repeat was visually inspected, and thecombination of facial video and MR that most closely matched in time waschosen. To aid in this process, videos containing all 20 video repeats and all20 MR repeats were constructed using Matlab. These videos provided aninitial insight into which combinations of facial and MR sequences would fittogether best. Third, the start and end frame of the MR scan was selectedsuch that the hybrid facial–MR videos were as closely aligned in time aspossible, as assessed by visual inspection of the facial video and MR scansequences presented side by side, again using custom Matlab code.
Preprocessing of MR and Video Data. Video images were reduced by 1/4 (from640 × 480 to 160 × 120 px) using bicubic interpolation. MR images were notrescaled and had a resolution of 120 × 160 px. The PCA implementationrequired an equal number of frames in the video and MR sequences. Videowas recorded at 25 fps, while MR images were acquired at around 16 fps;thus MR image sequences were always shorter than video sequences for thesame utterance. To match the number of video frames for a particularcombination of MR and video sequence, a scaling factor was calculated:
scale factor = Nvid=NMR
where Nvid was the number of video frames and NMR was the number of MRimages. The first frame and every rounded scaled frame were retained forfurther processing (e.g., if there were six MR frames and nine video frames,the scale factor would be 1.5, and the retained frame set would be round [1,2.5, 4, 5.5, 7, 8.5] = [1, 3, 4, 6, 7, 9]).
Input to the PCA. A two-dimensional (2D) array was constructed for eachmodality (Fig. 1B), with each frame represented as a serialized vector con-taining the RGB pixel values for that frame concatenated with a serializedvector describing the local motion required to warp the current frame ontoa reference frame (Fig. 1A; and refs. 37 and 38). This vector field was com-puted using a two-frame adaptation of the McGM, an optic flow algorithmmodeled on the processing of the human visual system (39, 40). The arraysfor each modality were then concatenated to give a multimodality hybridarray of observation by frame. Thus, each matched frame in the facial videoand MR sequences was explicitly represented as a combination of the war-ped texture (pixel values) and the warp vector field (shape) information.
Reconstruction and Quantification of Fidelity. PCA was performed on themultimodal hybrid arrays. To investigate the extent to which the PCA cap-tured shared variation between the two modalities, only one of the mo-dalities was projected into the PCA space, and the information about bothmodalities was reconstructed (using all of the PCs; Fig. 1C). To achieve this,the pixel and warp vector values for one modality in the original multimodalarray were set to zero, and then the inner product of the PCs and this partialarray was computed.
To quantify the fidelity of the reconstructions, we compared reconstructedfacial/MR sequences (see Fig. 1D for an example frame representation) withthe original facial/MR sequence (Fig. 1A). One approach would be to cor-relate frame-by-frame RGB pixel values from the original and reconstructedsequences and to use the correlation coefficient as a metric for reconstruc-tion fidelity. However, as reported previously (22), pixel correlations are notsensitive enough to provide a reliable metric of fidelity. The images acrossframes are inherently similar, especially in static regions such as the back-ground, and this results in pixel correlations that are invariably high. A moreappropriate metric of reconstruction fidelity is arrived at by plotting the
loadings (eigenvalues) from the original PCA against those from thereconstructed representation (when only the facial video representationshave been projected into the PCA space; Fig. 1E). A perfect reconstructionwould result in all of the points lying on the unity line in Fig. 1E, and recon-struction fidelity can be quantified as a deviation from this pattern. The cor-relation between these sets of loadings, referred to here as the loadingcorrelation, has been used previously to quantify categorization performance,as it corresponds well to similarity judgments in human observers (22).
Selection of the Reference Frame. To select a reference frame for each imagesequence, we employed a replicable and objective procedure that involved it-erating through theMcGM process a number of times. On the first iteration (I1),the reference image was chosen randomly. The output of the McGM processconsisted of vectors describing the horizontal and vertical warping necessary toproject each frame to the reference and a texture vector comprised of theimage on the basis of which the warp vectors would reconstruct the originalimage from the reference. If the McGM was perfectly accurate, this recon-structed texture vector would be identical to the reference image. The refer-ence image for each subsequent iteration (IN) was set to the mean texturevector from the previous iteration (IN −1). Simulations with a subset of data (forone sentence from three actors) demonstrated that both pixel and loadingcorrelations between successive iterations converged with each iteration. Re-construction fidelity after three iterations demonstrated low variability irre-spective of the original choice of reference frame, and this variability did notdiminish markedly with further iterations. Thus, for all of the data presentedhere, the warp vectors from the third iteration were used as input to the PCA.
Bubbles Analysis. To assess which regions of the video andMR sequences wereimportant for reconstruction of the othermodality, an adapted version of theBubbles method was employed (22, 41). Each vectorized representation ofthe frames in the facial video sequence (the RGB pixel values and the warpvectors) was occluded using an identical mask consisting of a vectorizedversion of a set of randomly positioned discs (Fig. 4A) ensuring spatialalignment of the input data and the masks. The MR sequence was thenreconstructed, as before, but using the occluded video sequence. Specifi-cally, the 2D RGB pixel values and 2D x and y warp vectors for each videoframe were separately multiplied by the 2D Boolean mask. The resultingarrays were then serialized and concatenated with the complete array forthe MR frame sequence such that each frame was represented by a one-dimensional (1D) array. As before, the pixel and motion vector values for theMR sequence in the original multimodal array were set to zero, and then theinner product of the PCs and this partial array was computed. This processwas repeated for 10,000 masks, with bubble positions randomly varied oneach iteration. The reconstruction fidelity for each iteration was quantifiedas the SSE between the loadings from the original PCA (applied to thecomplete dataset) and the loadings from the sequence that was recon-structed using the bubble-occluded arrays. To measure the regions which ledto the greatest reconstruction fidelity (ProportionPlane), the bubble masksfor the iterations with the lowest 10% SSE were summed together (Cor-rectPlane) and divided by the total sum of all masks (TotalPlane). The Pro-portionPlane was computed across the whole frame sequence and alsoindividually for each frame in the sequence, to give a dynamic snapshot ofwhich regions led to the highest reconstruction fidelity at each point duringthe sequence. We used hard-edged Boolean discs rather than the Gaussianblobs that were used originally (41) because the warp vectors were absoluteand so should not be scaled. The diameter of the discs was 12 px (the full-width half-maximum of the Gaussian blobs of 5-px SD that were used pre-viously), and the number of bubbles was twice that used previously (46 asopposed to 23 bubbles in ref. 22), to account for a doubling in the size of theimages used here compared with previous work. To assess which regions ofthe MR sequences were important for reconstruction of the facial videosequences, ProportionPlanes were computed using the same process, but inthis case the video sequences were reconstructed from MR sequences usingthe bubble-masks approach.
Data Availability.Data and example analysis scripts can be found inOpen ScienceFramework (OSF) at https://osf.io/3m5pr/?view_only=701b185e4b5f475-aa9057fb770e370da. Matlab data have been deposited in the OSF data-base (https://osf.io/) (DOI: 10.17605/OSF.IO/3M5PR).
ACKNOWLEDGMENTS. We thank Anh Cat Le Ngo for data collection. C.S., J.I.S.,and A.J. were supported by an Engineering and Physical Sciences ResearchCouncil New Pathways to Hearing grant [grant number EP/M026965/1]. A.J. wassupported by the National Institute for Health Research Nottingham BiomedicalResearch Centre.
Scholes et al. PNAS | December 22, 2020 | vol. 117 | no. 51 | 32797
PSYC
HOLO
GICALAND
COGNITIVESC
IENCE
S
Dow
nloa
ded
by g
uest
on
Dec
embe
r 23
, 202
1

1. N. Altieri, D. Hudock, Hearing impairment and audiovisual speech integration ability:A case study report. Front. Psychol. 5, 678 (2014).
2. N. P. Erber, Use of hearing aids by older people: Influence of non-auditory factors(vision, manual dexterity). Int. J. Audiol. 42 (suppl. 2), S21–S25 (2003).
3. W. H. Sumby, I. Pollack, Visual contribution to speech intelligibility in noise. J. Acoust.Soc. Am. 26, 212–215 (1954).
4. E. C. Cherry, Some experiments on the recognition of speech, with one and with 2ears. J. Acoust. Soc. Am. 25, 975–979 (1953).
5. J. E. Peelle, M. S. Sommers, Prediction and constraint in audiovisual speech percep-tion. Cortex 68, 169–181 (2015).
6. J. I. Skipper, V. van Wassenhove, H. C. Nusbaum, S. L. Small, Hearing lips and seeingvoices: How cortical areas supporting speech production mediate audiovisual speechperception. Cereb. Cortex 17, 2387–2399 (2007).
7. C. M. Capek et al., Cortical circuits for silent speechreading in deaf and hearingpeople. Neuropsychologia 46, 1233–1241 (2008).
8. G. A. Calvert, R. Campbell, Reading speech from still and moving faces: The neuralsubstrates of visible speech. J. Cogn. Neurosci. 15, 57–70 (2003).
9. L. E. Bernstein, J. Jiang, D. Pantazis, Z. L. Lu, A. Joshi, Visual phonetic processing lo-calized using speech and nonspeech face gestures in video and point-light displays.Hum. Brain Mapp. 32, 1660–1676 (2011).
10. J. I. Skipper, H. C. Nusbaum, S. L. Small, Listening to talking faces: Motor corticalactivation during speech perception. Neuroimage 25, 76–89 (2005).
11. A. Santi, P. Servos, E. Vatikiotis-Bateson, T. Kuratate, K. Munhall, Perceiving biologicalmotion: Dissociating visible speech from walking. J. Cogn. Neurosci. 15, 800–809(2003).
12. L. E. Bernstein, E. Liebenthal, Neural pathways for visual speech perception. Front.Neurosci. 8, 386 (2014).
13. J. I. Skipper, J. T. Devlin, D. R. Lametti, The hearing ear is always found close to thespeaking tongue: Review of the role of the motor system in speech perception. BrainLang. 164, 77–105 (2017).
14. M. Halle, K. Stevens, Speech recognition: A model and a program for research. IRETrans Inform Theor 8, 155 (1962).
15. R. L. Diehl, A. J. Lotto, L. L. Holt, Speech perception. Annu. Rev. Psychol. 55, 149–179(2004).
16. A. M. Liberman, F. S. Cooper, D. P. Shankweiler, M. Studdert-Kennedy, Perception ofthe speech code. Psychol. Rev. 74, 431–461 (1967).
17. A. M. Liberman, I. G. Mattingly, The motor theory of speech perception revised.Cognition 21, 1–36 (1985).
18. K. Stevens, M. Halle, “Remarks on analysis by synthesis and distinctive features” inModels for the Perception of Speech and Visual Form, W. Walthen-Dunn, Ed. (MITPress, Cambridge, MA, 1967), pp. 88–102.
19. A. M. Burton, R. S. S. Kramer, K. L. Ritchie, R. Jenkins, Identity from variation: Rep-resentations of faces derived from multiple instances. Cogn. Sci. (Hauppauge) 40,202–223 (2016).
20. L. Sirovich, M. Kirby, Low-dimensional procedure for the characterization of humanfaces. J. Opt. Soc. Am. A 4, 519–524 (1987).
21. M. Turk, A. Pentland, Eigenfaces for recognition. J. Cogn. Neurosci. 3, 71–86 (1991).22. F. Berisha, A. Johnston, P. W. McOwan, Identifying regions that carry the best in-
formation about global facial configurations. J. Vis. 10, 27 (2010).
23. H. Yehia, P. Rubin, E. Vatikiotis-Bateson, Quantitative association of vocal tract and
facial behavior. Speech Commun. 26, 23–43 (1998).24. A. Alsius, R. V. Wayne, M. Paré, K. G. Munhall, High visual resolution matters in au-
diovisual speech perception, but only for some. Atten. Percept. Psychophys. 78,
1472–1487 (2016).25. A. K. Pattem, A. Illa, A. Afshan, P. K. Ghosh, Optimal sensor placement in electro-
magnetic articulography recording for speech production study. Comput. Speech
Lang 47, 157–174 (2018).26. T. Kohonen, Self-Organization and Associative Memory (Springer, Berlin, New York,
ed. 3, 1989).27. C. Chandrasekaran, A. Trubanova, S. Stillittano, A. Caplier, A. A. Ghazanfar, The
natural statistics of audiovisual speech. PLoS Comput. Biol. 5, e1000436 (2009).28. H. McGurk, J. MacDonald, Hearing lips and seeing voices. Nature 264, 746–748 (1976).29. L. A. Ross, D. Saint-Amour, V. M. Leavitt, D. C. Javitt, J. J. Foxe, Do you see what I am
saying? Exploring visual enhancement of speech comprehension in noisy environ-
ments. Cereb. Cortex 17, 1147–1153 (2007).30. C. A. Fowler, “Speech as a supramodal or amodal phenomenon” in Handbook of
Multisensory Processes, G. A. Calvert, C. Spence, B. E. Stein, Eds. (MIT Press, Cam-
bridge, MA, 2004), pp. 189–201.31. K. G. Munhall, J. A. Jones, D. E. Callan, T. Kuratate, E. Vatikiotis-Bateson, Visual
prosody and speech intelligibility: Head movement improves auditory speech per-
ception. Psychol. Sci. 15, 133–137 (2004).32. E. Vatikiotis-Bateson, I. M. Eigsti, S. Yano, K. G. Munhall, Eye movement of perceivers
during audiovisual speech perception. Percept. Psychophys. 60, 926–940 (1998).33. E. Barenholtz, L. Mavica, D. J. Lewkowicz, Language familiarity modulates relative
attention to the eyes and mouth of a talker. Cognition 147, 100–105 (2016).34. E. Worster et al., Eye movements during visual speech perception in deaf and hearing
children. Lang. Learn. 68, 159–179 (2018).35. C. R. Lansing, G. W. McConkie, Attention to facial regions in segmental and prosodic
visual speech perception tasks. J. Speech Lang. Hear. Res. 42, 526–539 (1999).36. D. N. Kalikow, K. N. Stevens, L. L. Elliott, Development of a test of speech intelligibility
in noise using sentence materials with controlled word predictability. J. Acoust. Soc.
Am. 61, 1337–1351 (1977).37. V. Blanz, T. Vetter, “A morphable model for the synthesis of 3D faces” in Proceedings
of the 26th Annual Conference on Computer Graphics and Interactive Techniques
(ACM Press/Addison-Wesley Publishing Co., New York, NY, 1999), pp. 187–194.38. G. A. Cowe, "Example-based computer-generated facial mimicry," PhD thesis, Uni-
versity College London, London (2003).39. A. Johnston, P. W. McOwan, C. P. Benton, Robust velocity computation from a bio-
logically motivated model of motion perception. Proc. R Soc. B–Biol. Sci. 266, 509–518
(1999).40. A. Johnston, P. W. Mcowan, H. Buxton, A computational model of the analysis of
some 1st-order and 2nd-order motion patterns by simple and complex cells. Proc. R.
Soc. B–Biol. Sci. 250, 297–306 (1992).41. F. Gosselin, P. G. Schyns, Bubbles: A technique to reveal the use of information in
recognition tasks. Vision Res. 41, 2261–2271 (2001).
32798 | www.pnas.org/cgi/doi/10.1073/pnas.2006192117 Scholes et al.
Dow
nloa
ded
by g
uest
on
Dec
embe
r 23
, 202
1