The International Sampling Program: Continent of Origin ... · electronic version is available in...
33
Northeast Fisheries Science Center Reference Document 12-24 The International Sampling Program: Continent of Origin and Biological Characteristics of Atlantic Salmon (Salmo salar) Collected at West Greenland in 2011 by Timothy F. Sheehan, Marta G. L. Assunção, Nick Chisholm, Denise Deschamps, Heather Dixon, Mark Renkawitz, Ger Rogan, Rasmus Nygaard,Timothy L. King, Martha J. Robertson, Niall O’Maoiléidigh
Transcript of The International Sampling Program: Continent of Origin ... · electronic version is available in...
Northeast Fisheries Science Center Reference Document 12-24
The International Sampling Program: Continent of Origin and BiologicalCharacteristics of Atlantic Salmon
(Salmo salar) Collected at West Greenland in 2011
by Timothy F. Sheehan, Marta G. L. Assunção, Nick Chisholm, Denise Deschamps, Heather Dixon, Mark Renkawitz, Ger Rogan,
Rasmus Nygaard,Timothy L. King, Martha J. Robertson, Niall O’Maoiléidigh

Northeast Fisheries Science Center Reference Document 12-24
US DEPARTMENT OF COMMERCENational Oceanic and Atmospheric Administration
National Marine Fisheries ServiceNortheast Fisheries Science Center
Woods Hole, MA
October 2012
The International Sampling Program:Continent of Origin and BiologicalCharacteristics of Atlantic Salmon
(Salmo salar) Collected at West Greenland in 2011
by Timothy F. Sheehan1, Marta G. L. Assunção2, Nick Chisholm3,Denise Deschamps4, Heather Dixon5, Mark Renkawitz1, Ger Rogan6,
Rasmus Nygaard7,Timothy L. King8, Martha J. Robertson9,Niall O’Maoiléidigh6
1 NOAA Fisheries Service, Northeast Fisheries Science Center, 166 Water Street, Woods Hole, Massachusetts 02543, USA
2 The Centre for Environment, Fisheries & Aquaculture Science, Salmon and Freshwater Team, Pakefield Road, Lowestoft, Suffolk, NR33 0HT, UK (England & Wales)
3 River Annan Trust Fisheries Office, St Ann’s, Lockerbie, DG11 1HQ, UK (Scotland)4 Ministère des Ressources naturelles et de la Faune du Québec, Direction de la recherche sur la faune,
880, chemin Sainte-Foy, Québec, Québec G1S 4X4, Canada5 University of Waterloo, 200 University Avenue West, Waterloo, Ontario, N2L 3G1, Canada
6 Marine Institute, Fisheries Ecosystems Advisory Services, The Farran Laboratory, Furnace, Newport, Co. Mayo, Ireland
7 Grønlands Naturinstitut, Kivioq 3, 3905 Nuussuaq, DK-3900 Nuuk, Greenland 8 U. S. Geological Survey, Biological Resources Division, Leetown Science Center,
1700 Leetown Road, Kearneysville, West Virginia 25430, USA
Northeast Fisheries Science Center Reference Documents
This series is a secondary scientific series designed to assure the long-term documentation and to enable the timely transmission of research results by Center and/or non-Center researchers, where such results bear upon the research mission of the Center (see the outside back cover for the mission statement). These documents receive internal scientific review, and most receive copy editing. The National Marine Fisheries Service does not endorse any proprietary material, process, or product mentioned in these documents. All documents issued in this series since April 2001, and several documents issued prior to that date, have been copublished in both paper and electronic versions. To access the electronic version of a document in this series, go to http://www.nefsc.noaa.gov/nefsc/publications/. The electronic version is available in PDF format to permit printing of a paper copy directly from the Internet. If you do not have Internet access, or if a desired document is one of the pre-April 2001 documents available only in the paper version, you can obtain a paper copy by contacting the senior Center author of the desired document. Refer to the title page of the document for the senior Center author’s name and mailing address. If there is no Center author, or if there is corporate (i.e., non-individualized) authorship, then contact the Center’s Woods Hole Labora-tory Library (166 Water St., Woods Hole, MA 02543-1026). Editorial Treatment: To distribute this report quickly, it has not undergone the normal tech-nical and copy editing by the Northeast Fisheries Science Center’s (NEFSC’s) Editorial Office as have most other issues in the NOAA Technical Memorandum NMFS-NE series. Other than the four covers and first two preliminary pages, all writing and editing have been performed by the authors listed within. Information Quality Act Compliance: In accordance with section 515 of Public Law 106-554, the Northeast Fisheries Science Center completed both technical and policy reviews for this report. These predissemination reviews are on file at the NEFSC Editorial Office. This document may be cited as:
Sheehan TF, Assunção MGL, Chisholm N, Deschamps D, Dixon H, Renkawitz M, Ro-gan G, Nygaard R, King TL, Robertson MJ, O’Maoiléidigh N. 2012. The international sampling program, continent of origin and biological characteristics of Atlantic salmon (Salmo salar) collected at West Greenland in 2011. US Dept Commer, Northeast Fish Sci Cent Ref Doc. 12-24; 27 p. Available from: National Marine Fisheries Service, 166 Water Street, Woods Hole, MA 02543-1026, or online at http://www.nefsc.noaa.gov/nefsc/publications/
ii
TABLE OF CONTENTS Introduction ..................................................................................................................................... 1 International Sampling Program ..................................................................................................... 1 Continent of Origin ......................................................................................................................... 4 Biological Characteristics of the Catches ....................................................................................... 5 Salmon at Sea: SALSEA Greenland (Enhanced Sampling) ........................................................... 6 Acknowledgements ......................................................................................................................... 7 References Cited ............................................................................................................................. 8
1
INTRODUCTION An important Atlantic salmon (Salmo salar) mixed-stock fishery exists off the western coast of Greenland. This fishery takes primarily one-sea-winter (1SW) North American and European origin salmon that would potentially return to natal waters as mature two-sea-winter (2SW) spawning adults or older. Effective management of the resource on both continents requires annual collection of accurate landings data, continent of origin assignments and biological characteristics data to assess the impact of the fishery on the contributing stock complexes. Data collected during the fishery are also required for use in assessment models to predict pre-fishery abundance of North American and European stocks and to provide fishery managers with catch options required for setting harvest regulations for this mixed stock fishery. Atlantic salmon were first documented off the coast of Greenland in 1780 and were targeted by a small local inshore gillnet fishery (Jensen, 1990). During the early-1960s an international presence developed in the fishery; in 1965, vessels from Norway, Denmark, Sweden, and the Faroes arrived and introduced an offshore drift-gillnet fishery (Jensen, 1990). Catches increased substantially to a high of 2,689 metric tons (t) reported in 1971 (Figure 1). Tag studies conducted during this period indicated that the Atlantic salmon caught in this fishery did not originate from Greenland, but were of North American and European origin. Due to the concerns that this fishery would have deleterious impacts on the contributing stock complexes, a quota system was agreed and implemented in 1976 (Colligan et al. 2008) and since 1984 these regulations have been established by the North Atlantic Salmon Conservation Organization (NASCO). Since 1969, a coordinated international sampling program has been undertaken to obtain biological samples from this fishery. From 1969-1981, research vessels were used to obtain samples. Since 1982, international teams of samplers have been deployed throughout Greenland to obtain samples from fish processing plants (when a commercial fishery was allowed), local markets or other vendors from individual communities where Atlantic salmon were being landed. The focus of this sampling program was to collect biological samples and associated data on the catch. Originally, length, weight and scale samples were collected, and individuals were scanned for fin clips, or external/internal tags. The sampling program has continually evolved, and currently tissue samples are also taken for genetic analysis. In addition, it has been possible to collect samples for ongoing international collaborations investigating the marine ecology and persistent decline in salmon abundance in recent years.
The purpose of this paper is to:
describe the international sampling program; present the results from the continent of origin analysis; summarize the biological characteristics of the catch from West Greenland during the
internal use only fishery of 2011; and provide an update on the SALSEA Greenland Program.
INTERNATIONAL SAMPLING PROGRAM The West Greenland Commission (WGC) of the NASCO has agreed regulatory measures for
the West Greenland fishery for all years from 1984 to 2012 (with the exception of 1985, 1991, 1992 and 1996). Since 2006 these have been applied as multi-year regulatory measures; the latest measure

2
was established for the period 2009 to 2011 (WGC(09)7) and restricted landings in 2009 to the amount used for internal consumption in Greenland only, which in the past has been estimated to be 20 t; there would be no commercial export of salmon. The regulatory measure would also apply in 2010 and 2011 if the Framework of Indicators (FWI) developed by ICES (ICES 2007) indicated there had been no significant change in the indicators and therefore, that a reassessment of the catch advice would not be required. As the FWI did not suggest that there had been a significant change in the previously provided catch advice in 2010 or 2011, the 2009 regulatory measure was applied to the 2010 and 2011 fisheries.
In 2002, the Organization of Fishermen and Hunters in Greenland (KNAPK) agreed with the North Atlantic Salmon Fund (NASF) to be compensated for not prosecuting a commercial fishery. As part of this agreement, there was an annual opt out date where either party could notify the other party that the agreement would not be implemented for the upcoming fishing season. In 2007, a new agreement between KNAPK, NASF and the Atlantic Salmon Federation (ASF) was signed that effectively extended and revised the 2002 agreement through 2013, retaining the same opt out option and date as the 2002 agreement.
Although the 2011 commercial fishery remained closed and the quota was subsequently set to nil by the Home Rule Government of Greenland, the internal-use-only fishery for personal and local consumption was unaffected. As in the past, the internal-use-only fishery was without a quota limit, but was expected to be approximately 20 t. The opening date of the fishery was set at 1 August 2011 with a closing date of 31 October 2011. The fishery is regulated according to The Government of Greenland Executive Order no. 21 of 10 August 2002.
Under NASCO’s West Greenland Sampling Agreement (WGC(11)4), parties to NASCO’s WGC agreed to provide staff to sample catches from the internal-use-only fishery for Atlantic salmon in West Greenland during the 2011 season.
The objectives of the program were to:
continue the time series of data (1969-2010) collected on continent of origin and biological characteristics of salmon harvested in the West Greenland Fishery;
provide data on mean weight, length, age and continent of origin for input into the North American and European run-reconstruction models;
collect information on the recovery of internal and external tags; and collect additional biological samples from fresh whole fish in support of SALSEA
West Greenland or other special samples as requested. The European Union agreed to provide staff to sample the fishery for a minimum of six
person weeks, the United States agreed for a minimum of four person weeks, and Canada for a minimum of two person weeks. Samplers from various countries involved in the program were as follows:

3
Country Sampler(s) Institute Period Community (NAFO Division)
Canada Denise Deschamps Ministère des Ressources Naturelles et de la Faune
20 Sept – 10 Oct Ilulissat (1A)
UK (England & Wales)
Marta Assuncao Cefas Laboratory 29 Aug – 15 Sept Sisimiut (1B)
Ireland Ger Rogan Marine Institute 14 Sept – 28 Sept Sisimiut (1B)
USA Timothy Sheehan NOAA Fisheries Service 24 Aug – 10 Sept Nuuk (1D)
USA Mark Renkawitz NOAA Fisheries Service 5 Sep – 29 Sept Nuuk (1D)
UK (Scotland) Nick Chisholm River Annan Trust Fisheries Office 18 Aug – 30 Aug Qaqortoq (1F)
Canada Heather Dixon University of Waterloo 25 Aug – 15 Sept Qaqortoq (1F)
Individual samplers were deployed during the course of the salmon fishing season to
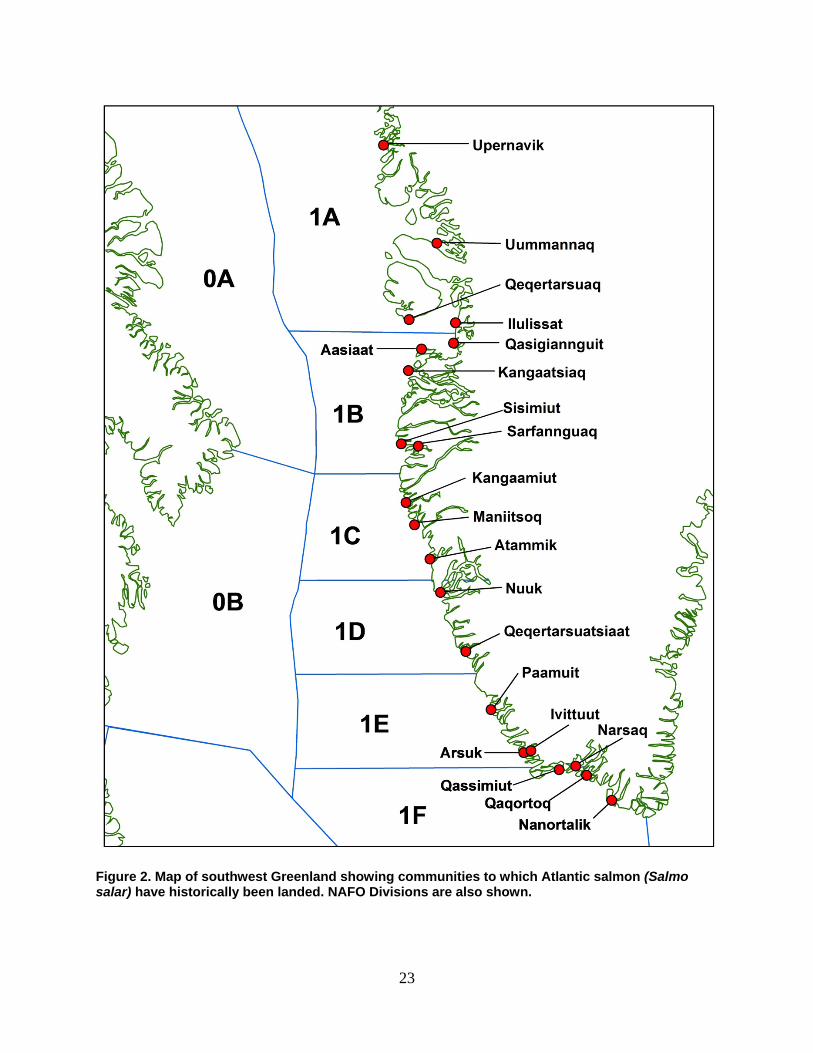
provide the best spatial and temporal coverage of the fishery possible. The coordination of this effort was handled by the USA (NOAA Fisheries Service) with assistance from the Greenland Institute of Natural Resources. Samplers were stationed in four communities representing four Northwest Atlantic Fisheries Organization (NAFO) Divisions (Figure 2): Ilulissat (1A), Sisimiut (1B), Nuuk (1D) and Qaqortoq (1F).
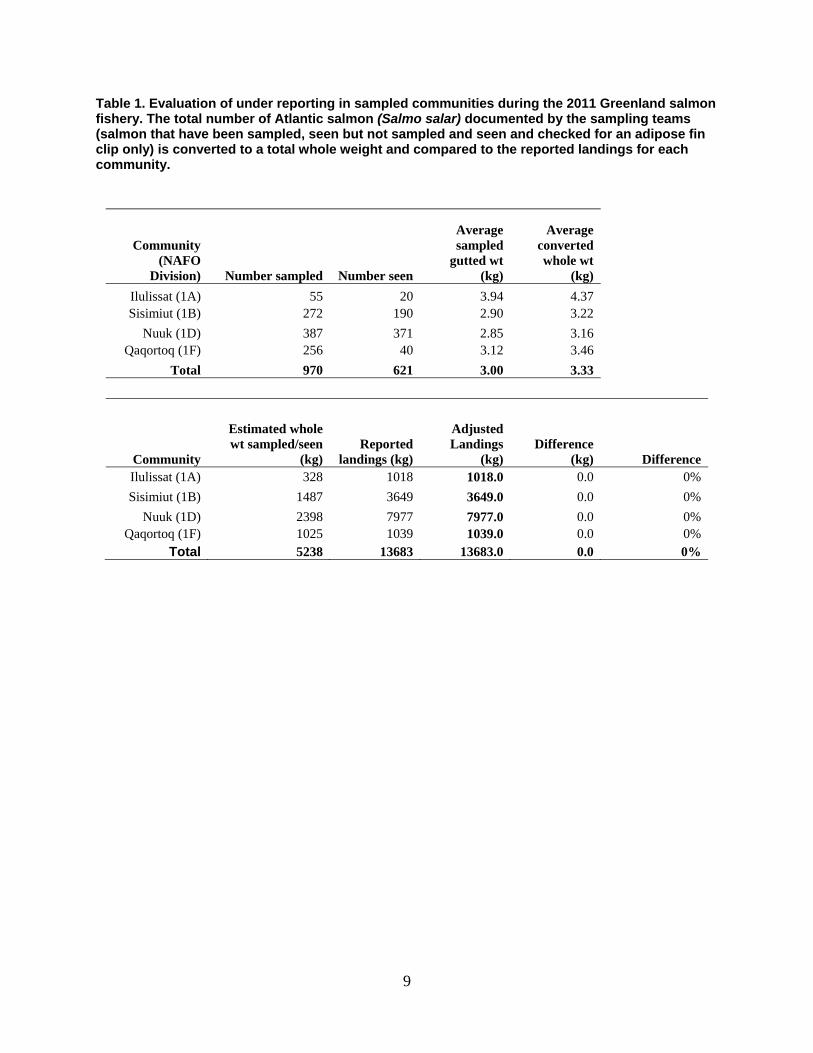
Reported landings were 27.5 t (27.4 t for West Greenland and 0.1 t for East Greenland ICES statistical area XIV)). In the past, non-reporting of harvest was identified by comparing the reported landings to the sample data. From 2002-2010 (with the exception of 2006), the sampling team documented more fish than were reported as being landed in at least one division (ICES 2011). A documented salmon could be one that was either sampled, checked for an adipose clip only or was not sampled but seen. When this type of discrepancy occurs, the reported landings are adjusted to include the total weight of the fish documented as being landed during the sampling period and the adjusted landings are included in all further assessments. In 2011 this did not occur in any of the sampled communities (Table 1). The reported landings and adjusted landings for 2002-2011 are presented in Table 2. To provide the most reliable estimate of catch and therefore the potential impact on contributing stocks, it is important to continue to improve the catch landings procedure and quality of the catch statistics.
For the Baseline Sampling Program, landed fish were sampled at random and when possible the total catch was examined. Fish were measured (fork length, mm) and weighed (gutted weight or whole weight, kg). Scales were taken for age determination and adipose fins were taken for DNA analysis. Fish were also examined for fin clips, external marks, external tags, and internal tags and adipose clipped fish were sampled for microtags (coded wire tags).
A total of 1,591 salmon were seen by the sampling teams. Of these, 198 fish were only checked for an adipose clip and additional data were collected from 970 as follows:
967 fork lengths; 964 gutted weights; 433 whole weights; 965 scale samples;
4
964 genetic samples; 431 sex identifications from gonadal examination.
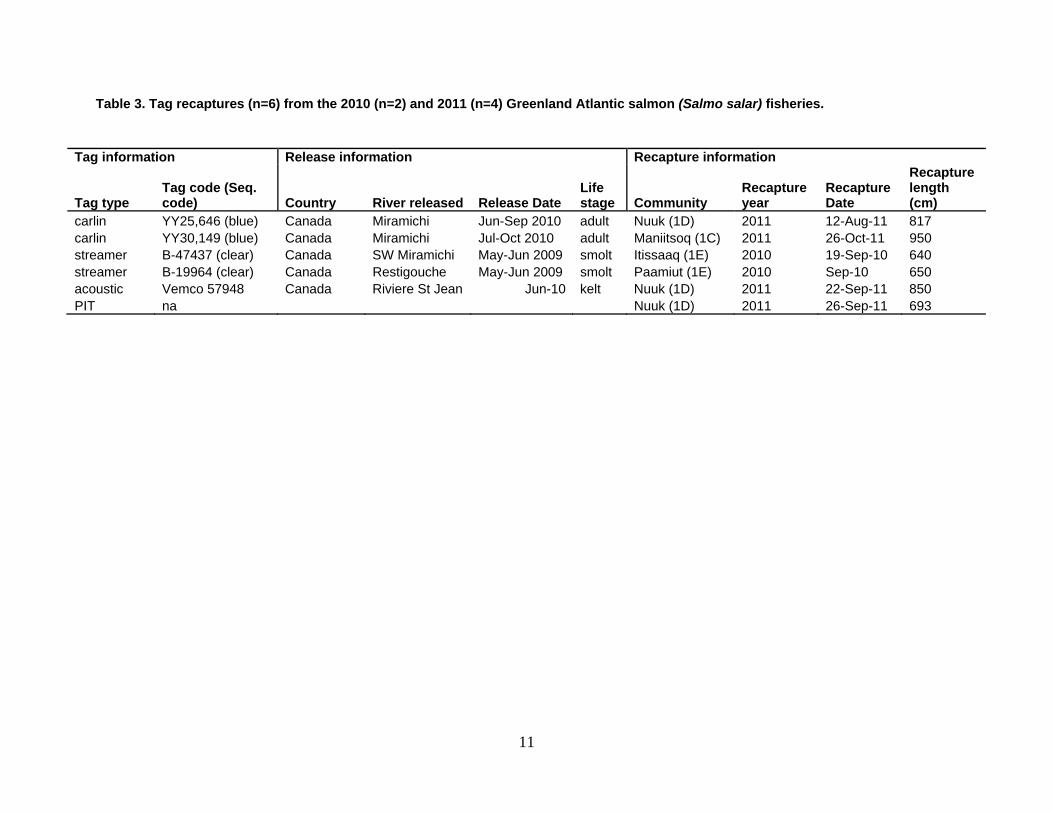
A total of 15 adipose clipped fish were documented. Of all the fish examined by the
samplers, three had either an external or internal tag (two of these also had an adipose clip). There were also three additional tags submitted to the Nature Institute by local fisherman from un-sampled fish (two from fish harvested in 2010 and one from a fish harvested in 2011). The tag breakdown was as follows (Table 3):
4 Carlin/streamer tags; 1 acoustic (VEMCO) tag; 1 Passive Integrated Transponder tag. Sampling for the Baseline Program in Nuuk often took place at the local market as this
was a centralized location where harvested salmon were present and available. Prior to any sampling, the sampler would always obtain permission from the market manager. The arrangement was successful for the first Nuuk sampler. However, concerns that proper arrangement had not been made to allow access to the fish prevented the second Nuuk sampler from obtaining any samples from the market. No solution was agreed during the remainder of the sampling season and consequentially the Nuuk sampler was unable to collect any additional Baseline Samples in 2011. This same problem had occurred in Nuuk in previous years, but it has not occurred elsewhere. Both Nuuk samplers were able to collect Baseline and Enhanced Samples from fish purchased directly from the fishermen. The sampling program in 2012 may opt not to sample in Nuuk until this issue can be resolved. This could hinder the program’s ability to accurately characterize the harvest as a large proportion of the annual landings are reported from Nuuk.
The limitation of the fishery to internal use only fishing caused practical problems for the sampling teams; however, the sampling program was successful in adequately sampling the Greenland catch, both temporally and spatially. The need to obtain samples from fish landed in Nuuk, especially in the future once the Enhanced Sampling Program is completed, should be considered.
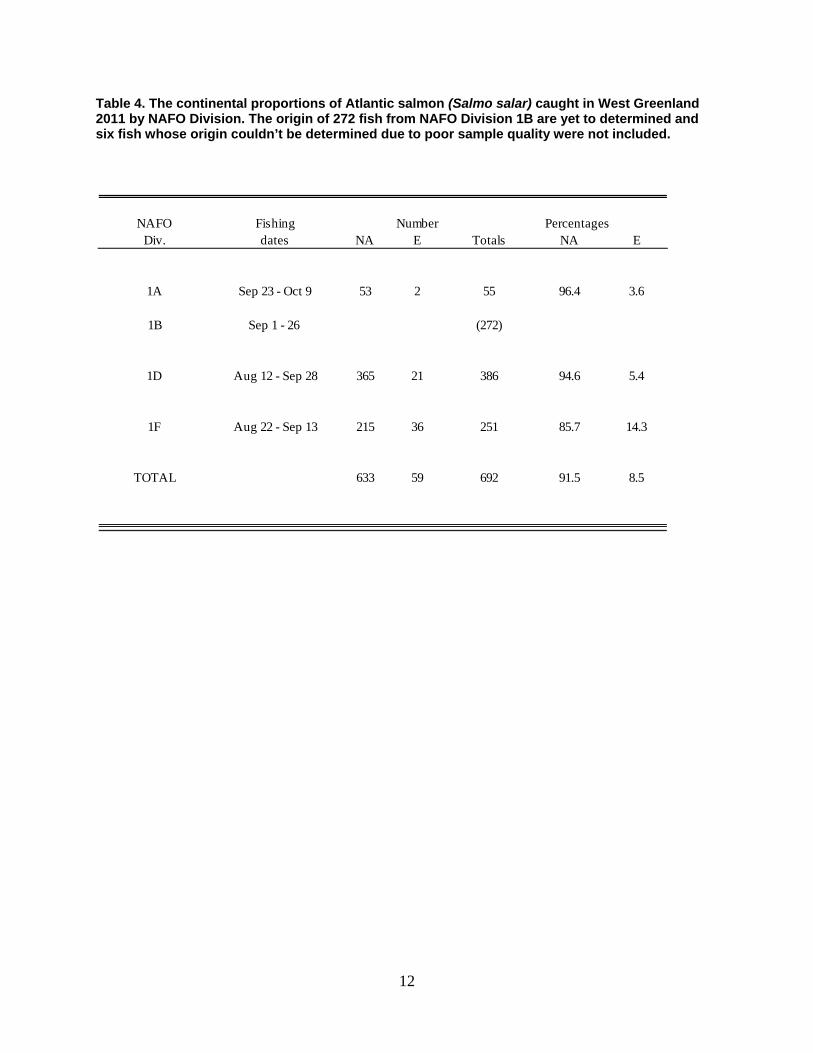
CONTINENT OF ORIGIN Fin tissue samples were collected and preserved in RNAlater. A total of 964 samples
were collect from four communities in four NAFO divisions: Ilulissat in 1A (n=55), Sisimiut in 1B (n=272), Nuuk in 1D (n=386), and Qaqortoq in 1F (n=251). Unfortunately, only 692 samples could be processed before this document was drafted. The Sisimiut (1B) samples (n=272) were accidentally packaged in a box with the formalin preserved Enhanced Samples and were transported back to the US via marine transport. The samples will be processed in 2012 and all sampling data will be updated prior to the 2013 assessment.
DNA isolation and the subsequent microsatellite analyses were performed in the US (King et al. 2001). A database of approximately 5,000 Atlantic salmon genotypes of known origin was used as a baseline to assign these individuals to continent of origin. In total, 91.5% of the salmon sampled were determined to be of North American origin and 8.5% were of European origin. The NAFO Division-specific continent of origin assignments are presented in Table 4.

5
These data show sustained high proportions of fish from the North American stock complex contributing to the fishery over the past 10 years (Figure 3). The variability in the recent stock complex contributions between Divisions and the deviation from past trends (Figure 4) underscores the need to annually sample multiple NAFO Divisions to achieve accurate estimates of continental contributions to the harvest.
Variations in the estimated weighted proportions of North American and European salmon from 1987-2011 are shown in Table 5 and Figure 4. The 2011 North American weighted contribution (92.0%) to the fishery was one of the highest on record. In addition, the weighted numbers of North American and European Atlantic salmon caught at Greenland (excluding the reported harvest from ICES Area XIV) were calculated for the 2011 fishery. Approximately 6,800 fish from North America and 600 fish from Europe were harvested (Table 5 and Figure 5). The 2011 total is a decrease from 2010 and remains among the lowest in the time series.
BIOLOGICAL CHARACTERISTICS OF THE CATCHES Biological characteristics (length, weight, and age) were recorded for all sampled fish.
Overall, the mean sampled fork length was 66.4 cm and the mean gutted weight was 3.00 kg across all sea ages.
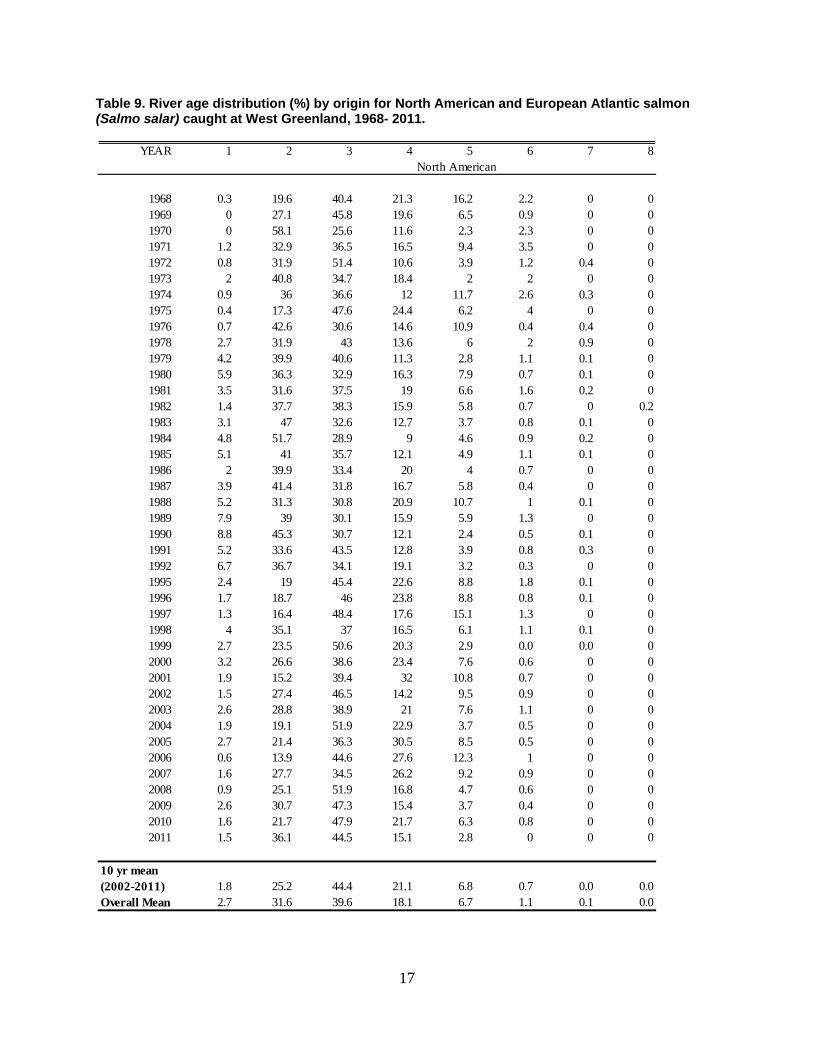
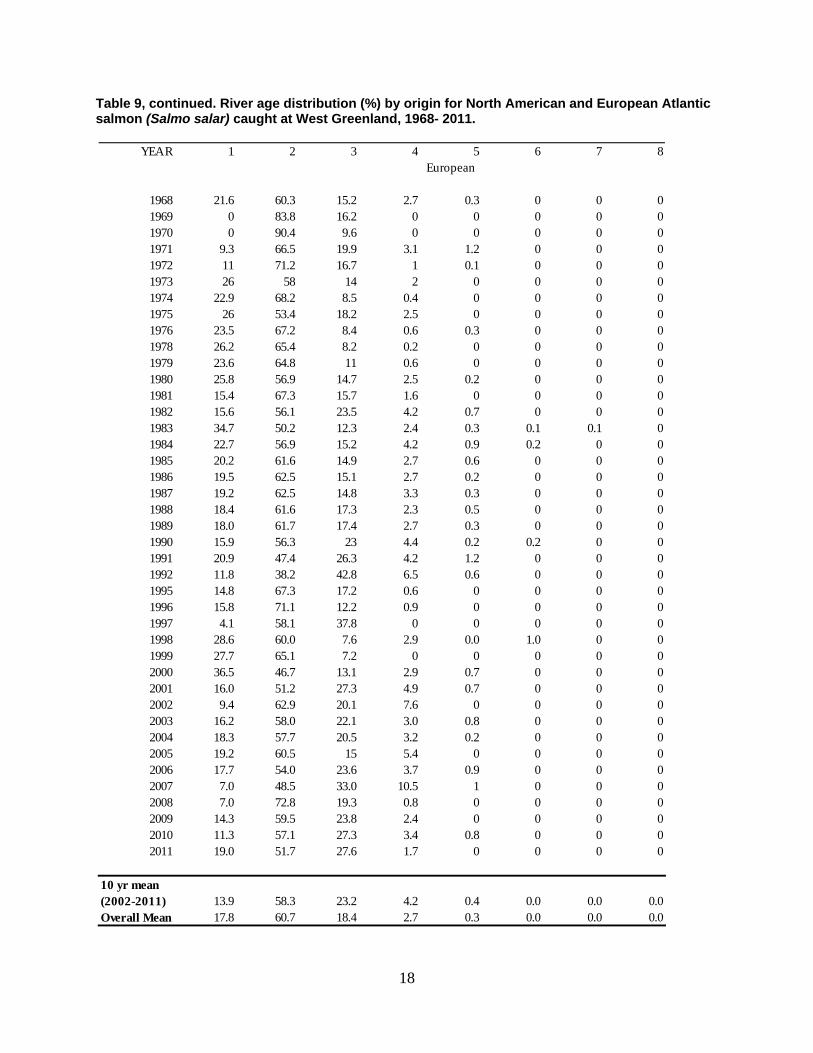
There was an overall decrease in mean whole weight of both European and North American 1SW salmon from 1969–1995 (Table 6 and Figure 6). This trend was reversed in 1996 when mean weights began to increase. In 2011, the mean length of North American 1SW salmon was 66.2 cm and the mean whole weight was 3.56 kg; the mean length of European 1SW salmon was 65.0 cm and the mean whole weight was 3.24 kg. The North American whole weight estimate increased slightly over the 2010 (3.44 kg) value whereas the European estimate remained the same (3.24 kg). Both estimates are greater than the 10-year North American and European mean whole weight estimates (3.14 and 3.13 kg respectively). The North American and European fork length estimates decreased slightly over the 2010 value (66.7 and 65.2 cm respectively), but increased from the 10-year means (64.7 and 64.6 cm respectively). A breakdown of the mean fork lengths and whole weights by sea age, continent of origin and NAFO Division for the 2011 fishery is presented in Table 7. It should be noted that the weight data have not been adjusted for date of capture and may not represent a true increase in mean weight over the time series as fish sampled later in the fishing season have had additional time to grow compared to fish sampled early in the fishery (ICES 2011). The smolt age distribution of the total catch by continent of origin is presented in Table 8. The smolt age distributions by origin for all North American and European origin salmon caught (1968-2011) are provided in Table 9. In 2011, the proportions by smolt age by continent of origin were:
Continent of origin Percent of continent of origin by smolt age (years)
1 2 3 4 5 6
North American 1.5% 36.1% 44.5% 15.1% 2.8% 0%
European 19.0% 51.7% 27.6% 1.7% 0% 0%

6
The mean smolt age of the 2011 North American origin samples was 2.8 years. Age 1 smolts continue to represent a small portion of the catch (1.5%, previous 10 year mean of 1.8%), which is indicative of relatively low contributions of the more southerly North American populations to the fishery. The percentage of smolt age 2 salmon of North American origin (36.1%) is an increase from 2010 value (21.7%) and the previous 10 year mean (25.2%). Age 3 and older smolts account for 62.4% of the harvest. The mean smolt age of the European salmon in 2011 was 2.1 years. The percent of smolt age 1 (19.0%) is above the 10 year mean of 13.9% and the age 2 smolt percent (51.7%) is below the previous 10 year mean (58.3%). The contribution of age 3 and older smolts (29.3%) is slightly above the previous 10 year mean (27.8%). As expected, the 1SW age group dominated the collection at 92.9% (Table 10). This value was a decrease from the 2010 (98.0%) value. The decreased proportion of 1SW fish was evident for both North American and European origin fish. In 2011, the proportions by sea age by continent of origin were:
Continent of origin Percent of continent of origin by sea age (years)
1SW 2SW 3SW Repeat Spawners
North American 93.8% 1.5% 0% 4.7%
European 82.8% 10.3% 1.7% 5.2%
SALMON AT SEA: SALSEA GREENLAND (ENHANCED SAMPLING)
In addition to the Baseline Sampling Program described above, an Enhanced Sampling
Program (SALSEA Greenland) was developed to conduct diverse and more detailed sampling on a fixed number of fish harvested from the waters off West Greenland. The Enhanced Sampling was designed to be integrated within the Baseline Sampling Program’s infrastructure. Fresh whole fish were purchased directly from individual fishermen, and these fish underwent the Baseline Sampling Program, plus a more detailed sampling program (Enhanced Sampling). SALSEA Greenland is an integral part of the larger SALSEA research program.
The Enhanced Sampling Program was successfully undertaken in 2011. A total of 430 fresh whole fish were purchased and sampled. All carcasses, post sampling, were donated for consumption to various people within the individual communities where the sampling took place.
This was the third and final year of Enhanced Sampling Program. A total of 1200 samples were collected across 4 NAFO Divisions for this project (Table 11). Sample processing is ongoing and at various stages of completion. Continued close coordination amongst all the researchers involved in the SALSEA Greenland effort is essential to maximize the benefit gained from this research initiative. An inventory of sample types collected, their purpose, and primary Agency/Institutional contacts responsible for their processing is provided in Table 12. As part of the sampling, sex was determined by examination of the gonads of 431 fish. The percentage by sex was 11.8% males (n=51) and 88.2% females (n=380).

7
ACKNOWLEDGEMENTS We would like to acknowledge the Greenland Institute of Nature Resources and the
fishers and residents in Greenland who provided access to their fish. We would also like to thank the above referenced laboratories and agencies for supporting the program, providing the samplers and the funding necessary to support them in Greenland. Funding support for the samplers was provided by the Department for Environment, Food and Rural Affairs, UK (for Marta Assunção), Fisheries and Oceans Canada, Ottawa (for Denise Deschamps), the Marine Institute (for Ger Rogan), Marine Scotland (for Nick Chisholm) and NOAA Fisheries Service (for Mark Renkawitz and Timothy Sheehan). Fisheries and Oceans Canada (Newfoundland and Labrador Region) conducted the ageing of all scale samples collected and maintains the master sampling database. NOAA Fisheries Service provided funding to the U. S. Geological Survey to support the genetic processing and continent of origin analysis.

8
REFERENCES CITED Colligan, M., T. Sheehan, J. Pruden, and J. Kocik. 2008. The challenges posed by international
management of Atlantic salmon: balancing commercial, recreational and societal interests - The North Atlantic Salmon Conservation Organization (NASCO). In M. G. Schechter, N. J. Leonard, and W. W. Taylor (Eds.), International Governance of Fisheries Ecosystems: learning from the past, finding solutions for the future (pp. 458). American Fisheries Society.
King, T.L., Kalinowski, S.T., Schill, W.B., Spidle, A.P., and Lubinski, B.A. 2001. Population
structure of Atlantic salmon (Salmo salar L.): a range-wide perspective from microsatellite DNA variation. Molecular Ecology, 10: 807-821.
ICES. 2007. Study Group on Establishing a Framework of Indicators of Salmon Stock
Abundance (SGEFISSA), 27–30 November 2006, Halifax, Canada. ICES CM 2007/DFC:01. 71 pp.
ICES. 2011. Report of the Working Group on North Atlantic Salmon (WGNAS), 22–31 March 2011, Copenhagen, Denmark. ICES 2011/ACOM:09. 286 pp.
Jensen, J.M. 1990. Atlantic salmon at Greenland. Fisheries Research, 10: 29-52.
WGC(09)7. 2009. Regulatory Measure for Fishing for Salmon at West Greenland for 2009, 2010, and 2011. Report of the Twenty-Sixth Annual Meetings of the Commissions. Molde, Norway, 2 – 5 June 2009.
WGC(11)4. 2011. West Greenland Fishery Sampling Agreement, 2011. Report of the Twenty-eighth Annual Meetings of the Commissions. Ilulissat, Greenland, 4 – 6 June 2011.
WGC(11)3. 2011. Report on the Use of the Framework of Indicators in 2011. Report of the Twenty-eighth Annual Meetings of the Commissions. Ilulissat, Greenland, 4 – 6 June 2011.
9
Table 1. Evaluation of under reporting in sampled communities during the 2011 Greenland salmon fishery. The total number of Atlantic salmon (Salmo salar) documented by the sampling teams (salmon that have been sampled, seen but not sampled and seen and checked for an adipose fin clip only) is converted to a total whole weight and compared to the reported landings for each community.
Community (NAFO
Division) Number sampled Number seen
Average sampled
gutted wt (kg)
Average converted whole wt
(kg)
Ilulissat (1A) 55 20 3.94 4.37 Sisimiut (1B) 272 190 2.90 3.22
Nuuk (1D) 387 371 2.85 3.16 Qaqortoq (1F) 256 40 3.12 3.46
Total 970 621 3.00 3.33
Community
Estimated whole wt sampled/seen
(kg) Reported
landings (kg)
Adjusted Landings
(kg) Difference
(kg) Difference Ilulissat (1A) 328 1018 1018.0 0.0 0%
Sisimiut (1B) 1487 3649 3649.0 0.0 0%
Nuuk (1D) 2398 7977 7977.0 0.0 0% Qaqortoq (1F) 1025 1039 1039.0 0.0 0%
Total 5238 13683 13683.0 0.0 0%

10
Table 2. Reported landings (kg) for the Greenland Atlantic salmon (Salmo salar) fishery (2002–2010) by NAFO Division as reported by the Home Rule Government and the division-specific adjusted landings where the sampling teams observed more fish landed than were reported. Landings from ICES statistical area XIV (East Greenland) are not included in this assessment, but amounted to 0.1 t in 2011.
NAFO Division
Year 1A 1B 1C 1D 1E 1F Total 2002 Reported 14 78 2100 3752 1417 1661 9022
Adjusted 2408 9769 2003 Reported 619 17 1621 648 1274 4516 8694
Adjusted 1782 2709 5912 12312 2004 Reported 3476 611 3516 2433 2609 2068 14712
Adjusted 4929 17209 2005 Reported 1294 3120 2240 756 2937 4956 15303
Adjusted 2730 17276 2006 Reported 5427 2611 3424 4731 2636 4192 23021
Adjusted 23021 2007 Reported 2019 5089 6148 4470 4828 2093 24647
Adjusted 2252 24806 2008 Reported 4882 2210 10024 1595 2457 4979 26147
Adjusted 3577 5478 28627 2009 Reported 195 6151 7090 2988 4296 4777 25496
Adjusted 5466 27975 2010 Reported 17263 4558 2363 2747 6766 4252 37949
Adjusted 4824 6566 5274 43056 2011 Reported 1858 3662 5274 7977 4021 4613 27407
Adjusted 27407
11
Table 3. Tag recaptures (n=6) from the 2010 (n=2) and 2011 (n=4) Greenland Atlantic salmon (Salmo salar) fisheries.
Tag information Release information Recapture information
Tag type Tag code (Seq. code) Country River released Release Date
Life stage Community
Recapture year
Recapture Date
Recapture length (cm)
carlin YY25,646 (blue) Canada Miramichi Jun-Sep 2010 adult Nuuk (1D) 2011 12-Aug-11 817 carlin YY30,149 (blue) Canada Miramichi Jul-Oct 2010 adult Maniitsoq (1C) 2011 26-Oct-11 950 streamer B-47437 (clear) Canada SW Miramichi May-Jun 2009 smolt Itissaaq (1E) 2010 19-Sep-10 640 streamer B-19964 (clear) Canada Restigouche May-Jun 2009 smolt Paamiut (1E) 2010 Sep-10 650 acoustic Vemco 57948 Canada Riviere St Jean Jun-10 kelt Nuuk (1D) 2011 22-Sep-11 850 PIT na Nuuk (1D) 2011 26-Sep-11 693
12
Table 4. The continental proportions of Atlantic salmon (Salmo salar) caught in West Greenland 2011 by NAFO Division. The origin of 272 fish from NAFO Division 1B are yet to determined and six fish whose origin couldn’t be determined due to poor sample quality were not included.
NAFO Fishing Number PercentagesDiv. dates NA E Totals NA E
1A Sep 23 - Oct 9 53 2 55 96.4 3.6
1B Sep 1 - 26 (272)
1D Aug 12 - Sep 28 365 21 386 94.6 5.4
1F Aug 22 - Sep 13 215 36 251 85.7 14.3
TOTAL 633 59 692 91.5 8.5

13
Table 5. The catch weighted numbers of North American (NA) and European (E) Atlantic salmon (Salmo salar) caught at West Greenland 1971-2011 and the proportion of the catch by weight. Numbers are rounded to the nearest hundred fish. Continent of origin assignments were based on scale characteristics until 1995, scale characteristics and DNA based assignments until 2001 and DNA based assignments only from 2001 onwards.
Proportion weighted
by catch Numbers of
Salmon caught NA E NA E
1982 57 43 192,200 143,800 1983 40 60 39,500 60,500 1984 54 46 48,800 41,200 1985 47 53 143,500 161,500 1986 59 41 188,300 131,900 1987 59 41 171,900 126,400 1988 43 57 125,500 168,800 1989 55 45 65,000 52,700 1990 74 26 62,400 21,700 1991 63 37 111,700 65,400 1992 45 55 46,900 38,500 1993 - - - - 1994 - - - - 1995 67 33 21,400 10,700 1996 70 30 22,400 9,700 1997 85 15 18,000 3,300 1998 79 21 3,100 900 1999 91 9 5,700 600 2000 65 35 5,100 2,700 2001 67 33 9,400 4,700 2002 69 31 2,300 1,000 2003 64 36 2,600 1,400 2004 72 28 3,900 1,500 2005 74 26 3,500 1,200 2006 69 31 4,000 1,800 2007 76 24 6,100 1,900 2008 86 14 8,000 1,300 2009 90 10 7,000 800 2010 81 19 10,000 2,600 2011 91 9 6,800 600

14
Table 6. Annual mean fork lengths and whole weights of Atlantic salmon (Salmo salar) caught at West Greenland, 1969-2011 (NA - North American and E – European).
Whole weight (kg) Fork length (cm) Sea age & origin Sea age & origin
1SW 2SW PS All sea ages TOTAL 1SW 2SW PSNA E NA E NA E NA E NA E NA E NA E
1969 3.12 3.76 5.48 5.80 - 5.13 3.25 3.86 3.58 65.0 68.7 77.0 80.3 - 75.31970 2.85 3.46 5.65 5.50 4.85 3.80 3.06 3.53 3.28 64.7 68.6 81.5 82.0 78.0 75.01971 2.65 3.38 4.30 - - - 2.68 3.38 3.14 62.8 67.7 72.0 - - -1972 2.96 3.46 5.85 6.13 2.65 4.00 3.25 3.55 3.44 64.2 67.9 80.7 82.4 61.5 69.01973 3.28 4.54 9.47 10.00 - - 3.83 4.66 4.18 64.5 70.4 88.0 96.0 61.5 -1974 3.12 3.81 7.06 8.06 3.42 - 3.22 3.86 3.58 64.1 68.1 82.8 87.4 66.0 -1975 2.58 3.42 6.12 6.23 2.60 4.80 2.65 3.48 3.12 61.7 67.5 80.6 82.2 66.0 75.01976 2.55 3.21 6.16 7.20 3.55 3.57 2.75 3.24 3.04 61.3 65.9 80.7 87.5 72.0 70.71977 - - - - - - - - - - - - - - -1978 2.96 3.50 7.00 7.90 2.45 6.60 3.04 3.53 3.35 63.7 67.3 83.6 - 60.8 85.01979 2.98 3.50 7.06 7.60 3.92 6.33 3.12 3.56 3.34 63.4 66.7 81.6 85.3 61.9 82.01980 2.98 3.33 6.82 6.73 3.55 3.90 3.07 3.38 3.22 64.0 66.3 82.9 83.0 67.0 70.91981 2.77 3.48 6.93 7.42 4.12 3.65 2.89 3.58 3.17 62.3 66.7 82.8 84.5 72.5 -1982 2.79 3.21 5.59 5.59 3.96 5.66 2.92 3.43 3.11 62.7 66.2 78.4 77.8 71.4 80.91983 2.54 3.01 5.79 5.86 3.37 3.55 3.02 3.14 3.10 61.5 65.4 81.1 81.5 68.2 70.51984 2.64 2.84 5.84 5.77 3.62 5.78 3.20 3.03 3.11 62.3 63.9 80.7 80.0 69.8 79.51985 2.50 2.89 5.42 5.45 5.20 4.97 2.72 3.01 2.87 61.2 64.3 78.9 78.6 79.1 77.01986 2.75 3.13 6.44 6.08 3.32 4.37 2.89 3.19 3.03 62.8 65.1 80.7 79.8 66.5 73.41987 3.00 3.20 6.36 5.96 4.69 4.70 3.10 3.26 3.16 64.2 65.6 81.2 79.6 74.8 74.81988 2.83 3.36 6.77 6.78 4.75 4.64 2.93 3.41 3.18 63.0 66.6 82.1 82.4 74.7 73.81989 2.56 2.86 5.87 5.77 4.23 5.83 2.77 2.99 2.87 62.3 64.5 80.8 81.0 73.8 82.21990 2.53 2.61 6.47 5.78 3.90 5.09 2.67 2.72 2.69 62.3 62.7 83.4 81.1 72.6 78.61991 2.42 2.54 5.82 6.23 5.15 5.09 2.57 2.79 2.65 61.6 62.7 80.6 82.2 81.7 80.01992 2.54 2.66 6.49 6.01 4.09 5.28 2.86 2.74 2.81 62.3 63.2 83.4 81.1 77.4 82.71995 2.37 2.67 6.09 5.88 3.71 4.98 2.45 2.75 2.56 61.0 63.2 81.3 81.0 70.9 81.31996 2.63 2.86 6.50 6.30 4.98 5.44 2.83 2.90 2.88 62.8 64.0 81.4 81.1 77.1 79.41997 2.57 2.82 7.95 6.11 4.82 6.9 2.63 2.84 2.71 62.3 63.6 85.7 84.0 79.4 87.01998 2.72 2.83 6.44 - 3.28 4.77 2.76 2.84 2.78 62.0 62.7 84.0 - 66.3 76.01999 3.02 3.03 7.59 - 4.20 - 3.09 3.03 3.08 63.8 63.5 86.6 - 70.9 -2000 2.47 2.81 - - 2.58 - 2.47 2.81 2.57 60.7 63.2 - - 64.7 -2001 2.89 3.03 6.76 5.96 4.41 4.06 2.95 3.09 3.00 63.1 63.7 81.7 79.1 75.3 72.12002 2.84 2.92 7.12 - 5.00 - 2.89 2.92 2.90 62.6 62.1 83.0 - 75.8 -2003 2.94 3.08 8.82 5.58 4.04 - 3.02 3.10 3.04 63 64.4 86.1 78.3 71.4 -2004 3.11 2.95 7.33 5.22 4.71 6.48 3.17 3.22 3.18 64.7 65.0 86.2 76.4 77.6 88.02005 3.19 3.33 7.05 4.19 4.31 2.89 3.31 3.33 3.31 65.9 66.4 83.3 75.5 73.7 62.32006 3.10 3.25 9.72 5.05 3.67 3.25 3.26 3.24 65.3 65.3 90.0 76.8 69.52007 2.89 2.87 6.19 6.47 4.94 3.57 2.98 2.99 2.98 63.5 63.3 80.9 80.6 76.7 71.32008 3.04 3.03 6.35 7.47 3.82 3.39 3.08 3.07 3.08 64.6 63.9 80.1 85.5 71.1 73.02009 3.28 3.40 7.59 6.54 5.25 4.28 3.48 3.67 3.50 64.9 65.5 84.6 81.7 75.9 73.52010 3.44 3.24 6.40 5.45 4.17 3.92 3.47 3.28 3.42 66.7 65.2 80.0 75.0 72.4 70.02011 3.56 3.24 5.48 5.18 4.53 5.11 3.67 3.82 3.69 66.2 65.0 75.6 76.3 72.5 76.3
10 yr mean (2002-2011) 3.14 3.13 7.21 5.76 4.58 4.16 3.23 3.27 3.23 64.7 64.6 83.0 78.7 74.4 73.0
Overall mean 2.85 3.16 6.62 6.30 4.09 4.73 3.00 3.26 3.12 63.3 65.3 81.9 81.5 71.7 76.1

15
Table 7. Mean fork lengths (cm) and whole weight (kg) by sea age, continent of origin and NAFO Division for Atlantic salmon (Salmo salar) caught at West Greenland in 2011 with corresponding standard deviation (SD). Table does not include salmon with no age or origin.
NAFO Fork Whole Fork Whole Fork Whole Fork No. Whole No.Div. length (cm) weight (kg) length (cm) weight (kg) length (cm) weight (kg) length (cm) weight (kg)
(S.D.) (S.D.) (S.D.) (S.D.) (S.D.) (S.D.) (S.D.) (S.D.)
North American and European
1A 69.6 4.49 77.5 5.70 75.9 70.1 55 4.61 20(3.3) (0.65) (0.8) (0.71) (12.2) (4.1) (0.73)
1D 64.7 3.46 76.6 5.37 71.0 4.16 65.1 373 3.52 167(2.9) (0.63) (8.3) (2.21) (6.4) (1.42) (3.7) (0.75)
1F 67.4 3.49 75.5 5.22 76.3 5.55 68.5 244 3.75 150(3.8) (0.65) (10.0) (2.02) (9.6) (1.79) (5.5) (1.12)
All Areas 66.1 3.53 75.9 5.32 75.6 5.09 66.8 672 3.69 337(3.6) (0.68) (8.7) (1.79) (8.2) (1.73) (4.8) (0.96)
North American
1A 69.6 4.49 75.9 69.9 53 4.49 18(3.3) (0.65) (12.2) (3.9) (0.65)
1D 64.8 3.47 76.6 5.37 72.6 4.26 65.3 353 3.54 154(2.8) (0.64) (8.3) (2.21) (7.2) (1.48) (3.7) (0.77)
1F 67.6 3.52 75.2 5.54 79.1 5.90 68.5 208 3.72 132(3.3) (0.61) (10.8) (2.52) (8.1) (1.68) (5.0) (1.03)
All Areas 66.2 3.56 75.6 5.48 72.5 4.53 66.7 614 3.67 304(3.5) (0.67) (9.5) (2.19) (7.7) (1.61) (4.6) (0.91)
European
1A 77.5 5.70 77.5 2 5.70 2(0.8) (0.71) (0.8) (0.71)
1D 63.1 3.31 - - 67.5 3.31 63.3 20 3.31 13(2.6) (0.46) - - - - (2.7) (0.44)
1F 66.2 3.17 75.8 4.97 67.7 3.73 68.4 36 3.99 18(5.7) (0.96) (10.1) (1.81) (7.2) (1.49) (7.8) (1.65)
All Areas 65.0 3.24 76.3 5.18 76.3 5.11 66.9 58 3.82 33(5.0) (0.72) (8.3) (1.55) (10.5) (2.05) (7.1) (1.37)
All sea ages Previous spawners2 SW1 SW

16
Table 8. The smolt-age composition (%) of Atlantic salmon (Salmo salar) caught in 2011 at West Greenland (NA - North American and E – European). Table does not include salmon with no age or origin.
NAFODivision Origin 1 2 3 4 5 6 Total No.
1A NA 0.0 26.9 57.7 13.5 1.9 0.0 52E 0.0 50.0 50.0 0.0 0.0 0.0 2
0.0 27.8 57.4 13.0 1.8 0.0 54
1D NA 1.1 36.4 45.7 15.6 1.1 0.0 352E 25.0 50.0 20.0 5.0 0.0 0.0 20
2.4 37.1 44.4 15.0 1.1 0.0 372
1F NA 2.4 38.0 39.0 14.6 5.9 0.0 205E 16.7 52.8 30.6 0.0 0.0 0.0 36
4.6 40.2 37.8 12.4 5.0 0.0 241
All Areas NA 1.5 36.1 44.5 15.1 2.8 0.0 609E 19.0 51.7 27.6 1.7 0.0 0.0 58
3.0 37.5 43.0 13.9 2.6 0.0 667
River age (%)
17
Table 9. River age distribution (%) by origin for North American and European Atlantic salmon (Salmo salar) caught at West Greenland, 1968- 2011.
YEAR 1 2 3 4 5 6 7 8
North American
1968 0.3 19.6 40.4 21.3 16.2 2.2 0 01969 0 27.1 45.8 19.6 6.5 0.9 0 01970 0 58.1 25.6 11.6 2.3 2.3 0 01971 1.2 32.9 36.5 16.5 9.4 3.5 0 01972 0.8 31.9 51.4 10.6 3.9 1.2 0.4 01973 2 40.8 34.7 18.4 2 2 0 01974 0.9 36 36.6 12 11.7 2.6 0.3 01975 0.4 17.3 47.6 24.4 6.2 4 0 01976 0.7 42.6 30.6 14.6 10.9 0.4 0.4 01978 2.7 31.9 43 13.6 6 2 0.9 01979 4.2 39.9 40.6 11.3 2.8 1.1 0.1 01980 5.9 36.3 32.9 16.3 7.9 0.7 0.1 01981 3.5 31.6 37.5 19 6.6 1.6 0.2 01982 1.4 37.7 38.3 15.9 5.8 0.7 0 0.21983 3.1 47 32.6 12.7 3.7 0.8 0.1 01984 4.8 51.7 28.9 9 4.6 0.9 0.2 01985 5.1 41 35.7 12.1 4.9 1.1 0.1 01986 2 39.9 33.4 20 4 0.7 0 01987 3.9 41.4 31.8 16.7 5.8 0.4 0 01988 5.2 31.3 30.8 20.9 10.7 1 0.1 01989 7.9 39 30.1 15.9 5.9 1.3 0 01990 8.8 45.3 30.7 12.1 2.4 0.5 0.1 01991 5.2 33.6 43.5 12.8 3.9 0.8 0.3 01992 6.7 36.7 34.1 19.1 3.2 0.3 0 01995 2.4 19 45.4 22.6 8.8 1.8 0.1 01996 1.7 18.7 46 23.8 8.8 0.8 0.1 01997 1.3 16.4 48.4 17.6 15.1 1.3 0 01998 4 35.1 37 16.5 6.1 1.1 0.1 01999 2.7 23.5 50.6 20.3 2.9 0.0 0.0 02000 3.2 26.6 38.6 23.4 7.6 0.6 0 02001 1.9 15.2 39.4 32 10.8 0.7 0 02002 1.5 27.4 46.5 14.2 9.5 0.9 0 02003 2.6 28.8 38.9 21 7.6 1.1 0 02004 1.9 19.1 51.9 22.9 3.7 0.5 0 02005 2.7 21.4 36.3 30.5 8.5 0.5 0 02006 0.6 13.9 44.6 27.6 12.3 1 0 02007 1.6 27.7 34.5 26.2 9.2 0.9 0 02008 0.9 25.1 51.9 16.8 4.7 0.6 0 02009 2.6 30.7 47.3 15.4 3.7 0.4 0 02010 1.6 21.7 47.9 21.7 6.3 0.8 0 02011 1.5 36.1 44.5 15.1 2.8 0 0 0
10 yr mean (2002-2011) 1.8 25.2 44.4 21.1 6.8 0.7 0.0 0.0Overall Mean 2.7 31.6 39.6 18.1 6.7 1.1 0.1 0.0
18
Table 9, continued. River age distribution (%) by origin for North American and European Atlantic salmon (Salmo salar) caught at West Greenland, 1968- 2011.
YEAR 1 2 3 4 5 6 7 8European
1968 21.6 60.3 15.2 2.7 0.3 0 0 01969 0 83.8 16.2 0 0 0 0 01970 0 90.4 9.6 0 0 0 0 01971 9.3 66.5 19.9 3.1 1.2 0 0 01972 11 71.2 16.7 1 0.1 0 0 01973 26 58 14 2 0 0 0 01974 22.9 68.2 8.5 0.4 0 0 0 01975 26 53.4 18.2 2.5 0 0 0 01976 23.5 67.2 8.4 0.6 0.3 0 0 01978 26.2 65.4 8.2 0.2 0 0 0 01979 23.6 64.8 11 0.6 0 0 0 01980 25.8 56.9 14.7 2.5 0.2 0 0 01981 15.4 67.3 15.7 1.6 0 0 0 01982 15.6 56.1 23.5 4.2 0.7 0 0 01983 34.7 50.2 12.3 2.4 0.3 0.1 0.1 01984 22.7 56.9 15.2 4.2 0.9 0.2 0 01985 20.2 61.6 14.9 2.7 0.6 0 0 01986 19.5 62.5 15.1 2.7 0.2 0 0 01987 19.2 62.5 14.8 3.3 0.3 0 0 01988 18.4 61.6 17.3 2.3 0.5 0 0 01989 18.0 61.7 17.4 2.7 0.3 0 0 01990 15.9 56.3 23 4.4 0.2 0.2 0 01991 20.9 47.4 26.3 4.2 1.2 0 0 01992 11.8 38.2 42.8 6.5 0.6 0 0 01995 14.8 67.3 17.2 0.6 0 0 0 01996 15.8 71.1 12.2 0.9 0 0 0 01997 4.1 58.1 37.8 0 0 0 0 01998 28.6 60.0 7.6 2.9 0.0 1.0 0 01999 27.7 65.1 7.2 0 0 0 0 02000 36.5 46.7 13.1 2.9 0.7 0 0 02001 16.0 51.2 27.3 4.9 0.7 0 0 02002 9.4 62.9 20.1 7.6 0 0 0 02003 16.2 58.0 22.1 3.0 0.8 0 0 02004 18.3 57.7 20.5 3.2 0.2 0 0 02005 19.2 60.5 15 5.4 0 0 0 02006 17.7 54.0 23.6 3.7 0.9 0 0 02007 7.0 48.5 33.0 10.5 1 0 0 02008 7.0 72.8 19.3 0.8 0 0 0 02009 14.3 59.5 23.8 2.4 0 0 0 02010 11.3 57.1 27.3 3.4 0.8 0 0 02011 19.0 51.7 27.6 1.7 0 0 0 0
10 yr mean (2002-2011) 13.9 58.3 23.2 4.2 0.4 0.0 0.0 0.0Overall Mean 17.8 60.7 18.4 2.7 0.3 0.0 0.0 0.0

19
Table 10. The sea-age composition of Atlantic salmon (Salmo salar) caught at West Greenland in 2011 (NA - North American and E – European). Table does not include salmon with no age or origin.
Sea-age composition (%) Previous
NAFO Origin 1SW 2SW Spawners Total No.
1A NA 96.2 0.0 3.8 53E 0.0 100.0 0.0 2
92.7 3.6 3.6 55
1D NA 94.9 0.8 4.2 354E 95.0 0.0 5.0 20
94.9 0.8 4.3 374
1F NA 91.4 2.9 5.7 209E 80.6 13.9 5.6 36
89.8 4.5 5.7 245
All NA 93.8 1.5 4.7 616areas E 82.8 12.1 5.2 58
92.9 2.4 4.7 674

20
Table 11. Inventory of 2009-2011 sampled SALSEA Greenland (Enhanced Sampled) Atlantic salmon (Salmon salar) by year, Northwest Atlantic Fisheries Organization (NAFO) Division and continent of origin.
2009 European North American unknown Total
1B 4 75 79 1D 12 188 5 205 1F 26 102 128
Total 42 365 5 412 2010
1B 12 73 85 1D 39 161 2 202 1F 13 57 1 71
Total 64 291 3 358 2011
1A 2 18 20 1B 87 87 1D 14 159 173 1F 18 131 1 150
34 308 88 430 Grand Total
1A 2 18 20 1B 16 148 87 251 1D 65 508 7 580 1F 57 290 2 349
Total 140 964 96 1200

21
Table 12. Inventory of samples collected, focus of the sample, and primary Agency/Institute contacts for processing under the Enhanced Sampling program/SALSEA Greenland. Ovary samples were only collected in 2009.
Sample or tissue Sample focus Agency/Institute contact Scales (dry) age and growth DFO/NOAA (Reddin/Sheehan) Stomach (formalin) diet NOAA (Renkawitz/Sheehan) Sea Lice Collection (RNALater) Slice resistance Univ. PEI Veterinary School (Burka) Sea Lice Collection (ETOH) genetic population study Univ. of Victoria (Koop) Muscle fillet section (frozen) lipid analysis NOAA (Sheehan) Adipose tissue (ETOH) Origin determination NOAA/USGS/DFO (Sheehan/King/others) Otolith (dry) oxygen isotope analysis Univ. of Waterloo/DFO (Power/Dempson) Water samples (bottles) oxygen isotope analysis Univ. of Waterloo/DFO (Power/Dempson) Heart and kidney (formalin and RNALater) Ichthyophonus (parasite) NOAA (MacLean) pyloric caeca, gill arch, liver, spleen, kidney, and heart (formalin) parasite Marine Scotland (Noguera) Intestine (formalin) parasite to be determined Adipose and caudal fin clip, dorsal muscle and liver (frozen), Scales (dry), and Stomach (frozen) stable isotopes Univ. of Waterloo/DFO (Power/Dempson) Ovary (Bouins) sea age at maturity DFO (Chaput) Kidney (RNALater/frozen) Disease (ISAv) NOAA (MacLean) Gill rakers, pyloric caeca, spleen, kidney (frozen) disease DFO (Chaput) Vents (RVS samples) parasite Marine Scotland (Noguera)

22
Figure 1. Reported landings and quota for Atlantic salmon (Salmo salar) fishery in Greenlandic home waters for (top) 1960-2011 and (bottom) 2002-2011. 2011 reported landings were 27.5 metric tons.
0
500
1,000
1,500
2,000
2,500
3,000
1960 1965 1970 1975 1980 1985 1990 1995 2000 2005 2010
Met
ric
Ton
nes
Year
Catch Quota
0
10
20
30
40
50
60
2002 2003 2004 2005 2006 2007 2008 2009 2010 2011
Met
ric
Ton
nes
Year
Catch Quota
23
Figure 2. Map of southwest Greenland showing communities to which Atlantic salmon (Salmo salar) have historically been landed. NAFO Divisions are also shown.

24
Figure 3. The non-weighted proportion of North American origin Atlantic salmon (Salmo salar) caught at West Greenland from 2001 – 2011 (left to right, 2011 is represented by the grey filled columns) by NAFO division according to the sample data. Division 1B 2011 data were not available and will be updated in 2012. Division 1A 2005 value is based off of one sample.
0%
20%
40%
60%
80%
100%
Overall 1A 1B 1C 1D 1E 1F
% N
ort
h A
me
ric
an
Division
2001
2002
2003
2004
2005
2006
2007
2008
2009
2011

25
Figure 4. The weighted proportions of North American and European Atlantic salmon (Salmo salar) caught at West Greenland from 1982 - 2011.
0.0
0.2
0.4
0.6
0.8
1.0
Pro
port
ion
Year
EuropeanNorth American

26
Figure 5. The weighted numbers of North American and European Atlantic salmon (Salmo salar) caught at West Greenland from 1982 – 2011 (top) and 2002 – 2011 (bottom). Numbers are rounded to the nearest hundred fish. In 2011, it is estimated that approximately 6,800 and 600 North American and European origin fish were harvested respectively.
0
20,000
40,000
60,000
80,000
100,000
120,000
140,000
160,000
180,000
200,000
220,000
1982 1987 1992 1997 2002 2007
nu
mb
er
year
North American
European
0
2,000
4,000
6,000
8,000
10,000
12,000
2002 2003 2004 2005 2006 2007 2008 2009 2010 2011
nu
mb
er
year
North American
European

27
Figure 6. Mean uncorrected whole weight (kg) of European and North American 1SW Atlantic salmon (Salmo salar) sampled in West Greenland from 1969 – 2011.
2.00
2.50
3.00
3.50
4.00
4.50
5.00
1969 1972 1975 1978 1981 1984 1987 1990 1993 1996 1999 2002 2005 2008 2011
kilo
gra
ms
year
North American
European

Procedures for Issuing Manuscriptsin the
Northeast Fisheries Science Center Reference Document (CRD) Series
Clearance All manuscripts submitted for issuance as CRDs must have cleared the NEFSC’s manuscript/abstract/webpage review process. If any author is not a federal employee, he/she will be required to sign an “NEFSC Release-of-Copyright Form.” If your manuscript includes material from another work which has been copyrighted, then you will need to work with the NEFSC’s Editorial Office to arrange for permission to use that material by securing release signatures on the “NEFSC Use-of-Copyrighted-Work Permission Form.” For more information, NEFSC authors should see the NEFSC’s online publication policy manual, “Manu-script/abstract/webpage preparation, review, and dis-semination: NEFSC author’s guide to policy, process, and procedure,” located in the Publications/Manuscript Review section of the NEFSC intranet page.
Organization Manuscripts must have an abstract and table of contents, and (if applicable) lists of figures and tables. As much as possible, use traditional scientific manu-script organization for sections: “Introduction,” “Study Area” and/or ”Experimental Apparatus,” “Methods,” “Results,” “Discussion,” “Conclusions,” “Acknowl-edgments,” and “Literature/References Cited.”
Style The CRD series is obligated to conform with the style contained in the current edition of the United States Government Printing Office Style Manual. That style manual is silent on many aspects of scientific manuscripts. The CRD series relies more on the CSE Style Manual. Manuscripts should be prepared to conform with these style manuals. The CRD series uses the American Fisheries Soci-ety’s guides to names of fishes, mollusks, and decapod
crustaceans, the Society for Marine Mammalogy’s guide to names of marine mammals, the Biosciences Information Service’s guide to serial title abbreviations, and the ISO’s (International Standardization Organiza-tion) guide to statistical terms. For in-text citation, use the name-date system. A special effort should be made to ensure that all neces-sary bibliographic information is included in the list of cited works. Personal communications must include date, full name, and full mailing address of the con-tact.
Preparation Once your document has cleared the review pro-cess, the Editorial Office will contact you with publica-tion needs – for example, revised text (if necessary) and separate digital figures and tables if they are embedded in the document. Materials may be submitted to the Editorial Office as files on zip disks or CDs, email attachments, or intranet downloads. Text files should be in Microsoft Word, tables may be in Word or Excel, and graphics files may be in a variety of formats (JPG, GIF, Excel, PowerPoint, etc.).
Production and Distribution The Editorial Office will perform a copy-edit of the document and may request further revisions. The Editorial Office will develop the inside and outside front covers, the inside and outside back covers, and the title and bibliographic control pages of the docu-ment. Once both the PDF (print) and Web versions of the CRD are ready, the Editorial Office will contact you to review both versions and submit corrections or changes before the document is posted online. A number of organizations and individuals in the Northeast Region will be notified by e-mail of the availability of the document online.

Research Communications BranchNortheast Fisheries Science Center
National Marine Fisheries Service, NOAA166 Water St.
Woods Hole, MA 02543-1026
Publications and Reportsof the
Northeast Fisheries Science CenterThe mission of NOAA’s National Marine Fisheries Service (NMFS) is “stewardship of living marine resources for the benefit of the nation through their science-based conservation and management and promotion of the health of their environment.” As the research arm of the NMFS’s Northeast Region, the Northeast Fisheries Science Center (NEFSC) supports the NMFS mission by “conducting ecosystem-based research and assess-ments of living marine resources, with a focus on the Northeast Shelf, to promote the recovery and long-term sustainability of these resources and to generate social and economic opportunities and benefits from their use.” Results of NEFSC research are largely reported in primary scientific media (e.g., anonymously-peer-reviewed scientific journals). However, to assist itself in providing data, information, and advice to its constituents, the NEFSC occasionally releases its results in its own media. Currently, there are three such media:
NOAA Technical Memorandum NMFS-NE -- This series is issued irregularly. The series typically includes: data reports of long-term field or lab studies of important species or habitats; synthesis reports for important species or habitats; annual reports of overall assessment or monitoring programs; manuals describing program-wide surveying or experimental techniques; literature surveys of important species or habitat topics; proceedings and collected papers of scientific meetings; and indexed and/or annotated bibliographies. All issues receive internal scientific review and most issues receive technical and copy editing.
Northeast Fisheries Science Center Reference Document -- This series is issued irregularly. The series typically includes: data reports on field and lab studies; progress reports on experiments, monitoring, and assessments; background papers for, collected abstracts of, and/or summary reports of scientific meetings; and simple bibliographies. Issues receive internal scientific review and most issues receive copy editing.
Resource Survey Report (formerly Fishermen’s Report) -- This information report is a regularly-issued, quick-turnaround report on the distribution and relative abundance of selected living marine resources as derived from each of the NEFSC’s periodic research ves-sel surveys of the Northeast’s continental shelf. This report undergoes internal review, but receives no technical or copy editing.
TO OBTAIN A COPY of a NOAA Technical Memorandum NMFS-NE or a Northeast Fisheries Science Center Reference Document, either contact the NEFSC Editorial Office (166 Water St., Woods Hole, MA 02543-1026; 508-495-2350) or consult the NEFSC webpage on “Reports and Publications” (http://www.nefsc.noaa.gov/nefsc/publications/). To access Resource Survey Report, consult the Ecosystem Surveys Branch webpage (http://www.nefsc.noaa.gov/femad/ecosurvey/mainpage/).
ANY USE OF TRADE OR BRAND NAMES IN ANY NEFSC PUBLICATION OR REPORT DOES NOT IMPLY ENDORSE-MENT.
MEDIA MAIL


![Draft NPDES and SDS Permit to Alexandria Extrusion Co ... · 5.3.6 The Permittee shall submit a sampling and analysis plan (SAP): Due by 45 days after permit issuance. [Minn. R. 7049]](https://static.fdocuments.us/doc/165x107/5f81c666d29b58132d6ad7cd/draft-npdes-and-sds-permit-to-alexandria-extrusion-co-536-the-permittee-shall.jpg)