The International Price System - Bureau of Labor Statistics · International Linkages The...
39
The International Price System Gita Gopinath Harvard Paper prepared for Jackson Hole Symposium 2015 1 / 27
Transcript of The International Price System - Bureau of Labor Statistics · International Linkages The...

The International Price System
Gita GopinathHarvard
Paper prepared for Jackson Hole Symposium 2015
1 / 27

International Linkages: Consensus Policy View
1 Nominal Exchange Rates and Inflation
• Depreciations (appreciations) are inflationary (deflationary)
PM = Eh/f P̄ ff Eh/f ↑,PM ↑
2 Nominal Exchange Rates and Trade Balance
• Depreciations (appreciations) improve (deteriorate) tradebalance, if demand sufficiently elastic.
TOT ≡ PX
PM=
P̄hh
Eh/f P̄ ff
Eh/f ↑,TOT ↓
• Fleming (1962), Mundell (1963), Dornbusch (1976), Svenson& van Wijnbergen (1989), Obstfeld & Rogoff (1995)
2 / 27

3 / 27

Publications using BLS IPP data
1 “The International Price System,” Forthcoming Jackson Hole SymposiumProceedings, 2015.
2 Ariel Burstein and Gita Gopinath. “International Prices and ExchangeRates,” in Gopinath, G., Helpman, E., and Rogoff, K. (Eds.): Handbookof International Economics, Volume 4, 2014. Amsterdam: Elsevier
3 Gita Gopinath, Oleg Itskhoki and Brent Neiman. Trade Prices and theGlobal Trade Collapse of 2008-09,” IMF Economic Review, September2012, Volume 60(12)
4 Gita Gopinath and Oleg Itskhoki. “In Search of Real Rigidities,” NBERMacroeconomics Annual, 2010, Volume 25.
5 Gita Gopinath and Oleg Itskhoki. “Frequency of Price Adjustment andPass- through,?” Quarterly Journal of Economics, May 2010, Volume125(2).
6 Gita Gopinath, Oleg Itskhoki and Roberto Rigobon. “Currency Choiceand Exchange Rate Pass-through,?” American Economic Review, March2010, Vol- ume 100(1).
7 Gita Gopinath and Roberto Rigobon. “Sticky Borders,” Quarterly Journalof Economics, May 2008, Volume 123(2)
4 / 27
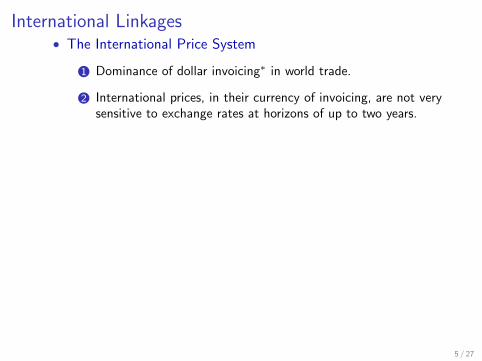
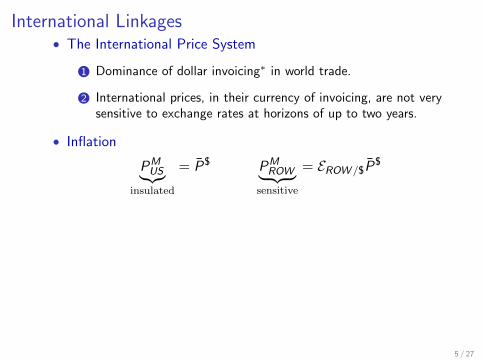
International Linkages• The International Price System
1 Dominance of dollar invoicing∗ in world trade.
2 International prices, in their currency of invoicing, are not verysensitive to exchange rates at horizons of up to two years.
• Inflation
PMUS︸︷︷︸
insulated
= P̄$ PMROW︸ ︷︷ ︸
sensitive
= EROW /$P̄$
• Terms of Trade
TOT︸ ︷︷ ︸stable
=P̄$h
P̄$f
• Devereux, Engel & Tille (2003), Corsetti & Pesenti (2005)
*currency in which an invoice for exported or imported goods is denominated. (Non-commodities)
5 / 27

Road Map
• Illustration using three countries
• Empirical evidence for IPS (35 countries)• Dollar dominance• Low sensitivity to ER’s
• Empirical evidence for IPS using BLS IPP data
• Policy Implications
6 / 27

A Tale of Three CountriesER Pass-through into Import Prices
.3.4
.5.6
.7.8
.91
1.1
PAS
S-T
HR
OU
GH
1 2 3 4 5 6 7 8HORIZON (Quarters)
Turkey Japan United States
∆ipin,t = αn +∑T
k=0 βn,k∆en,t−k +∑T
k=0 γn,k∆ppin,t−k + εn,t , T = 8
ERPT Turkey Japan USOne quarter 93% 83% 34%Eight quarter 100% 90% 44%Foreign Invoicing 97% 76% 7%
7 / 27

Road Map
• Illustration using three countries
• Empirical evidence for IPS (35 countries)• Dollar dominance• Low sensitivity to ER’s
• Macro and micro implications of IPS: Casas, Diez, Gopinath,Gourinchas (2015)
8 / 27

Data
• Import Price Index and Producer Price Index data
• Construct trade weighted exchange rates and trade weightedPPI
• Bilateral trade flows: IMF’s Direction of Trade Statistics database
• Currency invoicing• Customs agencies, central banks, other statistical agencies• Kamps (2006), Chinn & Ito (2014)
• BLS confidential import and export price data
• I-O tables to measure import content in consumption
9 / 27
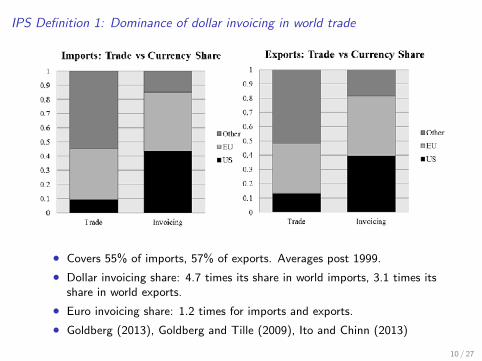
IPS Definition 1: Dominance of dollar invoicing in world trade
• Covers 55% of imports, 57% of exports. Averages post 1999.
• Dollar invoicing share: 4.7 times its share in world imports, 3.1 times itsshare in world exports.
• Euro invoicing share: 1.2 times for imports and exports.
• Goldberg (2013), Goldberg and Tille (2009), Ito and Chinn (2013)
10 / 27

IPS Definition 1: Dominance of dollar invoicing in world trade
Invoicing shares and GDP per capita0
.2.4
.6.8
1Sh
are
AU BE BR CA CO CY CZ DE EE FR GR HU ID IL IN IS IT JP LV
Dollar U.S. Trade
0.2
.4.6
.8Sh
are
CH ES LU MT NL NO PK PL PT RO SE SI TH TR UA UK
Dollar U.S. Trade
Figure : Dollar Dominance in World Trade: By Country
11 / 27

IPS Definition 1: Dominance of dollar invoicing in world trade
Country Imports Exports
United States 0.93 0.97Italy* 0.58 0.61Germany* 0.55 0.62Spain* 0.54 0.58France* 0.45 0.50United Kingdom 0.32 0.51Australia 0.31 0.20Switzerland 0.31 0.35Norway 0.30 0.03Sweden 0.24 0.39Japan 0.23 0.39Canada 0.20 0.23Poland 0.06 0.04Iceland 0.06 0.05Thailand 0.04 0.07Israel 0.03 0.00Turkey 0.03 0.02South Korea 0.02 0.01Brazil 0.01 0.01Indonesia 0.01 0.00India 0.00 0.00 12 / 27

IPS Definition 1: Dominance of dollar invoicing in world trade
Invoicing shares and GDP per capita
AR
AU
BE
BRBG
CA
CO
CY
CZ
EE
FRDE
GR
HU ISIN ID IL
IT
JP
LVLT
LU
MT
NL
NO
PKPL
PT
RO
SKSI
KR
ES
SECH
TH TRUA
UK
US
0.2
.4.6
.81
For
eign
Cur
renc
y In
voic
ing
Sha
re
7 8 9 10 11 12Log GDP Per Capita
(a) Imports
AR
AU
BRBG
CA
COCZ
HU ISIN ID IL
JPNO
PKPL
RO KR
SECH
TH TRUA
UK
US
0.2
.4.6
.81
For
eign
Cur
renc
y In
voic
ing
Sha
re7 8 9 10 11 12
Log GDP Per Capita
(b) Imports, Ex-Euro
13 / 27

IPS Definition 1: Dominance of dollar invoicing in world trade
Invoicing shares and GDP per capita
DZ AR
AU
ATBE
BRBG
CA
CO
CZ
FRDE
GR
HU ISIN ID IL
IT
JP
LVLT
LU
MY
NL
NOPKPL
PT
RO
SKSI
ZA
KR
ES
SECH
THTRUA
UK
US0.2
.4.6
.81
For
eign
Cur
renc
y In
voic
ing
Sha
re
7 8 9 10 11 12Log GDP Per Capita
(c) Exports
DZ AR
AU
BRBG
CA
CO
CZHU IS
IN ID IL
JP
MY NOPKPL
RO
ZA
KR
SECH
THTRUA
UK
US0.2
.4.6
.81
For
eign
Cur
renc
y In
voic
ing
Sha
re7 8 9 10 11 12
Log GDP Per Capita
(d) Exports, Ex-Euro
14 / 27

IPS Definition 1a: Relative Stability of invoicing patterns over time
0.3
.6.9
1995 2000 2005 2010 2015Australia
0.3
.6.9
2000 2005 2010 2015Iceland
0.3
.6.9
1990 1995 2000 2005 2010 2015Indonesia
0.3
.6.9
1970 1980 1990 2000 2010Japan
0.3
.6.9
2000 2005 2010 2015
Norway
0.3
.6.9
1995 2000 2005 2010 2015South Korea
0.3
.6.9
1995 2000 2005 2010 2015United States
0.3
.6.9
1995 2000 2005 2010 2015Thailand
0.3
.6.9
1995 2000 2005 2010 2015Turkey
Figure : Fraction Priced in Foreign Currency
15 / 27

IPS Definition 2a: Countries with high SRPT have high LRPT
• Dynamic Lag Regression
∆ipin,t = αn+T∑
k=0
βn,k∆en,t−k+T∑
k=0
γn,k∆ppin,t−k+εn,t , T = 8
• Cumulative Pass-through, PTn,m ≡∑m
k=0 βn,k
PTn,m = γ + ηPTn,1 + εn,m, m = 4, 8
• Start date 1990, 40 quarters at least, IP excluding petroleumfor U.S.
• VECM, Generated regressor bias
• Burstein and Gopinath (2014)
16 / 27

IPS Definition 2a: Countries with high SRPT have high LRPT (4 quarter)
ARAU
BRCA
COCZ DKEE
FIFR
DE
HK
HU
IE
IL
IT
JP
LV
MX
NL
NZNO
PK
PH
SG
ZA
KR
ES
SE
CH
TH
TR
UK
US
VE
.2.5
.81
.1F
OU
R Q
UA
RT
ER
.2 .5 .8 1.1ONE QUARTER
Four Quarter
Slope InterceptOLS 0.921 0.053
(0.11) (0.07)
Bootstrap
Mean 0.84 0.135th-pctile 0.57 -0.0895th-pctile 1.19 0.32S.D. 0.23 0.15
(R2 = 0.68, N = 35)
∆ipin,t = αn +∑T
k=0 βn,k∆en,t−k +∑T
k=0 γn,k∆ppin,t−k + εn,t , T = 8
PTn,4 = γ + ηPTn,1 + εn,4
17 / 27

IPS Definition 2a: Countries with high SRPT have high LRPT (8 quarter)
ARAU
BRCA
COCZ DK
EE
FIFR
DE
HK
HU
IE
ILIT
JP
LV
MX
NL
NZNO PK
PH
SG
ZA
KR
ES
SE
CH
TH
TR
UK
US
VE
.2.5
.81
.1E
IGH
T Q
UA
RT
ER
.2 .5 .8 1.1ONE QUARTER
Eight Quarter
Slope InterceptOLS 0.871 0.102
(0.14) (0.10)
Bootstrap
Mean 0.708 0.2505th-pctile 0.33 0.0095th-pctile 1.11 0.52S.D. 0.27 0.18
(R2 = 0.53, N = 35)
PTn,8 = γ + ηPTn,1 + εn,8
18 / 27
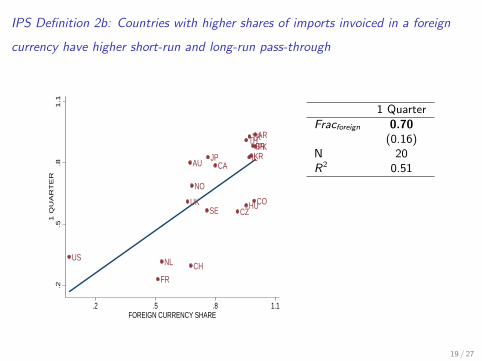
IPS Definition 2b: Countries with higher shares of imports invoiced in a foreign
currency have higher short-run and long-run pass-through
AR
AUBR
CA
COCZHU
ILJP
NO
PKKR
SE
CH
THTR
UK
US
FR
NL
.2.5
.81
.11 Q
UA
RT
ER
.2 .5 .8 1.1FOREIGN CURRENCY SHARE
1 Quarter
Fracforeign 0.70(0.16)
N 20R2 0.51
19 / 27

IPS Definition 2b: Countries with higher shares of imports invoiced in a foreign
currency have higher short-run and long-run pass-through
ARAU
BR
CA
COCZHU
IL
JP
NO
PKKR
SE
CH
TH
TR
UK
US
FR
NL
.2.5
.81.
14
QU
AR
TER
.2 .5 .8 1.1FOREIGN CURRENCY SHARE
ARAU
BRCA
COCZ
HU
IL
JP
NOPK
KRSE
CH
TH
TR
UK
USFR
NL
.2.5
.81.
18
QU
AR
TER
.2 .5 .8 1.1FOREIGN CURRENCY SHARE
4 Quarter 8 Quarter
Fracforeign 0.57 0.40(0.18) (0.18)
N 20 20R2 0.34 0.17
20 / 27
Detailed Evidence from the U.S.
1 US BLS price surveys, 1994.M1-2014.M6.• Gopinath, Itskhoki, Rigobon (2010)
2 Prices, as opposed to unit values
3 Exclude intra-firm transactions
4 Can condition on a price change
21 / 27

Detailed Evidence from the U.S.US BLS price surveys, 1994.M1-2014.M6, Gopinath, Itskhoki, Rigobon (2010)
0.2
.4.6
.81
1.2
PAS
S-T
HR
OU
GH
1 6 12 18 24HORIZON
DOLLAR NON DOLLAR ALL
Figure : Aggregate ERPT by Currency
22 / 27
0.3
.6.9
1.2
1 5 9 13 17 21 25
Germany
0.3
.6.9
1.2
1 5 9 13 17 21 25
Switzerland
0.3
.6.9
1.2
1 5 9 13 17 21 25
Italy
0.3
.6.9
1.2
1 5 9 13 17 21 25
UK
0.3
.6.9
1.2
1 5 9 13 17 21 25
Japan
0.3
.6.9
1.2
1 5 9 13 17 21 25
France
0.3
.6.9
1.2
1 5 9 13 17 21 25
Spain
0.3
.6.9
1.2
1 5 9 13 17 21 25
Belgium
0.3
.6.9
1.2
1 5 9 13 17 21 25
Netherlands
0.3
.6.9
1.2
1 5 9 13 17 21 25
Sweden
0.3
.6.9
1.2
1 5 9 13 17 21 25
Canada
0.3
.6.9
1.2
1 5 9 13 17 21 25
Austria
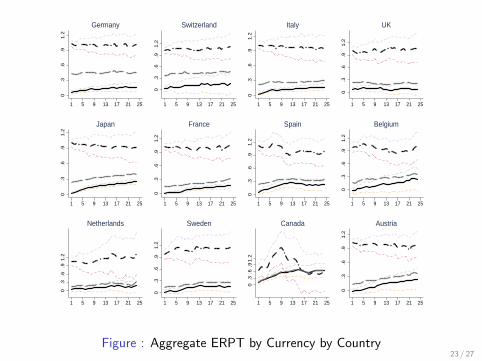
Figure : Aggregate ERPT by Currency by Country23 / 27

IPS Definition 2c: Border prices, in whatever currency they are set in, respond
partially to exchange rate shocks even conditional on a price change
go
PT Conditional on Price ChangeD ND
All 0.26 0.85Germany 0.32 0.85Switz. 0.21 0.67Italy 0.24 0.76UK 0.23 0.77France 0.19 0.72Spain 0.21 0.76Diff. 0.21 0.9310 HS 0.27 0.88Sufficient statistic for currency choice
24 / 27

IPS Definition 2c: Border prices, in whatever currency they are set in, respond
partially to exchange rate shocks even conditional on a price change
go
PT Conditional on Price ChangeD ND
All 0.26 0.85Germany 0.32 0.85Switz. 0.21 0.67Italy 0.24 0.76UK 0.23 0.77France 0.19 0.72Spain 0.21 0.76Diff. 0.21 0.9310 HS 0.27 0.88Sufficient statistic for currency choice
Life-long PTD ND
All 0.47 1.01
Diff. 0.39 0.98
24 / 27

International Price Systemgo
Endogenous currency choice: Price in a currency in which ‘desired’prices are most stable
• Strategic complementarity in pricing• Demand systems: Kimball (1995), Melitz and Ottaviano
(2008), Bergin and Feenstra (2001)• GIR(2010): Homogenous (differentiated) goods prices in
dollars (foreign currency)
• Imported input costs• Chung (2014)
• Can explain• Why SR and LRPT are similar
• Link between invoicing choices and PT
• Why dollar dominance hard to break
• Cannot be the full story: fixed costs important
25 / 27

International Price Systemgo
Endogenous currency choice: Price in a currency in which ‘desired’prices are most stable
• Strategic complementarity in pricing• Demand systems: Kimball (1995), Melitz and Ottaviano
(2008), Bergin and Feenstra (2001)• GIR(2010): Homogenous (differentiated) goods prices in
dollars (foreign currency)
• Imported input costs• Chung (2014)
• Can explain• Why SR and LRPT are similar
• Link between invoicing choices and PT
• Why dollar dominance hard to break
• Cannot be the full story: fixed costs important25 / 27

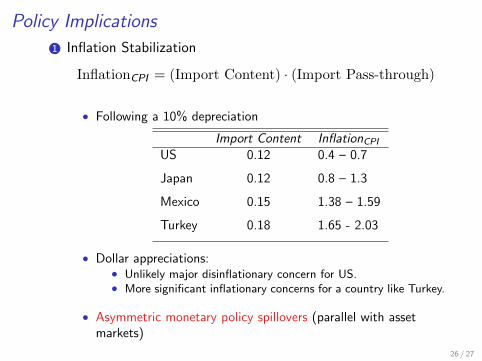
Policy Implications
1 Inflation Stabilization
InflationCPI = (Import Content) · (Import Pass-through)
• Following a 10% depreciation
Import Content InflationCPI
US 0.12 0.4 – 0.7
Japan 0.12 0.8 – 1.3
Mexico 0.15 1.38 – 1.59
Turkey 0.18 1.65 - 2.03
• Dollar appreciations:• Unlikely major disinflationary concern for US.• More significant inflationary concerns for a country like Turkey.
• Asymmetric monetary policy spillovers (parallel with assetmarkets)
26 / 27

Policy Implications
2 Export Competitiveness: quantities versus mark-ups• Do depreciations (appreciations) make exports cheaper
(expensive)?• For the U.S., Yes• For most others, No: Mainly fluctuations in mark-ups (profits)
• Japan: 33% of exports invoiced in yen.• PT into dollar prices even conditional on a price change for
these goods is 23%
3 Internationalization of Currencies: chinese yuan• Added benefit of insulating domestic inflation from external
shocks.
4 Special Drawing Rights: more symmetry• Bring greater symmetry in policy spillovers.• To be privately optimal, will need a large number of importers
and exporters to price in SDRs.
27 / 27