The Intergovernmental Panel on Climate Change: What do they have to tell the world? Gordon J....
86
The Intergovernmental Panel on Climate Change: What do they have to tell the world? Gordon J. Aubrecht, II author of Energy: Physical, Environmental, and Social Impact (Prentice Hall, 2006) http://vig.prenhall.com/catalog/academic/product/0,1144,01309322 21,00.html Physics Education Research Group Ohio State University Marion Campus Talk presented at OSU science cafe, Old Long’s Bookstore, 2 April 2008
-
Upload
maria-kelly -
Category
Documents
-
view
217 -
download
2
Transcript of The Intergovernmental Panel on Climate Change: What do they have to tell the world? Gordon J....
The Intergovernmental Panel on Climate
Change:What do they have to
tell the world?Gordon J. Aubrecht, II
author of Energy: Physical, Environmental, and Social Impact (Prentice Hall, 2006)http://vig.prenhall.com/catalog/academic/product/0,1144,0130932221,00.html
Physics Education Research GroupOhio State University Marion Campus
Talk presented at OSU science cafe, Old Long’s Bookstore, 2 April 2008

Abstract: The Fourth Assessment Report of the IPCC released in 2007 dealt with the scientific basis for climate change, consequences of emissions, and mitigation and adaptation. This talk will outline the main results of the world scientific consensus on climate change and what that will mean for our future.
The Intergovernmental Panel on Climate Change (IPCC) shared last year’s Nobel Peace Prize “for their efforts to build up and disseminate greater knowledge about man-made climate change, and to lay the foundations for the measures that are needed to counteract such change.”
There are three working groups of the IPCC (the physical science basis; impacts, adaptation, and vulnerability; and mitigation of climate change) that issued the reports in 2007. I focus on what these reports say about human effects on Earth.
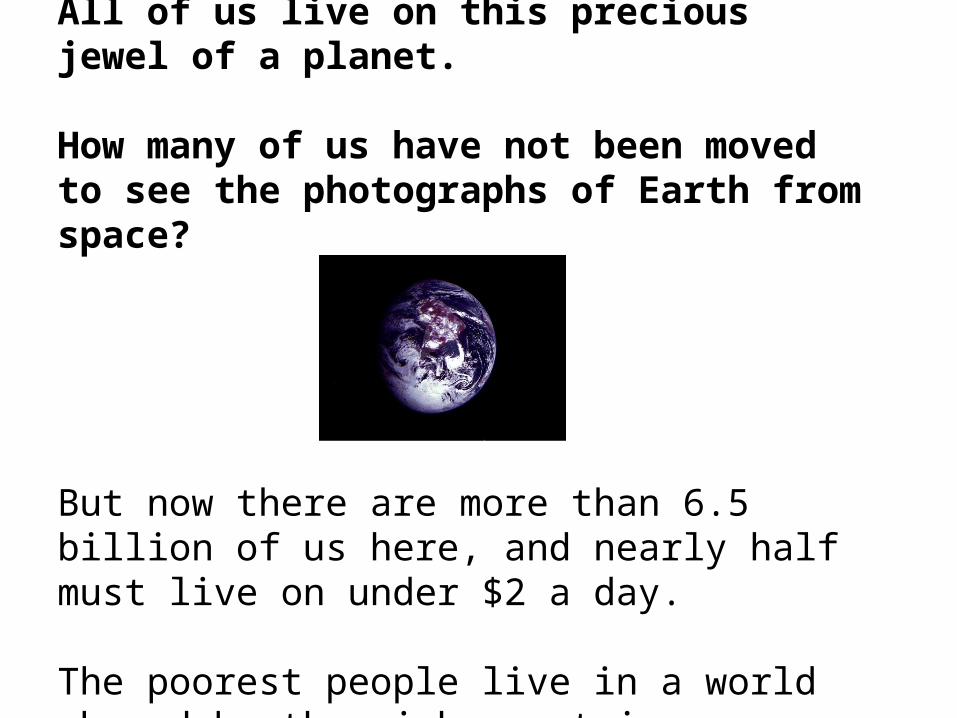
All of us live on this precious jewel of a planet.
How many of us have not been moved to see the photographs of Earth from space?
But now there are more than 6.5 billion of us here, and nearly half must live on under $2 a day.
The poorest people live in a world shaped by the rich countries.
Many of you have heard of the IPCC. For those of you who have not, it is run by the UN and the WMO and is made up of scientific experts who comb through what is known in the scientific literature and summarize the findings. Diversity of views is solicited. About one-third of the scientists in the first assessment participated in the second, about one-third who were in the second participated in the third, and so on. Governments (180 members) vote line by line on the Summaries for Policymakers. (You may have heard of the resistance of the US and China to these reports, which do reflect their objections.)

Here is an extremely condensed summary of the results of the four assessments:
1990 First Assessment Report“The unequivocal detection of the enhanced greenhouse effect from observations is not likely for a decade or more.”
1995 Second Assessment Report“The balance of evidence suggests a discernable human influence on global climate.”
2001 Third Assessment Report“There is new and stronger evidence that most of the warming observed over the last 50 years is attributable to human activities.”
2007 Fourth Assessment Report“Most of the observed increase in globally averaged temperatures since the mid-20th century is very likely due to the observed increase in anthropogenic greenhouse gas concentrations.”

Terminology used by IPCCLikelihood of the occurrence / outcome
Virtually certain >99% probability Very likely 90 to 99% probabilityLikely 66 to 90% probabilityAbout as likely as not 33 to 66% probabilityUnlikely 10 to 33% probabilityVery unlikely 1 to 10% probabilityExceptionally unlikely <1% probability
Let me repeat the last statement from the 2007 Fourth Assessment Report, which may not have sounded very impressive:
“Most of the observed increase in globally averaged temperatures since the mid-20th century is very likely due to the observed increase in anthropogenic greenhouse gas concentrations.”
Very likely means a 90 to 99% probability! IPCC is not kidding around about this.

The IPCC report actually comes from amalgamation of results from three separate Working Groups:
the scientific basis (WG1); impacts, adaptation, and vulnerability (WG2); and
mitigation of climate change (WG3).

Why CO2 is implicated
Humans began to affect the world when people began to clear land and grow crops. The
industrial revolution involved fossil fuel burning on an unprecedented scale.
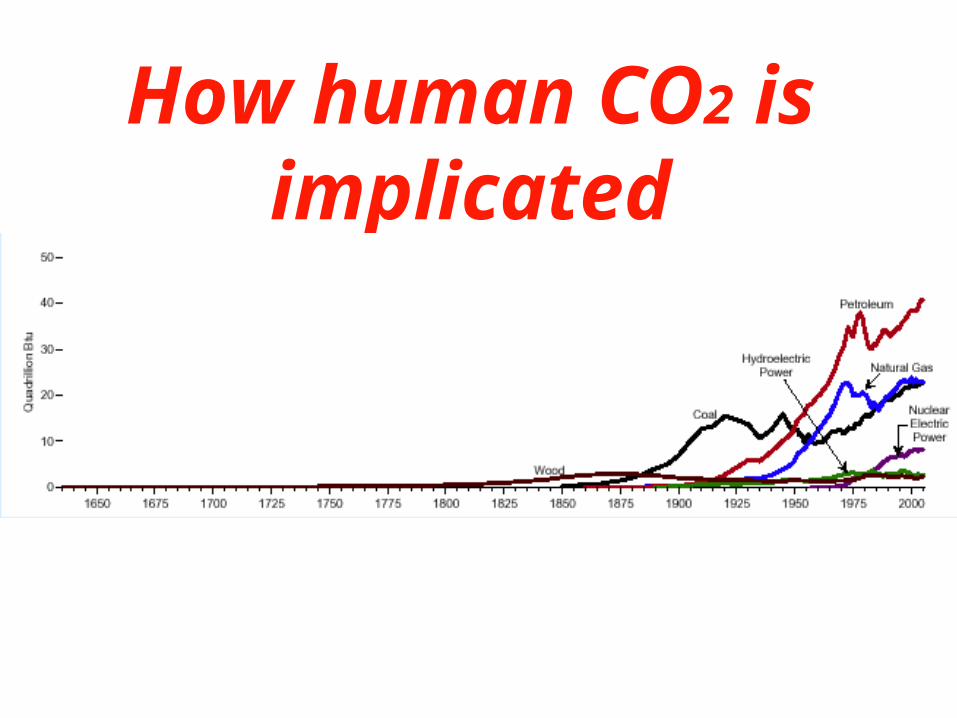
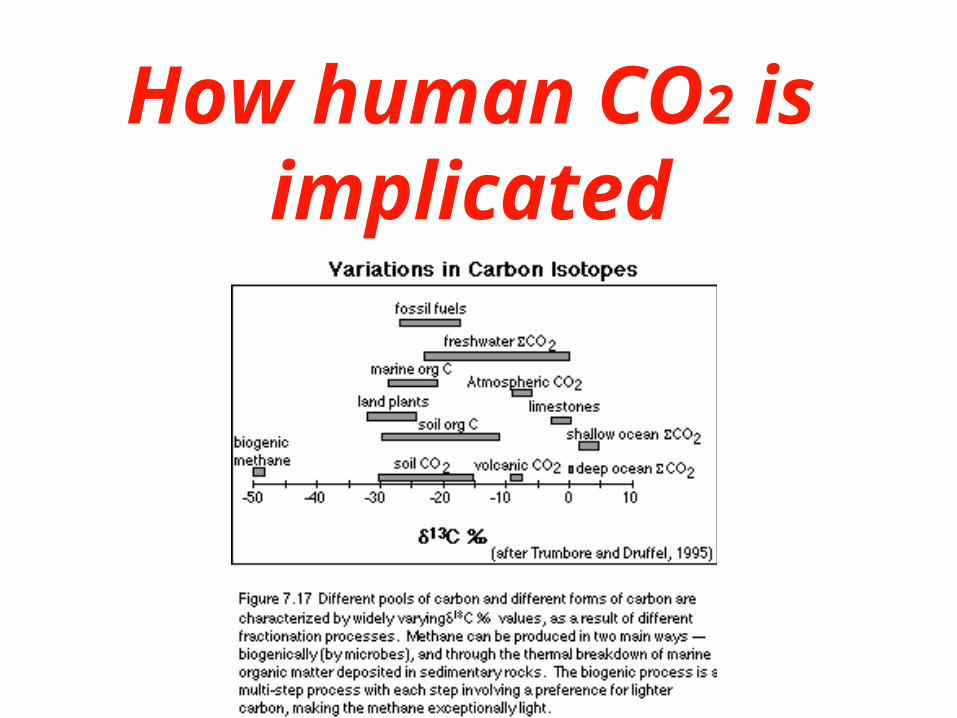
How human CO2 is implicated

How human CO2 is implicated
How human CO2 is implicated
How human CO2 is implicated
Photosynthesis — on land or in the sea — always takes more of the lower-mass carbon (carbon-12) from the mix of available CO2. So carbon fixed by
plants will always have a 13C value less than that
of the source CO2.
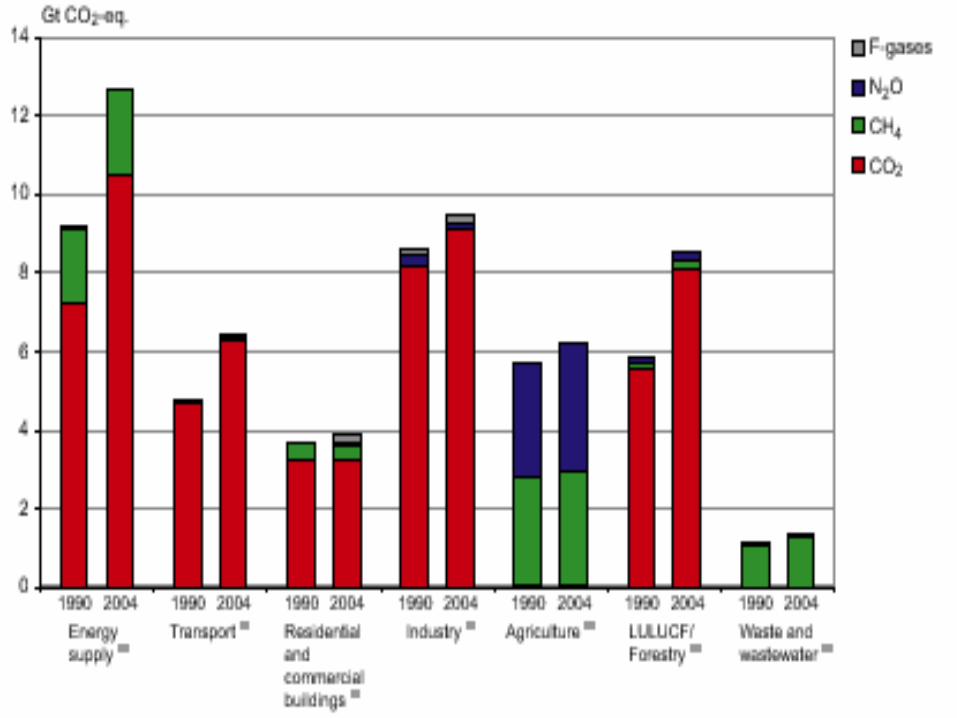

Electricity & transportation emissions are growing fastest.


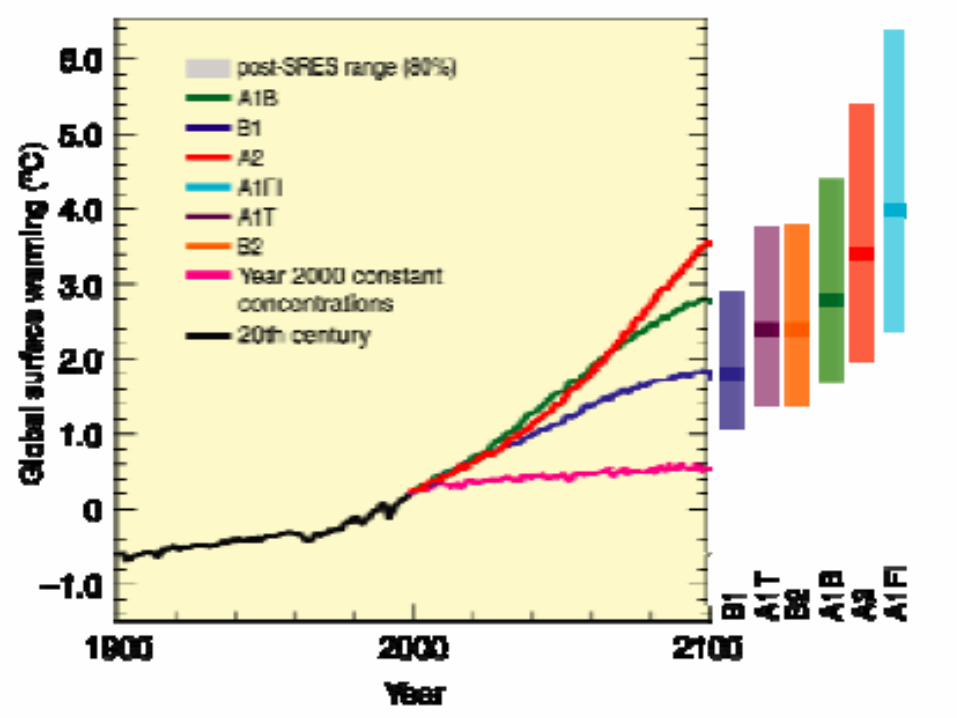
IPCC Special Report on Emission Scenarios
(SRES)The SRES scenarios do not include additional
climate initiatives, which means that no scenarios are included that explicitly assume
implementation of the United Nations Framework
Convention on Climate Change or the emissions targets of the Kyoto Protocol.

A1. The A1 storyline and scenario family describes a future world of very rapid economic growth, global population that peaks in mid-century and declines thereafter, and the rapid introduction of new and more efficient technologies. Major underlying themes are convergence among regions, capacity building and increased cultural and social interactions, with a substantial reduction in regional differences in per capita income. The A1 scenario family develops into three groups that describe alternative directions of technological change in the energy system. The three A1 groups are distinguished by their technological emphasis: fossil intensive (A1FI), non fossil energy sources (A1T), or a balance across all sources (A1B) (where balanced is defined as not relying too heavily on one particular energy source, on the assumption that similar improvement rates apply to all energy supply and end use technologies).

A2. The A2 storyline and scenario family describes a very heterogeneous world. The underlying theme is self reliance and preservation of local identities. Fertility patterns across regions converge very slowly, which results in continuously increasing population. Economic development is primarily regionally oriented and per capita economic growth and technological change more fragmented and slower than other storylines.

B1. The B1 storyline and scenario family describes a convergent world with the same global population, that peaks in mid-century and declines thereafter, as in the A1 storyline, but with rapid change in economic structures toward a service and information economy, with reductions in material intensity and the introduction of clean and resource efficient technologies. The emphasis is on global solutions to economic, social and environmental sustainability, including improved equity, but without additional climate initiatives.

B2. The B2 storyline and scenario family describes a world in which the emphasis is on local solutions to economic, social and environmental sustainability. It is a world with continuously increasing global population, at a rate lower than A2, intermediate levels of economic development, and less rapid and more diverse technological change than in the B1 and A1 storylines. While the scenario is also oriented towards environmental protection and social equity, it focuses on local and regional levels.
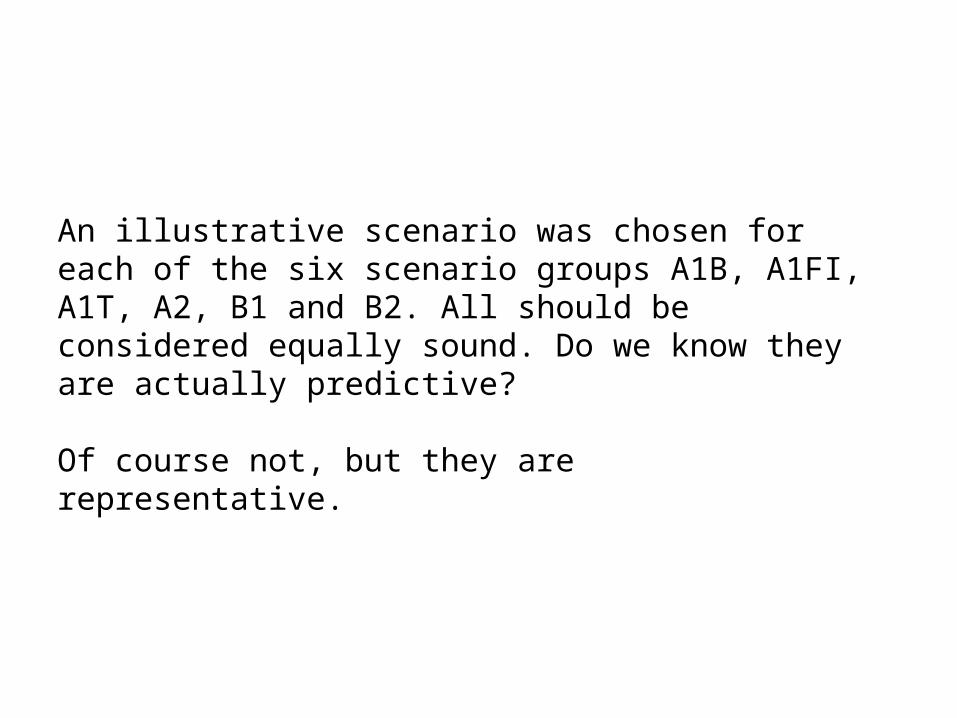
An illustrative scenario was chosen for each of the six scenario groups A1B, A1FI, A1T, A2, B1 and B2. All should be considered equally sound. Do we know they are actually predictive?
Of course not, but they are representative.
“Defining what is dangerous anthropogenic
interferencewith the climate system and, consequently, the
limits to beset for policy purposes are complex tasks that
can only bepartially based on science, as such
definitions inherentlyinvolve normative
judgments.” —WG3
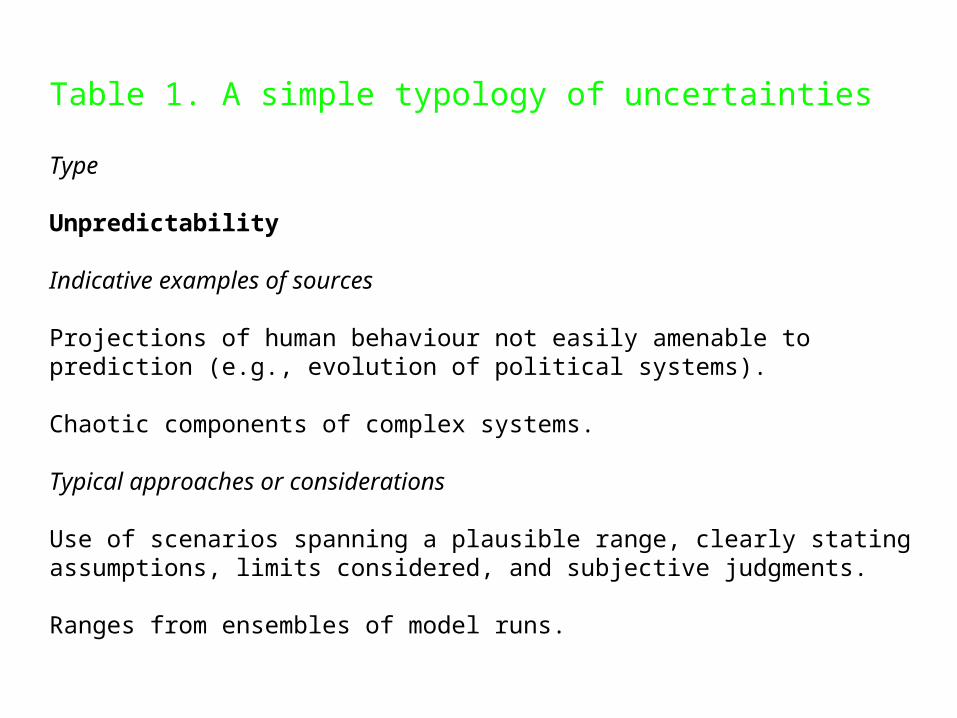
Table 1. A simple typology of uncertainties
Type
Unpredictability
Indicative examples of sources
Projections of human behaviour not easily amenable to prediction (e.g., evolution of political systems).
Chaotic components of complex systems.
Typical approaches or considerations
Use of scenarios spanning a plausible range, clearly stating assumptions, limits considered, and subjective judgments.
Ranges from ensembles of model runs.
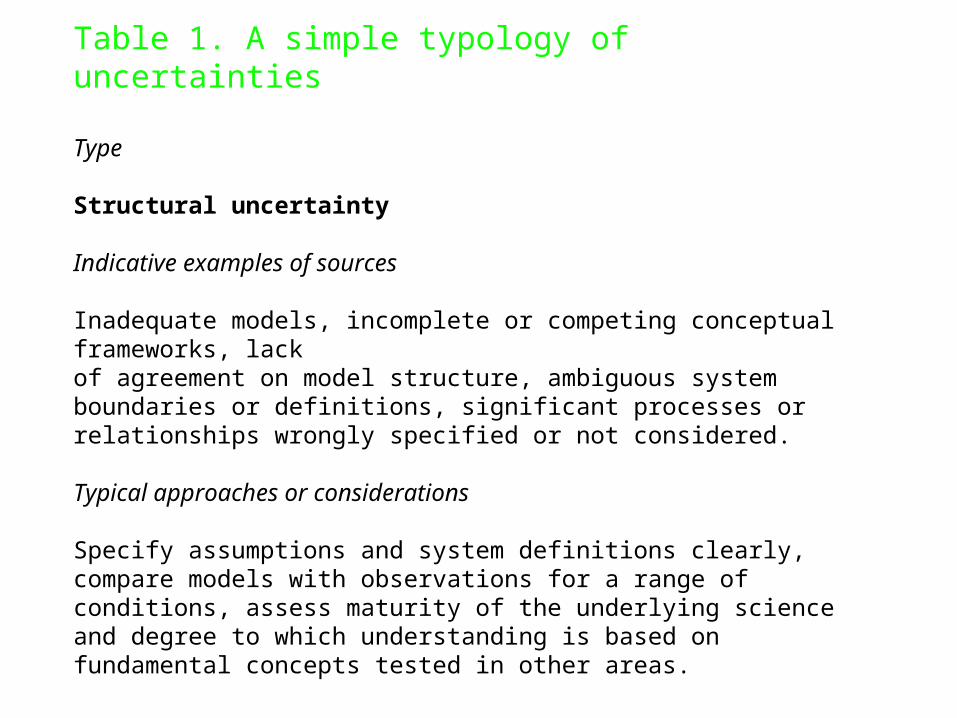
Table 1. A simple typology of uncertainties
Type
Structural uncertainty
Indicative examples of sources
Inadequate models, incomplete or competing conceptual frameworks, lackof agreement on model structure, ambiguous system boundaries or definitions, significant processes or relationships wrongly specified or not considered.
Typical approaches or considerations
Specify assumptions and system definitions clearly, compare models with observations for a range of conditions, assess maturity of the underlying science and degree to which understanding is based on fundamental concepts tested in other areas.

Table 1. A simple typology of uncertainties
Type
Value uncertainty
Indicative examples of sources
Missing, inaccurate or non-representative data, inappropriate spatial or temporalresolution, poorly known or changing model parameters.
Typical approaches or considerations
Analysis of statistical properties of sets of values (observations, model ensembleresults, etc); bootstrap and hierarchical statistical tests; comparison of models with observations.
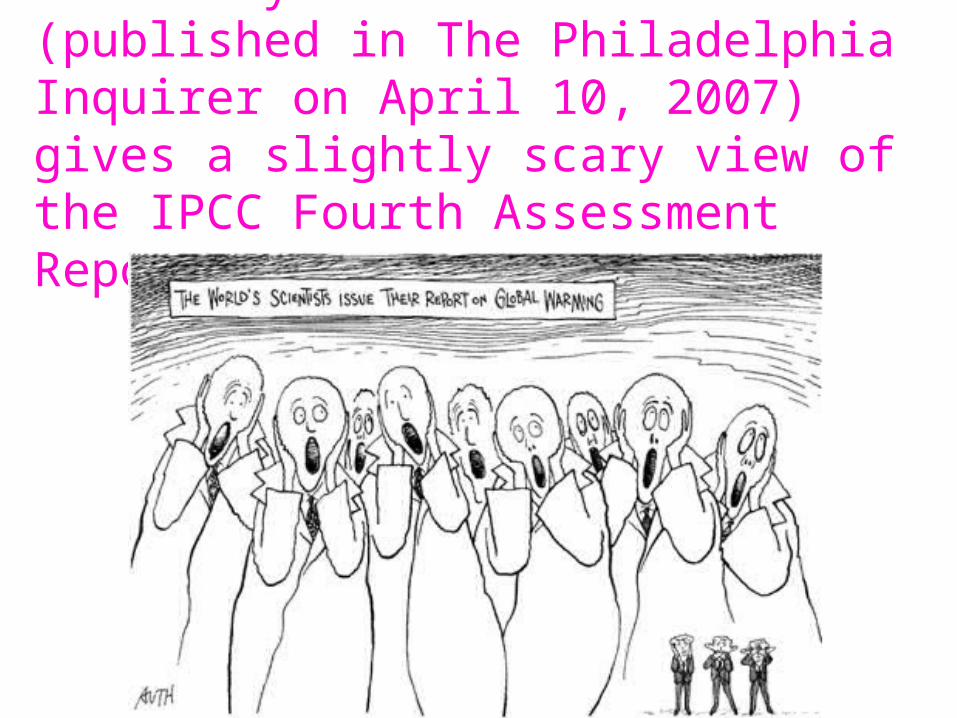
This Tony Auth cartoon (published in The Philadelphia Inquirer on April 10, 2007) gives a slightly scary view of the IPCC Fourth Assessment Report

WG1
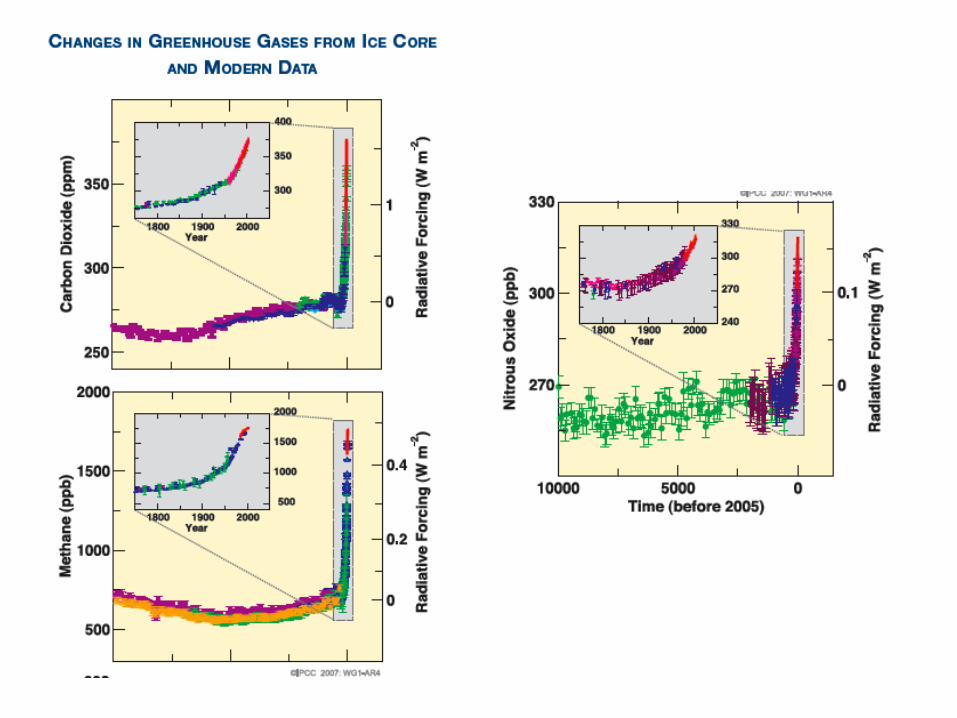
The global atmospheric nitrous oxide concentration increased from a pre-industrial value of about 270 ppb to 319 ppb in 2005. The growth rate has been approximately constant since 1980. More than a third of all nitrous oxide emissions are anthropogenic and are primarily due to agriculture.
The combined radiative forcing due to increases in carbon dioxide, methane, and nitrous oxide is +2.30 [+2.07 to +2.53] W m–2, and its rate of increase during the industrial era is very likely to have been unprecedented in more than 10,000 years.

WG1
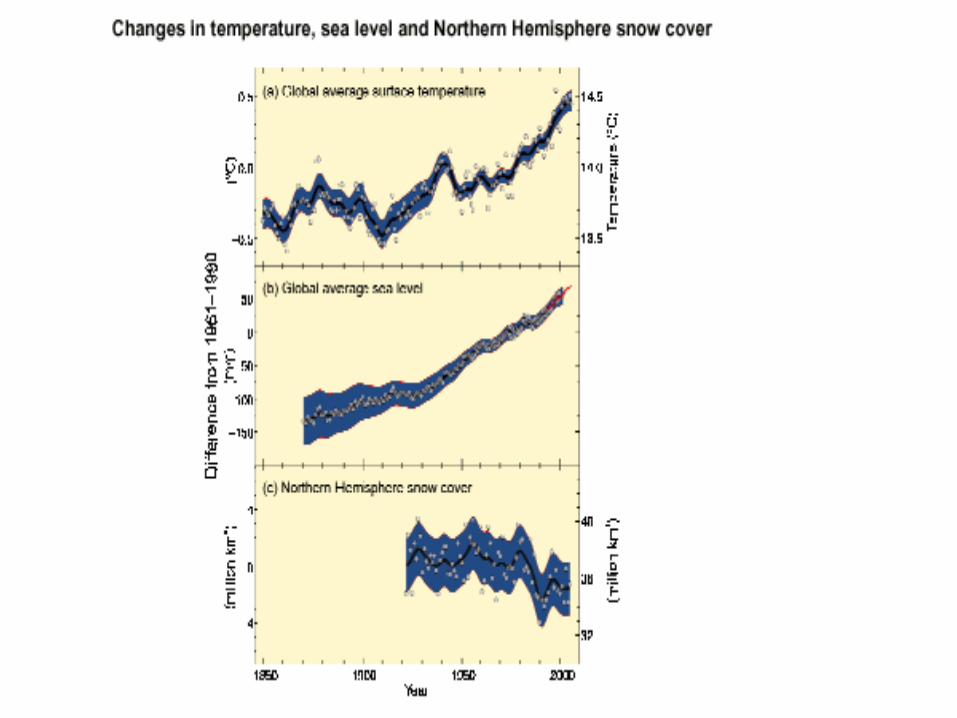
“Warming of the climate system is unequivocal, as is now evident from observations of increases in global average air and ocean temperatures, widespread melting of snow and ice, and rising global average sea level.”
WG1
“At continental, regional and ocean basin scales, numerous long-term changes in climate have been observed. These include changes in arctic temperatures and ice, widespread changes in precipitation amounts, ocean salinity, wind patterns and aspects of extreme weather including droughts, heavy precipitation, heat waves and the intensity of tropical cyclones.”
“Palaeoclimatic information supports the interpretation that the warmth of the last half century is unusual in at least the previous 1,300 years. The last time the polar regions were significantly warmer than present for an extended period (about 125,000 years ago), reductions in polar ice volume led to 4 to 6 m of sea level rise.”
WG1
“Most of the observed increase in global average temperatures since the mid-20th century is very likely due to the observed increase in anthropogenic greenhouse gas concentrations. This is an advance since the TAR’s conclusion that ‘most of the observed warming over the last 50 years is likely to have been due to the increase in greenhouse gas concentrations’. Discernible human influences now extend to other aspects of climate, including ocean warming, continental-average temperatures, temperature extremes and wind patterns.”
“For the next two decades, a warming of about 0.2 °C per decade is projected for a range of SRES emission scenarios. Even if the concentrations of all greenhouse gases and aerosols had been kept constant at year 2000 levels, a further warming of about 0.1 °C per decade would be expected.”
“There is now higher confidence in projected patterns of warming and other regional-scale features, including changes in wind patterns, precipitation and some aspects of extremes and of ice.”


WG1
“Anthropogenic warming and sea level rise would continue for centuries due to the time scales associated with climate processes and feedbacks, even if greenhouse gas concentrations were to be
stabilised.”

WG1
“Both past and future anthropogenic carbon dioxide emissions will continue to contribute to warming and sea level rise for more than a millennium, due to the time scales required for removal of this gas from the atmosphere.”
If T ~ 1.5 °C - 2.5 °C, 20% - 30% of plants and
animals at high risk of extinction.
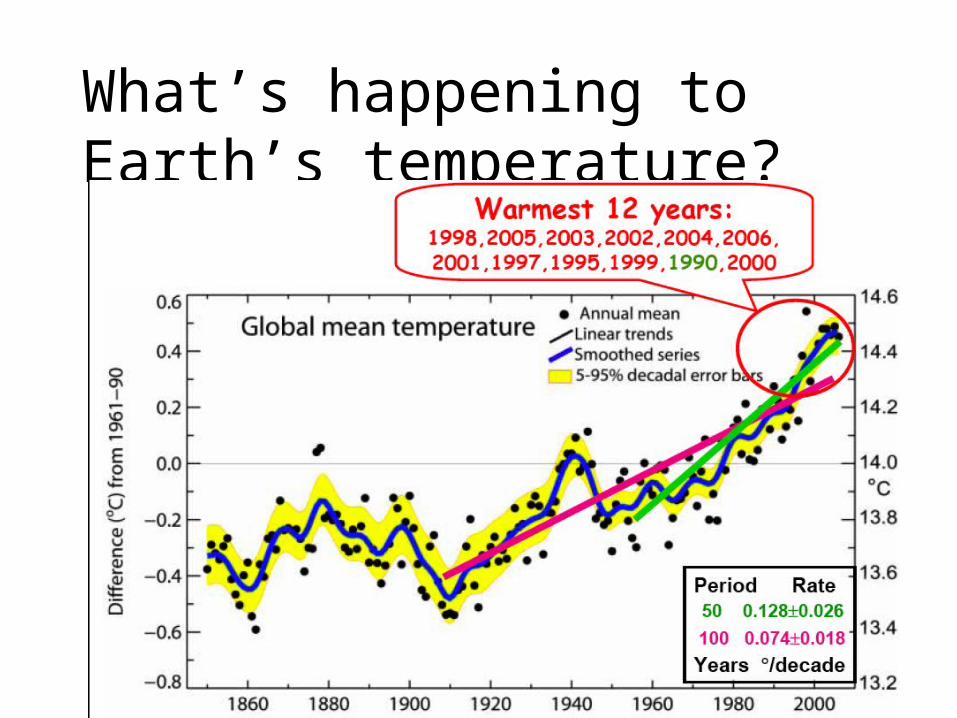
What’s happening to Earth’s temperature?
1
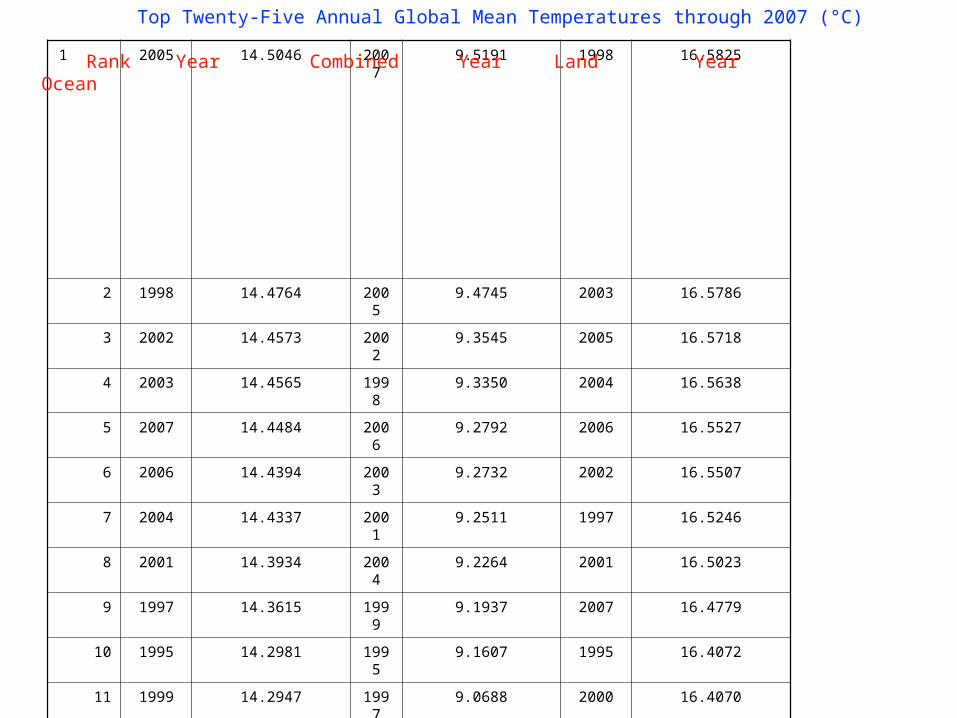
2005 14.5046 2007 9.5191 1998 16.5825
2 1998 14.4764 2005 9.4745 2003 16.5786
3 2002 14.4573 2002 9.3545 2005 16.5718
4 2003 14.4565 1998 9.3350 2004 16.5638
5 2007 14.4484 2006 9.2792 2006 16.5527
6 2006 14.4394 2003 9.2732 2002 16.5507
7 2004 14.4337 2001 9.2511 1997 16.5246
8 2001 14.3934 2004 9.2264 2001 16.5023
9 1997 14.3615 1999 9.1937 2007 16.4779
10 1995 14.2981 1995 9.1607 1995 16.4072
11 1999 14.2947 1997 9.0688 2000 16.4070
12 1990 14.2700 1990 9.0573 1990 16.4065
13 2000 14.2630 2000 9.0195 1991 16.3922
14 1991 14.2241 1988 8.9297 1987 16.3884
15 1988 14.1888 1991 8.9179 1999 16.3873
16 1987 14.1870 1981 8.9005 1996 16.3728
17 1994 14.1815 1994 8.8721 1994 16.3509
18 1983 14.1716 1983 8.8697 1988 16.3413
19 1996 14.1586 1987 8.7850 1983 16.3379
20 1981 14.1293 1989 8.7434 1993 16.3204
21 1993 14.1227 1938 8.7422 1992 16.3083
22 1944 14.1134 1944 8.7365 1980 16.3017
23 1989 14.1087 1993 8.7311 1944 16.3008
24 1992 14.0894 1996 8.7185 1989 16.2974
25 1980 14.0887 1973 8.6893 1979 16.2815
Top Twenty-Five Annual Global Mean Temperatures through 2007 (°C) Rank Year Combined Year Land Year Ocean

WG2 specific scenarios
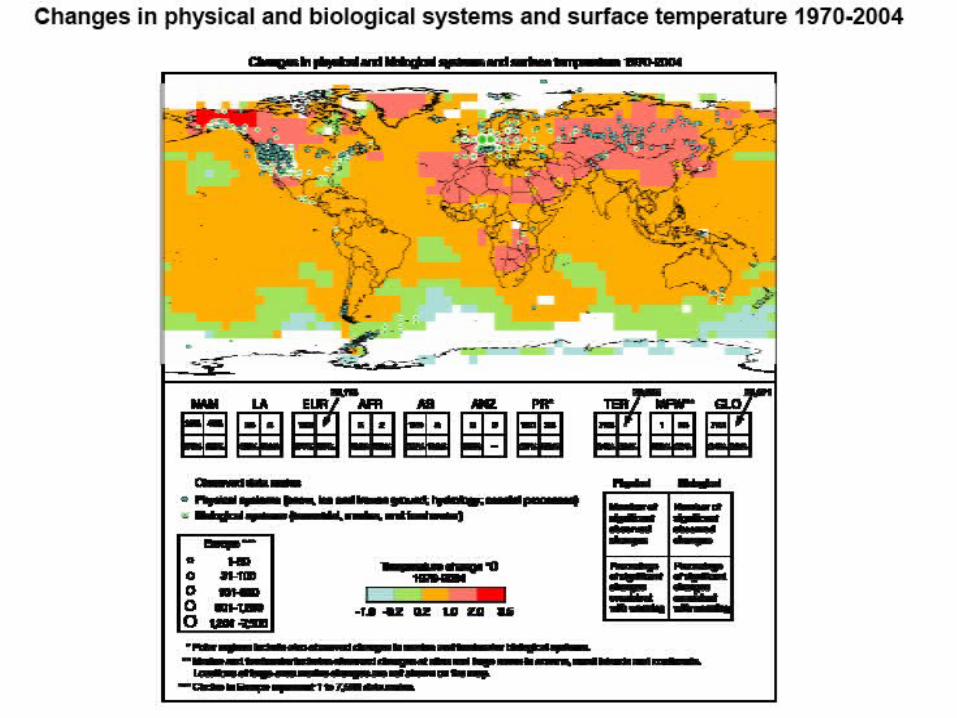
Observational evidence from all continents and most oceans shows that many natural systems are being affected by regional climate changes, particularly temperature increases.
A global assessment of data since 1970 has shown it is likely that anthropogenic warming has had a discernible influence on many physical and biological systems.
Other effects of regional climate changes on natural and human environments are emerging, although many are difficult to discern due to adaptation and non-climatic drivers.
More specific information is now available across a wide range of systems and sectors concerning the nature of future impacts, including for some fields not covered in previous assessments.

WG2 specific scenarios
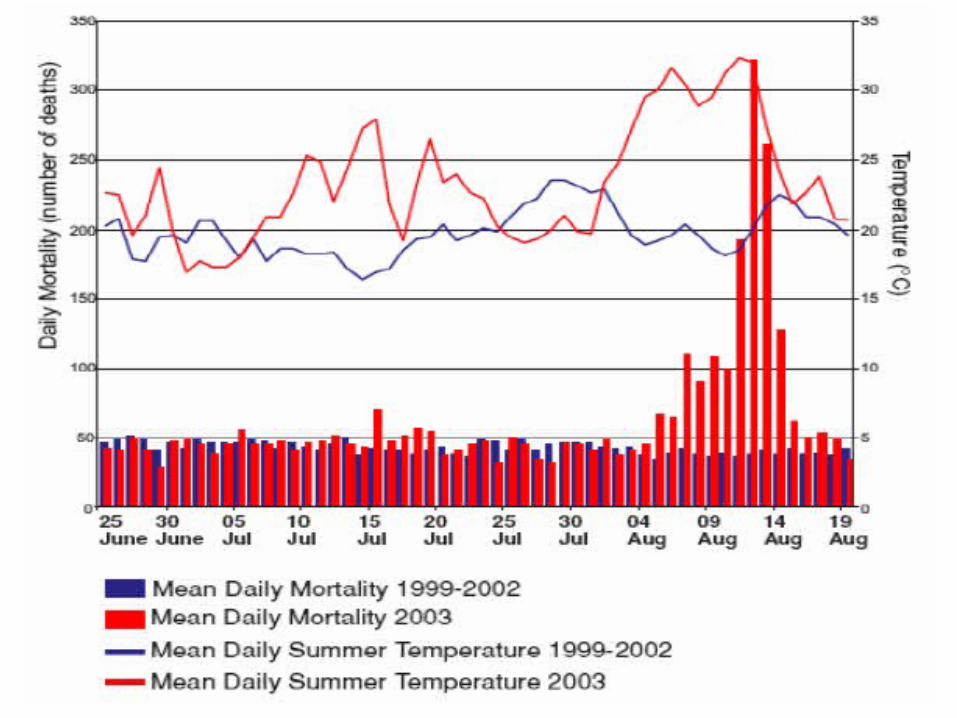
Projected climate change-related exposures are likely to affect the health status of millions of people, particularly those with low adaptive capacity, through: increases in malnutrition and consequent disorders, with implications for child growth and development; increased deaths, disease and injury due to heat waves, floods, storms, fires and droughts; the increased burden of diarrheal disease; the increased frequency of cardio-respiratory diseases due to higher concentrations of ground level ozone related to climate change; and, the altered spatial distribution of some infectious disease vectors.

Coastal flooding

Africa (selected): Agricultural production, including access to food, in many African countries and regions is projected to be severely compromised by climate variability and change. The area suitable for agriculture, the length of growing seasons and yield potential, particularly along the margins of semi-arid and arid areas, are expected to decrease. This would further adversely affect food security and exacerbate malnutrition in the continent. In some countries, yields from rain-fed agriculture could
be reduced by up to 50% by 2020.
Asia (selected):Glacier melt in the Himalayas is projected to increase flooding, and rock avalanches from destabilised slopes, and to affect water resources within the next two to three decades. This will be followed by decreased river flows as the glaciers recede.
Australia and New Zealand (selected):Significant loss of biodiversity is projected to occur by 2020 in some ecologically-rich sites including the Great Barrier Reef and Queensland Wet Tropics. Other sites at risk include Kakadu wetlands, southwest Australia, sub-Antarctic islands and the alpine areas of both countries.

Europe (selected):Nearly all European regions are anticipated to be negatively affected by some future impacts of climate change and these will pose challenges to many economic sectors. Climate change is expected to magnify regional differences in Europe’s natural resources and assets. Negative impacts will include increased risk of inland flash floods, and more frequent coastal flooding and increased erosion (due to storminess and sea-level rise). The great majority of organisms and ecosystems will have difficulties adapting to climate change. Mountainous areas will face glacier retreat, reduced snow cover and winter tourism, and extensive species losses (in some areas up to 60% under high emission scenarios by 2080).

Latin America (selected):By mid-century, increases in temperature and associated decreases in soil water are projected to lead to gradual replacement of tropical forest by savanna in eastern Amazonia. Semi-arid vegetation will tend to be replaced by arid-land vegetation. There is a risk of significant biodiversity loss through species extinction in many areas of tropical Latin America.Polar Regions (selected): In the Polar Regions, the main projected biophysical effects are reductions in thickness and extent of glaciers and ice sheets, and changes in natural ecosystems with detrimental effects on many organisms including migratory birds, mammals and higher predators. In the Arctic, additional impacts include reductions in the extent of sea ice and permafrost, increased coastal erosion, and an increase in the depth of permafrost seasonal thawing.Small islands (selected): Sea-level rise is expected to exacerbate inundation, storm surge, erosion and other coastal hazards, thus threatening vital infrastructure, settlements and facilities that support the livelihood of island communities.
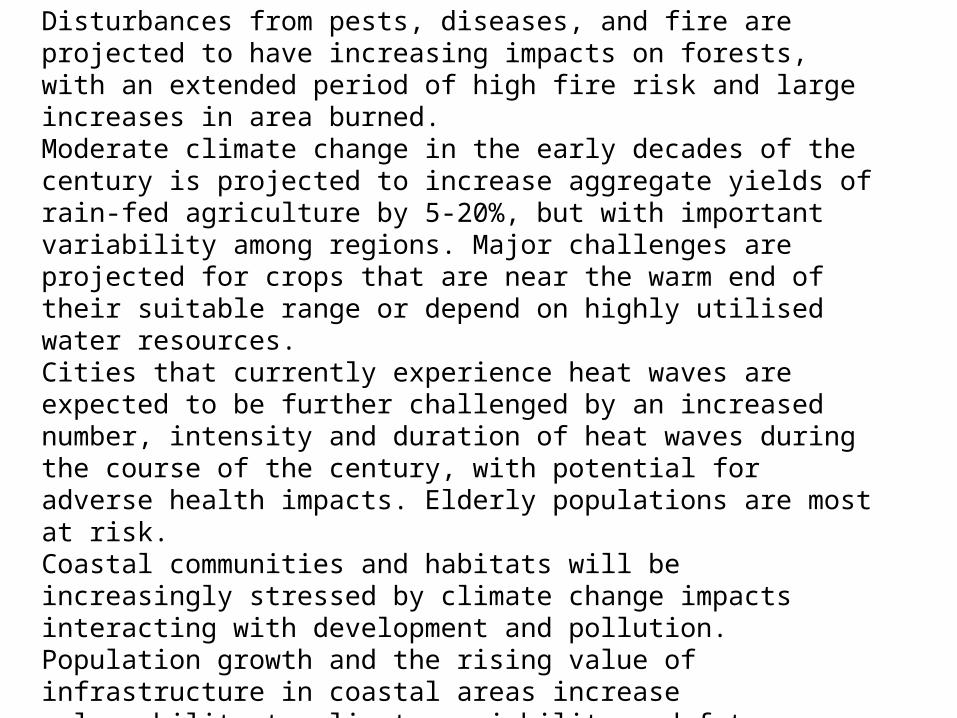
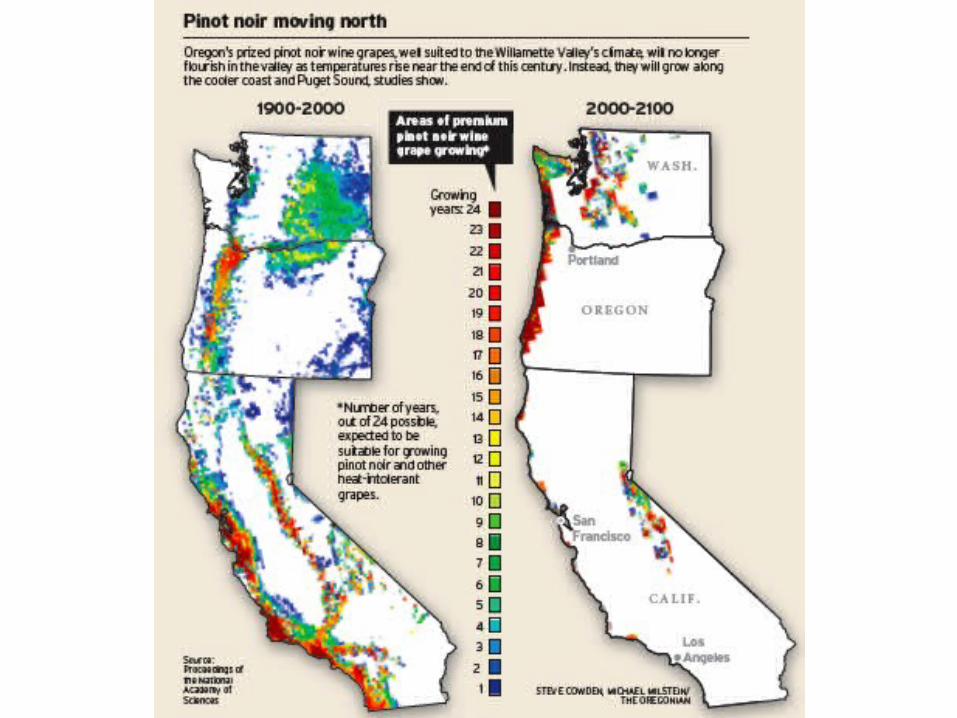
North America (all):Warming in western mountains is projected to cause decreased snowpack, more winter flooding, and reduced summer flows, exacerbating competition for over-allocated water resources. Disturbances from pests, diseases, and fire are projected to have increasing impacts on forests, with an extended period of high fire risk and large increases in area burned.Moderate climate change in the early decades of the century is projected to increase aggregate yields of rain-fed agriculture by 5-20%, but with important variability among regions. Major challenges are projected for crops that are near the warm end of their suitable range or depend on highly utilised water resources.Cities that currently experience heat waves are expected to be further challenged by an increased number, intensity and duration of heat waves during the course of the century, with potential for adverse health impacts. Elderly populations are most at risk.Coastal communities and habitats will be increasingly stressed by climate change impacts interacting with development and pollution. Population growth and the rising value of infrastructure in coastal areas increase vulnerability to climate variability and future climate change, with losses projected to increase if the intensity of tropical storms increases. Current adaptation is uneven and readiness for increased exposure is low.


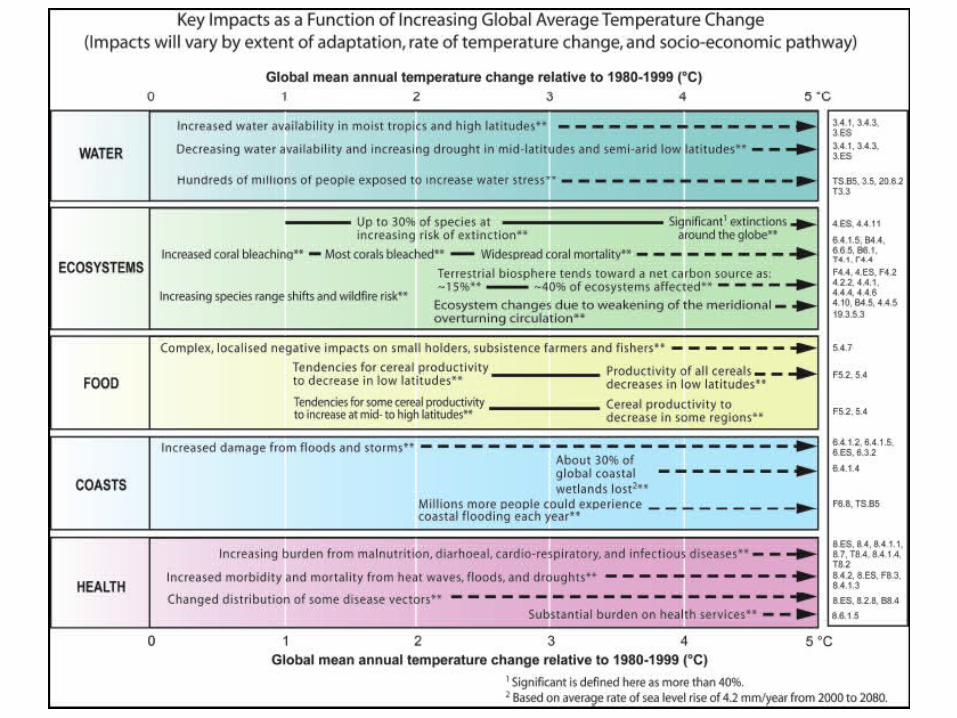
Magnitudes of impact can now be estimated more systematically for a range of possible increases in global average temperature.
Impacts due to altered frequencies and intensities of extreme weather, climate, and sea level events are very likely to change.
Some large-scale climate events have the potential to cause very large impacts, especially after the 21st century.
Impacts of climate change will vary regionally but, aggregated and discounted to the present, they are very likely to impose net annual costs which will increase over time as global temperatures increase.
Some adaptation is occurring now, to observed and projected future climate change, but on a limited basis.
Adaptation will be necessary to address impacts resulting from the warming which is already unavoidable due to past emissions.
A wide array of adaptation options is available, but more extensive adaptation than is currently occurring is required to reduce vulnerability to future climate change. There are barriers, limits and costs, but these are not fully understood.
Vulnerability to climate change can be exacerbated by the presence of other stresses.
Future vulnerability depends not only on climate change but also on development pathway.
Sustainable development can reduce vulnerability to climate change, and climate change could impede nations’ abilities to achieve sustainable development pathways.
Many impacts can be avoided, reduced or delayed by mitigation.
A portfolio of adaptation and mitigation measures can diminish the risks associated with climate change.


WG3
Global greenhouse gas (GHG) emissions have grown since pre-industrial times, with an increase of 70% between 1970 and 2004. (high agreement, much evidence
With current climate change mitigation policies and related sustainable development practices, global GHG emissions will continue to grow over the next few decades. (highT agreement, much evidence).
Baseline emissions scenarios published since SRES are comparable in range to those presented in the IPCC Special Report on Emission Scenarios (SRES) (25- 135 GtCO2-eq/yr in 2100). (high agreement, much evidence)

WG3
Both bottom-up and top-down studies indicate that there is substantial economic potential for the mitigation of global GHG emissions over the coming decades, that could offset the projected growth of global emissions or reduce emissions below current levels. (high agreement, much evidence)
Changes in lifestyle and behaviour patterns can contribute to climate change mitigation across all sectors. Management practices can also have a positive role. (high agreement, medium evidence)
While studies use different methodologies, in all analyzed world regions near-term health co-benefits from reduced air pollution as a result of actions to reduce GHG emissions can be substantial and may offset a substantial fraction of mitigation costs. (high agreement, much evidence)
WG3
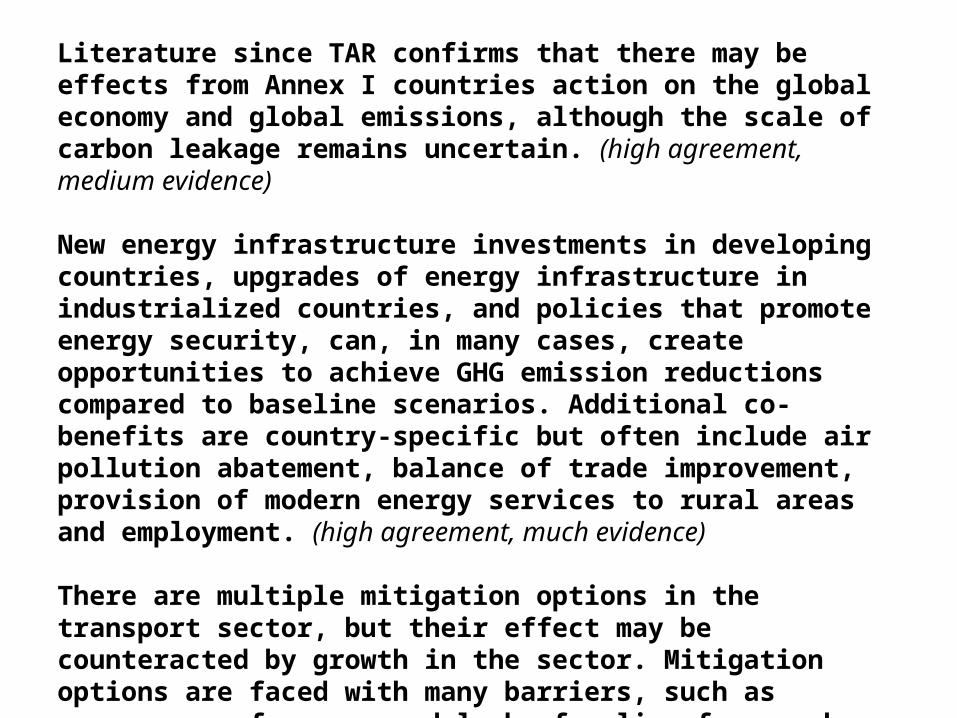
Literature since TAR confirms that there may be effects from Annex I countries action on the global economy and global emissions, although the scale of carbon leakage remains uncertain. (high agreement, medium evidence)
New energy infrastructure investments in developing countries, upgrades of energy infrastructure in industrialized countries, and policies that promote energy security, can, in many cases, create opportunities to achieve GHG emission reductions compared to baseline scenarios. Additional co-benefits are country-specific but often include air pollution abatement, balance of trade improvement, provision of modern energy services to rural areas and employment. (high agreement, much evidence)
There are multiple mitigation options in the transport sector, but their effect may be counteracted by growth in the sector. Mitigation options are faced with many barriers, such as consumer preferences and lack of policy frameworks. (medium agreement, medium evidence).

WG3
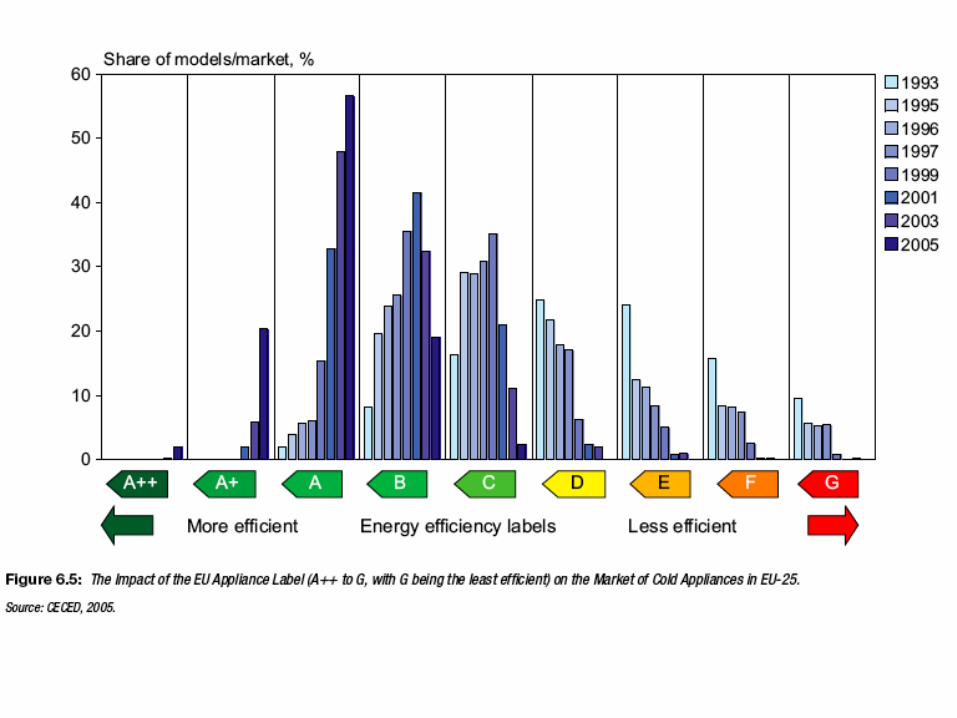
Energy efficiency options for new and existing buildings could considerably reduce CO2 emissions with net economic benefit. Many barriers exist against tapping this potential, but there are also large co-benefits. (high agreement, much evidence).
The economic potential in the industrial sector is predominantly located in energy intensive industries. Full use of available mitigation options is not being made in either industrialized or developing nations. (high agreement, much evidence)
Agricultural practices collectively can make a significant contribution at low cost to increasing soil carbon sinks, to GHG emission reductions, and by contributing biomass feedstocks for energy use. (medium agreement, medium evidence)

WG3
Forest-related mitigation activities can considerably reduce emissions from sources and increase CO2 removals by sinks at low costs, and can be designed to create synergies with adaptation and sustainable development. (high agreement, much evidence)
Post-consumer waste is a small contributor to global GHG emissions (< 5%), but the waste sector can positively contribute to GHG mitigation at low cost and promote sustainable development. (high agreement, much evidence)
Geo-engineering options, such as ocean fertilization to remove CO2 directly from the atmosphere, or blocking sunlight by bringing material into the upper atmosphere, remain largely speculative and unproven, and with the risk of unknown side-effects. Reliable cost estimates for these options have not been published. (medium
agreement, limited evidence)


WG3
In order to stabilize the concentration of GHGs in the atmosphere, emissions would need to peak and decline thereafter. The lower the stabilization level, the more quickly this peak and decline would need to occur. Mitigation efforts over the next two to three decades will have a large impact on opportunities to achieve lower stabilization levels. (high agreement, much evidence)
The range of stabilization levels assessed can be achieved by deployment of a portfolio of technologies that are currently available and those that are expected to be commercialised in coming decades. This assumes that appropriate and effective incentives are in place for development, acquisition, deployment and diffusion of technologies and for addressing related barriers. (high agreement, much evidence)
WG3
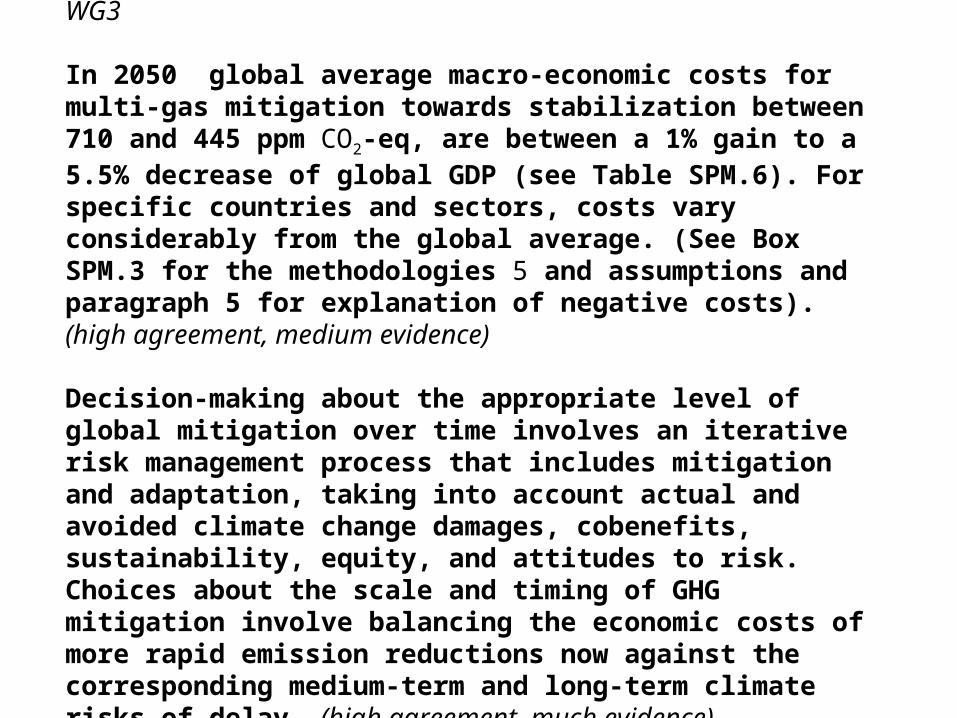
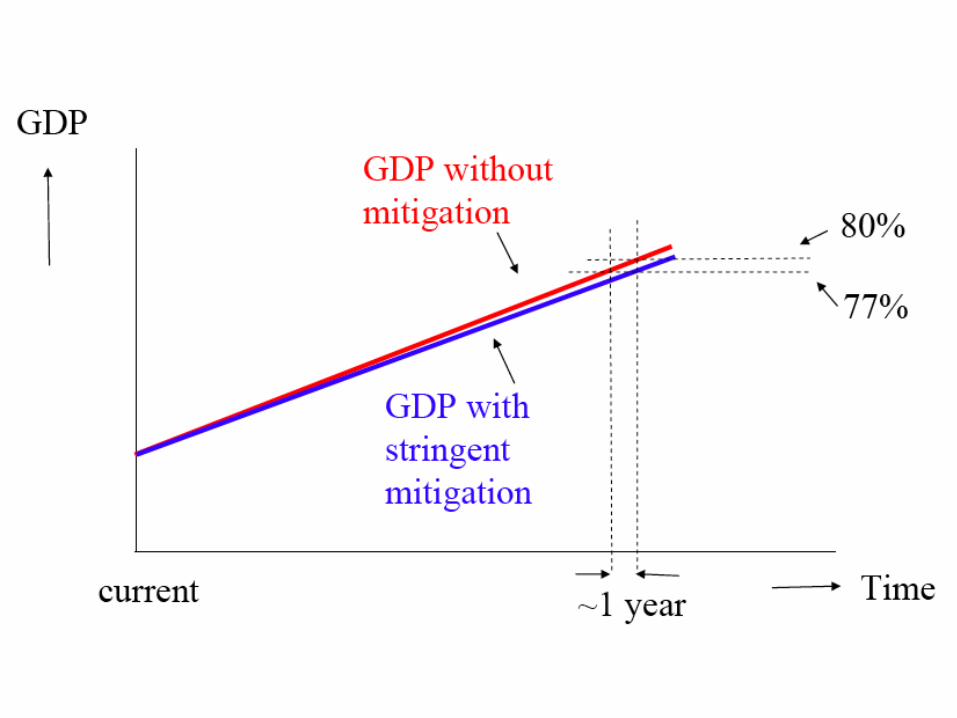
In 2050 global average macro-economic costs for multi-gas mitigation towards stabilization between 710 and 445 ppm CO2-eq, are between a 1% gain to a 5.5% decrease of global GDP (see Table SPM.6). For specific countries and sectors, costs vary considerably from the global average. (See Box SPM.3 for the methodologies 5 and assumptions and paragraph 5 for explanation of negative costs). (high agreement, medium evidence)
Decision-making about the appropriate level of global mitigation over time involves an iterative risk management process that includes mitigation and adaptation, taking into account actual and avoided climate change damages, cobenefits, sustainability, equity, and attitudes to risk. Choices about the scale and timing of GHG mitigation involve balancing the economic costs of more rapid emission reductions now against the corresponding medium-term and long-term climate risks of delay. (high agreement, much evidence)
WG3
A wide variety of national policies and instruments are available to governments to create the incentives for mitigation action. Their applicability depends on national circumstances and an understanding of their interactions, but experience from implementation in various countries and sectors shows there are advantages and disadvantages for any given instrument. (high agreement, much evidence)
Policies that provide a real or implicit price of carbon could create incentives for producers and consumers to significantly invest in low-GHG products, technologies and processes. Such policies could include economic instruments, government funding and regulation. (high agreement, much evidence)
Government support through financial contributions, tax credits, standard setting and market creation is important for effective technology development, innovation 5 and deployment. Transfer of technology to developing countries depends on enabling conditions and financing. (high agreement, much evidence)

WG3
Notable achievements of the UNFCCC and its Kyoto protocol are the establishment of a global response to the climate problem, stimulation of an array of national policies, the creation of an international carbon market and the establishment of new institutional mechanisms that may provide the foundation for future mitigation efforts. (high agreement, much evidence)
The literature identifies many options for achieving reductions of global GHG emissions at the international level through cooperation. It also suggests that successful agreements are environmentally effective, cost-effective, incorporate distributional considerations and equity, and are institutionally feasible. (high agreement, much evidence)
Making development more sustainable by changing development paths can make a major contribution to climate change mitigation, but implementation may require resources to overcome multiple barriers. There is a growing understanding of the possibilities to choose and implement mitigation options in several sectors to realize synergies and avoid conflicts with other dimensions of sustainable development. (high agreement, much evidence)
WG3
There are still relevant gaps in currently available knowledge regarding some aspects of mitigation of climate change, especially in developing countries. Additional research addressing those gaps would further reduce uncertainties and thus facilitate decision-making related to mitigation of climate change.

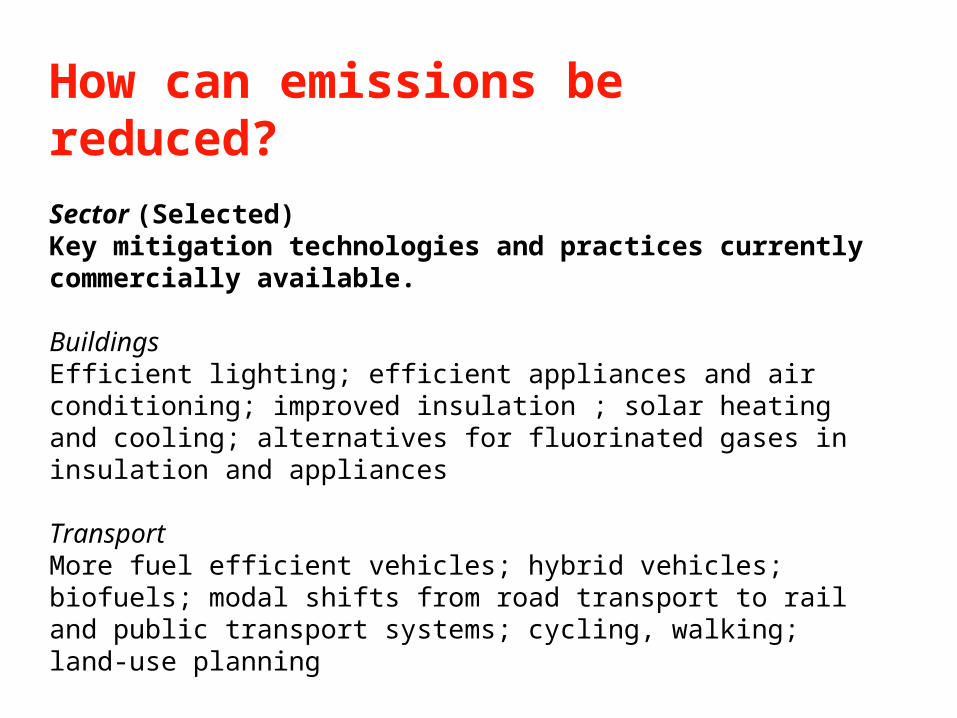
How can emissions be reduced?Sector (Selected) Key mitigation technologies and practices currently commercially available.
BuildingsEfficient lighting; efficient appliances and air conditioning; improved insulation ; solar heating and cooling; alternatives for fluorinated gases in insulation and appliances
TransportMore fuel efficient vehicles; hybrid vehicles; biofuels; modal shifts from road transport to rail and public transport systems; cycling, walking; land-use planning
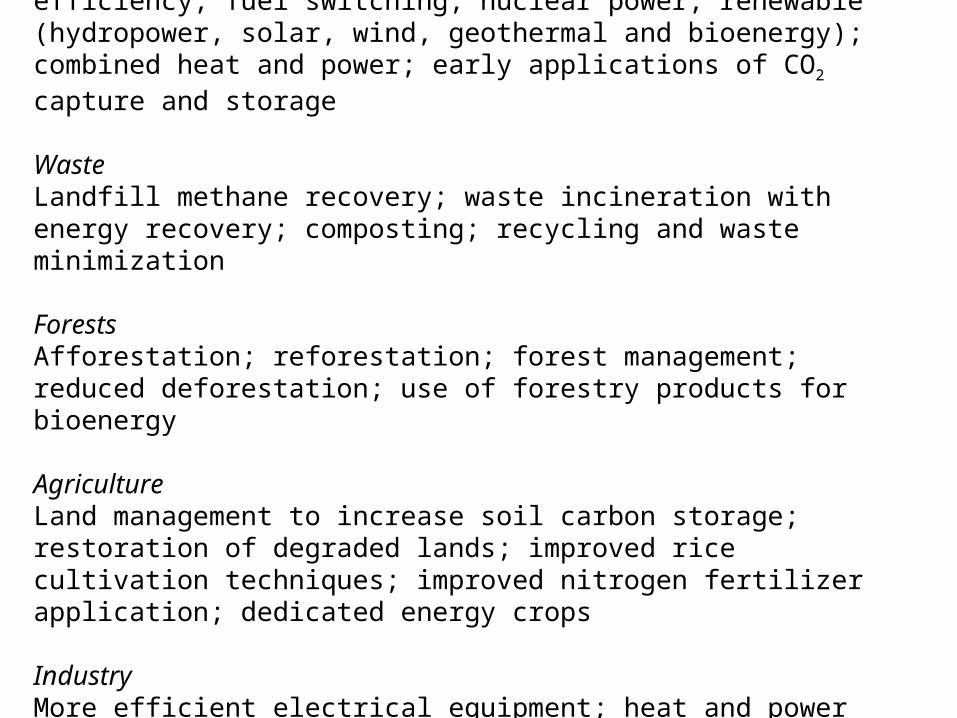
Energy Supplyefficiency; fuel switching; nuclear power; renewable (hydropower, solar, wind, geothermal and bioenergy); combined heat and power; early applications of CO2 capture and storage
WasteLandfill methane recovery; waste incineration with energy recovery; composting; recycling and waste minimization
ForestsAfforestation; reforestation; forest management; reduced deforestation; use of forestry products for bioenergy
AgricultureLand management to increase soil carbon storage; restoration of degraded lands; improved rice cultivation techniques; improved nitrogen fertilizer application; dedicated energy crops
IndustryMore efficient electrical equipment; heat and power recovery; material recycling; control of non-CO2 gas emissions


Wave energy possibilities.

The importance of a “price of carbon”
Policies that provide a real or implicit price of carbon could create incentives for producers and consumers to significantly invest in low-GHG products, technologies and processes.
Such policies could include economic instruments, government funding and regulation
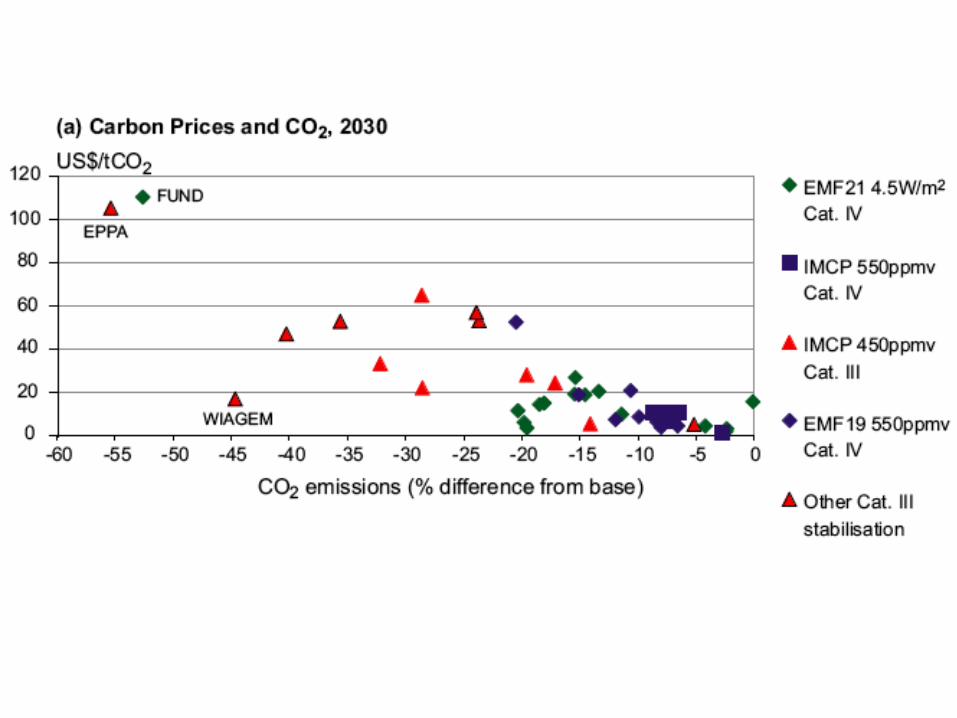
For stabilisation at around 550 ppm CO2eq carbon prices should reach 20-80 US$/tCO2eq by 2030 (5-65 if “induced technological change” happens) At these carbon prices large shifts of investments into low carbon technologies can be expected

The importance of technology policies Deployment of low-GHG emission technologies and RD&D would be required for achieving stabilization targets and cost reduction.
The lower the stabilization levels, especially those of 550 ppm CO2-eq or lower, the greater the need for more efficient RD&D efforts and investment in new technologies during the next few decades.
Government support through financial contributions, tax credits, standard setting and market creation is important for effective technology development, innovation and deployment.
Government funding for most energy research programs has been flat or declining for nearly two decades (even after the UNFCCC came into force); now about half of 1980 level.


“We are at war with the Earth and as in a blitzkrieg, events proceed faster than we can respond.” —James Lovelock, originator of the Gaia idea (that the planet behaves as an organism), in a lecture to the Royal Society, 30 October 2007

Change is coming ...
Can we ameliorate or adapt?
In his Royal Society speech, Lovelock also said: “We are not merely a disease; we are through our intelligence and communication the planetary equivalent of a nervous system. We should be the heart and mind of the Earth, not its malady.”
It’s up to us.