![[TM]Integrated Experience Program](https://static.fdocuments.us/doc/165x107/58ee20b21a28ab50088b4627/tmintegrated-experience-program.jpg)
The Integrated User Experience Evaluation Model: A ...
206
University of Central Florida University of Central Florida STARS STARS Electronic Theses and Dissertations, 2004-2019 2009 The Integrated User Experience Evaluation Model: A Systematic The Integrated User Experience Evaluation Model: A Systematic Approach To Integrating User Experience Data Sources Approach To Integrating User Experience Data Sources Roberto Champney University of Central Florida Part of the Operations Research, Systems Engineering and Industrial Engineering Commons Find similar works at: https://stars.library.ucf.edu/etd University of Central Florida Libraries http://library.ucf.edu This Doctoral Dissertation (Open Access) is brought to you for free and open access by STARS. It has been accepted for inclusion in Electronic Theses and Dissertations, 2004-2019 by an authorized administrator of STARS. For more information, please contact [email protected]. STARS Citation STARS Citation Champney, Roberto, "The Integrated User Experience Evaluation Model: A Systematic Approach To Integrating User Experience Data Sources" (2009). Electronic Theses and Dissertations, 2004-2019. 6130. https://stars.library.ucf.edu/etd/6130
Transcript of The Integrated User Experience Evaluation Model: A ...
University of Central Florida University of Central Florida
STARS STARS
Electronic Theses and Dissertations, 2004-2019
2009
The Integrated User Experience Evaluation Model: A Systematic The Integrated User Experience Evaluation Model: A Systematic
Approach To Integrating User Experience Data Sources Approach To Integrating User Experience Data Sources
Roberto Champney University of Central Florida
Part of the Operations Research, Systems Engineering and Industrial Engineering Commons
Find similar works at: https://stars.library.ucf.edu/etd
University of Central Florida Libraries http://library.ucf.edu
This Doctoral Dissertation (Open Access) is brought to you for free and open access by STARS. It has been accepted
for inclusion in Electronic Theses and Dissertations, 2004-2019 by an authorized administrator of STARS. For more
information, please contact [email protected].
STARS Citation STARS Citation Champney, Roberto, "The Integrated User Experience Evaluation Model: A Systematic Approach To Integrating User Experience Data Sources" (2009). Electronic Theses and Dissertations, 2004-2019. 6130. https://stars.library.ucf.edu/etd/6130
THE INTEGRATED USER EXPERIENCE EVALUATION MODEL: A SYSTEMATIC APPROACH TO INTEGRATING USER EXPERIENCE DATA
SOURCES
by
ROBERTO CHAMPNEY B.S. University of Central Florida, 2001 M.S. University of Central Florida, 2003
A dissertation submitted in partial fulfillment of the requirements for the degree of Doctor of Philosophy
in the Department of Industrial Engineering and Management Systems in the College of Engineering and Computer Science
at the University of Central Florida Orlando, Florida
Summer Term 2009
Major Professor: Linda C. Malone

© 2009 Roberto K. Champney
ii
ABSTRACT
Evaluating the user experience (UX) associated with product interaction is a challenge for
current human-systems developers. This is largely due to a lack of theoretical guidance
for directing how best to assess the UX and a paucity of tools to support such evaluation.
This dissertation provided a framework and tools for guiding and supporting evaluation
of the user experience.
This doctoral research involved reviewing the literature on UX, using this knowledge to
build first build a theoretical model of the UX construct and later develop a theoretical
model to for the evaluation of UX in order to aid evaluators – the integrated User
eXperience EValuation (iUXEV), and empirically validating select components of the
model through three case studies.
The developed evaluation model was subjected to a three phase validation process that
included the development and application of different components of the model
separately. The first case study focused on developing a tool and method for assessing the
affective component of UX which resulted in lessons learned for the integration of the
tool and method into the iUXEV model. The second case study focused on integrating
several tools that target different components of UX and resulted in a better
understanding of how the data could be utilized as well as identify the need for an
integration method to bring the data together. The third case study focused on the
application of the results of an usability evaluation on an organizational setting which
resulted in the identification of challenges and needs faced by practitioners. Taken
together, this body of research, from the theoretically-driven iUXEV model to the newly
developed emotional assessment tool, extends the user experience / usability body of
iii

knowledge and state-of-practice for interaction design practitioners who are challenged
with holistic user experience evaluations, thereby advancing the state-of-the-art in UX
design and evaluation.
iv

ACKNOWLEDGMENTS
Thanks be to God and Jesus Christ who made this possible.
Thank you Isa for everything, for motivating me and helping me find the time to finish
this work, for your patience and your ability for always allowing me to see a the road
ahead amidst the many challenges in life; I love you.
I would like to express my appreciation and gratitude for all the support I’ve received in
completing this work. From my parents who encouraged me to finish what I’ve started
and for ensuring that I received the preparation necessary for such an endeavor. From my
professors and advisors who gave me all their support and taught me so many things,
especially Dr. Kay Stanney and Dr. Linda Malone who believed in me, gave me an
incredible amount of support in providing me with every opportunity to complete this
chapter of my life; I am eternally grateful. From the staff at the IEMS department,
especially Joy Tatlonghari who helped me navigate the many bureaucratic steps along the
way.
v
TABLE OF CONTENTS LIST OF FIGURES ......................................................................................................... viii LIST OF TABLES ............................................................................................................. ix LIST OF ACRONYMS/ABBREVIATIONS .................................................................... xi CHAPTER ONE: GENERAL INTRODUCTION ............................................................ 1 CHAPTER TWO: THE INTEGRATED USER EXPERIENCE EVALUATION MODEL* ............................................................................................................................ 4
Abstract ........................................................................................................................... 4 Introduction ..................................................................................................................... 4 From Usability to User Experience ................................................................................. 4 Theoretical Foundation for an Integrated User Experience Evaluation Approach ......... 6
UX Approaches ........................................................................................................... 7 The Integrated User Experience Evaluation Model ...................................................... 20
Background & Context ............................................................................................. 20 The iUXEV Model .................................................................................................... 24
CHAPTER THREE: MULTIPLE CRITERIA DECISION ANALYSIS IN PRACTICE, A USABILITY ENGINEERING CASE STUDY* .......................................................... 52
Abstract ......................................................................................................................... 52 Introduction ................................................................................................................... 52 Background ................................................................................................................... 52 Method .......................................................................................................................... 54 Findings......................................................................................................................... 56 Lessons Learned ............................................................................................................ 56
CHAPTER FOUR: USING EMOTIONS IN USABILITY ............................................. 58 Abstract ......................................................................................................................... 58 Introduction ................................................................................................................... 58 Review .......................................................................................................................... 59
Defining Affect ......................................................................................................... 59 Measuring Emotions ................................................................................................. 61 Emotional Profiling (EP) .......................................................................................... 64
Findings......................................................................................................................... 69 Discussion ..................................................................................................................... 71
CHAPTER FIVE: AUGMENTING THE TRADITIONAL APPROACH TO USABILITY: THREE TOOLS TO BRING THE USER BACK INTO THE PROCESS 73
Abstract ......................................................................................................................... 73 Introduction ................................................................................................................... 73 Integrating Additional Metrics ...................................................................................... 74
Focus Groups ............................................................................................................ 75 Emotional Profiling ................................................................................................... 79 Kano Analysis ........................................................................................................... 82
Conclusions ................................................................................................................... 86 CHAPTER SIX: GENERAL DISCUSSION................................................................... 87 CHAPTER SEVEN: CONCLUSIONS AND FUTURE WORK .................................... 91 APPENDIX A: SOCIALLY CENTERED DESIGN ....................................................... 93
vi
Introduction ................................................................................................................... 94 The Socially Centered Design Process ......................................................................... 96 Socially Centered Design Variables ............................................................................. 97 Socially Centered Design Techniques ........................................................................ 101 Group Studies.............................................................................................................. 102 Ethnographic Studies .................................................................................................. 102 Cooperative Work Studies .......................................................................................... 103 Anthropomorphic Studies ........................................................................................... 103 Applying the Socially Centered Design Approach ..................................................... 103 Analysis and Dissemination of Information ............................................................... 104 Conclusions ................................................................................................................. 105 References ................................................................................................................... 106
APPENDIX B : DETAILED REVIEW OF UX APPROACHES ................................. 108 APPENDIX C: USABILITY EVALUATION BACKGROUND .................................. 122
User Analysis Methods ............................................................................................... 124 Design Tools ............................................................................................................... 125 Usability Evaluation Methods ..................................................................................... 127
APPENDIX D: iUXEV METHODS .............................................................................. 133 User Analysis .............................................................................................................. 134
User Analysis Overview ......................................................................................... 134 User Experience (UX) Evaluation ............................................................................. 138
Ergonomic Quality (EQ) ......................................................................................... 138 Hedonic Quality ...................................................................................................... 140 User Experience Evaluation Overview ................................................................... 142
APPENDIX E: EMOTION AND DESIGN ................................................................... 145 Introduction ................................................................................................................. 146 Emotions ..................................................................................................................... 147
Affective Phenomena .............................................................................................. 147 Schools of thought .................................................................................................. 150 Distinguishing Emotions ......................................................................................... 155
Artifacts and Emotions ............................................................................................... 157 The Multidimensional Experience Emotional Experience of Artifacts .................. 157 Mixed Emotions ...................................................................................................... 160 Implications............................................................................................................. 161 Taken together, the above literature suggests: ........................................................ 161
Current State-of-the-Art in Emotion and Design ........................................................ 163 Ethnographic Approaches ....................................................................................... 163 Heuristics ................................................................................................................ 165 Emotional Assessment ............................................................................................ 166 Affective Computing .............................................................................................. 172 Semantic Differentials ............................................................................................ 172 Attitude / Sentiment Approaches ............................................................................ 173
LIST OF REFERENCES ................................................................................................ 179
vii
LIST OF FIGURES Figure 1. UX Model (Construct and Sub-Constructs) ..................................................... 19
Figure 2. Targeted use of iUXEV in the Iterative Design Process . ................................. 21
Figure 3. The Usability Engineering Lifecycle (adapted from Stanney, Mollaghasemi, &
Reeves, 2000) .................................................................................................................... 23
Figure 4. Integration of methods for Usability Evaluation (iUXEV) ............................... 24
Figure 5. iUXEV integration component. ......................................................................... 32
Figure 6. onceptual Representation of Information Axiom ............................................. 44
Figure 7. Example of Application of Fuzzy Information Axiom to iUXEV Scales. ........ 45
Figure 8. Example of emoticon animation frames. ........................................................... 66
Figure 9. Example of Graphical Emotional Profile (GEP). .............................................. 69
Figure 10. Example of Graphical Emotional Profile (GEP). ............................................ 81
Figure 11. Illustration of SPOT Taxonomy. ................................................................... 120
Figure 12. Focus Group Format. ..................................................................................... 137
Figure 13. Multiple Components of Emotions. .............................................................. 166
Figure 14. Components of the Sentiment Construct...........……………………………184
viii

LIST OF TABLES Table 1. Summary and Categorization of UX Constructs ................................................ 12
Table 2. Link of iUXEV Model and UX Constructs. ....................................................... 25
Table 3. Advantages and Disadvantages of Integration and Prioritization Methods. ....... 35
Table 4. Prioritization Scheme for Ergonomic Data. ........................................................ 39
Table 5. Scale for Evaluating Impact on Goal. ................................................................. 41
Table 6. Example of Integration Component Table in iUXEV. ....................................... 42
Table 7. Example of Integration Component Table in iUXEV Showing Target and
Observed Values. .............................................................................................................. 46
Table 8. Example of Integration Component Table in iUXEV Showing Information
Content for Each UX Issue. .............................................................................................. 47
Table 9. Information Calculation Heuristics. .................................................................... 49
Table 10. Example of Integration Component Table in iUXEV Showing Application of
Heuristics for Each UX Issue. ........................................................................................... 50
Table 11. Issue Total Score Computation. ........................................................................ 51
Table 12. Emotion Questionnaire: List of Emotions. ....................................................... 65
Table 13. Example of Emotional Appraisal Profile (EAP). .............................................. 69
Table 14. Focus Group Method and Outcome. ................................................................. 79
Table 15. Example of Emotional Appraisal Profile (EAP). .............................................. 81
Table 16. Emotional Profiling Method and Outcome. ...................................................... 82
Table 17. Kano Analysis Method and Outcome. .............................................................. 86
Table 18. Socially Centered Design Variables. ................................................................ 99
Table 19. Uses of Ethnomethodology within Design. .................................................... 105
ix

Table 20. Matrix of Affective States. .............................................................................. 114
Table 21. Advantages and disadvantages UEMs.. .......................................................... 129
Table 22. Matrix of Affective States. .............................................................................. 149
Table 23. Basic Emotions Lists. ..................................................................................... 151
Table 24. Ethnographic Tasks......................................................................................... 164
Table 25. Taxonomy of Affective Educational Objectives. ........................................... 177
x
xi
LIST OF ACRONYMS/ABBREVIATIONS
AHP Analytic Hierarchy Process EAP Emotion Appraisal Profile EP Emotional Profiling EQ Ergonomic Quality FACS Facial Action Coding System GA Grid Analysis GEP Graphical Emotional Profile HCI Human-Computer Interaction HE Hedonic Quality ISO International Organization for Standards IUSR Industry Usability Reporting iUXEV Integrated User Experience Evaluation Model MCDA Multiple Criteria Decision Analysis MR Market Research NIST National Institute of Standards and Technology PrEMO Product Emotion Measurement Instrument ROI Return on Investment SWOT Strengths, Weaknesses, Opportunities and Threats SPOT Sensory Perceptual Task Taxonomy STA Sensory Task Analysis UA User Analysis UAM User Analysis Method UE Usability Evaluation UELC Usability Engineering Lifecycle UEM Usability Evaluation Method UPA Usability Professionals Association US United States UX User Experience
CHAPTER ONE: GENERAL INTRODUCTION
The objective of usability engineering and specifically the usability evaluation
process is to inform the design of interactive products so that they can seamlessly
integrate into the everyday lives of their intended users. As such it is important that all
components key to the user be considered when carrying out evaluations. Initially
usability evaluation focused on ease-of-use. Today other key characteristics, including
non-performance oriented criteria such as affect and the accompanying service of a
product, are consider integral to the evaluation. Within the user-centered design
community evaluation has thus expanded to a focus on characterizing the more holistic
“user experience” (Hassenzahl & Tractinsky, 2006), or to suggest a more inclusive
process “total user experience” (Petre, Minocha, & Roberts, 2007).
Yet, when undertaking such multi-criteria evaluations it can be difficult to
determine how to integrate the results such that they best inform design. The National
Institute of Standards and Technology (NIST) recognizes this as described in their
Industry USability Reporting (IUSR) Formative Project (2008) where they state “…With
many more techniques available for this work (formative usability), there is a need for
clear definitions for practitioners to use in planning and conducting our work, especially
in communicating/reporting the work (and its value) to our colleagues and customers”
(n.p.).
The current effort seeks to resolve this shortcoming by proposing an approach,
entitled the Integrated User Experience Evaluation (iUXEV) Model, for integrating a
diversified set of user-centered criteria that includes both objective and subjective user
experience results obtained through both non-empirical and empirically-based, as well as
1
task performance and non-performance based data. Once validated, the application of this
approach should assist practitioners in the contextual prioritization of user experience
shortcomings that are aligned with a product’s user experience and an organization’s
goals.
This dissertation uses the alternative multiple-paper format. Chapter 1, this
chapter, provides an overall introduction to the doctoral research. Chapter 2 presents the
first paper entitled The Integrated User Experience Evaluation (iUXEV) Model, which
will be submitted for review to Theoretical Issues in Ergonomics Science. This chapter
presents the background and theoretical underpinnings of this research and illustrates the
development of the iUXEV model for evaluation of the holistic user experience. Chapter
2 also includes a subjective validation of the model via Subject Matter Expert (SME)
evaluations. The outcome provided by application of the iUXEV model includes the
discovery of task related design shortcomings, non-task related emotional user reports,
contextual and affect-related user evaluation criteria findings, and a categorization of
functionality needs. Further, this chapter also presents the background and theoretical
underpinnings of a decision support approach for prioritization of the findings obtained
through the evaluation part of the iUXEV model. Chapter 3 - Multiple Criteria Decision
Analysis in Practice: A Usability Engineering Case Study, which is to be submitted to
Usability Professionals' Association 2010 International Conference, presents a case study
of the application of this decision support approach applied in a real-world situation. The
model presented in Chapter 2 contains a particularly novel approach for using emotional
data from user experiences; this process and a tool for eliciting and using emotional data
are further described in Chapter 4, entitled Using Emotions in Usability, which was
2

presented at the 51st Annual Meeting of the Human Factors and Ergonomics Society in
October 2007. Chapter 4 presents the theoretical background on the selection and use of
emotions for design as well as lessons learned from the development and empirical
application of a novel emotion assessment tool for design. Chapter 5, entitled Augmenting
the Traditional Approach to Usability: Three Tools to Bring the User Back Into the
Process, was also presented at the 51st Annual Meeting of the Human Factors and
Ergonomics Society in October 2007. Chapter 5 presents the lessons leaned as a result of
the application of these tools in a pilot study using consumer products with real users.
Chapter 6 provides a general discussion based on the four papers combined. Chapter 7
concludes the dissertation and provides directions for future research.
Taken together, this body of research, from the theoretically-driven model to the
newly developed emotional assessment tool, extends the usability body of knowledge and
state-of-practice for usability practitioners who are challenged with holistic user
experience evaluations, thereby advancing the state-of-the-art in user experience design
and evaluation.
3
CHAPTER TWO: THE INTEGRATED USER EXPERIENCE EVALUATION MODEL*
Abstract Discusses the theoretical composition of the user experience construct (UX) and presents
a method and process for utilizing multiple techniques for its evaluation and prioritization
of the resulting data.
Introduction
Until recently the design and evaluation of interactive products and services have
been the focus of the usability movement (e.g., ease of use) in order to ensure that said
offerings were usable by its intended users. Yet more recently a more holistic approach
has emerged which suggests that usability is not enough and that additional
considerations are of equal or greater importance in terms of user centered design. This
chapter intends to present the theoretical foundations that make up the UX construct by
exploring the different sub-constructs that fall under the umbrella of UX and then
propose an evaluation model which targets these components, and a strategy for
aggregating the results of such an evaluation.
From Usability to User Experience
Usability has been defined as the ease with which a product can be used to
perform its designated task by its intended users at a specified criterion (Lin, Choong, &
* Paper to be submitted to be Theoretical Issues in Ergonomics Science.
4
Salvendy, 1997). In operational terms usability engineering is the engineering of designs
for ease-of-use and is concerned with the effectiveness, efficiency, and satisfaction with
which targeted users can utilize a particular product (ISO 9241-11, 1998).
Early usability methods, which stressed the “Ergonomic Quality” of the user
experience (Hassenzahl, Platz, et al., 2000), focused on developing a quantitative yet
practical approach to the design of products, with the inclusion of iterative design and
evaluation. Such approaches sought to create functional and usable products to improve
productivity (Bevan, 1995; Dumas, 2006). These performance-oriented efforts have
generally focused on quantifying product performance in terms of effectiveness (i.e., the
extent to which tasks can be achieved), intuitiveness (i.e., how learnable and memorable
a system is), and subjective perception (i.e., how comfortable and satisfied users are with
a system) (Eberts, 1994; Nielsen, 1993; Shneiderman, 1992; Wixon & Wilson, 1997).
Yet usability engineering should aim to encompass the whole user experience, not
just performance-oriented aspects of user interaction. Early on Gould (1988) suggested
that usability should encompass a wide breath of components in addition to user
performance (e.g., system reliability, reading material, outreach program, installation and
packaging, advertising, support-group users, etc.). Slowly the field has taken notice and
hence recently there has been a push by some practitioners to label themselves as
“experience designers,” “user experience designers or researchers,” or “experience
modelers” (c.f. Forlizzi & Batterby, 2004), and the interest in “User Experience” (UX)
research has grown (Hassenzahl & Tractinsky, 2006). This movement was first observed
with the widening of usability approaches to include contextual design (Beyer &
Holtzblatt, 1998), and the incorporation of various contextual sources to achieve a more
5
inclusive design (e.g., social design, Bevan & Macleod, 1994; Stanney & Champney,
2006 – see Appendix A). This has progressed in recent years to include emotional and
personal components of the user experience, (e.g., the “hedonic quality” of a product,
Hassenzahl, Platz, et al., 2000). In the past, while the emotional response to a product
was considered, it was oversimplified in terms of product satisfaction. Yet, “satisfaction”
is a limited construct, which often constitutes little more than an inquiry into whether a
product works or not or whether or not it causes frustration to the user (Wright &
McCarthy, 2003). This focus on the elimination or mitigation of user frustration is a key
difference between early usability efforts and the more contemporary UX movement, the
latter of which is concerned not only with the sources of negative experiences, but also in
targeting the fostering of positive ones through beautiful and engaging interactions
(Overbeeke, Djajadinigrat, Hummels, Wensveen, & Frens, 2003).
Theoretical Foundation for an Integrated User Experience Evaluation Approach
In order to prescribe an evaluation approach for UX, it is first necessary to define
what constitutes a user experience. This section presents an overview of the different sub-
constructs under the UX construct.
While usability engineering is evolving from the traditional focus on
effectiveness, efficiency, and satisfaction (ISO 9241-11, 1998), into the more holistic UX
concept (Bevan, 1995; Dumas, 2006; Hassenzahl, Platz, et al., 2000; Hassenzahl &
Tractinsky, 2006), the concepts and ideas presented by the UX movement are not entirely
new. For instance, early usability efforts identified implications concerning the “soft” or
6
“personal” concept of the UX (c.f. Gutsche, 1975) or the notion that “hard” constructs
such as efficiency and learnability are not enough to encompass the complete user
experience (c.f. Gould, 1988; Whiteside & Wixon, 1987; Carroll & Thomas, 1988).
Some have even identified the importance of constructs outside the scope of the
interactive product itself, such as the experience of the purchase, service, etc. (c.f. Gould,
1988; Gutsche, 1975; Petre, Minocha & Roberts, 2006). Indeed, UX is concerned with all
functional and non-functional user needs and concerns (goals, interests, attitudes, etc.)
that form and influence the experience with an artifact.
UX Approaches
A wide array of work has been done under different disciplines and under different
focuses which could all be placed under the UX umbrella; and several attempts have been
made to organize such works in order to understand the different perspectives taken to
explore the non-performance, “soft,” or “personal” aspects of UX. Some of these
overarching works are discussed next.
McNamara and Kirakowski (2006) for instance suggest that the aspects of a
product that need to be evaluated in order to attend to the UX needs are: functionality,
usability, and experience. They suggest that a product must be evaluated for its
functionality (i.e., What does the product do?) by attending to such criteria as the
usefulness of features, maintainability, reliability, etc. They also suggest that a product
should be assessed for its usability in an evaluation of a product’s use (i.e., Can the
product support the intended goals of the user? etc.), as well as for its UX, which focuses
on the evaluation of the subjective experience as lived by the user (i.e., evaluation of
feelings, meanings, preferences, intentions, concerns, goals, etc.). Hassenzahl and
7
Tractinsky (2006) suggest that in addition to usability and functionality, as suggested by
McNamara and Kirakowski (2006), a broader review and breakup of the experiential is
possible; they summarize a review of recent literature into three main UX themes: 1)
beyond the instrumental (i.e., beyond functional and task-oriented evaluation), 2) emotion
and affect, and 3) experiential. Each of these has a particular and compelling view of the
non-performance oriented aspects of UX. The first theme (beyond the instrumental)
characterizes the intrinsic properties of artifacts (e.g., aesthetic, meaning, etc.; c.f. Liu,
2003) and the concern for human needs (e.g., physiological, safety, love/belonging,
esteem, self-actualization; c.f. Maslow, 1943) or concerns (e.g., family, creativity,
finances, etc.; c.f. Chulef, Read, & Walsh, 2001). The second theme is concerned with
the emotional component of interactions, and the mediating effect of affect in the
experience of interactive products; it encompasses the various works under the “Design
and Emotion” umbrella (c.f. Norman, 2004; Desmet, 2002; Overbeeke & Hekkert, 1999).
The third theme takes a more conceptual and semantic view of user experiences as it
considers the “situatedness” and “temporality” of the UX in order to explore and
understand the nature of this experience (e.g., eating a hot dog at home vs. a hot dog at
the ball park).
A similar breakup in themes was proposed by Forlizzi and Batterbee (2004), who
explored the concept of UX by distinguishing between: product-centered, user-centered,
and interaction-centered theoretical models or approaches. Product-centered approaches
are prescriptive in nature and attempt to guide the design of the UX by prescribing design
elements in the product itself. User-centered approaches, on the other hand, focus on
understanding users and as such may employ an array of approaches from different
8
disciplines (c.f. Sanders & Dandavate, 1999). Interaction-centered approaches focus on
exploring the role of the artifact in the experience, and defining the UX as an individual
entity.
Another contrasting view is that taken through human information processing
perspective. For instance, Westerink (2008) views the UX as being defined along
different processes under which it may be experienced by a user: perception, cognition,
memory, emotion, behavior, and physiology. A similar view is that of the approach taken
by Carroll, Milham, Stanney, and Becker (under review), who use a Sensory Task
Analysis (STA) process to go beyond the user analysis traditional of UX design, and
Champney, Carroll, Milham and Hale (2008), who through a Sensory Perceptual
Objective Task (SPOT) taxonomy systematized the STA process. Such processes are
used to determine how individuals gather information as well as act upon this information
in a contextual environment and to translate this information into interaction
requirements for the design of interactive systems (e.g., a training simulator). These
views consider that experiences may possess a focus that is predominantly relevant to a
particular human information process or set of processes, and thus emotion alone is not
sufficient to explore the UX beyond its functional aspects.
Another approach is the hierarchical perspective (Jordan, 2000; Khalid &
Helander, 2004;Kano, 1984). This perspective suggests that the types of features or
characteristics of an experience are not all equal, and that some have more relative
importance in a hierarchical order (e.g., once the first level needs have been satisfied,
secondary level needs become relevant or important, etc.).
9

The above cited works provide an overview into the various forms and
perspectives in which UX has been explored. The review points out many of the different
sub-constructs that fall under a UX and thus must be considered when assessing it.
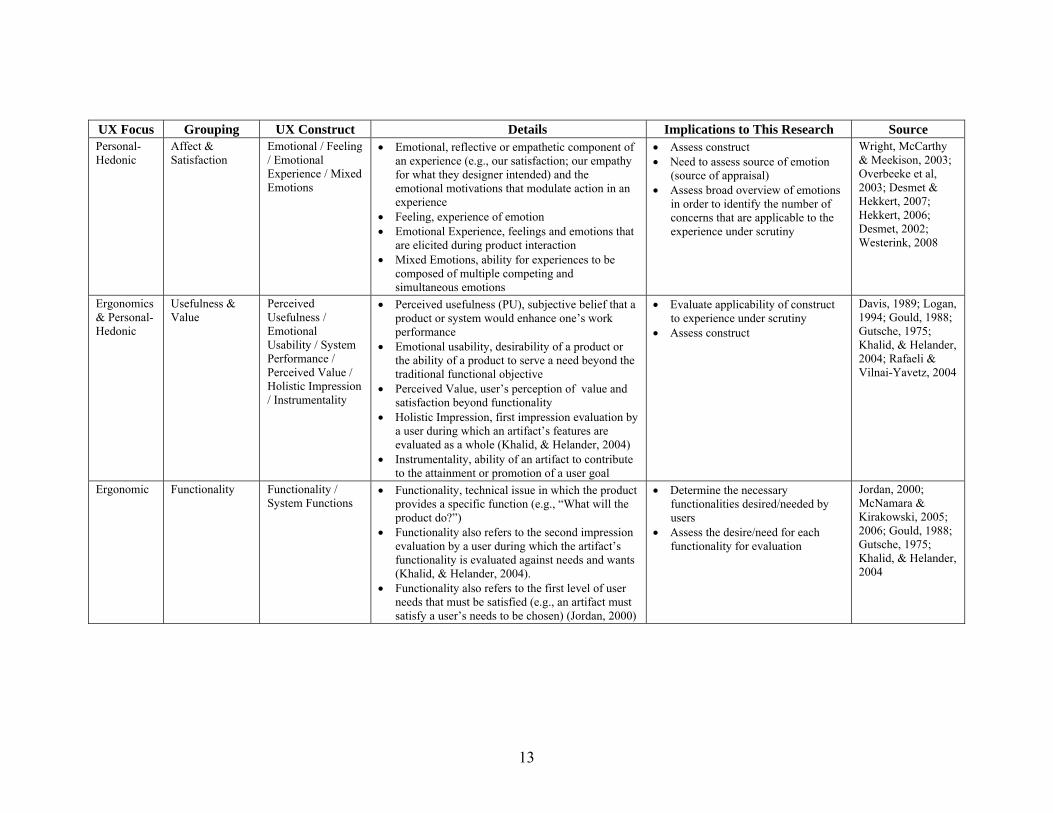
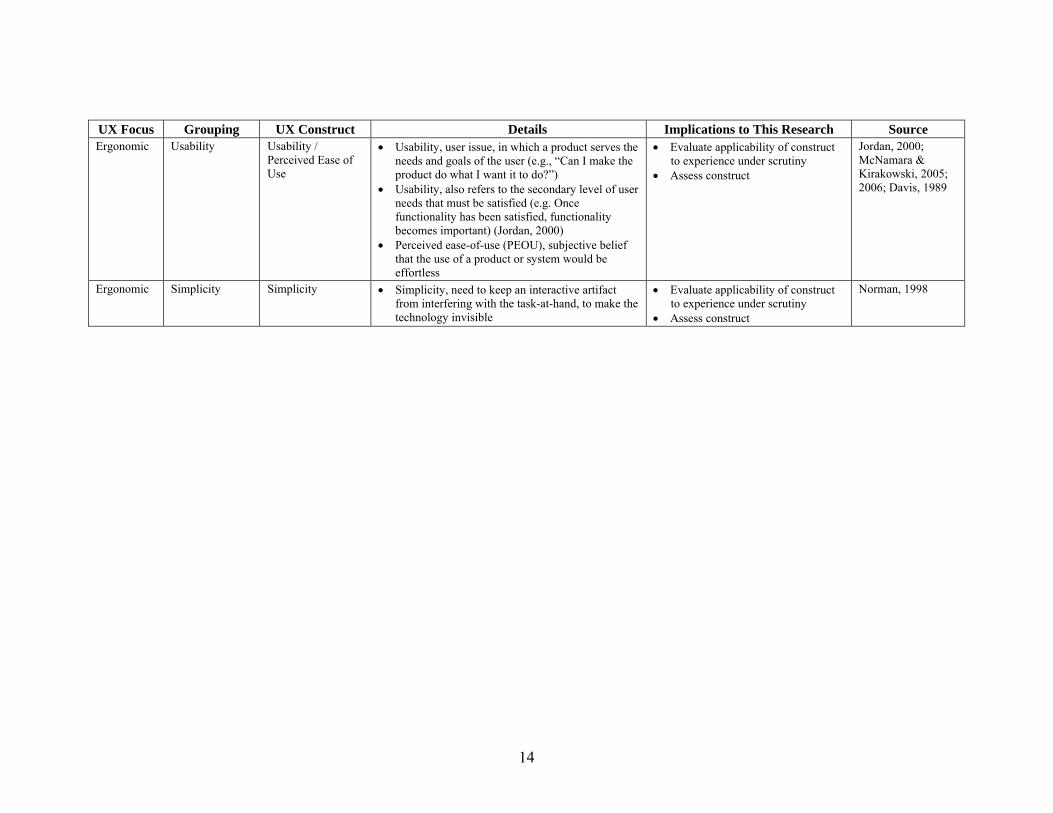
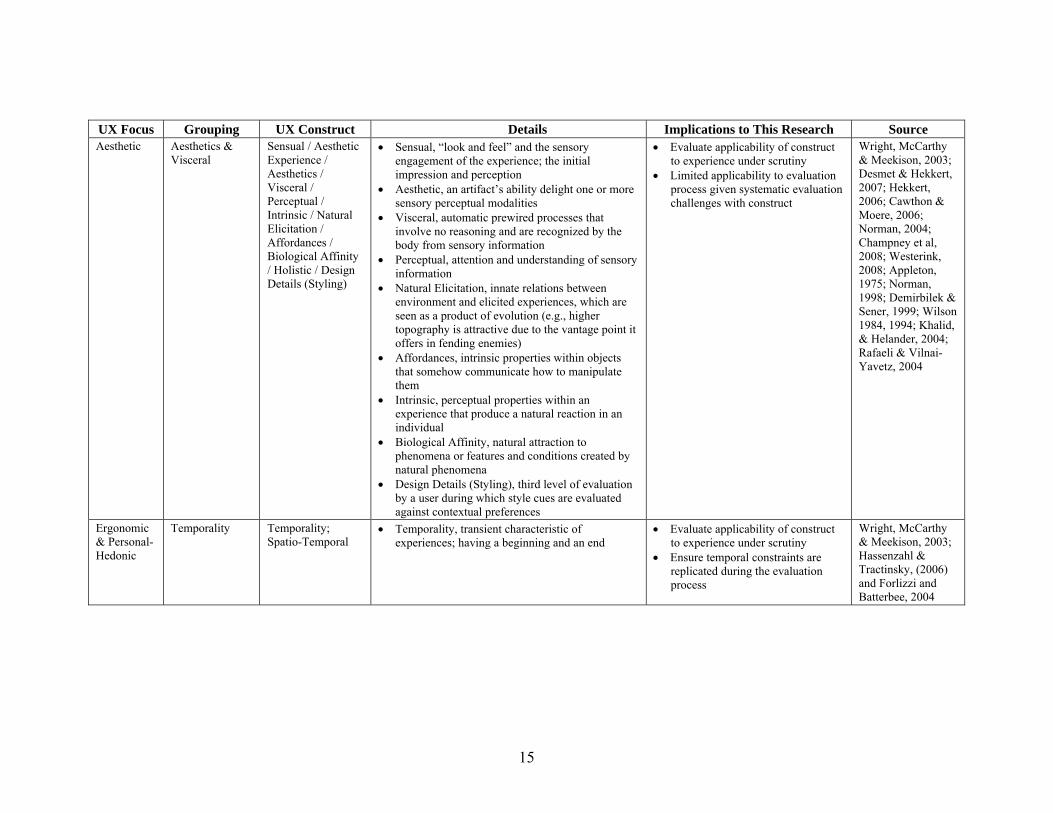
Table 1 summarizes this overview and includes other additional works, such as those
focusing on the traditional view of usability, in order to present a more comprehensive
review of UX and its constructs (for a more in-depth review of each of these general
perspectives and a discussion of their benefits and challenges please see Appendix B).
From this table it is evident that there is great variation in the naming conventions used to
define the different UX constructs, yet there appears to be considerable overlap as to
what the various constructs encompass. This table was formatted to reflect this
redundancy by offering a listing of the different construct names used in the literature and
their accompanying definitions. It is interesting to note that while some earlier works
proposed two general constructs for UX (task-based and satisfaction), more recent
discussions seem to have found three general constructs. Across the different perspectives
reviewed and constructs proposed by the different researchers, three broad components of
experiences seem to appear (c.f. Cupchik, 1999; Normal 2004; Rafaeli & Vilnai-Yavetz,
2004; Forlizzi and Batterbee, 2004; Desmet & Hekkert, 2007; Wright & McCarthy, 2003;
McNamara & Kirakowski, 2005; 2006)
1. Ergonomic: A task-based theme generally focused on the usefulness,
usability and functionality of an artifact. These functional-utility based
perspectives consider all task- and goal- oriented aspects of user
interaction, including such things as the quality of use and
functionalities of the artifact, including their usefulness and value.
10
11
2. Personal / Hedonic: A personal or symbolic theme generally focused on
the meaning behind an artifact or experience, or the pleasure derived
from an experience. These self-referent subjective-based perspectives
consider all non-task based aspects such as the symbolic, and emotional
(pleasurable or not) aspects of the user experience.
3. Aesthetics: An aesthetic theme generally focuses on the impressionistic,
sensual or styling cues of an artifact. This component of UX is intended
to represent the intrinsic properties of an experience and can’t be
explained by task or personal interests but rather by deeper engrained
intrinsic desires within humans.
In general, all of the identified constructs in Table 1 can be categorized under
these three primary components, ergonomic (i.e., functional-utility) based, personal-
hedonic (i.e., self-referent subjective) based, or aesthetic (i.e., intrinsic) based.
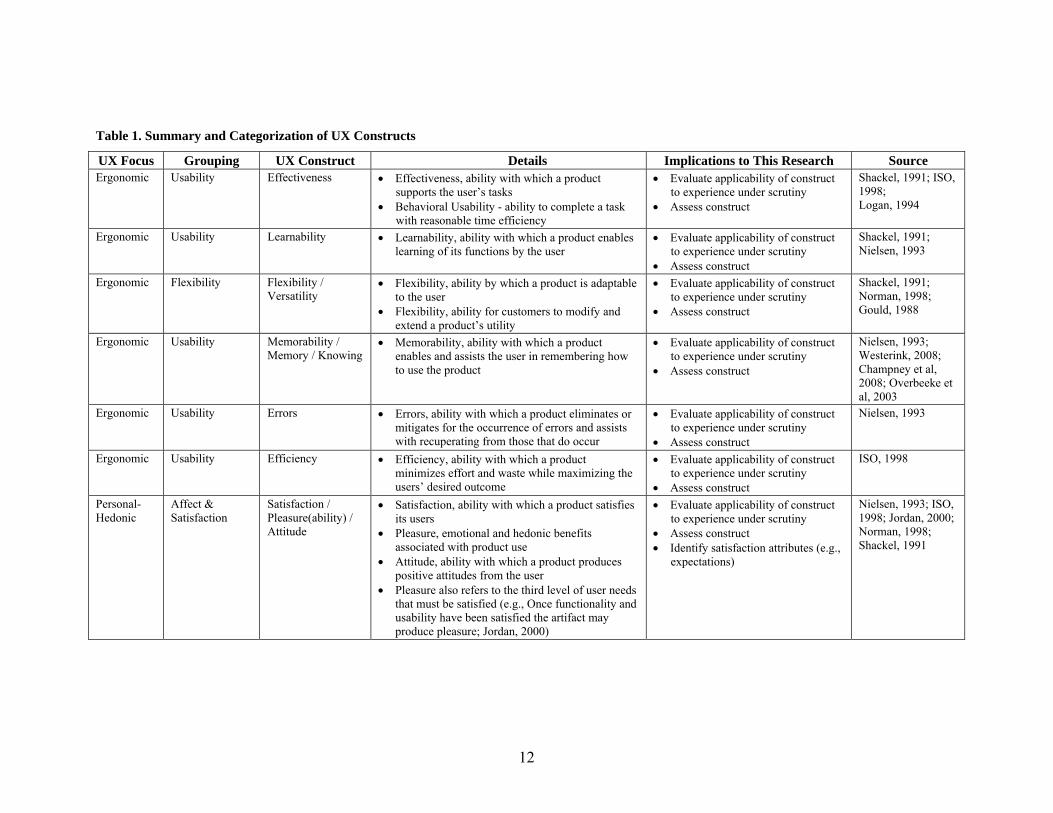
Table 1. Summary and Categorization of UX Constructs
UX Focus Grouping UX Construct Details Implications to This Research Source Ergonomic Usability Effectiveness • Effectiveness, ability with which a product
supports the user’s tasks • Behavioral Usability - ability to complete a task
with reasonable time efficiency
• Evaluate applicability of construct to experience under scrutiny
• Assess construct
Shackel, 1991; ISO, 1998; Logan, 1994
Ergonomic Usability Learnability • Learnability, ability with which a product enables learning of its functions by the user
• Evaluate applicability of construct to experience under scrutiny
• Assess construct
Shackel, 1991; Nielsen, 1993
Ergonomic Flexibility Flexibility / Versatility
• Flexibility, ability by which a product is adaptable to the user
• Flexibility, ability for customers to modify and extend a product’s utility
• Evaluate applicability of construct to experience under scrutiny
• Assess construct
Shackel, 1991; Norman, 1998; Gould, 1988
Ergonomic Usability Memorability / Memory / Knowing
• Memorability, ability with which a product enables and assists the user in remembering how to use the product
• Evaluate applicability of construct to experience under scrutiny
• Assess construct
Nielsen, 1993; Westerink, 2008; Champney et al, 2008; Overbeeke et al, 2003
Ergonomic Usability Errors • Errors, ability with which a product eliminates or mitigates for the occurrence of errors and assists with recuperating from those that do occur
• Evaluate applicability of construct to experience under scrutiny
• Assess construct
Nielsen, 1993
Ergonomic Usability Efficiency • Efficiency, ability with which a product minimizes effort and waste while maximizing the users’ desired outcome
• Evaluate applicability of construct to experience under scrutiny
• Assess construct
ISO, 1998
Personal-Hedonic
Affect & Satisfaction
Satisfaction / Pleasure(ability) / Attitude
• Satisfaction, ability with which a product satisfies its users
• Pleasure, emotional and hedonic benefits associated with product use
• Attitude, ability with which a product produces positive attitudes from the user
• Pleasure also refers to the third level of user needs that must be satisfied (e.g., Once functionality and usability have been satisfied the artifact may produce pleasure; Jordan, 2000)
• Evaluate applicability of construct to experience under scrutiny
• Assess construct • Identify satisfaction attributes (e.g.,
expectations)
Nielsen, 1993; ISO, 1998; Jordan, 2000; Norman, 1998; Shackel, 1991
12
UX Focus Grouping UX Construct Source Details Implications to This Research Personal-Hedonic
Affect & Satisfaction
Emotional / Feeling / Emotional Experience / Mixed Emotions
• Emotional, reflective or empathetic component of an experience (e.g., our satisfaction; our empathy for what they designer intended) and the emotional motivations that modulate action in an experience
• Feeling, experience of emotion • Emotional Experience, feelings and emotions that
are elicited during product interaction • Mixed Emotions, ability for experiences to be
composed of multiple competing and simultaneous emotions
• Assess construct • Need to assess source of emotion
(source of appraisal) • Assess broad overview of emotions
in order to identify the number of concerns that are applicable to the experience under scrutiny
Wright, McCarthy & Meekison, 2003; Overbeeke et al, 2003; Desmet & Hekkert, 2007; Hekkert, 2006; Desmet, 2002; Westerink, 2008
Ergonomics & Personal-Hedonic
Usefulness & Value
Perceived Usefulness / Emotional Usability / System Performance / Perceived Value / Holistic Impression / Instrumentality
• Perceived usefulness (PU), subjective belief that a product or system would enhance one’s work performance
• Emotional usability, desirability of a product or the ability of a product to serve a need beyond the traditional functional objective
• Perceived Value, user’s perception of value and satisfaction beyond functionality
• Holistic Impression, first impression evaluation by a user during which an artifact’s features are evaluated as a whole (Khalid, & Helander, 2004)
• Instrumentality, ability of an artifact to contribute to the attainment or promotion of a user goal
• Evaluate applicability of construct to experience under scrutiny
• Assess construct
Davis, 1989; Logan, 1994; Gould, 1988; Gutsche, 1975; Khalid, & Helander, 2004; Rafaeli & Vilnai-Yavetz, 2004
Ergonomic Functionality Functionality / System Functions
• Functionality, technical issue in which the product provides a specific function (e.g., “What will the product do?”)
• Functionality also refers to the second impression evaluation by a user during which the artifact’s functionality is evaluated against needs and wants (Khalid, & Helander, 2004).
• Functionality also refers to the first level of user needs that must be satisfied (e.g., an artifact must satisfy a user’s needs to be chosen) (Jordan, 2000)
• Determine the necessary functionalities desired/needed by users
• Assess the desire/need for each functionality for evaluation
Jordan, 2000; McNamara & Kirakowski, 2005; 2006; Gould, 1988; Gutsche, 1975; Khalid, & Helander, 2004
13
UX Focus Grouping UX Construct Source Details Implications to This Research Ergonomic Usability Usability /
Perceived Ease of Use
• Usability, user issue, in which a product serves the needs and goals of the user (e.g., “Can I make the product do what I want it to do?”)
• Usability, also refers to the secondary level of user needs that must be satisfied (e.g. Once functionality has been satisfied, functionality becomes important) (Jordan, 2000)
• Perceived ease-of-use (PEOU), subjective belief that the use of a product or system would be effortless
• Evaluate applicability of construct to experience under scrutiny
• Assess construct
Jordan, 2000; McNamara & Kirakowski, 2005; 2006; Davis, 1989
Ergonomic Simplicity Simplicity • Simplicity, need to keep an interactive artifact from interfering with the task-at-hand, to make the technology invisible
• Evaluate applicability of construct to experience under scrutiny
• Assess construct
Norman, 1998
14
UX Focus Grouping UX Construct Source Details Implications to This Research Aesthetic Aesthetics &
Visceral Sensual / Aesthetic Experience / Aesthetics / Visceral / Perceptual / Intrinsic / Natural Elicitation / Affordances / Biological Affinity / Holistic / Design Details (Styling)
• Sensual, “look and feel” and the sensory engagement of the experience; the initial impression and perception
• Aesthetic, an artifact’s ability delight one or more sensory perceptual modalities
• Visceral, automatic prewired processes that involve no reasoning and are recognized by the body from sensory information
• Perceptual, attention and understanding of sensory information
• Natural Elicitation, innate relations between environment and elicited experiences, which are seen as a product of evolution (e.g., higher topography is attractive due to the vantage point it offers in fending enemies)
• Affordances, intrinsic properties within objects that somehow communicate how to manipulate them
• Intrinsic, perceptual properties within an experience that produce a natural reaction in an individual
• Biological Affinity, natural attraction to phenomena or features and conditions created by natural phenomena
• Design Details (Styling), third level of evaluation by a user during which style cues are evaluated against contextual preferences
• Evaluate applicability of construct to experience under scrutiny
• Limited applicability to evaluation process given systematic evaluation challenges with construct
Wright, McCarthy & Meekison, 2003; Desmet & Hekkert, 2007; Hekkert, 2006; Cawthon & Moere, 2006; Norman, 2004; Champney et al, 2008; Westerink, 2008; Appleton, 1975; Norman, 1998; Demirbilek & Sener, 1999; Wilson 1984, 1994; Khalid, & Helander, 2004; Rafaeli & Vilnai-Yavetz, 2004
Ergonomic & Personal-Hedonic
Temporality Temporality; Spatio-Temporal
• Temporality, transient characteristic of experiences; having a beginning and an end
• Evaluate applicability of construct to experience under scrutiny
• Ensure temporal constraints are replicated during the evaluation process
Wright, McCarthy & Meekison, 2003; Hassenzahl & Tractinsky, (2006) and Forlizzi and Batterbee, 2004
15

UX Focus Grouping UX Construct Source Details Implications to This Research Ergonomic Task Doing / Task /
Behavior / Behavioral Emotions
• The perceptual-motor • Behavioral, goal and temporal oriented aspects of
an experience (e.g. the use or consumption of an article), which are grounded in the subconscious component that controls routine behavior
• Ensure the tasks and task characteristics are supported and evaluated
• Need to assess source of behavioral type emotions (source of appraisal)
Overbeeke et al, 2003; Cawthon & Moere, 2006; Norman, 2004; Westerink, 2008; Champney et al, 2008
Personal-Hedonic
Symbolic & Meaning
Experience of Meaning / Symbolic Emotions / Experience / Symbolism
• Experience of Meaning, interpretation and association which give experiences their expressive characteristics and personal significance
• Symbolic emotions, personal relationship with an artifact, which stem from the overseer layer that contemplates and biases behavior (Norman, 2004)
• Experience, relationship between a user and product, where the individual’s personal experience with the use of the product is considered (e.g., “How do I relate to this product?”)
• Symbolism, what the artifact represents, the meanings or associations elicited by it
• Evaluate applicability of construct to experience under scrutiny
• Need to assess source of symbolic type emotions (source of appraisal)
Desmet & Hekkert, 2007; Hekkert, 2006; Norman, 2004; McNamara & Kirakowski, 2005; 2006; Rafaeli & Vilnai-Yavetz, 2004
Ergonomic Support Support • Support, availability of assistance for the experience (e.g., User Interface, Reading Material, Language Translation, Outreach Program, , Installation, Field Maintenance and Serviceability, Advertising, Support-Group Users)
• Evaluate applicability of construct to experience under scrutiny
• Ensure evaluation also targets tasks or components of the experience that are secondary or supportive in nature and not just he central ones
Gould, 1988
Ergonomic & Personal-Hedonic
Situatedness Situatedness / Composition
• Situatedness, contextually dependant aspect of user experiences
• Composition, structure of an experience (e.g. its storyline)
• Evaluate applicability of construct to experience under scrutiny
• Ensure the situatedness constraints are replicated during the evaluation process which may result in the necessity to conduct evaluations outside sterile lab environments
Wright, McCarthy & Meekison, 2003
16
17
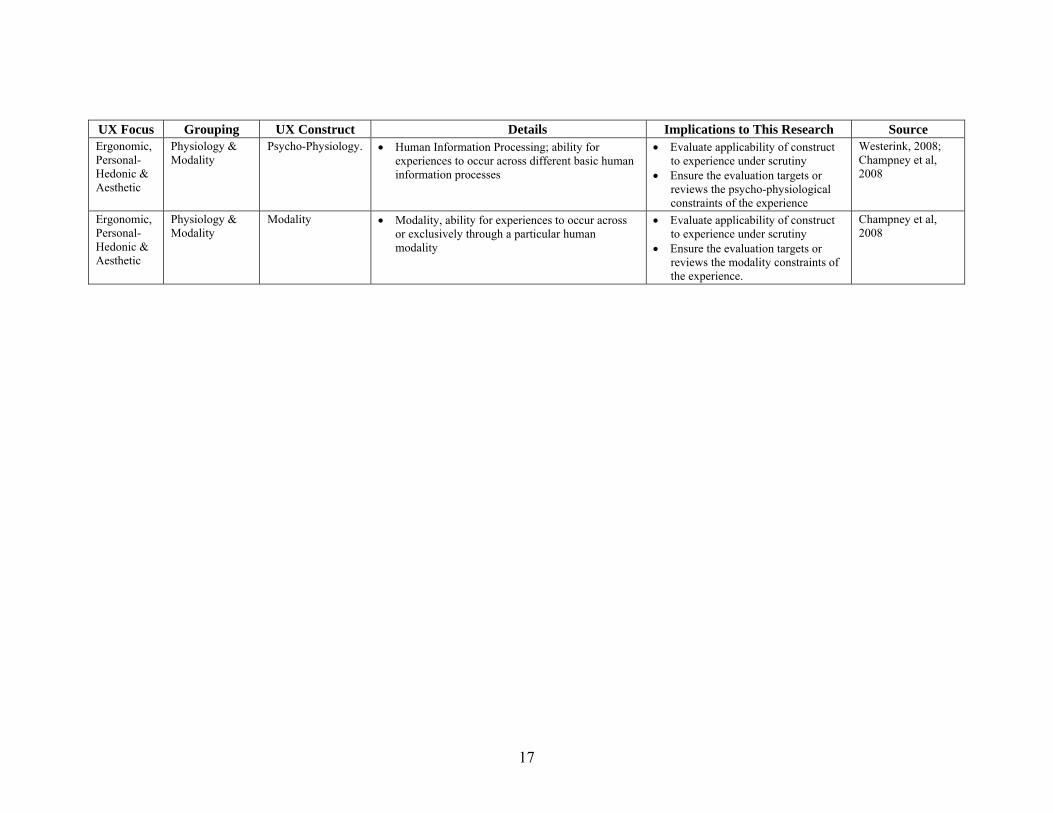
UX Focus Grouping UX Construct Source Details Implications to This Research Ergonomic, Personal-Hedonic & Aesthetic
Physiology & Modality
Psycho-Physiology. • Human Information Processing; ability for experiences to occur across different basic human information processes
• Evaluate applicability of construct to experience under scrutiny
• Ensure the evaluation targets or reviews the psycho-physiological constraints of the experience
Westerink, 2008; Champney et al, 2008
Ergonomic, Personal-Hedonic & Aesthetic
Physiology & Modality
Modality • Modality, ability for experiences to occur across or exclusively through a particular human modality
• Evaluate applicability of construct to experience under scrutiny
• Ensure the evaluation targets or reviews the modality constraints of the experience.
Champney et al, 2008
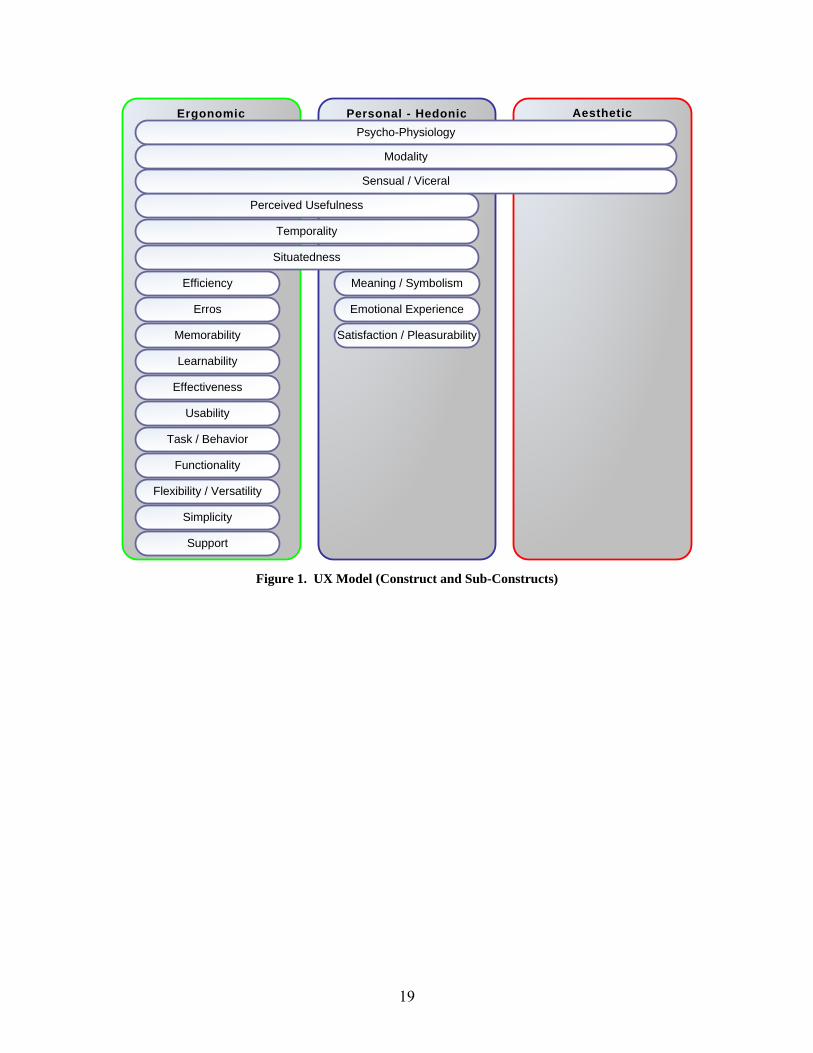
In summary, is it evident that traditional ergonomic perspectives are insufficient
to capture the broadness of the complete UX. Specifically, it is clear that far more than
task related criteria are involved in interactive experiences, and that either personal-
hedonic or aesthetic criteria alone are also insufficient. Thus, there is a need for UX
evaluation approaches that consider these aspects and those aspects that fall in between.
Figure 1 shows an integrated UX model, which takes into account the different UX
constructs aforementioned in the literature and summarized in Table 1. While this model
is more comprehensive than traditional evaluative approaches, it still lacks a
methodology for its practical application in the evaluation of interactive experiences.
Taking into consideration these constructs, an evaluation model is herein proposed that
would enable the operationalization of these perspectives into an agile evaluation process
to assess and guide design of the user experience.
18
AestheticErgonomic Personal - Hedonic
Flexibility / Versatility
Perceived Usefulness
Functionality
Simplicity
Emotional Experience
Support
Task / Behavior
Sensual / Viceral
Meaning / Symbolism
Usability
Psycho-Physiology
Situatedness
Temporality
Modality
Effectiveness
Learnability
Memorability
Erros
Efficiency
Satisfaction / Pleasurability
Figure 1. UX Model (Construct and Sub-Constructs)
19
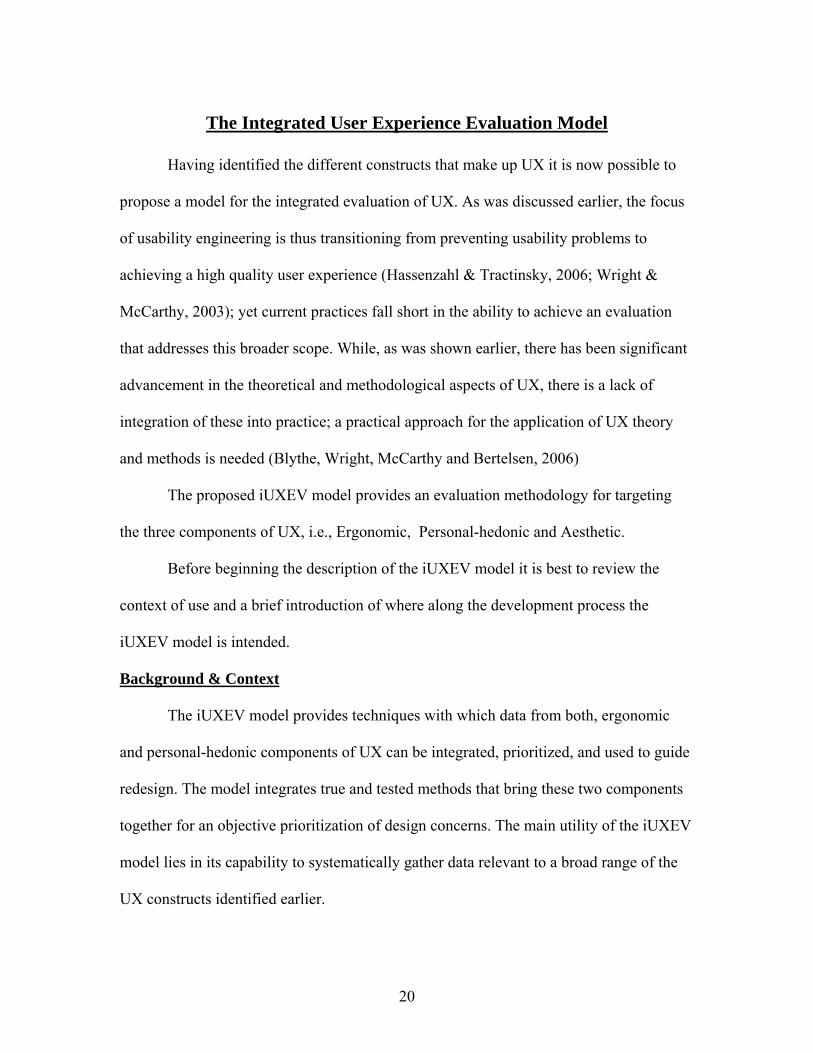
The Integrated User Experience Evaluation Model
Having identified the different constructs that make up UX it is now possible to
propose a model for the integrated evaluation of UX. As was discussed earlier, the focus
of usability engineering is thus transitioning from preventing usability problems to
achieving a high quality user experience (Hassenzahl & Tractinsky, 2006; Wright &
McCarthy, 2003); yet current practices fall short in the ability to achieve an evaluation
that addresses this broader scope. While, as was shown earlier, there has been significant
advancement in the theoretical and methodological aspects of UX, there is a lack of
integration of these into practice; a practical approach for the application of UX theory
and methods is needed (Blythe, Wright, McCarthy and Bertelsen, 2006)
The proposed iUXEV model provides an evaluation methodology for targeting
the three components of UX, i.e., Ergonomic, Personal-hedonic and Aesthetic.
Before beginning the description of the iUXEV model it is best to review the
context of use and a brief introduction of where along the development process the
iUXEV model is intended.
Background & Context
The iUXEV model provides techniques with which data from both, ergonomic
and personal-hedonic components of UX can be integrated, prioritized, and used to guide
redesign. The model integrates true and tested methods that bring these two components
together for an objective prioritization of design concerns. The main utility of the iUXEV
model lies in its capability to systematically gather data relevant to a broad range of the
UX constructs identified earlier.
20
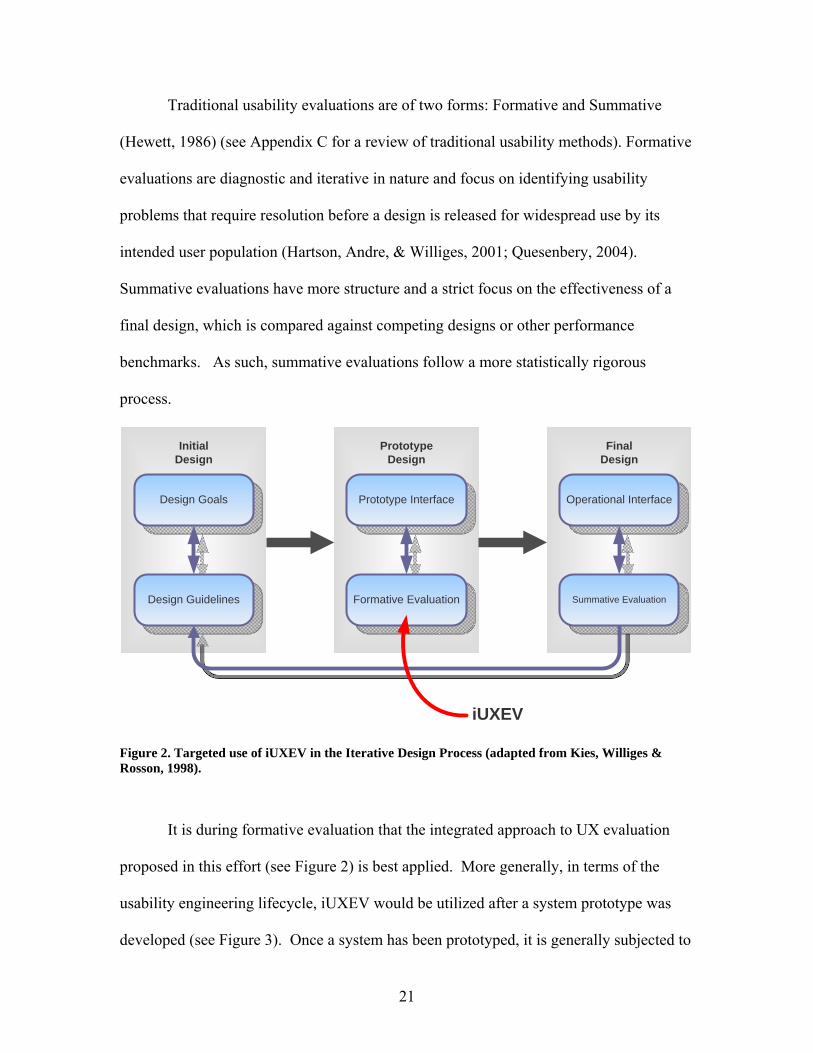
Traditional usability evaluations are of two forms: Formative and Summative
(Hewett, 1986) (see Appendix C for a review of traditional usability methods). Formative
evaluations are diagnostic and iterative in nature and focus on identifying usability
problems that require resolution before a design is released for widespread use by its
intended user population (Hartson, Andre, & Williges, 2001; Quesenbery, 2004).
Summative evaluations have more structure and a strict focus on the effectiveness of a
final design, which is compared against competing designs or other performance
benchmarks. As such, summative evaluations follow a more statistically rigorous
process.
Initial Design
Design Goals
Prototype Design
Prototype Interface
Final Design
Operational Interface
iUXEV
Design Guidelines Formative Evaluation Summative Evaluation
Figure 2. Targeted use of iUXEV in the Iterative Design Process (adapted from Kies, Williges & Rosson, 1998).
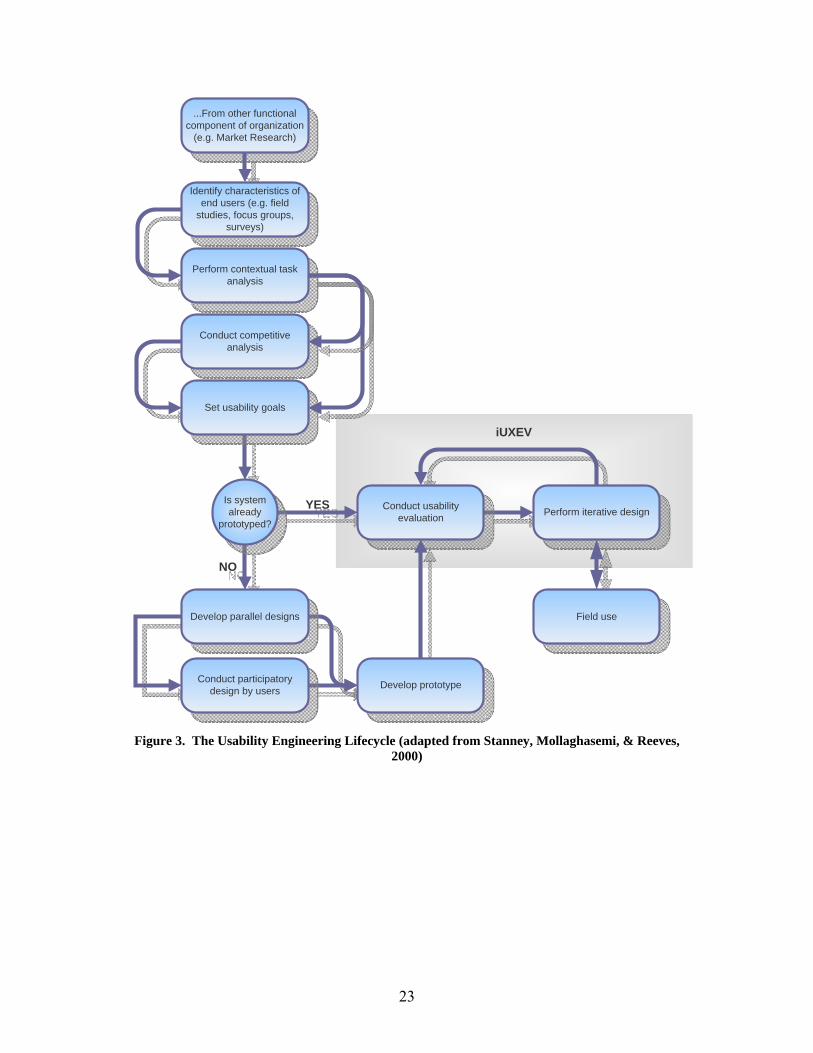
It is during formative evaluation that the integrated approach to UX evaluation
proposed in this effort (see Figure 2) is best applied. More generally, in terms of the
usability engineering lifecycle, iUXEV would be utilized after a system prototype was
developed (see Figure 3). Once a system has been prototyped, it is generally subjected to
21
usability evaluation via a choice of several Usability Evaluation Methods (UEMs). The
output of such evaluations is further fed into the next phase of the lifecycle involving
iterative design via feedback from evaluation and feedback from field use (e.g., response
cards; website questionnaires). Currently, however, there are few techniques available to
assist with the integration of the different types of UEM results such that they can readily
direct iterative design. Further, integration of the personal-hedonic component of UX
with traditional usability evaluation is rarely discussed in the literature. The iUXEV
model seeks to address these shortcomings while at the same time attempting to provide
an efficient method that is feasible in a fast paced and distributed development
environment.
22
YES
NO
iUXEV
Perform contextual task analysis
Conduct competitive analysis
Set usability goals
Is system already
prototyped?
Develop parallel designs
Conduct participatory design by users
Conduct usability evaluation Perform iterative design
...From other functional component of organization
(e.g. Market Research)
Identify characteristics of end users (e.g. field
studies, focus groups, surveys)
Develop prototype
Field use
Figure 3. The Usability Engineering Lifecycle (adapted from Stanney, Mollaghasemi, & Reeves,
2000)
23
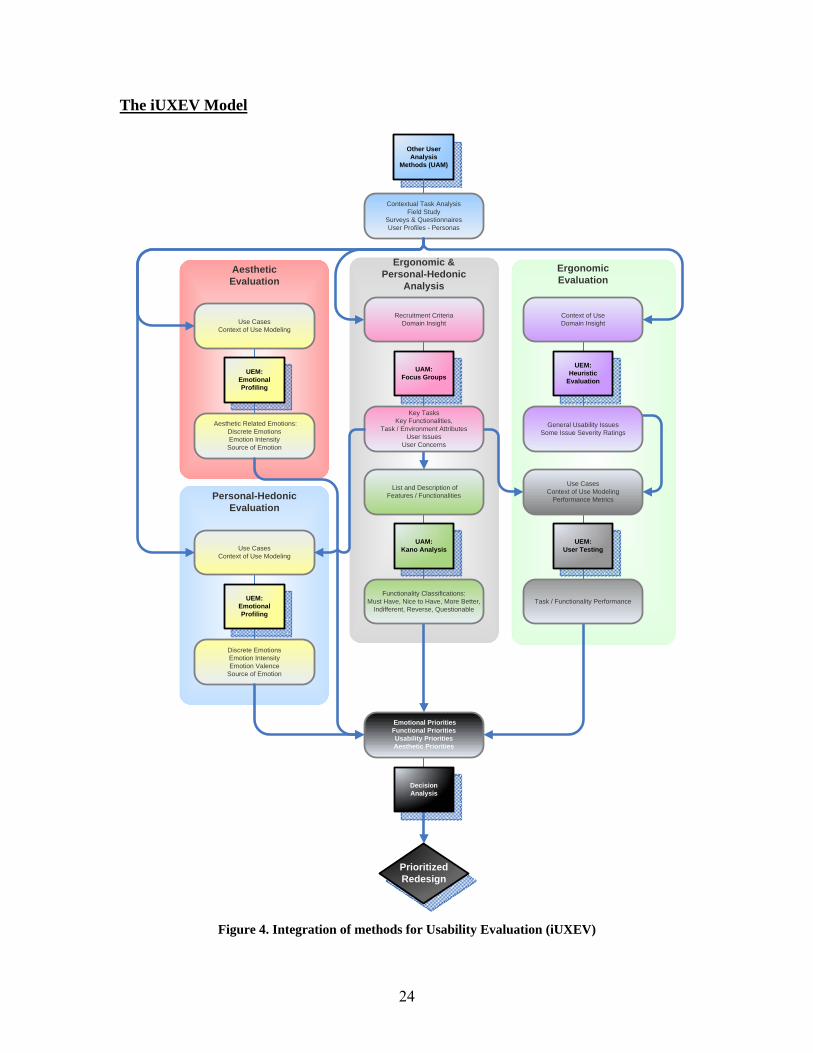
The iUXEV Model
Other User Analysis
Methods (UAM)
ErgonomicEvaluation
Ergonomic & Personal-Hedonic
Analysis
Contextual Task AnalysisField Study
Surveys & QuestionnairesUser Profiles - Personas
UAM:Focus Groups
Prioritized Redesign
Recruitment CriteriaDomain Insight
Key TasksKey Functionalities,
Task / Environment AttributesUser Issues
User Concerns
UAM:Kano Analysis
Functionality Classifications: Must Have, Nice to Have, More Better,
Indifferent, Reverse, Questionable
List and Description of Features / Functionalities
UEM:User Testing
Task / Functionality Performance
Use CasesContext of Use Modeling
Performance Metrics
UEM:Heuristic
Evaluation
Context of UseDomain Insight
General Usability IssuesSome Issue Severity Ratings
Emotional PrioritiesFunctional PrioritiesUsability PrioritiesAesthetic Priorities
Decision Analysis
Personal-HedonicEvaluation
UEM:Emotional Profiling
Discrete EmotionsEmotion IntensityEmotion Valence
Source of Emotion
Use CasesContext of Use Modeling
Aesthetic Evaluation
UEM:Emotional Profiling
Aesthetic Related Emotions:Discrete EmotionsEmotion IntensitySource of Emotion
Use CasesContext of Use Modeling
Figure 4. Integration of methods for Usability Evaluation (iUXEV)
24
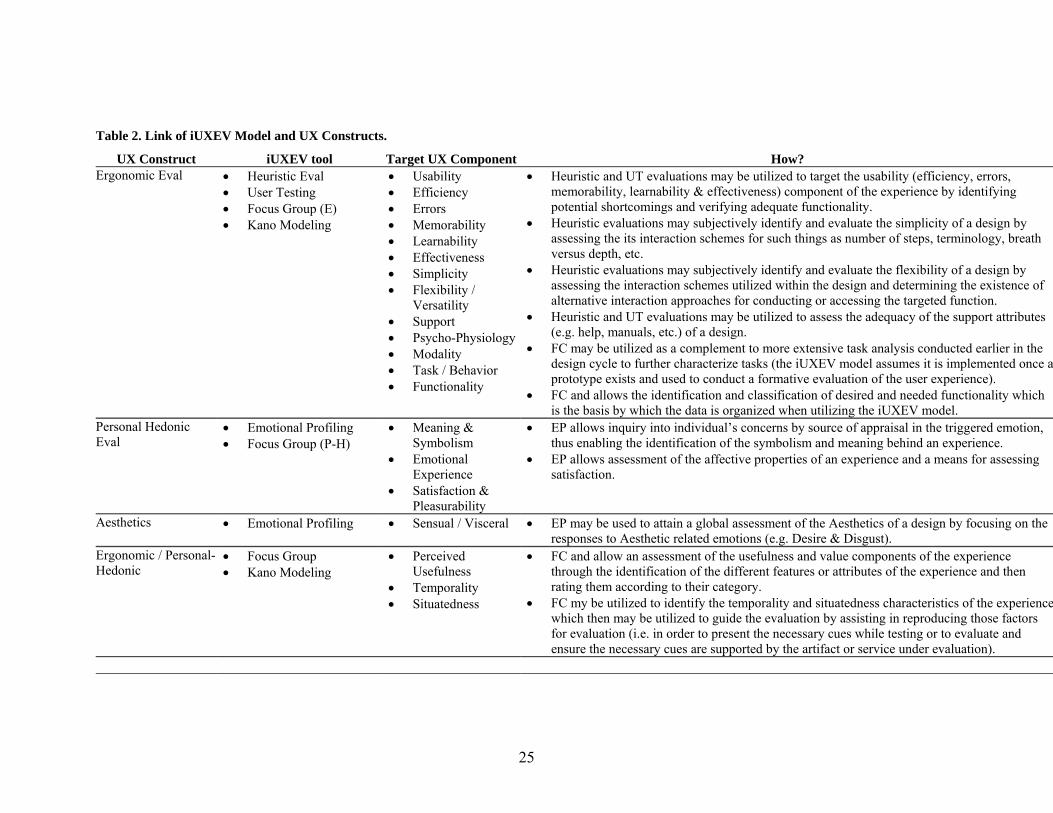
Table 2. Link of iUXEV Model and UX Constructs.
UX Construct iUXEV tool Target UX Component How?Ergonomic Eval • Heuristic Eval
• User Testing • Focus Group (E) • Kano Modeling
• Usability • Efficiency • Errors • Memorability • Learnability • Effectiveness • Simplicity • Flexibility /
Versatility • Support • Psycho-Physiology• Modality • Task / Behavior • Functionality
• Heuristic and UT evaluations may be utilized to target the usability (efficiency, errors, memorability, learnability & effectiveness) component of the experience by identifying potential shortcomings and verifying adequate functionality.
• Heuristic evaluations may subjectively identify and evaluate the simplicity of a design by assessing the its interaction schemes for such things as number of steps, terminology, breath versus depth, etc.
• Heuristic evaluations may subjectively identify and evaluate the flexibility of a design by assessing the interaction schemes utilized within the design and determining the existence of alternative interaction approaches for conducting or accessing the targeted function.
• Heuristic and UT evaluations may be utilized to assess the adequacy of the support attributes (e.g. help, manuals, etc.) of a design.
• FC may be utilized as a complement to more extensive task analysis conducted earlier in the design cycle to further characterize tasks (the iUXEV model assumes it is implemented once aprototype exists and used to conduct a formative evaluation of the user experience).
• FC and allows the identification and classification of desired and needed functionality which is the basis by which the data is organized when utilizing the iUXEV model.
Personal Hedonic Eval
• Emotional Profiling • Focus Group (P-H)
• Meaning & Symbolism
• Emotional Experience
• Satisfaction & Pleasurability
• EP allows inquiry into individual’s concerns by source of appraisal in the triggered emotion, thus enabling the identification of the symbolism and meaning behind an experience.
• EP allows assessment of the affective properties of an experience and a means for assessing satisfaction.
Aesthetics • Emotional Profiling • Sensual / Visceral • EP may be used to attain a global assessment of the Aesthetics of a design by focusing on the responses to Aesthetic related emotions (e.g. Desire & Disgust).
Ergonomic / Personal-Hedonic
• Focus Group • Kano Modeling
• Perceived Usefulness
• Temporality • Situatedness
• FC and allow an assessment of the usefulness and value components of the experience through the identification of the different features or attributes of the experience and then rating them according to their category.
• FC my be utilized to identify the temporality and situatedness characteristics of the experiencewhich then may be utilized to guide the evaluation by assisting in reproducing those factors for evaluation (i.e. in order to present the necessary cues while testing or to evaluate and ensure the necessary cues are supported by the artifact or service under evaluation).
25
The iUXEV model has five main components, an ergonomic evaluation, a
personal-hedonic evaluation, and aesthetic evaluation, a user analysis component and an
integration component which, as described in Table 2, addresses each of the identified
components of those constructs by means of a select number of methods.
Ergonomic Component
The aim of the ergonomic component of the iUXEV model is to focus on
evaluating the task-based and goal oriented aspects of user interaction (e.g., effectiveness,
efficiency, errors, memorability, learnability, simplicity, flexibility / versatility, support,
psycho-physiology, modality, task / behavior, functionality) through the utilization of one or
more methods available from the usability field. Specifically, the ergonomic quality of a
product can be assessed via many methods, including heuristic and expert-based
evaluations, laboratory or on-site usability testing with users, or model-based analytic
methods (see Table 21 in Appendix C). Yet there is a lack of understanding of which of
these methods is most effective given that there are 1) no standard criteria for evaluation,
2) no standard definitions, measures, and metrics for such criteria, and 3) no stable
standard process for ergonomic evaluation and comparison (Hartson, Andre, & Williges,
2001). Nonetheless, Hartson, Andre, and Williges (2001) found that when using these
methods, a combination of expert-based and user-based evaluation methods best
facilitates a formative evaluation process. Further a combination of qualitative and
quantitative results derived from user testing has been found to provide a more
convincing and compelling package to aid designers, than either one alone (Knight,
Pyrzak, & Green, 2007). Similarly, Stanney, Mollaghasemi, and Reeves (2000) suggest
that a particularly useful combination of methods is expert (i.e., heuristic) evaluation
26
followed by user testing. Based on this recommendations it was considered that the use of
both, heuristic evaluation and user testing could support the ergonomic evaluation of UX
and could be supplemented by use analysis methods (discussed below in the Use
Analysis section) to be incorporated into the iUXEV model. Specifically, the iUXEV
model adopts the effectiveness and efficiency of the heuristic evaluation, and the
confirmatory objectivity and insightfulness of user testing from past ergonomic UX
approaches and then integrates them into a process by which expert evaluations are
guided by insights from a focus group and confirmed and expanded by user testing and
later collapsed together into a multiple criteria matrix for the objective prioritization of
redesign efforts, thereby overcoming the subjectivity and evaluator bias often
accompanied by heuristic evaluations alone and supporting the potential lack of
contextual guidance of user testing (particularly in laboratory settings). Additional
discussion on the use and application of the selected methods used under iUXEV is
provided in Appendix D: iUXEV Methods.
Personal-Hedonic Component
The aim of the personal-hedonic component of the iUXEV model is to focus on
evaluating the subjective aspects of user interaction (e.g., meaning and symbolism,
emotional experience, satisfaction and pleasurability). Currently there are very limited
methods for assessing hedonic quality, which is likely why there has been limited activity
in assessing non-traditional aspects of user-centered design (Lewis, 2001). Early efforts
have involved satisfaction questionnaires, semantic differential lists, and other forms of
subjective assessment (c.f. ASQ, Lewis, 1991; PUTQ, Lin, Choong & Salvendy, 1997;
SUS, Brooke, 1996). Nonetheless, these methods do not address the source of the
27
hedonic quality of a product (i.e., what is causing a user to feel a particular way) or are
very specific to a domain and thus not readily generazible. It is the study of the
emotional experience an individual has with a product which uncovers the root of the
hedonic quality of the interaction (Forlizzi & Battarbee, 2004). Emotions play a very
central role in the understanding of the identified personal-hedonic constructs given their
characteristics (i.e. emotions are targeted and autonomic assessment to a stimuli against
personal concerns). Thus they offer the opportunity to uncover data supporting each of
the identified personal-hedonic sub-constructs as described in Table 2 (for a more in-
depth review of affect and emotion, and their assessment and implications to design
please see Appendix E). For these reasons Emotional assessment was the approach
selected for the personal-hedonic component in the iUXEV model. It is because of the
appraisal nature of emotions, which can aid in pinpointing user goals, standards and
attitudes (Ortony, Clore & Collins, 1988) and in turn can be taken and expanded to
understand the other personal-hedonic aspects of UX such as situatedness and
temporality, etc. that it proves such a flexible and powerful approach. Furthermore
emotions are said to have predefined reaction tendencies (Fridja, 1994), which suggests
that specific to every emotion is a behavioral defensive reaction (e.g. fear-flee, ager-
attack, boredom-avoid, etc.) that, when paired to experiential reports, can be invaluable in
predicting user behavior or adjusting design to mitigate for un/desired behavior.
Due to the limited availability of emotion assessment tools, for this effort a
method and tool were developed as means for not only assessing user emotions but the
source of such emotions. The development incorporated the use of emotional theory and
research findings for the creation of a non-verbal subjective assessment tool which
28

considers all aspects of the personal-hedonic user experience (see Chapter 4 for a more
detailed discussion and case study application of the method and tool, also see Appendix
D: iUXEV Methods for additional discussion on the use and application of the selected
methods used under iUXEV).
29
Aesthetics Component
As defined earlier the aesthetic construct focuses on the impressionistic, sensual
or styling cues of an experience, yet the evaluation of such a construct may prove
problematic. Appendix B describes how the evaluation of aesthetic constructs is
problematic given that when evaluated individually the process may prove cumbersome
(as each aesthetic element in a design would have to be evaluated separately, e.g.,
evaluating one color versus another), and when evaluated in a cohesive design it may
loose its diagnosticity given the synergistic effect of the multiple design elements
together. Nonetheless one broad approach to obtain a global aesthetic assessment may be
possible by utilizing a sub-group of emotions that are aesthetic in nature. Ortony, Clore,
& Collin (1988) cognitive structure of emotions suggest that emotions are the result of
reactions to consequences of events, actions of agents, or aspects of objects. The latter
one, aspects of objects, are aesthetic-based Attraction emotions (e.g., love, hate) linked to
the liking/disliking constructs. Utilizing this sub-set of emotions the emotional
assessment approach may be utilized to obtain a broad assessment of the Aesthetic
construct. For this reason the emotional assessment approach was chosen as the means
for evaluating the aesthetic component of UX in the iUXEV model. .
User Analysis Component
The aim of the user analysis component is to supplement the Ergonomic and
Personal-Hedonic component of the iUXEV model and to assist in the integration and
prioritization of UX issues identified. The user analysis supplements these other
components by allowing the identification of UX cues (e.g., tasks, needs, functionalities)
through queries and brainstorming with target users using a Focus Group methodology.
30
These are then characterization into features that are evaluated and categorized through
the Kano analysis into Must Haves, Attractive (Nice to Haves), One-Dimensional, and
Unimportant. In addition the user analysis seeks to identify the minimum performance
thresholds for these features (e.g., what are the minimum requirements for this feature to
be effective?). This thresholds are expressed in terms of desired user performance (e.g.,
time, steps, errors), emotional criteria (e.g., discrete target emotions, Desire; or valence,
positive or negative). A more extensive description of these tools and their application
within iUXEV is available in Appendix D.
Together, the ergonomic, personal-hedonic, aesthetic evaluations and the user
analysis components of the iUXEV model provide a comprehensive evaluation of the
user experience. Yet there is still a need to integrate and prioritize the results of these
evaluations and it is in this fifth component that is the central contribution of the iUXEV
model lies (see Figure 4).
Integration Component
The aim of the integration component of iUXEV is to allow for the aggregation of
the different types of data into a single objectively prioritized list of UX issues, thus
providing a methodology for integrating and prioritizing the data generated; this is
illustrated in figure 5 below.
31

Stakeholders / Decision Makers
Emotional Priorities:
Functional Priorities
Usability Priorities
Organizational Priorities
+ Positive Emotions
HappinessSatisfactionReliefPrideetc.
SadnessDissatisfactionDisappointmentShameetc.
- Negative Emotions
L ------ Intensity ------- H
Functionalities
Must Have (Expected)
One-Dimensional (More Better)
Attractive (Nice to Have)
Reverse (Investigate Further)
Questionable (Investigate Further)
Indifferent (Don’t Care)
Usability Parameters
100
90
80
70
60
50
Effectiveness
Efficiency
Learnability
Memorability
Subjective Usability Ratings
Etc.
Sales Criteria
Marketing Criteria
Cost Criteria
Time Criteria
Etc.
Organization / Project Goals
Master Table
SME input & impact assessment
Prioritized Guidance for Future Development
Figure 5. iUXEV integration component.
As summarized in Table 1, current UX methods fall particularly short in terms of
their ability to integrate and prioritize evaluation data. In order to achieve an integration
approach, current methods were reviewed. In general, current approaches to
categorization and prioritization of UX issues have been addressed by the usability
literature and fall under three main themes: severity ratings, categories classifications,
and goal considerations (see Table 3).
32

The Severity approach, which has been the more common form of prioritization,
is based on an estimate of the usability impact of each identified problem (Nielsen, 1994).
While severity ratings may prove effective if done reliably, several critics highlight the
lack of agreement among usability practitioners in the rating of problem severities (c.f.
Bailey, 2005; Catani & Biers, 1998; Cockton & Woolrych, 2001; Hertzum & Jacobsen
2003). To counteract for this lack of agreement, objective criteria must be used to anchor
the severity assessments (e.g., Severe- cannot complete task; Moderate- difficulty or
delay in task completion, etc.) such that subjectivity and variability across raters is
reduced or eliminated.
The premise of second approach, the Categories method, is that usability
problems may have similarities at a surface level, yet have very different underlying
causes and vice versa, and thus classifying problems helps with diagnosis of the
underlying essence of the problem (Andre, Hartson, Belz, & McCreary, 2001). Some
methods that fall under this approach include the use of design guidelines (c.f. Mayhew,
1992) and heuristics (Nielsen, 1993) as a basis for classification. These approaches, while
diagnostic, given that they identify the UX problem (i.e., the type of problem), do not
provide a more detailed classification in terms of the user interaction (i.e., which aspects
of the interaction are problematic), nor do they allow for a prioritization as all categories
are important.
The third approach, Goals, is a more recent approach, which considers assessing
priorities along identified dimensions (e.g., development time and effort, cost, sales
objectives, project goals, etc.) and determining the priority of addressing each identified
problem based on its impact on these dimensions (Fadden & McQuaid, 2003). While this
33

approach considers the needs of the project or organization as a whole, it may be
challenging to implement given the need for others outside the evaluation team to provide
input on the impact assessment of each item being rated. They also have been
shorthanded by the use of no more than two categories simultaneously and still require
further pairing to a severity rating in order to support the prioritization of further
development / design efforts.
Thus, while much of the challenge with prioritization has been dismissed with the
presumption that rank ordering a list of identified issues is a trivial process (Fadden &
McQuaid, 2003), as can be seen in Table 3 several issues arise when relying on such
methods (Lewis et al. 1990; Nielsen & Landauer, 1993). To overcome these
shortcomings, the iUXEV model uses hybrid approach utilizing components of multi-
criteria decision making, and axiomatic design (Suh, 1998) to integrate and prioritize
ergonomic and personal-hedonic data provided from a UX evaluation and organize these
data in a manner that is usable by usability practitioners and readily conveyed to decision
makers.
34
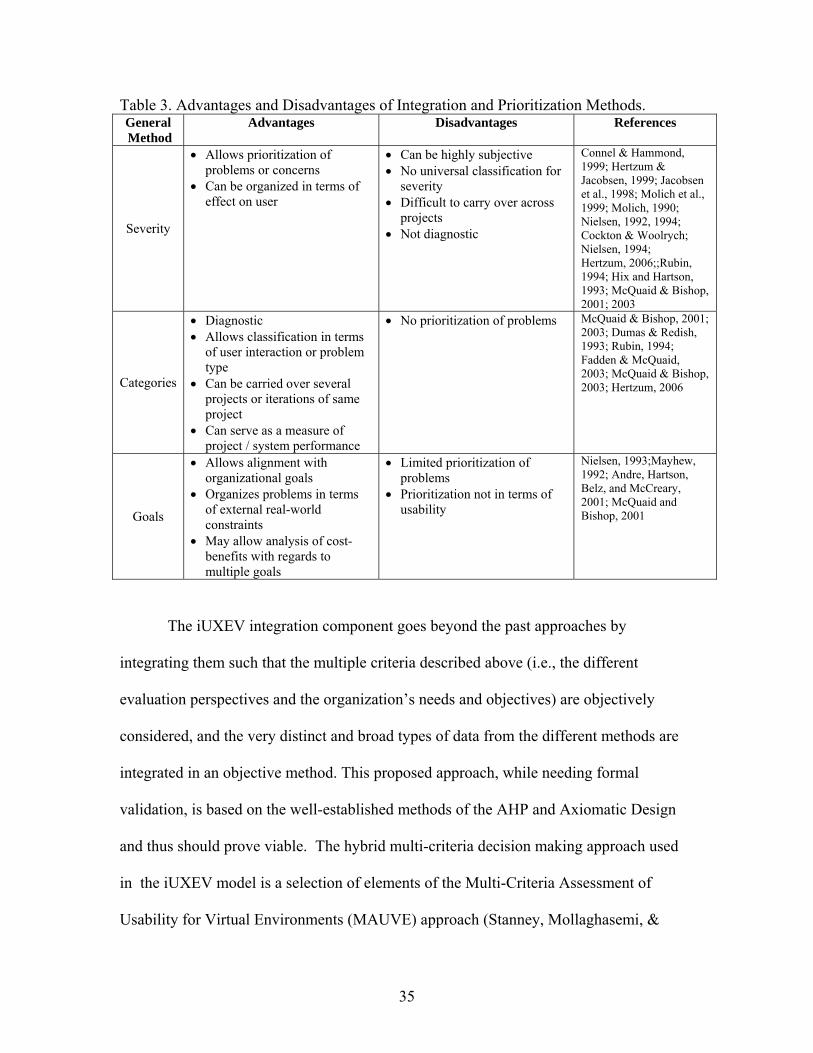
Table 3. Advantages and Disadvantages of Integration and Prioritization Methods. General Method
Advantages Disadvantages References
Severity
• Allows prioritization of problems or concerns
• Can be organized in terms of effect on user
• Can be highly subjective • No universal classification for
severity • Difficult to carry over across
projects • Not diagnostic
Connel & Hammond, 1999; Hertzum & Jacobsen, 1999; Jacobsen et al., 1998; Molich et al., 1999; Molich, 1990; Nielsen, 1992, 1994; Cockton & Woolrych; Nielsen, 1994; Hertzum, 2006;;Rubin, 1994; Hix and Hartson, 1993; McQuaid & Bishop, 2001; 2003
Categories
• Diagnostic • Allows classification in terms
of user interaction or problem type
• Can be carried over several projects or iterations of same project
• Can serve as a measure of project / system performance
• No prioritization of problems
McQuaid & Bishop, 2001; 2003; Dumas & Redish, 1993; Rubin, 1994; Fadden & McQuaid, 2003; McQuaid & Bishop, 2003; Hertzum, 2006
Goals
• Allows alignment with organizational goals
• Organizes problems in terms of external real-world constraints
• May allow analysis of cost-benefits with regards to multiple goals
• Limited prioritization of problems
• Prioritization not in terms of usability
Nielsen, 1993;Mayhew, 1992; Andre, Hartson, Belz, and McCreary, 2001; McQuaid and Bishop, 2001
The iUXEV integration component goes beyond the past approaches by
integrating them such that the multiple criteria described above (i.e., the different
evaluation perspectives and the organization’s needs and objectives) are objectively
considered, and the very distinct and broad types of data from the different methods are
integrated in an objective method. This proposed approach, while needing formal
validation, is based on the well-established methods of the AHP and Axiomatic Design
and thus should prove viable. The hybrid multi-criteria decision making approach used
in the iUXEV model is a selection of elements of the Multi-Criteria Assessment of
Usability for Virtual Environments (MAUVE) approach (Stanney, Mollaghasemi, &
35
Reeves, 2000), which utilized an Analytical Hierarchical Process (AHP) to facilitate the
consideration of multiple usability goals in a prioritization process and the Information
Axiom of Axiomatic Design (Suh, 1998)). The AHP method is a technique that allows
the consideration of multiple criteria for the purpose of decision making by allowing the
consideration of both objective and subjective factors in the selection among alternatives
(Stanney, Mollaghasemi, & Reeves, 2000). Axiomatic design is a methodology for the
design of systems which utilizes two primary axioms; the Independence axiom and the
Information axiom (Suh, 1998). While these axioms are primarily intended for design,
they could be used for evaluation. Of particular interest is the information axiom which is
utilized for determining in an objective manner how much does a design deviate from the
ideal design (as measured by the deviation from minimum requirements thresholds).
What follows is a description of these hybrid approach within the iUXEV model
The integration component of iUXEV is operationalized in a multi-criteria
prioritization method following a five-step process:
1. Criteria Identification (application of the three AHP principles)
a. Identify Goals and Criteria. Identifying the relevant UX goals and criteria that
are being used by stakeholders and decision makers for their consideration or
prioritization (simplified from the AHP by utilizing a single level non-
hierarchical decomposition format).
b. Rate Relative Importance of Criteria. The identified UX criteria must be
weighed for importance against each other. This can be done with the aid of a
representative/s of the development team who understands organizational and
project goals and criteria. The pair wise importance of each goal or criteria can
36
then be determined by using the “Relative Importance of Goals or Criteria”
approach of the AHP as described by Stanney et al. (2000). It is important to
note that ensuring the application of the approach (i.e. simplifying it such that it
is used in practice) is more important than the quantitative rigidity of the ratings
as this process will require multiple iterations and use of multiple key
individuals in an organization (see Case Study in Chapter 3 for a review of this
recommendation). Lastly, one needs to consider how one will prefer to utilize
the Kano data. This data may be utilized in two forms: one may use it to filter
the list of items one wishes to address (e.g., one will only consider Must Have
functions for the prioritization), or one may assign a subjective scale and
incorporate into the prioritization calculations. If one chooses the latter one, one
would have to include the Kano data as an additional factor and include it in the
pair wise comparison in order to determine how much important to give to this
rating.
2. Data Preparation
In order to integrate the data from such varied sources and in such different forms,
it is necessary to convert the date into a usable format.
a. User Analysis data. The data stemming from the user analysis is a list of the
user needs expressed in system functionalities composed during a focus group
and Kano analysis effort organized with its relational descriptors (e.g. required,
delighters, irrelevant) and their minimum performance requirements. This
serves as the foundation for the evaluation list such that every UX issue
37
identified through the evaluation components is linked and aligned to a relevant
user need expressed as functionality.
b. Ergonomic Data. The ergonomic data requires conversion to a workable format
such that highly descriptive and contextual data like those gathered from a
heuristic evaluation can be combined and prioritized next to numerical date
captured during user testing. Two lists of usability shortcomings identified
during both heuristic evaluation and user testing is created and organized based
on usability importance and then linked to the list of functionalities. As shown
in Table 3, there are several approaches for determining importance, with the
key aspect being the use of an objective criterion that minimizes bias and can be
translated into operational terms. Of the methods shown in Table 3, the most
compelling is a variation of the method provided by Hetzum (2006), which
focuses on identifying multiple evaluator correlations. It utilizes a composite
severity rating to mitigate evaluator bias by forcing the evaluator to ground
his/her assessments on some common relatively objective criteria. In this case
the grounding criteria are the Impact of the problem on the user, the expected
persistence of the problem, and the frequency among evaluators (or
participants) who found the problem. The variation proposed for the Hetzum
approach is presented in table 4 below where the scored from the three ratings
are averaged (i.e., added and then divided by 3). This is applied to both the
heuristic and user testing date separately and results in two lists which would
later be compared against a desired threshold set by the project’s administration
(e.g., address only those issues with importance ratings of 3 or above)
38
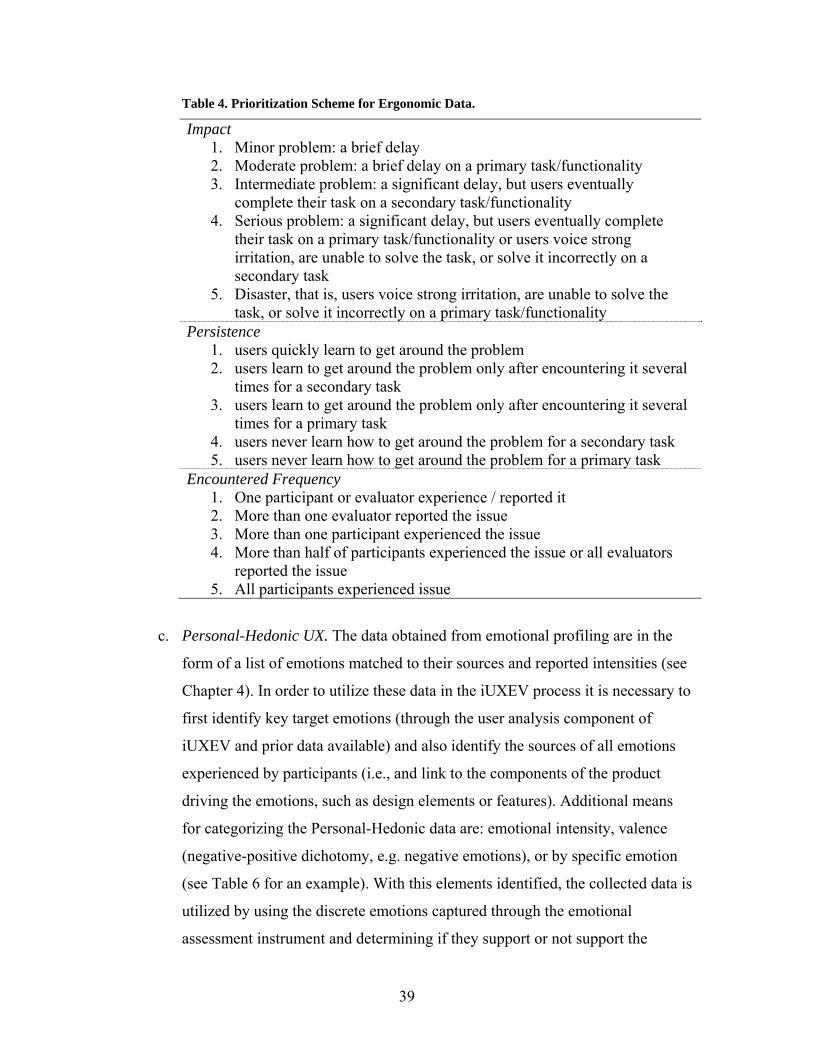
Table 4. Prioritization Scheme for Ergonomic Data.
Impact 1. Minor problem: a brief delay 2. Moderate problem: a brief delay on a primary task/functionality 3. Intermediate problem: a significant delay, but users eventually
complete their task on a secondary task/functionality 4. Serious problem: a significant delay, but users eventually complete
their task on a primary task/functionality or users voice strong irritation, are unable to solve the task, or solve it incorrectly on a secondary task
5. Disaster, that is, users voice strong irritation, are unable to solve the task, or solve it incorrectly on a primary task/functionality
Persistence 1. users quickly learn to get around the problem 2. users learn to get around the problem only after encountering it several
times for a secondary task 3. users learn to get around the problem only after encountering it several
times for a primary task 4. users never learn how to get around the problem for a secondary task 5. users never learn how to get around the problem for a primary task
Encountered Frequency 1. One participant or evaluator experience / reported it 2. More than one evaluator reported the issue 3. More than one participant experienced the issue 4. More than half of participants experienced the issue or all evaluators
reported the issue 5. All participants experienced issue
c. Personal-Hedonic UX. The data obtained from emotional profiling are in the
form of a list of emotions matched to their sources and reported intensities (see
Chapter 4). In order to utilize these data in the iUXEV process it is necessary to
first identify key target emotions (through the user analysis component of
iUXEV and prior data available) and also identify the sources of all emotions
experienced by participants (i.e., and link to the components of the product
driving the emotions, such as design elements or features). Additional means
for categorizing the Personal-Hedonic data are: emotional intensity, valence
(negative-positive dichotomy, e.g. negative emotions), or by specific emotion
(see Table 6 for an example). With this elements identified, the collected data is
utilized by using the discrete emotions captured through the emotional
assessment instrument and determining if they support or not support the
39
desired emotions in the target experience (c.f. Desmet, Porcelijn, and van Dijk,
2005). One alternative deviation of this is the use of a “general” valence for
instances where a specific discrete emotion target is not available (e.g., the
target emotion would be of positive valence). While this last alternative is less
desirable, it is necessary as the very concept of designing an emotional
experience is of significant challenge and a broader target may be “good
enough” in some instances. Finally it is of key importance that the target also be
expressed in a measure of intensity using some type of subjective scale (e.g.
n/a, happy, very happy). With this, it is deemed that those responses matching
the desired emotions and their intensity are “on target” and those not matching
“not on target” and thus considered UX issues and the deviation from intensity
a measure of the gap between observed and target (the emotion sources are then
used to diagnose and identify targets for redesign).
d. Additional Factors. The iUXEV integration approach also considers important
organizational and project concerns that fall outside the UX evaluation but that
are a critical and realistic component of the UX evaluation in the context of the
development of an artifact’s UX. These factors include the external governing
limitations or directives with which the project must align (e.g. cost,
development time, etc.). These are added as separate factors for consideration in
parallel to the three UX constructs (ergonomic, personal-hedonic & aesthetic).
Given that these are external factors and no data has yet been collected trough
the prior iUXEV methods, these are populated utilizing the approach described
next.
For each item identified (e.g., functionality) as illustrated in Table 5, a
subjective rating approach is utilized to populate with “impact” ratings. For this
it is necessary to involve the participation of local subject matter experts
(SME), such as members of the development team who are familiar with
specific criteria. For instance a software developer may be recruited as an SME
to rate the development cost and time required to address an identified
shortcoming (e.g., cost to resolve a found usability problem, or redevelop a
desired feature). In the application of this step it is necessary to answer the
40

41
following questions utilizing a Likert scale (Likert, 1932) and making the
subjective rating.
i. For Constraints: How much will resolving this issue consume of the
factor or criteria (expressed appropriate values for the factor under
evaluation, e.g., time in days, cost in dollars)?
ii. For Goals: How will addressing this item contribute to the desired goal
under evaluation (expressed using subjective numerical scale)?
For evaluating the impact on constraints the real value estimates may be
utilized. For evaluating the impact on goals a scale is needed and the one
provided is Table 5 is proposed as a possibility. Similarly to the previously
discussed data, this data would also be subjected to a judgment against a
threshold at a later step.
Table 5. Scale for Evaluating Impact on Goal.
Goal 1. No Impact 2. Some Indirect Impact: some component could be adapted to address the
goal 3. Strong Indirect Impact: could be adapted to address the goal 4. Direct Impact: supports addressing the goal in some way 5. Strong Direct Impact: used to address the goal
3. Data Organization
After the data has been prepared it is organized in a table (see Table 6) where all
items on the lists are aligned against the identified functionalities. Given that not
all items in the table will have relevance in all columns (e.g., emotion ratings) it
is acceptable to have empty cells. For instance a particular feature may have no
emotional data associated with it such that its score under that column will be
null.
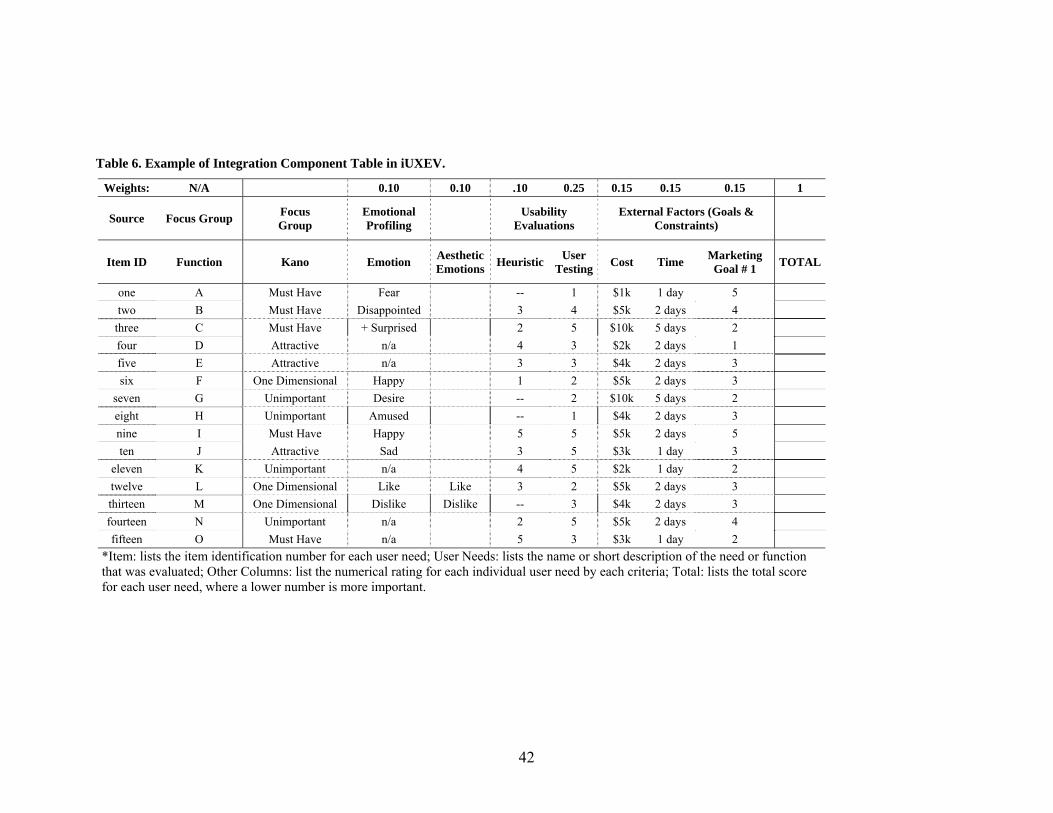
Table 6. Example of Integration Component Table in iUXEV.
Weights: N/A 0.10 0.10 .10 0.25 0.15 0.15 0.15 1
Source Focus Group Focus Group
Emotional Profiling Usability
Evaluations External Factors (Goals &
Constraints)
Item ID Function Kano Emotion Aesthetic Emotions Heuristic User
Testing Cost Time Marketing Goal # 1 TOTAL
one A Must Have Fear -- 1 $1k 1 day 5 two B Must Have Disappointed 3 4 $5k 2 days 4
three C Must Have + Surprised 2 5 $10k 5 days 2 four D Attractive n/a 4 3 $2k 2 days 1 five E Attractive n/a 3 3 $4k 2 days 3 six F One Dimensional Happy 1 2 $5k 2 days 3
seven G Unimportant Desire -- 2 $10k 5 days 2 eight H Unimportant Amused -- 1 $4k 2 days 3 nine I Must Have Happy 5 5 $5k 2 days 5 ten J Attractive Sad 3 5 $3k 1 day 3
eleven K Unimportant n/a 4 5 $2k 1 day 2 twelve L One Dimensional Like Like 3 2 $5k 2 days 3 thirteen M One Dimensional Dislike Dislike -- 3 $4k 2 days 3 fourteen N Unimportant n/a 2 5 $5k 2 days 4 fifteen O Must Have n/a 5 3 $3k 1 day 2
*Item: lists the item identification number for each user need; User Needs: lists the name or short description of the need or function that was evaluated; Other Columns: list the numerical rating for each individual user need by each criteria; Total: lists the total score for each user need, where a lower number is more important.
42
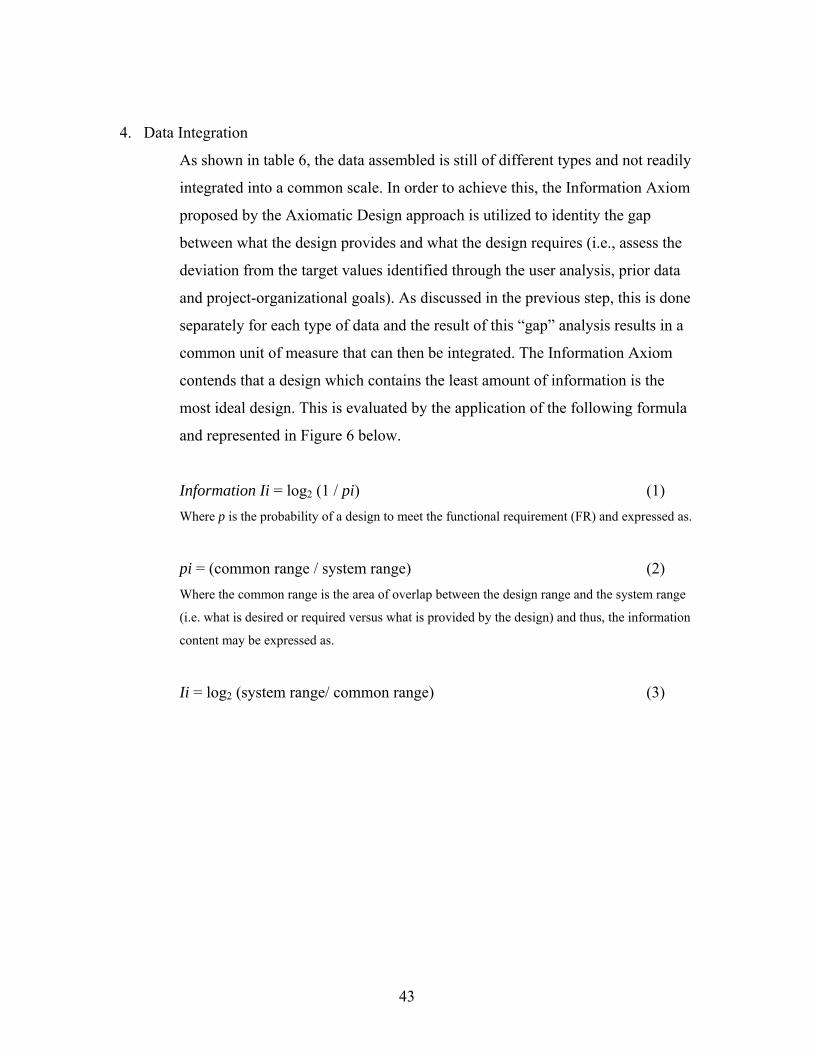
4. Data Integration
As shown in table 6, the data assembled is still of different types and not readily
integrated into a common scale. In order to achieve this, the Information Axiom
proposed by the Axiomatic Design approach is utilized to identity the gap
between what the design provides and what the design requires (i.e., assess the
deviation from the target values identified through the user analysis, prior data
and project-organizational goals). As discussed in the previous step, this is done
separately for each type of data and the result of this “gap” analysis results in a
common unit of measure that can then be integrated. The Information Axiom
contends that a design which contains the least amount of information is the
most ideal design. This is evaluated by the application of the following formula
and represented in Figure 6 below.
Information Ii = log2 (1 / pi) (1) Where p is the probability of a design to meet the functional requirement (FR) and expressed as.
pi = (common range / system range) (2) Where the common range is the area of overlap between the design range and the system range
(i.e. what is desired or required versus what is provided by the design) and thus, the information
content may be expressed as.
Ii = log2 (system range/ common range) (3)
43
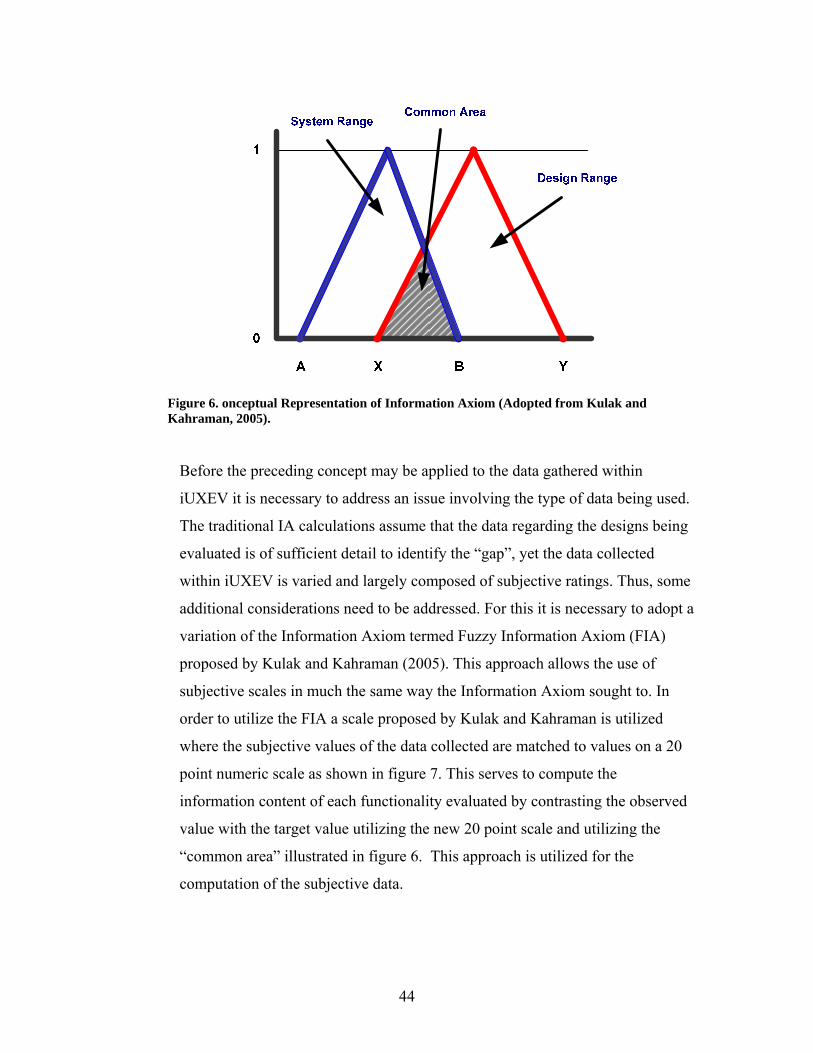
Figure 6. onceptual Representation of Information Axiom (Adopted from Kulak and Kahraman, 2005).
Before the preceding concept may be applied to the data gathered within
iUXEV it is necessary to address an issue involving the type of data being used.
The traditional IA calculations assume that the data regarding the designs being
evaluated is of sufficient detail to identify the “gap”, yet the data collected
within iUXEV is varied and largely composed of subjective ratings. Thus, some
additional considerations need to be addressed. For this it is necessary to adopt a
variation of the Information Axiom termed Fuzzy Information Axiom (FIA)
proposed by Kulak and Kahraman (2005). This approach allows the use of
subjective scales in much the same way the Information Axiom sought to. In
order to utilize the FIA a scale proposed by Kulak and Kahraman is utilized
where the subjective values of the data collected are matched to values on a 20
point numeric scale as shown in figure 7. This serves to compute the
information content of each functionality evaluated by contrasting the observed
value with the target value utilizing the new 20 point scale and utilizing the
“common area” illustrated in figure 6. This approach is utilized for the
computation of the subjective data.
44
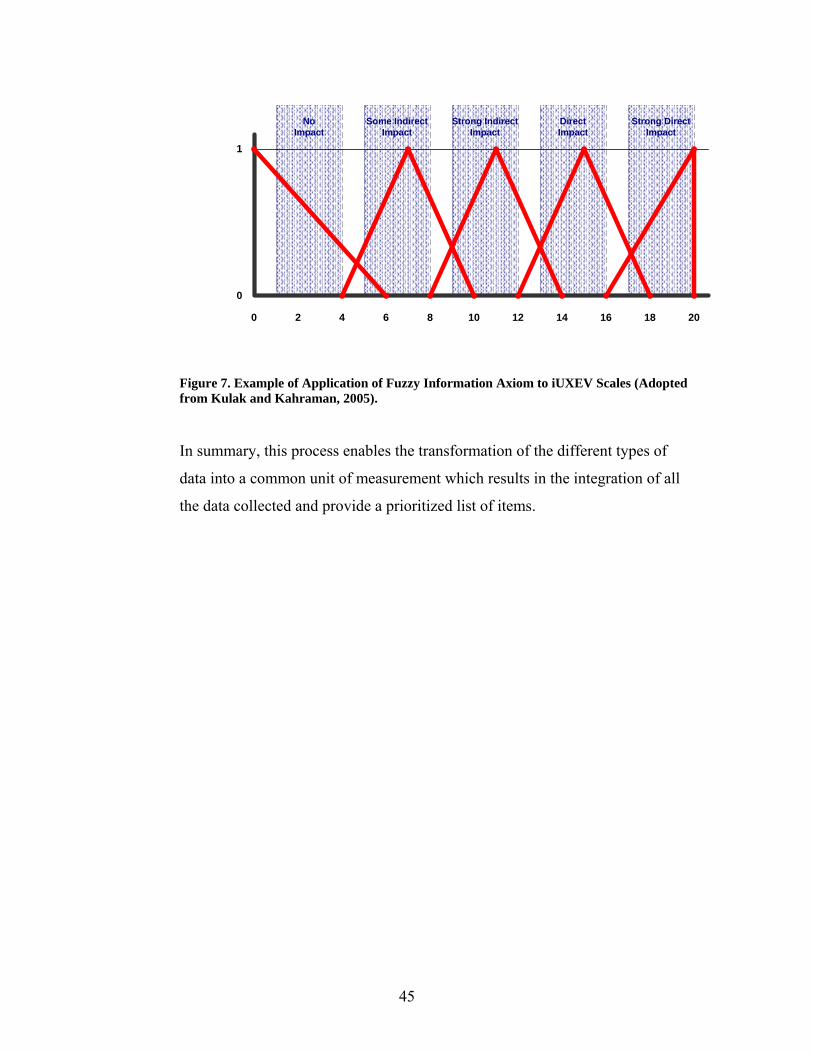
No Impact
Some Indirect Impact
Strong Indirect Impact
DirectImpact
Strong Direct Impact
0 2 4 6 8 10 12 14 16 18 20
1
0
Figure 7. Example of Application of Fuzzy Information Axiom to iUXEV Scales (Adopted from Kulak and Kahraman, 2005).
In summary, this process enables the transformation of the different types of
data into a common unit of measurement which results in the integration of all
the data collected and provide a prioritized list of items.
45
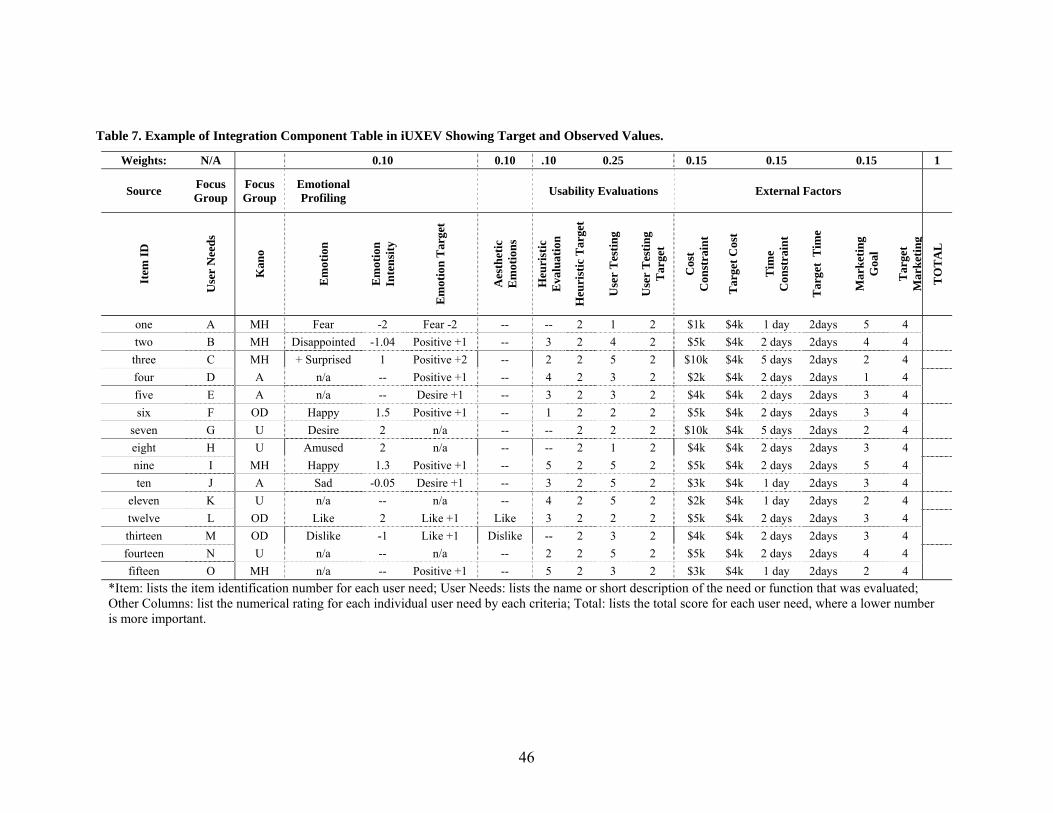
Table 7. Example of Integration Component Table in iUXEV Showing Target and Observed Values.
Weights: N/A 0.10 0.10 .10 0.25 0.15 0.15 0.15 1
Source Focus Group
Focus Group
Emotional Profiling
Usability Evaluations External Factors
Item
ID
Use
r N
eeds
Kan
o
Em
otio
n
Em
otio
n In
tens
ity
Em
otio
n T
arge
t
Aes
thet
ic
Em
otio
ns
Heu
rist
ic
Eva
luat
ion
Heu
rist
ic T
arge
t
Use
r T
estin
g
Use
r T
estin
g T
arge
t
Cos
t C
onst
rain
t
Tar
get C
ost
Tim
e C
onst
rain
t
Tar
get
Tim
e
Mar
ketin
g G
oal
Tar
get
Mar
ketin
g
TO
TA
L
one A MH Fear -2 Fear -2 -- -- 2 1 2 $1k $4k 1 day 2days 5 4 two B MH Disappointed -1.04 Positive +1 -- 3 2 4 2 $5k $4k 2 days 2days 4 4 three C MH + Surprised 1 Positive +2 -- 2 2 5 2 $10k $4k 5 days 2days 2 4 four D A n/a -- Positive +1 -- 4 2 3 2 $2k $4k 2 days 2days 1 4 five E A n/a -- Desire +1 -- 3 2 3 2 $4k $4k 2 days 2days 3 4 six F OD Happy 1.5 Positive +1 -- 1 2 2 2 $5k $4k 2 days 2days 3 4
seven G U Desire 2 n/a -- -- 2 2 2 $10k $4k 5 days 2days 2 4 eight H U Amused 2 n/a -- -- 2 1 2 $4k $4k 2 days 2days 3 4 nine I MH Happy 1.3 Positive +1 -- 5 2 5 2 $5k $4k 2 days 2days 5 4 ten J A Sad -0.05 Desire +1 -- 3 2 5 2 $3k $4k 1 day 2days 3 4
eleven K U n/a -- n/a -- 4 2 5 2 $2k $4k 1 day 2days 2 4 twelve L OD Like 2 Like +1 Like 3 2 2 2 $5k $4k 2 days 2days 3 4 thirteen M OD Dislike -1 Like +1 Dislike -- 2 3 2 $4k $4k 2 days 2days 3 4 fourteen N U n/a -- n/a -- 2 2 5 2 $5k $4k 2 days 2days 4 4 fifteen O MH n/a -- Positive +1 -- 5 2 3 2 $3k $4k 1 day 2days 2 4
*Item: lists the item identification number for each user need; User Needs: lists the name or short description of the need or function that was evaluated; Other Columns: list the numerical rating for each individual user need by each criteria; Total: lists the total score for each user need, where a lower number is more important.
46
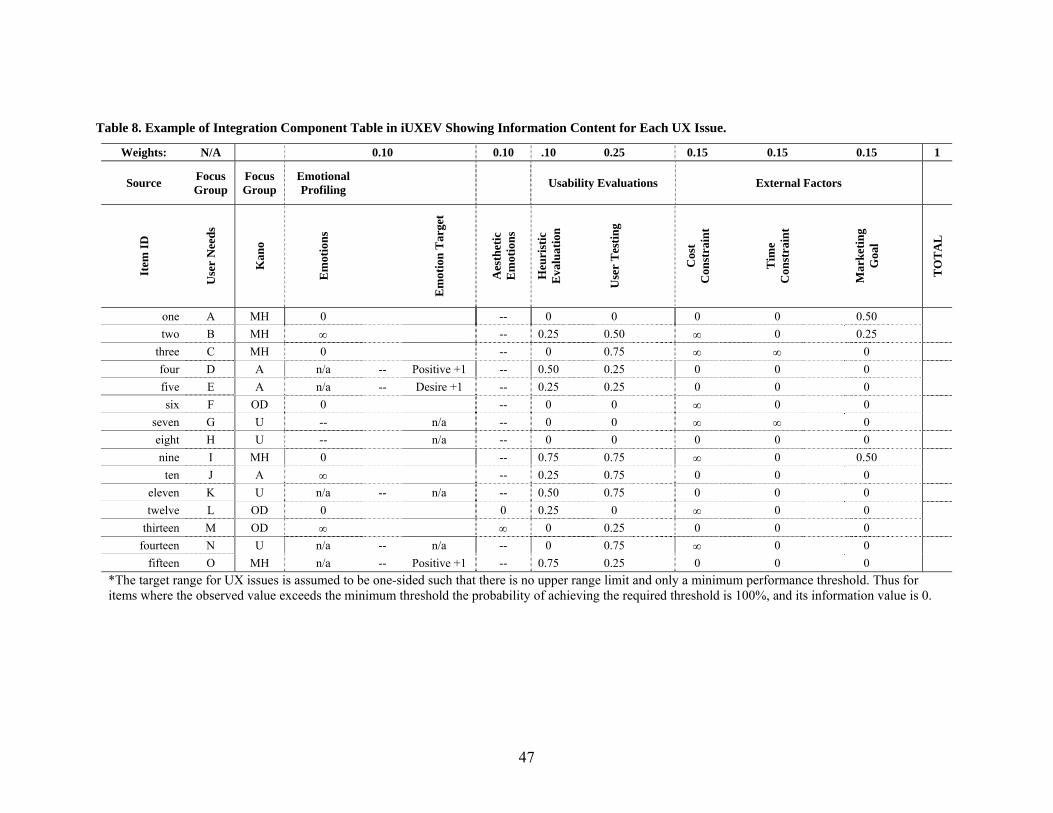
47
Table 8. Example of Integration Component Table in iUXEV Showing Information Content for Each UX Issue.
Weights: N/A 0.10 0.10 .10 0.25 0.15 0.15 0.15 1
Source Focus Group
Focus Group
Emotional Profiling
Usability Evaluations External Factors
Item
ID
Use
r N
eeds
Kan
o
Em
otio
ns
Em
otio
n T
arge
t
Aes
thet
ic
Em
otio
ns
Heu
rist
ic
Eva
luat
ion
Use
r T
estin
g
Cos
t C
onst
rain
t
Tim
e C
onst
rain
t
Mar
ketin
g G
oal
TO
TA
L
one A MH 0 -- 0 0 0 0 0.50 two B MH ∞ -- 0.25 0.50 ∞ 0 0.25
three C MH 0 -- 0 0.75 ∞ ∞ 0 four D A n/a -- Positive +1 -- 0.50 0.25 0 0 0 five E A n/a -- Desire +1 -- 0.25 0.25 0 0 0 six F OD 0 -- 0 0 ∞ 0 0
seven G U -- n/a -- 0 0 ∞ ∞ 0 eight H U -- n/a -- 0 0 0 0 0 nine I MH 0 -- 0.75 0.75 ∞ 0 0.50 ten J A ∞ -- 0.25 0.75 0 0 0
eleven K U n/a -- n/a -- 0.50 0.75 0 0 0 twelve L OD 0 0 0.25 0 ∞ 0 0
thirteen M OD ∞ ∞ 0 0.25 0 0 0 fourteen N U n/a -- n/a -- 0 0.75 ∞ 0 0
fifteen O MH n/a -- Positive +1 -- 0.75 0.25 0 0 0 *The target range for UX issues is assumed to be one-sided such that there is no upper range limit and only a minimum performance threshold. Thus for items where the observed value exceeds the minimum threshold the probability of achieving the required threshold is 100%, and its information value is 0.

5. Compute Information Values
The next step is to compute the information content values for each item on the list (e.g.
for each function). Give the type of data and the purpose of the use of this data, the
traditional information calculation formula # 1 cannot be applied to all the data available.
This is explained next. The emotional data is not conductive to the use of the formula and
thus heuristics must be used to transform such data into priorities (see table 9 below). The
usability data, may be transformed utilizing the FIA approach, yet all values that fall over
one scalar value above the threshold (e.g., if target is 2 and the observed value is 4)
would result in an infinite information value. This in turn would remove the severity
variability that is observed on “gaps” over more than 1 scalar difference; thus heuristics
are necessary for this data as well, with one key advantage. Given that the minimum and
maximum values are known (i.e., the subjective ratings have a minimum and a
maximum) one can provide severity ratings to this gaps and use those as the information
values (see table 9 below). The same approach could be applied to the goals data for the
external factors. The constraints data on the other hand produces a different challenge. In
this case the data values are potentially infinite as these are real world data (e.g. dollars,
time) and not subjective data. In this case one could use Formula #1, yet the values would
need a secondary transformation in order to make it compatible with the 0 to 1 scale
being used for the other data. Furthermore, the scale is logarithmic such that a the impact
does not follow a linear progression. As such one may have two options; either one
utilizes a subjective criteria to compute the impact on a constraint or one may use the
simple heuristics in table 9 (i.e., use zero for items that do not cross the constraint, and 1
for those that do).
48
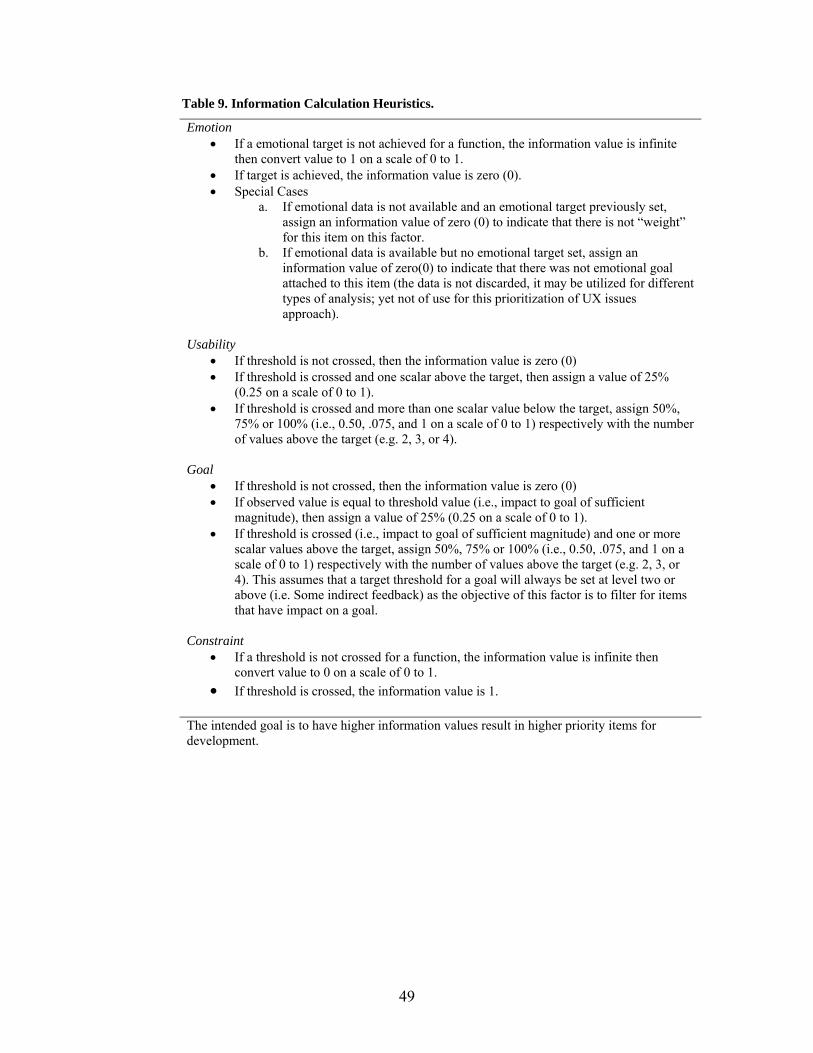
49
Table 9. Information Calculation Heuristics.
Emotion • If a emotional target is not achieved for a function, the information value is infinite
then convert value to 1 on a scale of 0 to 1. • If target is achieved, the information value is zero (0). • Special Cases
a. If emotional data is not available and an emotional target previously set, assign an information value of zero (0) to indicate that there is not “weight” for this item on this factor.
b. If emotional data is available but no emotional target set, assign an information value of zero(0) to indicate that there was not emotional goal attached to this item (the data is not discarded, it may be utilized for different types of analysis; yet not of use for this prioritization of UX issues approach).
Usability
• If threshold is not crossed, then the information value is zero (0) • If threshold is crossed and one scalar above the target, then assign a value of 25%
(0.25 on a scale of 0 to 1). • If threshold is crossed and more than one scalar value below the target, assign 50%,
75% or 100% (i.e., 0.50, .075, and 1 on a scale of 0 to 1) respectively with the number of values above the target (e.g. 2, 3, or 4).
Goal
• If threshold is not crossed, then the information value is zero (0) • If observed value is equal to threshold value (i.e., impact to goal of sufficient
magnitude), then assign a value of 25% (0.25 on a scale of 0 to 1). • If threshold is crossed (i.e., impact to goal of sufficient magnitude) and one or more
scalar values above the target, assign 50%, 75% or 100% (i.e., 0.50, .075, and 1 on a scale of 0 to 1) respectively with the number of values above the target (e.g. 2, 3, or 4). This assumes that a target threshold for a goal will always be set at level two or above (i.e. Some indirect feedback) as the objective of this factor is to filter for items that have impact on a goal.
Constraint
• If a threshold is not crossed for a function, the information value is infinite then convert value to 0 on a scale of 0 to 1.
• If threshold is crossed, the information value is 1.
The intended goal is to have higher information values result in higher priority items for development.
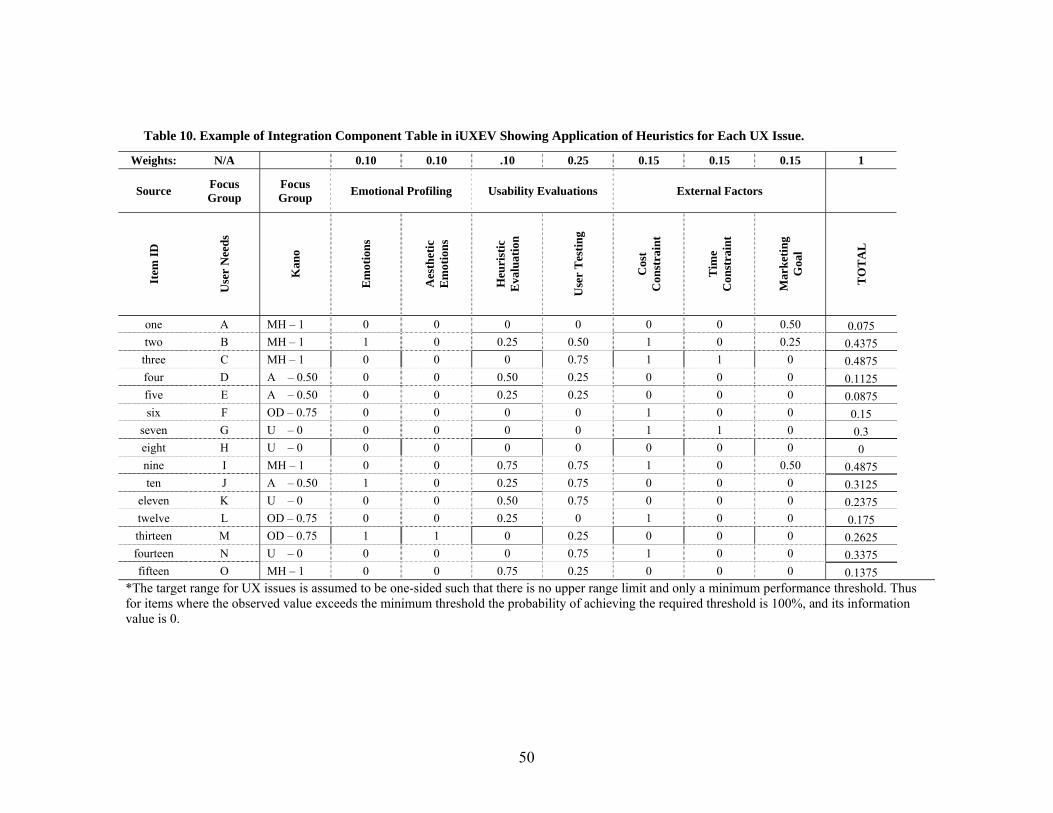
Table 10. Example of Integration Component Table in iUXEV Showing Application of Heuristics for Each UX Issue.
Weights: N/A 0.10 0.10 .10 0.25 0.15 0.15 0.15 1
Source Focus Group
Focus Group Emotional Profiling Usability Evaluations External Factors
Item
ID
Use
r N
eeds
Kan
o
Em
otio
ns
Aes
thet
ic
Em
otio
ns
Heu
rist
ic
Eva
luat
ion
Use
r T
estin
g
Cos
t C
onst
rain
t
Tim
e C
onst
rain
t
Mar
ketin
g G
oal
TO
TA
L
one A MH – 1 0 0 0 0 0 0 0.50 0.075 two B MH – 1 1 0 0.25 0.50 1 0 0.25 0.4375 three C MH – 1 0 0 0 0.75 1 1 0 0.4875 four D A – 0.50 0 0 0.50 0.25 0 0 0 0.1125 five E A – 0.50 0 0 0.25 0.25 0 0 0 0.0875 six F OD – 0.75 0 0 0 0 1 0 0 0.15
seven G U – 0 0 0 0 0 1 1 0 0.3 eight H U – 0 0 0 0 0 0 0 0 0 nine I MH – 1 0 0 0.75 0.75 1 0 0.50 0.4875 ten J A – 0.50 1 0 0.25 0.75 0 0 0 0.3125
eleven K U – 0 0 0 0.50 0.75 0 0 0 0.2375 twelve L OD – 0.75 0 0 0.25 0 1 0 0 0.175 thirteen M OD – 0.75 1 1 0 0.25 0 0 0 0.2625 fourteen N U – 0 0 0 0 0.75 1 0 0 0.3375 fifteen O MH – 1 0 0 0.75 0.25 0 0 0 0.1375
*The target range for UX issues is assumed to be one-sided such that there is no upper range limit and only a minimum performance threshold. Thus for items where the observed value exceeds the minimum threshold the probability of achieving the required threshold is 100%, and its information value is 0.
50
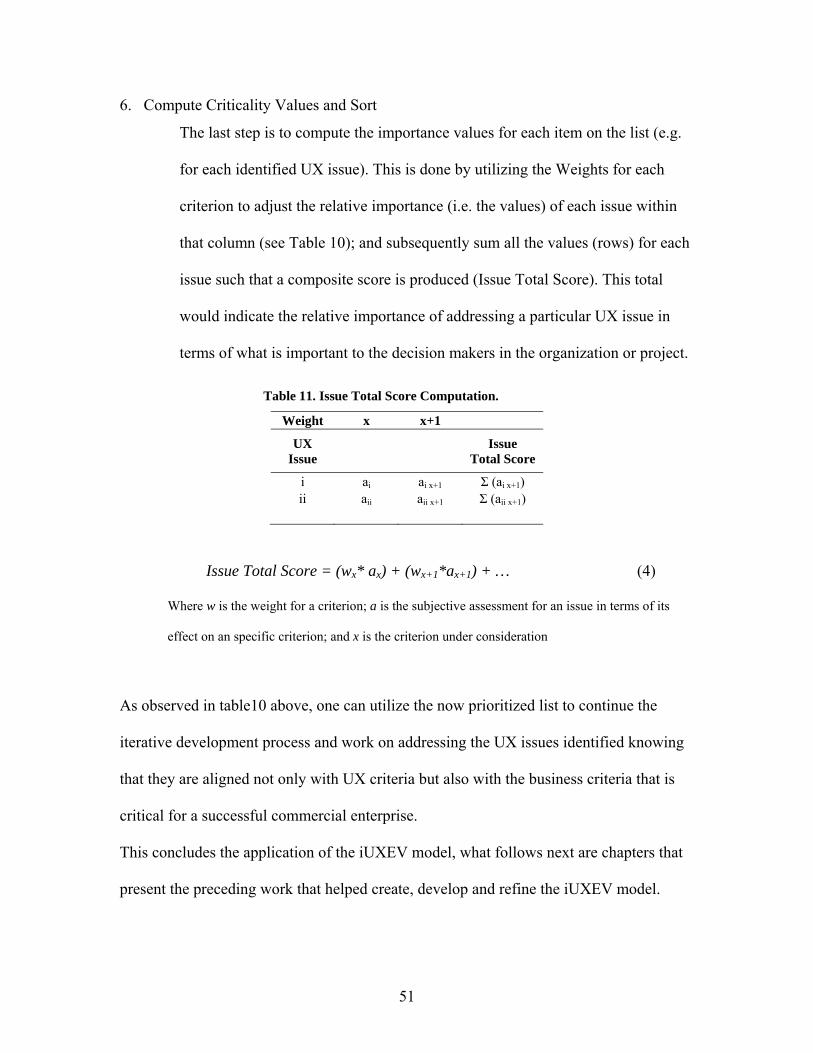
6. Compute Criticality Values and Sort
The last step is to compute the importance values for each item on the list (e.g.
for each identified UX issue). This is done by utilizing the Weights for each
criterion to adjust the relative importance (i.e. the values) of each issue within
that column (see Table 10); and subsequently sum all the values (rows) for each
issue such that a composite score is produced (Issue Total Score). This total
would indicate the relative importance of addressing a particular UX issue in
terms of what is important to the decision makers in the organization or project.
Table 11. Issue Total Score Computation.
Weight x x+1
UX Issue Issue
Total Score
i ai ai x+1 Σ (ai x+1) ii aii aii x+1 Σ (aii x+1)
Issue Total Score = (wx* ax) + (wx+1*ax+1) + … (4)
Where w is the weight for a criterion; a is the subjective assessment for an issue in terms of its
effect on an specific criterion; and x is the criterion under consideration
As observed in table10 above, one can utilize the now prioritized list to continue the
iterative development process and work on addressing the UX issues identified knowing
that they are aligned not only with UX criteria but also with the business criteria that is
critical for a successful commercial enterprise.
This concludes the application of the iUXEV model, what follows next are chapters that
present the preceding work that helped create, develop and refine the iUXEV model.
51
CHAPTER THREE: MULTIPLE CRITERIA DECISION ANALYSIS IN PRACTICE, A USABILITY ENGINEERING CASE STUDY*
Abstract
This chapter discusses the application of a multiple criteria decision analysis approach for
the prioritization of usability issues gathered through a real life project. The chapter
presents a description of the project, the process taken for the application of approach,
and lessons learned from the approach. The lessons learned were applied and helped
develop the integration component of the iUXEV model discussed earlier.
Introduction
During the recent development of an interactive computer application the author
had the opportunity to participate as the lead user-centered design engineer. The scope of
the effort was the study and documentation of the user population of the system, and with
the gained understanding, conduct both a heuristic and user testing evaluation of the
existing system. With the findings of the evaluation an updated version was to be
developed so that the identified usability issues would be resolved.
Background
The Organization. The client in this case was a small software development
company that specializes in optimization software for resource planning and scheduling
that could be described as a recent start-up organization. The company had three main
groups that could be described as an Administration group (Admin), a Client Service
* Paper to be submitted to Usability Professionals' Association 2010 International Conference
52
group (CS), and a Development group (Dev). As their names imply these were their main
scope of tasks and responsibilities, except for the Client Service group which overlapped
with both the Administration and Development groups.
Organization Goals. The company had an established business model for its
product, and was developing this product further in a target market. It had focused its
product for use in facilities maintenance at colleges and universities and had developed a
Quality framework to go along with the deployment of their product at a client’s site.
Nonetheless the Admin and CS groups believed the concept was powerful enough that it
could be integrated into other domains such as the military or the software application
broken apart (the system under evaluation) and its components used for completely
different business models. Such considerations came at the same time the organization
was beginning to organize the development of a second iteration of its system. In addition
they understood the need to integrate a user-centered design approach to their system
given that it had become evident that their clients had difficulties learning and using the
existing version of the system (v1.0).
Development Roles. As the company organized itself to start development of its
second version of the system several development roles were determined. The Admin
group would continue its role as the company’s administration and at the same time
manage and organize the search for additional funding sources such as investors or
grants. The Dev group, which was comprised of a distributed team of software
developers, would focus on transitioning the first version of their system into a more
robust architecture and design while incorporating the latest technologies. At the same
time the Dev team would be integrating the findings of the usability evaluation carried
53
out by the author. The CS group which worked directly and very closely with clients
would have the most diverse roles including: new business developer (i.e. sales and new
applications of company’s technology), funding source briefs, end-user advocate, client
consultant, technical support, instructors (of both system use and Quality program),
developer of system requirement and specifications, and user acceptance. The author
worked within the CS group as they had the most interaction with end-users and
possessed the most knowledge on the system’s capabilities and organizational goals.
The Challenge. The author worked throughout the development of both versions
two (v2.0) and three (v3.0) of the client’s system during which it was necessary to
incorporate usability evaluation findings into the development process. One challenge
faced by the company was the difficulty in prioritizing its development efforts given that
they had various business goals which they wanted to achieve and often competed for
resources. As such, development efforts for the redesigns often competed with requests
for resolution of usability shortcomings or the requests for new features. In order to
address this challenge it was necessary to approach it in a systematic way such that the
CS group could guide and prioritize the ongoing development effort. For this a
comprehensive “Wish List” was compiled, in it were listed usability shortcomings, new
features and functionalities identified by the CS group and the author, new capabilities
desired by the Admin and Dev group, and end-user requests.
Method
Approach. As the development project progressed new features, functionalities,
and the general development would change priorities based on the latest most important
or promising opportunity. There was no objective approach for prioritizing or
54
determining the most value for the dollar, nor any kind of alignment of the development
effort with the multitude of needs and objectives. Acting as an internal consultant to the
organization the author suggested using a multi criteria decision making approach.
Nonetheless this would require the participation of representatives from the different
groups in the organization. The CS group accepted the approach with some skepticism,
although was open to try new methods. The approach started with the creation of a list of
criteria and goals important to the organization. One representative of the CS group
participated in this, and created a list of several items the organization wanted to keep in
mind to guide the development efforts. These items ranged from general usability goals,
to the support of promising business opportunities (e.g. support X business model),
prospective customers (e.g. support Universities, Military, etc.), and support new more
adaptable web technologies (e.g. move from Java to web version). This list was then
rated in terms of importance using a pairwise comparison approach. The CS group
representative was asked to do pair wise comparisons among the items and determine
their relative importance to one another (e.g. X is twice as important as Y). The scores
were then normalized so that they would all add to one (1). Then this was assembled into
a table with the “Wish List” so that every item in the list could be rated against each goal
and criteria. Given that some goals or criteria were relevant to other groups those were
asked to be rated by relevant representatives (e.g. development time and cost would be
rated by the Dev group). The list was rated using a 5-point Likert scale, and in terms of
the goals, it was completed by answering the following question: “How does addressing
this item supports this goal?”
55
Findings
The process was time consuming and was completed by the CS group
representative with assistance of the author in roughly two afternoon sessions. The
criteria requiring the input for the Dev group proved more challenging. That group was
very busy with the development, and believed this was a distraction and in addition had
difficulty understanding how to do it, and what purpose it would have. One factor that
made the application of this methodology increasingly difficult was the fact that the Dev
group was in a different location (a different state). Nonetheless the need and process was
explained to the Dev group, while the CS group advocated the method and assured the
Dev group of the validity and value of the approach. After roughly two weeks the list was
returned merged with the existing ratings. The items were then added using the weights
for each criteria to obtain an “Importance” score for each item. This led to a prioritized
list of items that was aligned with the organizations goals and objectives.
Lessons Learned
The use of multi-criteria approaches is time consuming and so it is important to
assure those using it of its value and importance. Given this, some resistance should be
expected, and buy in from decision makers is critical for others to be more receptive to
the approach. Once the method has been applied, it is equally important that the result of
it be applied. It is key that buy in is followed by a commitment to use, such that those
participating in the method are held accountable so that the results are used and not
ignored. In the case study, the list was followed to some degree, nonetheless given that
they were a small and start up organization with changing needs new goals and criteria
kept coming up thus rendering the list less valuable with time. Further revisions to the list
56
were made with more difficulty given the time commitment required to produce and edit
it, such that the approach was eventually abandoned once the method’s advocate left the
group (i.e. the author’s tenure in the project). These challenges illustrate the difficulty of
using approaches that may be perhaps more quantitatively superior but that require more
effort. Individuals pressured by the needs of a business may not have the time or interest
in pursuing quantitative correctness or perfection, but may be more interested in usable
guidance that allows them the ability to make better decisions. For this reason a
simplified approach of the AHP is considered for iUXEV.
57
CHAPTER FOUR: USING EMOTIONS IN USABILITY∗
Abstract
Emotions are evermore present in discussions of product design and are becoming
part of a usability practitioner’s repertoire of evaluation criteria. Nonetheless, emotions in
design are far more than simply using satisfaction and frustration as criteria, noting how
pleasant or unpleasant a product is, or listing a number of emotions elicited during an
evaluation. Evaluating the emotional impact of a user interaction as part of a usability
evaluation requires that emotions be adequately assessed and, most importantly,
interpreted to identify their source. This article aims to present a method and process of
Emotional Profiling to show how emotions may be utilized to aid usability professionals
in further understanding the emotional reactions to human-system interactions, thereby
identifying factors that enhance or detract from the user experience.
Introduction
A traditional and recently evermore emphasized component of usability is the
emotional component of interaction experiences. The recent movement attempts to
understand and use affective criteria in the design and evaluation of products and their
experiences (c.f. Norman, 2004; Desmet, 2002, Helander & Khalid, 2006). While some
claim this component has been ignored until recently (c.f. Norman, 2004; Hedonomics,
Helander ,& Tham, 2003), it has commonly been a part of usability through the
∗ Champney, R.K. and Stanney, K.M. (2007). Using Emotions in Usability. Proceedings of the Human Factors and Ergonomics Society 51st Annual Meeting. Baltimore, Maryland, October 1-5.
58

assessment of satisfaction and frustration (e.g. Preece, Rogers, & Sharp, 2002; Mayhew,
1999).). Nonetheless these emotional criteria and measurements have not been applied
adequately. To begin, there are far greater numbers of emotions representational of
interaction experiences than satisfaction and frustration. Furthermore traditional methods
simply use emotions as a performance criterion attached to a particular task or overall
satisfaction with a product, and ignore the more subjective, yet diagnostic, subtleties of
non-performance oriented components of an experience (i.e. what meaning is behind
each emotion and how this relates to the product under evaluation). Further using such
simplistic emotional assessment techniques ignores the existence of mixed emotions
(Desmet, 2002; Ortony, Clore, & Collins,1988) and the power offered by the elicitation
process of emotions (i.e., the appraisal process, Arnold, 1960). Thus leaving a void in
how interaction experiences are emotionally defined and understood. This article aims to
present a method and process of Emotional Profiling to show how emotions may be
utilized to aid usability professionals in further understanding the emotional reactions to
human-system interactions, thereby identifying factors that enhance or detract from the
user experience.
Review
Defining Affect
Given the common interchangeability of terms it is important to define the
“affect” constructs. There are four types of affective phenomena: Moods, Affective
Styles, Sentiments, and Emotions (Davidson, Scherer, & Goldsmith, 2003). Moods are
subtle affective states with low intensity and long duration (Davidson, et. al., 2003;
Ekman, 1994), and are characterized by their non-intentional nature (Frijda, 1994) (e.g.,
59

not directed at a particular item or event, etc.). They provide the “emotional color” to all
one does (Davidson, 1994). Affective Styles refer to relatively longer lasting dispositions
that bias response to stimuli (Davidson, et. al., 2003). They are early consistent individual
differences that modulate emotional reactions to stimuli (Davidson, 1992; 1994).
Sentiments are long lasting predispositions towards identifiable stimuli (Petty, Fabrigar,
& Wegener, 2003). Emotions are defined as brief episodes of coordinated changes (brain,
autonomic, and behavioral) to facilitate a reaction to a significant event. In addition,
emotions are targeted and involve a relationship between the individual experiencing the
emotion and the object of the emotion (Frijda, 1993; 1994) (e.g., one is angry at…). The
primary objective of emotions has been suggested to be “to modulate or bias action” and
they are generally associated with precipitated events that are perceived as occurring
rapidly (Davidson, 1994). Furthermore they are said to last for very brief episodes, from
seconds to minutes (Ekman, 1994).
Of the four affective phenomena described above, only sentiments and emotions
are within modulating reach of the designer given their intentional nature. While
sentiments are commonly used (e.g., Consumer Sentiment) and insightful, they are one-
dimensional (i.e., either positive or negative) and lack the diagnosticity afforded by
emotions. Emotions are diagnostic given that they are acute (i.e., short lasting),
intentional, and their elicitation process involves an appraisal (i.e., an evaluation).
Emotions are the result of a process of appraisal (Arnold, 1960) in which a stimulus and
evaluation criteria, the latter of which are directed by the current state of an individual
(i.e., their current concerns), come together to produce a non-deliberate, “direct,
immediate, nonreflective, nonintellectual, [and] automatic” (Arnold, 1960, p. 174)
60

evaluation of a stimulus with regard to the self (e.g., is it beneficial or not?; Cornelius,
2000). In this regard it is believed that emotion and thought are inseparable. This process
of appraisal, in which individual characteristics come into play, is the source of the vast
array of emotional responses possible by a single stimulus. Thus the same stimulus may
result in an unpredictable array of emotions among different individuals. Yet though
structured inquiry it may be possible to understand the nature behind a felt emotion, and
potentially predict the possibility of observing one. In essence, if one understands how an
individual conceptualizes a situation then one may be able to predict the potential for
observing a particular emotion (Ortony, Clore, & Collins, 1988).
Measuring Emotions
As noted earlier, affective criteria have been pursued in the design and evaluation
of products; nonetheless this has been proven a difficult challenge given the difficulty in
measuring affect and emotions. While there is no one definition of emotion (Plutchik,
1980), emotions are generally thought to be multi-component phenomena experienced by
individuals, having behavioral reactions, expressive reactions, physiological reactions,
and subjective feelings (Desmet, 2002). Nonetheless one could define emotions as brief
episodes of coordinated changes (brain, autonomic, and behavioral) to facilitate a
reaction to a significant event that lasts for very brief episodes, from seconds to minutes
(Ekman, 1994). As such emotions may be measured by evidence of those reactions
outlined above, and attributed to a stimulus present during the event (i.e., emotion
measurement methodologies can assess these four reactive emotion components, thereby
identifying what the individual is feeling by capturing “the subjective representation of
emotions,” Scherer & Peper , 2001). Each of these four (4) principal methods for
61
measuring emotions will now be discussed, including their unique values and
weaknesses.
Behavioral Reactions, while no specific methods are reported in the literature,
there is documented literature of non-verbal behavior associated with emotions (c.f.
Guyton, 1996: 758-59). Nonetheless the ability to recognize non-verbal behavior requires
significant expertise, and furthermore these behaviors may be modulated by cultural
display rules. Desmet (2002) discussed just how difficult understanding behaviors may
be, when he reported on the subtle differences between Japanese and Dutch actors
displaying “disappointment.” In his report he observed how the lack of a simple “feature”
of looking away from a source of disappointment made the expression-behavior executed
by Dutch participants incomprehensible to Japanese test participants.
Expressive Reactions include facial and voice expressions that can be used to
discriminate between emotions. Facial expression assessment methods are based on the
assumption that key facial expressions can be linked to specific emotions (see the Facial
Action Coding System [FACS], Ekman, Wallace, Friesen, & Hager 2002). They are
valuable in that they offer the opportunity to identify what an individual is feeling though
observational changes in their face. While promising, they have several limitations: they
are limited to a small subgroup of basic emotions (e.g., happiness, surprise, fear, anger);
automated methods can only discriminate prototypal emotions, while in real life
prototypes are not the norm; they cannot identify mixed emotions, and they cannot
identify non-prototypical emotions like boredom or frustration (Kapoor, Qi, & Picard,
2003). Vocal expression methods attempt to identify emotional states based on vocal
patterns in voice (e.g., energy, utterances, pitch dynamics, etc.). Compared to facial
62
expression these methods have been studied less and have recognition performances
comparable but lower than facial methods (Johnstone, van Reekum, Hird, Kirsner &
Scherer, 2005). The benefits of these methods are similar to those of the facial expression
methodologies; in addition, they have the capability to be recognized across cultures as
many of the vocal changes are due to physiological arousal; they may be measured
without disturbing the individual, and some are commercially available (e.g., TrusterTM
Personal Lie Detector by Advantage UpGrade). Some disadvantages of these methods are
limitations in accuracy performance (e.g., 72% for TrusterTM as reported in field studies;
and 70% recognition by expert judges – Johnstone, Banse, & Scherer, 2006); they are
limited to a small group of emotions; they may require expert judges for emotions not yet
automated, and automated versions require trained interpretation.
Physiological Reactions may also be used to identify emotions by noting
autonomic bodily changes that accompany emotions and are the result of changes in the
autonomic nervous system (Levenson, 1992). These may include a variety of
physiological data sources like blood pressure, skin conductivity, pupil size, brain waves,
heart rates, etc. The benefits of such methods derive from instantaneous measurements of
changes that are out of the control of the individual, thus granting them a high degree of
association between stimulus and affect. They are also non-interruptive, as they do not
require the individual to be disturbed or distracted to probe for emotional state. On the
other hand they are limited to a small number of basic emotions; require expert analysis
for interpretation; cannot assess mixed emotions; may be prone to unrelated noise; and
may require complex apparatus for assessment. One key limitation of physiological
measures is their non-specificity, that is, that there may be no particular specific pattern
63
of bodily change that correlates with particular emotions, but that rather the changes in
bodily activity in a particular direction represent a given emotion (Levenson, 1992;
Desmet 2002).
Subjective Feelings are probably the most accessible method for assessing
emotions as they rely on the conscious awareness by individuals of their affective state
and are communicated through self-report. Their strengths are derived from the ease of
administering self-report assessments; requiring at times nothing more than verbal
answers or pen-and-paper. Some are even able to assess mixed emotions (Lang, 1980;
Desmet 2002). Nonetheless they do have limitations. They are disruptive to the
task/experience being assessed and rely on individuals’ memory and ability to express
their emotions. Verbal instruments, in particular, are plagued by the ability of individuals
to verbalize their emotions, and have limitations in translation across cultures. Like all
subjective assessment methods, they rely on the honesty of individuals’ reports, although
Fischer (2004) has reported physiological-subjective correlations between self-report and
brain imagery.
Of these four methods of measuring emotions, the subjective method is the most
accessible and readily available to most practitioners. This is the chosen method for this
work, for which a subjective non-verbal emotional questionnaire was created in an effort
to derive emotional profiles resulting from human-system interactions.
Emotional Profiling (EP)
The Subjective Emotional Questionnaire
There are existing subjective instruments to measure emotions; some of which
focus on more general affective dimensions (e.g., pleasantness, arousal; c.f. Stayman &
64
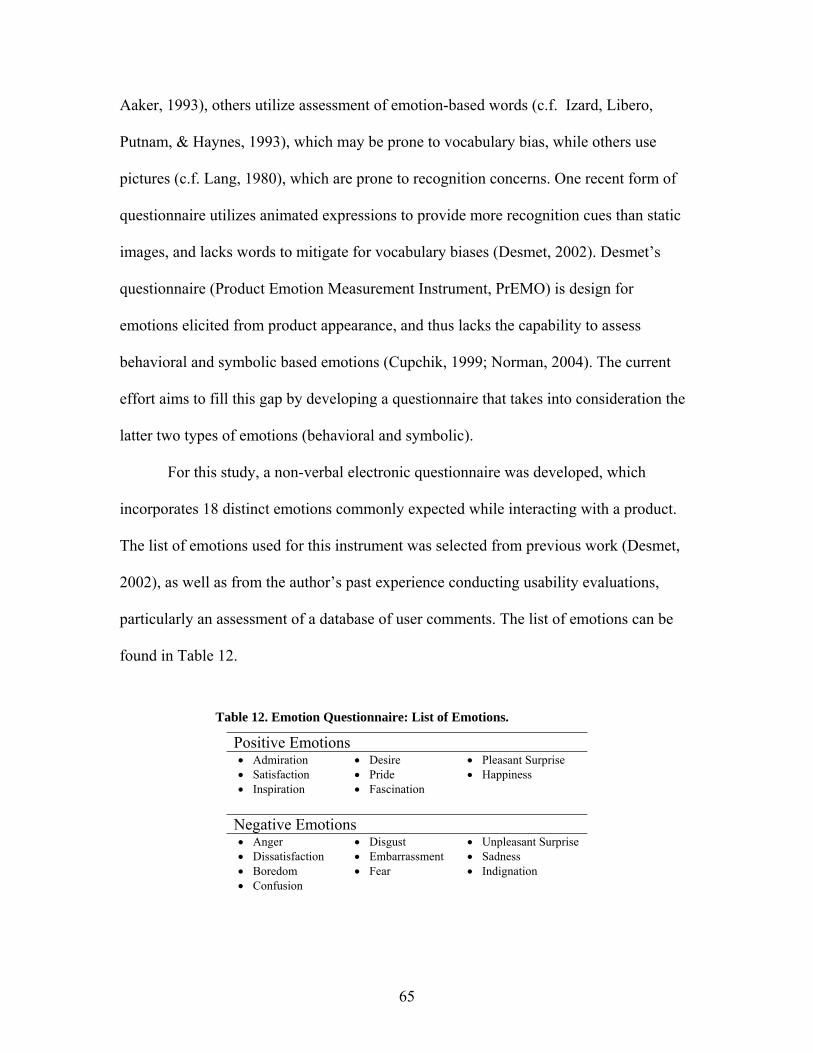
Aaker, 1993), others utilize assessment of emotion-based words (c.f. Izard, Libero,
Putnam, & Haynes, 1993), which may be prone to vocabulary bias, while others use
pictures (c.f. Lang, 1980), which are prone to recognition concerns. One recent form of
questionnaire utilizes animated expressions to provide more recognition cues than static
images, and lacks words to mitigate for vocabulary biases (Desmet, 2002). Desmet’s
questionnaire (Product Emotion Measurement Instrument, PrEMO) is design for
emotions elicited from product appearance, and thus lacks the capability to assess
behavioral and symbolic based emotions (Cupchik, 1999; Norman, 2004). The current
effort aims to fill this gap by developing a questionnaire that takes into consideration the
latter two types of emotions (behavioral and symbolic).
For this study, a non-verbal electronic questionnaire was developed, which
incorporates 18 distinct emotions commonly expected while interacting with a product.
The list of emotions used for this instrument was selected from previous work (Desmet,
2002), as well as from the author’s past experience conducting usability evaluations,
particularly an assessment of a database of user comments. The list of emotions can be
found in Table 12.
Table 12. Emotion Questionnaire: List of Emotions.
Positive Emotions • Admiration • Desire • Pleasant Surprise • Satisfaction • Pride • Happiness • Inspiration • Fascination
Negative Emotions • Anger • Disgust • Unpleasant Surprise • Dissatisfaction • Embarrassment • Sadness • Boredom • Fear • Indignation • Confusion
65
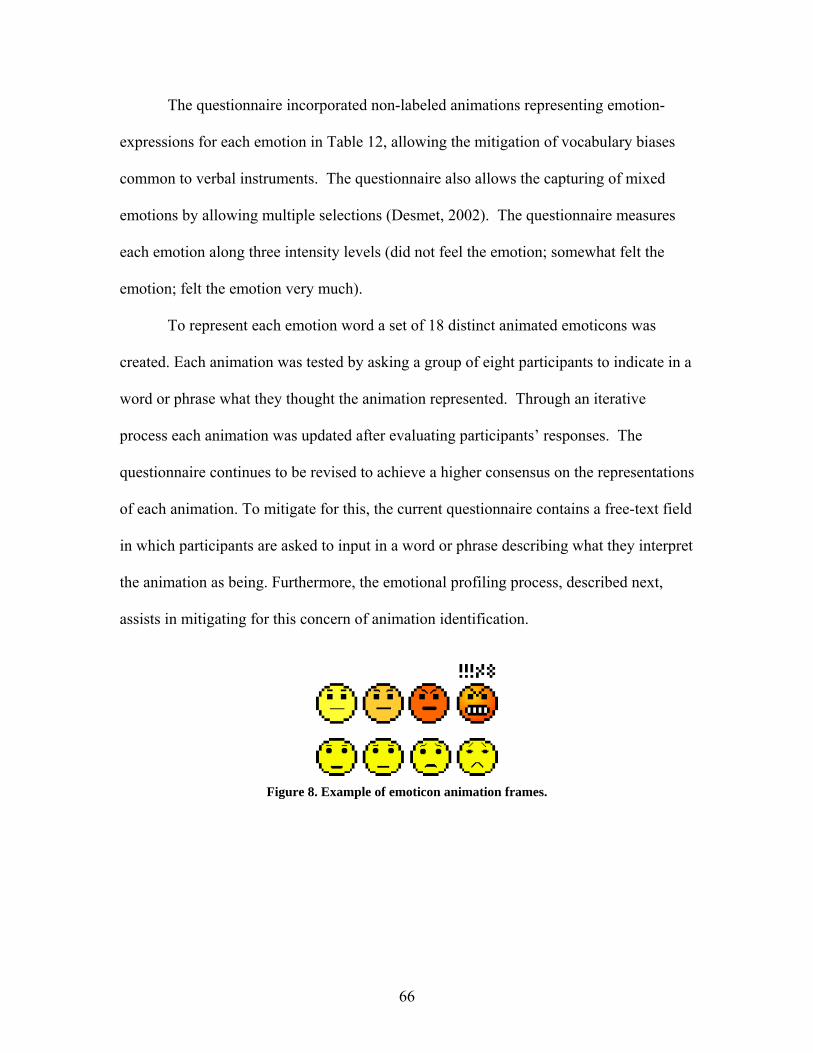
The questionnaire incorporated non-labeled animations representing emotion-
expressions for each emotion in Table 12, allowing the mitigation of vocabulary biases
common to verbal instruments. The questionnaire also allows the capturing of mixed
emotions by allowing multiple selections (Desmet, 2002). The questionnaire measures
each emotion along three intensity levels (did not feel the emotion; somewhat felt the
emotion; felt the emotion very much).
To represent each emotion word a set of 18 distinct animated emoticons was
created. Each animation was tested by asking a group of eight participants to indicate in a
word or phrase what they thought the animation represented. Through an iterative
process each animation was updated after evaluating participants’ responses. The
questionnaire continues to be revised to achieve a higher consensus on the representations
of each animation. To mitigate for this, the current questionnaire contains a free-text field
in which participants are asked to input in a word or phrase describing what they interpret
the animation as being. Furthermore, the emotional profiling process, described next,
assists in mitigating for this concern of animation identification.
Figure 8. Example of emoticon animation frames.
66
Performing Emotional Profiling
The Emotional Profiling (EP) process herein presented is based on the emotion
elicitation process of appraisal (Arnold, 1960). As such it considers that emotions are
elicited as a result of an evaluation in which a stimulus, evaluation criteria, and the
current state of an individual come together to produce a response (the emotion). Thus for
every emotion there should be a specific source of elicitation, which in terms of a
usability evaluation would correspond to a component of the product under evaluation
and its experience.
The proposed EP process involves three steps: 1) interaction, 2) emotion
assessment, and 3) appraisal inquiry. The interaction is part of the traditional usability
evaluation process in which a user is asked to interact with a product in a contextually-
based task. The emotion assessment takes places immediately after the interaction, and
utilizes the emotion questionnaire to note the elicited emotions. The final step is the
appraisal inquiry, which is an open-ended short interview in which the usability
practitioner inquires about those noted emotions in the questionnaire. This is done by first
asking the participant to describe the selection of each emotion animation with a question
such as “You indicated that you felt like this. Please tell me about what happened during
your interaction that caused you to feel this way.” This form of inquiry results in an
account of the events that resulted in the person feeling a particular way. This is followed
by an inquiry into the interpretation of the animation by asking the participant to describe
what he/she believes the animation represents. This information is then analyzed by the
experimenter for classification to minimize the potential for misinterpretation and to
ensure that each participant’s description of their feeling matches the semantic
67
interpretation of the selected animation. For example, an individual may describe a
feeling as “I would like to have this product,” which would then be interpreted as the
emotion Desire by the experimenter. Information gathered through this process results in
the construction of an Emotional Profile.
Emotional Profiling Outcomes
During emotional profiling, the outcome of the questionnaire and short interview
are used to develop a multi-axis representation of the emotions experienced by an
individual during interaction with a product. These representations include: a Graphical
Emotional Profile (GEP) and an Emotion Appraisal Profile (EAP).
The GEP as illustrated in Figure 13, which shows the distribution of emotions and
their intensity for the queried experience. The GEP allows one to understand the general
distribution across positive versus negative emotions and visualize those emotions having
the highest intensity. This information can then be used to target further inquiry into the
largest drivers of positive and negative emotions and prioritize redesigns with the aid of
the EAP.
The EAP contains a list of appraisal descriptions and statements recorded during
the short interviews, which highlights the sources of the reported emotions. This is of key
importance, as the emotion list alone does not portray a usable output for a diagnostic
evaluation to direct redesign. In conjunction with the GEP, the EAP allows one to
identify the key drivers of the most intense or experienced emotions, as well as target the
sources of both negative and positive emotions.
68
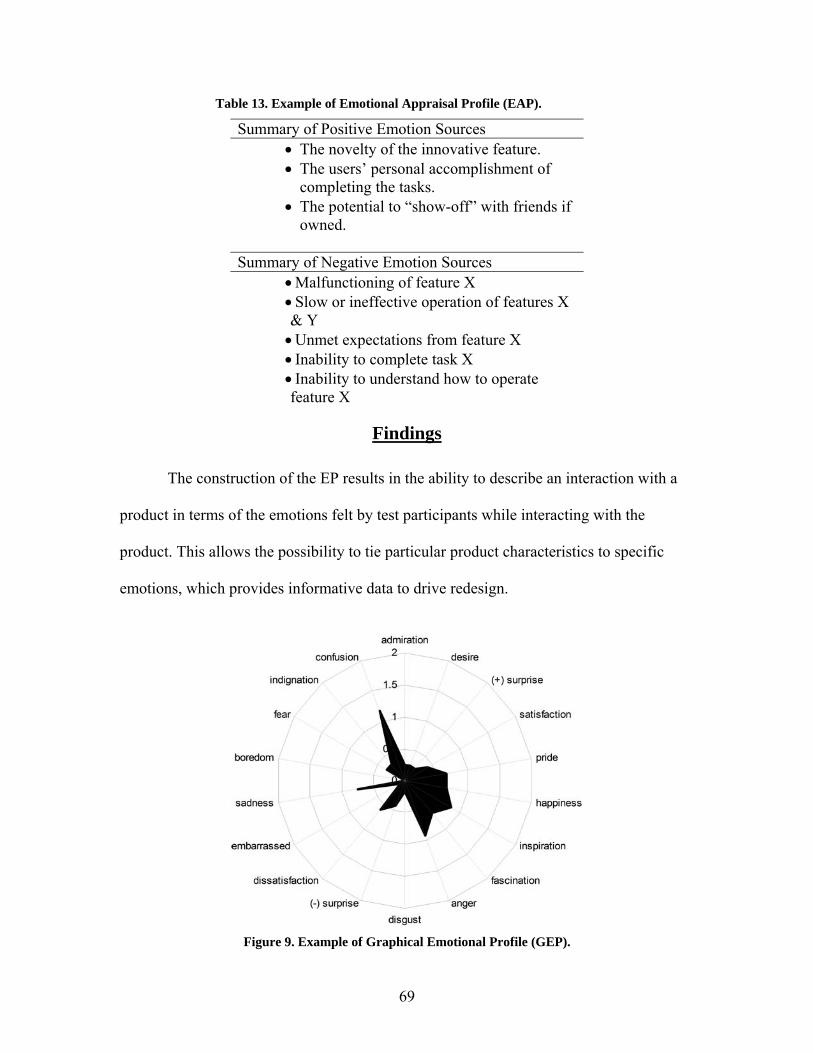
Table 13. Example of Emotional Appraisal Profile (EAP).
Summary of Positive Emotion Sources • The novelty of the innovative feature. • The users’ personal accomplishment of
completing the tasks. • The potential to “show-off” with friends if
owned. Summary of Negative Emotion Sources
• Malfunctioning of feature X • Slow or ineffective operation of features X & Y • Unmet expectations from feature X • Inability to complete task X • Inability to understand how to operate feature X
Findings
The construction of the EP results in the ability to describe an interaction with a
product in terms of the emotions felt by test participants while interacting with the
product. This allows the possibility to tie particular product characteristics to specific
emotions, which provides informative data to drive redesign.
Figure 9. Example of Graphical Emotional Profile (GEP).
69

During testing of this process and the current emotion questionnaire the following
findings were observed, which may be of significant help for usability practitioners
wishing to use assessments of emotions in their evaluations.
• Similar to previous findings, it was observed that individuals are able to relate their
feelings to an animation without the need to conceptualize an emotion word (Desmet,
2002). This was observed when several individuals could correctly describe what a
particular animation represented, yet could not provide an emotion word to depict the
animation when the experimenter inquired.
• Emotion measuring instruments should allow for mixed emotions to be measured.
During testing of the EP process it was observed that all participants reported several
emotions from the same interaction.
• Identifying the source of an emotion is key for diagnosticity. A list of emotions offers
modest benefit for redesign; a diagnosis for the elicitation of each emotion is
imperative to assist designers in evaluating how to enhance a product (i.e., to offer
guidance for redesign).
• Questionnaires and interviews should be administered as close as possible to the
product interaction experience to mitigate for memory decay or intrusions.
• To reduce the risk of leading participants, allow them to describe their experience
before prompting for more details to understand the source of the appraisal.
• Expect users to use non-emotion words (e.g., “I felt like, I want it!” - interpreted as
Desire) or gestures (e.g., putting finger inside open mouth to indicate Disgust), some
interpretation is undoubtedly required.
70

Discussion
The Emotional Profiling (EP) process discussed herein offers usability
practitioners the ability to objectively utilize motions in their evaluations and not leave to
chance the emotional signature one’s products may have. While the emotional
questionnaire used to evaluate the Emotional Profiling process discussed here is still in
development, the practitioner may choose to use other questionnaires and expect to
utilize the EP process described here.
Furthermore, the findings collected thus far do show promise. This is because,
even during instances where the animations were misinterpreted by participants, the
description of the experience obtained during the post-interview was sufficient for the
experimenter to find a suitable emotion word to describe it, and thus categorize it
appropriately. Further, identifying which product characteristics produced which specific
emotions and with what intensity has proven valuable in assisting in the prioritization of
redesign efforts following evaluations. This is due to the transformation of the subjective
emotion construct into a directional objective intensity rating attached to a particular
product characteristic. Furthermore, the description of an experience associated with a
product’s performance assists in the interpretation of what level of performance is good
enough. Emotions provide an almost universal language with which a designer/developer
may empathize with what a user is feeling about a product’s current performance, and
thus adjust the design to enhance or resolve this feeling.
Further study is needed and is ongoing in the development of the EP process,
including further refinement of the emotion questionnaire and appraisal inquiry. For
instance, the choice of emotions included in the questionnaire is under further review.
71
Yet this is a challenging task, as formal studies of emotion words have estimated there
are large numbers of emotions (e.g., 347 as reported by Desmet, 2002; 655 as reported by
Aaker, Douglas & Vezina, 1988; 97, Richins, 1997), and the choice for which ones are
included vs excluded is not a trivial task. This review of emotions will be followed by
refinement of the animations to achieve higher reliability ratings and validation with
different types of products.
72
CHAPTER FIVE: AUGMENTING THE TRADITIONAL
APPROACH TO USABILITY: THREE TOOLS TO BRING
THE USER BACK INTO THE PROCESS*
Abstract
A primary goal of the usability evaluation process is to create interfaces that can
be seamlessly integrated into current processes and create an enjoyable experience for the
user. Given this, it is critical to capture user input to effectively drive product
development and redesign. While many methods are available to usability practitioners,
this paper highlights three techniques that can be used to substantially enhance usability
evaluation output. Specifically this paper presents a method to utilize focus groups,
emotional profiling and Kano analysis methods in combination to define user needs,
expectations, and desires, provide an explanation of why features of a product are liked or
disliked, as well as add additional structure to the prioritization of usability shortcomings
and related redesign recommendations. A background on each method, the process for
implementing them into usability analyses, and guidelines for successful use are provided
for usability practitioners.
Introduction
The process of usability evaluation aims to optimize human-system interfaces by
ensuring systems are easy, effective, and enjoyable to use. Several objectives are targeted
* Jones, L.D., Champney, R.K. Axelsson, P., Hale, K. (2007). Augmenting the Traditional Approach to Usability: Three Tools to Bring the User Back Into the Process. Proceedings of the Human Factors and Ergonomics Society 51st Annual Meeting. Baltimore, Maryland, October 1-5.
73
in usability evaluations, including (1) requirements analysis, (2)
designing/testing/development, and (3) installation (Mayhew, 1999). To meet each of
these objectives, usability practitioners have a variety of tools and methods to select from
(Mayhew, 1999; Nielsen & Mack, 1994; Preece, Rogers, & Sharp, 2002). The methods
selected are often adapted to suit the scope of evaluation based on, for example, system
complexity, duration of effort, and/or resources available.
During a recent usability analysis of next-generation prototype products, the
authors adopted seven specific methods to include in the evaluation: contextual task
analysis, user profiling, focus groups, heuristic evaluations, user testing, Kano modeling,
and emotional profiling. This paper details three of these methods (focus groups, Kano
modeling, and emotional profiling) that are less commonly utilized together, yet have
significant advantages in enhancing the usability analysis process and outcomes,
particularly for next-generation products. Specific guidelines that outline how these
methods may be integrated into a usability evaluation are provided for practitioners who
are interested in adopting these methods into future analyses.
Integrating Additional Metrics
Focus groups, Kano modeling, and emotional profiling each contribute uniquely
to the goals of a usability analysis, particularly in terms of defining user needs,
expectations, and desires, providing an explanation of why certain features of a product
are liked or disliked, and adding additional structure to the prioritization of usability
shortcomings and related redesign recommendations. Focus groups should be integrated
early in the usability evaluation path to capture targeted users’ needs, desires, and
expectations, particularly for next-generation product concepts. During focus groups,
74
whenever possible, participants should also be able to interact with prototypes, and given
the opportunity to provide their informal evaluation of similar products, which helps to
drive the development of Kano modeling and emotional profiling tools. Both Kano
modeling and emotional profiling can be included in user testing sessions to provide
insight into users’ likes and dislikes of various product features and emotions tied to
product interaction. Output from these methods can be used to prioritize criticality of
usability shortcomings. For example, issues related to features that were deemed
‘necessary’ for the product, yet resulted in negative emotions and poor performance
during user testing are ranked higher priority than issues related to ‘neutral’ features with
positive emotions and adequate performance outcomes. A practitioner’s description of
the methods and guidelines developed from lessons learned during this effort and its
preceding research is presented below.
Focus Groups
Focus groups have traditionally been used as a qualitative method to learn about
customer responses to current and potential products and services. According to Katz and
Williams (2001), the earliest focus group appeared in 1926 where small discussion
groups with schoolboys were used to test a social distance theory. Thereafter, focus
groups have been widely used by social scientists for behavioral research and marketing
investigators to determine new trends and gather feedback on existing and new products
and services. The wide adoption of focus groups in product development may be
attributed to their ability to obtain effective qualitative data from potential or actual
customers with little cost or effort. In human factors, usability, and ergonomics, the
primary purpose of this tool is to capture user needs, desires, and expectations, which
75
provide guidance to designers to ensure compliance with those needs during product or
service development.
The benefits to integrating focus groups into usability evaluations stem from the
following:
− Group setting- The primary benefit over other interview techniques is that members
can build on the feedback of others, potentially leading to more valuable and
innovative ideas. In addition, being part of a group may provide a feeling of security,
which could lead to participants sharing comments that would not be expressed in
isolation.
− Exploration and clarification of answers- Unlike questionnaires, the moderator can
use follow-up questions to gather in-depth explanations of an individual’s answer and
ensure accurate interpretation of comments.
− Face to face interaction- Interacting with users face to face encourages members to
take part in the discussion. It also allows the moderator to capture and react to
important facial and body expression.
− Easily understood outcomes- The outcomes of focus groups can be used to
communicate the importance of requirements to non-analytical design team members
since it is in common language as opposed to complex statistical summaries, charts or
graphs.
Although the advantages described above demonstrate the utility of focus groups,
the following points must be considered when utilizing this methodology:
76
− Discussion control- Group discussions have the potential to drift away from the
initial subject if not effectively guided.
− Dominant group members- The strength of group discussion is based on the
diversity of opinions from group members (Nielsen, 1997). Given this, it is essential
that discussions are guided to ensure that dominant group members do not lead to
skewed data from the session
Running focus groups. To effectively run a focus group, a moderator and session
recorder are required. Discussion topics and research questions are identified based on
the client’s and usability team’s (if different entities) goals, and used to develop a script
for the moderator to follow when conducting the session. Typically, the script should
include 5 main questions and associated sub-questions., yet should be highly flexible, as
the moderator should be able to divert from it based on the progress of the session and the
input provided. Focus groups are generally conducted with five to twelve individuals
selected based on a set of demographics that define the targeted user population. During
the session, the moderator guides this group using the script created while ensuring that
they don’t lead the group to conclusions. Once the focus group is complete, results are
compiled and summarized into guidance for the development of user testing scenarios
and, metrics.
Focus group outcomes. Although the outcomes from focus groups are qualitative,
once compiled and summarized, they can provide a breadth of information to drive all
stages of evaluation. Specifically, the outcomes of focus groups can provide initial
insights on users’ needs and expectations, tasks and behaviors related to interface under
investigation, and common errors experienced by users, which, along with a heuristic
77
analysis, may be used to determine critical user testing tasks and metrics to evaluate
products. Focus groups can also capture users’ impressions of features and attributes that
are of value to the product under development, which can in turn be integrated into a tool
to more quantitatively evaluate the impression of the product (see Kano analysis and
Emotional Profiling sections below). Additional outcomes include suggestions, opinions
and initial priorities on redesigns and new design concepts. (Langford & McDonagh,
2003).
Focus group guidelines. In order to efficiently conduct a focus group and obtain
maximum benefits from the outcome, the following guidelines are suggested:
• Ensure moderator is unbiased, knowledgeable about the topic, and experienced in
guiding groups to ensure the discussion remains on topic and avoids bias effects
caused by highly outspoken participants.
o When possible, use a third party moderator and post data processing analyst to
avoid biased outcomes.
• Avoid leading questions (e.g. “wouldn’t you like it if this product had X feature”)
• Use a diverse mix of individuals within the targeted user groups to ensure
representative data.
78

Table 14. Focus Group Method and Outcome.
Group interview methodology focused on obtaining qualitative data used to drive multiple stages of the usability evaluation process. Requirements Unbiased and knowledgeable moderator Session recorder 5-12 participants for 1-3 hours Outcomes User needs and expectations of targeted interface User testing guidance (e.g., use cases and metrics) Kano analysis guidance (e.g., list of design features with associated criticality) Emotional profiling guidance (e.g., list of design features to target during profiling session)
Emotional Profiling
Capturing user emotions during the design and evaluation of products is an
increasingly present practice, with the goal of understanding the affective experience
associated with a product (c.f. Norman, 2004; Desmet, 2002, Helander & Khalid, 2006).
Earlier work has focused on sentiments (c.f. Likert, 1932), or more general affective
dimensions (e.g. pleasantness, arousal; Stayman and Aaker, 1993) while more recent
efforts have focused on emotions (cf. Richins, 1997; Desmet, 2002). Given the common
interchangeability of terms, Davidson, Scherer, and Goldsmith (2003) defined underlying
affective phenomena as: Moods, Affective Styles, Sentiments, and Emotions. Of these,
only sentiments and emotions can be affected by designers because of their intentional
nature. While sentiments are commonly evaluated (e.g. Consumer Sentiment) and
insightful, they are one-dimensional (i.e. either positive or negative) and lack the
diagnostic capability afforded by emotions. Emotions are diagnostic given that they are
acute (i.e. short lasting), intentional, and their elicitation process involves an appraisal
(i.e. an evaluation). Emotions are the result of a process in which a stimulus, evaluation
79
criteria, and the current state of an individual come together to produce an assessment of
the stimulus with regards to self (e.g. is it beneficial or not; Cornelius, 2000). In this
regard, it is believed that emotion and thought are inseparable. In essence, if one
understands how an individual conceptualizes a situation then one can predict the
potential for observing a particular emotion (Ortony, Clore and Collins, 1988).
Performing emotional profiling. Emotional Profiling (EP) involves the collection
of elicited emotions experienced while interacting with a product, followed by questions
regarding the rationale of the experienced emotion. For this, a non-verbal (i.e., graphic
representation) electronic questionnaire that incorporates distinct emotions commonly
expected while interacting with a product may be used to measure emotions and their
intensity. Such a questionnaire uses non-labeled animations representing expressions for
each emotion, mitigating vocabulary biases common to verbal instruments and providing
the capability to record mixed emotions (Desmet, 2002).
The EP questionnaire is administered after user testing. Users are asked to report
emotions felt while interacting with the product and complete a short follow-up interview
allowing investigators to gain insight into interpretations of the animations as well as the
appraisal process which led to selection of specific emotions.
Emotional profiling outcomes. The EP provides a multidimensional representation
of emotions experienced by individuals during interaction with the product. There are
two basic outputs and utilizations of this process: the Graphical Emotional Profile (GEP)
and the Emotion Appraisal Profile (EAP). The GEP (Figure 9) shows the distribution of
emotions and corresponding intensity of the analyzed experience across all participants.
The GEP allows usability practitioners to understand the general distribution across
80
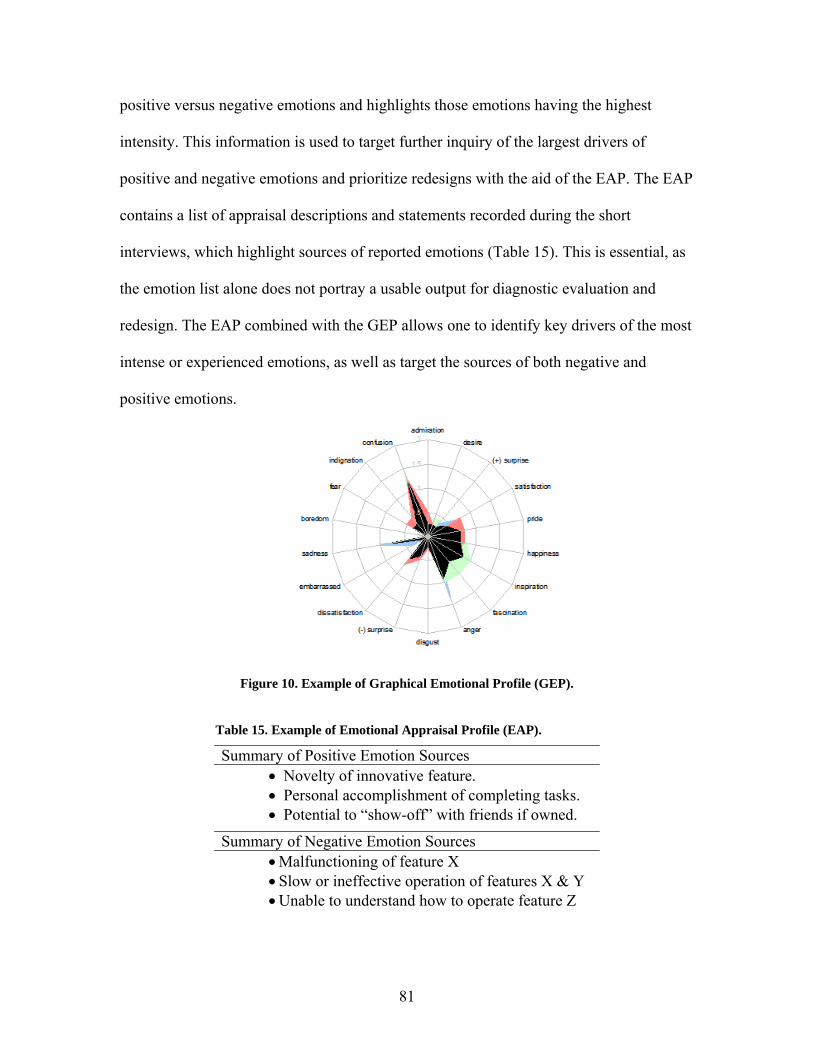
positive versus negative emotions and highlights those emotions having the highest
intensity. This information is used to target further inquiry of the largest drivers of
positive and negative emotions and prioritize redesigns with the aid of the EAP. The EAP
contains a list of appraisal descriptions and statements recorded during the short
interviews, which highlight sources of reported emotions (Table 15). This is essential, as
the emotion list alone does not portray a usable output for diagnostic evaluation and
redesign. The EAP combined with the GEP allows one to identify key drivers of the most
intense or experienced emotions, as well as target the sources of both negative and
positive emotions.
Figure 10. Example of Graphical Emotional Profile (GEP).
Table 15. Example of Emotional Appraisal Profile (EAP).
Summary of Positive Emotion Sources • Novelty of innovative feature. • Personal accomplishment of completing tasks. • Potential to “show-off” with friends if owned.
Summary of Negative Emotion Sources • Malfunctioning of feature X • Slow or ineffective operation of features X & Y • Unable to understand how to operate feature Z
81
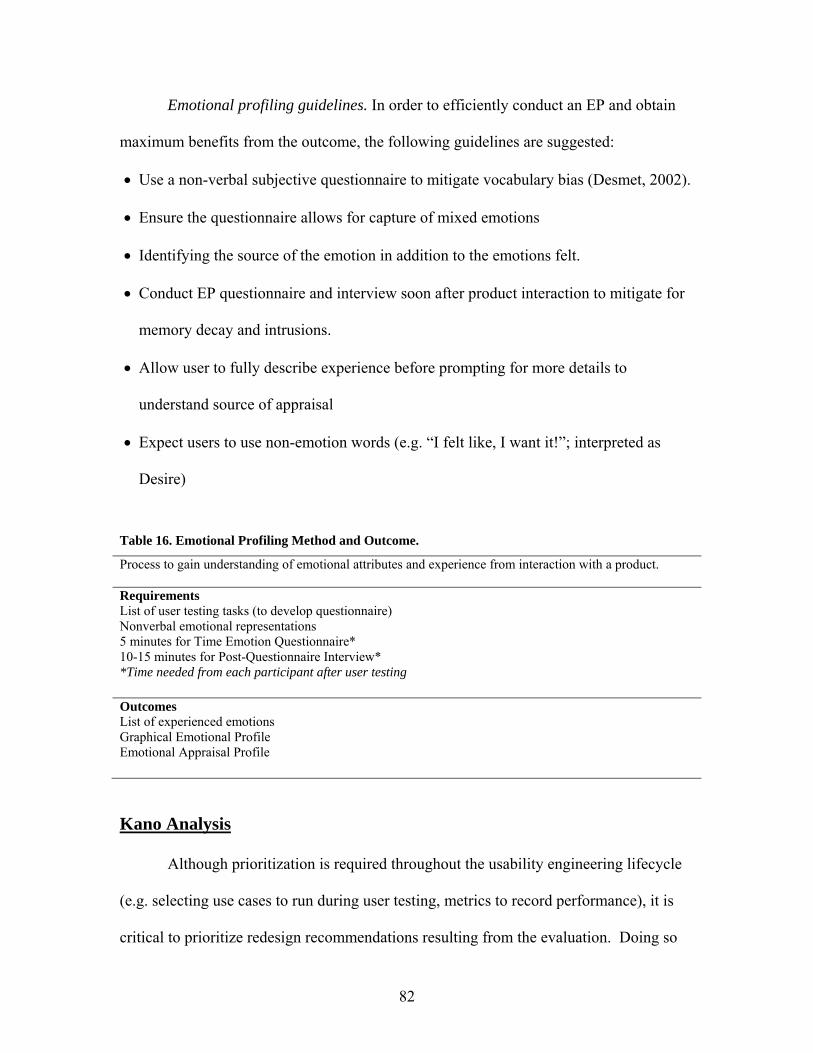
Emotional profiling guidelines. In order to efficiently conduct an EP and obtain
maximum benefits from the outcome, the following guidelines are suggested:
• Use a non-verbal subjective questionnaire to mitigate vocabulary bias (Desmet, 2002).
• Ensure the questionnaire allows for capture of mixed emotions
• Identifying the source of the emotion in addition to the emotions felt.
• Conduct EP questionnaire and interview soon after product interaction to mitigate for
memory decay and intrusions.
• Allow user to fully describe experience before prompting for more details to
understand source of appraisal
• Expect users to use non-emotion words (e.g. “I felt like, I want it!”; interpreted as
Desire)
Table 16. Emotional Profiling Method and Outcome.
Process to gain understanding of emotional attributes and experience from interaction with a product. Requirements List of user testing tasks (to develop questionnaire) Nonverbal emotional representations 5 minutes for Time Emotion Questionnaire* 10-15 minutes for Post-Questionnaire Interview* *Time needed from each participant after user testing Outcomes List of experienced emotions Graphical Emotional Profile Emotional Appraisal Profile Kano Analysis
Although prioritization is required throughout the usability engineering lifecycle
(e.g. selecting use cases to run during user testing, metrics to record performance), it is
critical to prioritize redesign recommendations resulting from the evaluation. Doing so
82
provides a means for developers to determine which redesigns should result in the highest
return on investment (ROI).
Typically, the primary methods used to prioritize usability redesigns are based on
criticality of errors that occur during testing (Nielsen & Mack, 1994; Rubin, 1994), yet
these methods do not necessarily direct the redesign effort towards shortcomings
associated with features most important or necessary for users. The Kano Analysis (for
an extensive explanation see Berger, et al., 1993) is one method that effectively takes
subjective evaluation of the evaluator (i.e., usability practitioner) out of the prioritization
process and replaces it with user priorities. Developed in the 1980s by Noriaki Kano and
collegues (Kano, Seraku, Takahashi, & Tsuji, 1984), this method quantitatively
categorizes each characteristic of a product into one of the following 4 categories based
directly on user input:
• Must-be requirements- Requirements that must be met in order for the product to be
considered for use.
• One-dimensional requirements- Also known as the ‘more is better requirements’.
Customer satisfaction is proportional to the level in which they are met.
• Attractive requirements- Also known as ‘delighters’. These are the requirements that
make a product stand out and lead to the highest level of satisfaction.
• Reverse requirements- Also known as ‘dissatisfiers’. These are requirements that
users explicitly don’t want in a product.
Extensions of this model have been used to quantitatively determine precisely
how much each feature affects customer satisfaction and dissatisfaction (Sauerwein,
83
Bailom & Matzler, 1996), and allow quantitative comparisons of evaluated products to
competitor products (see Berger et al., 1993).
Performing kano analysis. The Kano Analysis method consists of the following four-
step process: creating the questionnaire, piloting the questionnaire, administering the
questionnaire, and evaluating the results. Creating the questionnaire is the most extensive
stage of the Kano Analysis process, as it requires usability practitioners to determine
what product features could potentially be included in the design. Initially, this list can be
populated by the practitioner and a few representative system users from which only
must-be, reverse, and one-dimensional requirements are likely to be gathered. In order to
gather attractive requirements, a focus group may be used to determine common
problems with the existing or similar system and brainstorm potential solutions to them.
Once all potential requirements are gathered, the questionnaire is developed by creating a
functional form question (to determine how users feel when each feature is present) and a
dysfunctional form question (to determine how users feel when each feature is not
present) for each product feature. After development of the questionnaire, an important
next step in the Kano analysis process is to pilot test the questions to ensure users will
understand both forms of the question for each feature.
After the questionnaire is developed and piloted, it is administered to a group of
users. Given that this technique is relatively new to most users, it is beneficial to have an
evaluator present that can explain the process and answer any questions users have as
they fill out the forms (Sauerwein, et al., 1996). Completed questionnaires are evaluated
in order to categorize each system characteristic into one of the four groups previously
explained. Further analyses can then be performed in order to provide a qualitative
84
evaluation of the effects of each characteristic on customer satisfaction and
dissatisfaction (Sauerwein, et al., 1996), and provide quantitative comparison points to
competitor products (see Berger et al., 1993).
Kano analysis outcome. Traditionally, the primary outcome of the Kano Analysis
is a representation of the relative importance of system characteristics based on users’
expectations. When the level of importance varies across groups of users, the results of
the Kano Analysis can then be combined with demographics to potentially determine
where market segmentation exists. This understanding may then be used to classify and
prioritize system development and redesign focus to ensure it is aligned with target user
expectations. Ultimately, the Kano Analysis technique provides a method to gain a better
understanding of user needs, desires and expectations, determine how the product under
evaluation does or does not meet these, and pinpoint where the largest ROI may be found
during redesign phases.
Kano analysis guidelines. In order to efficiently conduct a Kano Analysis and
obtain maximum benefits from the outcome, the following guidelines are suggested:
• After listing ‘must-be’, ‘one dimensional’ and ‘reverse’ requirements, identify
problems with similar systems and potential solutions to pinpoint ‘attractive’
requirements (focus groups are beneficial for this)
• Ensure each question is in simple language and only targets the evaluation of a single
product feature
• Pilot test all questions with one or two unbiased users before administering to ensure
they are easily understood
85
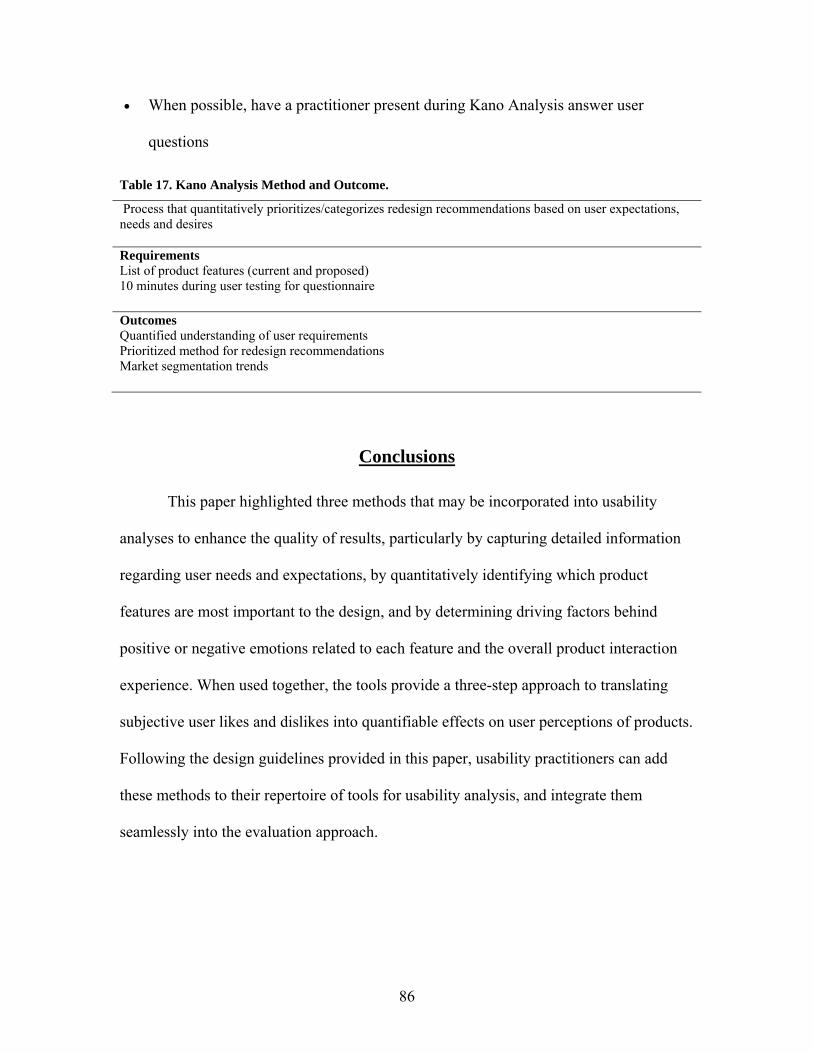
• When possible, have a practitioner present during Kano Analysis answer user
questions
Table 17. Kano Analysis Method and Outcome.
Process that quantitatively prioritizes/categorizes redesign recommendations based on user expectations, needs and desires Requirements List of product features (current and proposed) 10 minutes during user testing for questionnaire Outcomes Quantified understanding of user requirements Prioritized method for redesign recommendations Market segmentation trends
Conclusions
This paper highlighted three methods that may be incorporated into usability
analyses to enhance the quality of results, particularly by capturing detailed information
regarding user needs and expectations, by quantitatively identifying which product
features are most important to the design, and by determining driving factors behind
positive or negative emotions related to each feature and the overall product interaction
experience. When used together, the tools provide a three-step approach to translating
subjective user likes and dislikes into quantifiable effects on user perceptions of products.
Following the design guidelines provided in this paper, usability practitioners can add
these methods to their repertoire of tools for usability analysis, and integrate them
seamlessly into the evaluation approach.
86
CHAPTER SIX: GENERAL DISCUSSION
The current effort seeked to resolve the shortcomings found in existing UX
research and practice in informing the design of interactive products so that they can
seamlessly integrate into the everyday lives of their intended users. For this it was critical
to identify the key components of UX as well as how to instantiate tools and
methodologies for their assessment. By proposing an the Integrated User Experience
Evaluation (iUXEV) Model this work began to address the identified gaps by presenting
a pragmatic approach to the evaluation of UX and the communication of its findings to
inform design.
This work discussed the revelation that, usability is not enough. As many other
authors have pointed out, User Experience (UX) involves considerably more aspects than
the performance oriented focus that has consumed the usability approach. This work
proposed a new model for UX by not only identifying the major constructs (ergonomic,
personal-hedonic, aesthetic) but by also identifying the numerous sub-constructs that
form part of these larger concepts. This model clearly showed that in order to truly assess
an artifact for its UX, it is necessary to address each and every one of these sub-
constructs. Otherwise one risks leaving to chance the very success of the artifact. The UX
of an artifact is key, given that it is in essence the result of what a user expects and what
is delivered by the artifact as they come together in some contextual set of conditions.
And thus it is necessary to evaluate all the different aspects under which a user will assess
such an experience. While not claiming to be exhaustive, the list of sub-constructs
identified in the UX model (see Chapter 2) do highlight that a user will experience or
87
judge an experience along many foci. The UX model demonstrates that UX may actually
involve aspects that are separate from an actual artifact. Specifically, such experiences
may be extended to the process (e.g., purchasing, servicing), the context, or the
relationship between the artifact and some other entity (e.g., a brand).
Clearly addressing all the aspects of a UX would be a sizable challenge, and so
this work set out to address the evaluation of UX as a starting point of the greater
challenge. In essence, how may one assess UX given its numerous perspectives? In this
work, this challenge was addressed by focusing on the formative evaluation process, i.e.,
once one has an artifact prototype and one needs to evaluate it and address any
shortcomings as part of an iterative design process. The iUXEV model (see Chapter 2)
for the evaluation of UX issues takes the benefits and capabilities of formative usability
evaluations and expands on those capabilities through the use of new and existing tools,
as well as the adaptation of methods to enable the assessment of UX issues. The iUXEV
model is aimed at providing a comprehensive UX evaluation fashioned after a traditional
formative usability evaluation given the efficacy of the usability evaluation approach, and
the popularity of the method among practitioners.
The iUXEV model is composed of a sub-set of tools that when used as prescribed
in the methodology proposed in Chapter 2, are able to seek specific data which will yield
a comprehensive evaluation of the three major constructs within UX; the ergonomic,
personal-hedonic, and aesthetic. This model and associated methodology were developed
and refined through insights gained from three different case studies.
While the ergonomic aspects of UX evaluation have been refined through decades
of usability practice, the personal-hedonic and aesthetic components are still in their
88

infancy. To address this gap, it was necessary to develop a tool and method capable of
assessing these constructs. The development of this tool and method was possible given
that both that the personal-hedonic and aesthetic constructs interact at an affective level
within individuals through the means of the experience of feelings (e.g., pleasure,
disgust). In essence, individuals make affective assessments based on the impact
(beneficial or not) of a stimulus (i.e., an artifact) using a variety of goals, concerns and
attitudes that are active during the contextual experience of the individual. In addition
these affective assessments may apply to either behavioral, personal-hedonic or aesthetic
concerns and thus key emotion types apply to the specific UX constructs sought.
The emotional assessment tool and method discussed within this work (see
Chapter 3) enable the assessment of these two constructs yet the tool and method could
benefit from continued improvement and refinement; particularly in increasing the
reliability of the emoticons through iterative redesign and through the optimization of the
appraisal inquiry component of the method.
The integration component of iUXEV takes into consideration the real life issues
that often constrain the findings of usability evaluations. The iUXEV model recognizes
that within a development effort there are concerns within an organization that often
compete for resources with usability / UX concerns. For this reason the integration
component utilizes a multi-criteria decision approach, which is able to prioritize UX
concerns with regards to a list of multiple criteria, and most importantly, adapt these
broad types of data into a functioning common unit of measure. This later common unit
of measure is only possible by the adaptation of the Information Axiom from the
89

Axiomatic Design approach, and is the very means by which the prioritization and
multiple-criteria comparisons are possible.
The results of this work can be summarized in the instantiation of a working
method and tools that can objectively rate the UX and put the results of this assessment
into use in a form usable by decision makers.
90

CHAPTER SEVEN: CONCLUSIONS AND FUTURE WORK
The result of this work has culminated with the development of four key outcomes. One
is the development of an emotional assessment methodology and tool which addresses
three types of emotions. Two is the development of a UX model with specific constructs
identified. Three is the development of a UX formative evaluation approach utilizing a
sub-set of existing and newly developed methods. Four the development of an integration
approach for the aggregation and prioritization of UX issues with regards to UX criteria
and other competing factors. While each contribution is very promising, further
validation and refinement are still required.
The emotional assessment method requires additional refinement such that it may
be utilized with less training by an evaluator. The emotion assessment tool still requires
further refinement of its animations via additional reliability studies of its emoticons, as
well as further validation of the choice of the emotions used. While the selection of
emotions in the tool were aimed at developing a generalized tool, the choice of these
emotions may be adjusted to better serve specific contexts and thus further work to refine
the selected emotions could be beneficial.
The UX model, while extensive, would benefit from a factorial analysis in order
to validate the relationship of the sub-constructs to their parent constructs, as well as
identify any redundant factors. This would help validate the efficacy of the iUXEV
model, which requires additional validation in industry such that the now integrated
method could be utilized and refined via lessons learned from its application.
91

The iUXEV model presents a pragmatic approach for the evaluation of UX and
for the communication of its findings to inform design taking in consideration challenges
that are faced in industry. Further work should follow where the proposed model is
further tested and validated in industry.
Finally as part of the iUXEV model’s integration approach allows the integration
and presentation of UX issues in a usable manner for decision makers. Follow up work
should further test and validate its usability in practice to further understand and verify if
the cultural and organizational challenges identified and addressed by the simplified
approaches can overcome these.
92

APPENDIX A: SOCIALLY CENTERED DESIGN
93
Stanney & Champney, 2006 Stanney K.M, Champney, R.K., (2006). Socially Centered Design. In Karwowski, W. (Ed.) International
Encyclopedia of Ergonomics and Human Factors. CRC Press.
Introduction
Conventional approaches to design, which focused on technology and its wide
application, often resulted in systems that were at best half-heartedly embraced by user
communities and more often than not begrudgingly obligated into adoption. To overcome
such shortcomings, system design and the individuals who contribute to this activity have
evolved to reflect the salient concerns of successive eras. The engineer as the principal
designer has evolved into a team of designers including psychologists, social scientists
and anthropologists (Squires and Byrne 2002). The concerns of design have also
transformed from those focused solely on the central design concerns of functionality and
usability to more “border issues,” i.e. design variables that reflect socially constructed
and maintained world views which both drive and constrain how people can and will
react to and interact with a system or its elements. Socially centered design is a medial-
ergonomic design that fills the void between traditional system centered design
(i.e. macro-ergonomic design of the overall organization and work system structure, as
well as process interfaces with the system’s environment, people and technology) and
contemporary user centered design (i.e. micro-ergonomic design of specific jobs and
related human–machine, human–environment, and user system or software interfaces)
(Stanney et al. 1997). Specifically, socially centered design takes a holistic approach to
design, broadening the narrowly defined technical focus of past design approaches by
considering users, as their performance is influenced by their knowledge and
understanding of the social context in which they perform their work. Following this
94

design approach, naturalistic observation of human behavior as it is influenced by
situational, contextual and social factors is used to assist in the formulation of system
designs.
Socially centered design assumes that, by taking into consideration organizational
and social factors such as informal work practices and shared artifacts, the system design
process will be enhanced (Luff et al. 2000). This presupposes that social interaction is
orderly and can therefore be understood. System designers can achieve this understanding
by developing a sense of the intrinsic categories and methods (i.e. informal processes)
that members of an organization assign themselves during their interactions. In particular,
participatory observation, in which designers become immersed in and interact with
target user populations in their natural work setting, can be used to gain such
understanding. Further, socially centered design recognizes that the roles and
responsibilities of workers are situated (i.e. emergent rather than individualistic, local to a
particular time and place, contingent on the current situation, embodied in a physical and
social context, open to revision and vague), being defined in relation to the social
interaction in which they occur.
There are several types of “context” in which such social interaction occurs and
each of these needs to be considered within the socially centered design construct. These
include:
• the user context, which includes attitudes, behaviors and motivational
factors, as well as border or non-central uses of particular artifacts that
users have adopted;
95
• the environmental context, which describes the ambiguous milieu in
which a target technology is adopted and used;
• the cultural context, which consists of the norms, power relationships,
status relationships, cohesiveness, group density values, myths and
interactions of the culture within which the target technology is to exist;
and
• the developmental context, which includes the multidisciplinary team
dynamics, cooperative decision-making processes, systems and material
requirements necessary to create the target technology under development.
While the latter context often receives the most attention, it is the other contexts
that often determine the success of a target technology once implemented. Thus, working
within all of these contexts, socially centered designers conduct contextual inquiries and
use the results to improve the design of new and existing technological systems and
products, as well as serving as user advocates by facilitating the involvement of users in
the design process.
The Socially Centered Design Process
The socially centered system design process should commence with a review of
documentation concerning the practices and terminology utilized in the target
environment. This provides a foundation of knowledge from which to reason about the
processes or practices to be investigated. Once they have a basic understanding of the
contexts to be observed, designers conduct contextual inquiries to determine user needs,
product desires, task flows and environmental parameters potentially influencing system
design (Stanney et al. 1997). This investigation will generally involve some form of
96
direct observation such as field studies or ethnographic observation (Wasson 2000). It is
critically important that this observational period be conducted in an unbiased, non-
leading manner (Squires and Bryne 2002). Designers are expected to become immersed
in one or more communities of practice to observe, record and analyze what users
actually do in applying artifacts to achieve goals. While such participatory observation
leads to great insights, designers should avoid modifying the behavior of those observed
by refraining from asking leading questions or imposing biases where their perspectives
differ from those being observed. In applying techniques like interviews, focus groups,
detailed questionnaires or measuring specific aspects of work performance, immersed
designers seek to adopt the user’s frame of reference or view of reality to understand the
how and why of artifact use. Once completed, the most common mistake of such
observational studies is to overextend the interpretation of the results. Thus, it is essential
that the rich abundance of observational data obtained be filtered, organized and
interpreted in the larger context of the technology and science in which the artifacts exist.
Socially Centered Design Variables
The socially centered design variables for which data are accumulated during
observational studies comprise those input or contextual variables that are expected to
influence group processes (Stanney et al. 1997). These variables include the context
itself, both as a global or comprehensive factor and the separate component variables that
collectively comprise the context: artifacts, cooperative task activities, organizational
structure, situational factors and interpersonal characteristics (see Table 18).
The contexts (i.e. user, environmental, cultural and developmental) in which an
activity is performed have both physical (e.g. locational and sensory cues) and social
97
elements (e.g. presence of, relationship to, and expectations of other individuals) that
provide opportunities for or constrain individual behavior, particularly due to the schema
(i.e. general purpose representations of concepts, situations or ideas) that develop over
time.
Individuals within a given community generally use artifacts in particular ways
according to past insights, common intuitions, shared understandings and activities, and
current or recent experiences (Gaver 1994). Over time, however, different communities
may develop “border” or noncentral uses for peripheral or secondary attributes
characteristic of particular artifacts. These border uses will probably be unique to a given
community and may arise when functional fixedness is overcome by a perceptive user
with a novel problem. Although in the past these issues were recognized, their influences
on design were generally thought to be inconsequential owing to the tendency of artifacts
to remain stable over time and populations of consumers (Stanney et al. 1997). With the
demassification of today’s competitive market, however, designers have been forced to
offer many customized products instead of a few standardized ones to cater for narrow
demographic segments scattered in regional markets. The result is that there may no
longer be a guarantee of artifact continuity to include border uses. In turn, shared
practices may not be easily maintained, especially if customization is extended
downwards to the individual user so that only a very few common core or border
attributes exist to support member coordination of the community’s internal behaviors
(Gaver 1994). Such circumstances highlight the need for embracing socially centered
design practices.
98

Table 18. Socially Centered Design Variables.
Design Variables Information to Inform Design
Context
Description of user, environmental, cultural and development contexts in which an activity is performed, including physical and social elements that develop over time.
Artifacts
Description of the designed and created objects or systems that humans apply and use to influence the world around them, including “border” or non-central uses.
Cooperative task
Description of the degree to which effective activities group performance depends on both the transmission of information about task activities and transmission of information about the values, interests, and personal commitments of group members.
Organizational Description of the norms, power relationships, structure status relationships, cohesiveness, and group density of an organization or group.
Situational factors
Description of the social networks and relationships that exist among group members, as well as their maturity
and cultural differences.
Interpersonal Description of the attitudes, behaviors, and characteristics motivations of individual group members.
In organizational settings, cooperative task activities generally define or reflect
the job or objective that artifacts are used in whole or part to accomplish. The influence
of the task factor on group performance, when this is mediated in some manner by
technological artifacts, manifests itself in terms of the degree to which effective group
performance depends on both the transmission of information about the
task and transmission of information about the values, interests and personal
commitments of group members (Luff et al. 2000). These factors, and the effectiveness
with which system designs or artifacts support their performance, can be identified
through the observational studies of socially centered design.
99
The organization or group within which an activity is performed significantly
affects the appropriateness of a system design. To implement plans and achieve common
objectives, group members and the systems that support them must create and maintain
meaningful relations (i.e. norms, power relationships, status relationships, cohesiveness
and group density), which can be identified through observational studies. Thus,
organizational requirements emerge from a system being placed in a social context and
its associated group relations rather than those deriving from the functions to be
performed or the tasks to be assisted (Luff et al. 2000).
Situational characteristics reflect the various social networks and relationships
that exist among group members, as well as the maturity of the group (e.g. just formed
versus well established) (Stanney et al. 1997). In particular, cultural situational
differences (e.g. collectivistic versus individualistic cultures) are particularly influential
in social and work settings, which in turn is reflected in the behavior of the members of
these cultures.
Interpersonal characteristics (e.g. dominance, friendliness, authoritarianism, field-
articulation, gender) reflect the attitudes, behaviors and motivations of individual group
members. Groups whose members have compatible personalities tend to be more
cohesive, more efficient and more productive than groups with incompatible members.
The specific outcome one should aim for from a contextual inquiry is the development of
a conceptual model of the observed domain, with detailed descriptions of users, tasks,
artifacts, environmental and cultural parameters associated with the target domain. More
specifically, the resulting conceptual model consists of operational task flows and
descriptions (i.e. a user-centered model of cooperative tasks as they are currently
100
performed that specifies how users currently think about, talk about and conduct their
tasks in the actual operational environment), descriptions of required or desired physical
systems, work flow models (i.e. characterizes communication and coordination between
people), artifact descriptions (i.e. tools created to support cooperative work),
environmental descriptions, as well as cultural models that describe organizational
constraints. This knowledge should allow developers to design a system that taps as much
as possible into existing cooperative task knowledge and desires for future technology
solutions, thereby maximizing human–system performance by accommodating the
organizational and social constraints and conditions existing within a given target
environment. There are several different methods used to elicit this contextual
information.
Socially Centered Design Techniques
Socially centered design techniques reflect the methodologies applied to acquire
data about users and their work context and related artifacts (Squires and Bryne 2002;
Stanney et al. 1997; Wasson 2000). These techniques elicit identification of artifact
attributes for both core and border uses; specifying whether they facilitate, slow or
impede activities; the scope and nature of relationships among individuals and the
manner in which particular artifacts support these relationships; and how work,
communication and information flow are mediated. Several different techniques have
been used in an attempt to elicit such contextual information.
101
Group Studies
Socially centered design can use a modified version of traditional sociological
group studies, where predictive theories or even designers’ intuitions are formulated and
situationally tested in a variety of contextual settings (Stanney et al. 1997). This can be a
timely and resource intensive approach.
Ethnographic Studies
The ethnographic approach identifies work practices and organizational
interactions through anthropological studies of the work setting (Squires and Bryne 2002;
Stanney et al. 1997). Ethnomethodology examines how competent members of an
organization coordinate their behaviors, specifically in delimiting the categories, methods
and artifacts used to render their activities intelligible to one another (Wasson 2000).
Ethnographic studies have two general focuses: (1) the moment-to-moment interactions
of observational participants and (2) more global, longer-term activities such as how
artifacts are used to distribute and regulate knowledge, communication and action, as
well as identification of the personal objectives, beliefs, principles and practices of those
observed.
The ethnographic approach often involves participatory observation in which
designers intensely observe and interact with the cultural activities, belief systems,
rituals, institutions and artifacts of those under observation. Using this approach,
designers and intended users of the system or product develop a shared understanding of
the nature of the work or activity to be performed, the users’ needs in performing that
activity, and the contextual components that support the completion of the activity. This
102
mutual understanding is deeply tied to the context in which the work or activity is
performed. Thus, design solutions based on the ethnographic approach may not
generalize to other situations.
Cooperative Work Studies
Cooperative work studies involve observational investigations of groups working
cooperatively in their natural social and cultural setting (Luff et al. 2000; Stanney et al.
1997). In general, the group under observation collaborates on a common goal that
requires communication (either face-to-face or mediated exchanges) to support goal
achievement, and who thus must in some manner coordinate their work activities. With
this approach, structural variables reflecting the group (e.g. size, composition,
interactions, internal processes) and external situational factors that reflect the natural
environment are identified and used to inform the design process.
Anthropomorphic Studies
Anthropomorphic studies generally examine human-to-human communication
patterns and then try to emulate these relationships in the design of interactive systems.
The focus is to identify the schema (e.g. communication modes, cognitive strategies)
through which people perform activities or tasks.
Applying the Socially Centered Design Approach
As advancing technologies emerge, designers struggle with the issue of how to
generate new innovative technological artifacts that meet users’ requirements. Socially
103

centered design approaches are particularly advantageous in exploratory design stages
before an initial design concept has been identified (Squires and Bryne 2002). At this
stage, the information generated from observational studies can lead to creative design
solutions that would probably have never been rendered without such insights. These
approaches are also useful to leverage concurrent with the development life cycle, in
evaluative stages, once a formal prototype has been generated and observational studies
can focus on target users interacting with the system or product in its intended operational
setting, and finally upon reexamination, where previous field studies are reexamined to
inform new designs (see Table 19).
Analysis and Dissemination of Information
While the advantages of considering social aspects within the development life
cycle of interactive products are generally accepted, two critical difficulties have arisen in
the application of such techniques associated with time and communication. In terms of
time, “quick and dirty” ethnographic frameworks have been proposed that aim to direct
observation toward specific foci (Hughes et al. 1997). In particular, focusing on three
major dimensions can streamline observation: (1) distributed coordination, which refers
to patterns of task activities; (2) plans and procedures, which refer to the rules, actors and
relationships within an organization; and (3) awareness of work, which refers to how
activities within an organization are made “visible” between parties. In addition, Millen
(2000) suggested that field research could be expedited by following three main
strategies: (1) focus field research on important activities, as identified via the insights of
key informants; (2) use multiple interactive observation techniques (i.e. multiple
104
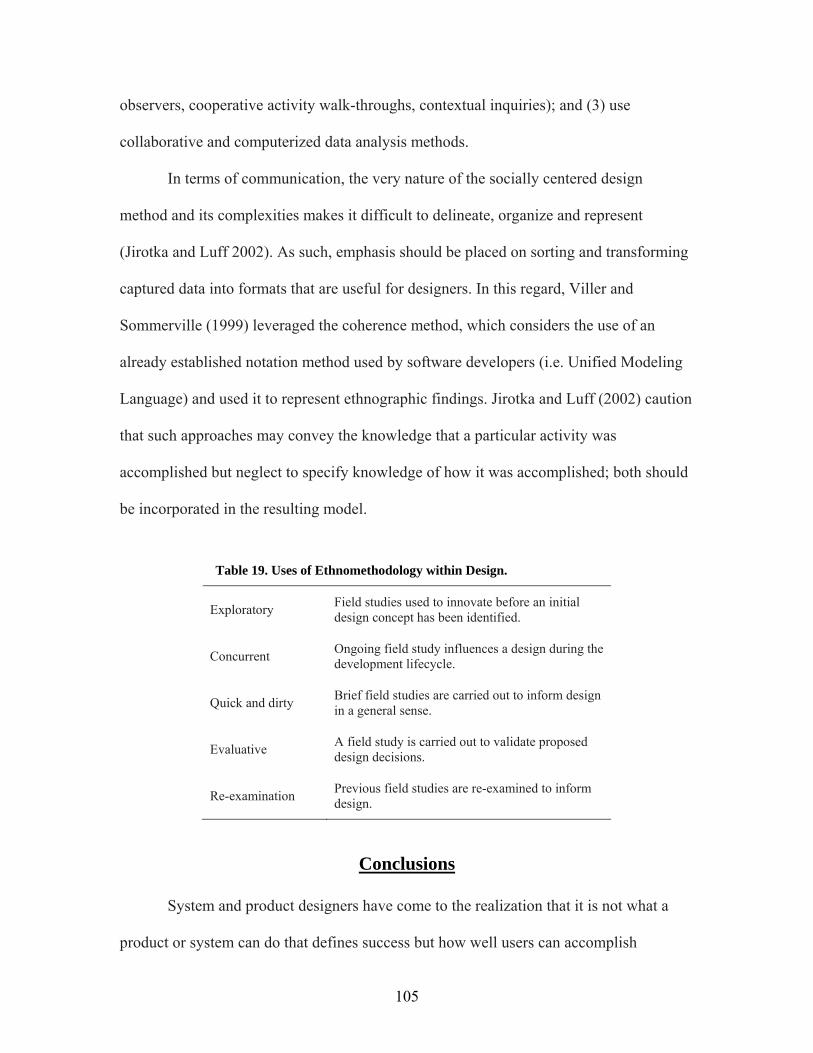
observers, cooperative activity walk-throughs, contextual inquiries); and (3) use
collaborative and computerized data analysis methods.
In terms of communication, the very nature of the socially centered design
method and its complexities makes it difficult to delineate, organize and represent
(Jirotka and Luff 2002). As such, emphasis should be placed on sorting and transforming
captured data into formats that are useful for designers. In this regard, Viller and
Sommerville (1999) leveraged the coherence method, which considers the use of an
already established notation method used by software developers (i.e. Unified Modeling
Language) and used it to represent ethnographic findings. Jirotka and Luff (2002) caution
that such approaches may convey the knowledge that a particular activity was
accomplished but neglect to specify knowledge of how it was accomplished; both should
be incorporated in the resulting model.
Table 19. Uses of Ethnomethodology within Design.
Exploratory Field studies used to innovate before an initial design concept has been identified.
Concurrent Ongoing field study influences a design during the development lifecycle.
Quick and dirty Brief field studies are carried out to inform design in a general sense.
Evaluative A field study is carried out to validate proposed design decisions.
Re-examination Previous field studies are re-examined to inform design.
Conclusions
System and product designers have come to the realization that it is not what a
product or system can do that defines success but how well users can accomplish
105
intended tasks with the aid of the product or system. Yet users are known to have
idiosyncratic usage patterns that are not readily foreseen by designers. The challenge is to
identify the artifacts, cooperative task activities, impact of organizational, cultural and
situational factors, as well as the interpersonal behaviors that influence the effectiveness
of a given system or product design. Failing to comprehend or consider these factors may
make the acceptance and adoption of new system level solutions very unlikely or difficult
at best. Further, while the formal notation of all observations elicited via socially centered
design techniques is not feasible due to their complexities, the capability to raise issues of
concern via this approach is valuable enough to seriously consider them in design. The
value of socially centered design techniques is in their ability to systematically elicit an
understanding of contextual factors and integrate this knowledge into the development
process, thereby improving the design of new and existing technological systems and
products.
References Gaver, W., 1994, Commentary on borderline issues: 8. Grounding social behavior. Human–Computer
Interaction, 9, 70–4.
Hughes, J.A., O’brien, J., Rodden, T. and Rouncefield, M., 1997, Designing with ethnography: a
presentation framework for design. Proceedings of the Symposium on Designing Interactive
Systems-DIS’97 (New York: ACM), pp. 147–59.
Jirotka, M. and Luff, P. 2002. Representing and modeling collaborative practices for system development.
Social Thinking – Software Practice. pp. 111-39.
Luff, P., Hindmarsh, J. and Heath, C. (eds), 2000, WorkplaceStudies: Recovering Work Practice and
Informing System Design(Cambridge, MA: Cambridge University Press).
Millen, D.R., 2000, Rapid ethnography: time deepening strategies for HCI field research. In Proceedings of
DIS 2000 (New York: ACM), pp. 280–6.
106

Squires, S. and Byrne, B. (eds), 2002, Creating Breakthrough Ideas: The Collaboration of Anthropologists
and Designers in the Product Development Industry (Westport, CT: Bergin Garvey).
Stanney, K.M., Maxey, J. and Salvendy, G., 1997, Socially centered design. In Salvendy, G. (ed.)
Handbook of Human Factors and Ergonomics (2nd ed.) (New York: John Wiley), pp. 637–56.
Viller, S. and Sommerville, I., 1999, Coherence: an approach to representing ethnographic analysis in
systems design. Human Computer Interaction, 14, 9–41.
Wasson, C., 2000, Ethnography in the field of design. Human Organization, 59(4), 377–88.
107

APPENDIX B : DETAILED REVIEW OF UX APPROACHES
108
This appendix provides a more detailed review of the perspectives and approaches
overviewed in Chapter Two’s Theoretical Foundations for and Integrated User
Experience Evaluation Approach section.
Beyond the Instrumental approaches consider cues that influence an experience
beyond utilitarian aspects. This view considers the innate consequences of an artifact and
its surrounding environmental cues on one’s psyche, which in turn influence one’s
experiences. Such approaches attempt to exploit the shared genealogy of individuals (as
proposed by the Darwinian and Jamesian psychological traditions; Darwin, 1874; James,
1884) and the generalization of new discoveries through guided observation of the social
sciences. The additional cues considered by this view encompass such things as
aesthetics, intrinsic properties, or human interests. Most often this view considers the role
of intrinsic cues that influence an experience (in contrast to extrinsic cues that may be
rooted in the environment or that may be within the cognitive presence of the individual,
such as perceived value or function). Several works suggest the existence and power of
such intrinsic properties. A few examples are; Biophilia, which is considered to be an
inborn human affinity for other life-forms and the natural environment (Wilson 1984;
1994); Landscapes, human affinity to which Appleton (1975) argues arises from their
‘natural’ characteristics such that the most appealing ones are linked to those which
provide refuge or a vantage point; and Anthropomorphism, which Papanek (1995) is
suggested to induce feelings of warmth and protectiveness in humans. Demirbilek and
Sener (2003) discuss the incorporation of anthropomorphic design features that resemble
those to which humans are said to be attracted to, such as those of a child’s physiognomy.
Unfortunately the application of such cues presents some challenges, such as how to
109
operationalize, prioritize, and measure them (Hassenzahl & Tractinsky, 2006).
Furthermore, the approach used to understand such intrinsic values is a challenging one
and offers only a limited view of human experience. For instance, Fechner (1876, as
reported in Liu, 2003) is said to have inquired in the effects of physical stimuli on
psychological responses; utilizing a psycho-physical approach where he systematically
manipulated visual stimuli to gauge changes in response. Liu’s (2003) review of work on
this “bottom-up” approach reveals the sizeable challenge of such an endeavor, to
understand what is pleasing to the senses in the study of aesthetics, as different design
characteristics could potentially be infinitely evaluated individually this way (e.g., shape,
color, complexity, order, rhythm, novelty, and prototypicality). While this bottom-up
approach is a valid way to identify intrinsic design elements and their effect on an
individual, it disregards the notion that multiple design elements when taken together
may have completely different results. Yet a purely “top-down” approach lacks the
systematicity to identify which features of a complex design are driving an experience;
and the combination of both approaches, while more systematic, is cumbersome to apply.
One viable alternative is presented by Khalid and Helander (2004), who have used broad
categorical dimensions and semantic differentials to evaluate responses. For instance,
they systematically surveyed user reactions to novel products to identify product
characteristics that satisfied individuals, and found three broad dimensions that could be
used for it: Holistic (shape, design, size, colors), Styling (color, form, size), and Function
(arrangement, displays, buttons), which were found as adequate factors to measure
customer’s needs with affect influences. Yet even this approach is not diagnostic enough
to guide further redesign. Given the challenge faced by such implicit attributes it is not
110

possible to provide guided prescriptions to their applications. One may, at best, provide
some broad general guidance, yet without any real objective backing. Thus, while these
are clear attributes of UX they present a challenge as they cannot be evaluated in such a
systematic way that fits within the resource constraints faced in industry.
Affective Cues are a natural option for exploring the non-performance oriented
aspects of UX. The notion of studying affect associated with products or services is not a
new concept. In particular, it has long been a core concern of the branding and
advertising industries (c.f. Mantineau, 1957). While one might feel compelled to argue
that individuals generally make objective purchasing decisions by choosing among
several items based on their performance characteristics alone, it is evident that affect
plays a similar if not stronger role in motivating selection criteria (Lavine, Thomsen,
Zana, & Borgida, 1998). In the latter case, decisions are generally made based on
subjective judgments that satisfy concerns within a particular context (e.g., fashion,
interests, social belonging, etc.) (Helander & Ming Po Tham, 2003). Further, we often
express emotions through the artifacts we choose. For instance “…when two coffee
makers basically make the same pot of coffee, we take the one that gives us a pleasant,
desirable, or inspired feeling” (Overbeeke & Hekkert, 1999, pp. 5). The use of affect in
terms of UX suggest that one may investigate the meaning and the nature of the
experience by exploring the emotional impact and the sources of the experienced affect.
Nonetheless affective phenomena are of different types and a discussion of affect
should commence with a definition of the types of affective phenomena, as the related
terminology is often times used interchangeably (affect, emotions, moods, etc.). In
111
general, six major affective phenomena may be observed: Emotions, Feelings, Moods,
Attitudes, Affective Styles, and Temperament (Davidson, Scherer, & Goldsmith, 2003).
Emotions are defined as brief episodes of coordinated changes (brain, autonomic,
and behavioral) to facilitate a reaction to a significant event. In addition, emotions
are targeted and involve a relationship between the individual experiencing the
emotion and the object of the emotion (Frijda, 1993; 1994) (e.g. one is angry
at…). The primary objective of emotions has been suggested to be “to modulate
or bias action” and they are generally associated with precipitated events that are
perceived as occurring rapidly (Davidson, 1994, p. #). Furthermore they are said
to last for brief episodes, from seconds to minutes (Ekman, 1994).
Feelings are “the subjective representation of emotions” (Scherer & Peper, 2001,
p. #), or in other words the experiencing of an emotion.
Moods are subtle affective states with lower intensity than emotions, yet are
longer in duration (Davidson, et. al., 2003; Ekman, 1994). Moods are
characterized by their non-intentional nature (Frijda, 1994) (i.e., not directed at a
particular item or event). They provide the “emotional color” to all one does
(Davidson, 1994).
Attitudes / Sentiments are long lasting predispositions towards identifiable stimuli.
Affective-Styles / Emotional Traits / Temperaments refer to relatively long lasting
dispositions that bias an individual’s response to stimuli (Davidson, et. al., 2003).
Thus, they are individual differences that modulate emotional reactions to stimuli
believed to be under the control of one’s genetic coding (Davidson, 1992; 1994).
From these, only those that originate from an experience are within modulation of
112
the designers and thus pertinent to the study of UX (i.e., their origin; Intentional
vs. Non-Intentional, see Table 1; Fridja, 1994). These are phenomena where a
relationship between the individual having the experience and a particular
stimulus exists (e.g., one is mad at someone); in contrast to Non-Intentional states,
which are independent of a stimulus (e.g., one is depressed).
In particular, emotions and sentiments (attitudes) are of key importance in UX
due to their intentional nature (i.e. they can be brought about by an experience with an
artifact) (Frijda, 1993; 1994). Emotions are of particular importance given that they are
short lived (Ekman, 1994). This means that an emotion comes and goes, allowing for
determination of its onset (e.g. after using a product) and what caused it (the target or
source of the emotion). Sentiments on the other hand are long lasting general
predispositions towards identifiable stimuli (Petty, Fabrigar, & Wegener, 2003) and as
such do not allow the ability to describe the experience with such color and diagnosticity.
Emotions happen as brief episodes of coordinated changes (brain, autonomic, and
behavioral) to facilitate a reaction to a significant event allowing us “to modulate or bias
action” (Davidson, 1994), as such a key to diagnosticity lies in the elicitation process (the
source). Emotions are the result of a process of appraisal (i.e. an evaluation) in which a
stimulus and evaluation criteria, the latter of which are directed by the current state of an
individual (i.e., their current concerns), come together to produce a non-deliberate,
“direct, immediate, nonreflective, nonintellectual, [and] automatic” (Arnold, 1960, p.
174) evaluation of a stimulus with regard to self (e.g., is it beneficial or not?; Cornelius,
2000). This process of appraisal, in which individual characteristics come into play, is the
source of the vast array of emotional responses possible by a single stimulus. This
113
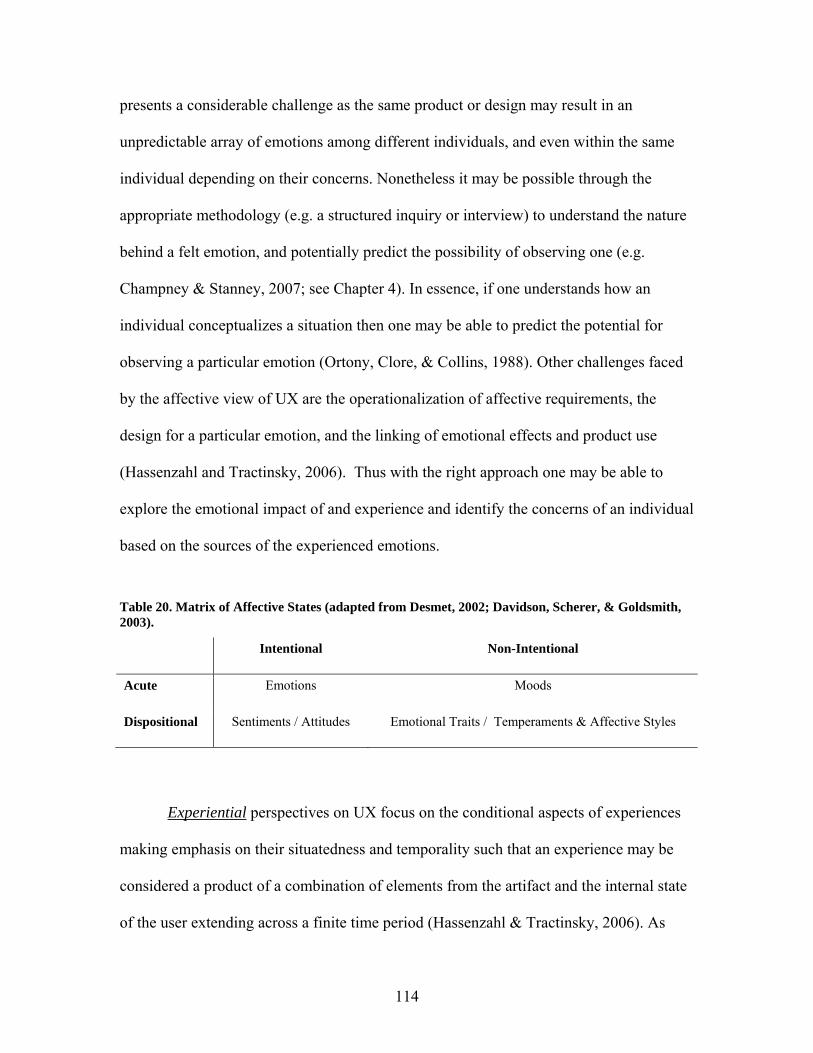
presents a considerable challenge as the same product or design may result in an
unpredictable array of emotions among different individuals, and even within the same
individual depending on their concerns. Nonetheless it may be possible through the
appropriate methodology (e.g. a structured inquiry or interview) to understand the nature
behind a felt emotion, and potentially predict the possibility of observing one (e.g.
Champney & Stanney, 2007; see Chapter 4). In essence, if one understands how an
individual conceptualizes a situation then one may be able to predict the potential for
observing a particular emotion (Ortony, Clore, & Collins, 1988). Other challenges faced
by the affective view of UX are the operationalization of affective requirements, the
design for a particular emotion, and the linking of emotional effects and product use
(Hassenzahl and Tractinsky, 2006). Thus with the right approach one may be able to
explore the emotional impact of and experience and identify the concerns of an individual
based on the sources of the experienced emotions.
Table 20. Matrix of Affective States (adapted from Desmet, 2002; Davidson, Scherer, & Goldsmith, 2003).
Intentional Non-Intentional
Acute Emotions Moods
Dispositional Sentiments / Attitudes Emotional Traits / Temperaments & Affective Styles
Experiential perspectives on UX focus on the conditional aspects of experiences
making emphasis on their situatedness and temporality such that an experience may be
considered a product of a combination of elements from the artifact and the internal state
of the user extending across a finite time period (Hassenzahl & Tractinsky, 2006). As
114
discussed earlier, experiential perspectives have taken three general approaches: product-
centered, user-centered, and interaction-centered, where the interaction-centered offers
the most compelling proximity to what the individual is experiencing (Forlizzi &
Batterbee, 2004). Interaction-centered views may be considered in two general forms: an
affective perspective and a product interaction experience perspective.
The affective perspective, which highlights the subjective experience as lived by
the user (McNamara & Kirakowski, 2006), takes the view that humans experience the
world through an evaluation at three distinct levels of experience (which overlap with the
Affective Cues perspective discussed earlier): Sensory/Aesthetic, Cognitive/Behavioral,
and Personal/Symbolic (Cupchik, 1999; Normal 2004). These are believed to be
grounded in three distinct levels of brain processing: automatic visceral level; process
control behavioral level; and contemplative reflective level (Norman, 2004). Each having
a particular role in the way interaction with the environment is managed. When one
engages with an artifact one is essentially participating in an experience with that artifact
and that artifact’s emotional attributes are the result of these three distinct levels of
experience, each with its own affective elicitation effects (e.g., mixed emotions). The
Sensory/Aesthetic level involves the perceptual properties of experiences and evaluations
of experiences at this level are ideal for “first impression” assessments or evaluation of
physical properties. It involves the more visceral automatic prewired processes that
involve no reasoning and are recognized by the body from sensory information (Norman,
2004). The Cognitive/Behavioral level involves the goal and temporal oriented aspects of
an experience (e.g. the use or consumption of an item) and is grounded in the
subconscious component that controls routine behavior (Norman, 2004). A prime
115
advantage of the contrast between the Sensory/Aesthetic and Cognitive/Behavioral levels
is the ability to use the latter to identify changes and incongruence between perceptual
affective experiential properties and those that arise during or after an engaging
experience. The Personal/Symbolic level involves the ‘connection’ between an
experience (e.g. an artifact) and some additional object (where an object can be an
individual, an event, an object, etc.). It is an overseer layer that contemplates and biases
behavior (Norman, 2004). While the visceral level is prewired, the behavioral and
reflective levels are greatly influenced by learning and culture, yielding an infinite
number of response types across individuals for similar stimuli. In this regard there may
be some overlap between the kind of experiential properties assessed by this and the
previous two levels. This is due to the fact that a perceptual/aesthetic or
cognitive/behavioral property of an experience may indeed be affectively assessed on
some personal/symbolic manner (e.g. a color reminiscent of…). Which level is more
salient depends on an individual’s context, interests, goals and expectations. For instance
a sensory/aesthetic property would serve in a decorative context, a cognitive/behavioral
property would play a role in a functional context, and a personal/symbolic property
would be important when in a social context. This does not imply that one level
dominates over the others, or that they are mutually exclusive. All three domains may
play a role in an experience and their relative importance is managed by the interests of
the individual, whether consciously or unconsciously. This implies that UX must be
assessed from these three domains as each may have disctict and concurrent roles within
a particular experience.
116
The product interaction experience perspective centers on the interaction between
individuals and artifacts (e.g. products) and resulting experiences (Forlizzi and Batterbee,
2004). It decomposes user interactions into three types (fluent, cognitive, and expressive)
and experience into three dimensions (experience, an experience and coexperience).
Fluent interactions are those that are automatic and known, with limited demand for
attention, thus allowing for a focus on the outcome or other matters (e.g. riding a bycicle)
(Forlizzi & Batterbee, 2004). Cognitive interactions are more involved and require
focused attention and resources resulting in gained knowledge, confusion or errors as
outcomes to the interaction with a new or unknown artifact (e.g. using a new cellular
phone). Expressive interactions are those with which the user expresses him/herself
through a relationship and personalization with an artifact (e.g. customizing a car). At the
same time these types of interactions unfold across three dimensions of experience. The
first, experience, is the one involving conscious awareness and evaluation of the activity
and intended goals (e.g. walking in the park); an experience on the other hand is a more
clustered composition of interactions and emotions schematized with a definite character
and sense of completion (e.g. a dinner party); the third is co-experience, and involves the
experience in a social context composed of a number of interactions. As individuals
interact with artifacts these experiences dynamically flow between the fluent, cognitive
and expressive types of interactions.
Together these two perspectives suggest that experiences have at their core a
particular context or situation (situatedness) and are finite having a beginning and an end
(temporality). The challenges presented by this view are similar to those of the affective
cues in which it may prove challenging to design for a particular experience given the
117

complexities involved. Thus, an experience may not be guaranteed as it is ingrained
within the individual, nonetheless the components to support an experience (i.e. the
situatedness and temporality) could be used to present the opportunity for guided
experiences. Further, one additional challenge facing experiences and the design of
experiences is the difference between the actual experience and the retrospective
assessment of such experiences, i.e. experiences and assessment of the experience is
related yet not identical (Hassenzahl & Tractinsky, 2006). This implies that when
evaluating UX it is necessary to do so in a manner that integrates the situatedness and
temporality of the real experience; thus this suggests the limited ability to reproduce and
assess UX in a sterile lab environment.
Psycho-physiological perspectives consider that experiences are perturbations of
the normal state encompassing a time course and patterns of actions and reactions
(Westerink, 2008); furthermore these experiences occur across or mainly through a
particular psychological or physiological process: Perception (e.g. sounds and arts),
Cognition (e.g. interface interaction), Memory (e.g. reliving an experience), Affect (e.g. a
positive or negative experience), Behavior (e.g. gestures, postures, expressions),
Physiology (e.g. physical arousal). The Sensory Task Analysis (STA) view, for example,
braeks up experiences into the sensory information requirements (i.e. multimodal cues,
visual, auditory, haptic, etc.) that the user relies upon to perceive and comprehend the
environment and interaction requirements necessary for the successful completion of a
task (Carroll et. al, under review). To complete this, the STA process requires task
decomposition at a very detailed level based on knowledge of both the domain task and
human information processing theory in order to define the sensory requirements (types
118
of information and sensory parameters) needed to successfully represent the experience.
The Sensory Perceptual Objective Task (SPOT) taxonomy (Champney et. al, 2008)
facilitates this process by allowing the systematic decomposition of domain tasks into
generic tasks based on a set of basic task types grounded in human information
processing theory. These basic sensory perceptual and response task types include the
visual, auditory and haptic modalities, which serve as building blocks for any domain
task (e.g. detecting an aircraft is a specific case of visually detecting a stimulus). The
SPOT taxonomy utilizes two models and theoretical foundations to enable such task
decomposition (see Figure 11). The first model, a categorization of psychophysical
processes presented by Coren, Ward and Enns (2004) defines the first level of the SPOT
taxonomy classification and represents it as a general human sensory perceptual process
(Detect, Discriminate, Quantify, Identify, Respond). The second level of classification is
a modality-based breakdown (visual, auditory and haptic modalities). The third level of
classification is based on the multi-sensory display MS-Taxonomy by Nesbit (2004),
which identifies the different types of tasks possible for each modality (e.g. Spatial,
Temporal, Direct). The fourth and final level of classification is based on modality
specific research (visual, auditory, haptic) that characterizes human capabilities along
each of these modalities. While this psycho-physiological perspective results in a very
granular depiction of the experience it may be resource consuming and is largely task
oriented giving no insight into the other components of the experience.
119
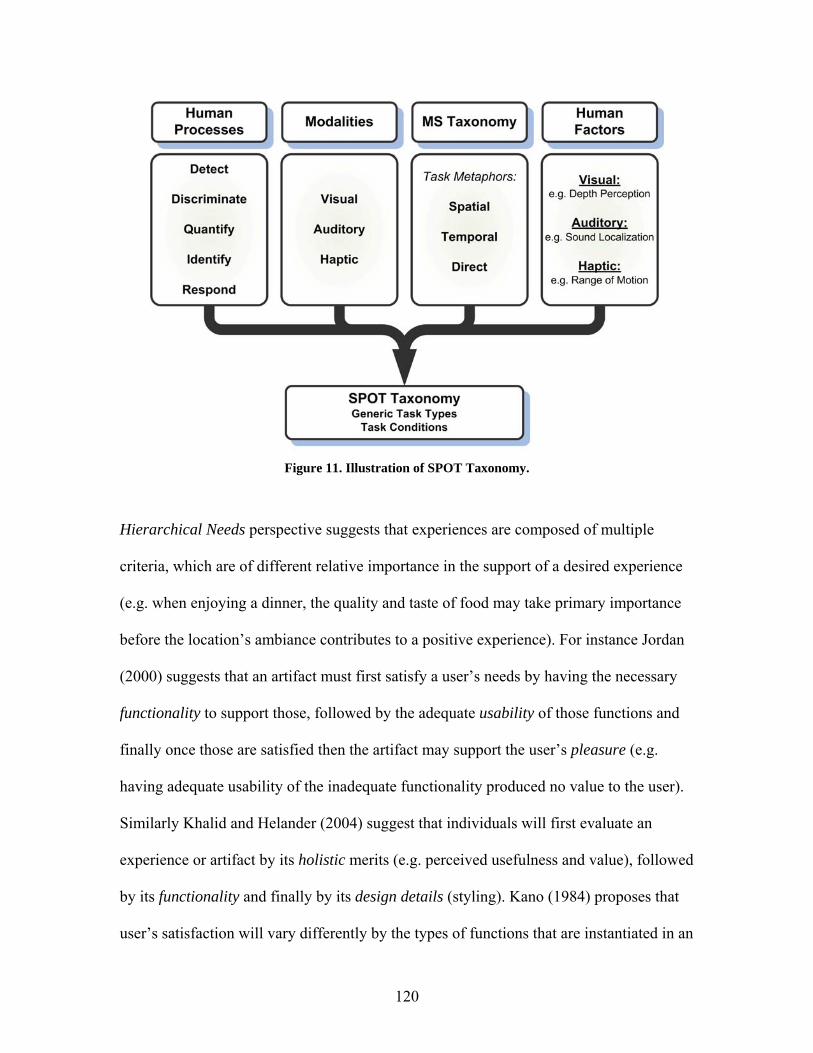
Figure 11. Illustration of SPOT Taxonomy.
Hierarchical Needs perspective suggests that experiences are composed of multiple
criteria, which are of different relative importance in the support of a desired experience
(e.g. when enjoying a dinner, the quality and taste of food may take primary importance
before the location’s ambiance contributes to a positive experience). For instance Jordan
(2000) suggests that an artifact must first satisfy a user’s needs by having the necessary
functionality to support those, followed by the adequate usability of those functions and
finally once those are satisfied then the artifact may support the user’s pleasure (e.g.
having adequate usability of the inadequate functionality produced no value to the user).
Similarly Khalid and Helander (2004) suggest that individuals will first evaluate an
experience or artifact by its holistic merits (e.g. perceived usefulness and value), followed
by its functionality and finally by its design details (styling). Kano (1984) proposes that
user’s satisfaction will vary differently by the types of functions that are instantiated in an
120

artifact, such that there is a hierarchy of core functions that must be included (must-be),
followed by those that provide continuous value (one-dimensional; the more the better)
and those that offer additional value (attractive). While these perspectives are valuable
they offer challenges stemming from the perceived contradictions among them (i.e. who
is right?) and the fact that they prescribe the intentions and preferences of users (e.g.
function before pleasure; which contradicts the situations where an artifact is desired and
drives pleasure for some symbolic meaning and not usefulness). Although Kano does
not beak up the hierarchy into functional and non-functional needs, it is this very general
tone which makes this method valuable as an adequate approach to identify the hierarchy
of needs the approaches by Jordan (2000) and Khalid and Helander (2004) intend to
prescribe (e.g. one can identify a user population’s hierarchy of needs in terms of the
product’s attributes).
121

APPENDIX C: USABILITY EVALUATION BACKGROUND
122
In order to support evaluation of the complete user experience, the usability
discipline utilizes a number of tools aimed at understanding the product’s task domain
and its users, evaluating designs, and aiding or prescribing design alternatives. These
tools are shared with other disciplines such as Market Research and the Social Sciences
and while they may be categorized in different forms (c.f. Gillan, 2000; discipline origin,
function, and stage of design cycle), for practical purposes they may be categorized under
three broad groups, including User Analysis Methods (UAM), Design Tools, and
Usability Evaluation (UE) Tools (Hartson, Andre, & Williges, 2003; Lansdale &
Ormerod, 1994; Kelkar, Khasawneh, Bowling, Gramopadye, Melloy, & Grimes, 2005;
Nielsen, 1993; Usability Net; usability.gov; Usability Professionals Association [UPA]).
• User analysis methods are those tools that focus on learning more about the user
and their environment. These tools include focus groups, user profiles and
personas, ethnographic or observational studies, task analysis, and demographic
surveys. They provide critical data to assist in both design and evaluation.
• Design tools are concerned with guiding or prescribing the design of interactive
products, and are usually available in the form of applied human factors
principles, Gestalt principles, and guidelines for usable designs.
• Usability evaluation tools, also known as Usability Evaluation Methods (UEM;
Gray & Salzman, 1998), are concerned with evaluating existing designs for their
usability by identifying problems and areas of concern. They refer to any method
or technique used to perform usability evaluation or testing to improve the
usability of an interactive design at any stage of its development (planning,
analysis and requirements, design, implementation, test, post release; Hartson et
123
al., 2003; Usability Net, usability.gov). These tools may include heuristic
evaluations, subjective usability evaluations, usability testing, and performance
metrics, etc
User Analysis Methods
User analysis methods are generally used at the front-end of development in order
to learn about the end-user of the artifact under design; particularly during the initial
phases where elicitation, analysis, specification and validation of requirements are
conducted. User analysis involves the identification of characteristics of the user
population that are likely to influence their acceptance and effective use of a product or
system (Dillon & Watson, 1996). These analyses are highly context sensitive and
generalize poorly across domains, which implies they must be carried out and repeated
across applications.
Nielsen (1993) suggests that users may be characterized using three general
parameters: domain knowledge, computing experience, and application experience.
While these three aspects are useful from a global perspective, Booth (1990) proposes a
more detailed and comprehensive breakdown of the aspects targeted by user analysis,
including: User Characterization, Task Analysis, Situation Analysis, and Acceptance
Criteria (Booth, 1990).
• User Characterization focuses on understanding who target users are, and their
characteristics such as demographic information, background (e.g. knowledge,
training, etc.), any usage constraints (e.g. voluntary vs involuntary), personal
preferences (e.g. attitudes, individual traits) and job characteristics (where
applicable).
124

• Task Analysis focuses on identifying target users’ goals, what users want to
achieve as an end state, and tasks, what users must do to achieve said goals. This
also includes the development of an understanding of the tools and the
environment in which users interact. A task analysis may involve the definition of
goals, task characteristics, task dependencies and criticalities, existing challenges
to those tasks, task criteria (e.g., sequence, frequency, flexibility, etc.), user
discretion, and task demands (e.g., physical, cognitive, perceptual, environmental,
health and safety).
• Situational Analysis focuses on the understanding of the situations that regularly
arise as part of a user’s routine activities and how these conditions may influence
the user. A situational analysis entails considerations of system-level interaction
aspects such as equipment, availability (e.g., data, people, materials, support,
etc.), overloads to the system or user, interruptions, environment (e.g., physical
and social), and policies.
• Acceptance Criteria focuses on identifying user requirements and preferences so
that these may set parameters for system acceptance criteria.
Design Tools
Design tools are concerned with providing a guide for usable design and are
usually used during initial design in an iterative fashion. Typical examples of these tools
are applied human factors principles, Gestalt principles, and guidelines for usable design.
An example of an applied human factors principle is Fitts’ law, which can be used in the
design of interface items such as targets like buttons, text, etc. (Gillan & Bias, 2001). The
principle of similarity, an example of a Gestalt principle, states that things which share
125
visual characteristics (e.g., shape, size, color, texture) will be seen as belonging together
(Mullet & Sano, 1995). Research-Based Web Design & Usability Guidelines (U.S.
Department of Health and Human Services, 2006) and Apple (Apple Human Interface
Guidelines, Apple Inc. 2008) are examples of guidelines that provide prescriptions for
usable design. Nielsen’s (1993) heuristics are similar although they are commonly used
as an evaluation tool that could otherwise be used to guide usable design. Nielsen
(www.nngroup.com) has also produced specialized design guidelines (e.g., for children,
teens, seniors) in addition to more general usability guidelines. Similarly Baker,
Greenberg, and Gutwin (2002) have adopted the general Nielsen’s heuristics to develop
their own set of eight groupware heuristics. Such usability guidelines abound on the web,
yet most lack empirical or theoretical support and few attempt to generalize their
recommendations. Unfortunately usability may be difficult to generalize as it is a product
of the needs of an artifact’s intended users. Even when such guidelines are grounded in
human factors research, they are subject to contextual variances which limit their general
application (c.f. Gillan & Bias, 2001; “…the cognitive and perceptual processes used to
read graphs [or other interaction elements] vary as a function of many different
contextual variables: the task, the specific features of the graph, and the graph reader’s
knowledge, strategies, and culture.” pp. 362).
Given that design tools are aimed at initial design and this effort is targeted at
enhancing the evaluation process, more specifically at formative evaluation, which takes
place once a design has been instantiated, design tools are considered to fall outside the
scope of the current research and thus are not further discussed herein.
126
Usability Evaluation Methods
Usability evaluation methods may be broken down into four main sub-categories:
analytical methods, specialist reports, user reports, and observation methods (Whitefield
et al., 1991).
- Analytical methods involve the application of human cognition models to
provide insight into a systems predicted usability (e.g., performance,
efficiency, learnability, workload), generally during the conceptual design
stage before a system has been developed..
- Specialist reports are evaluations by human-computer interaction (HCI)
professionals of the usability of the target system in terms of identifying good
design features as well as potential issues or problems.
- User reports rely on domain user’s subjective and experiential feedback about
an interactive product, generally during the conceptual design stage or when
an existing design is available for evaluation (e.g. a competitor’s offerings,
prototypes, earlier versions, etc.)
- Observation methods employ empirical studies (usability studies) with users
interacting with the target system either in a laboratory or in the field.
Advantages and disadvantages of various UEM are presented in Table 2.
When adopting a holistic evaluation approach it is important to note that each
UEM produces distinct outputs which may not be readily comparable. Yet, it is necessary
to prioritize and rate the severity of the issues found via each UEM because in practice it
may not be possible to address all issues, and thus only those that have the highest impact
on project goals may get implemented (Høegh, Nielsen, Overgaard, Pedersen, & Stage,
127
2006). Furthermore, while usability practitioners are tasked with assessing the usability
of products, given their role in a project they may not be in a position to weigh in on
decision making with regard to product design/redesign. For such reasons it is essential
that the results from the application of UEM are readily usable by decision makers,
prioritized or set-up for reprioritization for decision making and integrated across
methods for ready interpretation. In order to help address these needs, an approach for
integrating the results from utilizing various UEMs is herein proposed such that trade-off
analysis can be conducted by decision makers.
128
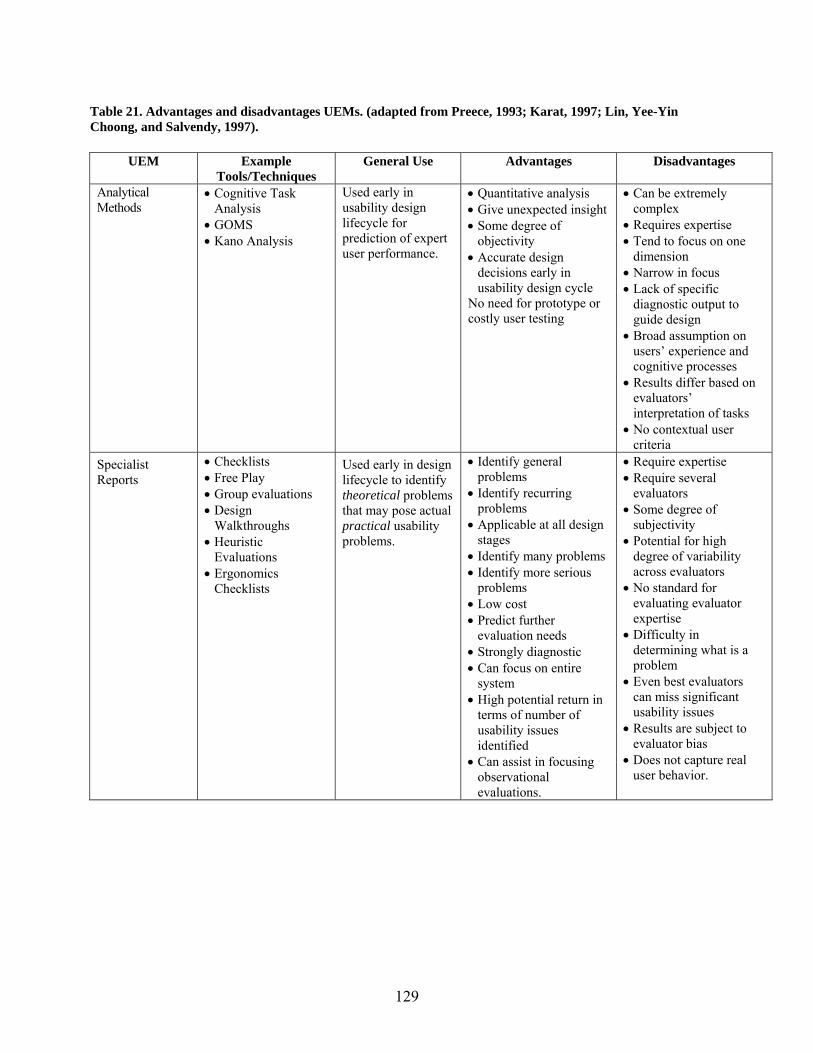
Table 21. Advantages and disadvantages UEMs. (adapted from Preece, 1993; Karat, 1997; Lin, Yee-Yin Choong, and Salvendy, 1997).
UEM Example
Tools/Techniques General Use Advantages Disadvantages
Analytical Methods
• Cognitive Task Analysis
• GOMS • Kano Analysis
Used early in usability design lifecycle for prediction of expert user performance.
• Quantitative analysis • Give unexpected insight • Some degree of
objectivity • Accurate design
decisions early in usability design cycle
No need for prototype or costly user testing
• Can be extremely complex
• Requires expertise • Tend to focus on one
dimension • Narrow in focus • Lack of specific
diagnostic output to guide design
• Broad assumption on users’ experience and cognitive processes
• Results differ based on evaluators’ interpretation of tasks
• No contextual user criteria
Specialist Reports
• Checklists • Free Play • Group evaluations • Design
Walkthroughs • Heuristic
Evaluations • Ergonomics
Checklists
Used early in design lifecycle to identify theoretical problems that may pose actual practical usability problems.
• Identify general problems
• Identify recurring problems
• Applicable at all design stages
• Identify many problems • Identify more serious
problems • Low cost • Predict further
evaluation needs • Strongly diagnostic • Can focus on entire
system • High potential return in
terms of number of usability issues identified
• Can assist in focusing observational evaluations.
• Require expertise • Require several
evaluators • Some degree of
subjectivity • Potential for high
degree of variability across evaluators
• No standard for evaluating evaluator expertise
• Difficulty in determining what is a problem
• Even best evaluators can miss significant usability issues
• Results are subject to evaluator bias
• Does not capture real user behavior.
129

UEM Example Tools/Techniques
General Use Advantages Disadvantages
Observation Methods (
• Facilitated Free-Play • Direct Observation • Video • Verbal Protocols • Computer Logging • Think Aloud
Techniques • Field Evaluations • Quantitative
Measures • Alternative Design
Comparisons • Free Play • Facilitated Free-Play • User Testing
Used in iterative design stage for problem identification or for competitive analysis in final testing of system or summative usability evaluations
• Identify serious problems
• Identify recurring problems
• Avoid low-priority problems
• Some degree of objectivity
• Quickly highlights usability issues
• Verbal protocols provide significant insights
• Provides rich qualitative data.
• Powerful and prescriptive method
• Can provide quantitative data
• Can provide a comparison of alternatives
• Reliability and validity of quantitative measures generally good.
• Requires expertise • High cost • May be unnatural to
users • Observation can affect
user performance with system
• Analysis of data can be time and resource consuming.
• Formal experiment is generally time and resource consuming
• Structured protocols can have a narrow focus
• Tasks and evaluative environment can be contrived
• Results difficult to generalize.
User Reports Evaluation (explicit)
• Questionnaires • Structured
Interviews • Focus Groups
Used any time in design lifecycle to obtain information on users’ preferences and perception of a system.
• Low cost • Provides insights into
users’ opinions and preferences
• Provides insights into users’ understanding of system
• Can be diagnostic • Rating scales can
provide quantitative data
Can gather data from large subject pools.
• Subjective • User experience
important • Possible user response
bias • Response rates can be
low • Possible interviewer
bias • Analysis of data can be
time and resource consuming
Evaluator may not be using appropriate checklist to suit situation
User Reports Evaluation (implicit)
Psycho-physiological Measures of Satisfaction • EEGs • Heart rate • Blood pressure • Pupil dilation • Skin Conductivity • Level of adrenaline
in blood
Used any time in design lifecycle to obtain information on user satisfaction.
Eliminate user bias by employing objective measures of user satisfaction.
Invasive techniques are involved that are often intimidating and expensive for usability practitioners.
130
In addition to understanding the classification of methods, it is also important to
understand the aim of the evaluations for which they are used. There are two main types
of evaluations: formative and summative (Hewett, 1986); which play important parts at
different stages of the development process.
• Formative usability evaluations are diagnostic in nature and focus on identifying
usability problems that need to be resolved before a final design is accepted for
release. They typically incorporate the use of specialist reports or observational
methods with the primary goal of identifying usability shortcomings rather than
quantify or scientifically evaluate usability performance. They are often done at
several stages of design and development with the objective of improving a
design by uncovering usability problems and supporting decision-making about
designs elements or features (Hartson, Andre, Williges, 2001; Quesenbery, 2004).
• Summative usability evaluations focus on evaluating the efficacy of the final
design or comparing it against competing design alternatives in terms of usability.
They typically incorporate the use of structured observation and user reports or
analytical methods, with the emphasis on documenting usability performance for
baseline or comparative purposes. They are generally done after development to
make an assessment of the design and used to assess or compare the “level” of
usability achieved by a design and as such are usually more rigorous and formal
than formative evaluations, often seeking statistical significance. These forms of
evaluation are usually based on the three key elements that define usability in
ISO9241-11: effectiveness (completeness and accuracy), efficiency (resources
131

expended), and satisfaction (Hartson, Andre, & Williges, 2001; Quesenbery,
2004).
132

APPENDIX D: iUXEV METHODS
133

User Analysis
The User Analysis within the iUXEV model seeks to understand the need for
specific functionalities in the product under development in order to assist in the decision
analysis conducted later in the process. The emphasis of this component of iUXEV is to
gain sufficient understanding regarding the user and its environment in an efficient
manner and not to repeat the more extensive user analysis that has already taken place at
the onset of product conception. The findings of this User Analysis will both guide the
evaluation process and assist in the prioritization of evaluation findings to direct future
development.
While many UAM could be used, the current effort integrates two key UAMs, a
form of Analytical Method (i.e., Kano Analysis) and a form of User Reports (i.e., focus
groups) . Other UAMs could be selected to support the user analysis and integrated via
the iUXEV model, the key to selecting the method is to address the logistical needs
outlined earlier such that this analysis is effective and efficient, and the method selected
is appropriate for eliciting user needs and transforming them into features or
functionalities which can then be linked to the results of the User Experience Evaluation
component of iUXEV.
User Analysis Overview
Focus groups are a traditional method adapted from MR where a group of
individuals is invited to participate in a structured discussion designed to gain insight on a
target topic (c.f. Langford & McDonagh, 2003). The focus group was selected over other
UAM (e.g., interviews, observation), due to its efficiency and ability to obtain the
134
necessary data for iUXEV. A second UAM selected was Kano analysis (Kano, 1984),
which is a quality engineering methodology for categorizing features or requirements for
determining what is important for customer satisfaction. It was selected for its ability to
transform subjective data into objective categories with great efficiency. Kano analysis
was selected due to its focus on functionality, and its capability to discriminate between
user needs and user wants. This type of information is critical in experience evaluations
as it serves to not only to prioritize redesign recommendations (e.g. target issues that
impact user needs first, and those that impact user wants later), but also because it is
critical to understand which aspects of a user’s needs and expectations are targeted or met
by the product. Both McNamara and Kirakowski (2006; Functionality, Usability,
Experience) and Jordan (2000; Functionality, Usability, Experience) suggest in their UX
models that Functionality plays a key role in determining the quality of the experience
with a product. For instance Jordan (2000) suggests that good user experience is
supported by a hierarchical order of needs in which needed functionality is primordial
and followed in priority by usability and pleasure (e.g. a product functionality is required
to serve one’s needs in order for the product to be effective, if a product is unable to
deliver the needs of the user, its usability would be of little or no value, and if a product
doesn’t either serve a need or isn’t usable it is unlikely to deliver any pleasure).
Focus Group
When seeking to integrate usability results from various UEM, it is essential to
modify traditional approaches so that they can feed this integrative process. To achieve
this goal, the focus group can be directed at assessing four components of user
interaction, including: 1. How users behave in their environments (e.g., focus group
135
question: “Please mention three ways you do X”), followed by an inquiry into those items
to discuss 2. How users accomplish these behaviors in their environments (e.g., focus
group question: “Please discuss the steps in which you do X”), followed by a discussion
of 3. What challenges users encounter in their environments (e.g., focus group question:
“Please discuss the challenges you have had while doing X”), and finishing with an
inquiry regarding 4. What solutions might address the challenges encountered by users in
their environment (e.g., focus group question: “Please discuss some potential solutions to
the challenges just discussed”). This final list of potential solutions can then serve as the
foundation for creating a list of system requirement for desired features/functionalities in
the product (see Figure 4). During this process it is also necessary to obtain desired
performance thresholds that would satisfy the correct implementation of the discussed
features/functionalities so that proper prioritization of issues can be attained later in the
evaluation of the product. Further, there is a latent concern in usability evaluation
methods that limiting evaluation tasks to those prescribed by the development team or
only those capable by the system e.g. “How does the implicit assumption that we only
ask participants to do tasks that are possible with a affect their performance in a usability
evaluation?” (Lewis, 2001). This approach mitigates this concern by inviting user
sourced input into contextual tasks they are interested, have difficulties, concerns or
match their needs. Finally it is also key that when using a focus group, the right type of
individuals are identified and invited to participate (for a more in-depth discussion e.g.,
Lilien, Morrison, Searls, Sonnack, von Hippel, 2002).
136

1. “Please mention three ways you do X”
Questions Outputs
“Ice-Breaker”Contextual Tasks
2. “Please discuss the steps in which you do X”
3. “Please discus the challenges you have had while doing X”,
4. “Please discuss some potential solutions to the challenges just discussed”
Primes Participants on IssuesContextual Task Breakup
List of Challenges (opportunities)
List of Potential Solutions
List of Features
Figure 12. Focus Group Format.
Kano Analysis
This analysis stems from the Kano model for customer satisfaction and product
requirements (Kano, 1984). In it Kano discusses three main types of product
requirements that affect satisfaction: Must-be, One-dimensional, and Attractive
requirements (Sauerwein, Bailom, Matzler, & Hinterhuber, 1996). Must-be requirements
represent those aspects of a product which if not included or properly implemented will
results in dissatisfaction (i.e., they are expected); nonetheless these requirements do not
set the product apart from the competition. One-dimensional requirements influence
137
satisfaction proportional to the level of fulfillment (i.e., the more the better). Attractive
requirements are not expected by the user nor traditionally explicitly requested; they lead
to greater levels of satisfaction if implemented, yet they do not lead to dissatisfaction if
not present. The benefits of such classification are salient in that one may readily take
advantage of such classifications for prioritizing further development efforts or use them
as a basis for trade-off analysis (Sauerwein et al., 1996). In order to achieve such a
classification, Kano analysis typically implements the use of two questionnaires (one
positive and one negative), where participants are asked about their feelings regarding the
Inclusion (positive) or Exclusion (negative) of a particular feature utilizing a Likert scale
(Likert, 1932) with alternatives such as: 1. I like it that way, 2. It must be that way, 3. I
am neutral, 4. I can live with it that way, and 5. I dislike it that way (Berger et al., 1993).
With the responses utilizing this scale a matrix may be constructed and the features
categorized as Must-be, One-dimensional, and Attractive requirements.
User Experience (UX) Evaluation
The Experience Evaluation component seeks to understand the user experience in
terms of task performance and personal meaning and consists of an evaluation of
Ergonomic Quality and Hedonic Quality
Ergonomic Quality (EQ)
Ergonomic Quality can be assessed via many methods, including heuristic and
expert-based evaluations, laboratory or on-site usability testing with users, model-based
analytic methods, etc. (see table 2). Yet there is a lack of understanding of the
capabilities, effectiveness and limitations of each UEM given that there is 1) no standard
138
criteria for comparison, 2) no standard definitions, measures and metrics for such criteria,
and 3) no stable standard process for UEM evaluation and comparison (Hartson, Andre,
and Williges, 2001). As such it is difficult to prescribe one method over another as new
methods are added or modified from existing methods in the “usability toolkit”. There is
a concern in the usability engineering community about the quality of performance
evaluations of UEMs. The term “Damaged Merchandize” was used by Gray and Salzman
(1998) in reference to the poor experimental design rigor used by researchers for
evaluating UEMs. These findings were later confirmed by (Hartson, Andre, and
Williges, 2001) through a meta-analysis of UEM evaluation studies. Nonetheless there is
some guideline based on the limited work in this area. For instance Hartson, Andre, and
Williges (2001) conclude that a combination of expert-based and use-based evaluation
methods usually facilitates the formative evaluation process. Further a combination of
qualitative user test data and quantitative results have been found to be a more convincing
and compelling package to aid designers, than either one alone (Knight, Pyrzak, and
Green, 2007) . Stanney, Mollaghasemi, and Reeves (2000) suggest that a combination of
methods is often practical where using a heuristic or expert evaluation, then follow with
user testing being a typical approach. This approach would generally result in the
identification of the most obvious usability issues through the heuristic evaluation, which
would then be confirmed and complemented with the user testing evaluation where also
other issues that may have been missed by the first evaluation could be uncovered. In
addition, even though Hartson, Andre, and Williges (2001) could not identify much
empirical data in their analysis, they indeed found enough statistical data that suggested
that the heuristic evaluation method did had higher “thoroughness” scores compared to
139
other methods. Where thoroughness is the number of problem identified over the number
of real problems that exist in a design.
Thus the following two methods were selected to be integrated via the iUVE: a
heuristic evaluation and user testing with domain users.
Hedonic Quality
Currently there are very limited methods for assessing hedonic quality, which has
been a factor in the limited activity in assessing non-traditional aspects of user-centered
design (Lewis, 2001). Early efforts have involved satisfaction questionnaires, semantic
differential lists and other forms of subjective assessment. Nonetheless these methods do
not address the source of the hedonic quality (i.e. what is causing a user to feel in a
particular way). It is the study of the emotional experience an individual has with a
product which uncovers the root of this hedonic quality of the interaction. Emotions are
at the core of human experience and the key to understanding and designing user
experiences (Forlizzi & Battarbee, 2004). This is because emotions are integral to the
creation of an individual’s plans and intention, the organization of these plans, and the
evaluation of outcomes (Carlson, 1997). Thus, when interacting with products, emotions
affect the interaction’s plan, execution and perception of outcomes surrounding such
interactions; emotions serve as a means for understanding and communicating what
individuals experience ((Forlizzi & Battarbee, 2004). This is not to say that emotions are
the only means by which to assess the hedonic component of UX, other intentional
affective phenomena (i.e. which have an identifiable source or elicitation) such as
Attitudes may be use, or other subjective descriptive approaches (e.g. semantic
differentials).
140
For instance, Kansei Engineering, which through a series of steps allows the
creation of a semantic instrument for determining the relevant factors to which a
particular context is evaluated (e.g. affective criteria) using statistical methodology.
Kansei Engineering is of special interest given its status as the only method expressly
designed for quantifying emotional customer needs and developing them into products
(Schütte, 2005). With these criteria alternative designs are evaluated using end users to
express their feelings regarding the designs. Through scoring, and at times modeling, the
best alternative is selected or the best design parameter estimates are identified. This
yields the ability to not only identify the impressions of individuals but to predict how a
potential design may be perceived by individuals. A disadvantage of the Kansei method
is its complexity. Other methods in this category are context specific standardized tools
such as the Semantic Description of Environment (SMB) (Küller, 1975 in Karlsson,
Aronsson, & Svensson, 2003). For instance the SMB has been used in the evaluation of
vehicle interiors and is able to distinguish and rate products based on visual aesthetic
evaluations (Karlsson, et. al., 2003). Although the SMB method is simpler than the
Kansei (in which an instrument like the SMB is developed in the process), both methods
lack the ability to indicate why individuals feel as they do.
With this limitation in assessment methodology, the current effort focused on
utilizing emotions as a means for assessing the hedonic component of UX. For this effort
a method and tool were developed as means for, not only assessing user emotions, but
assess the source of such emotions. The development incorporated the use of emotional
theory and research findings for the creation of a non-verbal subjective assessment tool
which considered all aspects of the hedonic user experience (see Chapter 5 for a more
141
detailed discussion and case study application of the method and tool). Thus, for the
current effort, emotional profiling was selected to be integrated via the iUVE because it is
the only known approach that may assess in an objective matter the often neglected
hedonic quality of the user experience.
User Experience Evaluation Overview
Heuristic Evaluation
The assessment of Ergonomic component of UX often begins with a heuristic
evaluation (Nielsen, 1993) during which, armed with domain information, a group of
usability experts evaluate a product for usability shortcomings. A heuristic approach is
often a first choice because it is a “discount usability” method (Nielsen, 1993) capable of
identifying a significant amount of issues, which can be readily used for further analysis
by more involved methods such as user testing. Heuristic evaluations are carried out
individually by a set of evaluators and later their findings are combined and discussed
among the team. More than one evaluator is necessary in order to mitigate for biases,
evaluation skill level, and to maximize the opportunity for finding the most issues
(Kirmani & Rajasekaran, 2007). For instance one evaluator may detect between 19% to
65% of the problems in an interface (Lewis et al. 1990, Nielsen and Landauer, 1993). In
fact it has been recommended that three to five evaluators be considered (Nielsen &
Landauer, 1993). Together with the usability shortcomings, evaluators categorize and rate
the severity of identified usability problems in an effort to prioritize and organize the
findings for ease of understanding and decision making (the categorization and
prioritization of usability problems will be discussed later).
142
Utilizing the findings from the heuristic evaluation, the EQ evaluation continues
with a more targeted empirical approach with user testing. This is important since
usability issues need further confirmation, as it has been found that experts may be
inconsistent in the number of problems they identify, and overestimate or underestimate
the severity and prevalence of problems (Catani & Biers, 1998; Hertzum & Jacobsen,
2003).
User Testing
User testing is a technique that borrows aspects from the social sciences where
users are asked to interact with the target product under prescribed conditions while being
observed and measured. In this type of evaluations key tasks, functionalities, user issues,
and concerns derived during the initial User Analsysi and focus group are fed into the
design of scenarios that are to be tested. Further, data from the heuristic evaluation are
utilized to further study those areas where usability issues where identified. These
methods make it possible for the testing component to target aspects of the product that
have the greatest impact on users or those aspects that have been identified as
problematic or of possible concern. The output of user testing is an objective
representation of the extent of the observed usability shortcomings in a quantifiable
format (in terms of user performance).
Emotional Profiling
The Personal-Hedonic component of UX in the iUXEV model is approached from
an emotional perspective in order to understand the meaning behind the user experience.
While there is no one definition of emotion (Plutchik, 1980), emotions are multi-
component phenomena experienced by individuals and are associated with behavioral
143
reactions, expressive reactions, physiological reactions, and subjective feelings (Desmet,
2002). Emotions are brief episodes of coordinated changes (brain, autonomic, and
behavioral) to facilitate a reaction to a significant event that last very brief episodes, from
seconds to minutes (Ekman, 1994). Feeling are the “the subjective representation of
emotions” (Scherer & Peper, 2001). Emotions are elicited through a process of appraisal
under which a stimulus (the product) and an individual’s concerns (i.e., the user’s goals,
standards and attitudes) come together during an experience and are judged in terms of
what it means to the individual (Arnold, 1960). Thus, emotional profiling is carried out
to understand what kinds of emotions are produced during product interaction and at the
same time what caused those emotions to be elicited (i.e., the source of the emotion).
This results in three key outputs: 1. discrete emotions (what emotions were felt by the
user); 2. emotional valence and intensity (whether the emotion was positive or negative,
and how strong it was); and the 3. source of the emotion (what made the user feel that
way). Together these data allow the creation of an emotion profile of the user experience
(further discussion on the Emotional Profiling method follows in Chapter 6).
144

APPENDIX E: EMOTION AND DESIGN
145
Introduction
While one would feel compelled to argue that we make objective decisions and could
possibly choose among several items on their performance characteristics alone, it is
evident that emotions play a similar if not stronger role in our selection criteria. We make
emotional decisions when selecting artifacts and more importantly we express emotions
through the artifacts we choose. The notion of studying emotions associated with
products or services is not a new concept; it has been around for quite some time and is a
core part of the branding and advertising industry. Emotional appreciation for artifacts is
what individuals admit to when purchasing clothes or admiring objects, they make
decisions based on experience and subjective judgments that satisfy their concerns within
a particular context (e.g. fashion, interests, social belonging, etc.) (Helander & Ming Po
Tham, 2003)
The effect of emotions in the marketing and design of products is an ever
increasing factor as companies strive to differentiate their products from other similar
ones. This is accelerated as new technologies and rapid product life-cycles transform
fairly recently introduced innovations into commodities that are threatened by aggressive
competition.
As stated in the editorial of the Proceedings of the First International Conference
on Design & Emotion (Overbeeke & Hekkert, 1999):
“…when two coffee makers basically make the same pot of coffee, we take the one that
gives us a pleasant, desirable, or inspired feeling.”
146
Simply ignoring such emotional factors is not an option, as “There is no such
thing as a neutral interface” (Gaver, 1999, pg 51). A design will always elicit some kind
of emotion, whether intended or not. It is too risky to leave to chance the emotional
impact of a product given the enormous development expenditures involved in creating
products. To face these types of challenges an objective measurement of a product’s
emotional content is needed to inform designers and ensure that said products match the
requirements of the intended customer.
The subsequent sections in this text discuss the different components and issues
associated with products and emotions that are later used to propose a process to inform
the design of product emotions and a direction for the design of tools to support such a
process.
Emotions
Affective Phenomena
No discussion of emotions should be started before defining the different
terminology that often times are used interchangeably (affect, emotions, moods, etc.).
“The Handbook of Affective Science” (Davidson, Scherer, & Goldsmith, 2003)
distinguishes between emotion and affective science, by defining emotions as a subset of
affect. Six major affective phenomena may be observed: Emotions, Feelings, Moods,
Attitudes, Affective Styles, and Temperament. In addition affective phenomena may be
characterized by the factors that give rise to them, by their origin: Intentional Vs Non-
Intentional, and Acute Vs Dispositional (Desmet, 2002). The first dichotomy refers to the
existence or not of a relationship between the individual experiencing the phenomena and
a particular stimulus. Intentional states refer to those states that have a relationship with
147
the stimulus (e.g. one is angry at someone); in contrast to Non-Intentional states (e.g. one
is depressed). The second dichotomy refers to the endurance of a state. Acute states have
a definite time limitation (may be short or long) having a beginning and an end, in
contrast to Dispositional states, which are enduring in nature.
• Emotions are defined as brief episodes of coordinated changes (brain, autonomic,
and behavioral) to facilitate a reaction to a significant event. In addition, emotions
are targeted and involve a relationship between the individual experiencing the
emotion and the object of the emotion (Frijda, 1993; 1994) (e.g. one is angry
at…). The primary objective of emotions has been suggested to be “to modulate
or bias action” and they are generally associated with precipitated events that are
perceived as occurring rapidly (Davidson, 1994). Furthermore they are said to last
very brief episodes, from seconds to minutes (Ekman, 1994). Feelings are “the
subjective representation of emotions” (Scherer & Peper , 2001), or in other
words the experiencing of an emotion.
• Moods are subtle affective states with lower intensity than emotions, are longer in
duration (Davidson, et. al., 2003; Ekman, 1994), and are characterized by their
non-intentional nature (Frijda, 1994) (e.g. not directed at a particular item or
event, etc.). They provide the “emotional color” to all one does (Davidson, 1994).
• Attitudes / Sentiments are long lasting predispositions towards identifiable stimuli.
• Affective-Styles / Emotional Traits refer to relatively longer lasting dispositions
that bias response to stimuli (Davidson, et. al., 2003). They are the individual
differences that modulate the emotional reactions to stimuli (Davidson, 1992),
148
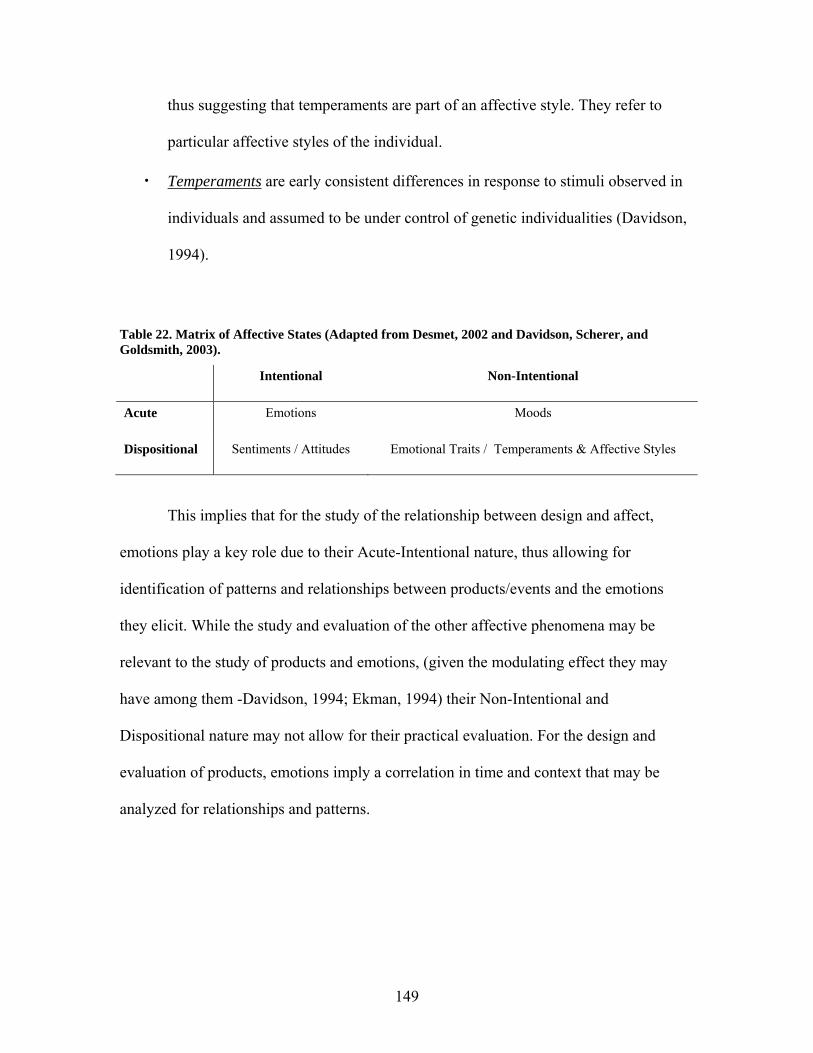
thus suggesting that temperaments are part of an affective style. They refer to
particular affective styles of the individual.
• Temperaments are early consistent differences in response to stimuli observed in
individuals and assumed to be under control of genetic individualities (Davidson,
1994).
Table 22. Matrix of Affective States (Adapted from Desmet, 2002 and Davidson, Scherer, and Goldsmith, 2003).
Intentional Non-Intentional
Acute Emotions Moods
Dispositional Sentiments / Attitudes Emotional Traits / Temperaments & Affective Styles
This implies that for the study of the relationship between design and affect,
emotions play a key role due to their Acute-Intentional nature, thus allowing for
identification of patterns and relationships between products/events and the emotions
they elicit. While the study and evaluation of the other affective phenomena may be
relevant to the study of products and emotions, (given the modulating effect they may
have among them -Davidson, 1994; Ekman, 1994) their Non-Intentional and
Dispositional nature may not allow for their practical evaluation. For the design and
evaluation of products, emotions imply a correlation in time and context that may be
analyzed for relationships and patterns.
149
Schools of thought
In order to pursue the study of the role emotions play within the real of design,
i.e., how do humans experience artifacts at an emotional level, it is necessary to explore
the construct of emotions in order to understand them and how to assess them.
There are four (4) identified traditions on views associated with emotions. The
Evolutionary / Darwinian, The Bodily-Feedback / Jamesian, The Cognitive, and The
Social Constructivist.
The Evolutionary or Darwinian
This tradition is based on Darwin’s 1872 book The Expression of Emotion in Man
and Animals. It holds that emotions are phenomena with important survival functions that
have been selected through evolution for their value in resolving challenges faced by the
species. The exact number of emotions isn’t clear, Desmet (2002) cites for example “200 to
300” emotional words in the English language. Aaker, David, Douglas, Sayman, and
Vezina (1988) cite several works with which they composed a list of over 655 different
“feelings”. These lists nonetheless are likely to contain synonyms or related emotions; yet
from a Darwinian perspective it is observed that a particular set of emotions is observed
in all humans (Cornelius, 2000). These core or basic emotions that are said to be shared
by all humans, and are thought to be the ones from which others are derived from
(Cornelius, 1999). Table 23. shows a list of some of these basic emotion types. In
general it is observed that there these lists vary slightly in number, they mostly include
Cornelius’ (1996) “Big Six”: happiness, sadness, fear, disgust, anger, and surprise, as
well as other similar classifications. These are seen as representations of survival related
responses selected over the course of evolution. For the design and evaluation of products
150
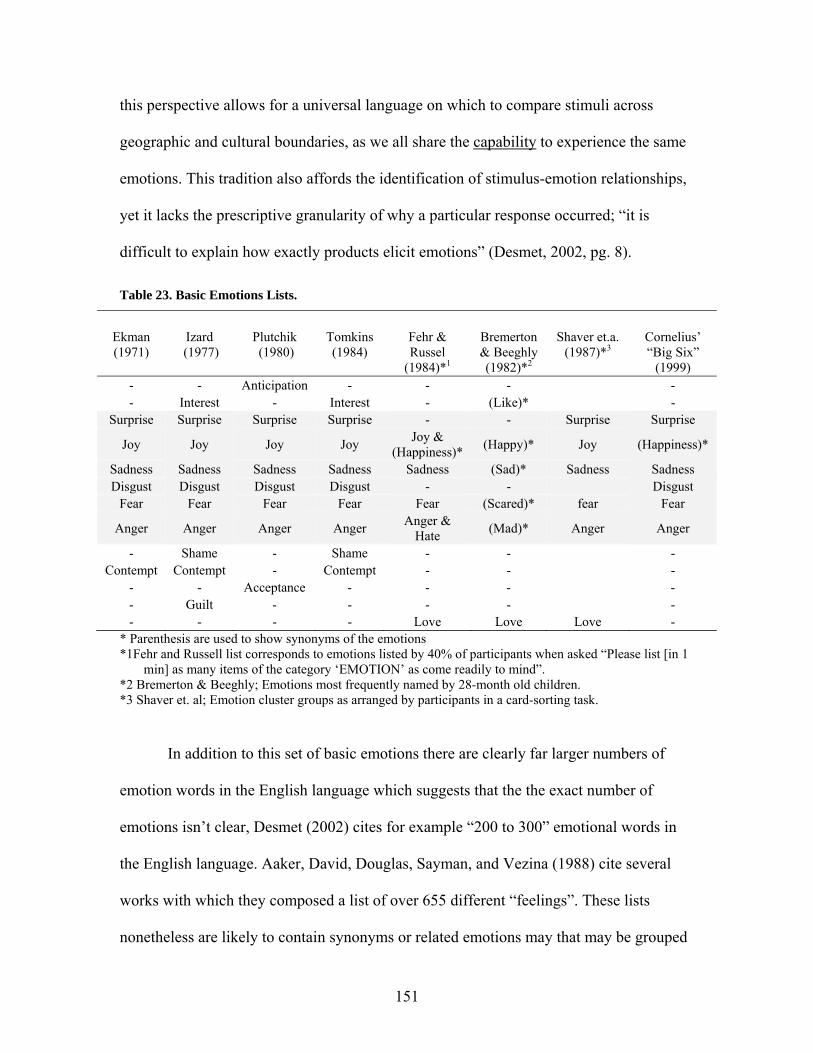
this perspective allows for a universal language on which to compare stimuli across
geographic and cultural boundaries, as we all share the capability to experience the same
emotions. This tradition also affords the identification of stimulus-emotion relationships,
yet it lacks the prescriptive granularity of why a particular response occurred; “it is
difficult to explain how exactly products elicit emotions” (Desmet, 2002, pg. 8).
Table 23. Basic Emotions Lists.
Ekman (1971)
Izard (1977)
Plutchik (1980)
Tomkins (1984)
Fehr & Russel
(1984)*1
Bremerton & Beeghly (1982)*2
Shaver et.a. (1987)*3
Cornelius’ “Big Six”
(1999) - - Anticipation - - - - - Interest - Interest - (Like)* -
Surprise Surprise Surprise Surprise - - Surprise Surprise
Joy Joy Joy Joy Joy & (Happiness)* (Happy)* Joy (Happiness)*
Sadness Sadness Sadness Sadness Sadness (Sad)* Sadness Sadness Disgust Disgust Disgust Disgust - - Disgust
Fear Fear Fear Fear Fear (Scared)* fear Fear
Anger Anger Anger Anger Anger & Hate (Mad)* Anger Anger
- Shame - Shame - - - Contempt Contempt - Contempt - - -
- - Acceptance - - - - - Guilt - - - - - - - - - Love Love Love -
* Parenthesis are used to show synonyms of the emotions *1Fehr and Russell list corresponds to emotions listed by 40% of participants when asked “Please list [in 1
min] as many items of the category ‘EMOTION’ as come readily to mind”. *2 Bremerton & Beeghly; Emotions most frequently named by 28-month old children. *3 Shaver et. al; Emotion cluster groups as arranged by participants in a card-sorting task.
In addition to this set of basic emotions there are clearly far larger numbers of
emotion words in the English language which suggests that the the exact number of
emotions isn’t clear, Desmet (2002) cites for example “200 to 300” emotional words in
the English language. Aaker, David, Douglas, Sayman, and Vezina (1988) cite several
works with which they composed a list of over 655 different “feelings”. These lists
nonetheless are likely to contain synonyms or related emotions may that may be grouped
151

or reduced to a smaller core number of emotions. While the exact number of emotions
might be an elusive answer, important aspect with implications to design and emotion is that
they may be reduced to manageable numbers that may still provide sufficient detail to
inform design. This is precisely what Desmet (2002), Richins (1997) and Aaker, et.al.
(1988) have attempted to do for their own contexts; using the rationale that some
emotions are more likely to be elicited or relevant to some contexts than others. Desmet,
for instance focused on “product appearance” (he was implying product perception),
Richins’ focus was on product elicited emotions in general, and Aaker et.al. focused on
advertising.
The Bodily-Feedback or Jamesian
This tradition is based on William James’ 1884 work “What is an emotion?” and
follows his reasoning that “the bodily changes follow directly the PERCEPTION of the
exciting fact, and that our feeling of the same changes as they occur IS the emotion”
(James, 1884 pg. 189-190). Similar to the Darwinian approach , under this tradition
emotions are considered automatic predispositions to environmental stimuli for the
purpose of survival. For the context of design and emotion the implications of this
tradition affords three possibilities: one, eliciting or suggesting a physical reaction pattern
in users may lead to a sought emotion, or at least prime for them (e.g., smile and induce
happiness); two, that by modifying multimodal patterned stimuli a particular emotion
may be modulated (e.g., Cornelius -2000, sites evidence that the amount of loss of nerve
sensitivity has a relationship with the intensity of experienced emotions –Hohmann,
1966; and Chwalisz, Diener & Gallger, 1988); and three, that observing physiological
patterns and changes may allow for the measurement of an emotion and its intensity.
152
This provides the prospect for expressly designing specific emotions into a product (i.e.,
through multimodal stimuli) and measuring whether or not such targeted emotions are
indeed elicited during interaction with the product.
The Cognitive
This tradition shares its origins with ancient philosophy, and its central
assumption is that emotion and thought are inseparable. All emotions are understood to
be dependant on an appraisal (Arnold, 1960), a process through which environmental
stimuli are judged as beneficial or not (Cornelius, 2000). Furthermore this tradition holds
that every emotion is associated with a specific and different pattern of appraisal that is
linked to the individualities of each organism (e.g., life experience, temperament,
physiological state). In this perspective emotions are seen as non-deliberate “direct,
immediate, nonreflective, nonintellectual, [and] automatic” sense judgments (Arnold,
1960, pg. 174). While different theories exist within this tradition, they all converge on
the use of “appraisal dimensions” (e.g. pleasantness, activation, control, certainty,
responsibility, effort, etc.) whose combination results in a particular emotion. For the
context of emotion and design, this perspective has great promise. It affords the
traceability of elicited emotions by understanding how the individual appraises a
stimulus. In addition, by understanding an individual’s “perspective” one may be able to
“mold” or design a stimuli to elicit or prime for a sought emotion.
The Social Constructivism
This tradition holds that emotions are cultural creations resulting from learned
social rules that may only be understood with social insight (Cornelius, 2000). This
approach also considers the use of an appraisal component, yet it adds an additional level
153
of granularity by describing the social threshold between the appraisal dimensions (e.g.,
what is pleasant from unpleasant). The implications to the design and emotion context are
the possibility of understanding and mitigating for social constructs that may affect the
emotions elicited by a particular stimulus as it transcends cultural borders.
Implications
The review of the different traditions allows one to draw insight as to how to
incorporate and assess emotions within the context of design. Both the Darwinian and
Jamesian traditions suggest that all human beings share the capability to experience the
same emotions, thus granting one the opportunity to compare products and the reactions
consumers express towards them utilizing a rather universal common language among
humans. These traditions suggest that a particular emotion can be targeted through
design, yet not without first understanding the “source” of such an emotion. The
Cognitive tradition suggests that one must develop empathy for the consumer, through an
understanding of their pattern of appraisal, if one is to understand the “source” of an
emotion and attempt to predict emotional reactions. Furthermore, such empathy is not
readily generalized, as specific cultural variations must be taken into account as
suggested by the Social Constructivist tradition.
154
Distinguishing Emotions
The preceding sections discussed the different perspectives taken in an attempt to
define and understand emotions; yet they do not discuss how one is to identify one
emotion from another one. Emotions are multi-component phenomena consisting of:
expressive reactions, physiological reactions, behavioral reactions, and subjective
feelings thus to distinguish emotions from one another, the literature offers three
approaches: by Their Manifestations, by Their Core Relational Theme, or by Their
Appraisal Dimensions.
By Their Manifestations
Manifestations refer to the observable signs that an individual exhibits while
experiencing an emotion. There are four (4) main emotion manifestation components
one may utilize to identify emotions: Behaviors, Expressions, Physiological Reactions,
and Subjective Feelings (Desmet, 2002). Each brings opportunities and challenges when
trying to expressly design specific emotions into a product and assessing whether or not
the targeted emotions have been elicited.
Behaviors are reactions engaged while experiencing an emotion (e.g., fidgeting,
taking a step back), that upon observation may identify the emotion experienced by an
individual. Expressions are facial, vocal or postural reactions that form a pattern tied to
specific emotions. Physiological Reactions are changes in bodily function that come
while experiencing an emotion (e.g. sweat). Subjective Feelings are the conscious
awareness of an affective state. For the context of emotion and design, these four
avenues allow one to match an emotion assessment method to distinct needs particular to
an experience or to serve as confirmatory methods for the deficiencies of another method.
155
Thus a repertoire of assessment tools is required to adapt to the differing needs of
consumer experiences.
By Their Core Relational Theme
As discussed in the Cognitive and Social Constructivism traditions, emotions are
the result of a particular pattern of appraisal. That is, a set of conditions are experienced
by an individual that result in a particular emotion. By understanding and modeling the
different involved appraisals one may distinguish between emotions, and also present
some explanation of their source. A Core Relational Theme is a “higher level of
abstraction” of the appraisal process that views emotion components as a whole, (e.g.
Experiencing Anxiety is the result of an individual facing an uncertain, existential threat-
Lazarus, 2001). For the context of emotion and design, this means that by identifying a
particular emotion one may be able to “reverse engineer” an emotion to a pattern of
appraisal (i.e. by studying the events and appraisals that preceded the emotion). It also
implies that to create a sought emotion and predict its occurrence one could model
environmental stimuli to match a particular pattern of appraisal.
By Their Appraisal Dimensions
Similar to the Core Relational Theme method, using dimensions to distinguish
emotions is based on the premise that emotions are composed of a series of binary
choices across different appraisal dimensions (e.g. Pleasantness or Unpleasantness). An
emotion is explained by the appraised belief (e.g. good or bad) among a series of
dimensions (e.g. pleasantness, activation, control, certainty, responsibility, effort, etc.)
that describe an emotion. For example to experience Anger the following conditions
apply, Angry = NO(pleasantness) + NO(responsibility), while to experience Guilt =
156
NO(pleasantness) + Yes(responsibility). In a similar manner to the earlier discussion, by
understanding the conditions that precede emotions and understanding what an individual
is perceiving, one may be able to understand and predict an emotion.
Artifacts and Emotions
The Multidimensional Experience Emotional Experience of Artifacts
In the context of design and emotion, when discussing artifacts and emotions it is
important to identify the different types of relationships possible between humans and
artifacts. Gaver (1999) identified five (5) possible emotional roles artifacts may play in
human-artifact relationships. Artifacts may: Elicit, Allow, Communicate, Recognize, and
Have emotions.
• Elicit, artifacts may elicit emotions by what they are, how they are used, and what
they represent (the relationship to some external event or second artifact).
• Allow, artifacts may allow for the experiencing of emotions by having flexibility
in their composition (e.g. changing color).
• Communicate, artifacts may act as a medium for the communication of emotions
from one person to another (e.g. emoticons).
• Recognize, artifacts may be capable of recognizing emotions using physiological
and behavioral cues (e.g. affective computing).
• Have, artifacts with the use of simulation engines may have and express emotions
in response to environmental stimuli.
This is an important point given that experiences with products may have different
dimensions like those described above and may be experienced at different
levels/domains. This is something that is supported by emotion research as part of the
157
cognitive theory of emotion (Cupchik, 1999; Ortony, Clore and Collings, 1988).
Emotions elicited by artifacts are not fundamentally different than those elicited by other
stimuli. That is, they are authentic emotions as Desmet (2002) proposes using the analogy
of emotion researchers who have studied emotions elicited by works of art (c.f., Fridja &
Schram, 1995; Lazarus, 1991). As such an artifact’s emotional attributes are the result of
three distinct domains: the Sensory/Aesthetic, Cognitive/Behavioral, and
Personal/Symbolic (Cupchik, 1999). What domain is more salient depends on an
individual’s goals, standards and attitudes (Ortony, Clore and Collings, 1988).. For
instance a sensory/aesthetic meaning would serve in a decorative context, a
cognitive/behavioral meaning would play a role in a functional context, and a
personal/symbolic meaning would be important when in a social context. This does not
imply that one domain dominates over the others, or that they are mutually exclusive. All
three levels may play a role in emotions and their relative importance is managed by the
interests of the individual, whether consciously or unconsciously. Others in the field
suggest that this phenomenon is grounded in three distinct levels of brain processing: the
automatic visceral level; the process control behavioral level; and the contemplative
reflective level (Norman, 2004). Each having a particular role in the way interaction with
the environment is managed. The Visceral Level corresponds to the automatic prewired
processes that involve no reasoning and are recognized by the body from sensory
information. The Behavioral Level is the subconscious component that controls routine
behavior. The Reflective Level is an overseer layer that contemplates and biases
behavior. While the visceral level is prewired, the behavioral and reflective levels are
greatly influenced by learning and culture, yielding an infinite number of response types
158
across individuals for similar stimuli. This same phenomena has also been reported in the
study of art where the identity of the “object of the emotion” has been coined. Tan (2000)
suggests that a work of art may elicit two types of emotions - A-emotions and R-
emotions. That is, emotions may be elicited by the characteristics of the object itself (e.g.
color, form, function), A-emotions; or emotions may be elicited by some representation
outside the artifact to which the artifact is associated (e.g. brands, events, people, etc.),
called R-emotions. In product marketing this latter concept has been applied with great
success in the use of “metonymies;” where the use of the name of one artifact or concept
is used for that of another related one, that in turn adds meaning or value (e.g., Nike’s
Michael Jordan shoes) (Dermirbilek & Sener, 2003).
In addition to the “object of the” emotion dimensions (Sensory/Aesthetic,
Cognitive/Behavioral, and Personal/Symbolic) there is a time dimension that also plays a
part in the experience of emotions and thus implications to the relationship between
design and emotion. For instance, some in the design community have reported anecdotes
of changes in emotions with time (Jacobs, 1999). Spontaneously elicited emotions are not
the same as those elicited after some type of exposure to a particular stimulus, due to a
“getting used to” phenomenon. “[People] they begin with an initial impression of the
object, continue through actual experiences utilizing it, and culminate with degrees of
emotional attachment to it” (Cupchik, 1999, pg. 75); that is, repeated exposure to the
same stimulus will results in its reduced potency for eliciting a response through the
principle of habituation (Cupchik, 1995). For instance, habituation within human-human
relationships, in particular romantic relationships, begin with an explosion of vibrant
emotions that subdue to a more tranquil “attachment” with time (Fischer, 2004).
159
In the context of design and emotion this is a key aspects of the understanding of
the emotional experience with artifacts (i.e., designs) since it implies that these
experiences are multidimensional and may even contain references to factors that reside
outside the artifact itself (i.e. its relationship to something else) and thus the “object of
the emotion,” is key. Further, this multidimensionality appears to prescribe a
categorization of how such relationship between design and emotion may be approached
in an operational context. It proposes the notion that one may experience emotions simply
by perceiving a stimulus (object or event), by engaging with the stimulus, or by
appreciating a stimulus for its relationship to an external-secondary quality. These are
characteristics that fit well with the established efforts in the study of Aesthetics,
Usability Engineering, and Branding-Marketing. Further, it also suggest that one needs
to control and consider that an individual’s appraisal of a product changes and must be
reevaluated across time or when the concerns under the evaluation have changed. This
creates the need to not only understand the initial emotions elicited by products, but also
to understand the long-term emotional patterns of elicited emotions and the fact that these
emotions may be mixed and even contradictory; this is phenomena is described next.
Mixed Emotions
As discussed earlier, artifact emotional attributes are the result of three distinct
domains (the Sensory/Aesthetic, Cognitive/Behavioral, and Personal/Symbolic) that are
active simultaneously, implying that each may induce its own affective response. For
instance Desmet (1999) showed that individuals would report that they had experienced a
160
mix of emotions, even conflictive emotions, which were elicited when presented with
artifact designs for their evaluation. He explained this by using the emotional concern
structure developed by Ortony, Clore and Collings (1988).
“This structure (the OCC structure) distinguishes three basic types of concerns:
(1) goals, (2) standards, and (3) attitudes. First, goals are the things one wants to see
happen (e.g., I want to publish a book). Second, standards are the things one believes
ought to happen (e.g., I shouldn’t disrespect my parents). And third, attitudes are one’s
dispositional likings or dislikings such as tastes (e.g., I love cheesecake). This theory
implies that a stimulus can elicit three types of emotions, depending on which concern
type is focused.” (Desmet, 1999, pg. 71)
This not only implies that different emotions may be experienced by a single
individual, but that the variations in emotional responses between individuals should be
expected to be large. Not only do different individuals have different concerns, but even
if they had the same concern they may also have a different focus within the concern.
This implies that in addition to understanding how individuals appraise a stimulus, one
must also develop and understanding of the different contextual variables that may
influence goals, standards and attitudes. This is because all three of these structures may
change within a short period of time, or may be modulated by a particular situation.
Implications
Taken together, the above literature suggests:
o That there are a number of affective phenomena that are often mislabeled as emotions
(true emotions are directed at an object/event and transitional). Emotions offer the
161

opportunity to evaluate the affective feelings individuals may encounter during a
“product experience” as they perceive, engage, or relate to products/events.
o That all individuals are capable of experiencing emotions, yet how those emotions
come about is determined by an automatic self-evaluation (appraisal) of the meaning
of a stimulus to oneself (i.e. what it means to me?).
o That the appraisal is made in regards to a series of dimensions that are influenced by a
broad range of variables such as goals, concerns (evaluation criteria), context, cultural
influences, time, and cognition.
o That there are a series of mechanisms for identifying the presence of an emotion in an
individual (behaviors, expressions, physiological reactions, and subjective feelings).
o That while measuring bodily and behavioral aspects of emotions should be
attainable, some emotions may be mixed and beyond the capabilities of automatic
measurement tools.
o That measuring and identifying an emotion is not sufficient. Beyond what the
individual is feeling, one must understand why he/she is feeling it.
o That in the context of product emotions, one must understand what is the object of the
emotion: the product itself or some related external artifact or event.
o That the appraisal criteria that generate an emotion varies according to three possible
aspects in which one may experience a product (perceiving, engaging, relating; or
after Cupchik, 1999, Sensory/Aesthetic, Cognitive/Behavioral, and
Personal/Symbolic),
162
Thus in order to operationalize the relationship between emotion and design with
the goal of influencing or informing the design of artifacts and the emotions they elicit,
all of these criteria should be considered and consolidated in a process and series of
tools. Some approaches have attempted to accomplish this, and are discussed next.
Current State-of-the-Art in Emotion and Design
In the field of “Consumer Behavior” the topic of how emotions influence
purchasing behavior has been a central theme. The results from this type of market
research are of use for the design of products, yet they have limitations for their
transformation into usable design prescriptions. Currently the central theme appears to be
“Experience Design;” but as Sanders and Dandavate (1999, p. 87-88) put it “we can
never really design experience.” Experience is composed of what the designer provides
and what the user brings with him/her to the interaction. Knowing about a user’s
experiences, goals and interests, context, and characteristics becomes imperative for
providing the opportunity for a design experience to occur. A review of some o f the
methods utilized to study emotion and design are presented next.
Ethnographic Approaches
While they are named individually and not “ethnographic” per say, a great
number of approaches could qualify under the umbrella of what is implied by an
“Ethnographic Approach.” The core theme of ethnographic-type approaches is to
observe, capture, and translate the complexities of a community into a format that allows
outsiders (in this case designers) to develop empathy and context. This is accomplished
via several methods as outlined in Table 24.
163
Table 24. Ethnographic Tasks - Adapted from Sanders and Dandavate (1999).
o Listening to what people say.
o Interpreting what people express and making inferences about what they think.
o Watching what people do.
o Observing what people use.
o Uncovering what people know.
o Attempting to understand what people feel.
o Appreciating what people dream.
Some of the common tools for ethnographic approaches are site observations,
focus groups, interviews, and questionnaires. These are what Sanders and Dandavate
(1999) call “Do”, “Say” and “Make” tools, the first two are tools that allow researchers to
see what people do and say, and the last one allows for participatory design and result in
“as-yet-unknown, undefined, and/or unanticipated” (p. 90) needs. Participatory design is
desired to some point in order to gain access to the experiencer’s world as he/she
expresses the experience. The incorporation of these three kinds of tools has been
accomplished using “emotion toolkits” or “probes” in which usually a selected group of
individuals is given an assignment and the tools for documenting it (e.g. diary, camera,
voice recorder) or asked to bring back relevant items (e.g., see Johnson & Wiles, 2003;
Wenseveen, 1999). For example, Desmet (1999) utilized an exploratory ethnographic
method to accompany his assessment tool, where he asked individuals to identify during
a period of time (while carrying through their daily lives) a series of objects that made
them feel a particular set of emotions individually (e.g., happiness). For each emotion a
picture and a note in a logbook were requested. Based on the responses, the designer
164
could gain insight into what produced the emotions that were developed and gain
empathy to what each individual’s concerns were.
These methods, while insightful and invaluable to the context of design and
emotion, lack the prescriptivenes or diagnosticity to objectively guide design. They
provide insights, yet without additional tools and data transformation much is left to the
discretion and capability of the designer.
Heuristics
The design community has employed the use of “heuristic” rules to influence the
perception of individuals by manipulating the design of an artifact. The choice of what is
used depends on which level one is designing for (as discussed earlier these are:
Sensory/Aesthetic, Cognitive/Behavioral, and Personal/Symbolic). For the
sensory/aesthetic domain, designers have used heuristics for such things as lines, shapes,
texture, balance and color; and gestalt principles and performance heuristics for
cognitive/behavioral phenomena (e.g., Nielsen, 1993). These methods attempt to exploit
the shared genealogy of individuals (as proposed by the Darwinian and Jamesian
traditions) and the generalization of new discoveries through guided observation of the
social sciences. While this “bottom-up” approach of assembling individual components
may prove efficient, critics question the validity - as different elements achieve synergy
in composition (Liu, 2003). With a “top-down” approach this criticism is controlled for,
yet the results from the method are difficult to interpret, leading to the need for a more
systematic approach to provide some diagnosticity.
165
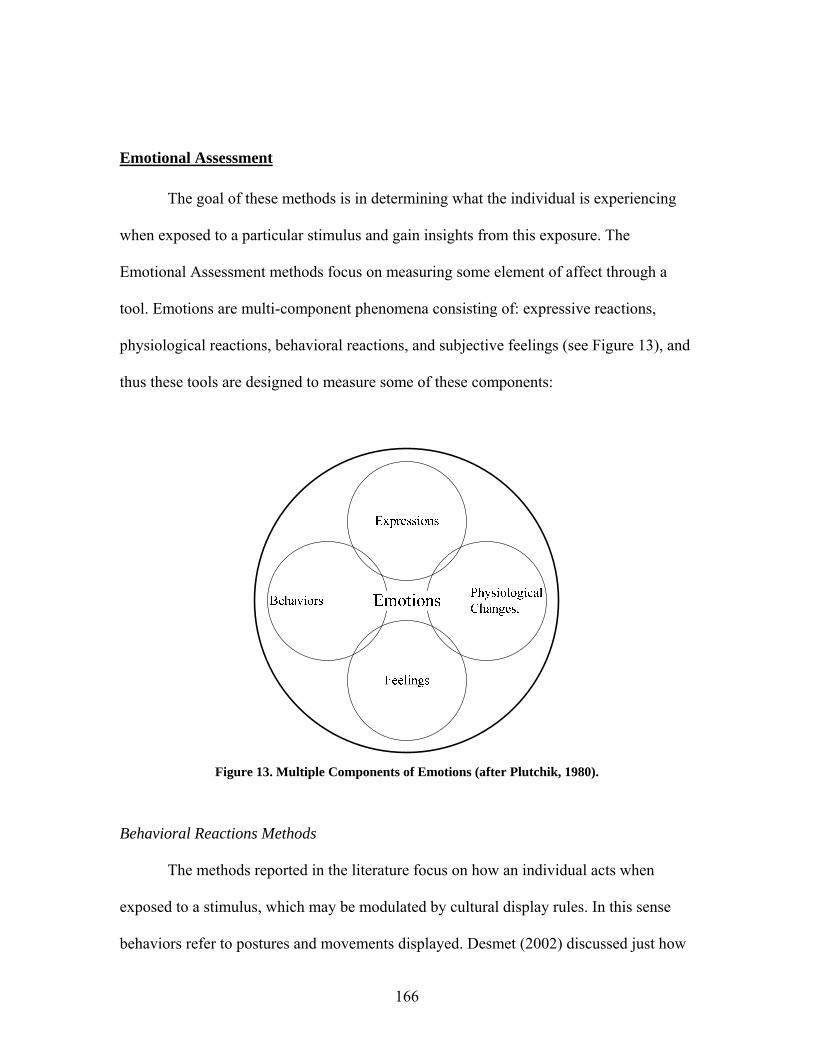
Emotional Assessment
The goal of these methods is in determining what the individual is experiencing
when exposed to a particular stimulus and gain insights from this exposure. The
Emotional Assessment methods focus on measuring some element of affect through a
tool. Emotions are multi-component phenomena consisting of: expressive reactions,
physiological reactions, behavioral reactions, and subjective feelings (see Figure 13), and
thus these tools are designed to measure some of these components:
Figure 13. Multiple Components of Emotions (after Plutchik, 1980).
Behavioral Reactions Methods
The methods reported in the literature focus on how an individual acts when
exposed to a stimulus, which may be modulated by cultural display rules. In this sense
behaviors refer to postures and movements displayed. Desmet (2002) discussed just how
166
difficult understanding behaviors may be, when he reported on the subtle differences
between Japanese and Dutch actors displaying “disappointment”. In his report, he
observed how the lack of a simple “feature” of looking away from the source of the
emotion made the expression-behavior executed by Dutch actors incomprehensible by
Japanese test participants. While there are methods that promise to measure behaviors,
they have not been specifically used for this purpose. For instance, Velastin and Davis
(2005) report on the capability to track movements and patterns by individuals in a crowd
through video surveillance, and through evaluation of “lingering” or “moving in a
different direction from the majority” one may identify unsafe behavior. The strengths of
this approach are that target behaviors may be readily identified by a trained observer
without the awareness or distraction of the subject of interest (e.g., startles suggest
surprise). On the other hand, the weaknesses of this approach are that it relies on the
interpretation of a trained observer, and it’s limited to the broad interpretation of a
general emotional state and or to a limited set of discrete emotions.
Expression Measuring Methods
These approaches look for particular gestures or behaviors to make their
judgments (c.f. Hager & Ekman, 1983). While unobtrusive and promising in that they
could be used universally to capture multicultural expressive cues from basic emotions,
they lack the capability to interpret mixed emotions and may be limited to a sub-set of
basic emotions. These approaches have largely focused on facial and voice expressions to
discriminate between emotions. Facial expression methods are based on the assumption
that key facial expressions are linked to specific emotions (c.f. FACS, Ekman, Wallace,
Friesen, & Hager 2002; Hager & Ekman, 1983). They are valuable in that they offer the
167
opportunity to identify what an individual is feeling, through observation of changes in
their face. While promising these methodologies have several limitations: they are limited
to a small subgroup of basic emotions (e.g. happy, surprise, fear, anger); automated
methods can only discriminate prototypal emotions, while in real life prototypes are not
the norm; they cannot identify mixed emotions; and they cannot identify non-prototypical
emotions like boredom or frustration (Kapoor, Qi and Picard, 2003). Vocal expression
methods attempt to identify emotional states based on vocal patterns in voice (e.g.
energy, utterances, pitch dynamics, etc.). Compared to facial expression these methods
have been studied less and have recognition performances comparable but lower than
facial methods (Jonhstone, Reekum, Kirsner & Scherer, 2005). The benefits of these
methods are similar to those of the facial expression methodologies, in addition, they
have the capability to be recognized across cultures as many of the vocal changes are due
to physiological arousal, may be measured without disturbing the individual, and some
are commercially available (e.g. TrusterTM Personal Lie Deterctor by Advantage
UpGrade). Some disadvantages of these methods are their limitations in accuracy
performance (e.g., 72% for TrusterTM as reported from their field study; and 70%
recognition by expert judges – Johnstone, Banse & Scherer, 2006); they are limited to a
small group of emotions; they may require expert judges for emotions not yet automated;
and automated versions require trained interpretation.
Physiological Methods
These approaches exploit the array of bodily changes that may be present when
experiencing emotions and focus on autonomic bodily changes that accompany emotions
and are the result of changes in the Autonomic Nervous System (ANS) (Levenson, 1992).
168

These may include a variety of physiological data sources like blood pressure, skin
conductivity, pupil size, brain waves, heart rates, body-heat fluctuations (c.f. Kapoor, Qi,
& Picard, 2003 – facial action recognition; Polzin & Waibel, 2000 – verbal expression
recognition; Verona & Curtin, 2006 – startle eye-blink reactions; Puril et al., 2005 –
thermal imaging; Britton et al., 2006 – heart rate; Bradley, Cuthbert & Lang, 1996 – skin
conductance response). These methods exploit the fact that unlike expressions, emotional
processes are automatic and out of the control of the individual A benefit of such
methods is that they provide an instantaneous measurement of changes that are out of the
control of the individual, thus granting them a high degree of association between
stimulus and affect. They are also advantageous as they do not require the individual to
be disturbed or distracted to probe for the emotional state. On the other hand, they are
limited to a small number of basic emotions; require expert analysis for interpretation;
cannot assess mixed emotions; may be prone to unrelated noise; and may require
complex apparatus for assessment. One key limitation of physiological measures is their
specificity, that is, that there may be no particular specific pattern of bodily change that
correlates with particular emotions (although this is challenged by Levenson, 1992), but
that rather the changes in bodily activity in a particular direction represent the emotion
(Levenson, 1992; Desmet 2002).
Subjective Feelings Methods
These approaches assess emotions through self-report and rely on the conscious
awareness by individuals of their affective state and are reported through self-report.
While a consensus definition for emotion may not exist, individuals in the general
population are able to discern and identify emotions. This is supported by Shaver et al.
169
(1987), who in their work on emotion prototypes summarized the converging results of their
work and other researchers in distinct geographic areas.
“…although English speakers around the world have difficulty giving an explicit
rule like definition of emotion, they have little trouble agreeing that a particular
psychological state name designates a relatively good or a relatively poor example of the
emotion category.” (p. 1064)
The strength of subjective methods include their ease of administering, requiring
at times nothing more than verbal answers or pen-and-paper. There are primarily two
approaches for this approach; Dimensional and Discrete Emotions approaches (Scherer,
2005) . The dimensional approach utilizes key scales to inquire about affective factors
(e.g., valence, arousal, intensity) (c.f. Geneva Emotion Research Group, 2002). Examples
of emotional dimensions are Valence (i.e. positive and negative affect; Warmth Monitor,
Stayman & Aakner, 1993) and Arousal (e.g. Affect Intensity Measure, AIM, Larsen,
1984 in Larsen, Diener, & Emmons 1986). The Discrete Emotion approach utilized
words or other representations of emotions (pictures or animations) to inquire about felt
emotions, and some are even able to assess mixed emotions (e.g., Lang, 1980; Richins,
1997; Desmet 2002). A variety of these methods use words and scales to allow
individuals to indicate how they are feeling (c.f. Geneva Emotion Research Group, 2002).
Until recently one of the limitations of these approaches was their verbal bias which was
confounded with an individual’s vocabulary (i.e., the familiarity or recognition of the
meaning for the emotion words or dimensions). However, others have stepped away
from verbal methods and begun using images or animations to illustrate emotions -
having individuals indicate which items represent what they felt and to what intensity
170
(c.f. Lang P.J, 1980 – Self Assessment Manikin, SAM; Desmet, 1999; 2002 - Product
Emotion Measurement instrument, PrEmo; Desmet, Overbeeke & Tax, 2001 –
Emocards). Furthermore, they have been shown to produce reliable results. For instance
Pekrum, Goetz, Perry, Kramer, Hochstadt, and Molfenter (2004) report reliability
coefficients between 0.88 and 0.95 for their scales. Sanford and Rowatt (2004) report
reliability estimates for their three emotion scales at 0.89, 0.84, and 0.82. Similar to
Stayman and Aaker (1993) who found reduced test-retest reliabilities for their humor
measuring instrument at 0.65, warmth at 0.85 and irritation instruments at 0.72.
Nonetheless subjective methods do have some limitations. They are disruptive to the
task/experience being assessed and rely on the individuals’ memory (e.g. Richins, 1997)
and ability to express their emotions. Furthermore individuals differ in “affective clarity,”
that is they differ in their ability to experience their moods and emotions lucidly
(Lischetzke, Cuccodoro, Gauger, Todeschini, & Eid, 2005). Like all subjective
assessment methods, they rely on the honesty of individuals’ reports, although Fischer
(2004) has reported some physiological-subjective correlations between self-report and
brain imagery.
In general a key limitation of all these emotion assessment tools and methods
is their limited diagnositicity (i.e., they cannot explain why the individual is feeling a
particular way). While they may indicate what an individual is feeling, they cannot
explain why, which is critical in order to understand the “object of the emotion” as
discussed earlier.
171
Affective Computing
These methods are not entirely concerned with designing and emotion, but are
rather focused on designing emotionally “intelligent” machines (i.e., reactive interfaces
that change with users’ experienced emotions). In this case these systems rely on an
individual’s physiological changes or expressions to interpret what the individual is
feeling (c.f. Kapoor, Qi, & Picard, 2003- facial action recognition; Polzin & Waibel,
2000 – verbal expression recognition). Similarly, within this genre are those methods that
seek to model and reproduce emotions based on environmental stimuli (i.e. machine
emotions, c.f. Exkschlager, Bernhaupt, & Tscheligi, 2005; Gratch & Marsella, 2005).
While the affective computing approach is promising in its promise to automatically
identifying emotions and developing emotional prediction tools, it does so in the same
manner as the previously discussed physiological and expression measuring tools. Thus,
its shortcomings involve their inability to identify mixed emotions and their limitation to
a small number of basic emotions.
Semantic Differentials
While not specifically attending to emotions, these methods have been utilized in
the past to assess or prescribe design from an affective perspective. A series of methods
are available that allow on to uncover attitudes or subjective impressions which can carry
subjective meaning and are later used for transformation into prescriptive requirements.
Such is the case of Kansei Engineering, which through a series of steps is able to create a
custom instrument for determining the relevant factors to which a particular context is
evaluated (e.g., affective criteria) using statistical methodology. Kansei Engineering is of
special interest given its status as the only method expressly designed for quantifying
172
affective customer needs and developing them into products (Schütte, 2005). With these
criteria alternative designs are evaluated using end users/customers to express their
feelings regarding the designs. Through scoring, and at times modeling, the best
alternative is selected or the best design parameter estimates are identified. This yields
the ability to not only identify the impressions of individuals but to predict how a
potential design may be perceived by individuals. A disadvantage of the Kansei method
is its complexity as it requires expertise, time and effort to utilize and to develop the
assessment instrument, further such instrument is only relevant to the context or artifact
in question. Other methods in this category, are context specific standardized tools such
as the Semantic Description of Environment (SMB) (Küller, 1975 in Karlsson, Aronsson,
& Svensson, 2003). For instance the SMB has been used in the evaluation of vehicle
interiors and is able to distinguish and rate products based on visual aesthetic evaluations
(Karlsson, et. al., 2003). Although the SMB method is simpler than the Kansei (in which
an instrument like the SMB is developed in the process), both methods lack the ability to
indicate why individuals feel as they do.
Attitude / Sentiment Approaches
As discussed earlier attitudes / sentiments are long lasting predispositions towards
identifiable stimuli and contain affective, cognitive and behavioral components (Petty,
Fabrigar, & Webener, 2003). As such they may be utilized to understand the affective
relationships between an individual and an experience.
Sentiments are long-lasting predisposition to particular stimuli created through
previous exposure to the stimuli, which result in a dispositional idea (Broad, 1954).
There are certain sentiments that are rather common in human beings and appear to be
173
innate (e.g., dislike of blood, dislike of unstable surfaces) (Fridja, 1994). In general,
sentiments are enduring and stable responses to stimuli, most having their origin derived
from previous judgments (emotional appraisals). Furthermore, Zajoc (1980, 2000)
suggests that individuals may immediately acquire an affective response towards a
stimulus even though they have no awareness of having encountered it before. In turn,
judgments are constantly influenced by preexisting sentiments (Forgas, 2003).
Emotions and sentiments have a reciprocal relationship, as often emotions may
lead to an acquired sentiment; and an object towards which a particular sentiment is held
may trigger a particular emotion (Fridja, 1994). Similar to emotions, sentiments have a
set of characteristics that define them. Sentiments have Valence (positive/negative), in
this sense they are broader than emotions as only the direction along an affect dimension
is considered here. Similar to emotions, sentiments have Strength in reference to certainty
versus probability. They also have a Complexity component, which considers the number
of elements that participate in the formation of the sentiment. Although the original
tripartite theory of sentiments considered affect as a single dimension (positive or
negative), the valence component has more recently been re-conceptualized as a
component made up of various discrete emotions (Pettey, Fabrigar, & Wegener, 2003).
Specifically, sentiments are said to have ABC characteristics: Affect, Behavior, and
Cognition components (see Figure 14; Breckler, 1984; Eagly & Chaiken, 1993). The
affect component considers the feelings (i.e., emotions) experienced towards the
stimulus. The behavioral component considers the actions or behaviors exhibited towards
the stimulus. The cognitive component considers the thoughts/beliefs about the stimulus.
174
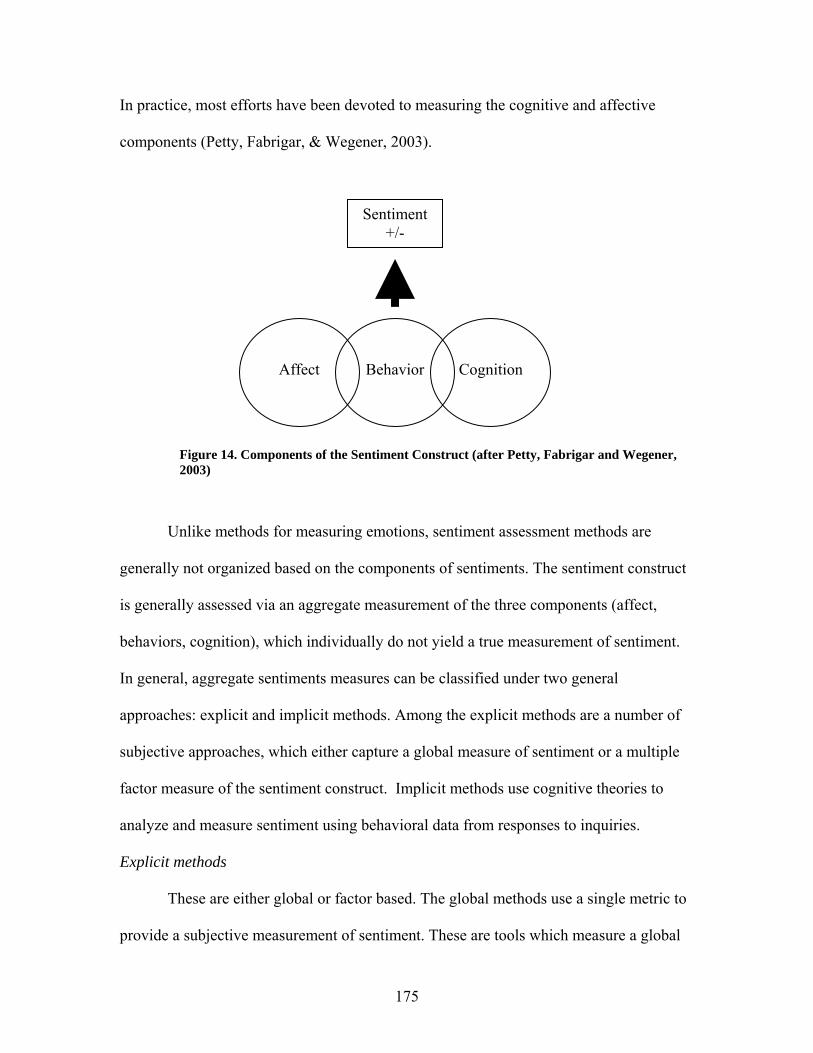
In practice, most efforts have been devoted to measuring the cognitive and affective
components (Petty, Fabrigar, & Wegener, 2003).
Sentiment +/-
Affect Cognition Behavior
Figure 14. Components of the Sentiment Construct (after Petty, Fabrigar and Wegener, 2003)
Unlike methods for measuring emotions, sentiment assessment methods are
generally not organized based on the components of sentiments. The sentiment construct
is generally assessed via an aggregate measurement of the three components (affect,
behaviors, cognition), which individually do not yield a true measurement of sentiment.
In general, aggregate sentiments measures can be classified under two general
approaches: explicit and implicit methods. Among the explicit methods are a number of
subjective approaches, which either capture a global measure of sentiment or a multiple
factor measure of the sentiment construct. Implicit methods use cognitive theories to
analyze and measure sentiment using behavioral data from responses to inquiries.
Explicit methods
These are either global or factor based. The global methods use a single metric to
provide a subjective measurement of sentiment. These are tools which measure a global
175
index of sentiment along the valence dimension (i.e., positive and negative affect) and are
represented by instruments such as the Warmth Monitor used in advertising (Stayman &
Aakner, 1993). While the Warmth Monitor may be considered an emotion tool, through
its application it may be turned into a sentiment measurement. While global methods are
readily applied, they lack any diagnosticity as no other information is captured but the
Sentiment score. On the other hand, factor based methods may assess a holistic subjective
score through a composite sentiment construct that is composed of the subjective factors
that target each of the three component of sentiments and assessed via subjective criteria.
Fishbein and Ajzen (1975) report the following factor-based methods for assessing
sentiments: Fishbein’s method, a combination of Bogardus’ Social Distance and
Guttman’s Scalogram Analysis, Thurstone’s Equal-Appearing Interval Scale, Likert’s
method, and Osgood’s Semantic Differential method. Each of these methods utilizes
verbal descriptions to measure all three components of sentiments (affect, behavior,
cognition) and involves manipulations of lists of statements to arrive at a measurement of
sentiment towards an item using a subjective rating system. These methods have the
advantage of including a variety of factors, which may be measured independently of the
main sentiment construct. As such they may provide some degree of diagnosticity to the
nature of the sentiments experienced by those reporting. Nonetheless they are textual
based, are prone to memory biases and their results are not comparable across methods
(i.e., one needs to make assessment utilizing the same, often customized, tool to have
data for comparison purposes) . Furthermore they require the creation of context unique
instruments that require expert design and validation.
176

One general limitation of all explicit methods is their reliance on the individuals’
responses and the inability to capture behaviors. It’s been suggested that behaviors are an
indication of the greatest commitment to a subject, where the observation of actions
determine the true sentiments towards an object (see Table 15, c.f. Krathwohl, Bloom, &
Masia, 1956; Hauesnstein, 1998). While explicit behavioral methodologies could not be
identified in the emotion and design literature, there are some reports of the use of such
tools in the study of Organizational Commitment. In the latter field, questionnaires have
been used to capture behavioral measurements by querying the existence or not of
specific behaviors (e.g., Meyer & Allen, 1997).
Table 25. Taxonomy of Affective Educational Objectives Adapted from Krathwohl et. al. (1956).
Level Definition
Receiving Being aware of or attending to something in the environment
Responding Showing some new behaviors as a result of experience
Valuing Showing some definite involvement or commitment
Organization
Integrating a new value into one's general set of values, giving it some ranking among one's general priorities
Characterization by Value Acting consistently with the new value
177

Implicit Methods
In addition to these subjective measurement instruments, behavioral instruments
have been used to measure sentiments said to exist beneath consciousness as implicit
biases (e.g. Implicit Association Test, Greenwald & Nosek, 2001; Visual Probe Task,
Mogg, Bradley, Field and De Houwer, 2003). These types of approaches use behaviors
such as response times in relation to congruent and incongruent stimuli-property
associations (e.g. white-good, back-good) as an indication of implicit sentiments. Which
while impressive in their ability to uncover hidden sentiments and identify biases, they
are unable to uncover the source of such biases and require expertise effort (e.g., in tool
development and data analysis).
178
LIST OF REFERENCES Aaker, D.A., Douglas, M.S. and Vezina, R. (1988). Identifying Feelings Elicited by Advertising.
Psychology and Marketing. Vol. 5, No. 1.
Andre, S.A., Hartson, H.R., Belz, S.M., and McCreary, F.A., 2001. The user action framework: a reliable
foundation for usability engineering support tools. International Journal of Human-Computer Studies.
Vol. 54. pp.107-136
Apple Inc. 2008. Apple Human Interface Guidelines. Retrieved January 20, 2008.
http://developer.apple.com/documentation/UserExperience/Conceptual/OSXHIGuidelines/OSXHIGui
delines.pdf
Appleton, J. 1975, The Experience of Landscape (New York: Wiley). In Liu, Y. (2003), Engineering
aesthetics and aesthetic ergonomics: Theoretical foundations and a dual-process research methodology.
Ergonomics, Vol. 46, Nos. 13/14, 1273 – 1292
Arnold, M.B. (1960). Emotion and personality. New York: Columbia University Press.
Bailey, B. 2005. Judging the severity of usability issues on web sides: This doesn’t work. Usability.gov.
Retrieved November 29, 2007.
Berger, C., Blauth, R., Boger, D., Bolster, C., Burchill, G., DuMouchel, W., Pouliot, F., Richter, R.,
Rubinoff, A., Shen, D., Timko, M., and Walden, D. (1993). Kano’s methods for understanding
customer-defined quality. The Center for Quality Management Journal, 2 (4).
Bevan, N. (1995). Usability is quality of use. In Proceedings of the HCI International 1995 Conference on
Human Computer Interaction (pp. 349–354). Mahwah, NJ: Lawrence Erlbaum Associates, Inc.
Bevan, N., & Macleod, M. (1994). Usability measurement in context. Behaviour & Information
Technology, 13, 132–145.
Beyer, H., and Holtzblatt, K. (1998). Contextual Design: Defining Customer-Centered Systems. Morgan
Kaufmann Publishers, Inc., San Francisco CA.
Blythe, M., Wright, P., McCarthy, J., and Bertelsen O.W.,2006. Theory and method for experience
centered design. In Proceedings of the conference on human factors computing systems. April 22-27.
Montreal, Quebec, Canada. Pp. 1691-1694.
179

Booth, P., An Introduction to Human-Computer Interaction, LEA, Hove, East Sussex, U.K., 1990.
Bradley, M. M., Cuthbert, B. N., & Lang, P. J. (1996). Picture media and emotion: Effects of a sustained
affective context. Psychophysiology, Vol. 33, pp. 662–670. In Britton, J.C., Taylor, S.F., Berridge,
K.C., Mikels, J.A., Liberzon, I., 2006. Differential subjective and psycholphysiological responses to
socially and nonsocially generated stimuli. Emotion, Vol. 6, No. 1
Breckler, S.J. (1984). Empirical validation of affect, behaviour and cognition as distinct components of
attitude. Journal of Personality and Social Psychology, Vol. 47, pp. 1191-1205
Britton, J.C., Taylor, S.F., Berridge, K.C., Mikels, J.A., Liberzon, I., 2006. Differential subjective and
psycholphysiological responses to socially and nonsocially generated stimuli. Emotion, Vol. 6, No. 1
Brooke, J. (1996). SUS: A Quick and Dirty Usability Scale. In: P.W. Jordan, B. Thomas, B.A.
Weerdmeester & I.L. McClelland (Eds.), Usability Evaluation in Industry. London: Taylor & Francis.
Also see http://www.cee.hw.ac.uk/~ph/sus.html
Carlile, S., Dlaney, S., and Corderoy, A. (1999). The localisation of spectrally restricted sounds by human
listeners. Hearing Research. 128, 175-189
Carlson, R. Experienced Cognition. New York: Lawrence Erlbaum Associates, 1997.
Carroll, J.M., & Thomas, J.C. (1988). Fun. SIGCHI Bulletin, Vol. 19, pp. 21-24. In Carroll, J.M. (2004).
Beyond fun. Interactions. Vol. 11. No. 5, pp. 38-40
Carroll, M. B., Milham, L. M., Stanney, K.M., & Becker, W. (under review). Operational Requirements
Analysis. In D. Schmorrow, J. Cohn, & D. Nicholson (Eds.), The Handbook of Virtual Environment
Training: Understanding, Predicting and Implementing Effective Training Solutions for Accelerated
and Experiential Learning. Aldershot, Hampshire, UK: Ashgate Publishing.
Catani, M.B. and Biers, D.W. (1998), Usability evaluation and prototype fidelity, Proceedings of the
Human Factors and Ergonomics Society.
Cawthon, N., Vande Moere, A. (2006) A conceptual model for evaluating aesthetic effect within the user
experience of information visualization. In Proceedings of the Tenth conference on nformation
Visualization (IV’06). 05-07 July 2006. pp. 374 – 382
180
Champney, R.K, Carrol, M.B., Milham, L.M., Hale, K (2008). Sensory-Perceptual Objective Task (SPOT)
Taxonomy: A Task Analysis Tool. Proceedings of the Human Factors and Ergonomics Society 52nd
Annual Meeting. New York City, New York, September 22-26.
Champney, R.K. and Stanney, K.M. (2007). Using Emotions in Usability. Proceedings of the Human
Factors and Ergonomics Society 51th Annual Meeting. Baltimore, Maryland, October 1-5
Chulef, A.S., Read, S.J., and Walsh, D.A., (2001). A Hierarchical Taxonomy of Human Goals. Motivation
and Emotion, Vol. 25, No. 3
Chwalisz, K., Diener, E., & Gallagher, D. (1988).Autonomic arousal feedback and emotional experience:
Evidence from the spinal cord injured. Journal of Personality and Social Psychology, Vol. 54, pp. 820-
828.
Cockton, G. and Woolrych, A. (2001), Understanding inspection methods: Lessons from an assessment of
heuristic evaluation, Joint Proceedings of HCI 2001 and IHM 2001: People and Computers XV, 171-
191.
Connell, I. W., & Hammond, N. V. (1999). Comparing usability evaluation principles with heuristics:
Problem instances vs. problem types. In M. Angela Sasse & C. Johnson (Eds.), Proceedings of the
IFIP INTERACT ’99 Conference on Human–Computer Interaction (pp. 621–629). Amsterdam: IOS.
Coren, S., Ward, L. M., & Enns, J. T. (2004). Sensation & Perception (6th Edition). New York: Wiley.
Cornelius, R.H. 1996. The Science of Emotion. Upper Saddle River, NJ: Simon & Schuster
Cornelius, R.R. (2000). Theoretical approaches to emotion. Proceedings of the ISCA Workshop on Speech
and Emotion (pp. 3–10). Northern Ireland.
Cupchik, G.C. (1999). Emotion and industrial design: Reconciling meaning and feelings. In C. J.
Overbeeke & P. M. Hekkert, (Eds.), Proceedings of the First International Conference on Design and
Emotion, Delft: Delft University of Technology.
Cupchik, G.C., (1999), Emotion and industrial design: Reconciling meaning and feelings. In C J
Overbeeke, P P M Hekkert, (1999), Proceedings of the First International Conference on Design and
Emotion, Delft: Delft University of Technology.
Darwin, C. (1874). The Descent of Man (2nd ed.). London: J. Murray. In
http://psychclassics.asu.edu/Darwin/Descent/index.htm
181
Davidson RJ. (1992). Emotion and affective style: hemispheric substrates. Psychology Science Vol. 3, pp.
39-43,
Davidson, R. J., Scherer, K. R., and Goldsmith, H. H. (2003). Handbook of Affective Sciences. New York:
Oxford University Press.
Davidson, R.J. (1994). Asymmetric brain function, affective style and psychopathology: The role of early
experience and plasticity. Development and Psychopathology, Vol. 6, pp. 741-758.
Davidson, R.J., (1994), On Emotion, Mood, and Related Affective Constructs. In In Ekman, P., Davidson,
R.J., (Eds), 1994. The Nature of Emotion: Fundamental Questions. New York: Oxford University
Press.
Davis, F. D. (1989). Perceived usefulness, perceived ease of use, and user acceptance of information
technology. MIS Quarterly, 13(3), 319-340.
Demirbilek, O. and Sener, B., (2003), Product design, semantics and emotional response. Ergonomics, Vol.
46, No. 13/14, pp. 1346 – 1360
Desmet, P. M. A., & Hekkert, P. (2007). Framework of product experience. International Journal of
Design, Vol. 1, , No. 1, pp. 57-66.
Desmet, P., (2002), Designing emotions. Unpublished doctoral thesis. Delft University of Technology.
ISBN 90-9015877-4.
Dillon, A., and Watson, C. 1996. User analysis in HCI: the historical lesson from individual differences
research. International Journal of Human-Computer Studies. Vol. 45, No. 6, pp. 619-637
Dumas, J.S., & Redish, J.C. (1993). A practical guide to usability testing. Norwood, NJ: Ablex Publishing
Company.
Eberts, R. (1994). User interface design. Englewood Cliffs, NJ: Prentice Hall.
Ekman, P. (1994), Moods, emotions, and traits. In Ekman, P., Davidson, R.J., (Eds), The nature of emotion:
Fundamental questions. New York: Oxford University Press.
Ekman, P., Friesen, W.V., & Hager, J.C., (2002). Facial action coding system investigator’s guide. A
human face. Utah: Salt Lake City.
182
Fadden, S., and McQuaid, H.L., 2003. Fixing what matters: Accounting for organizational priorities when
communicating usability problems. Proceedings of the Usability Professionals’ Association
Conference. June 23-27, Scottsdale, Arizona, USA
Ferre, X. 2003. Integration of usability techniques into the software development process. In proceedings of
the International Conference on Software Engineering. May 3-4 Portland, Oregon USA. pp. 28-35.
http://www.icse-conferences.org/
Fischer, H. (2004). Why we love, The nature and chemistry of romantic love. New York: Henry Holt and
Company.
Fishbein, M., & Ajzen, I. 1975 attitude, intention, and behavior: An introduction to theory and research.
Reading, MA: Addison-Wesley. Belief,. Available from Izek Ajzen at
http://people.umass.edu/aizen/f&a1975.html
Forlizzi, J. and Battarbee, K., 2004, Understanding experience in interactive systems. In Proceedings of the
2004 conference on Designing Interactive Systems (DIS 04): processes, practices, methods, and
techniques (New York: ACM), p. 261-268.
Fridja, N.H, (1994), Varieties of Affect: Emotions and Episodes, Moods and Sentiments. In Ekman, P.,
Davidson, R.J., (Eds), 1994. The Nature of Emotion: Fundamental Questions. New York: Oxford
University Press.
Fridja, N.H., (1993), Appraisal and Beyond: The issue of cognitive determinants of emotion. Hove, UK:
Lawrence Erlbaum Associates Ltd.
Fridja, N.H., and Schram, D. (Eds.), (1995), Special Issue on Emotions and Cultural Products. Poetics. Vol
23. No. 1-2.
Frijda, N.H. (1994). Varieties of affect: Emotions and episodes, moods and sentiments. In Ekman, P.,
Davidson, R.J., (Eds), The nature of emotion: Fundamental questions. New York: Oxford University
Press.
Gaver, W.W. (1999), Irrational aspects of technology: Anecdotal evidence, in C J Overbeeke, P P M
Hekkert, (1999), Proceedings of the First International Conference on Design and Emotion, Delft:
Delft University of Technology.
183

Geneva Emotion Research Group (2002), Geneva Appraisal Questionnaire (Online), Jan 10 2006.
www.unige.ch/fapse/emotion/resmaterial
Gillan, D.J., and Bias, R.G., 2001. Usability Science. I: Foundations. International Journal of Human-
Computer Interaction. Vol. 13, No. 4, pp.351-372.
Gould, D.J., 1988. How to design usable systems. In Helander M. (Ed.), Handbook of Human-Computer
Interaction. North-Holland. Elsevier. Pp 757-789.
Gratch, J. and Marsella, S., (2005), Lessons from Emotion Psychology for the Design of Lifelike
Characters. Applied Artificial Intelligence. Vol. 19
Greenwald, A. G., & Nosek, B. A. (2001). Health of the Implicit Association Test at age 3. Zeitschrift für
Experimentelle Psychologie, Vol. 48, pp. 85-93.
Gutsche, R.H. 1975. User Experience. In Proceedings of the SIGMETRICS Technical Meeting on Pricing
Computer Services. November 20-21. Palm Springs, California
Guyton, A. C. (1996). Textbook of medical physiology (9th edition). Philadelphia: W. B. Saunders.
Hager, J.C., and Ekman, P. (1983), The Inner and Outer Meaning of Facial Expressions. In Social
Psychology: a Sourcebook. New York: The Guildford Press.
Hale, K.S. and Stanney, K. (2004). Effects of low stereo acuity on performance, presence and sickness
within a virtual environment. Applied Ergonomics, Vol. 37, pp. 329–339.
Hartson, H.R., Andre, T.S., Williges, R.C. 2003. Criteria for evaluating usability evaluation methods.
International Journal of Human-Computer Interaction. Vol. 15, No. 1, pg. 145-181.
Hartson, H.R., Andre, T.S., Williges, R.C., 2001. Criteria for evaluating usability evaluation methods.
International Journal of Human-Computer Interaction. Vol. 13, No.4, pp 373-410.
Hassenzahl, M. (2003). The thing and I: understanding the relationship between user and product. In
M.Blythe, C. Overbeeke, A. F. Monk, & P. C. Wright (Eds.), Funology: From Usability to Enjoyment
(pp. 31-42). Dordrecht: Kluwer Academic Publishers.
Hassenzahl, M. (2006). Hedonic, emotional, and experiential perspectives on product quality. In C. Ghaoui
(Ed.), Encyclopedia of Human Computer Interaction. (pp. 266-272). Idea Group.
Hassenzahl, M., and Tractinsky, N. 2006. User experience – a research agenda. Behaviour & Information
Technology. Vol. 25, No. 2, pp. 91 – 97
184
Hassenzahl, M., Platz, A., Burmester, M.,&Lehner,K. (2000). Hedonic and ergonomic quality aspects
determine a software’s appeal. In Proceedings of the CHI 2000 Conference on Human Factors in
Computing Systems (pp. 201–208). New York: ACM, Addison-Wesley.
Hauesnstein, A.D., (1998), A Conceptual Framework for Educational Objectives: A holistic approach to
traditional taxonomies. University Press of America, Inc. Lanham, Maryland.
Helander, M.G., & Khalid, H.M., (2006). Affective and pleasurable design. In: Salvendy, G. (Ed.),
Handbook on human factors and ergonomics (pp. 543–572). New York: Wiley and Sons.
Helander, M.G., & Tham, M. P. (2003). Hedonomics: affective human factors design. Ergonomics, Vol.
46, No. 13/14, pp. 1269-1272
Hertzum, M. 2006. Problem Prioritization in Usability Evaluation: From Severity Assessments Toward
Impact on Design. International Journal of Human-Computer Interaction. Vol. 21, No. 2, Pg 125-146
Hertzum, M. and Jacobsen, N.E. (2003), The evaluator effect: A chilling fact about usability evaluation
methods, International Journal of Human-Computer Interaction, Vol. 15, No. 4, pg. 183-204.
Hertzum, M.,&Jacobsen, N. E. (1999). The evaluator effect during first-time use of the cognitive
walkthrough technique. In H.-J. Bullinger&J. Ziegler (Eds.), Human–computer interaction:
Ergonomics and user interfaces (Vol. 1, pp. 1063–1067). London: Lawrence Erlbaum Associates, Inc.
Hewett. T.T., 1986. The role of iterative evaluation in designing systems for usability. In M.D., Harrison &
A.F., Monk (Eds.), People & Computers: Designing for usability. Proceedings of the second
conference of the BCS HCI specialist group. Cambridge: Cambridge University Press. In Booth, P., An
Introduction to Human-Computer Interaction, LEA, Hove, East Sussex, U.K., 1990.
Høegh, R.T., Nielsen, C.M., Overgaard, M., Pedersen, M.B., Stage, J., 2006. The impact of usability
reports and user test observations on developers’ understanding of usability data: An exploratory study.
International Journal of Human-Computer Interaction. Vol. 21, No. 2, pg. 173-196
Hohmann, G. W. (1966). Some effects of spinal cord lesions on experienced emotional
feelings.Psychophysiology, Vol. 3, pp. 143-156.
Izard, C. E., Libero, D. Z., Putnam, P.,& Haynes, O. M. (1993). Stability of emotion experiences and their
relations to traits of personality. Journal of Personality and Social Psychology, 64, 847-860.
185
Jacobs, J.J., (1999). How to teach, design, produce and sell product-relation emotions. In C J Overbeeke, P
P M Hekkert, Proceedings of the First International Conference on Design and Emotion, Delft: Delft
University of Technology.
Jacobsen, N. E., Hertzum, M., & John, B. E. (1998). The evaluator effect in usability studies: Problem
detection and severity judgments. In Proceedings of the Human Factors and Ergonomics Society 42nd
Annual Meeting (pp. 1336–1340). Santa Monica, CA: Human Factors and Ergonomics Society
James, W. (1884). What is an emotion? Mind, Vol. 19, pp. 188-205. in
http://psychclassics.yorku.ca/James/emotion.htm
Johnson, D., and Wiles, J. (2003) Effective affective user interface design in games. Ergonomics Vol. 46,
No. 13/14, pp. 1332-1345.
Johnson, K.O. and Yoshioka, T. (2002 Neural Mechanisms of Tactile Form and Texture Perception. In The
Somatosensory System: Deciphering the Brain’s Own Body Image, R.J. Nelson (Ed.), CRC Press, pp.
73-102
Johnstone, T., Banse, R., and Scherer, K.R., (16 February 2006). Acoustic profiles in prototypical vocal
expressions of emotions. Geneva Emotion Research Group, Universite de Geneve. Retrieved February
16, 2006, from http://www.unige.ch/fapse/emotion/members/johnston/profiles.html
Johnstone, T., van Reekum, C. M., Hird, K., Kirsner, K., & Scherer, K. R. (2005). Affective speech elicited
with a computer game. Emotion, 5, 513-518.
Johnstone, T., van Reekum, C. M., Hird, K., Kirsner, K., Scherer, K. R. (2005). Affective speech elicited
with a computer game. Emotion, Vol. 5, pp. 513-518.
Jones, D. & Bell, M. (2006). MOT2IVE V2 System Requirements. VIRTE Program Interim Report,
Contract No. N00014-04-C-0024, Arlington, VA: Office of Naval Research.
Jones, L.D., Champney, R.K. Axelsson, P., Hale, K. (2007). Augmenting the Traditional Approach to
Usability: Three Tools to Bring the User Back Into the Process. Proceedings of the Human Factors and
Ergonomics Society 51th Annual Meeting. Baltimore, Maryland, October 1-5.
Jordan, P. W. (2000) Designing Pleasurable Products: An Introduction to the New Human Factors,
London: Taylor & Francis
186
Kano, N., Seraku, N., Takahashi, F., and Tsuji, S. (1984). Attractive Quality and Must-be Quality,
Hinshitsu. The Journal of the Japanese Society for Quality Control, (April), pp.39 -48.
Kapoor, A., Qi, Y., & Picard, R.W. (2003, October). Fully automatic upper facial action recognition. IEEE
International Workshop on Analysis and Modeling of Faces and Gestures (pp. 195 – 202). Nice,
France.
Karlsson, B.S.A, Aronsson, N., and Svensson, K.A., (2003), Using semantic environment description as a
tool to evaluate car interiors. Ergonomics, Vol. 46, No. 13/14, pp. 1408-1422.
Katz, L., and Williams, A. (2001). The Use of Focus Group Methodology in Education: Some Theoretical
and Practical Considerations. International Electronic Journal For Leadership in Learning , 5(3).
Kelkar, K., Khasawneh, M.T., Bowling, S.R., Gramopadye, A.K., Melloy, B.J., and Grimes, L. 2005. The
added usefulness of process measures over performance measures in interface design. International
Journal of Human-Computer Interaction. Vol. 18, No. 1 pp. 1-18
Khalid, H. M., & Helander, M.G. (2004). A Framework for Affective Customer Needs in Product Design.
Theoretical Issues in Ergonomics Science, 5(1), 27-42.
Kies, J. K.,Williges, R. C.,&Rosson, M. B. (1998). Coordinating computer-supported cooperative work: A
review of research issues and strategies. Journal of the American Society for Information. Science, 49,
776–779.
Kirmani, S., and Rajasekaran, S., 2007. Heuristic evaluation quality score (HEQS): A measure of heuristic
evaluation skills. Journal of Usability Studies. Vol. 2, No. 2, pg. 61-75.
Knight, A., Pyrzak, G., & Green, C. (2007). When two methods are better than one: Combining user study
with cognitive modeling. Proceedings of ACM Conference on Human Factors in Computing Systems
(CHI), 1783-1788.
Krathwohl, D., Bloom, B., & Masia, B. (1956). Taxonomy of educational objectives. Handbook II:
Affective domain. New York: David McKay.
Kulak, O., and Kahraman, C., “Multi-attribute comparison of advanced manufacturing systems using fuzzy
vs. crisp axiomatic design approach”, International Journal of Production Economics., Vol. 95, No. 3,
pp. 415-424.
187
Kuller R. 1975, Semantisk miljo¨beskrivning (SMB). (Stockholm: Psykologifo¨ rlaget).in Karlsson, B.S.A,
Aronsson, N., and Svensson, K.A., (2003), Using semantic environment description as a tool to
evaluate car interiors. Ergonomics, Vol. 46, No. 13/14, pp. 1408-1422.
Lang P.J. (1980) Behavioral treatment and bio-behavioral assessment: computer applications. In Sidowski
J.B., Johnson J.H., Williams T.A., Technology in mental health care delivery system, pp 129-139,
Norwood, NJ: Albex.
Lang, P.J. (1980). Behavioral treatment and bio-behavioral assessment: computer applications. In
Sidowski, J.B., Johnson, J.H., & Williams, T.A. (Eds), Technology in mental health care delivery
systems (pp. 129-139). Norwood, NJ: Albex.
Langford, J., and McDonagh, D. (2003). Focus Groups. Taylor and Francis: New York.
Lansdale, M. W. and Ormerod, T. C. 1994, UnderstandingInterfaces: a Handbook of Human-Computer
Dialogue. Academic Press, San Diego, CA
Larsen, R. J. (1984). Theory and measurement of affect intensity as an individual difference characteristic.
Dissertation Abstracts International, 5. 2297B. (University Microfilms No. 84-22112) in Larsen, R.,
Diener, E., Emmons, R.A. 1986. Affect intensity and reactions to daily life events. Journal of
Personality and Social Psychology. Vol. 51, No. 4.
Larsen, R. J., Diener, E., & Emmons, R. A. (1986). Affect intensity and reactions to daily life events.
Journal of Personality and Social Psychology. Vol. 51, No. 4.
Lazarus, R.S. (1991), "Progress on a Cognitive-Motivational-Relational Theory of Emotion", American
Psychologist, Vol. 46, pp. 819-833.
Lazarus, R.S. (2001), Relational Meaning and Discrete Emotions. In Scherer, K.R., Schorr, A., Johnstone,
T. (Eds.), Appraisal Process in Emotion: Theory, Methods, Research (pp. 37-67). New York: Oxford
University Press.
Levenson, R.W., (1992), Autonomic nervous system differences among emotions. Psychological Science,
Vol. 3, No. 1, pp 23-27
Lewis, C., Polson, P., Wharton, C., & Rieman, J. (1990). Testing a walkthrough methodology for theory-
based design of walk-up-and-use interfaces. In Proceedings of the ACM CHI ’90Conference (pp. 235–
242). New York: ACM.
188

Lewis, J. R. (1995) IBM Computer Usability Satisfaction Questionnaires: Psychometric Evaluation and
Instructions for Use. International Journal of Human-Computer Interaction, 7:1, 57-78. Also see
http://www.acm.org/~perlman/question.cgi?form=ASQ.
Likert, R. (1932). A Technique for the Measurement of Attitudes. Archives of Psychology, Vol. 140 No.
55.
Lilien, G. L., Morrison, P. D., Searls, K., Sonnack, M., & von Hippel, E. (2002). Performance Assessment
of the Lead User Idea-Generation Process for New Product Development. Management Science, 48(8),
1042-1059
Lin, H. X., Choong, Y. Y., & Salvendy G. (1997). Aproposed index of usability: Amethod for comparing
the relative usability of software systems. Behavior & Information Technology, 16(4/5), 267–278.
Liu, Y. (2003), Engineering aesthetics and aesthetic ergonomics: Theoretical foundations and a dual-
process research methodology. Ergonomics, Vol. 46, No. 13/14, pp. 1273 – 1292
Logan, R. J.(1994) Behavioral and emotional usability: Thomson consumer electronics. In Usability in
Practice. M. E. Wiklund, Ed. New York: AP Professional, 1994, pp. 59-82.
Maslow, A.H. (1943). A theory of human motivation. Psychological Review. Vol. 50, pp. 370-396.
Mayhew, D. J., 1992. Principles and Guidelines in Software ;ser Interface Design. Englewood Cliffs, NJ:
Prentice-Hall.
Mayhew, D.J. (1999). The usability engineering lifecycle. San Francisco, CA.: Morgan Kaufmann
Publishers, Inc.
McNamara, N. and Kirakowski, J., (2005) Defining usability: Quality of use or quality of experience? in
Proceedings of the IEEE International Professional Communication Conference, Limerick, Ireland,
10-13 July, pp.200-204
McNamara, N., and Kirakowski, J. (2006, November / December). Functionality, usability and user
experience: three areas of concern. Interactions, pp. 26-28.
McQuaid, H. L., and Bishop, D. (2001). An Integrated Method for Evaluating Interfaces, in Proceedings of
Usability Professionals’ Association, June 25-29, Lake Las Vegas, Nevada, USA
189
McQuaid, H.L., and Bishop, D., 2003. Communicating the priority of problems discovered during a
product evaluation. In Proceedings of the XVth Triennial Congress of the International Ergonomics
Association (IEA) 2003. Seoul, Republic of Korea
Mogg, K., Bradley, B.P., Field, M. and De Houwer, J., (2003). Eye movements to smoking-related pictures
in smokers: relationship between attentional biases and implicit and explicit measures of stimulus
valence. Addiction, Vol. 98, No. 6.
Molich, R., Thomsen, A. D., Karyukina, B., Schmidt, L., Ede, M., van Oel, W., & Arcuri, M. (1999).
Comparative evaluation of usability tests. In Extended Abstracts of ACM CHI ’99 Conference (pp. 83–
84). New York: ACM.
Mullet, K.,and Sano, D. (1995). Designing visual interfaces. Englewood Cliffs, NJ: Prentice Hall.
Nesbitt, K. (2004). MS-Taxonomy: A Conceptual Framework for Designing Multi-Sensory Displays. In
Proceedings of the Eighth International Conference on Information Visualization.
Nielsen, J. (1993). Usability engineering. Boston: Academic Press.
Nielsen, J. (1992). Finding usability problems through heuristic evaluation. In Proceedings of the ACM
CHI ’92 Conference (pp. 373–380). New York: ACM.
Nielsen, J. (1994). Heuristic evaluation. In J. Nielsen & R. L. Mack (Eds.), Usability inspection methods
(pp. 25–62). New York: Wiley.
Nielsen, J. (1997). The Use and Misuse of Focus Groups. IEEE Software, Vol. 14, No. 1, pp. 94-95.
Nielsen, J. and Mack, R. L. (Eds.) (1994). Usability Inspection Methods. John Wiley & Sons: New York,
NY.
Nielsen, J., and Landauer, T. K. (1993). A mathematical model of the finding of usability problems.
Proceedings of the ACM/IFIP INTERCHI'93 Conference. Amsterdam, The Netherlands, April 24-29,
pp. 206-213.
Norman, D., (2004). Emotional design: Why we love (or hate) everyday things. New York: Basic Books.
Norman, D. A. (1988). The psychology of everyday things. New York: Basic Books.
Norman, D.A.. (1998) The invisible computer. Cambridge, MA: The MIT Press
Ortony, A., Clore, G. L., and Collins, A. (1988). The cognitive structure of emotions. Cambridge, UK:
Cambridge University Press.
190
Overbeeke, C.J. and Hekkert, P.P.M., (1999), Proceedings of the First International Conference on Design
and Emotion, Delft: Delft University of Technology.
Papanek, V. 1995, The Green Imperative: Natural Design for the Real World (London: Thames and
Hudson). In Demirbilek, O., and Sener, B., (2003). Product design semantics and emotional response.
Ergonomics, Vol. 46, No. 13/14.
Petre, M., Minocha, S., and Roberts, D. (2006) Usability beyond the website: an empirically-grounded e-
commerce evaluation instrument for the total customer experience. Behavior & Information
Technology. Vol. 25, No. 2, pp. 189-203
Petty, R. E., Fabrigar, L. R., & Wegener, D. T. (2003). Emotional factors in attitudes and persuasion. In
Davidson, R. J., Scherer, K. R., & Goldsmith, H.H. (Eds.), Handbook of affective sciences (pp. 752–
772). Oxford, UK: Oxford University Press.
Plutchik, R. (1980), Emotion: a psychoevolutionary synthesis, New York: Harper & Row.
Polzin, T.S. and Waibel, A., (2000), Emotion-Sensitive Human-Computer Interfaces. ISCA Workshop on
Speech and Emotion: A conceptual framework for research. Belfast. http://www.qub.ac.uk/en/isca/proceedings/
Preece, J., Rogers, Y., and Sharp, H. (2002). Interaction design: beyond human-computer interaction. John
Wiley & Sons, Inc.: New York, NY.
Puril, C., Olson, L., Pavlidis, I., Levine, L., Starren, J., (2005, April). StressCam: Non-contact
measurement of emotional states through thermal imaging. Conference on Human Factors in
Computing Systems at CHI 2005, Portland, Oregon, USA
Quesenbery, W., 2004. Defining a summative usability test for voting systems: A report from the UPA
2004 Workshop on Voting and Usability (Online). Usability Professional’s Association. Retrieved
January 20, 2008.
http://www.usabilityprofessionals.org/upa_projects/voting_and_usability/documents/voting_summative_test.pdf
Rafaeli, A., and Vilnai-Yavetz, I. (2004). Instrumentality, aesthetics and symbolism of physical artifacts as
triggers to emotion. Theoretical Issues in Ergonomics Science. Vol. 5, No. 1 pp. 91-112.
Richins, M. (1997), Measuring emotions in the consumption experience, Journal of Consumer Research,
Vol. 24, No. 2, pp. 127
191
Rubin, J. (1994). Handbook of usability testing: How to plan, design, and conduct effective tests. New
York: John Wiley and Sons, Inc.
Ruthford, M.A., Ramey, J.A., 2000. The design response to usability test findings: A case study based on
artifacts and interviews. In the Professional Communication Conference. Proceedings of the 2000 Joint
IEEE International and 18th Annual Conference on Computer Documentation (IPCC/SIGDOC 2000).
September 24-27. Cambridge, MA, USA
Sanders, E.B. N. & Dandavate, U., (1999), Design for experiencing: New tools. In C J Overbeeke, P P M
Hekkert, Proceedings of the First International Conference on Design and Emotion, Delft: Delft
University of Technology.
Sauerwein, E., Bailom, F., and Matzler, K. (1996). The Kano Model: How to Delight Your Customers.
International Working Seminar on Production Economics, Innsbruck/Igls, Austria, February 19- 23,
313 – 327.
Scherer K. R., & Peper, M. (2001). Psychological theories of emotion and neuropsychological research. In
F. Boller & J. Grafman (Eds.), Handbook of neuropsychology (Vol. 5, Emotional behavior and its
disorders, G. Gainotti, Ed., pp. 17-48). Amsterdam: Elsevier.
Schütte, S. (2005). Engineering Emotional Values in Product Design: Kansei Engineering in Development.
Unpublished doctoral dissertation, Linköpings universitet, Linköping, Sweden
Shackel, B. (19910.Usability – Context, framework, definition, design and evaluation. in Human Factors
for Informatics Usability, Shackel, B. & Richardson, S., Eds. Cambridge: Cambridge University Press,
pp. 21-37.
Shaver, P., Schwartz, J., Kirson, D., O’Connor, G., (1987). Emotion Knowledege: Further Eploration of a
Prototype Approach. Journal of Personality and Social Psychology, Vol. 52, No. 6,
Shneiderman, B. (1992). Designing the user interface (2nd ed.). Reading, MA: Addison-Wesley.
Stanney K.M, Champney, R.K., (2006). Socially Centered Design. In Karwowski, W. (Ed.) International
Encyclopedia of Ergonomics and Human Factors. CRC Press.
Stanney, K.M., Mollaghasemi, M., Reeves, L., 2000. Usability Evaluation and Navigational Metaphor
Design: Explorations into Human-Computer Interaction Issues in Virtual Environments Final Report
(Contract No. N61339-99-C-0098), Naval Air Warfare Center Training Systems Division
192
Stayman M.D., and Aakner, D.A., 1993. Continuous measurement of self-report of emotional response.
Psychology and Marketing. Vol. 10 No. 3, pp. 199-214.
Tan, E.S.H. (2000). Emotion, art and the humanities. In M. Lewis & J.M. Haviland-Jones (Eds.), Handbook
of Emotions (2nd ed.). pp 116-134. New York: The Guildford Press.
TrusterTM, Advantage UpGrade, Post Office Box 251 Palm Harbor, FL 34682 USA. www.truster.com
Velastin, S.A. and Davis, A.C., (2005), Intelligent CCTV Surveillance: advances and limitations. In
Noldus, L.P.J.J., Grieco, F., Loijens, L.W.S., and Zimmerman P.H. Eds. Proceedings of Measuring
Behavior 2005, Wageningen, The Netherlands.
Verona, E., and Curtin, J.J., 2006. Gender differences in the negative affective priming of aggressive
behavior. Emotion, Vol. 6, No. 1
Wensveen, S.A.G., (1999), Probing experiences. In C J Overbeeke, P P M Hekkert, Proceedings of the
First International Conference on Design and Emotion, Delft: Delft University of Technology.
Westerink, J. (2008) Experience in Products. In Westerink, J.H.D.M., Ouwerkerk, M., Overbeek, T. J.M.,
Pasveer, W. F., and de Ruyter, B. Probing experience: from assessment of user emotions and
behaviour to development of products. Springer. Dordrecht, The Netherlands.
Whiteside, J. and Wixon, D., 1987, The dialectic of usability engineering. In INTERACT 87 – 2nd IFIP
International Conference on Human–Computer Interaction. September 1 – 4, 1987, Stuttgart,
Germany, pp. 17 – 20.
Wilson, E. O. 1984, Biophilia (Cambridge, MA: Harvard University Press). In McLoone, H.E., (2003),
Touchable objects: attributes applied to the design of computer input devices. Ergonomics, Vol. 46,
Nos.13/14, 1320 – 1331
Wilson, E. O. 1994, Naturalist (Washington, D.C.: Island Press, Inc.). In McLoone, H.E., (2003),
Touchable objects: attributes applied to the design of computer input devices. Ergonomics, Vol. 46,
Nos.13/14, 1320 – 1331
Wixon, D., & Wilson, C. (1997). The usability engineering framework for product design and evaluation.
In M. Helander (Ed.), Handbook of human-computer interaction (pp. 653–688). Amsterdam,
Netherlands: North-Holland.
193

194
Wright, P. C., McCarthy, J. C. and Meekison, L. (2003) Making sense of experience. in Funology: From
Usability to User Enjoyment. M. Blythe, A. Monk, C. Overbeeke & P. C. Wright, Eds. Dordrecht:
Kluwer, 2003, pp. 43-54.