The Information Content of Put Warrant Issues
48
The Information Content of Put Warrant Issues Scott Gibson a Paul Povel b Rajdeep Singh b February 2006 a Department of Economics and Finance, School of Business, College of William and Mary, Williamsburg, VA 23187. b Department of Finance, Carlson School of Management, University of Minnesota, 321 19 th Avenue South, Minneapolis, MN 55455. Email: [email protected] (Gibson), [email protected] (Povel) and [email protected] (Singh). We are grateful to Sugato Bhattacharyya, Francesca Cornelli, Gustavo Grullon, Dirk Jenter, Jack Kareken, Ross Levine, Bob McDonald, Roni Michaely, Sheridan Titman, Andrew Winton, and seminar participants at the 11th annual Financial Economics and Accounting conference at Ann Arbor, MI, and at University of Minnesota and Cornell University for their helpful comments.
Transcript of The Information Content of Put Warrant Issues

The Information Content
of Put Warrant Issues
Scott Gibson a
Paul Povel b
Rajdeep Singh b
February 2006
a Department of Economics and Finance, School of Business, College of William and Mary, Williamsburg, VA23187. b Department of Finance, Carlson School of Management, University of Minnesota, 321 19th AvenueSouth, Minneapolis, MN 55455. Email: [email protected] (Gibson), [email protected] (Povel)and [email protected] (Singh). We are grateful to Sugato Bhattacharyya, Francesca Cornelli, GustavoGrullon, Dirk Jenter, Jack Kareken, Ross Levine, Bob McDonald, Roni Michaely, Sheridan Titman, AndrewWinton, and seminar participants at the 11th annual Financial Economics and Accounting conference atAnn Arbor, MI, and at University of Minnesota and Cornell University for their helpful comments.

The Information Content
of Put Warrant Issues
Abstract
We analyze why firms may want to issue put warrants, i.e., promises to repurchase
their own shares at a given price in the future. We describe four alternative
explanations, one of which is novel: that put warrants are issued by firms that
wish to signal their good future prospects to their investors (who undervalue the
firms in the eyes of their managers). We test the validity of the four alternative
explanations, using a new, hand-collected data set on put warrant issues in the
U.S. between 1993 and 1999. We find evidence that is inconsistent with three
of the four explanations. Only the signaling explanation is consistent with the
empirical evidence. Put warrant issuers strongly outperform their peers in the
years after the put warrant issues; they enjoy valuable and improving investment
opportunities, and they invest heavily. Put warrant issuers are thus very different
from other firms with ongoing open market share repurchase programs.
JEL codes: G35, G32, D82
Key Words: Put warrants; share repurchases; signaling

1 Introduction
Corporate-issued put warrants give investors the right to sell shares back to the firm at
a future date at a fixed strike price. In return, the firm receives an upfront tax-free cash
premium. The amounts involved can be large: the most prolific issuer of put warrants,
Microsoft Corp., collected $1.9bn between 1994 and 1999. However, put warrants expose the
issuing firm to potentially large liabilities, if the share price moves below the strike price.
In 2000, Microsoft Corp. had potential put warrant obligations of over $11bn outstanding;
during the fiscal year 2001, the company decided to abort its put warrant program, and it
spent over $1.4bn to repurchase outstanding put warrants. Thus, issuing put warrants can
yield tax-free income for a firm, but that brings with it potentially large and costly financial
obligations.
In this paper we analyze why firms may want to expose themselves to this risk. We
consider explanations that can be found in the media and the literature, and we develop a
new explanation. We then test the validity of these explanations, using a new, hand-collected
data set.
Put warrants, and the reasons for issuing them, have not been systematically analyzed
before. One possible explanation for their use is that put warrants allow firms to synthesize
an open market share repurchase: instead of going through a broker, firms can use derivatives
to schedule regular repurchases at certain prices (see Grullon and Ikenberry (2000)). Doing
so may allow the firm to reduce the transaction costs of regular share repurchases, and to
avoid market imbalances if its shares are not traded in a liquid market. This explanation,
which we term the transaction costs explanation, suggests that put warrant issuers are firms
with illiquid share markets, for example smaller firms.
A second possible explanation has to do with stock option compensation, and the di-
lution caused to existing shareholders. Some media commentators have argued that put
warrants simplify share repurchases motivated by the exercise of such stock options, by us-
1

ing derivatives for the repurchases, too. In fact, some firms purchased call options on their
own shares. However, these were usually accompanied by the issue of an equal or larger
number of put warrants, which do not link share repurchases with stock option exercise as
claimed. Nevertheless, we examine the idea that put warrant issues may be more attractive
for firms that make heavier use of stock option compensation. The dilution explanation
implies that put warrant issuers are no different from other firms that have ongoing share
repurchase programs, except for the presence of significant option compensation programs
for their executives or employees. Thus, put warrants should be issued mainly by firms that
offer employees significant option compensation, such as high-tech firms (see Anderson et al.
(2000) and Ittner et al. (2003)).
A third possibility is that firms (potentially) suffering from the “free cash flow problem”
(see Jensen (1986)) issue put warrants. The agency explanation suggests that put warrant
issuers are mature firms, characterized by strong, stable cash flows and few or no investment
opportunities. Such firms may undertake bad investments, simply because managers prefer
to re-invest spare cash to paying it out to shareholders. One way for managers to commit
not to waste spare cash is to credibly promise to pay it out, which can be achieved with put
warrants.
A fourth alternative explanation is that put warrant issues signal good news to investors.
The signaling explanation predicts that only firms with good prospects (compared with the
market’s expectations) will issue put warrants, since firms with poor prospects find them
more costly than firms with good prospects. Firms can use a variety of methods to signal
good news to their investors.1 Put warrants have the benefit that they may be costless, or
even a profitable way of signaling: Microsoft Corp. (and other issuers) prided themselves of
having issued put warrants quarter after quarter, and not a single one was exercised.
The contribution of this paper is twofold. First, we develop the signaling explanation
1See Grullon and Ikenberry (2000); Allen and Michaely (2003); Grullon and Michaely (2002); or Grullonand Michaely (2004).
2

for put warrant issues, i.e., we show theoretically how and under what conditions put war-
rants can be used to support a separating equilibrium. Second, we test the merits of this
explanation and the alternative explanations empirically, using a new, hand-collected data
set.
An example can illustrate the idea of the signaling explanation. In late 1994, AT&T
announced that it would team up with a local firm to enter the Mexican telecommuni-
cations market in 1997, competing with Telmex (Telefonos de Mexico), the Mexican tele-
phone monopoly, instead of cooperating with it. At the time, uncertainty existed about
future deregulation moves of the Mexican government, and about the prospects for different
telecommunications markets in Mexico (long-distance service; local markets; cellular phone
operations; etc.) Telmex’ share price had been in decline for two weeks after the news hit.
To stop this decline, its controlling shareholder, Carlos Slim Helu, announced that he would
issue put warrants for Telmex stock, with a maturity of twelve months. The total potential
liability if the put warrants were exercised amounted to $450m.2
The put warrant issue was meant to reassure investors that Telmex was in a strong
position. Put warrants are similar to a money-back guarantee: if shareholders are not
satisfied with the shares they purchased (because their price fell), they have the right to sell
these shares back at a certain price. Clearly, such an offer will be made only if the chances
of actually having to pay up are not too large. Thus, with a sufficiently large offer, investors
should realize that the firm issuing put warrants must have better prospects than expected:
if the prospects were worse than investors expected, the put warrants could turn out to
be very costly for the firm. In other words, an appropriately structured issue can convey
good news to investors, private information that would otherwise be hard for management
to convey in a credible way.3
2See “Mexico’s Slim Makes Big Bet On Telmex,” Wall Street Journal, November 23, 1994. A similarstory, featuring WMX Technologies Inc., is described in “WMX sells options in buyback strategy involvingless cash,” Wall Street Journal, April 11, 1994.
3In an information brochure about stock buybacks, the investment bank Salomon Brothers emphasizesthe possible use of put warrants to send a positive signal to investors: “. . . put warrants send a positive
3

Importantly, the net costs of using put warrants to signal are zero: firms that issue put
warrants earn a cash premium at the time of issue, and in a separating equilibrium, the put
warrants are priced fairly, so the expected cash outflow is offset by the cash premium. In
contrast, if a firm with poor prospects tries to fool investors by issuing put warrants, it should
expect to suffer a large and costly cash outflow when the put warrants mature, larger than
the amount it collected when issuing the puts. If firms with good prospects choose the right
structure for their issue, then firms with poor prospects will not imitate them, and investors
will understand the signals and price the put warrants (and the shares) fairly. Necessary
conditions for such costless (“non-dissipative”) signaling have been analyzed in Brennan and
Kraus (1987) and Nachman and Noe (1994). Our model focuses on put warrants, which have
been issued in practice, showing that they satisfy the necessary conditions. This contrasts
with other signaling models in which firms use payout policy to signal inside information to
outside investors. In contrast to ours, these models are based on costly signaling (see, e.g.,
Bhattacharya (1979), Miller and Rock (1985), Vermaelen (1984), Ofer and Thakor (1987),
and Constantinides and Grundy (1989)).
In the second part of the paper, we describe a new, hand-collected data set on put warrant
issues that took place between 1993 and 1999, and we use this data to test the validity of
the alternative explanations for put warrant issues. The sample of put warrant issuers that
we study is drawn from a sample of firms that had an active share repurchase program
sometime during the years 1993-1999. The reason for this is that put warrants are issued
(for regulatory reasons) only by firms that have announced plans to repurchase shares in the
open market.
The evidence is consistent with the signaling explanation, but inconsistent with the trans-
action costs explanation, the dilution explanation, and the agency explanation. Conflicting
signal to the market regarding management’s view of the firm’s future stock price. Specifically, managementessentially sets a floor (the warrants’ strike price) below which it is willing to “put its money where its mouthis” and repurchase stock.” (Cited from “Stock Buybacks — Strategy and Tactics,” Salomon Brothers, NewYork, 1997.)
4

with the transaction costs explanation, put warrant issuers are larger than non-issuers, and
their shares exhibit greater liquidity. Conflicting with the dilution explanation, we find that
technology firms are not over-represented in the sample of put warrant issuers, and that
their use of stock option compensation is not different from other firms. Conflicting with
the agency explanation, we find that put warrant issuers are characterized by valuable and
improving investment opportunities, high investment in R&D, and high capital expenditure;
we find no evidence of asset disposal after put warrant issues. And conflicting with the
transaction costs explanation and the dilution explanation, but consistent with the signaling
explanation and the agency explanation, put warrant issuers show significantly improved
operating performance in the years after the issue.
Our findings have implications for research on share repurchase programs (since put
warrants are issued within ongoing share repurchase programs). A large number of studies
have analyzed announcements of share repurchase programs, finding positive stock price
reactions.4 Two studies explore the origins of these share price reactions: Nohel and Tarhan
(1998), who study 242 tender offer share repurchases, and Grullon and Michaely (2004),
who study a comprehensive sample of open-market share repurchases. Both present evidence
supporting the view that share repurchases are symptoms of a transformation of these firms, a
transformation that includes declining investment opportunities and profitable but maturing
products. Managers of these firms appear to be maximizing shareholder value by promising
to disburse excess free cash flow to shareholders, instead of wasting it on negative-NPV
investments. This description does not fit firms that issue put warrants at all: they have
valuable and growing investment opportunities; they invest heavily; their profitability is
high and improving after the put warrant issues; and there is no evidence of asset sales
as an explanation for improved profitability. Thus, in order to understand the information
conveyed by share repurchase program announcements, it is necessary to better distinguish
4See Dann (1981), Vermaelen (1981), Comment and Jarrell (1991), Ikenberry et al. (1995), Grullon andMichaely (2002).
5

the types of firms that announce them, partly by studying how the repurchases are eventually
implemented.
The remainder of the paper is organized as follows. In Section 2, we describe some
institutional details in connection with put warrants. In Section 3, we lay out the model’s
assumptions, and we establish conditions under which appropriately designed securities lead
to a non-dissipative separating equilibrium. In Section 4, we focus on put warrants and
how they can be used in a separating equilibrium. In Section 5, we develop the testable
predictions of the four alternative explanations. In Section 6, we describe the data and how
it was collected. In Section 7, we explain the empirical methodology that we use to test
the validity of the four alternative explanations. In Section 8, we present and interpret the
empirical findings. We make our concluding remarks in Section 9.
2 Institutional Details
Corporate-issued put warrants give investors the right to sell shares back to the firm at
a future date at a fixed strike price. In return, the firm receives an upfront tax-free cash
premium.5 In many cases, the issuing firm can insist on a net settlement, i.e., if the owner of
the put warrant exercises, there may be no delivery of shares to be repurchased, and instead
the owner receives the equivalent of the intrinsic value. In some cases, a net cash settlement
is possible; in other cases, the issuer reserves the right to pay by issuing shares to the owner
of the put warrant.
Put warrants are sold through private placements, not public offerings. Accordingly the
SEC does not require that their issue be registered and publicly disclosed. The accounting
rules have changed over time, but firms required to file financial statements with the SEC
had to provide summary information about material put warrant issues at least since 1988.6
5Put warrants may have tax disadvantages for firms that are paying taxes and that do not have sparesources of tax shields, cf. McDonald (2004).
6EITF 88-9 classified all put warrant issues as temporary equity; EITF 00-19 (implemented in 2001)
6

These firms’ quarterly and/or annual financial statements should mention the fact that put
warrants were issued, and give a few details: their number, strike price and maturity (to
allow for the calculation of the potential liability at expiration), and information about the
funds raised (recorded as an increase in stockholders’ equity, without any tax liabilities). In
practice, the information provided is often sketchy or incomplete; information can be found
in balance sheets, statements of stockholders’ equity, cash flow statements, and/or in the
notes to the financial statements.
The minimal disclosure requirements are comparable to those for open market share
repurchases. In fact, the SEC rules covering both types of transaction are identical. Firms
must publicly announce their plans to repurchase shares in the open market, before they
can repurchase shares or issue put warrants. This is one of the rules of conduct listed in
SEC Rule 10b-18, which provides a “Safe Harbor” against possible accusations of share price
manipulation (the anti-manipulation provisions are detailed in Sections 9(a)(2) and 10(b) of
the Securities Exchange Act of 1934). Rule 10b-18 offers a “Safe Harbor”, but following its
guidelines is not a requirement (for details on open market share repurchases, Rule 10b-18,
and its violations, see Cook et al. (2003)). That the “Safe Harbor” guidelines of Rule 10b-18
apply to the issue of put warrants was clarified by the SEC in a no-action letter, upon a
request from the Chicago Board Options Exchange (File No. TP 90-375, February 22, 1991).
Put warrants are marketed almost exclusively to sophisticated institutional investors,
primarily securities dealers and hedge funds. The intention to issue put warrants is thereby
made known to the key players in the financial markets (i.e., the sophisticated institutional
investors who have been offered the put warrants), while avoiding the attention of retail
investors who may mis-interpret the issue and its possible implications. Conversations with
investment bankers who underwrite put warrants confirmed that corporations use private
classified some put warrant issues as mezzanine items, depending on the details of the contract; FAS 150(implemented in 2003) classifies all put warrant issues as liabilities. Classifying put warrants as liabilitiesrequires that they are recorded at fair value in each statement, and that changes in the fair value are reflectedin the firm’s reported earnings.
7

placement channels to avoid confusing less sophisticated or inexperienced investors, who
may find it hard to assess the significance and risks involved with the issue of put warrants.7
3 The General Model
In this section, we analyze the general properties of a security that allows for a non-dissipative
separating equilibrium. In Section 4, we analyze a model in which firms can issue put
warrants, and we show that put warrants satisfy these conditions. The pricing of put warrants
is not straightforward, since they may be so deep in the money at maturity that the promised
payments (the strike prices times the number of put warrants) are higher than what the firm
can possibly pay. In other words, the firm may be worth less than the payoff that put warrant
holders were promised. We therefore analyze a model with a continuum of possible future
values of a firm, and in which investors rationally expect that the firm may default on its
put warrants (for liquidity reasons; we ignore possible “strategic” defaults).
Consider a firm that is debt-free and has a continuum of shares outstanding, with measure
1. It expects a stochastic cash flow C ∈ [0, C
]at date t = 2. This cash flow is paid out to
shareholders, and the firm is then liquidated. The firm can be of two types, H or L. The
types are unobservable to outsiders (including shareholders), and the probability of type H
is strictly between zero and one. The types have different cash flow distributions, gH(C) and
gL(C), with full support and no mass points. We assume that the monotone likelihood ratio
property (MLRP) holds:
d
dC
gL(C)
gH(C)< 0 ∀C ∈ [
0, C].
MLRP implies first-order stochastic dominance (FOSD), i.e., GL (C) > GH(C) ∀C < C, and
that gH and gL cross exactly once. Denote the crossing point by x. MLRP also implies that
7In particular after the derivatives-related losses at Procter and Gamble, Gibson Greetings, Barings Bankand Orange County. See “Heard on the street: More firms use options to gamble on their own stock,” WallStreet Journal, May 22, 1997.
8

the expected final cash flow is higher for type H,
FH ≡∫ C
0
CgH(C)dC >
∫ C
0
CgL(C)dC ≡ FL. (1)
At date t = 0, the firms can issue securities and pay out the proceeds as a special dividend to
their current shareholders. While the firm’s type can be observed only by its management,
investors update their beliefs after observing what securities were offered. The investors who
consider buying the new securities also update their beliefs about the firm’s type, which in
turn affects their willingness to pay for those new securities. Investors are willing to buy the
securities if, given their beliefs, they expect at least to break even.
Assume that the management’s objective function is to maximize a weighted average of
the expected share price at date t = 1 (after the firm issued securities and investors updated
their beliefs) and the expected share price at date t = 2 (after cash flows have been realized).
Miller and Rock (1985) argue that this objective function is justified if some shareholders
suffer liquidity shocks at the intermediate date and must sell their shareholdings, and at
that stage the firm’s type is not publicly known, yet.8 The firm’s management should then
put some weight on creating favorable selling conditions for those shareholders who are hit
by the liquidity shock, which leads to the weighted-average objective function. Denote the
weight on the t = 1 share price by µ; the weight on the final share price is then (1− µ). We
assume that µ ∈ (0, 1).
The problem for the firm with type H is to convince investors that it is of type H. It
can achieve that by issuing a bundle of securities that a firm with type L would prefer not
to issue (thereby revealing its type). The key is to design a bundle of securities promising
8Alternatively, the management’s objective function may stem from stock options that vest over differenttime horizons; or the founder-manager may plan to sell out in two stages (see Chemmanur and Fulghieri(1997)); or the manager may leave the firm at date t = 1 for exogenous reasons, and her human capital maydepend on the market’s perception of the firm’s value at that date; or the share price may be relevant tostakeholders other than shareholders, for example customers trying to infer the long-term prospects of a firmthat sells long-lived goods or relationship-specific services (see Titman (1984); see also Daniel and Titman(1995) for an overview).
9

payments that are more likely to be made if the securities are issued by a type L firm, which
then does not find it attractive to mimic a type H firm. We now analyze conditions under
which such a separating securities issue is possible and will be chosen by the H type firm.
In a separating equilibrium, the firm issues a bundle of securities promising a payout
ψi(C), i = H, L, given a final cash flow C. Investors correctly identify the firm’s type after
observing its securities issue (or non-issue), and the securities are sold at a fair price in
equilibrium. Without loss of generality, we focus on equilibria in which a type L firm does
not issue any securities.9
Define PH and PL, the full-information values of put warrants issued by type H or L
firms, as
Pi =
∫ C
0
ψH(C)gi(C)dC, i = H, L. (2)
The incentive constraint for type L is
FL ≥ PH + µ (FH − PH) + (1− µ) (FL − PL) . (3)
The left-hand side describes the type L equilibrium payoff under separation: the type L
firm does not issue any put warrants and investors identify its type and value correctly.
The right-hand side represents the payoff from mimicking a type H issue: the first term
is the cash raised in the issue; the second and third term can be rewritten as (FL − PL) +
µ ((FH − PH)− (FL − PL)), i.e. the true value, plus the overvaluation at date t = 1 (weighted
by µ). Rearranging (3) yields
µ
1− µ≤ PL − PH
FH − FL
. (4)
If the type H firm deviates from the separating strategy by not issuing any put warrants,
9As will become obvious below, if there is a separating equilibrium in which the type L firm issues putwarrants, there is an equivalent separating equilibrium in which it does not issue any. Given separation, atype L firm does not benefit from issuing any securities, so it weakly prefers not to issue any. For a type Hfirm, issuing securities is costless in a separating equilibrium, so it has no incentive to change the details ofthe securities it offers to investors. So the equivalent equilibrium leaves the type H issue unchanged and hasa type L firm issue no securities at all.
10

investors will at date t = 1 believe that its type is L instead of H. The incentive constraint
for type H,
FH ≥ µFL + (1− µ) FH , (5)
is not binding in equilibrium (it simplifies to FH ≥ FL).
Lemma 1 Incentive compatibility is violated if ψ′i(C) ≥ 0 ∀C.
Proof. (By contradiction.) MLRP and ψ′i(C) ≥ 0 ∀C together imply that
∫ C
0
ψ′H(C)(GL(C)−GH(C)
)dC > 0.
After rearranging and partial integration,
∫ C
0
ψH(C)(gH(C)− gL(C)
)dC > 0 ⇐⇒ PH − PL > 0.
This contradicts (4), which requires that in equilibrium, PL − PH > 0.
Lemma 1 shows that separation cannot arise in equilibrium if type H firms issue securities
whose payoff is everywhere increasing with the firm’s realized final cash flow. A similar result
has been derived before, cf. Brennan and Kraus (1987) and Nachman and Noe (1994). The
intuition is straightforward. Any security that has payoffs increasing in the firm’s cash flow
will in expectation turn out to be more costly for the type H firm than the type L firm.
This is because the type H firm is more likely to get higher cash flow realizations than the
type L firm. Separation cannot arise under these circumstances, since a type L firm would
always end up selling a security priced higher than its intrinsic value.
Lemma 1 provides a general condition on the type of securities that a type H firm should
not issue if it wants to induce a separating equilibrium. Even though the lemma rules out
the most commonly observed securities (e.g., straight and convertible debt, straight and
convertible preferred stock, and common stock), it does not rule out put warrants, which
11

are the focus of our analysis. In the next section, we show that put warrants satisfy the
conditions set out in Lemma 1, and that firms may therefore signal their superior future
prospects by issuing put warrants.10
4 The Model With Put Warrants
It is interesting to study put warrants since firms use them in practice. Put warrants are
attractive signaling tools for two reasons. First, instead of having to burn money up front, as
in other signaling theories, the type H firm is actually paid an amount PH when sending the
signal. This makes signaling through put warrant issues particularly attractive to firms that
are cash constrained, say firms that are growing rapidly and have large investment opportu-
nities. Second, a firm is credibly committed to repurchasing shares if the put warrants are
exercised; this compares favorably to open-market share repurchase announcements, where
there is no guarantee that a promised repurchase will be executed, and where repurchase
plan announcements therefore do not have much credibility (see Allen and Michaely (2003)
for a survey on payout policy).
For simplicity, assume that the firm can only issue put warrants at date t = 0. If a put
warrant is exercised, the firm purchases the contractually agreed number of shares from the
put-owner and pays the contractually specified strike price. The exercise of a put warrant
reduces the number of shares that the firm has outstanding.
Assume that the firm sells one type of put warrant, with strike price x ∈ [0, C
]and
expiration date t = 2, and that it sells put warrants for β shares, where β < 1 (the firm
cannot repurchase more shares than it has outstanding). Recall that the total measure of
shares is 1, implying that the maximum amount that the firm may have to pay upon exercise
is x. Investors believe the firm is of type H if it issues put warrants. By selling these put
warrants the firm raises an amount PH(β, x), which is also the expected payoff to the put
10Alternative security designs that may satisfy the conditions include putable bonds, cf. David (2001); and“contingent value rights,” used in 23 takeovers during the 1990s, cf. Chatterjee and Yan (2004).
12

warrant owners as a group, if issued by a type H firm. If the put warrants were issued by
a type L firm (mimicking a type H firm), denote the true expected value by PL(β, x). As
before, receipts from the issue (if any) are paid out immediately to existing shareholders as
a pro-rata dividend.
Denote by s the equilibrium value of one share after date t = 2, i.e. after expiration (s
is also the value of all shares). Put warrant owners should exercise if s < x. If C ∈ [0, βx),
then s < βx, and there is not enough cash to cover the promised strike price for all put
owners; in this case, we assume that the firm pays out all its cash on a pro-rata basis to the
put warrant owners. The payoff for each put warrant owner is then Cβ, and the remaining
shares (if β < 1) are worthless.
With somewhat higher C, the put warrants are exercised, and the shares retain value
after the put warrants were exercised and the strike price was paid. The post-exercise share
price is determined by
(1− β) s = C − βx ⇐⇒ s =C − βx
1− β.
The payoff from exercising a put warrant is then
x− s = x− C − βx
1− β=
x− C
1− β.
If that payoff is positive, i.e. if C < x, the put warrant owners find it individually rational to
exercise. If C ≥ x, the put owners do not exercise, their payoff is zero, and the share price
is s = C. To sum up, the aggregate payoff to put-owners (at expiration) is
C if 0 ≤ C ≤ βx
β1−β
(x− C) if βx ≤ C ≤ x
0 if x ≤ C ≤ C
(6)
13

The payoff described in (6) satisfies the necessary condition for a separating equilibrium (cf.
Lemma 1 above): the payoff is weakly increasing in the first and third interval, but it is
strictly decreasing in the second interval (if β = 1, then the second interval collapses, and
there is a discontinuity in the payoff schedule).
A key variable in our analysis is ∆(β, x), the difference between PL(β, x) and PH(β, x),
the full-information values of (otherwise identical) put warrants issued by type L and H
firms.
∆(β, x) ≡ PL(β, x)− PH(β, x)
=
∫ βx
0
C
(gL(C)− gH(C)
)dC +
∫ x
βx
β
1− β(x− C)
(gL(C)− gH(C)
)dC. (7)
It is easily verified that ∆(β, 0) = ∆(0, x) = 0, and that ∆(β, x)|βx=C
= FL − FH < 0. The
next result will be useful in the analysis that follows.
Lemma 2 ∆(β, x) has a unique maximum in β = 1, x = x.
Proof. See the Appendix.
Given a put warrant issue (β, x), we can derive the incentive constraint for type L (anal-
ogous to (3) and (4)),
µ
1− µ≤ PL(β, x)− PH(β, x)
FH − FL
. (8)
To obtain intuition it is helpful to rewrite (8) as µ [FH − FL] ≤ (1− µ) [PL (·)− PH (·)],decomposing the net benefit of mimicking a type H issue into cash-related effects and pure
valuation effects. PL(β, x) is the value of future cash outflows for the type L firm if it mimics
the type H firm and issues put warrants. PH(β, x) is the price it can raise in the issue. The
difference is the cost of mimicking borne by the shareholders of a type L firm, and (1− µ)
recognizes the weight imposed by shareholders on the real cost borne. The left-hand side of
the inequality is the benefit of mimicking at t = 1. The market perceives the firm to be of
a high type and values it accordingly. For incentive compatibility to be satisfied, the cost of
14

mimicking has to be higher than the benefit. The next proposition derives a necessary and
sufficient condition for incentive compatibility to be satisfied.
Proposition 1 There exists a separating equilibrium if and only if
µ
1− µ≤ PL(1, x)− PH(1, x)
FH − FL
. (9)
Proof. From Lemma 2, (1, x) maximizes the right-hand side of (8). If a separating equi-
librium exists for some (β, x) 6= (1, x), then (1, x) is also a separating equilibrium. If (9)
is binding, then (1, x) is the unique separating equilibrium, since (8) is violated for all
(β, x) 6= (1, x). If (9) is violated, then (8) is violated for all (β, x), and no separating
equilibrium exists.
The sufficient and necessary condition for separation (9) has intuitive properties. The
left-hand side is increasing in µ, the weight on the short-term valuation in the firm’s objective
function. The higher this weight, the more attractive it becomes for a type L firm to mimic
a type H firm, and the harder it becomes to separate. Separation also becomes more difficult
if (FH − FL) increases, the short-term benefit (weighted by µ) from mimicking. Separation
becomes easier if (PL(1, x)− PH(1, x)) increases, i.e. the maximum difference in the full-
information values of the put warrants.
This mispricing (the type L firm sells put warrants at the low price PH even if the value
of the expected payoff at expiration is higher) is not the only concern that a firm may
have. Issuing put warrants can be costly, even for a type H firm. There may be fixed costs
associated with a put warrant issue, say because management is distracted by a need to
acquaint itself with valuation techniques, market regulation, and legal risks. Management
may fear the embarrassment of an exercise of the put warrants, implying that the firm
underperformed, compared with its own expectations. If the firm must repurchase shares
at a price far above the current share price, there may also be financial implications. More
likely than not, the low share price may have been caused by poor performance, and the firm
15

may be financially weakened. This would be a bad time for it to make large payments to put
warrant owners: the firm may have to raise fresh funds at a high price, sell assets to raise
cash, or cancel investment projects to cut costs. These possible costs seem to be relevant
considerations in practice: the fact that some firms issued put warrants in the past decade
seems to have caught the public’s attention only when some firms were required to make
large payments, with strike prices far above the firms’ current share prices, and observers
had concerns about those firms’ financial health.11
We now analyze how such potential costs affect the feasibility of a separating equilibrium.
Suppose that issuing put warrants (β, x) leads to costs αC(β, x), where α ∈ [0,∞) and
C is strictly positive and weakly increasing in both arguments. Modeling with the scale
parameter α allows us to model high and low costs of put warrant issues in a straightforward
way. Consider a put warrant issue (β, x) for which (8) is satisfied, i.e. in the absence of any
costs, a type L firm does not issue any put warrants. In the presence of costs, we need to
rewrite the incentive constraint as
FL ≥ PH(β, x) + µ
(FH − PH(β, x)
)+ (1− µ)
(FL − PL(β, x)
)− αC(β, x) (10)
µ
1− µ≤ PL(β, x)− PH(β, x)
FH − FL
+αC(β, x)
(1− µ) (FH − FL). (11)
If the costs are not zero, we must also consider the incentive constraint for the type H
firm,
FH − αC(β, x) ≥ µFL + (1− µ) FH . (12)
(Recall that if the type H firm deviates, investors believe at date t = 1 that its type is L.)
In a separating equilibrium with costs, both (11) and (12) must be satisfied.
11See, e.g., “EDS Bet on Its Stock Price, And Ended Up Losing Big,” Wall Street Journal, September26, 2002; “EDS Isn’t Alone in Betting on a Rising Stock,” Wall Street Journal, September 27, 2002; “BadGuesses: Rocky Markets Foil Firms’ Bets Based On Risk Models,” Wall Street Journal, September 27, 2002;“Does Not Compute: For EDS Chief, Some Gambles That Fueled Growth Turn Sour,” Wall Street Journal,October 1, 2002.
16

Proposition 2 For sufficiently low α, costs of put warrant issues make it easier to satisfy
the incentive constraint for the type L firm. For sufficiently high α, the incentive constraint
for the type H firm is violated, and there will be no separation in equilibrium.
Proof. Comparing (8) and (11), we see that the presence of costs of issuing put warrants
adds slack to the incentive constraint for the type L firm: the last term in (11) is positive, so
all else equal, the condition is more likely satisfied. Thus, all else equal, separation becomes
more feasible in the presence of costs. The second statement follows immediately from an
inspection of (12).
If issuing put warrants becomes costly for all firms, and the costs are not higher for
the type H firm, then it is clear that it should be easier to satisfy the incentive constraint
for the type L firm. However, the analysis does not stop there. Despite the loss due to
misvaluation, the type H may prefer not to issue any put warrants if the costs are sufficiently
high: separation may fail because the benefits are not sufficiently large, compared with the
costs.
To shed more light on these effects, consider the case of fixed costs: at the time of the put
warrant issue, the firm must pay a fixed cost K, which for simplicity we assume comes out
of the amount raised in the issue, possibly augmented by retained cash that would otherwise
have been paid out to shareholders (at date t = 0) as a special dividend. A necessary and
sufficient condition for incentive compatibility (cf. (11)) is that
µ (FH − FL)−∆(1, x) (1− µ) ≤ K. (13)
The incentive constraint for the type H firm is satisfied if and only if
K ≤ µ (FH − FL) . (14)
Combining (13) and (14) shows that a necessary and sufficient condition for the existence
17

of a separating equilibrium is
K ∈[
µ (FH − FL)−∆(1, x) (1− µ) , µ (FH − FL)
]. (15)
This condition is violated if (14) is violated, which occurs when the potential gain from sepa-
ration is small (FH−FL is small or µ is small), or the fixed issuing cost is high. Alternatively,
(15) is violated if (13) is violated, which occurs when the gains from separation are large
and K is small.
Consider a put warrant issue (β0, x0) such that (8) is binding, i.e. separation is possible
in the model without issuing costs (but not with some put issues in the neighborhood of
(β0, x0)). Now consider the case of a small fixed cost K. With (8) satisfied, the lower bound
in (15) is negative and therefore not binding. If K is sufficiently small, (14) is satisfied
and the put warrant issue (β0, x0) remains a separating equilibrium. However, the incentive
constraint (13) is slack, so the set of parameter constellations for which separation is possible
is increased by the introduction of the fixed cost. As K grows, this set increases further, until
(14) is binding — at this level of K, separation is not an equilibrium anymore, since the H
type prefers to mimic the L type. In sum, as K increases, separation becomes feasible more
easily, but eventually the cost will be so high that the type H firm prefers not to separate.
Now consider the case in which (8) is violated even at (1, x), i.e. there is no separating
equilibrium in the model without costs. Introducing a small fixed cost K may not result in
a significant change, since (13) may also be violated, i.e. K is below the (now positive) lower
bound in (15). Eventually, as K grows, (13) will be binding and then satisfied with slack,
and separation becomes feasible for more parameter constellations. However, as described
above, (14) will eventually be violated, and separation cannot be an equilibrium since the
H type would prefer to mimic the L type (by not issuing any put warrants).
To sum up, if the issue of put warrants leads to costs (besides the cash outflows if the put
warrants are exercised), the analysis becomes more complicated, but the qualitative results
18

are the same. In some cases, it may become easier to satisfy the conditions for separation
(and the costs reinforce the ability to use put warrants as a signaling device), while in other
cases, it may become harder (the good firms may prefer not to separate).
5 Development of Hypotheses
The aim of this paper is to explain why some firms issue put warrants, while others don’t.
One important aspect of put warrants is that they may lead to large liabilities if the share
price drops below the strike price. Thus, we need to ask why some (but not all) firms may
want to expose themselves to this risk. When testing the validity of alternative explanations
empirically, it is important to bear in mind the institutional constraints. In particular, put
warrant issues can take place only within a share repurchase program whose existence has
been publicly disclosed beforehand. That provides one reason why the natural comparison
is with firms that also have ongoing share repurchase programs. Another reason is that it
makes it easier to separate different forces: share repurchase announcements have been found
to signal information to investors (see our discussion in the introduction), so we can control
for these effects and focus on the incremental effects of put warrant issues.
One possible explanation (see Grullon and Ikenberry (2000)) is that put warrants allow
firms to synthesize an open market share repurchase: instead of going through a broker, firms
can use derivatives to schedule regular repurchases at certain prices. Using put warrants
may allow the firm to reduce the transaction costs of regular share repurchases, since the
repurchases can be mechanized (through the choice of maturities and strike prices), they
need no supervision (if the counterparties fail to exercise, that can only benefit the issuing
firm), the legal fees may be low (since the put warrants are privately negotiated), and
the firm can reduce the impact of changing share prices on its repurchase program (the
firm can spread large repurchases over several months and hedge share price fluctuations).
Most importantly, the firm can avoid adverse effects on the liquidity of its stock, by using
19

privately placed put warrants instead of open market share repurchases. The transaction
costs explanation predicts that firms with less liquid shares should be more likely to issue
put warrants, where the shares may be less liquid because the firm is smaller than others,
or because its share turnover is lower for other reasons.
An alternative explanation is found in the business press. Many firms that repurchase
shares do so to neutralize the dilution effects of their stock compensation programs. Put
warrants, it is claimed, are part of a repurchase strategy using derivatives that many firms
have implemented to offset the dilutive effect that stock options have on shares.12 Derivatives
allow them to lock in a certain share price for future repurchases, and put warrants seem to
be particularly attractive because of the initial tax-free cash inflow and the possible absence
of a future cash outflow, as emphasized by some CFOs and treasurers; others emphasized the
benefits of stability, arguing that derivatives can be used to hedge future share repurchases
necessitated by stock option exercise.13 This explanation is somewhat inconsistent, since the
stock options awarded to employees are typically calls, and only few firms purchased call
options to implement a share repurchase program; furthermore, the firms that did buy calls
also issued put warrants, typically in equal or larger numbers. Nevertheless, if practitioners
find this a reasonable explanation, it is worthy of inspection. The dilution explanation for
put warrant issues implies that put warrant issuers are no different from other firms that
have ongoing share repurchase programs, except for the presence of significant stock option
compensation programs for their employees. In this case, we would expect the group of
firms that issue put warrants to include many firms from high-tech industries, where stock
compensation is more significant than in other industries (see Anderson et al. (2000) and
Ittner et al. (2003)).
12See, e.g., “Stock Options: No Ifs, Calls, or Puts?” CFO Magazine, October 1, 2000; “Dell Pays HeftyPrice for Its Own Shares,” Wall Street Journal, June 19, 2001; “Stock Option Hedging: Gambling withbuybacks,” CFO Magazine, December 1, 2002.
13See “Heard on the street: More firms use options to gamble on their own stock,” Wall Street Journal,May 22, 1997; “EDS Bet on Its Stock Price, And Ended Up Losing Big,” Wall Street Journal, September26, 2002; “Heard on the Street: Dell, Eli Lilly Join EDS In Risky Options Game” and “Stormy Markets FoilBets By Firms Based on Models,” Wall Street Journal, September 27, 2002.
20

A third explanation regards put warrants as a tool that managers can use to commit not
to waste resources, and to pay them out to shareholders instead. Managers of firms with
high free cash flows and limited reinvestment opportunities may be tempted to make poor
investment decisions, using the free cash flow for ill-advised acquisitions, unprofitable invest-
ments, etc. (see Jensen (1986)). Like debt (and to some degree dividends), put warrants
(with sufficiently high exercise prices) commit such firms to pay out excess cash to investors
instead of squandering it. Unlike debt and dividends, however, such payments are made
if the firm is performing poorly, as measured by its share price. Thus, put warrants could
accelerate change in a firm if corporate governance problems arise or worsen, by extracting
cash from it after making obviously bad investments, for example. This agency explanation
suggests that put warrant issuers have poor investment opportunities, and high (and possibly
increasing) free cash flows. A firm’s operating profitability after the issue may either remain
unchanged or improve: it will improve if the firm disposes of underperforming assets; and it
will remain unchanged if the put warrants merely prevent unprofitable investments.
Finally, the signaling explanation developed in Section 4 argues that firms issue put
warrants to credibly communicate to investors that they are being undervalued. Investors
should understand the signal, and revise their valuations upward. Put warrant issuers should
outperform their peers after the issue, by showing improved operating performance. The
signaling explanation requires the presence of informational asymmetries between the firm’s
insiders and participants in the financial markets. This is more likely to be the case for firms
that have large capital expenditure programs, histories of high growth, significant growth
opportunities, and assets that are hard to value.
6 Data Description
Our initial sample consists of all firms that were reported in the Securities Data Corpora-
tion (SDC) U.S. Mergers and Acquisitions database as having an ongoing share repurchase
21

program anytime in the 1993-1999 interval (we explain our choice of time interval below).
This constitutes our initial sample, since firms that issue put warrants do so in connection
with an ongoing share repurchase program, due to SEC regulations. SEC Rule 10b-18 (the
“Safe Harbor” rule for stock repurchases) describes under what conditions transactions in a
firm’s own stock are not regarded as market manipulation. One stipulation is that plans to
repurchase stock must be announced publicly. Put warrant issuers therefore must have an
ongoing share repurchase program, or a recent stock repurchase plan announcement.
As we argued above (Section 2), firms that prepare GAAP-conforming financial state-
ments have to record material put warrant issues in their financial statements. Quarterly
and annual financial statements are available for publicly traded firms (and other large firms)
through the SEC. We thus searched the 10-K’s and 10-Q’s for firms from our initial sample
on the EDGAR website.14 Our search was limited to the 1993-1999 period, because financial
statements typically can be downloaded from the EDGAR website only from 1993 onwards;
and since our aim is to analyze the put warrant issuers’ long-term performance, we included
only statements with filing dates in or before 1999.
We searched for the phrases “put warrant” or “put option”. A vast majority of the
hits referred to commodity put options or foreign exchange options, which we eliminated
from the sample. In several cases, the put warrants were issued in conjunction with either
debt or preferred stock; we eliminated these since the put warrants were not free-standing
securities, and their issue cannot be separated from the issue of the security to which they
were attached.
This left us with 386 distinct observations for 85 different firms over seven years. The
frequency of put warrant issues is comparable in practice to that of Dutch auction and fixed-
price self-tender offers. For example, Lie and McConnell (1998) identify 102 Dutch auction
and 130 fixed-price tenders during 14 years. Nohel and Tarhan (1998) study the same type
of events and find a total of 242 Dutch auctions and fixed-price tenders during 14 years.
14URL: http://www.sec.gov/edgar/searchedgar/companysearch.html
22

The put warrant issuers do not represent an unusual sample of firms when looking at
the industries in which they are active. A simple check is to compare the frequency of two-
digit SIC codes with those for our initial sample of firms with ongoing open market share
repurchase programs (3,662 firms with Compustat data). We find a major difference only
in the depository institutions industry (2-digit SIC code 60), which includes 2.4% of the
put warrant issuers vs. 18.5% of the repurchasers. This is not surprising, given that this
industry is heavily regulated, and financial institutions must protect their equity buffer. In
some other industries, there were some smaller differences: electronic and electric equipment
and components (36): 11.9% vs. 5.5%; chemicals (28): 10.7% vs. 4.5%; printing and
publishing (27): 4.8% vs. 1.4%; business services (73): 10.7% vs. 7.6%; health services (80):
3.6% vs. 1.1%; communications (48): 3.6% vs. 1.5%; eating and drinking places (58): 3.6%
vs. 1.6%; petroleum refining (29): 2.4% vs. 0.4%; food stores (54): 2.4% vs. 0.6%; general
merchandise stores (53): 2.4% vs. 0.6%; and apparel (23): 2.4% vs. 0.9%. In all other
industries, the differences were negligible.
Ideally, we would like to determine the exact date that firms announced planned put
warrant issues. However, that is not possible with the available data. The exact date of
a put warrant issue is not described in the 10-K/10-Q statements, either.15 Instead, most
refer only to an issue sometime during a quarter (277 observations) or longer time periods
(22 could only be attributed to a specific half-year; and 32 could only be attributed to a
specific year; one observation — which we eliminated — could only be attributed to a two-
year period). Merging put warrant issues that took place in the same year leaves us with
199 annual observations for 84 firms. Due to missing Compustat data which is vital to our
matching procedure (see below), our final sample consists of 188 observations for 77 different
firms.
(Table 1 about here)
15A news search in Lexis-Nexis, Factiva (Dow Jones and Reuters) and the Wall Street Journal did notdeliver any information about put warrant issues that was not available from financial statements.
23

In Table 1 we report summary characteristics of sample firms (as of their first-time put
issuance to avoid double-counting) and matching firms (see below, in Section 7) with share
repurchase programs. Judging from a variety of measures, put warrant issuers are larger than
other share repurchasers. For example, put warrant issuers exhibit larger market capitaliza-
tions than share repurchasers, with a mean (median) value for the market capitalization of
$6.811bn ($2.684bn) versus $3.219bn ($0.590bn). The same holds for a comparison with all
firms that have ongoing share repurchase programs.
Put warrant issuers are also more profitable than other share repurchasers, featuring a
higher ROA (return on assets: EBITDA divided by beginning-of-period book value of assets)
and a higher sales margin (EBITDA divided by sales). The difference is not significant when
comparing put warrant issuers with matched repurchasers, which is not surprising given that
ROA is one of the three criteria in the matching procedure (see Section 7).
Table 1 also shows that put issuers exhibit significantly higher values of Tobin’s Q (calcu-
lated as book value of assets minus book value of equity plus market value of equity, divided
by book value of assets) than share repurchasers, with a mean (median) of 2.96 (2.20) and
1.89 (1.36), respectively. (Again, the values for the matched sample are nearly identical,
because Tobin’s Q is used in our matching procedure.) The values of Tobin’s Q for our
sample are strikingly high when compared to the share repurchasers studied by Nohel and
Tarhan (1998): nearly half the firms in their sample have values of Tobin’s Q below one,
whereas not a single firm in our sample has a value smaller than one.
7 Methodology
There are two critical differences between the predictions that our alternative explanations
for put warrant issues make. One of these concerns the predicted changes in operating perfor-
mance after a put warrant issue. Our signaling explanation predicts improved performance
after a put warrant issue, compared with a peer group of share repurchasers (managers con-
24

vey information about improved prospects to investors by issuing put warrants); the agency
explanation predicts that the operating performance may improve or remain unchanged; in
contrast, the transaction cost explanation and the dilution explanation predict that there
should be no significant changes. The success of these predictions can be tested by compar-
ing measures of performance for our put warrant issuers with those for a sample of matching
firms.
The second critical difference between the predictions is how the financial markets react to
the announcement of a put warrant issue. The transaction cost explanation and the dilution
explanation suggest that no important information is conveyed to the financial markets,
who are aware of both ongoing open market share repurchase programs and stock option
compensation programs. In contrast, the agency explanation and the signaling explanation
suggest that a put warrant issue conveys positive news to the markets, either that the firm
commits to waste less cash, or that insiders feel that the firm is undervalued.
Event studies are the standard method to study market reactions to specific events. The
limited data availability, however, prevents us from using this type of test. As described
in Section 6, we have no information about when the financial markets became aware that
a particular firm will issue put warrants (i.e., we do not know the announcement dates).
The only information we could gather is when the sales of put warrants were executed, but
even this information is imprecise, since for most firms, we know only the fiscal quarter or
year in which put warrants were issued. As Brown and Warner (1985) show, event windows
wider than a few days tend to include too much noise that limits the performance and
interpretation of event studies, so we cannot use an event study to analyze how the market
reacts to planned put warrant issues.
A second standard method in the payout literature is to study the characteristics and
the performance of put warrant issuers before and after an issue, focusing on accounting
ratios. For example, Lie and McConnell (1998), Nohel and Tarhan (1998) and Grullon and
Michaely (2004) construct samples of matching firms based on performance characteristics
25

immediately before the event of interest (as suggested by Barber and Lyon (1996)), and
use them to benchmark performance changes after the issue of put warrants. Like these
earlier studies, we compare the relative performance in the years before and after the put
warrant issues to test whether put warrant issues are indeed a sign that a firm’s operating
performance is expected to improve.
Since in almost all cases put warrants are issued by firms that earlier announced a share
repurchase program,16 it is important to consider only firms with an ongoing share repurchase
program as candidates for the matching sample. This allows us to separate the effects
connected with the put warrant issue from effects connected with the announcement of
a share repurchase program (such announcements have been shown to signal changes in
firms’ characteristics; see Allen and Michaely (2003) for an overview). The initial sample
of potential matching firms is similar to the initial sample from which we drew the put
warrant issuers. It includes all firms that were reported in the Securities Data Corporation
(SDC) U.S. Mergers and Acquisitions database as having authorized an open-market share
repurchase anytime in the 1988-1999 interval.17 If the ending date of a repurchase program
is not specified in the data, we estimate it as three years after the last announcement,
authorization or completed repurchase.18
Our matching procedure uses three variables: the return on assets (“ROA”; EBITDA
divided by the beginning-of-period book value of assets); the change in ROA compared
with the preceding period (“∆ROA”); and Tobin’s Q (“Q”). Using these variables is a
standard approach: Barber and Lyon (1996) suggest the use of ROA and ∆ROA; we also
include Tobin’s Q, since Lie (2001) finds that doing so improves the power of empirical tests.
Procedures similar to ours are used in Nohel and Tarhan (1998) and Grullon and Michaely
16Again, this is to satisfy the guidelines of the “Safe Harbor” rule 10b-18; see Section 2.17We exclude a small number of self-tenders and Dutch auctions, since these events are very different from
regular open-market repurchase announcements; see e.g. Lie and McConnell (1998) or Nohel and Tarhan(1998).
18Stephens and Weisbach (1998) show that the vast majority of open-market share repurchases are executedwithin three years of the repurchase plan’s announcement.
26

(2004).
For each year in which a firm issued put warrants, we select all firm-years from the
repurchaser data set that cover the same calendar year. For each of these firms, we then
calculate the two-digit SIC code, ROA and ∆ROA for the preceding period, and beginning-
of-period Tobin’s Q. The matching proceeds as follows.
1. Select matching candidates whose two-digit SIC code matches that of the put warrant
issuer, and the following are all satisfied:
(a) ROA is either within 20% of the put warrant issuer’s, or the absolute difference
is no larger than 0.01.
(b) ∆ROA is either within 20% of the put warrant issuer’s, or the absolute difference
is no larger than 0.01.
(c) Q is either within 20% of the put warrant issuer’s, or the absolute difference is no
larger than 0.1.
If more than one observation satisfies these criteria, choose the one that minimizes
|ROAput − ROAmatch|+ |∆ROAput −∆ROAmatch|+ |Qput −Qmatch| . (16)
2. If the first stage eliminated all candidates, repeat the procedure, but select all firms
whose one-digit SIC code matches that of the put warrant issuer.
3. If the second stage also eliminated all candidates, repeat the procedure, but select all
firms, irrespective of their SIC code.
4. If the third stage also eliminated all candidates, select all firms, and choose the one
that minimizes (16).
27

Only 188 put warrant issues can be matched, due to missing Compustat data. Of these,
61 are two-digit SIC code matches; 52 are one-digit SIC code matches; 41 are matched
without reference to their SIC code; and 34 are matched using only (16). This matching
performance seems somewhat limited, which is not surprising given the small initial sample
from which matching candidates are drawn (165 in 1993, 806 in 1994, 1,310 in 1995, 1,827
in 1996, 2,315 in 1997, 3,029 in 1998, and 3,433 in 1999). Nevertheless, the performance of
the matching procedure was quite good: as our analysis below shows, the profitability and
Tobin’s Q values of the firms are very similar in the year before the put warrant issues.
8 Empirical Findings
8.1 Post-Issue Performance
Our signaling explanation predicts that put warrant issuers are firms with good prospects, or
at least better prospects than those of firms that (judging by pre-issue data) seem otherwise
very similar. The same prediction may also be made by the agency explanation. In contrast,
the transaction cost explanation and the dilution explanation predict no significant change.
Our goal in this section is thus to analyze whether put warrant-issuers show any significant
changes in post-issue performance, compared with their peers.
We consider several measures of operating performance but, as is standard in the liter-
ature, we focus on ROA, calculated as EBITDA divided by beginning-of-period book value
of assets. Like Grullon and Michaely (2004), we scale by the book value of the assets that
generated the operating income and EBITDA. (It would be misleading to scale by the mar-
ket value of assets, since — as we postulate — put warrant issues have an effect on share
prices: if this effect is positive, then we would underestimate the post-issue performance; if
the effect is negative, we would overestimate it.)
Table 2 gives details of how various accounting performance measures evolve from three
28

years before the put warrant issue to three years after. We focus on the return on as-
sets (ROA); the operating return on assets (OpROA); and the net income return on assets
(NIROA) (see Table 2 for the construction of these variables). Column A presents the median
paired differences for these measures: We calculate the difference between (say) the ROA for
the put warrant issuers and the ROA for their matching firms and report the median value
of those differences. We focus on medians because of the small sample size.
(Table 2 about here)
The median paired differences for ROA (see Column A of Table 2) suggest that put
warrant issuers strongly outperform their peers after the issue. In the year of the issue, the
ROA is higher, and the difference is significant both economically and statistically. The
difference grows over time, becoming economically large (4.6 percentage points absolute
difference) and highly significant in all three years. This increase is not apparent in the year-
by-year changes reported in Column B (median paired differences of proportional increases),
but it reappears in Column C, where we report the cumulative increases from year zero (the
year of the put warrant issue) to years two and three thereafter: both are positive and large,
but statistically insignificant for the three-year horizon. There is no systematic difference in
the years of and before the put warrant issues, which is not surprising given that year −1
ROA was used to construct the matching sample.
The next two profitability measures in Table 2, OpROA and NIROA, provide robustness
checks to ROA. Like ROA, OpROA is an upstream measure of operating performance in that
it is unaffected by capital structure changes, tax issues, and non-recurring events. NIROA,
on the other hand, measures profitability after these factors which are not directly related
to the firm’s continuing operations. Consistent with the prediction of our model, OpROA
and NIROA both show a similar pattern of significant profitability increases in post-event
29

years for put warrant issuers relative to matching firms.19 In fact, the findings are stronger
than when using ROA: the cumulative changes are more significant, and the performance
improvement seems to happen over a longer time horizon.
Overall, the findings reported in Table 2 suggest that put warrant issuers significantly
outperform their peers after the put warrant issue. These findings are consistent with both
the signaling explanation and the agency explanation, but they are inconsistent with the
transaction cost explanation and the dilution explanation.
8.2 Is There a Free-Cash-Flow Problem?
The evidence presented in Section 8.1 suggests that put warrant issuers outperform their
peers after the issues, consistent with both the signaling explanation and the agency expla-
nation. We now analyze what may have driven the improved performance, with the aim of
better distinguishing the explanatory power of these two explanations.
The agency explanation assumes that put warrant issuers potentially suffer from the
free cash flow problem. This problem is most acute for firms that are mature, in the sense
that they are not growing, face limited or no investment opportunities, and earn high and
stable free cash flows. The managers of firms with these characteristics may be tempted to re-
invest the free cash flows even if they lack profitable investment opportunities. Consequently,
shareholders should benefit if the management can commit to pay out the excess cash. Going
further, shareholders may benefit if these firms sell off assets or close operations that do not
earn their required return. Besides freeing up cash that is poorly invested, doing so should
improve the average operating performance of these firms.
This makes it possible to distinguish the predictions of the signaling explanation and the
agency explanation (see also Nohel and Tarhan (1998) and Grullon and Michaely (2004)).
Both explanations predict improvements in operating performance (consistent with our find-
19Using Income Before Extraordinary Items (Compustat data item 18) leads to findings that are verysimilar (not reported).
30
ings reported in 8.1) after the put warrant issues. But the agency explanation predicts that
put warrant issuers should face limited investment opportunities; should invest less than
they used to, or possibly not at all; and should dispose of some of their (under-performing)
assets. In contrast, the signaling explanation makes no predictions about changes, except
possibly that the put warrant issuers expect to face better investment opportunities, and
that they will therefore invest more and keep their assets.
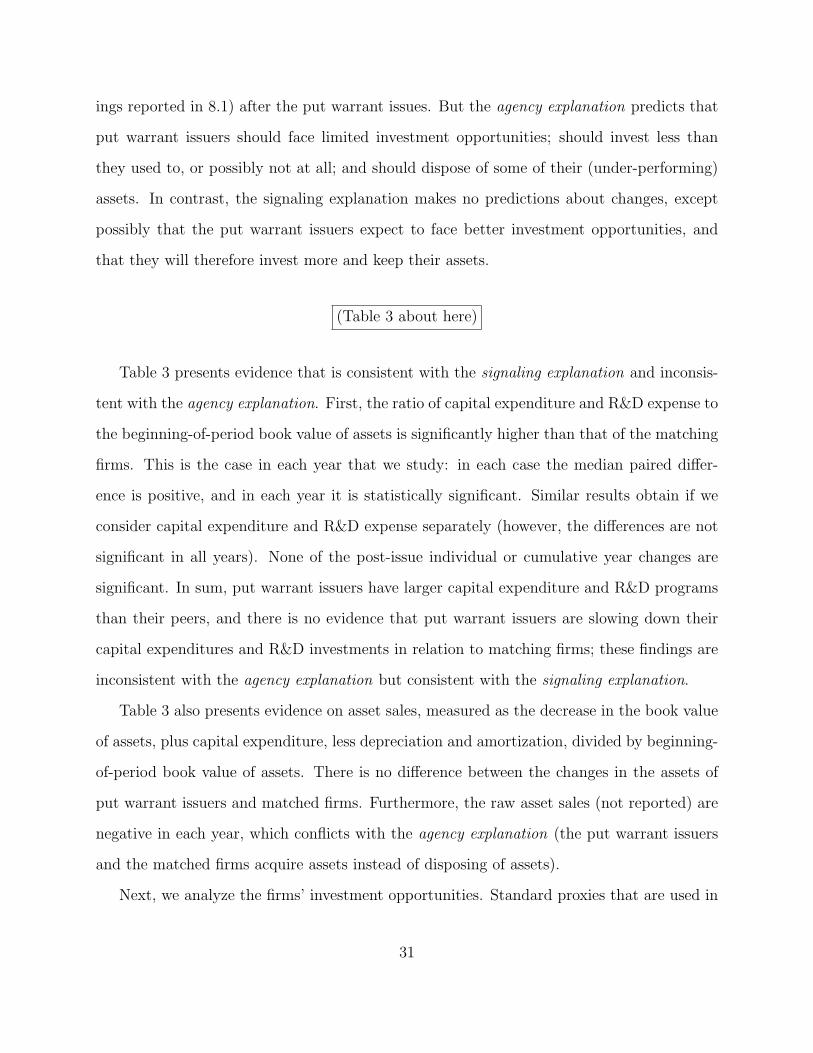
(Table 3 about here)
Table 3 presents evidence that is consistent with the signaling explanation and inconsis-
tent with the agency explanation. First, the ratio of capital expenditure and R&D expense to
the beginning-of-period book value of assets is significantly higher than that of the matching
firms. This is the case in each year that we study: in each case the median paired differ-
ence is positive, and in each year it is statistically significant. Similar results obtain if we
consider capital expenditure and R&D expense separately (however, the differences are not
significant in all years). None of the post-issue individual or cumulative year changes are
significant. In sum, put warrant issuers have larger capital expenditure and R&D programs
than their peers, and there is no evidence that put warrant issuers are slowing down their
capital expenditures and R&D investments in relation to matching firms; these findings are
inconsistent with the agency explanation but consistent with the signaling explanation.
Table 3 also presents evidence on asset sales, measured as the decrease in the book value
of assets, plus capital expenditure, less depreciation and amortization, divided by beginning-
of-period book value of assets. There is no difference between the changes in the assets of
put warrant issuers and matched firms. Furthermore, the raw asset sales (not reported) are
negative in each year, which conflicts with the agency explanation (the put warrant issuers
and the matched firms acquire assets instead of disposing of assets).
Next, we analyze the firms’ investment opportunities. Standard proxies that are used in
31

the literature are Tobin’s Q and the market-to-book ratio.20 We observe significant increases
in the proxies for investment opportunities in the years of and after the put warrant issues.
That is reflected in the levels (Column A) as well as the changes (Columns B and C).
(Since Tobin’s Q is one of the variables used in the matching procedure, the difference in
year −1 is very small.) These findings are inconsistent with the agency explanation but
consistent with the signaling explanation. Put warrant issuers generally have very high
values of Tobin’s Q (see Table 1), suggesting that investors expect these firms to have
valuable investment opportunities. And after the put warrant issues, the expectations seem
to improve significantly. Thus, there is no need for investors to worry that managers may
waste cash on poor investments, since managers tend to choose profitable investments if
such investments are possible. Improving investment opportunities, however, are consistent
with our signaling explanation, because investors may not be aware that the prospects are
improving until after the put warrant issues. (The increase in Tobin’s Q and the market-to-
book ratio may also be driven by share price increases, which increase the numerator but
not the denominator of the two ratios.)
High values of Tobin’s Q and large investment programs (see 2) are also consistent with
the assumptions behind our signaling model: Both are likely to complicate an investor’s
valuation problem, leaving more scope for asymmetric information between investors in the
markets and the firms’ insiders.
In their analysis of tender offer share repurchases, Nohel and Tarhan (1998) split their
sample into subsets with values of Tobin’s Q above and below one, arguing that this allows
them to separately analyze firms with valuable investment opportunities and firms that seem
to invest in negative-NPV investments. Such a sample split is inappropriate in our case: as
described above, the median of Tobin’s Q is much higher than in Nohel and Tarhan (1998).
In fact, the lowest value (not reported) is higher than one. This is again consistent with our
20Another alternative measure, the sum of the market value of equity and the book values of long-termdebt and preferred stock, scaled by the sum of their book values, also yields similar results (not reported).
32

other results, namely that put warrant issuers have valuable investment opportunities and
are certainly not in danger of wasting free cash flow on negative-NPV investments.
8.3 Stock Option Compensation
The dilution explanation implies that put warrants should be issued by firms that have
significant stock compensation programs. Firms in high-tech industries are known to make
heavier use of stock option compensation than firms from other industries (see Anderson
et al. (2000) and Ittner et al. (2003)). We have described the industry composition of our
sample of put warrant issuers in Section 6. While some high-tech industries are represented
more than other industries, the differences do not seem large (given the size of the sample,
84 firms). And other over-represented industries are decidedly low-tech (restaurants, food
stores, general merchandise stores, apparel, printing and publishing, chemicals, business
services). In fact, the main difference when compared with the set of firms with active
repurchase programs is that there are significantly less depository institutions (2-digit SIC
code 60) in the put warrant issuer sample. Thus, the industry composition of our sample
does not allow any clear inferences about the extent of stock option compensation for put
warrant issuers.
The main recipients of stock option compensation for whom data is available are a firm’s
top executives. Compustat Execucomp contains such data for the largest publicly traded
U.S. firms, collected from the annual proxies that these firms file with the SEC.
(Table 4 about here)
Table 4 shows that there is no major difference in the extent of stock option compensation
for the three groups of firms. We calculate option grants during a fiscal year and option
holdings at year-end, as a percentage of the shares outstanding. We do so both for the
number of contracts (divided by the number of shares outstanding) and for the value of
33

the options (as reported by the firms; as a percentage of the market value of all shares).
Execucomp also reports a Black-Scholes value for the option grants, which we substitute for
the value reported by the firms. The only ratio where there is a slightly significant difference
is the value of stock option holdings (reported) as a percentage of the market value of equity;
here, the put warrant issuers seem to have a higher percentage than the active repurchasers
(p-value 0.087; see Column C of Table 4). The corresponding difference between put issuers
and matched repurchasers is small and insignificant (p-value 0.839). In sum, the evidence
on stock option compensation does not support the dilution explanation.
8.4 Transaction Costs
The transaction costs explanation predicts that put warrants will be used if the costs of
issuing put warrants is lower than the cost of executing open market share repurchases.
Grullon and Ikenberry (2000) argue that the direct transaction costs (legal and investment
banking fees) are likely higher for put warrants than for open market share repurchases.
However, the firm’s executives may worry about the impact of open market share repurchases
on share prices if the market for their shares is not liquid. Privately placed put warrants
may avoid large order imbalances, and they also make it easier to circumvent the guidelines
of SEC Rule 10b-18 (again, see Grullon and Ikenberry (2000); see Cook et al. (2003) on
violations of Rule 10b-18).
The transaction costs explanation predicts that put warrants will be issued by firms whose
shares are less liquid, for example because they are small firms. Table 1 presents evidence that
conflicts with the transaction costs explanation. First, put warrant issuers are significantly
larger than share repurchasers that do not issue put warrants. This is true for a variety of
variables that measure size, including total assets, sales, and market capitalization. Second,
put warrant issuers are characterized by greater liquidity, with a mean (median) monthly
share turnover of 1.77 (1.01) versus 1.19 (0.73) (The difference is stronger when comparing
34

put warrant issuers with all share repurchasers).
It is not surprising that put warrant issuers are large firms. Dealing with derivatives
requires executives who have experience in dealing with sophisticated financial instruments,
which is more likely in the case of large firms. Put warrant issuers should also be large
since investors may purchase the put warrants as part of a hedging strategy involving other
securities that the firm issued, which in turn requires liquid markets in a variety of securities,
typically available only for larger firms. This greater liquidity exhibited by put issuers is
also consistent with the demand side of the market for puts. The clientele of institutional
investors who buy put warrants typically holds the puts in conjunction with the underlying
stock as part of a stock-price volatility play. This strategy requires daily trading in the
underlying stock to hedge the put position; hence the tendency for put issuers to have
actively traded stocks.21 Consistent with this source of demand, we also find a higher
percentage of institutional ownership (see Table 1) when studying quarterly reports filed
with the SEC by institutional managers (13F statements, available through the Thomson
Financial CDA/Spectrum Institutional Holdings database).
In sum, the shares of put warrant issuers are more liquid than those of comparable firms,
because put warrant issuers are larger, and because they have a higher share turnover. Thus,
transaction costs cannot explain why some firms issue put warrants and others don’t.
9 Conclusion
The aim of this paper is to analyze what type of firms issue put warrants, and under what
conditions. We identify four alternative explanations, one of which is novel and developed
in this paper: put warrant issues can be used as a signaling device by firms whose excellent
prospects are not recognized by investors. As we show, an appropriately designed put warrant
21In practice, this need for liquidity in the underlying stock restricts firms to having a number of putwarrants outstanding, at any one time, equal to roughly ten days of trading volume. For firms with highlyliquid stock, this can be substantial. Microsoft, for example, collected more than $1.9bn in put warrantpremiums between 1994 and 2000.
35

issue will not be imitated by firms lacking equally good prospects. The reason is that for
these firms, the put warrants are more likely to be exercised, leading to large expected cash
outflows at the time of expiration.
Put warrants are attractive signaling devices. Besides being non-dissipative, they also
allow the issuing firm to collect a cash premium at the time of issue, a feature that is par-
ticularly attractive for firms that are growing rapidly and that have opaque operations and
investment opportunities — text book examples of firms that may want to signal their su-
perior prospects to the financial markets. A further advantage of put warrant issues is the
absence of commitment problems, which plague open market share repurchase announce-
ments and dividend policy changes.
To test the validity of the four alternative explanations, we use a new, hand-collected
data set on put warrant issues. We find little support for three of the four alternative
explanations. More precisely, we find evidence that is inconsistent with each explanation
except for the signaling explanation.
Put warrant issuers turn out to be stellar performers after the issue, with valuable and
improving investment opportunities and active investment programs. This contrasts with
earlier studies which analyze firms that announce share repurchase programs (recall that put
warrant issuers have ongoing open market share repurchase programs): Nohel and Tarhan
(1998) and Grullon and Michaely (2004) find that these firms are likely experiencing declines
in their investment opportunities, and their share repurchase announcements are commit-
ments not to waste free cash flow and instead return it to shareholders. Put warrant issuers
are very different: even though they issue put warrants as part of share repurchase programs,
their investment opportunities are certainly not declining, and there is no evidence of free
cash flow problems. This suggests that share repurchasers cannot always be regarded as
a homogenous group, and that a careful distinction of different types of firms (and their
motives for repurchases) will lead to a better understanding of share repurchases, and the
information content of their announcements.
36

Our analysis shows that a security that seems useful in theory may actually be created
by the financial markets. However, it also shows the power of regulation in destroying useful
institutions. An inspection of recent financial statements shows that most put warrant issues
were terminated in 2002 or earlier. We can think of two possible explanations for this. First,
the market-wide decline in stock prices that began in early 2000 caused a series of firms
with large numbers of outstanding put warrants to suffer embarrassing setbacks, and this
made issuing put warrants more risky for managers worried about lawsuits by disappointed
shareholders. Second, a change in the accounting rules (the implementation of FAS 150 in
2003) forced firms to record all put warrants as liabilities, and to mark them to market, with
corresponding hits to reported earnings if the put warrants become more valuable. There
are probably good reasons for the introduction of FAS 150. Yet, it also greatly curtailed
the use (at least temporarily) of a security that allowed firms to put the money where their
mouth is, with benefits for both firms and investors.
37

Appendix: Proof of Lemma 2
By contradiction. First, suppose the maximum is in x < x.
∂∆(β, x)
∂β=
1
(1− β)2
∫ x
βx
(x− C)
(gL(C)− gH(C)
)dC.
This is positive for x < x, since gL(C) > gH(C) for C < x (and using L’Hopital’s rule if
β = 1). So we must have β = 1. However, from (7),
∆(1, x) =
∫ x
0
C
(gL(C)− gH(C)
)dC <
∫ bx
0
C
(gL(C)− gH(C)
)dC = ∆(1, x).
(The inequality follows from the fact that gL(C) > gH(C) for C < x.)
Second, suppose the maximum is in x > x and β such that βx ≥ x.
∆(β, x) =
∫ bx
0
C
(gL(C)− gH(C)
)dC +
∫ βx
bxC
(gL (C)− gH(C)
)dC
+
∫ x
βx
β
1− β(x− C)
(gL(C)− gH(C)
)dC
<
∫ bx
0
C
(gL(C)− gH(C)
)dC
=∆(1, x).
Third, suppose the maximum is in x > x and β such that βx < x
∆(β, x) =
∫ βx
0
C
(gL(C)− gH(C)
)dC +
∫ bx
βx
β
1− β(x− C)
(gL(C)− gH(C)
)dC
+
∫ x
bx
β
1− β(x− C)
(gL(C)− gH(C)
)dC
<
∫ βx
0
C
(gL(C)− gH(C)
)dC +
∫ bx
βx
β
1− β(x− C)
(gL(C)− gH(C)
)dC
+
∫ bx
βx
(β
1− β(x− C)− C
)(gL(C)− gH(C)
)dC
38

=
∫ βx
0
C
(gL(C)− gH(C)
)dC +
∫ bx
βx
C
(gL(C)− gH(C)
)dC
=
∫ bx
0
C
(gL(C)− gH(C)
)dC −
∫ bx
βx
C − βx
1− β
(gL(C)− gH(C)
)dC
<
∫ bx
0
C
(gL(C)− gH(C)
)dC
=∆(1, x)
39

References
Allen, F. and Michaely, R. (2003). Payout policy. In Constantinides, G., Harris, M., and
Stulz, R., editors, Handbook of the Economics of Finance, Vol. 1A, chapter 7, pages 337–
429. Elsevier North-Holland.
Anderson, M., Banker, R., and Ravindran, S. (2000). Executive compensation in the infor-
mation technology industry. Management Science, 46:530–547.
Barber, B. M. and Lyon, J. D. (1996). Detecting abnormal performance: The empirical
power and specification of test statistics. Journal of Financial Economics, 41:359–399.
Bhattacharya, S. (1979). Imperfect information, dividend policy and the ‘bird in the hand’
fallacy. Bell Journal of Economics, 10:259–70.
Brennan, M. and Kraus, A. (1987). Efficient financing under asymmetric information. Jour-
nal of Finance, 52:1225–1243.
Brown, S. J. and Warner, J. B. (1985). Using daily stock returns: The case of event studies.
Journal of Financial Economics, 14:3–31.
Chatterjee, S. and Yan, A. (2004). Contingent value rights: Theory and empirical evidence.
Mimeo, Fordham University.
Chemmanur, T. and Fulghieri, P. (1997). Why include warrants in new equity issues? A
theory of unit IPOs. Journal of Financial and Quantitative Analysis, 32:1–24.
Comment, R. and Jarrell, G. (1991). The relative signaling power of Dutch auction and
fixed-price self-tender offers and open market share repurchases. Journal of Finance,
46:1243–1271.
Constantinides, G. M. and Grundy, B. (1989). Optimal investment with stock repurchase
and financing as signals. Review of Financial Studies, 2:445–465.
40

Cook, D., Krigman, L., and Leach, C. (2003). An analysis of SEC guidelines for executing
open market repurchases. Journal of Business, 76:289–315.
Daniel, K. and Titman, S. (1995). Financing investment under asymmetric information.
In Jarrow, R. A., Maksimovic, V., and Ziemba, W. T., editors, Handbooks in Operations
Research and Management Science, Vol 9, Finance, chapter 23, pages 721–766. Elsevier
North-Holland.
Dann, L. Y. (1981). Common stock repurchases. An analysis of returns to bondholders and
stockholders. Journal of Financial Economics, 9:113–38.
David, A. (2001). Pricing the strategic value of putable securities in liquidity crises. Journal
of Financial Economics, 59:63–99.
Grullon, G. and Ikenberry, D. (2000). What do we know about stock repurchases? Journal
of Applied Corporate Finance, 13:31–51.
Grullon, G. and Michaely, R. (2002). Dividends, share repurchases and the substitution
hypothesis. Journal of Finance, 57:1649–1684.
Grullon, G. and Michaely, R. (2004). The information content of share repurchase programs.
Journal of Finance, 59:651–680.
Ikenberry, D., Lakonishok, J., and Vermaelen, T. (1995). Market underreaction to open
market share repurchases. Journal of Financial Economics, 39:181–208.
Ittner, C., Lambert, R., and Larcker, D. (2003). Capital structure and the market for corpo-
rate control: The defensive role of debt financing. Journal of Accounting and Economics,
34:89–127.
Jensen, M. (1986). Agency costs of free cash flow, corporate finance and takeovers. American
Economic Review, 76:323–29.
Lie, E. (2001). Detecting abnormal operating performance: Revisited. Financial Manage-
ment, 30:77–91.
41

Lie, E. and McConnell, J. J. (1998). Earnings signals in fixed-price and Dutch auction
self-tender offers. Journal of Financial Economics, 49:161–186.
McDonald, R. (2004). The tax (dis)advantage of a firm issuing options on its own stock.
Journal of Public Economics, 88:925–955.
Miller, M. and Rock, K. (1985). Dividend policy under asymmetric information. Journal of
Finance, 40:1031–1051.
Nachman, D. C. and Noe, T. H. (1994). Optimal design of securities under asymmetric
information. Review of Financial Studies, 7:1–44.
Nohel, T. and Tarhan, V. (1998). Share repurchases and firm performance: New evidence
on the agency costs of free cash flow. Journal of Financial Economics, 49:187–222.
Ofer, A. and Thakor, A. (1987). A theory of stock price responses to alternative corporate
cash disbursement methods: Stock repurchases and dividends. Journal of Finance, 42:365–
394.
Stephens, C. and Weisbach, M. (1998). Actual share reacquisitions in open-market repur-
chase programs. Journal of Finance, 53:313–333.
Titman, S. (1984). The effect of capital structure on a firm’s liquidation decision. Journal
of Financial Economics, 13:137–151.
Vermaelen, T. (1981). Common stock repurchases and market signaling: An empirical study.
Journal of Financial Economics, 9:139–183.
Vermaelen, T. (1984). Repurchase tender offers, signaling and managerial incentives. Journal
of Financial and Quantitative Analysis, 19:163–181.
42

Table 1: Summary Statistics
Summary Statistics for first-time put warrant issuers and firms with ongoing open market share repurchaseprograms. The initial sample consists of firms that announced share repurchases between 1993 and 1999, asreported in the Securities Data Corporation (SDC) U.S. Mergers and Acquisitions database. For these firms,10-K and 10-Q statements were searched for information on put warrant issues. Column A contains data forthe put warrant issuer sample. Column B contains data for a matched sample of firms from the repurchasersample that did not issue put warrants. Firms were matched on several dimensions (following the approachin Grullon and Michaely (2004)), using data from the year before the put warrant issue: SIC code, ROA,change in ROA, and the beginning-of-year market-to-book ratio. (For details of the matching procedure, seeSections 6 and 7. Column C contains data for firms from the original sample of share repurchasers, aftereliminating put warrant issuers. The variables are constructed as follows: “dataX” refers to data item Xin Standard & Poor’s Compustat Industrial Annual database; “L.” refers to a lagged/begginning-of-periodvariable; Total assets = L.data6; Market capitalization = data25×data199; Sales = data12; EBITDA =data13; Income bef. extr. items = data18; Capital expenditure = data128; R&D expense = data46; Dummy:bond rating = ∃ spdrc or spcprc or subdbt; ROA = data13/L.data6; Sales margin = data13/L.data12; Lever-age = data9/(data6−data60+data25×data199); Sales growth = (data12−L.data12)/L.data12; Tobin’s Q =(L.data6−L.data60+L.data25×L.data199)/L.data6. Monthly share turnover uses CRSP data, for the yearbefore a put issue; and Institutional holdings (fraction of total) uses Thomson Financial CDA/SpectrumInstitutional Holdings data (from institutional managers’ 13F filings), for the year before a put issue. Ac-counting variables are reported in millions of US$. Due to missing data, the number of observations (“N”)for put warrant issuers and matched firms can be smaller than 77.
(A) (B) (C)Put issuers Matched firms Share repurchasers
N Mean Median N Mean Median N Mean MedianTotal assets 77 3,618.1 1,356.4 77 1,789.8 ∗∗∗ 296.8 ∗∗∗ 3,393 2,806.2 256.3 ∗∗∗
Market capitalization 77 6,810.5 2,684.5 77 3,219.3 ∗∗ 590.3 ∗∗∗ 3,538 1,387.7 ∗∗∗ 164.8 ∗∗∗
Sales 77 3,474.6 1,605.2 77 1,670.0 ∗∗∗ 394.3 ∗∗∗ 3,587 1,230.2 ∗∗∗ 155.3 ∗∗∗
EBITDA 77 699.6 323.7 77 326.5 ∗∗∗ 72.4 ∗∗∗ 3,465 231.2 ∗∗∗ 23.5 ∗∗∗
Income bef. extr. items 77 266.7 108.5 77 147.7 ∗∗ 37.8 ∗∗ 3,587 75.1 ∗∗∗ 8.5 ∗∗∗
Capital expenditure 76 321.0 114.9 74 145.3 ∗∗∗ 24.1 ∗∗∗ 2,881 96.2 ∗∗∗ 7.6 ∗∗∗
R&D expense 48 143.1 58.5 50 57.5 ∗ 14.0 1,638 47.9 ∗∗ 2.7 ∗∗∗
Dummy: bond rating 77 0.597 1.000 77 0.312 ∗∗∗ 0.000 ∗∗∗ 3,587 0.209 ∗∗∗ 0.000 ∗∗∗
ROA 77 0.231 0.209 77 0.220 0.197 3,273 0.142 ∗∗∗ 0.134 ∗∗∗
Sales margin 77 0.190 0.192 77 0.177 0.169 ∗ 3,465 -0.251 ∗∗ 0.155 ∗∗∗
Leverage 76 0.105 0.058 77 0.070 ∗∗ 0.021 ∗∗ 3,530 0.127 0.067Sales growth 77 0.253 0.124 77 0.184 0.102 3,393 0.286 0.110Tobin’s Q 77 2.959 2.200 77 2.916 2.065 ∗ 3,177 1.888 ∗∗∗ 1.359 ∗∗∗
Monthly share turnover 77 1.768 1.010 77 1.186 ∗∗ 0.729 ∗∗∗ 3,097 0.984 ∗∗∗ 0.634 ∗∗∗
Institutional holdings 66 0.671 0.698 74 0.584 ∗∗ 0.604 ∗∗ 3,190 0.439 ∗∗∗ 0.421 ∗∗∗
∗∗∗, ∗∗ and ∗: mean and median significance levels for the difference between means and medians for putissuers and share repurchasers, at the 1, 5 and 10 percent levels, respectively (using the two-sided t test, andthe Wilcoxon signed-rank and rank-sum tests).
43

Table 2: Relative Accounting Performance Around the Time of Put Warrant Issues
The sample consists of 188 put warrant issues between 1993 and 1999. The put warrant issuers’ accountingperformance is compared with that of share repurchasers that are matched using a method adapted fromBarber and Lyon (1996). (See Sections 6 and 7 for details.) The sample size in each row (“N”) may differfrom 188 due to missing Compustat data. Values reported in column A are median relative performanceratios for put warrant issuers, for up to three years before and after a put warrant issue (time t = 0), i.e.,median performance above that of the matching firm. Values reported in column B are median year-by-yeardifferences of the same variables, again after subtracting the corresponding values for the matching firms.Values reported in column C are median cumulative changes from year 0 (issuing year) to years 2 and 3after the issue. ROA (return on assets) is EBITDA (operating income before depreciation; Compustat dataitem 13), divided by beginning-of-period book value of assets (item 6); OpROA (operating return on assets)is income before extraordinary items (item 18) less special items (item 17) plus income taxes (item 16) plusinterest expense (item 15), divided by beginning-of-period book value of assets; and NIROA (net incomereturn on assets) is net income (item 172) divided by beginning-of-period book value of assets. Valuesreported are absolute: for example, if the CapEx & R&D ratios were 12% and 7%, we would report a valueof 0.05 in column A.
(A) (B) (C)Level Increase (year-by-year) Cumulative incr. (t = 0)
N Median p-value N Median p-value N Median p-valueROA (−3) 174 0.020∗∗∗ 0.008 150 -0.056 0.173ROA (−2) 188 0.005∗ 0.074 174 -0.034 0.143ROA (−1) 188 -0.001 0.373 188 0.004 0.919ROA (0) 187 0.006 0.127 187 0.011 0.333ROA (+1) 167 0.025∗∗∗ 0.003 167 0.057 0.233ROA (+2) 146 0.023∗∗∗ 0.001 146 0.047 0.455 146 0.122∗ 0.054ROA (+3) 129 0.046∗∗∗ 0.002 128 -0.014 0.761 129 0.126 0.143
OpROA (−3) 139 0.015 0.114 110 -0.063 0.347OpROA (−2) 152 0.008 0.214 125 -0.005 0.308OpROA (−1) 157 -0.001 0.820 145 -0.037 0.166OpROA (0) 159 0.009 0.207 149 0.008 0.307OpROA (+1) 140 0.018∗ 0.065 133 0.041 0.379OpROA (+2) 122 0.029∗∗∗ 0.005 117 0.040 0.409 115 0.102∗∗ 0.047OpROA (+3) 109 0.032∗∗ 0.013 106 0.007 0.428 102 0.091 0.329
NIROA (−3) 174 0.007 0.630 150 -0.056 0.436NIROA (−2) 188 -0.003 0.239 174 -0.083 0.372NIROA (−1) 188 -0.008 0.470 188 -0.003 0.193NIROA (0) 188 -0.002 0.835 188 0.030 0.422NIROA (+1) 168 0.005 0.281 168 -0.013 0.677NIROA (+2) 150 0.021∗∗ 0.010 150 0.152 0.148 150 0.257∗∗∗ 0.008NIROA (+3) 130 0.020∗∗∗ 0.006 130 0.110 0.271 130 0.257∗∗ 0.027
∗∗∗, ∗∗ and ∗: significance levels at the 1, 5 and 10 percent levels, using the Wilcoxon signed-rank test.
44
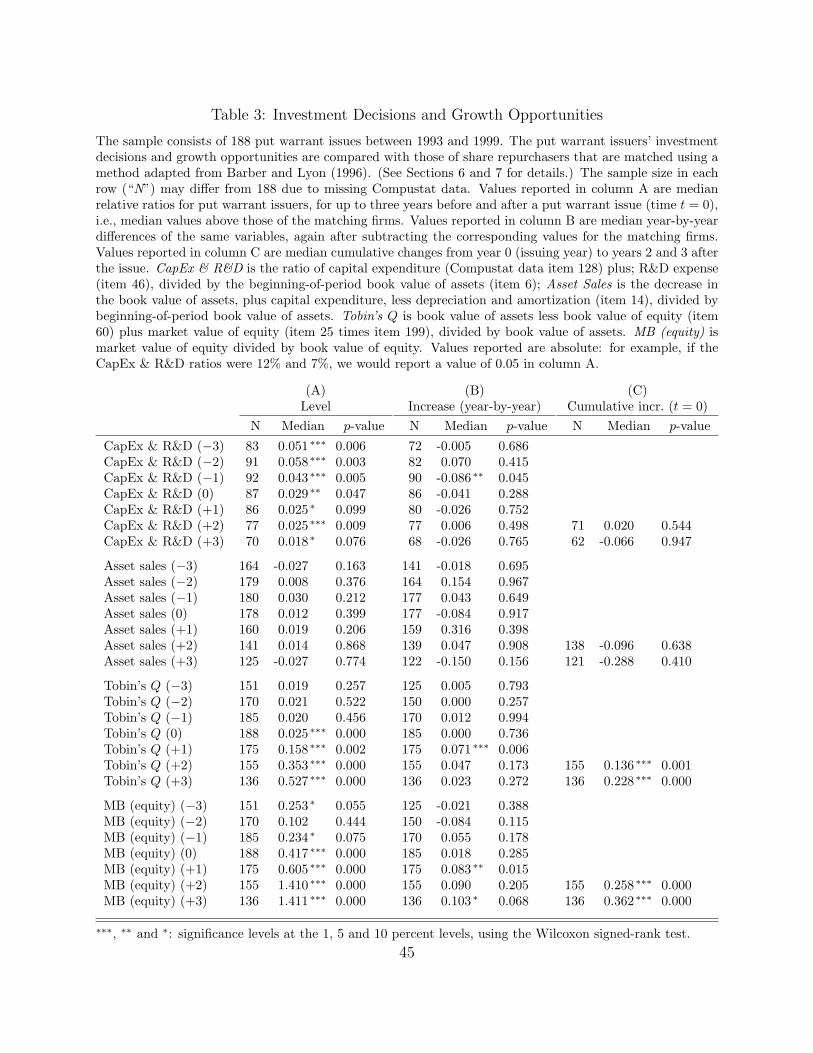
Table 3: Investment Decisions and Growth Opportunities
The sample consists of 188 put warrant issues between 1993 and 1999. The put warrant issuers’ investmentdecisions and growth opportunities are compared with those of share repurchasers that are matched using amethod adapted from Barber and Lyon (1996). (See Sections 6 and 7 for details.) The sample size in eachrow (“N”) may differ from 188 due to missing Compustat data. Values reported in column A are medianrelative ratios for put warrant issuers, for up to three years before and after a put warrant issue (time t = 0),i.e., median values above those of the matching firms. Values reported in column B are median year-by-yeardifferences of the same variables, again after subtracting the corresponding values for the matching firms.Values reported in column C are median cumulative changes from year 0 (issuing year) to years 2 and 3 afterthe issue. CapEx & R&D is the ratio of capital expenditure (Compustat data item 128) plus; R&D expense(item 46), divided by the beginning-of-period book value of assets (item 6); Asset Sales is the decrease inthe book value of assets, plus capital expenditure, less depreciation and amortization (item 14), divided bybeginning-of-period book value of assets. Tobin’s Q is book value of assets less book value of equity (item60) plus market value of equity (item 25 times item 199), divided by book value of assets. MB (equity) ismarket value of equity divided by book value of equity. Values reported are absolute: for example, if theCapEx & R&D ratios were 12% and 7%, we would report a value of 0.05 in column A.
(A) (B) (C)Level Increase (year-by-year) Cumulative incr. (t = 0)
N Median p-value N Median p-value N Median p-valueCapEx & R&D (−3) 83 0.051∗∗∗ 0.006 72 -0.005 0.686CapEx & R&D (−2) 91 0.058∗∗∗ 0.003 82 0.070 0.415CapEx & R&D (−1) 92 0.043∗∗∗ 0.005 90 -0.086∗∗ 0.045CapEx & R&D (0) 87 0.029∗∗ 0.047 86 -0.041 0.288CapEx & R&D (+1) 86 0.025∗ 0.099 80 -0.026 0.752CapEx & R&D (+2) 77 0.025∗∗∗ 0.009 77 0.006 0.498 71 0.020 0.544CapEx & R&D (+3) 70 0.018∗ 0.076 68 -0.026 0.765 62 -0.066 0.947
Asset sales (−3) 164 -0.027 0.163 141 -0.018 0.695Asset sales (−2) 179 0.008 0.376 164 0.154 0.967Asset sales (−1) 180 0.030 0.212 177 0.043 0.649Asset sales (0) 178 0.012 0.399 177 -0.084 0.917Asset sales (+1) 160 0.019 0.206 159 0.316 0.398Asset sales (+2) 141 0.014 0.868 139 0.047 0.908 138 -0.096 0.638Asset sales (+3) 125 -0.027 0.774 122 -0.150 0.156 121 -0.288 0.410
Tobin’s Q (−3) 151 0.019 0.257 125 0.005 0.793Tobin’s Q (−2) 170 0.021 0.522 150 0.000 0.257Tobin’s Q (−1) 185 0.020 0.456 170 0.012 0.994Tobin’s Q (0) 188 0.025∗∗∗ 0.000 185 0.000 0.736Tobin’s Q (+1) 175 0.158∗∗∗ 0.002 175 0.071∗∗∗ 0.006Tobin’s Q (+2) 155 0.353∗∗∗ 0.000 155 0.047 0.173 155 0.136∗∗∗ 0.001Tobin’s Q (+3) 136 0.527∗∗∗ 0.000 136 0.023 0.272 136 0.228∗∗∗ 0.000
MB (equity) (−3) 151 0.253∗ 0.055 125 -0.021 0.388MB (equity) (−2) 170 0.102 0.444 150 -0.084 0.115MB (equity) (−1) 185 0.234∗ 0.075 170 0.055 0.178MB (equity) (0) 188 0.417∗∗∗ 0.000 185 0.018 0.285MB (equity) (+1) 175 0.605∗∗∗ 0.000 175 0.083∗∗ 0.015MB (equity) (+2) 155 1.410∗∗∗ 0.000 155 0.090 0.205 155 0.258∗∗∗ 0.000MB (equity) (+3) 136 1.411∗∗∗ 0.000 136 0.103∗ 0.068 136 0.362∗∗∗ 0.000
∗∗∗, ∗∗ and ∗: significance levels at the 1, 5 and 10 percent levels, using the Wilcoxon signed-rank test.45

Table 4: Stock Option Compensation
Data about stock option compensation plans for put warrant issuers (column A), matched repurchasers(column B), and all firms with ongoing open market share repurchase programs (column C). For detailson the construction of the samples, see Table 1 and Sections 6 and 7. The statistics are calculated usingCompustat Execucomp data. Opt. grts, % shrout. is the number of options awarded to the top executivesof a firm in a year, as a percentage of the shares outstanding. Option grants, % MVE is the value of thoseoptions (as valued by the firm), divided by the market value of the firm’s shares. Opts. held, % shrout. andOptions held, % MVE are similar ratios, using the number of options held in the numerator. Option grants(B-S), % MVE is similar to Option grants, % of MVE, except that the value in the numerator is calculatedusing the Black-Scholes formula (coded in Execucomp). Due to missing data, the number of observations(“N”) for put warrant issuers and matched firms is smaller than 77.
(A) (B) (C)Put issuers Matched firms Share repurchasers
N Mean Median N Mean Median N Mean MedianOpt. grts, % shrout. 69 0.65% 0.31% 50 0.50% 0.23% 1,309 0.80% 0.36%Opt. grts, % MVE 69 0.40% 0.10% 50 0.19% 0.07% 1,305 0.32% 0.12%Opts. held, % shrout. 69 2.56% 1.89% 50 2.22% 1.56% 1,309 2.43% 1.61%Opts. held, % MVE 69 0.83% 0.48% 50 0.91% 0.44% 1,305 0.80% 0.33% ∗
Opt. grts. (B-S), % MVE 69 0.35% 0.11% 50 0.16% 0.06% 1,305 0.30% 0.09%∗∗∗, ∗∗ and ∗: mean and median significance levels for the difference between means and medians for putissuers and share repurchasers, at the 1, 5 and 10 percent levels, respectively (using the two-sided t test, andthe Wilcoxon signed-rank and rank-sum tests).
46