THE INFLUENCE OF PROSTHETIC FOOT TYPES AND · The intrarater test-retest reliability of static and...
296
THE INFLUENCE OF PROSTHETIC FOOT TYPES AND ALTERED SENSORY CONDITIONS ON THE POSTURAL STABILITY OF BELOW-KNEE AMPUTEES DURING UPRIGHT STANDING NOORANIDA ARIFIN THESIS SUBMITTED IN FULFILMENT OF THE REQUIREMENTS FOR THE DEGREE OF DOCTOR OF PHILOSOPHY FACULTY OF ENGINEERING UNIVERSITY OF MALAYA KUALA LUMPUR 2016
Transcript of THE INFLUENCE OF PROSTHETIC FOOT TYPES AND · The intrarater test-retest reliability of static and...

THE INFLUENCE OF PROSTHETIC FOOT TYPES AND
ALTERED SENSORY CONDITIONS ON THE POSTURAL
STABILITY OF BELOW-KNEE AMPUTEES DURING
UPRIGHT STANDING
NOORANIDA ARIFIN
THESIS SUBMITTED IN FULFILMENT OF THE
REQUIREMENTS FOR THE DEGREE OF DOCTOR OF
PHILOSOPHY
FACULTY OF ENGINEERING
UNIVERSITY OF MALAYA
KUALA LUMPUR
2016

UNIVERSITI MALAYA
ORIGINAL LITERARY WORK DECLARATION
Name of Candidate: Nooranida binti Arifin (I.C/Passport No: 830312085860)
Registration/Matric No: KHA120003
Name of Degree: PhD of Engineering
Title of Project Paper/Research Report/Dissertation/Thesis (“this Work”):
The influence of prosthetic foot types and altered sensory conditions on the
postural stability of below-knee amputees during upright standing.
Field of Study: Prosthetics (Biomechanics)
I do solemnly and sincerely declare that:
(1) I am the sole author/writer of this Work;
(2) This Work is original;
(3) Any use of any work in which copyright exists was done by way of fair dealing and for
permitted purposes and any excerpt or extract from, or reference to or reproduction of
any copyright work has been disclosed expressly and sufficiently and the title of the
Work and its authorship have been acknowledged in this Work;
(4) I do not have any actual knowledge nor do I ought reasonably to know that the making
of this work constitutes an infringement of any copyright work;
(5) I hereby assign all and every rights in the copyright to this Work to the University of
Malaya (“UM”), who henceforth shall be owner of the copyright in this Work and that
any reproduction or use in any form or by any means whatsoever is prohibited without
the written consent of UM having been first had and obtained;
(6) I am fully aware that if in the course of making this Work I have infringed any
copyright whether intentionally or otherwise, I may be subject to legal action or any
other action as may be determined by UM.
Candidate’s Signature Date
Subscribed and solemnly declared before,
Witness’s Signature Date
Name:
Designation:

iii
PREFACE
Six chapters of this thesis (Chapter 4-9) comprised the manuscripts which include the
body of the work accepted/submitted for publication in ISI-indexed journals.
Chapter 4 contains reprinted text from Journal of Applied Biomechanics, 30(2),
Arifin, et al., Intrarater Test-Retest Reliability of Static and Dynamic Stability Indexes
Measurement Using the Biodex Balance System During Unilateral Stance, pg. 300-304,
Copyright 2014, Human Kinetics Inc.
Chapter 5 contains reprinted text from Biomedical Engineering Online, 13 (23),
Arifin, et al., The effects of prosthetic foot type and visual alteration on postural
steadiness in below-knee amputees, pp. 1-10, Copyright 2014, Biomed Central Ltd.
Chapter 6 contains reprinted text from The Scientific World Journal, 6, Arifin, et
al., Postural Stability Characteristics of Transtibial Amputees Wearing Different
Prosthetic Foot Types When Standing on Various Support Surfaces. pp. 1-6, Copyright
2014, Hindawi Publishing Corporation.
Chapter 7 contains reprinted text from Adapted Physical Activity Quarterly,
Accepted, Arifin, et al., The effects of different prosthetic feet and head extension on
the postural stability of below-knee amputees during quiet standing. Copyright 2015,
Human Kinetics Inc.
Chapter 8 contains reprinted text from Journal of Engineering in Medicine, 229
(7), Arifin, et al., Evaluation of postural steadiness in below-knee amputees when
wearing different prosthetic feet during various sensory conditions using the Biodex
Stability System (BSS), pp. 491-498, Copyright 2015, SAGE Publication.
Chapter 9 contains reprinted text submitted to Journal of Mechanics in Medicine
and Biology, Arifin, et al., Postural Stability Strategies In Transtibial Amputees During
Quiet Standing In Altered Sensory Conditions Wearing Three Types Of Prosthetic Feet,
SAGE Publication.

iv
ABSTRACT
For individuals with below-knee amputation, the loss of the biological ankle joint and
associated musculatures may adversely affect amputees’ ability to maintain upright
posture successfully, particularly in altered sensory conditions. While postural stability
performance among below-knee amputees has been explored, no research to date has
systematically evaluated postural stability with different prosthetic foot types and
modified sensory input. This research primarily aims to systematically evaluate the
control of postural stability during primary sensory modifications among below-knee
prosthesis users when wearing different types of prosthetic feet. This research also
demonstrates the possibility of objective quantification of postural stability in below-
knee amputees obtained from a commercially available computed posturography device.
The mechanical properties of solid ankle cushioned heel (SACH) foot, single axis (SA)
foot and energy storage and release (ESAR) Talux® foot were tested using a universal
tensile machine. The intrarater test-retest reliability of static and dynamic postural
stability indexes measurement using the Biodex® Balance System (BBS) was
performed on 20 able-bodied participants. 19 participants (ten below-knee amputees and
nine controls) took part in several studies including postural stability assessment of
upright standing during visual, somatosensory and vestibular sensory modifications
while wearing three different prosthetic types. Participants were asked to stand quietly
with eyes-closed, on different surfaces (rigid, unstable and compliant) and with head
tilting backward to simulate modified visual, proprioception and vestibular sensory
input, respectively. The mechanical testing results showed that the ESAR foot had the
lowest heel stiffness followed by SACH and SA. Similarly, the forefoot stiffness was
the lowest for ESAR foot while SACH and SA had similar forefoot stiffness. The
reliability results indicated that postural stability assessment using the BBS provides
‘good to excellent’ test-retest reliability over a one-week time interval. The findings

v
from the posturography assessment suggested that postural stability in below-knee
amputees during quiet upright standing was not affected by the prosthetic foot factor,
but was significantly affected when one of the primary sensory inputs was altered.
When visual cues were absent, overall stability was reduced in SACH and ESAR feet,
medio-lateral stability was reduced in SACH foot while anterior-posterior stability was
reduced in ESAR foot. Standing on a compliant surface was demonstrated to
significantly reduce the overall stability in SACH foot compared to that of an ESAR
foot. Additionally, this study revealed that the differences between amputees and able-
bodied participants can be distinguished when standing on a compliant surface. During
vestibular sensory modification, postural instability in medial-lateral direction was
significantly greater in all prosthetic feet compared to able-bodied individuals. From the
time domain data, the loading time percentage on amputees’ intact limb was
significantly longer than the amputated limb in all sensory conditions for all three
prosthetic feet. The amputees also had a significant strong positive relationship between
overall and medio-lateral stability indexes with all prosthetic feet types and altered
sensory conditions. The analysis of Activities-specific Balance Confidence (ABC) score
demonstrated a significantly higher score in ESAR compared to SACH and SA. In
conclusion, the novel results presented in this thesis have important implications for
amputee rehabilitation program and encourage an evidence-based practice during
amputee assessment. These include identifying postural stability responses towards
different sensory modifications and how these changes can be quantified and monitored
using a reliable and practical computed posturography device.

vi
ABSTRAK
Bagi individu dengan amputasi bawah-lutut, kehilangan sendi buku lali biologi dan
struktur otot yang berkaitan boleh memberi kesan kepada keupayaan amputi untuk
mengekalkan postur tegak, terutamanya dalam keadaan deria diubah. Walaupun prestasi
kestabilan postur amputi bawah-lutut telah diterokai, tiada penyelidikan setakat ini yang
menilai secara sistematik kestabilan postur dengan jenis kaki palsu yang berbeza dan
input deria diubahsuai. Kajian ini terutamanya bertujuan untuk menilai secara sistematik
kawalan kestabilan postur semasa pengubahsuaian deria utama di kalangan pengguna
prostesis bawah-lutut apabila memakai pelbagai jenis kaki palsu. Kajian ini juga
menunjukkan kemampuan peranti posturografi komersial dalam penilaian kuantitatif
kestabilan postur amputi bawah-lutut. Sifat mekanik kaki solid ankle cushioned heel
(SACH), single axis (SA) dan energy storage and release (ESAR) Talux® telah diuji
menggunakan mesin ujian universal. Kebolehpercayaan pengukuran-semula penilai
dalaman bagi indeks kestabilan postur statik dan dinamik menggunakan Sistem
Kestabilan Biodex® (BBS) telah dijalankan ke atas 20 orang peserta normal. 19 peserta
(sepuluh amputi bawah-lutut dan sembilan normal) telah mengambil bahagian dalam
beberapa kajian termasuk penilaian kestabilan postur berdiri tegak semasa
pengubahsuaian deria visual, sentuhan dan vestibular ketika memakai tiga jenis kaki
palsu yang berbeza. Para peserta telah diminta untuk berdiri dengan mata tertutup, di
atas permukaan yang berbeza (keras, tidak stabil dan lembut) dan dengan kepala
didongakkan ke belakang untuk mensimulasikan pengubahsuaian input visual, sentuhan
dan vestibular. Keputusan ujian mekanikal menunjukkan kaki ESAR mempunyai
kekakuan tumit yang paling rendah diikuti oleh SACH dan SA. Kekakuan hadapan kaki
adalah paling rendah untuk kaki ESAR manakala SACH dan SA mempunyai kekakuan
kaki hadapan yang sama. Keputusan menunjukkan bahawa kebolehpercayaan
pengukuran-semula penilaian dalaman ketika ujian kestabilan postur menggunakan

vii
BBS adalah antara 'baik hingga cemerlang' untuk tempoh selang masa seminggu.
Dapatan daripada penilaian posturografi mencadangkan bahawa kestabilan postur
amputi bawah-lutut ketika berdiri tegak tidak dipengaruhi oleh faktor kaki palsu, tetapi
telah terjejas dengan ketara apabila salah satu input deria utama diubah. Apabila isyarat
visual tiada, kestabilan keseluruhan telah berkurangkan bagi kaki SACH dan ESAR,
kestabilan sisi kiri-kanan berkurangan bagi kaki SACH manakala kestabilan depan-
belakang berkurangan bagi kaki ESAR. Berdiri di atas permukaan yang lembut telah
mengurangkan kestabilan keseluruhan kaki SACH berbanding dengan kaki ESAR.
Selain itu, kajian ini mendedahkan bahawa perbezaan antara peserta amputi dan normal
boleh dibezakan apabila berdiri di atas permukaan yang lembut. Semasa
pengubahsuaian deria vestibular, ketidakstabilan postur sisi kiri-kanan adalah jauh lebih
besar dalam semua kaki palsu berbanding individu normal. Daripada data domain masa,
peratusan masa bebanan pada anggota normal amputi adalah jauh lebih lama daripada
anggota badan residu untuk kesemua keadaan deria dan kaki palsu. Amputi juga
mempunyai hubungan positif yang sangat signifikan di antara indeks kestabilan postur
keseluruhan dan sisi kiri-kanan untuk semua jenis kaki palsu dan pengubahsuaian
isyarat deria. Analisis Keyakinan Kestabilan Aktiviti Khusus (ABC) menunjukkan skor
yang signifikan lebih tinggi dalam ESAR berbanding SACH dan SA. Kesimpulannya,
keputusan novel yang dibentangkan di dalam tesis ini mempunyai implikasi yang
penting bagi program pemulihan amputi dan menggalakkan amalan berasaskan bukti
semasa penilaian amputi. Ini termasuk mengenal pasti tindak-balas kestabilan postur
ketika pengubahsuaian deria berbeza dan bagaimana perubahan ini boleh diukur dan
dipantau menggunakan peranti posturografi yang dipercayai dan praktikal.

viii
ACKNOWLEDGMENT
In the name of Allah, the most compassionate, the most merciful.
I would like to express my gratitude to the following people and organization for their
help and valuable contribution to the completion of this thesis.
First and foremost, I would like to thank Prof. Ir. Dr. Noor Azuan Abu Osman
and Prof. Ir. Dr. Wan Abu Bakar Wan Abas for their invaluable supervisory support and
guidance during the duration of this study. I am forever grateful to Ministry of Higher
Education Malaysia and University of Malaya for their financial sponsorship. I would
especially like to thank all the participants for their enthusiasm and commitment. I
would also like to thank Dr. Arezoo Eshragi, Dr. Sadeeq Ali, Dr. Hossein Gholizadeh
and Mr. Firdaus Omar for their technical support throughout data collection. I would
like to thank my fellow members of Center of Applied Biomechanics (CAB) for all the
hours of friendly conversation and insightful advice.
I would like to thank my parents: Arifin Mohd Isa and Rosyani Nordin for their
prayers, love and encouragement throughout my entire life. This thesis is dedicated to
them. I’d also like to thank my sisters and brothers, Azua, Ashikin, Fahmi and Fakhri,
and their wonderful families for their continuous support. To Wafiq, Alia, Rizqi, Akif
and Riyad, thank you for constantly being the reason for me to smile and laugh. To my
parents in law, Hasbollah Hj Mohamad and Yah Awg Nik, thank you for your support
and prayers.
Lastly, and most importantly, I’d like to thank my wonderful husband, Dr. Hasif
Rafidee Hasbollah, for his constant love, for motivating me in loving and caring ways
and for the happiness he has brought into my life. His determination and endurance
during his PhD years has been inspirational.

ix
TABLE OF CONTENTS
PREFACE ........................................................................................................................ iii
ABSTRACT ..................................................................................................................... iv
ABSTRAK ....................................................................................................................... vi
ACKNOWLEDGMENT ................................................................................................ viii
TABLE OF CONTENTS ................................................................................................. ix
LIST OF FIGURES ........................................................................................................ xv
LIST OF TABLES ......................................................................................................... xix
LIST OF ABBREVIATIONS ......................................................................................... xx
LIST OF EQUATIONS ............................................................................................... xxiii
1. INTRODUCTION ........................................................................................................ 1
1.1 Background ....................................................................................................... 1
1.2 Worldwide prevalence of lower- limb amputation ........................................... 3
1.3 Amputation prevalence in Malaysia ................................................................. 4
1.4 Effects of amputation to the control of postural stability ................................. 5
1.5 Problem statement ............................................................................................ 8
1.6 Aim and objectives ......................................................................................... 10
1.7 Outline of Thesis ............................................................................................ 11
2. LITERATURE REVIEW............................................................................................ 13
2.1 Overview of lower limb amputation research ................................................. 14
2.2 Below-knee amputation and prosthesis ........................................................... 15
2.2.1. History of amputation and prosthetics ................................................ 15
2.2.2. Levels of lower-limb amputation ....................................................... 17
2.2.3 Components of transtibial prosthesis .................................................. 18
2.3 Control of postural stability in human ............................................................... 26
2.3.1 General background ............................................................................ 26
2.3.2 Definition and related terms ............................................................... 27
2.3.3 Functions of postural stability ............................................................. 28

x
2.3.4 Components and organization of postural stability ............................. 33
2.3.5 Postural stability during unperturbed upright standing ...................... 40
2.3.6 Postural stability during perturbed upright standing ........................... 45
2.3.7 Postural stability control during upright standing in lower-limb
amputees ............................................................................................. 45
2.4 Quantitative instrumented assessment of postural stability balance .................. 49
2.4.1 Overview ............................................................................................. 49
2.4.2 Methodology for systematic review ................................................... 50
2.4.3 Results obtained from systematic search ............................................ 54
2.4.4 Discussion .......................................................................................... 70
2.4.5 Limitations of the study ...................................................................... 76
2.4.6 Conclusion .......................................................................................... 76
2.5 Self-report and functional outcome assessment of balance………………….78
2.5.1 Medicare Functional Classification Level (MFCL) (K-Level)........... 79
2.5.2 Health status questionnaire (SF-12v2)……..………..……………..79
2.5.3 Houghton Scale ................................................................................... 80
2.5.4 Berg Balance Score (BBS) ................................................................. 81
2.5.5 Activities-specific Balance Confidence (ABC) .................................. 82
2.6 Overall conclusion ............................................................................................. 83
2.7 Novel contributions of the current thesis .......................................................... 84
3. GENERAL MATERIALS AND METHOD………………………………………...86
3.1 Flowchart of the overall study. ....................................................................... 87
3.2 Systematic literature review ........................................................................... 88
3.3 Ethical review ................................................................................................. 88
3.4 Inclusion and exclusion criteria ...................................................................... 88
3.5 Participants included in this study .................................................................. 89
3.6 Determination of prosthetic foot stiffness from the standard mechanical
testing ............................................................................................................. 93
3.6.1 Introduction ....................................................................................... 93

xi
3.6.2 Methodology ....................................................................................... 97
3.6.3 Results ............................................................................................. 105
3.6.4 Discussion ........................................................................................ 112
3.6.5 Conclusion ........................................................................................ 114
3.7 Balance assessment using Biodex Stability System (BSS) ............................ 115
3.7.1 Overview ........................................................................................... 115
3.7.2 Stability index parameters ................................................................ 118
3.7.3 Patient data management .................................................................. 120
3.8 Self-report and functional outcome assessment of the participants. ............... 121
3.8.1 Introduction ....................................................................................... 121
3.8.2 Methodology ..................................................................................... 123
3.8.3 Results ............................................................................................... 126
3.8.4 Discussion ......................................................................................... 131
3.8.5 Conclusion ........................................................................................ 134
3.9 Experimental protocol ..................................................................................... 135
3.10 Sensory conditions .......................................................................................... 139
3.11 Statistical analyses ........................................................................................... 141
4. INTRARATER TEST-RETEST RELIABILITY OF STATIC AND DYNAMIC
STABILITY INDEXES MEASUREMENT USING THE BIODEX® STABILITY
SYSTEM DURING UNILATERAL STANCE ....................................................... 142
4.1 Introduction .................................................................................................... 143
4.2 Methodology .................................................................................................. 145
4.2.1 Participants ....................................................................................... 145
4.2.2 Instrumentation ................................................................................. 145
4.2.3 Protocols ........................................................................................... 146
4.2.4 Statistical Analysis ............................................................................ 147
4.3 Results ............................................................................................................. 148
4.4 Discussion ....................................................................................................... 149
4.5 Conclusion ....................................................................................................... 152

xii
5. THE EFFECTS OF PROSTHETIC FOOT TYPE AND VISUAL ALTERATION ON
POSTURAL STEADINESS IN BELOW-KNEE AMPUTEES. ............................. 153
5.1 Background ..................................................................................................... 154
5.2 Methodology ................................................................................................... 156
5.2.1 Participants ......................................................................................... 156
5.2.2 Equipment and protocol .................................................................... 156
5.2.3 Statistical analysis ............................................................................. 157
5.3 Results ............................................................................................................ 158
5.3.1 Participants’ characteristics .............................................................. 158
5.3.2 Comparison between prosthetic foot types ....................................... 158
5.3.3 Comparison between eyes-opened and eyes-closed ......................... 159
5.3.4 Perceived-balance assessment .......................................................... 159
5.4 Discussion ...................................................................................................... 161
5.5 Conclusion ...................................................................................................... 165
6. POSTURAL STABILITY CHARACTERISTICS OF TRANSTIBIAL AMPUTEES
WEARING DIFFERENT PROSTHETIC FOOT TYPES WHEN STANDING ON
VARIOUS SUPPORT SURFACES. ....................................................................... 166
6.1 Introduction ...................................................................................................... 167
6.2 Methodology .................................................................................................... 169
6.2.1 Participants ....................................................................................... 169
6.2.2 Instrumentation and procedures ........................................................ 170
6.2.3 Statistical analysis ............................................................................. 173
6.3 Results ............................................................................................................. 174
6.3.1 Participants’ summary ...................................................................... 174
6.3.2 Postural stability between prosthetic feet ......................................... 174
6.3.3 Postural stability between prosthetic and able-bodied group ........... 175
6.4 Discussion ....................................................................................................... 176
6.5 Conclusions ..................................................................................................... 179

xiii
7. THE EFFECTS OF DIFFERENT PROSTHETIC FEET AND HEAD EXTENSION
ON THE POSTURAL STABILITY IN PERSONS WITH BELOW-KNEE
AMPUTATION DURING QUIET STANDING. .................................................... 181
7.1 Introduction .................................................................................................... 182
7.2 Methodology .................................................................................................. 185
7.2.1 Participants’ characteristics .............................................................. 185
7.2.2 Experimental protocol ...................................................................... 186
7.2.3 Statistical Analysis ............................................................................ 188
7.3 Results ............................................................................................................. 189
7.3.1 Influence of prosthetic foot types and sensory conditions ................ 189
7.3.2 Comparison between control and prosthetic groups ......................... 191
7.4 Discussion ...................................................................................................... 192
7.5 Conclusions .................................................................................................... 196
8. EVALUATION OF POSTURAL STEADINESS IN BELOW-KNEE AMPUTEES
WHEN WEARING DIFFERENT PROSTHETIC FEET DURING VARIOUS
SENSORY CONDITIONS USING THE BIODEX® STABILITY SYSTEM (BSS).
.................................................................................................................................. 197
8.1 Introduction .................................................................................................. 198
8.2 Methodology ................................................................................................. 199
8.2.1 Subjects ........................................................................................... 199
8.2.2 Procedures and equipment .............................................................. 200
8.2.3 Statistical Analysis .......................................................................... 203
8.3 Results ........................................................................................................... 204
8.3.1 Participants’ characteristics ............................................................ 204
8.3.2 Stability indexes during sensory modifications .............................. 204
8.3.3 Percentage of time in concentric zones for each sensory condition 205
8.3.4 Loading time percentage in left and right quadrants for each sensory
condition ........................................................................................... 208
8.4 Discussion ..................................................................................................... 209
8.5 Conclusion .................................................................................................... 212

xiv
9. POSTURAL STABILITY STRATEGIES IN TRANSTIBIAL AMPUTEES
DURING QUIET STANDING IN ALTERED SENSORY CONDITIONS
WEARING THREE TYPES OF PROSTHETIC FEET. ....................................... 213
9.1 Introduction ................................................................................................... 214
9.2 Methodology ................................................................................................. 216
9.2.1 Participants ...................................................................................... 216
9.2.2 Prosthetic feet .................................................................................. 217
9.2.3 Procedures ....................................................................................... 217
9.2.4 Statistical Analysis .......................................................................... 219
9.3 Results ............................................................................................................. 220
9.3.1 Subjects’ characteristics ................................................................... 220
9.3.2 Movement strategies in predicting the overall postural stability. .... 221
9.4 Discussion ...................................................................................................... 225
9.5 Conclusion ...................................................................................................... 228
10. CONCLUSIONS AND FUTURE RECOMMENDATIONS ................................. 229
10.1 Conclusions...……………………………………………………………….229
10.2 Recommendations for future research………………………………............235
References ..................................................................................................................... 238
Appendix A: List of ISI Publications ............................................................................ 260
Appendix B: References obtained for systematic review. ............................................ 262
Appendix C: Ethical approval ....................................................................................... 266
Appendix D: Participants information sheets ............................................................... 267
Appendix E: Informed consent ..................................................................................... 268
Appendix F: Questionnaires .......................................................................................... 269
xv
LIST OF FIGURES
Figure 1.1: Percentage of amputation at all levels (Reproduced from WHO,
2004)……………………………………………………………………..2
Figure 1.2: Trends and projection of national prevalence of diabetes among
Malaysian age ≥18 years. (Retrived January 6, 2015, from www2.
moh.gov.
my/attachments/7168)…..................................................….…………….5
Figure 2.1: Publication trend for research related to lower limb amputation
prosthesis from 1983 to
2014……………………………………………………....14
Figure 2.2: Published articles per year for research related to balance in lower limb
amputees from 1994-2014…………………………........……………...15
Figure 2.3: Ancient toes prosthesis found in Luxor, Egypt; (A) the Greville
Cartonnage toe and (B) leather and wood toe. Reproduced from Finch et
al. (2012)…..............................................................................…...……16
.
Figure 2.4: Peg leg prostheses during (A) Gallo-Roman era and (B) Renaissance era.
Reproduced from Seymour (2002)…................................………….….17
Figure 2.5: Level of amputations according to ISO nomenclatures. Reproduced from
Seymour (2002)…………….............……………………………….….18
Figure 2.6: Components of a modular transtibial prosthesis with silicone soft liner
and pin suspension
system….……………………………………………....19
Figure 2.7: Four types of prosthetic feet: (A) solid ankle cushion heel (SACH), (B)
single-axis, (C) multi-axis, and (D) energy saving and return (ESAR).
Reproduced from Seymour (2002) and Fergason (2007)
.................……………………………………………………………....21
Figure 2.8: Two common prosthetic sockets for transtibial prosthesis; (A) PTB and
(B) TSB socket. Note the significant indention on the patellar tendon
area in PTB socket design. Figure A was reproduced from Kapp and
Cummings
(1992)………..................................................................……………….23
Figure 2.9: Four general categories which are: (A) atmospheric pressure, (B)
anatomic, (C) straps and (D) hinges. Reproduced from Michael (2004),
Carroll and Binder (2006) and Seymour
(2002).………………...……………………………………..……….....25
Figure 2.10: Organization of postural stability control according to systems model
approach (Adopted from Peterka 2002; Shumway-Cook and Woollacott,
2007)………............................................................................................32

xvi
Figure 2.11: Vital components contributing to postural stability (Reproduced from
Horak, 2006)…………………...…………………………………...…..34
Figure 2.12: Three common movement strategies to maintain postural stability during
upright standing; A. ankle strategy, B. hip strategy and C. stepping
strategy (Adapted from Seeger, 2003)……..…..;………………………35
Figure 2.13: Somatosensory system which consist of muscle proprioception, joint and
cutaneous afferents (Retrieved from http://classes.midlandstech.edu/
carterp/Courses /bio110/chap09/chap09.htm)…………….....…………37
.
Figure 2.14: Peripheral vestibular system which is responsible for maintaining
postural stability (Retrieved from http://classes.midlandstech.edu/
carterp/Courses/bio110/chap09/chap09.htm). ………...………….……38
Figure 2.15: The CoM is located within the limits of stability conical-shaped area
during upright standing (Reproduced from Wallace,
2007)…………………...……………………………………………….41
Figure 2.16: Relative position of CoM and CoP during a point during swaying while
standing quietly on a firm surface. Abbreviations; W: body weight, GRF:
ground reaction force, g: CoM position, p: CoP position, α: angular
acceleration and ω: angular velocity…………….....…………………..42
Figure 2.17: Main muscle groups that control the CoM during standing (Reproduced
from Wallace, 2007)……………………………………………...…….44
Figure 2.18: Flow chart of article selection process according to PRISMA
guidelines…………………………………………………...……….….55
Figure 3.1: The flowchart of the overall methodology of this
study.……………………………………………………………...…….87
Figure 3.2: Flow diagram of amputee subject recruitment. ………...…………...…90
Figure 3.3: Bench and dynamic alignment during each testing session……………91
Figure 3.4: Static tests on the Lambda foot using VAPC 1973 procedure at (a)
forefoot, and (b) heel region. (Reproduced from Toh et al.,
1993).………………………………………………………...…………95
Figure 3.5: Components of Solid Ankle Cushioned Heel (SACH) foot………....…98
Figure 3.6: Components of Single Axis (SA) foot……………………………….…99
Figure 3.7: Components of Energy Storage and Return foot (ESAR)
Talux………………………………………………………………...….99
Figure 3.8: Instron 4469 universal tensile machine.……………………...…….....101
Figure 3.9: L-shape heel block with the height of 10 mm.…………......…………101

xvii
Figure 3.10: Alignment using laser pointer and heel block from posterior and anterior
aspect of the foot.……………………………………………………...102
Figure 3.11: The attachment configuration of the cylindrical adaptor, pylon and
coupling adapter via a dowel pin.…………………….…….…………103
Figure 3.12: The foot platforms; (a) 150 heel block and (b) 200 forefoot
block......................................................................................................103
Figure 3.13: Experimental setup. A sample of prosthetic foot is shown aligned on an
Instron 4469 universal tensile machine. Vertical compression loading
transferred a bending load to the foot.………………………..………104
Figure 3.14: Initial and final conditions during loading at the heel and forefoot regions
of SACH foot.…………………………………………...……….……106
Figure 3.15: Initial and final conditions during loading at the heel and forefoot regions
of SA foot.…………………...……………………………..…………107
Figure 3.16: Initial and final conditions during loading at the heel and forefoot regions
of ESAR foot.………………………………………………...….……108
Figure 3.17: Determination of stiffness from the slope of load- displacement curve for
a sample of SACH foot during loading at the heel
region.…………...………………………………………………….…109
Figure 3.18: Plot of load-displacement curve to determine the stiffness at the heel
region for five samples of prosthetic feet.…………………….………110
Figure 3.19: Plot of load-displacement curve to determine the stiffness at the forefoot
region for five samples of prosthetic feet.………………………….…110
Figure 3.20: Linear stiffness of each prosthetic foot at the heel and forefoot region
obtained from static structural test in descending
order.…………………………………………………………..………112
Figure 3.21: The Biodex Stability System (BSS) ………………………….....……116
Figure 3.22: The stability platform with adjustable stability level.………...………118
Figure 3.23: An example of a subject’s trajectory of CoM displacement within zones
and quadrants from the platform’s centre during eyes-closed
condition................................................................................................120
Figure 3.24: Mean ABC score for each ABS items according to prosthetic foot type.
The asterisk sign (*) indicates significant different between prosthetic
feet.........................................................................................................129
Figure 3.25: The overall protocol for amputee participants in this
study………...…………………………………………………………136
Figure 3.26: Position of participant on the BSS device.……………………………138

xviii
Figure 3.27: Participant taking a rest between trials, with unchanged feet
position………………………………………………………………..139
Figure 3.28: Different types of sensory alterations conducted in this study for all
participants.……………………………………………………………140
Figure 5.1: Overall (OSI), anterior-posterior (APSI) and medial-lateral (MLSI)
stability indexes score in mean (± standard error) between prosthetic foot
types during eyes-opened and eyes-closed conditions. The asterisk sign
indicates statistically significant differences (p<0.05) between APSI and
MLSI within the same visual condition.
………………………………………………………..…………….…160
Figure 5.2: Differences of overall (OSI), anterior-posterior (APSI) and medial-lateral
(MLSI) stability index score between eyes-closed and eyes-opened
conditions in mean (± standard error) according to prosthetic foot type.
The asterisk sign indicates statistically significant differences
(p<0.05).................................................................................................160
Figure 6.1: Surface conditions used in this study: (a) rigid, (b) compliant and (c)
unstable..................................................................................................172
Figure 6.2: Low-density polyethylene foam with a circular radius of 22 cm and a
thickness of 2.5 cm to simulate compliant
surface....................................................................................................172
Figure 7.1: The position of the head in (A) neutral and (B) extended
positions.................................................................................................187
Figure 7.2: The change of OSI, APSI and MLSI expressed as percentage increase or
decrease between each prosthetic foot and normal groups. Note that the
asterisk sign (*) indicate significant difference between prosthetic foot
and control. Deficit in balance leads to greater increase in stability index
score. Positive value indicates the stability score of amputees are greater
than that of control subjects. Standard errors are represented in the figure
by the error bars attached to each
column……………………..………….192
Figure 8.1: Positions of the concentric zones (A, B, C, D) in relatives to right and
left
quadrants................................................................................................202
Figure 8.2: Stability indexes (OSI, APSI, MLSI) in SACH, SA and ESAR prosthetic
feet during four sensory conditions. Significant differences between two
sensory conditions were indicated as *(EO vs EC), ¥(EO vs HExt), #(EC
vs Foam) and §(Foam vs HExt).............................................................206
Figure 9.1: The scatter plot of the distribution of Overall Stability Index (OSI),
Anterior-Posterior Stability Index (APSI) and Media-Lateral Stability
Index (MLSI) for (a) SACH foot, (b) SA foot and (c) ESAR
foot.........................................................................................................220

xix
LIST OF TABLES
Table 2.1: Definition of ‘postural stability’ from selected published
literatures…..............................................................................…….…..28
Table 2.2: Sensory information available during sensory organization tests.
Abbreviations; vis: visual, vest: vestibular, prop: proprioceptive, sway-
ref’d: sway referenced (Reproduced from Black,
2001)…......................................................................................………..40
Table 2.3: Criteria used for quality assessment of the reviewed
articles……………………………………..……………………...….…53
Table 2.4: Summary of study characteristics……………………………………....58
Table 2.5: Summary of study protocols………………………………..………......65
Table 2.6: Assessment of methodological quality scores of reviewed
papers………...........................................................................................69
Table 2.7: Definitions for MFCL…………………………………………………..80
Table 3.1: Inclusion and exclusion criteria for amputee and control
group……………………………………………………………..……..89
Table 3.2: Amputee and able-bodied participant characteristics..............................92
Table 3.3: Stiffness categories according to the mechanical testing on ESAR
prosthetic feet at the forefoot region, with vertical compression load of
800N. Note that the stiffness value in this study is the load-deformation
curve slope (Geil, 2001)..........................................................................94
Table 3.4: Linear stiffness (kN/mm) at the heel and forefoot regions for SACH, SA
and ESAR foot and its manufacturer……………………………...........97
Table 3.5: The characteristics of tested prosthetic feet.............................................98
Table 3.6: Selected Instron 4469 load frame specifications...................................100
Table 3.7: Maximum deflection and stiffness values at the heel and forefoot region
for all samples of prosthetic feet............................................................111
Table 3.8: Averaged deformation and stiffness for each type of foot, where R2 is
coefficient of determination, K is stiffness and p-value <0.05 indicates
the significant of the
model.........................................................................111
Table 3.9. Outcome measurement tools related to lower limb prosthetics used in
this study. The type of outcome measures is based from the guidelines
proposed by Miller & McCay (2006)....................................................122
Table 3.10: Aggregated scale items and range of possible scores............................124

xx
Table 3.11: Mean (SD) of Physical Component Summary (P11CS) and Mental
Component Summary (MCS) score for healthy and amputee
group………………..………………………………………………....126
Table 3.12: Individual and overall Houghton scores for all amputees (A1-
10)……………………………………………………………….....….127
Table 3.13: Individual and overall mean BBS score presented for the amputees and
able-bodied controls…………………...…………………………...…128
Table 3.14: Mean ABC scores of perceived balance confidence with the three
prosthetic feet........................................................................................130
Table 4.1: Summary of the stability index score, SEM, ICC, and 95% CI during
unilateral stance in static and dynamic postural stability assessment with
seven days separation period.................................................................150
Table 5.1: The mean and (standard deviation) of stability indexes score and ABC
score three types of prosthetic foot during eyes-opened and eyes-closed
conditions...............................................................................................159
Table 6.1: The average and standard deviation of each prosthetic foot and control
group during standing on different support surface
configurations........................................................................................176
Table 7.1: The average and standard deviation of stability indexes for each
prosthetic foot during standing in various
conditions..............................................................................................190
Table 7.2: Analyses of Variance for stability indexes............................................190
Table 8.1: Mean (SD) of percentage of time in concentric zones for SACH, SA and
ESAR foot during different sensory conditions
...............................................................................................................207
Table 8.2: Percentage of loading time over the test period on the amputated and
intact leg with SACH, SA and ESAR foot during different sensory
conditions
………...................................................................................................208
Table 9.1: Correlations (Pearson’s r) between the variables in the analysis
(N=10)………………………………………………………………...222
Table 9.2: The summary of standard multiple regression analysis for APSI and
MLSI in predicting the OSI during sensory alterations for all prosthetic
feet
(N=10)………………………………………………………………...224
Table 9.3: The mean (standard deviation) of stability indexes score for three types
of prosthetic foot during four sensory
conditions……………………………………………………………...225

xxi
LIST OF ABBREVIATIONS
ABC Activities-specific Balance Confidence
ADL Activities of daily living
AOPA American Orthotic & Prosthetic Association
AP Anterior-posterior
APSI Anterior/ posterior stability index
BBS Berg Balance Scale
BI Balance Index
BoS Base of Support
BSS Biodex® Stability System
CAD-CAM Computer Aided Design –Computer Aided Manufacturing
CNS Central Nervous System
CoM Centre of Mass
CoP Centre of Pressure
CTSIB Clinical Test of Sensory Interaction and Balance
CI Confidence Interval
ES Equilibrium Score
ESAR Energy Storage and Return
FDA Food and Drug Administration
HCFA Health Care Financing Administration
ICC Interclass correlation of coefficient
IDF International Diabetes Federation
ISO International Standards Organization
ISPO International Society of Prosthetics and Orthotics
MEC Medical Ethics Committee
MCS Mental Component Summary

xxii
ML Medial-lateral
MFCL Medicare Functional Classification Level
MLSI Medial/ lateral Stability Index
NASD National Amputee Statistical Database
NHMS National Health and Morbidity Survey
OSI Overall Stability Index
PCS Physical Component Summary
PDC Patient Data Collection Software Utility
PEQ Prosthesis Evaluation Questionnaire
PPA Prosthetic Profile of the Amputee
PRISMA Preferred Reporting Items for Systematic Reviews and Meta-Analyses
PTB Patellar Tendon Bearing
SA Single Axis
SACH Solid Ankle and Cushioned Heel
SEBT Star Excursion Balance Test
SEM Standard Error Measurement
SOT Sensory Organization Testing
TSB Total Surface Bearing
PTB-SC PTB supracondylar
PTB-SCSP PTB supracondylar-suprapatella
UK United Kingdom
UMMC University Malaya Medical Centre
USA United States of America
VAPC Veteran Administration Prosthetic Centre
WHO World Health Organisation

xxiii
LIST OF EQUATIONS
OSI =
2 2 (0-Y) + (0-X)
number of samples
APSI =
2 (0-Y)
number of samples
MLSI =
2 (0-X)
number of samples
(3.4)
(3.1)
(3.2)
(3.3)

1
CHAPTER 1
INTRODUCTION
1.1 Background
Generally, limb loss resulted from acquired amputation is often due to disease,
injury or surgery whereas congenital limb loss is present at birth (Nielsen, 2007; Smith,
2004). According to Tseng and associates (2007), lower limb loss can be further
classified as ‘major’ such as amputation above- or below- the knee, or the foot while
‘minor’ involves amputation of the toes. In the United States of America (USA) alone,
664,000 persons were estimated living with major limb loss and more than 900,000 with
minor limb loss in 2005 (Ziegler-Graham, MacKenzie, Ephraim, Travison &
Brookmeyer, 2008). Amputation has been known not only to affect a person physically
and psychologically, but also renders a major challenge for the nation (Gitter & Bosker,
2005; Nielsen, 2007). Hence, amputations cause significant implication in increasing
the costs of healthcare systems globally, with annual costs of lower extremity
amputations in the USA reaching USD4.3 billion (Dillingham, Pezzin & Shore, 2005).
Lower limb amputations are often resulted from vascular-related diseases (such
as neuropathy and peripheral vascular disease), trauma, cancer and congenital anomalies
(Nielsen, 2007). Specifically, vascular-related diseases (with or without diabetes)
account for 80-90% of all amputations in Western countries (Dilingham, Pezzin &
MacKenzie, 2002). Particularly, a person with diabetes has 10–30 times greater risk of
undergoing lower limb amputation compared with the general population (Vamos et al.,
2010). Moreover, it is estimated that around 20–50% of diabetes amputees will require
second leg amputation within one to three years, and more than 50% of the amputees
will need another amputation within five years (Van Gils et al., 1999). On the other

2
hand, in some countries with history of recent war, such as Cambodia and Zimbabwe,
amputation due to trauma can account for more than 80% of all amputations (World
Health Organisation [WHO], 2004).
Generally, below-knee (transtibial) and above-knee (transfemoral) amputations
are the most common amputation levels followed by the ankle, hip and knee
disarticulations (47%, 31%, 3%, 2%, 1%, respectively) (WHO, 2004). In fact, lower
limb amputations are performed eleventh times more frequent than upper limb
amputations, making lower-limb amputees constitute 80–85% of the total amputees
(Shurr & Michael, 2000; Yazicioglu, Taskaynatan, Guzelkucuk & Tugcu, 2007). Due to
improved awareness and success in retaining the knee joint, the ratio of above-knee
amputations to below-knee amputations showed significant changes in ratio from 70:30
in 1965 to 30:70 in 1975. The level of amputation and its percentage is illustrated in
Figure 1.1.
Figure 1.1: Percentage of amputation at all levels (Reproduced from WHO, 2004).
3
1.2 Worldwide prevalence of lower- limb amputation
The incidence of lower limb amputation is high across the globe and continues
to be a major threat to morbidity and mortality (Moxey et al., 2011). Nevertheless, the
current information on worldwide prevalence of amputation is difficult to obtain,
possibly because of minimal attention and resources as well as the lack of standardised
approach in gathering data (Aleccia, 2010; Nielsen, 2007). In the United Kingdom
(UK), there are an estimated 5,000 new referrals to prosthetic service centres annually
(National Amputee Statistical Database [NASD], 2005). Specifically, vascular-related
diseases has accounted for 77% of lower limb amputation while diabetes currently
accounts for 42% of the total referral in the UK (NASD, 2005). In comparison with the
USA, an estimation of 1.6 million persons were living with limb loss in 2005 of which
54% had amputation secondary to dysvascular disease with over two thirds being
diabetic (Ziegler-Graham et al., 2008). The most striking fact is that amputations due to
dysvascular conditions are estimated at 2.3 million in 2050 (Ziegler-Graham et al.,
2008).
In terms of annual prevalence of diabetes-related amputation per 100 000
person, the Netherlands recorded 18-20 incidences (Rommers, Vos, Groothoff,
Schuiling & Eisma, 1997), 176 incidences in Ireland (Buckley et al., 2002), 251
incidences in England (Holman, Young & Jeffcoate, 2012) and the USA with 500
incidences (National Center for Health Statistics, 2012). In low income countries, for
example Tanzania, 40% of lower limb amputation incidence was due to tumours (Loro
& Franceschi, 1999). For countries with on-going conflict and landmine issues, 159
incidences were estimated in Afghanistan, 102 incidences in Iraq and 300 incidences in
Angola (Aleccia, 2010).

4
1.3 Amputation prevalence in Malaysia
According to WHO (2005), 0.5% of a population in a developing country
represent individuals with disability whom will require prosthesis and/ or orthosis and
related rehabilitation services. When populations of all developing countries are
combined, an estimated 25 million inhabitants are in need of prosthetic and/ or orthotic
device (WHO, 2005). In relation to this prediction, among the 31 million current
population in Malaysia (Malaysia Statistics Department, 2015), around 155000
individuals will be in need of prosthetic and/ or orthotic devices. Furthermore, the
population is projected to reach 38.5 million people by the year of 2040 (Malaysia
Statistics Department, 2015), recording a staggering number of 192500 individuals with
physical disability.
The first National Health and Morbidity Survey (NHMS I) in 1986 reported the
prevalence of diabetes mellitus among Malaysian was at 6.3% and during the NHMS II
assessment in 1996, the prevalence percentage was increased to 8.2% (Mafauzy, 2006).
Surprisingly in 2006, the prevalence increased to 11.6% as revealed in NHMS III report
(Letchuman et al., 2010) which exceeded the estimation of 11-14% prevalence by 2025
in Malaysia (International Diabetes Federation [IDF], 2003). The increasing trend of
diabetes prevalence in this country seems to continue, as the recent study revealed
22.6% prevalence, almost twofold increase from previously reported in 2006 (Wan
Nazaimoon et al., 2013). Despite the proactive efforts initiated from the Ministry of
Health, such as the establishment of Diabetes Resource Centres in hospitals and the
national steering committee for improving the screening and management of diabetes in
clinics, the national prevalence of diabetes is expected to rise around 22% in year 2020
(Figure 1.2) (Letchuman et al., 2010; Mafauzy, 2006).

5
Figure 1.2: Trends and projection of national prevalence of diabetes among Malaysian
age ≥18 years. (Retrived January 6, 2015, from www2.moh.
gov.my/attachments/7168)
This alarming increasing trend may be associated with the increase in prevalence
of obesity and overweight in Malaysia (Wan Mohamud et al., 2011). Moreover,
evidence from previous research indicates that obesity and overweight were
significantly related with diabetes (IDF, 2003; Lazar, 2005; Mokdad et al., 2001;
Resnick, Valsania, Halter & Lin, 2000). Consequently, scientific study has shown that
diabetes mellitus is a key risk factor leading to lower limb amputation (Resnick,
Valsania & Phillips, 1999), such that in 2005, a lower limb loss was estimated for every
30 seconds due to diabetes in some part of the world (IDF, 2005). Hence, diabetes
epidemic remains a serious threat and burden to Malaysia that can potentially increase
the number of physically-disabled persons in the country.
1.4 Effects of amputation on the control of postural stability
Following amputations, one of the rehabilitation goals is to restore the
amputee’s activities of daily living by reducing the dependency on others and increasing

6
mobility function. One of the essential and basic skills during early rehabilitation
training is to control balance during upright standing (Geurts & Mulder, 1992). In fact,
standing has been reported to be the most frequent indoor acticity performed by the
unilateral below-knee amputees in comparison to sitting, lying, transitions and other
movement-related activities (Bussmann et al., 1998). Maintaining balance, also known
as postural stability, involves the integration of six important components which are
biomechanical constraints, movement strategies (hip and ankle), sensory (visual,
somatosensory, vestibular) strategies, orientation in space, control of dynamics and
cognitive processing (Horak, 2006). However, this simple task is very challenging due
to the loss of muscular and skeletal structures as well as major impairments in both
afferent and efferent inputs which are responsible in controlling postural stability
(Vanicek, Strike, McNaughton & Polman, 2009; Guskiewicz & Perrin, 1996).
Often during upright standing, persons with lower limb amputation are
characterised with poor postural stability (Buckley et al., 2002; Vrieling et al., 2008a),
rely heavily on the intact limb and primarily dependent on visual information (Buckley
et al., 2002, Vanicek et al., 2009) during static and dynamic postural stability control.
Therefore, amputees exhibit high prevalence for falls and fear of falling when compared
to age-matched able-bodied individuals (Miller, Deathe & Speechley, 2003), with the
risk of falling being the same as that for the elderly (Sattan, 1992). In addition to the
deteriorating postural stability control due to the proprioception loss in individuals with
lower limb amputation, several other intrinsic factors were thought to influence the
control of stability during upright standing. Findings from previous studies suggested
that the reason of amputation (Hermodsson, Ekdahl, Persson & Roxendal, 1994), length
of residual limb (Lenka & Tiberwala, 2007) and level of amputation (Rougier &
Bergeau, 2009) are associated with poor stance balance. Although other extrinsic factors

7
such as the type of suspension and socket may alter the control of postural stability, they
are yet to be confirmed (Kamali, Karimi, Eshraghi & Omar, 2013).
Recent advancements in technology have engendered tremendous
transformations in the design and materials used to manufacture prosthetic feet.
Although the prosthesis allows amputees to perform many activities of daily living,
amputation remains as physical and psychological challenges for an amputated person.
One of the most important elements of a prosthetic device that should be taken into
consideration when selecting appropriate ankle-foot prosthesis is the stiffness of the
joint. The stiffness of the prosthetic ankle-foot joint is intended to substitute for the loss
of muscles and other soft tissues that surround the ankle-foot complex. Interestingly,
recent studies suggested that extrinsic factor from the mechanical properties of the
prosthetic foot, such as the stiffness, may influence the stability control in anterior-
posterior direction among below-knee amputees (Nederhand, Van Asseldonk, Der Kooij
& Rietman, 2012; Buckley, O’Driscoll & Bennett, 2002).
However, it is not clear how the stiffness influences the control of postural
stability during upright standing in individuals with below-knee amputation when the
sensory inputs are altered or challenged. As a result, decision making pertaining to the
prosthetic prescription ascribed to patients mainly involves empirical knowledge that is
based on a prosthetist’s subjective experience of prosthetic devices (van der Linden et
al., 2004; Stark, 2005; Hofstad, van der Linden, van Limbeek and Postema 2009).

8
1.5 Problem statement
Previous studies have examined the compensatory strategies in postural stability
control during upright standing in persons with below-knee amputation (Barnett,
Vanicek and Polma, 2012; Buckley et al., 2002; Kaufman et al., 2007; Jayakaran,
Johnson and Sullivan, 2015; Matjacic and Burger, 2003; Nederhand et al., 2012).
However, the amputees from those studies were equipped with a variety of different
prosthetic feet. While the overall findings described in previous studies adequately
explained the control mechanism of postural stability in amputated individuals, the
variation in prosthetic feet may have had an influence on an individual’s response to the
balance task. As a matter of fact, researchers had speculated that stiffness of the ankle
muscle might play an important role in maintaining balance and joint stability
(Blackburn et al., 2000; Vrieling, 2008a).
For amputees, it was reported that a significant relationship between dynamic
balance control and prosthetic foot stiffness may justify the potential of stiffer prosthetic
foot in enhancing the safety of postural stability in this population (Nederhand et al.,
2012). Regardless, the influence of prosthetic foot stiffness has received less attention
among the researches than many other elements of a prosthetic device, such as the
socket type and suspension. Therefore, variations between prosthetic feet must be
considered during objective assessment of postural stability control in individuals with
lower-limb amputation and their performance should be quantified from postural
stability measurement results.
Often, most research studied the influence of variations in prosthetic feet from
dynamic task such as during level, ramp or stairs ambulation (Agrawal et al., 2013a;
Agrawal et al., 2014; MacFarlane, Nielsen, Shurr and Meier, 1991). Although these

9
assessments provides informative insight into the control of postural stability at a higher
level, other foundational task such as standing upright should be given the same
attention. The act of standing has been known as an unstable posture that requires
constant muscle contraction particularly in the lower extremity that causes body sway in
all directions (Isakov et al., 1992). More importantly, controlling stability while
standing upright involves a more complex system that requires learning processes
before it is mastered in a person who has undergone amputation (Loram, Maganaris and
Lakie, 2005). Thence, a person with lower-limb amputation must first acquires the
ability to achieve a stable quiet standing to improve gait ability, increase gait
asymmetry as well as the prevention of falls (Hendrickson, Patterson, Inness, McIlroy &
Mansfield, 2014; Yanohara et al., 2014).
Although balance confidence and stability have shown to be associated with
walking performance and social activity (Miller et al., 2001a), studies on postural
balance with different foot category are scarce compared with research on other
biomechanical areas (Hafner, 2006). In relation to this, distinguished researchers have
suggested that the assessment of postural stability should evaluate how changes in
support surface and sensory conditions will influence the coordination of the lower
limbs to maintain postural stability (Horak, 1997; Kaufman, 2004). This is vital due to
the complex interactions between the musculoskeletal and sensory information in
reorganizing postural stability for a person with lower limb amputation (Geurts and
Mulder, 1992).
While postural sway of lower-limb amputees have been shown to increase when
visual and support surface were altered (Hermodsson et al., 1994; Nadollek et al., 2002;
Vanicek et al., 2009), these studies’ aim was focused toward comparing the effect of
sensory modifications on postural control but did not explore the possible interaction

10
between prosthetic foot types and sensory conditions to facilitate the maintenance of
static postural stability. As proposed by Hafner (2005), the standardisation of prosthetic
foot characteristics or mechanical behaviour should be considered as a better research
method to provide scientific evidence for prescription of prosthetic foot. However,
studies on how or to what extent prosthetic feet types may influence the control of
postural stability during altered sensory has not been examined to date. Thus,
manipulating prosthetic foot types and sensory conditions could give a valuable insight
into whether or not prosthetic foot variations will influence the performance of
amputees during upright standing with alteration in sensory information.
1.6 Aim and objectives
The overall aim of this thesis was to investigate the influence of prosthetic foot
types and altered sensory conditions on the postural stability of below-knee amputees
during upright standing. To achieve this aim, six objectives have been identified as
follows:
i. to determine the intrarater test-retest reliability measures of postural stability
indexes over a specific time interval during static and dynamic unilateral stance
using the computed posturography
ii. to determine the influence of different prosthetic foot types to the control of
postural stability during quiet standing when visual inputs were altered
iii. to determine the effect of different prosthetic foot types on the control of
postural stability under various support surface conditions between persons with
below-knee amputation and able-bodied individuals
iv. to examine the effects of different prosthetic feet and head extension on the
postural stability and whether balance between persons with below-knee

11
amputation and able-bodied individuals could be distinguished by using
computed posturography
v. to demonstrate the use of stability indexes, time percentage on concentric zones
and quadrants for postural stability assessment under various sensory
manipulations
vi. to quantify the movement strategies in anterior-posterior and medial-lateral
directions in predicting the overall postural stability wearing three types of
prosthetic feet when sensory inputs were altered
1.7 Outline of Thesis
Including the first introductory chapter, this thesis consists of ten chapters.
Several chapters are written in the format of peer-reviewed published papers, and may
therefore contain certain redundancies, particularly in the Introduction and Methodology
sections. The thesis begins with Chapter 1 which presents the general background,
amputation prevalence, adverse effects of amputation on the postural stability, identified
problem statement and purpose of this thesis.
Chapter 2 provides a comprehensive review of the pertinent literatures related to
the biomechanics of maintaining postural stability. This includes: the overview research
trend in lower limb amputation, general history, amputation levels, components of
below-knee prosthesis, postural stability during quiet standing in healthy and amputated
individuals, as well as the summary of instrumented measures and outcome measures
related to postural stability assessment.
A general methodology section is presented in Chapter 3. It describes the
participants’ inclusion exclusion and criteria, ethical approval, as well as experimental
procedures which justify and describe the biomechanical and functional analysis tools
used within the thesis. This chapter further details the mechanical testing procedure in

12
determining the linear stiffness of each prosthetic foot and describes the perceptive
analyses which determine the prosthesis use, functional balance status and balance
confidence among individuals with below knee amputation and able-bodied
participants.
Chapter 4 examines the intrarater test-retest reliability measures of postural
stability indexes over a specific time interval during static and dynamic unilateral stance
using the chosen computerised posturography device.
Chapter 5 to 7 focus on the assessment of postural stability control with three
different prosthetic foot types during altered visual, proprioceptive and vestibular
sensory information, respectively.
Chapter 8 contains a detailed description regarding the use of stability indexes,
time percentage on concentric zones and quadrants for postural stability assessment
under various sensory manipulations.
Chapter 9 reports the biomechanical analyses to quantify the movement
strategies in anterior-posterior and medial-lateral directions in predicting the overall
postural stability wearing three types of prosthetic feet with modified sensory inputs.
Finally, Chapter 10 provides a summary based on the findings of this thesis and
limitations are explored. This chapter closes with recommendations for future studies in
improving the understanding of postural stability control of persons with below-knee
amputation.

13
CHAPTER 2
LITERATURE REVIEW
This chapter provides a comprehensive review on areas related to postural stability
control in below-knee amputees. The review of previous and current literatures provide
an outline of the body of knowledge that explores the aspects of both prosthesis
intervention and balance assessment in persons with below-knee amputation. The first
part of this chapter will discuss the overview of previous and current trend of research
in lower limb amputation. Topics relevant to below-knee amputation such as general
history, amputation levels and components of below-knee prosthesis are reviewed in the
second part of this chapter. It continues with the third part which explains postural
stability during quiet standing and its underlying biomechanics in healthy and
amputated individuals. This section will contrast normal control of postural stability
with that of pathologic control in below-knee amputees. The fourth part summarizes the
instrumented measures of balance found from systematic search of published literatures.
Next, the outcome measures related to balance are also elaborated. Finally, this chapter
ends with a summary of the contribution of the current thesis to the body of knowledge
related to postural stability control in people with below-knee amputation.

14
Years
Num
ber
of
pap
ers
2.1 Overview of lower limb amputation research
In the last decade of the 20th century, several contributing factors such as
technological advances in componentry and fabrication, emergence of new materials as
well as increased awareness in evidence-based practice have encouraged the positive
growth of lower limb amputation research. Generally, prosthetic research is primarily
based on two purposes, which are to expand understanding to the body of knowledge or
to solve an identified practical problem (Geil, 2009). The publication trend based on a
search in the Web of Science database indicates that the distribution of published
articles has increased in the last three decades from 1981 to 2014 (Figure 2.1).
However, there is still insufficient evidence related to balance in lower-limb amputees
based on the total published articles per year as shown in Figure 2.2.
Figure 2.1: Publication trend for research related to lower limb amputation prosthesis
from 1983 to 2014.
According to previous literature studies, most of the research in the field of
prosthesis and lower limb amputation focused on the common measures of
biomechanics such as kinetics (derived from force data), kinematics (motion analysis),
temporal characteristics, muscle activity and energy expenditure (Hafner, 2005; Sagawa
et al., 2011). Moreover, the lack of research pertaining balance assessment in amputees

15
Years
is reflected by the list of the first top ten articles in the field of lower limb prosthetics,
where only two studies on static balance in below-knee amputees and dynamic balance
in above-knee amputees were recorded at 7th and 8th place, respectively (Eshraghi, Abu
Osman, Gholizadeh, Ali and Shadgan, 2013). Despite numerous published studies on
lower limb amputees, limitation in the studies conducted to date on balance control in
persons with lower limb amputation warrants further investigation.
Figure 2.2: Published articles per year for research related to balance in lower limb
amputees from 1994-2014.
2.2. Below-knee amputation and prosthesis
2.2.1. History of amputation and prosthetics
Lower-limb amputation has been known as one of the oldest surgical procedures
performed since prehistoric times (Wilson, 1992). During the Renaissance era from the
14th to 16th centuries, Hippocrates indicates that amputation was performed mainly due
to gangrene (Bowker and Pritham, 2004). Later, it was Ambroise Pare (from 1509 to
1590) who became known for his significant contribution to the development of modern
surgery. Following the innovation of gunpowder, more amputations were undertaken as
Num
ber
of
pap
ers
16
a result from shot and cannon ball injuries. One of the well-known battle field surgeons
was Lisfranc (from 1790 to 1847) who was famous for foot amputation procedure that
was later named after him.
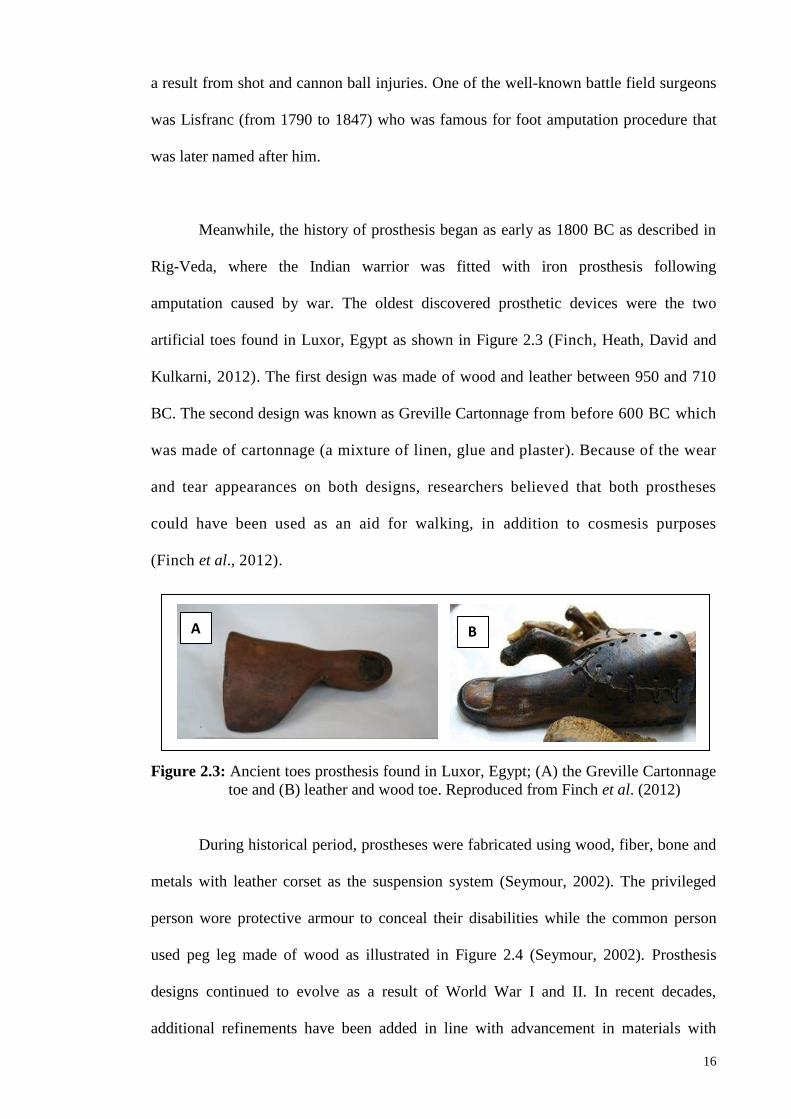
Meanwhile, the history of prosthesis began as early as 1800 BC as described in
Rig-Veda, where the Indian warrior was fitted with iron prosthesis following
amputation caused by war. The oldest discovered prosthetic devices were the two
artificial toes found in Luxor, Egypt as shown in Figure 2.3 (Finch, Heath, David and
Kulkarni, 2012). The first design was made of wood and leather between 950 and 710
BC. The second design was known as Greville Cartonnage from before 600 BC which
was made of cartonnage (a mixture of linen, glue and plaster). Because of the wear
and tear appearances on both designs, researchers believed that both prostheses
could have been used as an aid for walking, in addition to cosmesis purposes
(Finch et al., 2012).
Figure 2.3: Ancient toes prosthesis found in Luxor, Egypt; (A) the Greville Cartonnage
toe and (B) leather and wood toe. Reproduced from Finch et al. (2012)
During historical period, prostheses were fabricated using wood, fiber, bone and
metals with leather corset as the suspension system (Seymour, 2002). The privileged
person wore protective armour to conceal their disabilities while the common person
used peg leg made of wood as illustrated in Figure 2.4 (Seymour, 2002). Prosthesis
designs continued to evolve as a result of World War I and II. In recent decades,
additional refinements have been added in line with advancement in materials with
A B

17
lighter and durable properties such as silicone, thermoplastic, carbon fibre and titanium.
Fabrication of prosthesis socket has been computerised with the use of Computer Aided
Design–Computer Aided Manufacturing (CAD-CAM) which increased the
manufacturing efficiency and time savings when compared to the manual process
(Bowker and Pritham, 2004).
Figure 2.4: Peg leg prostheses during (A) Gallo-Roman era and (B) Renaissance era.
Reproduced from Seymour (2002).
2.2.2. Levels of lower-limb amputation
Standard nomenclature for levels of amputation was developed by the
International Society of Prosthetics and Orthotics (ISPO) in 1973 to improve
international communication related to the field (Schuch & Pritham, 1994). In 1989, the
terms were minimally modified and endorsed by the International Standards
Organization (ISO). This standardised nomenclature is adopted to replace traditional
terminologies such as above-knee and below-knee used in American practice
previously. For amputation performed across the axis of a long bone such as tibia, the
term transtibial is used, while amputation between long bones or through a joint is
A B

18
known as disarticulation (ISO, 1989a). Figure 2.5 depicts the acquired amputation level
and its ISO terms.
Figure 2.5: Levels of amputation according to ISO nomenclatures. Reproduced from
Seymour (2002).
2.2.3 Components of transtibial prosthesis
Prosthesis or prosthetic device is defined as ‘externally applied device used to
replace wholly, or in part, an absent or deficient limb segment’ (ISO, 1989b). The
present thesis focused on lower-limb prosthesis, particularly for transtibial amputees.
Generally, the endoskeletal or modular transtibial prosthesis consists of prosthetic foot,
pylon, suspension system and socket (Figure 2.6) Along with these components, soft
liners are prescribed when necessary according to the conditions of the residual limb. In
addition to the patient’s current condition, the range of prosthetic components is mainly
determined based on the functional classification system (K-level) describing the
functional abilities of persons who had undergone lower-limb amputation (Gailey and
Clark, 2007). The following paragraphs briefly discuss each of the components.
Short transfemoral
Medium transfemoral
Long transfemoral
Supra condylar
Knee Disarticulation
Hip Disarticulation
Hemipelvectomy
Very short transtibial
Short transtibial
Standard transtibial
Long transtibial
Syme
Chopart Lisfranc
Transmetatarsal amputation (TMA)

19
Soft liner
Socket
Pylon
Foot
Figure 2.6: Components of a modular transtibial prosthesis with silicone soft liner and
pin suspension system.
Ideally, a prosthetic ankle-foot unit should be prescribed and carefully designed
to adjust its mechanical characteristics to the functional needs of the prosthesis user
(Cortes, Viosca, Hoyos, Prat and Sanchez-Lacuesta, 1997). This includes the ability of
the foot to replicate the biomechanical characteristics of anatomical foot as close as
possible (Fergason, 2007). Often, prosthetic prescription for person with lower-limb
amputation is primarily based on empirical knowledge along with other factors such as
the body weight, muscle strength, residual length and activity level (Stark, 2005). From
a manufacturer’s practice, the combination of mobility grade and amputee’s weight is
used to determine the stiffness level of the prosthetic foot for prescription purposes
(Geil, 2001). However, there seem to be no consensus among the manufacturers on the
stiffness level in such that the choice of stiffness is left to both the prosthetist’s and
amputee’s subjective interpretation.
Pin
Suspension

20
Nevertheless, to provide general guidelines during the prescription process,
prosthetic feet are classified into four primary types according to the motion they
permit, mechanical behaviour and physical design (Hafner, 2005). They are:
conventional, single-axis, multi axis and energy storage and return (ESAR). The
conventional foot is the basic design, non-articulated solid ankle cushion heel (SACH)
which was developed at the University of California in the early 1950’s (Michael,
2004). It consists of an internal keel that extends to the ball of foot and a cushion wedge
built into the heel (Figure 2.7 A). In some designs, belting is added from the keel to the
end of toes to stimulate toe flexors (Fergason, 2007). The SACH foot has been
commonly prescribed due to its durability, simplicity, minimal maintenance and low
cost (Fergason, 2007). As the name suggests, the single-axis (SA) foot permits 150
plantarflexion and 5-70 dorsiflexion (Figure 2.7 B). The front bumper substitutes for the
gastrocnemius-soleus eccentric contraction while the rear bumper mimics eccentric
contraction of the anterior tibialis (Seymour, 2002). One of the advantage of this design
is its ability to reach foot flat quickly during early stance. On the other hand, major
drawbacks include increased weight and frequent maintenance (Fergason, 2007).
The multi-axis foot consists of rubber block which allow dorsiflexion and
plantarflexion in the sagittal plane, with additional motions in transverse plane such as
inversion, eversion and rotation (Figure 2.7 C). This foot benefits most during uneven
terrain locomotion and ascending slope (Seymour, 2002). However, due to its
multiplanar motions, this design provides less static stability to amputees with weaken
leg muscles (Fergason, 2007).

21
Figure 2.7: Four types of prosthetic feet: (A) solid ankle cushion heel (SACH), (B)
single-axis, (C) multi-axis, and (D) energy saving and return (ESAR).
Reproduced from Seymour (2002) and Fergason (2007).
For amputees leading active lifestyle with high activity levels, they are often
prescribed with energy storage and return (ESAR) foot (Figure 2.7 D). The notion of the
name is related to its light weight, carbon graphite composites which store forces during
loading and release this stored energy during pre-swing (Fergason, 2007). This type of
foot has been known to improve walking speed, greater stride length and more
symmetrical gait pattern when compared to a conventional SACH foot (Hafner, 2005;
van der Linde et al., 2004). However, the range of motion at the ankle of a single-axis
foot was demonstrated to be greater than the ESAR foot (van der Linde et al., 2004).
Nevertheless, results from these studies should be interpreted carefully due to variability
between studies such as subject selection and experimental protocols.
The next component of a transtibial prosthesis is the pylon which is a cylindrical
rod used to connect the distal end of prosthetic foot to the socket adapter at the proximal
A B
C D

22
end. In recent years, shock-absorbing pylon and flexible pylon have been introduced in
addition to the conventional rigid pylon. A study conducted on a group of transtibial
amputees during self-selected walking speed demonstrated that the use of shock-
absorbing pylon was effective as a rigid pylon (Berge, Czerniecki and Klute, 2005).
Meanwhile, the use of flexible nylon pylon in transtibial amputees was shown to
improve gait quality and comfort than that of rigid aluminium pylon
(Coleman, Boone, & Czerniecki, 2001).
The prosthetic socket serves as a connection between the residual limb and the
prosthetic foot. Since weight-bearing capability of the residual limb differs from the
foot, the design and fit of a socket are vital to ensure a successful rehabilitation for
amputees (Goh, Lee and Chong, 2004). Moreover, the shape of the socket is one of the
factors which can possibly influence the occurrence of pressures and shear stresses at
the residual limb-prosthetic socket interface (Sanders, Zachariah, Baker, Greve and
Clinton, 2000). Generally, two types of socket are commonly used for transtibial
prosthesis which are the patellar tendon bearing (PTB) and the total surface bearing
(TSB) (Seymour, 2002).
The PTB socket was first introduce by Radcliffe in 1950s that relied on the
weight-bearing capabilities of the patellar tendon area (Goh et al., 2004). As such, an
indentation known as ‘patellar tendon bar’ was created on the socket to reduce weight
loading on the pressure-intolerant areas (Figure 2.8 A) (Laing, Lee and Goh, 2011).
Despite being used for more than 40 years and known for providing good fit, the PTB
socket has been reported with suspension problem and unbearable pressure on the
patella tendon (Fergason and Smith, 1999; Yigiter, Sener & Bayar, 2002). In addition, a
skilled and experienced prosthetist is required in order to produce a good PTB socket fit
(Laing et al., 2011).

23
Figure 2.8: Two common prosthetic sockets for transtibial prosthesis; (A) PTB and (B)
TSB socket. Note the significant indention on the patellar tendon area in
PTB socket design. Figure A was reproduced from Kapp and Cummings
(1992).
In recent years, the TSB socket has been recognised as an effective alternative to
the conventional PTB socket (Figure 2.8 B). The TSB socket, which was introduced by
Ossur Kristinsson in 1993, is based on the concept of distributing equal pressure on the
entire residual limb and commonly used together with the silicone liner (Cavenett,
Aung, White and Streak, 2012). Recent research findings on amputees’ satisfaction
survey showed that the TSB socket is favoured by the majority of amputees
(Gholizadeh, Abu Osman, Eshraghi, Ali & Abd Razak, 2014). This could be linked to
the previous study which demonstrated significant improvement in suspension, weight
acceptance on amputated side, as well as lighter prosthesis mass when ambulating with
TSB socket in transtibial subjects (Yigiter et al., 2002).
Suspension and prosthetic fit have been linked to influence functional efficiency
and comfort levels (Beil, Street and Covey, 2002). Good suspension is vital to secure
the prosthesis on the residual limb during activities of daily living (Seymour, 2002).
Several types of prosthetic suspension systems are available for transtibial amputees.
Generally the suspension system for a transtibial prosthesis are categorized into four
Ant.
A
Ant.
B
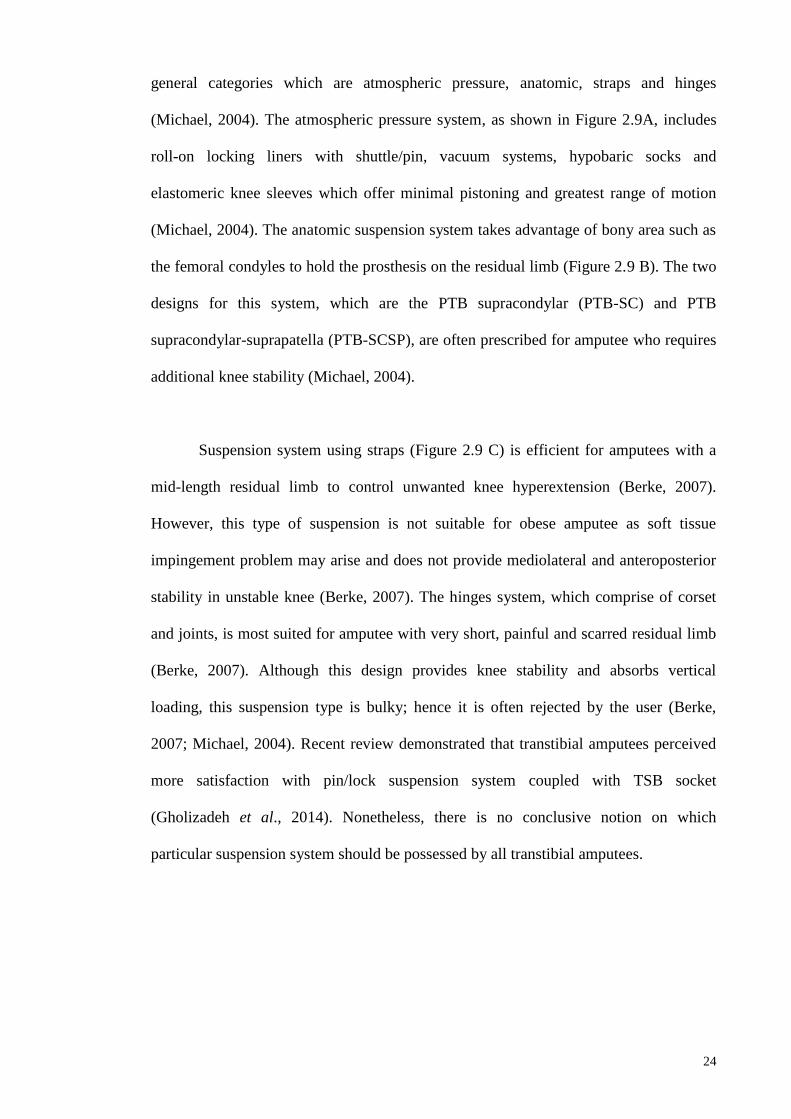
24
general categories which are atmospheric pressure, anatomic, straps and hinges
(Michael, 2004). The atmospheric pressure system, as shown in Figure 2.9A, includes
roll-on locking liners with shuttle/pin, vacuum systems, hypobaric socks and
elastomeric knee sleeves which offer minimal pistoning and greatest range of motion
(Michael, 2004). The anatomic suspension system takes advantage of bony area such as
the femoral condyles to hold the prosthesis on the residual limb (Figure 2.9 B). The two
designs for this system, which are the PTB supracondylar (PTB-SC) and PTB
supracondylar-suprapatella (PTB-SCSP), are often prescribed for amputee who requires
additional knee stability (Michael, 2004).
Suspension system using straps (Figure 2.9 C) is efficient for amputees with a
mid-length residual limb to control unwanted knee hyperextension (Berke, 2007).
However, this type of suspension is not suitable for obese amputee as soft tissue
impingement problem may arise and does not provide mediolateral and anteroposterior
stability in unstable knee (Berke, 2007). The hinges system, which comprise of corset
and joints, is most suited for amputee with very short, painful and scarred residual limb
(Berke, 2007). Although this design provides knee stability and absorbs vertical
loading, this suspension type is bulky; hence it is often rejected by the user (Berke,
2007; Michael, 2004). Recent review demonstrated that transtibial amputees perceived
more satisfaction with pin/lock suspension system coupled with TSB socket
(Gholizadeh et al., 2014). Nonetheless, there is no conclusive notion on which
particular suspension system should be possessed by all transtibial amputees.

25
Figure 2.9: Four general categories which are: (A) atmospheric pressure, (B) anatomic,
(C) straps and (D) hinges. Reproduced from Michael (2004), Carroll and
Binder (2006) and Seymour (2002).
Soft liners are used to protect the residual limb and providing total contact
between the limb and socket (Seymour, 2002). Two types of soft liners which are
commonly used are Pelite® and viscoelastic liner (Seymour, 2002). Pelite® liner is made
of lightweight closed-cell polyethylene foam, while viscoelastic liner (or known as roll-
on liner) is made of gel or silicone. Choosing a liner depends on the condition of
residual limb. For example; scarred, sensitive or bony residual limb is often prescribed
with the Pelite® liner, while residual limb which has irregular shape is often prescribed
with viscoelastic liner (Kapp and Fergason, 2007). A recent finding from the work of
A B
D C

26
Ali et al. (2012) showed that amputees were more satisfied with polyethylene liner than
viscoelastic liner during donning and doffing.
In brief, the variations in the commercially available prosthetic components
offers wide range of alternatives for prosthetists in making the optimum decision
pertaining components selection. Most importantly, the choice of prosthetic components
not only depends on the thorough understanding of its underlying mechanism, but also
relies heavily on the ability of the amputee to function with such choices.
2.3 Control of postural stability in human
2.3.1 General background
Postural control is known as the foundation to achieve independent standing and
walking (Melzer, Benjuya and Kaplanski, 2004). It has been defined as the control of
the body’s position in space for the purpose of balance and orientation (Shumway-Cook
& Woollacott, 2001).Therefore, it is considered as an important aspect in the
rehabilitation process among the elderly (Baldwin, Thomas, Ploutz-snyder & Lori,
1999; Parraca et al., 2011), impaired (Salsabili, Bahrpeyma, Forogh and Rajabali, 2011;
Testerman and Griend, 1999) and amputee (Vrieling et al., 2008a; Vanicek et al., 2009)
populations. Poor control of postural stability is often associated with the risk of falling
which consequently leads to death, injuries and loss of mobility (Winter, Patla and
Frank, 1990a). The maintenance of stable posture is controlled by the sensory system
(vestibular, visual, proprioceptive systems), the central nervous system and
musculoskeletal system (Winter et al., 1990a). Hence, any deficits of these components
will greatly affect the ability to maintain postural stability during standing and walking.
27
2.3.2 Definition and related terms
The word ‘balance’ is a common term which had been utilised widely in various
clinical purposes. It has been used interchangeably with other related terms such as
stability and postural control (Pollock, Durward and Rowe, 2000; Seeger, 2003). For
instance, Shumway-Cook and Woollacott (2007) defined postural stability, or balance,
as the ability to maintain the body in equilibrium. On the other hand, Hinman (2000)
defined balance, or postural stability, as the ability to maintain the body’s center of
mass (CoM) within its base of support (BoS). The BoS is defined as the area within the
border of the contact surface between the feet and the support surface (Wallace, 2007).
Specifically, posture is defined as the geometric relation between two or more body
segments relative to the environment (Balasubramaniam & Wing, 2002). Whereas
stability is defined as the sensitivity of a dynamic system to external and internal
perturbations (e.g., changing muscle activity in response to gravity) that occur during
posture (Stergiou, 2004). Hence, Pollock and associates (2000) described human
stability as the person’s natural capability to maintain, achieve or restore balance by
integrating the sensory and motor systems. Interestingly, despite the frequent use of the
term ‘balance’ among the healthcare professionals, no standard terminology has been
established (Shumway-Cook and Wollacott, 2007). Various interpretation of postural
stability is shown in Table 2.1.
From these definitions, it is reasonable to conclude that the term postural
stability is the process of postural control which consist of a complex integration of
somatosensory, visual and vestibular inputs along with motor coordination to maintain
the center of mass (CoM) within the base of support (BoS). (Blackburn,
Prentice, Guskiewicz and Busby, 2000; Shumway-Cook and Woollacott, 2000).
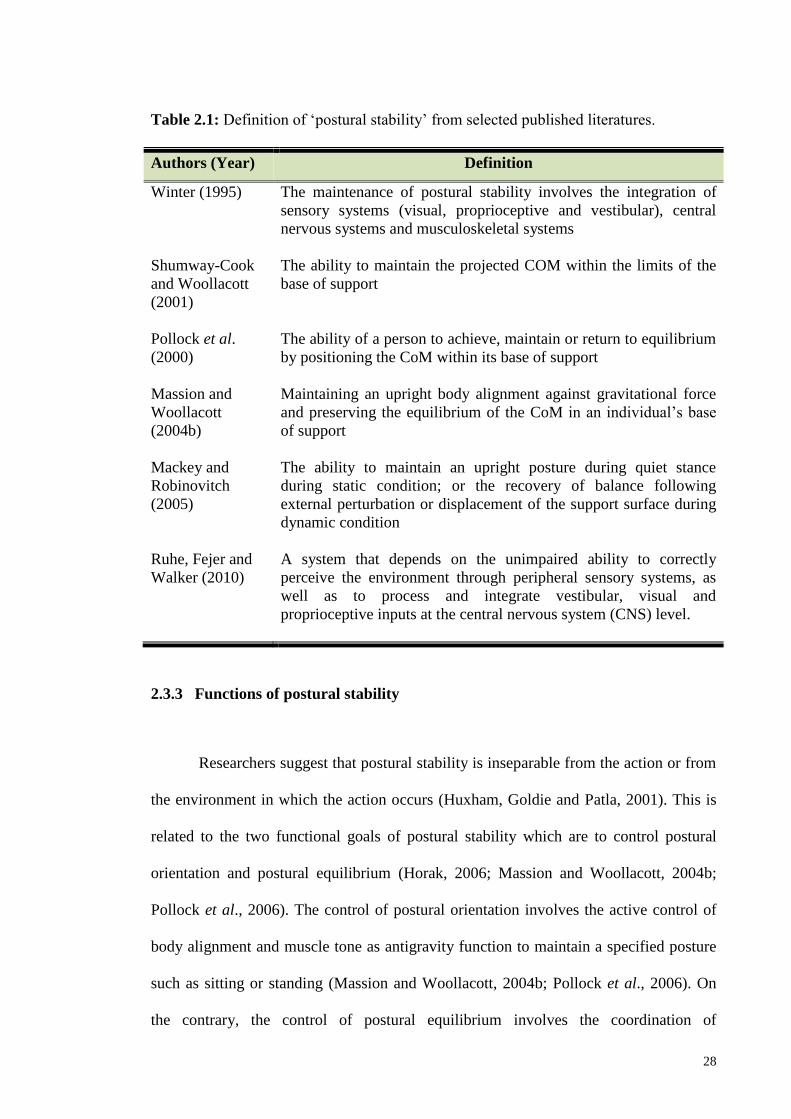
28
Table 2.1: Definition of ‘postural stability’ from selected published literatures.
Authors (Year) Definition
Winter (1995) The maintenance of postural stability involves the integration of
sensory systems (visual, proprioceptive and vestibular), central
nervous systems and musculoskeletal systems
Shumway-Cook
and Woollacott
(2001)
The ability to maintain the projected COM within the limits of the
base of support
Pollock et al.
(2000)
The ability of a person to achieve, maintain or return to equilibrium
by positioning the CoM within its base of support
Massion and
Woollacott
(2004b)
Maintaining an upright body alignment against gravitational force
and preserving the equilibrium of the CoM in an individual’s base
of support
Mackey and
Robinovitch
(2005)
The ability to maintain an upright posture during quiet stance
during static condition; or the recovery of balance following
external perturbation or displacement of the support surface during
dynamic condition
Ruhe, Fejer and
Walker (2010)
A system that depends on the unimpaired ability to correctly
perceive the environment through peripheral sensory systems, as
well as to process and integrate vestibular, visual and
proprioceptive inputs at the central nervous system (CNS) level.
2.3.3 Functions of postural stability
Researchers suggest that postural stability is inseparable from the action or from
the environment in which the action occurs (Huxham, Goldie and Patla, 2001). This is
related to the two functional goals of postural stability which are to control postural
orientation and postural equilibrium (Horak, 2006; Massion and Woollacott, 2004b;
Pollock et al., 2006). The control of postural orientation involves the active control of
body alignment and muscle tone as antigravity function to maintain a specified posture
such as sitting or standing (Massion and Woollacott, 2004b; Pollock et al., 2006). On
the contrary, the control of postural equilibrium involves the coordination of

29
sensorimotor system to accomplish self-initiated movements (for example, movement
from sitting to standing) or to restore stability in reaction to external disturbances (for
example, a trip or a push) (Horak, 2006; Massion and Woollacott, 2004b; Pollock et al.,
2006).
Overall, researchers agreed on the notion that the success to maintain postural
stability depends on the adaptive postural control which modifies the motor as sensory
system in response to the task characteristics (for example, normal walking versus
walking on toes) and environmental context (for example, standing on stable versus
moving support surface) (Huxam et al., 2001; Massion and Woollacott, 2004b;
Shumway-Cook and Woollacott, 2007). In addition, other mechanisms of postural
control include the anticipatory postural control which is based on the previous
experience and learning, as well as motivation and intention of the subject (Shumway-
Cook and Woollacott, 2007).
In relation to this, several models of postural control have been developed to
provide understanding in human control of postural stability. The most commonly
discussed models of postural control are the genetic, hierarchical and system models. In
the genetic model of posture, three main functions are identified which are to orient the
body segments against gravity, preserve whole body balance and adapting the body’s
segments to the ongoing movement. (Massion, Alexandrov & Frolov, 2004a). However,
the concept of genetic model of posture was criticized for its lacking in considering the
important role of anticipation from learning and experience during the organization of
posture and movement (Massion et al., 2004a). In addition, this model neglects the
nature of flexibility of postural reactions following external disturbance in fine-tuning
the postural control (Massion et al., 2004a).
30
Due to this argument, it appears that the postural control mechanism requires a
higher level of postural organization. Hence, the hierarchical model of postural control
was proposed by Nicholai Bernstein that combined both genetic approach and learning
aspects in controlling postural stability (Massion et al., 2004a). In this model, the CNS
system is thought to organize the control of posture in an ascending hierarchical manner
in such that the control of reflexes occur at the spinal cord (lower level) and brain stem
(higher level) while the equilibrium response occurs at the cortical brain area (highest
level) (Seeger, 2003; Mattiello and Wollacott, 1997, 2004b; Woollacott and Shumway-
Cook, 1990). Accordingly, reflexes and response occur at lower level will disappear as
control is taken over by the higher centres (Mattiello and Wollacott, 1997). Although
the hierarchical model has been widely accepted, it was scrutinised because movement
and posture control is not an independent result of sensory input eliciting predetermined
movement patterns but rather the postural control emerges from the interaction of
multiple body system with the changes in task and environment (Mattiello and
Wollacott, 1997).
Hence, the systems model was proposed which suggest that it is not only
dependent on the CNS hierarchical organization from higher and lower level, but rather
from interrelation between several systems in a concerted manner as shown in Figure
2.10 (Mattiello and Wollacott, 1997). As such, the flexibility of this interrelation
permits adaptation of the postural control system to changes in environmental, physical
and task constraints (Mattiello and Wollacott, 1997). This model consists of three
essential elements in the control of postural stability which are: combinations of sensory
information from visual, vestibular and somatosensory systems, motor processes that
involve muscle synergies and finally integration of sensory and motor processes at the
CNS level that includes adaptive and anticipatory postural control (Shumway-Cook and
Woollacott, 2007). The systems model represents a sensory-motor control loop which

31
the CNS continuously monitors the environment’s context condition from the afferent
feedback and regulating corresponding postural movements based on the transmitted
efferent feedback (Yim-Chiplis and Talbot, 2000; Tucker et al., 2015). The adaptive
postural control functions in adapting the sensory and motor system in response to
changing task and environmental demands while the anticipatory postural control works
based on previous experience and learning (Shumway-Cook and Woollacott, 2007).
The use of systems model in balance assessment has been suggested to aid in
determining the fundamental cause of balance deficit in order to plan for specific
rehabilitation management (Horak, 1997). The sensory and motor strategies for postural
stability control based on the systems model are described in the following sections.

32
Figure 2.10: Organization of postural stability control according to systems model
approach (Adapted from Peterka 2002; Shumway-Cook and Woollacott,
2007).
Visual
detects head orientation
relative to the
environment
Somatosensory
detects leg orientation
relative to the support
surface
Vestibular
detects deviations of
head orientation from
earth-vertical (gravity)
Afferent feedback Efferent feedback CNS
Compare, select and
combine
information from
sensory systems
Determine body
position
Choose movement
strategy
(ankle/hip/
stepping strategy)
Generate
appropriate
corrective torque
based on the
summed signal
Postural adjustments
Environmental context

33
2.3.4 Components and organization of postural stability
In this thesis, the postural stability control system is viewed based on the systems
model (Horak, 2006; Shumway-Cook and Woollacott, 2007). According to the systems
model, the maintenance of postural stability involves the integration of six important
components which are biomechanical constraints, movement strategies, sensory
strategies, orientation in space, control of dynamics and cognitive processing as
illustrated in Figure 2.11 (Horak, 2006). Impairments in one or more of the components
will lead to postural instability and increase the risk of fall especially in the elderly and
person with neurological or musculoskeletal disorders.
The biomechanical subcomponents of postural control demonstrates the ability of
a person to accomplish the desired motor task depending on the muscles strength, joint
range of motion, flexibility and body alignment in postures such as standing and sitting
(Horak, 1997). Most importantly, the alignment of body segments’ CoM over the BoS
must be within the limits of stability to ensure appropriate selection of movement and
sensory strategies (Horak, 2006). Variations in the body’s demographics such as height,
weight, age and gender have been proposed to affect the individual limit of stability
which consequently influences the selection of appropriate movement strategies to
maintain postural stability (Guskiewicz and Perrin, 1996).
Hence, three common movement strategies have been hypothesized as a
mechanism to keep the body’s postural stability in a variety circumstances (Figure
2.12). The ankle and hip strategy are strategies that keep the feet on a fixed-support,
while stepping strategy involves changes-in–support of the feet (Pollock et al., 2000).
The selection of appropriate strategy often relies on the magnitude size of the
perturbation, type of support surface and on experience and expectation (Horak, 1997).

34
Figure 2.11: Vital components contributing to postural stability (Reproduced from
Horak, 2006).
Previous work of notable researchers concluded that the ankle strategy will be
executed to shift the CoM by rotating the body around the ankle joint during small
perturbation while on a rigid-flat surface (Horak, 2006). In contrast, the hip strategy is
required during events such as significant body sway around the hips and trunk, larger
perturbation magnitude, standing on narrow beam or complaint surface or no previous
experience with the perturbation (Horak, 1997). For conditions with very fast or large
perturbations such as walking or hopping, the stepping or stumbling strategy is used to
reposition the CoM within the changing base of support (Horak, Shupert and Mirka,
Biomechanical
constraints
Limits of
stability
Strength
Range of
motion
Reactive
Anticipatory
Voluntary
Movement
Strategies
Sensory
Strategies
Orientation in
Space
Control of
Dynamics
Cognitive
Processing
Sensory
integration
Sensory
reweighting
Attention
Learning
Gait
Perception
Verticality Gravity,
surfaces,
vision

35
A B C
1989).People with high risk of falling or fear of falling use the hip and stepping strategy
more often than the ankle strategy in maintaining postural stability (Horak, 2006).
Figure 2.12: Three common movement strategies to maintain postural stability during
upright standing; A. ankle strategy, B. hip strategy and C. stepping
strategy (Adapted from Seeger, 2003).
The selection of movement strategies also relies on the types of perturbation
applied on the balance system. For instance, reactive controls will response to
unexpected external perturbation applied without the knowledge of a person (for
example, tilted support surface) (Winter, 1995). Reactive movement strategies help a
person to develop coordinated multi-joint movement to ensure the body is located
within the stability limits boundary (Salsabili et al., 2011). On the other hand, proactive
control will respond to voluntary initiated internal perturbation (for example, leg
raising) and also to anticipatory well-learnt perturbation (for example, walking) (Winter,
1995).
The next sub-component is the sensory strategies which help a person to identify
and select appropriate sensory information for the control of postural stability. Horak
(2006) proposed two function of sensory strategies which are sensory integration and
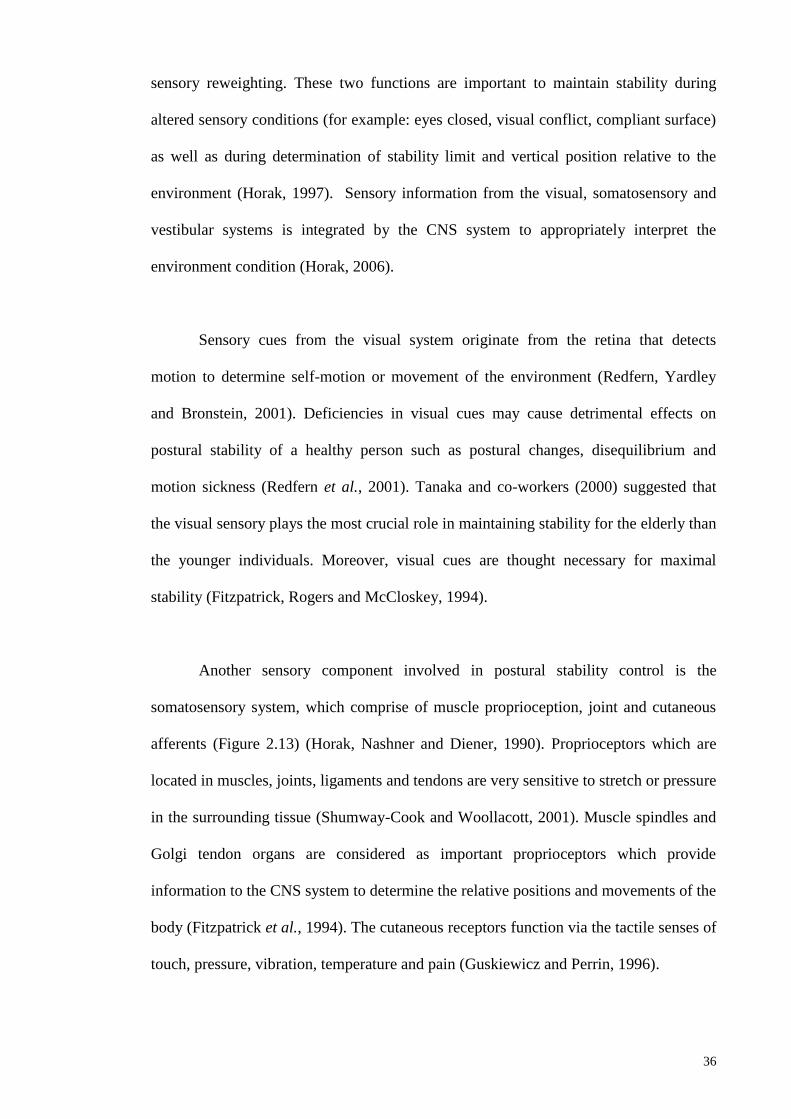
36
sensory reweighting. These two functions are important to maintain stability during
altered sensory conditions (for example: eyes closed, visual conflict, compliant surface)
as well as during determination of stability limit and vertical position relative to the
environment (Horak, 1997). Sensory information from the visual, somatosensory and
vestibular systems is integrated by the CNS system to appropriately interpret the
environment condition (Horak, 2006).
Sensory cues from the visual system originate from the retina that detects
motion to determine self-motion or movement of the environment (Redfern, Yardley
and Bronstein, 2001). Deficiencies in visual cues may cause detrimental effects on
postural stability of a healthy person such as postural changes, disequilibrium and
motion sickness (Redfern et al., 2001). Tanaka and co-workers (2000) suggested that
the visual sensory plays the most crucial role in maintaining stability for the elderly than
the younger individuals. Moreover, visual cues are thought necessary for maximal
stability (Fitzpatrick, Rogers and McCloskey, 1994).
Another sensory component involved in postural stability control is the
somatosensory system, which comprise of muscle proprioception, joint and cutaneous
afferents (Figure 2.13) (Horak, Nashner and Diener, 1990). Proprioceptors which are
located in muscles, joints, ligaments and tendons are very sensitive to stretch or pressure
in the surrounding tissue (Shumway-Cook and Woollacott, 2001). Muscle spindles and
Golgi tendon organs are considered as important proprioceptors which provide
information to the CNS system to determine the relative positions and movements of the
body (Fitzpatrick et al., 1994). The cutaneous receptors function via the tactile senses of
touch, pressure, vibration, temperature and pain (Guskiewicz and Perrin, 1996).

37
Figure 2.13: Somatosensory system which consist of muscle proprioception, joint and
cutaneous afferents (Retrieved from Palastanga, Field and Soames, 2002).)
Sensory cues from the somatosensory information provided by feet in contact
with the support surface appears to be preferred in healthy adults in maintaining
postural stability (Gutierrez et al., 2001; Shumway-Cook and Horak, 1986). It is
proposed that the tactile and proprioceptive information from the sole of the feet and
flexor muscle around the ankle joint are used to indicate the body’s movement relative
to the standing surface and the quality of the surface (for example: soft, hard or uneven)
(Kavounoudias, Roll and Roll, 2001). On the other hand, Fitzpatrick and associates
(1994) proposed that the proprioceptive signals from receptors in the leg muscles are
sufficient to maintain a stable upright stance. In relation to this, a person with reduced
somatosensory input such as in the case of peripheral neuropathy and amputation, the
ability to control postural stability is reduced (Geurts and Mulder, 1992). Due to partial
or total loss of somatosensory information from the feet, the hip strategy is used instead
of ankle strategy to regain postural stability (Horak et al., 1990).
Muscle proprioceptors Cutaneous Receptors

38
The vestibular system (Figure 2.14), which is located in the inner ear (known as
labyrinth), consists of vestibular apparatus such as vertical semicircular canals, otolith
organs, vestibular neural processing and the vestibulospinal reflex (Black, 2001). This
system detects angular motion as well as linear acceleration and deceleration especially
during resolving conflicts between vision and proprioception sensory (Guekiewicz and
Perrin, 1996; Nashner, Black and Wall, 1982).
Figure 2.14: The vestibular system which is responsible for maintaining postural
stability (Retrieved from Palastanga, Field and Soames, 2002).
According to Horak and co-workers (1990), the execution of hip strategy
requires vestibular information. Despite the critical role of the vestibular system, the
vestibular information is proposed as unnecessary for postural stability during quiet
standing when visual (eyes-opened) and proprioception (firm and stable support
surface) information is accurate (Horak et al., 1990). However, several studies showed
that postural stability during undisturbed upright stance was decrease when the head
was tilted, causing the otolith organs to be positioned beyond their working range
(Jackson and De l'Aune, 1996; Jackson and Vuillerme and Rougier, 2005).
The postural stability system receives multiple sensory inputs, hence sensory re-
weighting is another vital component for maintenance of postural stability. As such,
39
when a person changes his position from one sensory condition to another, he must also
re-weight his dependency on each sensory (Horak, 2006). For instance, a healthy person
walking from a well-lit room to a dark room on a firm surface will rely most on
somatosensory system but will change his dependency on visual and vestibular system
when standing on an unstable surface. Thus, these unique interactions among the three
primary sensory inputs to maintain postural stability has encouraged Nashner and
associates (1982) to propose the sensory organization testing (SOT) for a
comprehensive assessment of sensory interactions in balance.
The recent version of this test is known as the Clinical Test of Sensory
Interaction and Balance (CTSIB), where the subjects are required to stand quietly for
20s under six different conditions which altered the visual and somatosensory
information (Table 2.2) (Shumway-Cook and Horak, 1986). This testing altered the
visual cues by standing with eyes-closed or wearing visual-conflict dome while
somatosensory input was altered by standing on a firm or on medium-density foam. The
theory behind the SOT and CTSIB is that a healthy subject should be able to ignore the
inaccurate sensory input and maintain postural stability by utilising information
available from other accurate sensory inputs (Guekiewicz and Perrin, 1996). Hence, an
understanding of the different components and their contribution to the control of
postural stability will aid to systematically determine the underlying cause of balance
deficit in a particular person (Horak, 2006).

40
Table 2.2: Sensory information available during sensory organization tests.
Abbreviations; vis: visual, vest: vestibular, prop: proprioceptive, sway-
ref’d: sway referenced (Reproduced from Black, 2001)
The next element required for postural stability is the orientation in space. For a
stable posture, the ability to orient the body parts in relative to gravity, support surface,
visual surrounds and internal references is very crucial (Horak, 2006). Failure to
response to a tilted or inaccurate internal representation will cause postural alignment
that is not aligned with the gravitational vertical and therefore will result in postural
instability (Horak, 2006). Another aspect of postural stability is the control of dynamics
such as during walking or changing from one posture to another. This is because during
these activities, the CoM is not located within the BoS (Horak, 2006). Finally, good
postural stability also requires cognitive processing from attentional and learning
resources (Teasdale and Simoneau, 2001). Attentional resources is important since
additional attention is required when postural stability task becomes more difficult such
as solving simple mathematical question during quiet upright standing (Horak, 1997).
2.3.5 Postural stability during unperturbed upright standing
An unperturbed, upright quiet standing seems like a breeze and easy task.
However, the body is a flexible system consisting of multiple segments connected
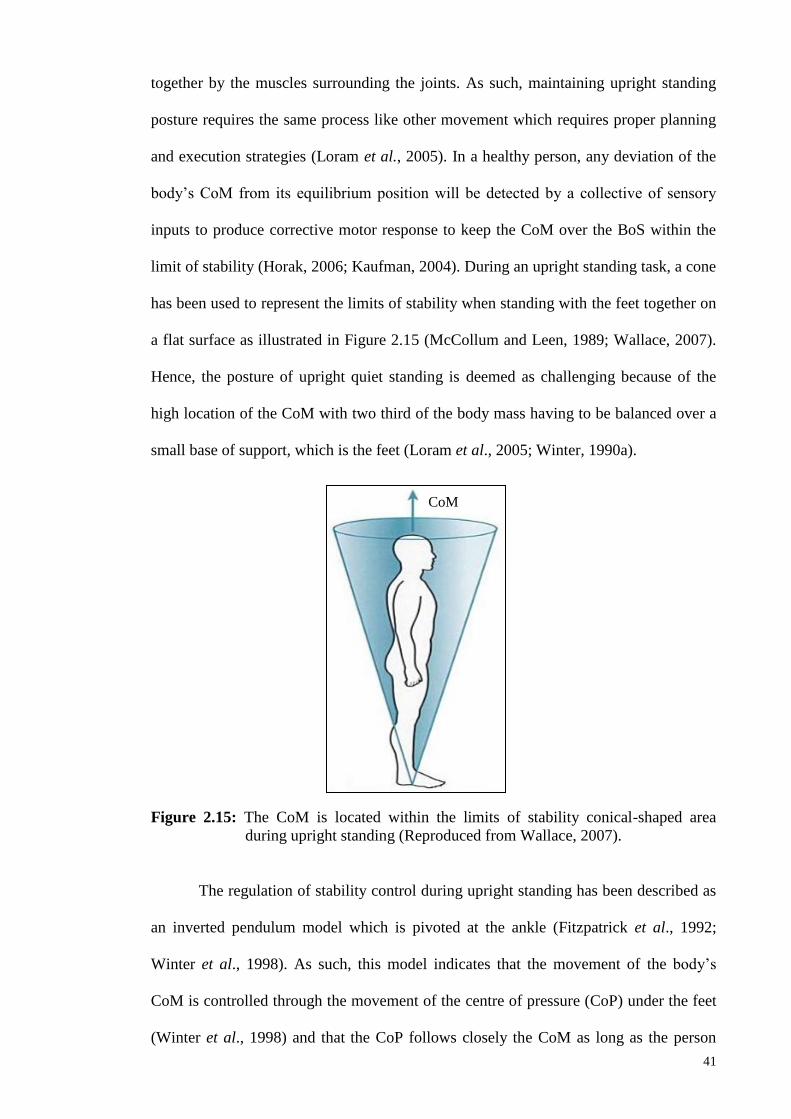
41
together by the muscles surrounding the joints. As such, maintaining upright standing
posture requires the same process like other movement which requires proper planning
and execution strategies (Loram et al., 2005). In a healthy person, any deviation of the
body’s CoM from its equilibrium position will be detected by a collective of sensory
inputs to produce corrective motor response to keep the CoM over the BoS within the
limit of stability (Horak, 2006; Kaufman, 2004). During an upright standing task, a cone
has been used to represent the limits of stability when standing with the feet together on
a flat surface as illustrated in Figure 2.15 (McCollum and Leen, 1989; Wallace, 2007).
Hence, the posture of upright quiet standing is deemed as challenging because of the
high location of the CoM with two third of the body mass having to be balanced over a
small base of support, which is the feet (Loram et al., 2005; Winter, 1990a).
Figure 2.15: The CoM is located within the limits of stability conical-shaped area
during upright standing (Reproduced from Wallace, 2007).
The regulation of stability control during upright standing has been described as
an inverted pendulum model which is pivoted at the ankle (Fitzpatrick et al., 1992;
Winter et al., 1998). As such, this model indicates that the movement of the body’s
CoM is controlled through the movement of the centre of pressure (CoP) under the feet
(Winter et al., 1998) and that the CoP follows closely the CoM as long as the person
CoM

42
stands like an inverted pendulum (Borg and Laxaback, 2010). According to the work of
Winter and associates (1998), the CoM is located approximately 5cm anteriorly to the
ankle joint in the anterior-posterior direction when standing upright. As a result, the
angular velocity (ω) is produced, causing forward sway (Figure 2.16). To correct the
body’s forward sway, the CoP must be located anteriorly to the CoM. Consequently,
further forward sway will generate angular acceleration (α) which causes backward
sway. When the CNS senses the posterior shift needing correction, the angular
acceleration will be reversed so that the CoP lies behind CoM and the body returns to its
initial condition. This observation indicates that the CoP is continuously moving closely
following the CoM while increasing and decreasing the angular velocity and
acceleration to keep the CoM within the BoS (Aoyama et al., 2006; Winter, 1998).
Figure 2.16: Relative position of CoM and CoP during swaying while standing quietly
on a firm surface. Abbreviations; W: body weight, GRF: ground reaction
force, g: CoM position, p: CoP position, α: angular acceleration and ω:
angular velocity.
Due to the dynamic nature of upright quiet standing, this task requires
continuous muscular activity to immobilize joints that causes body movements
intervening along the anterior-posterior (AP) and medial-lateral (ML) axes
CoM
GRF
W
ω α
g p
Ankle
joint
Anterior Posterior

43
(Balasubramaniam & Wing, 2002). It is also proposed that the restoration torque
produced by the muscles around the joint is subjected to the setting of appropriate joint
stiffness to control body’s CoM during quiet standing (Winter et al., 1998). Researchers
had found an important relationship between functional ankle stability and the ability to
maintain balance (Pintsaar et al., 1996). Consequently, other researchers theorized that
the stiffness of the ankle muscle might play an important role in maintaining balance
and joint stability (Blackburn et al., 2000; Vrieling, 2008a). In the absence of
perturbation, the muscle contracts eccentrically to resist the gravitational forces.
However, in order to maintain postural stability during perturbation, concentric muscle
contraction is essential. Hence, stiffer muscles potentially increase the efficiency of
balance control mechanism. In a healthy person, the ankle plantarflexors and
dorsiflexors are considered sufficient to control the net ankle moment during quiet
standing in anterior-posterior direction with minimal movement of hip or knee joints
(Winter, 1995).
Moreover, Winter et al. (1998) measured the CoP and CoM excursion during
quiet standing and showed that an increase in ankle joint stiffness will reduce the
amount of postural instability. However, maintaining postural stability by controlling
ankle joint stiffness alone was reported as insufficient (Loram and Lakie, 2001). To
control the postural stability in medial-lateral direction, the abductor and adductor
muscles of the hip initiate the load/ unloading mechanism along the frontal plane
(Winter, 1995). In addition, it is evident that other leg muscles as illustrated in Figure
2.17 are also involved in the control of balance in anterior-posterior and medial-lateral
direction which produce stretch reflex to resist the lengthening of the muscle
(Shumway-Cook and Woollacott, 2007; Wallace, 2007; Winter, 1995). For instance,
Gatev et al. (1999) demonstrated that body sway can be restricted by the control of

44
ankle stiffness with the activated of gastrocnemius muscle working in a spring-like
manner.
Figure 2.17: Main muscle groups that control the CoM during standing (Reproduced
from Wallace, 2007).
Generally, it has been reported that for normal subjects, body sway occurs more
in anterior-posterior than medial-lateral direction, eyes-closed trials produce greater
sway than eyes-open trials and older subjects demonstrate greater sway than younger
subjects (Guskiewicz and Perrin, 1996). However, quiet upright standing in people with
motor and sensory deficit, such as individuals with lower limb amputation and knee
osteoarthritis, is often characterised by an increase of body sway compared to age-
matched healthy controls (Duclos et al., 2009; Knoop et al., 2011) and weight-bearing
asymmetry due to the CoM position towards the unaffected side (Clark and Zernicke,
1981; Yanohara et al., 2014).

45
2.3.6 Postural stability during perturbed upright standing
During activities of daily living, we are often faced with unexpected perturbation
which may jeopardize the postural stability system. Such external perturbations include
tripping, sudden stop or start, being pushed or pulled and slippery or uneven surface.
Hence, response to destabilisation caused by unexpected perturbation is vital to examine
the integrity of the sensory and motor processes involved in stability control (Winter et
al., 1990a). To create the unexpected perturbation, researchers used movable support
surface (translation or tilting surface) and/ or visual conditions while a person maintains
his postural stability (Mancini and Horak, 2010). For instance, postural stability during
platform tilting requires the activation of posterior muscles of the leg and trunk to
control forward sway while the anterior muscles of the leg and trunk are responsible to
control back sway (Winter, 1995). Sensory perturbations also serve as an alternative to
determine whether a person can re-weight the available sensory information by
identifying sensory conditions and to increase reliance on the accurate sensory available
to maintain postural stability in altered environments (Mancini and Horak, 2010).
2.3.7 Postural stability control during upright standing in lower-limb amputees
Individuals with lower limb amputation represent a unique rehabilitation group
due to the total loss of neuromuscular and skeletal muscles. Specifically in a below-
knee amputee, the significant role of the ankle joint complex in maintaining balance is
jeopardized due to the replacement of the joint complex with prosthetic components
with reduced joint mobility and muscle strength (Blackburn et al., 2000; Vanicek et al.,
2009). Moreover, it has been shown that an injured ankle joint suffers not only from
damaged anatomical structures, but also causes deficit to the mechanoreceptors to
convey appropriate information to the CNS (Blackburn et al., 2000). As such, it is

46
reasonable to corroborate that a total loss of such joint will give major impact to the
ability of controlling postural stability in person with below-knee amputation. In fact,
excessive postural instability which may cause falling can occur especially in
challenging sensory conditions due to the loss of somatosensory input from the muscles,
tendon and skin of the amputated leg (Horak, Shupert and Mirka, 1989). Hence it is not
surprising when community-living lower-limb amputees are reported with increased
risk of falling compared with age-matched, able-bodied people, with 52% of amputees
having experienced a fall within a 12-month period (Miller, Speechley and Deathe,
2001b).
Realizing the importance of understanding the reorganization of postural
stability in individuals with lower limb amputation, researchers have shown interest in
providing evidence-based studies to identify the underlying factors controlling postural
stability. Previous studies reported that amputees suffer deteriorating balance function
due to several influential factors. Although changes in postural control in amputees have
been studied, the results have been conflicting. In general, it was accepted that the
person with lower-limb amputation exhibited greater body sway than the healthy person
(Buckley et al., 2002; Duclos et al., 2009; Jayakaran, Johnson and Sullivan, 2015
Orechovska et al., 2015a).
Particularly when compared to a healthy normal group, the below-knee amputee
group demonstrated significant increased postural instability in medial-lateral direction
during upright standing while looking straight ahead and with eyes-closed
(Hermodssson et al, 1994). Similarly, dysvascular elderly amputees with lower scores
of circulatory status were associated with greater standing instability in medial-lateral
direction (Quai, Brauer and Nitz, 2005). Whereas Bolger and associates (2014) found
conflicting evidence that the CoM displacement and stability margin were similar

47
between individuals with transtibial limb loss and matched controls during randomly
applied multi-directional support surface translations. Nevertheless, greater CoP
displacement was found in the intact leg during anterior-posterior perturbations, and
under the prosthetic leg in medial-lateral perturbations (Bolger et al., 2014).
Cause of amputation is another parameter that can influence standing stability. It
has been shown that standing imbalance is more apparent in vascular amputees
compared to non-vascular amputees (Hermodsson et al., 1994; Molina-Rueda et al.,
2016). In contrast, another study showed that postural control in the dysvascular
amputation group was not different from the traumatic amputation group in altered
sensory conditions (Jayakaran et al., 2015). Additionally, shorter residual limb is
associated with poor stance balance due to major loss of proprioceptive sensory at the
lower leg (Lenka and Tiberwala, 2007; Orechovska et al., 2015b). In regards to the level
of amputation, transfemoral amputees exhibit poor balance performance compared to
transtibial amputees due to the missing knee joint combined with greater asymmetry in
the loading distribution and increased deviations of the CoM in intact leg (Fernie and
Holliday, 1978; Rougier and Bergeau, 2009). Another common consensus from
previous studies was that standing load distribution was greater on the intact leg than
the amputated leg (Nederhand et al., 2012; Hlavackova et al., 2011; Duclos et al., 2009;
Vrieling et al., 2009). Overall, person with lower-limb amputation faced with poor
postural stability control despite the amputation aetiology or level which suggests that
the residual limb is not sufficient to completely compensate for the foot as a source for
proprioception sensory inputs (Quai et al., 2005).
Although the type of prosthetic knee joint, suspension and socket may influence
the standing stability, there is not enough evidence to support such notion (Kamali et
al., 2013; Lenka and Tiberwala, 2010). Nevertheless, modifications of prosthetic

48
alignment in the sagittal plane was shown to negatively affect the movement strategy in
controlling postral stability in belo-knee amputees (Kolarova, Janura, Svoboda and
Elfmark, 2013)
Interestingly, the passive mechanical properties of the prosthetic foot, one of
which is the stiffness, have been suggested to influence stability control in anterior-
posterior direction among below-knee amputees (Buckley et al., 2002; Curtze et al.,
2012; Kamali et al., 2013; Nederhand et al., 2012). In fact, the work of Vittas and
associates (1986) showed a reduced body sway in AP and ML direction compared to
healthy person which may be due to the stiff ankle of the prosthetic foot. Some
researchers suggested the stiffness of prosthetic foot provides an external torque to the
knee joint to sustain its stability (Johannesson et al., 2010, Mackenzie et al., 2004).
While these previous studies hypothesized the possible role of prosthetic
stiffness in postural stability control, only Nederhand and co-workers (2012) objectively
assessed the relationship between the ankle stiffness of the different prosthetic feet of
the amputees and the balance performance during the platform perturbations. From the
findings, the prosthetic ankle stiffness was significantly correlated with the dynamic
balance control in above- and below-knee amputees. By considering the positive
correlation between stiffness and balance control, it may augment the hypothesis that
the choice of prosthetic feet with specific properties can influence the postural stability
during upright standing. As such, they argued that stiffer prosthetic foot coupled with
balance training could improve the motor skills in utilizing the prosthetic foot as a
stabilising mechanism. However, due to the heterogeneity in terms of amputation level
and prosthetic feet types involved in this study, the authors urged for further
investigation with repeated testing using different prosthetic feet in one user.
49
2.4 Quantitative instrumented assessment of postural stability balance
2.4.1 Overview
Previous studies have assessed balance during upright standing in lower limb
amputees using various approaches. Balance can be assessed by means of four
conditions which are static, dynamic, anticipatory and reactive (Yim-Chiplis and Talbot,
2000). Static balance is defined as the ability to maintain the CoM within BoS during
quiet upright standing or sitting. Dynamic balance occurs when upright posture is
maintained while both CoM and BoS are moving. Anticipatory balance is the ability to
maintain balance during expected perturbation. Reactive balance is the ability to
respond to unexpected perturbation. Due to the complexity of balance control,
qualitative and quantitative assessments have been developed to evaluate balance in
individuals with balance deficits. In clinical practice, general functional balance of
amputees is assessed using the qualitative clinical screening instruments in order to
determine whether or not balance deficit exists and if treatment is needed (Horak, 1997).
Several validated questionnaire tools such as Prosthesis Evaluation
Questionnaire (Miller et al., 2001a), Houghton Scale (Devlin, Pauley, Head and
Garfinkel, 2004), Berg Balance Scale (Wong, Chen and Welsh, 2013) and Locomotor
Capabilities Index (Franchignoni et al., 2007) have been used to assess self-perceived
balance capability. While these assessments provide useful information on the balance
abilities, they provide limited information on the underlying balance impairments.
Technological advancements have introduced quantitative measurements to objectively
assess balance to identify the cause of balance deficits, assess balance improvement as
well as for balance training purposes (Yim-Chiplis and Talbot, 2000). Assessments
using the force platform (Buckley et al., 2002; Curtze et al., 2012; Hermodsson et al.,
1994; Nederhand et al., 2012), motion analysis system (Lee, Lin and Soon, 2007), and
50
computerized dynamic posturography (Barnett et al., 2012; Vanicek et al., 2009) have
been used to objectively quantify balance in people with lower limb amputation.
The most common clinical instrument used for postural stability assessment is
the measurement of center of pressure (CoP) using the force platform, which is not
sufficient to explain the control of standing posture (Winter et al., 1990a; Winter, 1995;
Yim-Chiplis and Talbot, 2012). Results from other assessment methods such as star
excursion balance test (SEBT) are difficult to relate to activity of daily living (Cachupe,
Shifflett, Kahanov and Wughalter, 2001). Therefore, postural balance assessment with
various standing conditions coupled with alterations of sensory input is necessary in
order to obtain a more comprehensive analysis of the mechanism underlying the
postural control of human.
Since balance is considered as one of the critical deciding factors that affect
prosthesis prescriptions (Stark, 2005), several studies related to balance in amputees
have been designed to explore the mechanism involved in the control of balance.
Hence, the current systematic review aims to summarize the available evidence on the
quantitative instrumental aspects of balance assessment on individuals with lower limb
amputation during upright standing.
2.4.2 Methodology for systematic review
A computerized search was performed with the use of four online databases:
PsychInfo (from 1806 to 2014, PubMed (from 1949 to 2014), Embase (from 1949 to
2014), and Web of Knowledge (from 1980 to 2014). The searched terms used included
#1: stabil* OR balance OR equilibrium OR postur*, #2: amput*, #3: assessment OR
evaluation OR measurement, and #4: walk* OR run* OR* stairs*. Then, these specific

51
search phases were combined using the Boolean operators for the search of (#1 AND #2
AND #3) NOT (#4). A supplementary manual search from the reference list of retrieved
articles was also performed to identify any relevant articles that were not listed in the
database search.
The next stage is to determine the selection criteria for articles obtained from the
search. The titles and abstracts of all articles found from electronic and manual search
were independently screened for potential eligibility. A risk of bias assessment was
conducted independently by two reviewers in order to determine the quality of the
included studies. Next, all eligible articles were further screened for inclusion and
exclusion criteria. Articles were included if they met the following selection criteria: (1)
written in English, (2) instrumented assessment of static and dynamic balance in lower-
limb amputees, and (3) amputees participant aged 18 years and above. The exclusion
criteria were as follows: (1) studies on balance during activities other than standing, (2)
studies in which the stepping strategy was used, (3) single-case studies, (4) not original
article (e.g: expert opinions, literature reviews, comment/ letter to Editor, proceedings,
dissertation) and (5) articles that were published in magazines or newsletters. An
additional exclusion criterion for selected articles was those studies that involved
participants with other medical conditions that can affect their balance, such as
orthopedic, neurologic, or rheumatic disorders. Full-text articles were assessed if
information from the titles and abstracts was not sufficient for article selection decision.
Disagreements between the two reviewers were resolved by discussion with a third
reviewer to reach a consensus.
Validated assessment tool to critically appraise balance studies in lower limb
amputees has not been yet established. Therefore, the methodology quality of the
selected articles was evaluated with a purpose-designed checklist adapted from previous

52
studies (Downs and Black, 1998; Mazaheri, Coenen, Parnianpour, Kiers and van Dieen ,
2013; van der Linde et al., 2004). This checklist consists of three major aspects with a
total of 14 criteria (Table 2.3). The first aspect, which was ‘participants’ selection’,
consists of the following eight criteria on randomization and functional homogeneity:
gender, age, weight, height, activity level, cause of amputation, and level of amputation.
According to the Medicare Functional Classification Level (MFCL), the four activity
levels are as follows: household ambulator (K1), limited community ambulator (K2),
community ambulator (K3) and high level user (K4) (Gailey et al., 2002).
The ‘balance assessment’ aspect consists of the following four criteria:
acclimation period, type of balance assessment, parameters of the outcome measures,
and the information on the prosthesis. The final aspect was ‘statistical validity’, in
which two criteria were assessed in terms of the appropriate statistical test (parametric
or non-parametric) and information on the statistical results. The possible maximum
score is 14, with a higher score indicating better methodology quality. Each criterion
was scored as either “1” for a “yes” answer or “0” for a “no/invalid/not provided/not
clear” answer. When a criterion was not applicable, it was not counted for the final
scoring. Consultation from the third reviewer was required when disagreement occurred
between the two reviewers (during the scoring process. In this review, a comparison
was made on the methodological quality of the studies rather than on the differences
between the control and transtibial or transfemoral groups.

53
Table 2.3: Criteria used for quality assessment of the reviewed articles.
Criteria Indication Scores
Participants selection
1.Randomization Sequence of test
1=Yes, 0=No/
Not reported
1=For study that
consider
confounding
effect of each
parameters,
0=Not
considered / Not
reported
2.Control of functional
homogeneity
2A Gender
2B Age
M/F
Years
2C Weight Kilogram, kg
2D Height Meter, m
2E Activity level K1/K2/K3/K4 or high/ low
2F Cause of amputation
2G Level of amputation
Vascular/ Non-Vascular
(VD,T,C, CR)
PFA/ TT/ TF
Balance assessment
1=For study that
provide any
information for
each item, 0=
Not provided
/not clear /
invalid
3.Acclimation period
4.Type of balance
assessment
Days/ weeks/ months
Static/Dynamic
5.Outcome measures
parameters
For example: Stability index/
CoP-related parameters/ load
distribution/ joint moments
6. Prosthesis information
Prosthetic foot/ knee/ socket /
suspension
Statistical validity
7. Use of appropriate
statistical test
Appropriate statistical tests were
used to assess differences in
balance
1=Yes, 0=No/
Not provided
8. Sufficient information on
statistical results
Actual probability (e.g p=0.035
rather than p<0.05) and standard
deviation was reported
Note. F: Female: M: Male: K: activity level based on Medicare Functional Classification Level (MFCL);
VD: Vascular disease; T: Traumatic; C: Congenital, CR: Carcinoma; Static: assessment during quiet
standing without perturbation; Dynamic: assessment during standing with internal or external
perturbation; PTB: Patellar tendon bearing; SPTB: Supracondylar patellar tendon bearing; TSB: Total
surface bearing; PFA: Partial foot amputation; TT: Transtibial; TF: Transfemoral.
After the final selection of articles, important information listed in the
methodology quality criteria was extracted. Other additional pieces of information, such
as the first author’s name, year of publication, study size, participants’ demographic
data, type of balance assessment, type of perturbation, test conditions, foot position, test
equipment, and outcomes measured, were tabulated.
54
Furthermore, because prosthetic mechanisms may affect the control of standing
posture in lower limb amputees, we extracted information on the types of prosthetic
knee, foot, suspension, and socket. The results on muscle strength and subjective
balance test scores were not extracted. Instead of using their commercial names, we
classified the prosthetic feet used in the studies according to its type: conventional,
single-axis, multi-axis, and energy savings and return (ESAR) foot (Hafner, 2006).
2.4.3 Results obtained from systematic search
A total of 461 articles were initially retrieved from the electronic search: 150
from PsychInfo, 166 from Medline, 69 from Embase, and 76 from Web of Knowledge.
Another 12 articles were found from the references of related articles. After the articles
were further screened for duplicates, 451 articles remained for title and abstacts
screening (Figure 2.18). After applying the inclusion/ exclusion criteria, another 407
articles were eliminated. The most common rejection reasons were due to studies being
unrelated to balance, not original articles, studies other than standing and only recruited
able-bodied participants. A total of 44 articles were assessed for eligibility. Of these, 10
articles had to be excluded because of the absence of a full-text version. In total, 34
articles were included in the review. The process of inclusion and exclusion was based
on the Preferred Reporting Items for Systematic Reviews and Meta-Analyses
(PRISMA) flow diagram (Moher, Liberati, Tetzlaff and Altman, 2009).

55
For this section, references from reviewed articles are tabulated in a table in
Appendix B. A summary of the participants of the studies included in the review is
reported in Table 2.3. In total, 552 people with lower limb amputation (356 or 65%
transtibial, 167 or 30% transfemoral, 21 or 4% partial-foot amputation, 8 or 1% knee
disarticulation) and 425 able-bodied people had participated in the studies. Twenty-
eight studies were conducted based on the same type of amputation, which was
transtibial, transfemoral, or partial foot. Another eight studies failed to separate the
participants according to their types of amputation (Appendix B1).
Figure 2.18: Flow chart of article selection process according to PRISMA guidelines.
The age of the amputee participants ranged from 24 to 72 years. A total of 18
studies (53%) included a control group in their protocol, whereby 15 of them involved
age-matched able-bodied adults (Appendix B2). In addition, four studies mentioned
about the amputees’ activity level based on the Medicare Functional Classification

56
Level (MFCL), nine studies provided complete demographic information (age, weight,
height, gender) of all participants, 20 studies reported on the years of post-amputation,
and only two studies mentioned the acclimation period to test the prostheses (Appendix
B3). Among the selected studies, 16 studies grouped the participants into either the
vascular or non-vascular group (Appendix B4). Of the reported etiology, 185 of the
amputation had been an outcome of vascular reason and 202 of non-vascular (trauma,
carcinoma, congenital, unknown disease) reason. However, five of the reviewed studies
have not mentioned the cause of amputation (Appendix B5).
About 94% of the studies (32/34) provided incomplete information on the
prosthesis components used during the evaluation of balance in the amputees (Appendix
B6). In addition, only three studies were found to have amputees wearing the same type
of prosthetic foot and six studies using the same type of socket for each of the
participants to control the confounding effect it may cause (Appendix B7). Among the
studies that mentioned the type of prosthetic foot, eight studies used the conventional
foot, seven used the ESAR foot, seven used the multiaxial foot, and two used the single
axis foot (Appendix B8). The most common prosthetic knee joint used for transfemoral
amputees was the microprocessor knee, followed by the polycentric, hydraulic and
mechanical passive knees.
The details of the experimental protocols used in the reviewed studies are listed
in Table 2.4. A total of 25 studies measured balance during static double leg standing,
four during single leg standing on intact leg and two during single leg standing on
prosthetic leg (Appendix B9). Dynamic balance because of unexpected or expected
perturbations during bipedal standing was reported (Appendix B10). Balance was
mostly assessed with the use of a force platform in 53% (18/34) of the studies, followed
by computerized posturography, displacement transducers and motion analysis system

57
(Appendix B11). A combined assessment approach involving the force platform and
motion analysis system or goniometer was reported in seven studies (Appendix B12).

58
Table 2.4: Summary of study characteristics.
First author (Year) Study size
(N)
Sex
(F/M)
Age range/
mean(s.d)
(years)
Weight
range/
mean(s.d)
(kg)
Height
range/
mean (s.d)
(m) Am
pu
ta
-tio
n
Cau
se
Act
ivit
y
level
Post
-
am
p
Acc
lim
.
tim
e
Prosthesis intervention
Nederhand et al. [2012] 6TF
8TT
6AB
5M 1F
7M 1F
NP
45-63
33-62
NP
60-90
60-105
NP
1.64-1.84
1.73-1.94
NP
9T, 1CG,
2VD, 2C
K3
K3
1-32 NP
NP
Knee : HYD, MP, POLY
Foot : SA, ESAR
Susp. : PL, S
Socket: NP
Barnett et al. [2012] 7TT 7M 44-70 77-107 1.74-1.93 4VD,
3 non-VD
NP NP NP Foot : MA, ESAR
Susp.: NP
Socket: NP
Curtze et al. [2012] 15TT
13AB
15M 13M 55.1 (9.8)
53.1 (10.6)
92.5 (13.9)
87.2 (10.1)
1.83 (0.5)
1.87 (0.6)
10T, 1CG,
4VD
NP 2-44 NP Foot : CF, MA, ESAR
Susp.: NP
Socket: NP
Mayer et al. [2011] 10TTa
18TTb
8M 2F 12M
6F
61.1 (10.5)
64.8 (9.5)
82.9 (17.2)
65.8 (16)
1.72 (0.1)
1.64 (0.1)
21 VD NP 4.2
5.6
NP Foot : CF
Susp.:CL
Socket: PTB
Hlavackova et al.[2011] 8TF NP 26.1 (13.5) NP NP 8VD NP 6 NP NP
Mohieldin et al. [2010] 14TT/ 7TF,
20AB
20M 1F
18M 2F
45.2 (1.8)
41.3 (3.1)
NP
NP
NP
NP
15T, 6VD NP 0.2 NP Knee : NP
Foot : CF, MA, ESAR
Susp. : PL
Socket: NP
Lenka & Tiberwala [2010] 20TT NP 34.3 (9.6) 63.3 (3.7) 1.61 (2.8) NP NP NP NP Foot : CF
Susp.: NP
Socket: PTB

59
Table 2.4, Continued
First author (Year) Study size
(N)
Sex
(F/M)
Age range/
mean(s.d)
(years)
Weight
range/
mean(s.d)
(kg)
Height
range/
mean (s.d)
(m) Am
pu
-
tati
on
Cau
se
Act
ivit
y
level
Post
-
am
p
Acc
lim
.
tim
e
Prosthesis intervention
Vanicek et al. [2009] 5TTe
4TTf
5ABe
4ABf
5M
2M 2F
4M 1F
1M 3F
54 (14)
64 (15)
52 (16)
72 (5)
76(13)
77(21)
78 (13)
82 (14)
1.77(0.1)
1.66(0.2)
1.78(0.2)
1.67(0.1)
6T, 1CG,
2VD
NP
NP
4
13
NP
NP
Foot : MA
Susp.: NP
Socket: NP
Hlavackova et al.[2009] 12TF NP 64.7 (6.3) NP NP 12T NP 14 NP NP
Rougier & Bergeau [2009] 15TT
11TF
13M 2F
9M 2F
41.7 (11.3)
49.6 (16.8)
74(14.3)
75.9(17.1)
1.75(0.1)
1.7 (0.1)
15T 11T NP
NP
NP
NP
NP
NP
Knee : NP
Foot :MA, ESAR
Susp. : NP
Socket: NP
Kozakova et al. [2009] 21TT 16M 5F 64.4 (9.2) 85(16.3) 1.74 (7.5) 8T, 1C,
12VD
K1/
K3
0.4 NP NP
Kanade et al. [2008] 16PFA
22TT
15M 1F
20M 2F
62.1(8.8)
62.9(6.1)
93.9 (18.9)
95.5 (14.7)
1.76 (8.7)
1.74 (5.3)
38VD NP NP NP Foot : NP
Susp.: NP
Socket: TSB/ PTB
Vrieling et al. [2008a] 5TT/ 3TF
9AB
6M 2F
8M 1F
51.8(12.7)
44.8(9.9)
83.3(9.7)
85.6(9.1)
1.78(0.09)
1.84(0.07)
5T, 1VD,
2C
NP 21 NP Knee : POLY
Foot : CF,MA,
ESAR
Susp.: NP
Socket: NP
Duclos et al. [2007] 9TT/ 4TF/
1KD, 18AB
NP
NP
43(10)
37(10)
NP
NP
NP
NP
13T, 1C NP 5 NP NP

60
Table 2.4, Continued
First author (Year) Study size
(N)
Sex
(F/M)
Age range/
mean(s.d)
(years)
Weight
range/
mean(s.d)
(kg)
Height
range/
mean (s.d)
(m) Am
pu
-
tati
on
Cau
se
Act
ivit
y
level
Post
-
am
p
Acc
lim
.
tim
e
Prosthesis intervention
Yazicioglu et al. [2007] 9TT/3PFAg
10TT/2PFAh
NP 28.3(4.6)
29.8(1.4)
NP NP 24T NP 12 NP NP
van der Kooij et al. [2007] 4TF
6AB
3M 1F
NP
49-63
NP
NP
NP
NP
NP
2T, 1VD,
1C
K3
NP NP
Knee : MP, POLY
Foot : CF,SA, ESAR
Susp. : NP
Socket: NP
Lee et al. [2007]
7TT 5M 2F 24-60 53-70 1.53-1.67 NP NP 9 NP NP
Kaufman et al. [2007] 15TF 12M 3F 26-57 NP NP 7T, 6C,
1VD, 1CG
K3/
K4
20 18
weeks
Knee : MC, MP
Foot: NP
Susp. : NP
Socket: NP
Mouchnino et al. [2006] 5TT
5AB
5M
5M
34 (15)
NP
NP
NP
NP
NP
5T NP NP NP NP
Quai et al. [2005]
22TT 16M 6F 54-86 44-123 1.5-1.8 22VD NP 3 NP
NP
Matjacic & Burger [2003] 14TT NP 38-70 NP NP 14T NP 9 NP Foot : NP
Susp.: NP
Socket: SPTB
Buckley et al. [2002] 3TT/3TF
6AB
6M
6M
25.7 (5.8)
24.7 (2.7)
NP
NP
NP
NP
6T
NP
NP
NP
Knee : HYD, MP
Foot : MA
Susp.: PL, WB
Socket: PTB, QD

61
Table 2.4, Continued
First author (Year) Study size
(N)
Sex
(F/M)
Age range/
mean(s.d)
(years)
Weight
range/
mean(s.d)
(kg)
Height
range/
mean (s.d)
(m) Am
pu
-
tati
on
Cau
se
Act
ivit
y
level
Post
-
am
p
Acc
lim
.
tim
e
Prosthesis intervention
Nadollek et al. [2002]
22TT NP 71.7 (9.6) 80.9 (22) 1.7 (0.1) 22 VD NP 3 NP
Foot : NP
Susp.: CU, PL
Socket: SPTB, PTB
Viton et al. [2000] 5TT
5AB
5M
5M
34.8
NP
NP
NP
NP NP 5T NP NP NP Foot :CF
Susp.: NP
Socket: TSB
Blumentritt et al. [1999] 5TT NP 37-70 61-105 1.68-1.83 4T, 1D
NP 4-52 NP Foot : CF, ESAR
Susp.: NP
Socket: SPTB
Mouchnino et al. [1998] 5TT
5AB
5M
5M
24-59
24-59
NP
NP
NP
NP
5T NP NP NP NP
Aruin et al. [1997] 6TT
6AB
5M 1F
5M 1F
53.3 (8.1)
54.5 (10.5)
80.4(3.1)
77.8(3.7)
1.76(0.02)
1.72 (0.04)
NP NP 22 NP NP
Hermodsson et al. [1994] 18TTc
18TTd
27AB
12M 6F
15M 3F
19M 8F
68.8 (12)
63.9 (10)
69.6 (9.8)
NP
NP
NP
NP
NP
NP
18VD
18T
NP
NP
6
24
NP
NP
NP
NP
NA
Geurts & Mulder [1994]
3TF/4TT/5KD
12AB
8AB
9M3F
9M3F
4M4F
59.4 (18.3)
58.9 (18.3)
24.9 (2.4)
NP
NP
NP
NP
NP
NP
9 VD,
3 non-VD
NP 0.2 NP NP

62
Table 2.4, (Continued)
First author (Year) Study size
(N)
Sex
(F/M)
Age range/
mean(s.d)
(years)
Weight
range/
mean(s.d)
(kg)
Height
range/
mean (s.d)
(m) Am
pu
-
tati
on
Cau
se
Act
ivit
y
level
Yea
rs
post
-
am
p
Acc
lim
.
tim
e
Prosthesis intervention
Isakov et al. [1992]
11TT
9AB
11M
9M
64.8 (9.2)
65.6 (8.6)
NP
NP
NP
NP
11 VD NP NP 1-2
days,
3-4
week
NP
Vittas et al. [1986] 20TT 18M 2F 16-76 NP NP 8T, 12VD NP NP NP Foot : NP
Susp.: NP
Socket: PTB
Fernie & Holliday [1978]
50TF
29TT
134AB
NP
NP
NP
53
58
50
NP
NP
NP
NP
NP
NP
NP NP NP NP NP
Dornan et al. [1978] 39TF
105AB
NP
NP
55
50
NP
NP
NP
NP
NP NP NP NP NP
Note. AB: Able-bodied; PFA: Partial foot amputation; TT: Transtibial; KD: Knee disarticulation; TF: Transfemoral; F: Female; M: Male; VD: Vascular Disease; T: Traumatic; CG: Congenital;
C: Cancer; D: Disease; K –level: Medicare functional classification; CF: conventional foot; SA: single axis; MA: multi axial; ESAR: Energy storage and return; MC: Mechanical passive knee;
POLY: Polycentric; HYD: Hydraulic; MP: Microprocessor; CL: Cotton liner; CU: Cuff; L: Liner; S: Suction; PL: Pin-Lock; WB: Waist-belt; PTB: Patellar tendon bearing; SPTB: Supracondylar
patellar tendon bearing; TSB: Total surface bearing; QD: Quadrilateral; NP: Not provided; NA: Not applicable; a: skilled prosthesis users; b: first-fitted amputees; c: vascular group; d: trauma group;
e: faller; f: non-faller; g: footballer amputees; h: non-footballer amputees.

63
During the balance assessment, the standardization of the stance position was
reported in 62% of the studies, another 18% allowed the self-selected stance and 20%
did not mention such information (Appendix B13). The distance between the two feet
ranged from 3 cm to 30cm with an angle of 90 to 300 from the sagittal plane. For studies
that reported the number of trials and its durations, most authors had conducted between
two to five repetitions of measurements with 20-30 seconds trial duration (Appendix
B14). Twelve studies instructed the participants to place their arms at the side of their
body, whereas eight studies instructed the participants to place their arms at their hip,
back or across their chest (Appendix B15). However, the remaining 14 studies failed to
mention this information in their article. Regarding the instruction given, the three most
common instructions provided were to “stand as still as possible”, “stand upright” and
“stand stationary” (Appendix B16).
All included studies manipulated a selection of three major sensory inputs
(visual, vestibular, and somatosensory) to challenge the balance of the participants. A
total of 33 (97%) studies were conducted on the firm surface condition, while only one
study assessed standing balance on a compliant surface by using a 5cm-width foam.
(Appendix B17). In addition, 15 (44%), four (12%), and 15 (44%) studies were
performed with the participants’ eyes open, close and both, respectively (Appendix
B18).
The study protocols and main parameters measured in the reviewed studies are
summarized in Table 2.5. Balance was mainly assessed from the CoM and CoP
variables, such as excursion, velocity, amplitude, and area in 26 (76%) studies
(Appendix B19). Additionally, the weight distribution between the intact and prosthetic
legs was examined in 13 studies (Appendix B19). Stability indexes such as equilibrium

64
score (ES) and composite score were obtained from the NeuroCom Smart Equitest in
four studies, while the Balance Index (BI) score was calculated from KAT Balance
System (Appendix B19). Additionally, the total standing duration during which the
subject maintained balance was reported in four studies (Appendix B19). Results from
other outcomes such as kinematics and moments of the ankle, knee and hip, muscle
activity and strength, limits of stability which assessed the ability to volitionally perturb
balance, as well as the vertical and horizontal components of the ground reaction force
were found to be limited.
The methodological quality scores for all of the reviewed studies are presented
in Table 2.6. Overall, the rating score for half of the reviewed studies (17 articles)
satisfied at least 50% of the listed criteria. The quality score ranged from 21% to 72%.
However, consistent and noticeable weaknesses among the remaining studies with low
scores lie in the absence of information on functional homogeneity of the subjects and
the specific p-value of significant findings.
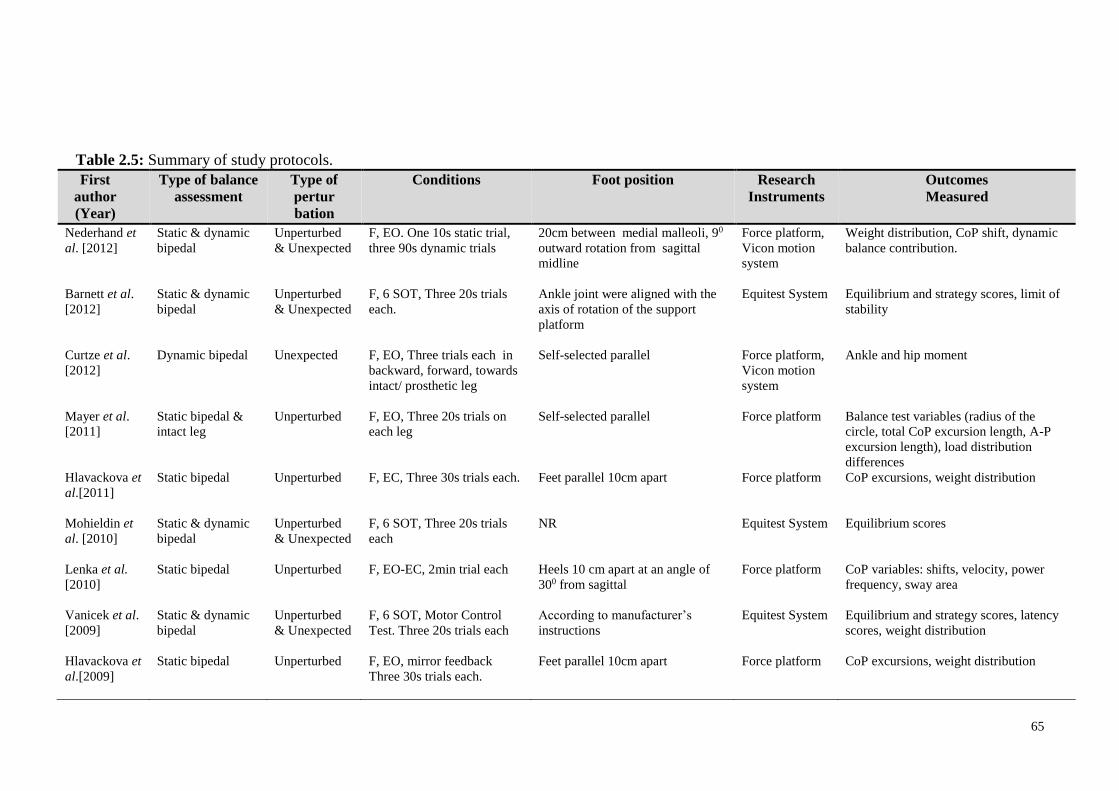
65
Table 2.5: Summary of study protocols.
First
author
(Year)
Type of balance
assessment
Type of
pertur
bation
Conditions Foot position Research
Instruments
Outcomes
Measured
Nederhand et
al. [2012]
Static & dynamic
bipedal
Unperturbed
& Unexpected
F, EO. One 10s static trial,
three 90s dynamic trials
20cm between medial malleoli, 90
outward rotation from sagittal
midline
Force platform,
Vicon motion
system
Weight distribution, CoP shift, dynamic
balance contribution.
Barnett et al.
[2012]
Static & dynamic
bipedal
Unperturbed
& Unexpected
F, 6 SOT, Three 20s trials
each.
Ankle joint were aligned with the
axis of rotation of the support
platform
Equitest System Equilibrium and strategy scores, limit of
stability
Curtze et al.
[2012]
Dynamic bipedal Unexpected F, EO, Three trials each in
backward, forward, towards
intact/ prosthetic leg
Self-selected parallel Force platform,
Vicon motion
system
Ankle and hip moment
Mayer et al.
[2011]
Static bipedal &
intact leg
Unperturbed F, EO, Three 20s trials on
each leg
Self-selected parallel Force platform Balance test variables (radius of the
circle, total CoP excursion length, A-P
excursion length), load distribution
differences
Hlavackova et
al.[2011]
Static bipedal Unperturbed F, EC, Three 30s trials each.
Feet parallel 10cm apart Force platform CoP excursions, weight distribution
Mohieldin et
al. [2010]
Static & dynamic
bipedal
Unperturbed
& Unexpected
F, 6 SOT, Three 20s trials
each
NR Equitest System Equilibrium scores
Lenka et al.
[2010]
Static bipedal Unperturbed F, EO-EC, 2min trial each
Heels 10 cm apart at an angle of
300 from sagittal
Force platform CoP variables: shifts, velocity, power
frequency, sway area
Vanicek et al.
[2009]
Static & dynamic
bipedal
Unperturbed
& Unexpected
F, 6 SOT, Motor Control
Test. Three 20s trials each
According to manufacturer’s
instructions
Equitest System Equilibrium and strategy scores, latency
scores, weight distribution
Hlavackova et
al.[2009]
Static bipedal Unperturbed F, EO, mirror feedback
Three 30s trials each.
Feet parallel 10cm apart Force platform CoP excursions, weight distribution

66
Table 2.5, Continued
First
author
(Year)
Type of balance
assessment
Type of
pertur
bation
Conditions Foot position Research
Instruments
Outcomes
Measured
Kozakova et
al. [2009]
Static bipedal Unperturbed F-C, EO-EC, 30s trials each
for four standing condition
NR Force platform Load distribution, CoP excursion &
velocity
Rougier &
Bergeau
[2009]
Static bipedal Unperturbed F, EO, Five 32s trials
9 cm between heels, 30° angle
between the inner edges of the feet
Force platform Weight bearing, CoP trajectories
Vrieling et al.
[2008a]
Dynamic bipedal Unexpected F, EO-EC single task, EO
double task, 60s trial each
Self-selected Force platform CoP excursion, weight bearing index
(WBI), GRFy, GRFz
Kanade et al.
[2008]
Static bipedal Unperturbed F, EO, Three 30s trials Self-selected parallel Force platform CoP excursion, weight distribution
Duclos et al.
[2007]
Static bipedal Unperturbed F, EC , 60s trial Feet 3cm apart Force platform CoP variables: shifts, velocity, position
Yazicioglu et
al. [2007]
Static single intact,
dynamic bipedal
Unperturbed
Expected
F, EO, 1 trial NR KAT 2000,
dynamometer
Balance index (BI), muscle strength
van der Kooij
et al. [2007]
Static bipedal Unperturbed F, EO-EC, Two 90s trials 20cm between medial malleoli, 90
outward rotation from sagittal
midline
Force platform,
Vicon motion
system
Weight bearing, CoP shift, CoM sway,
dynamic balance contribution (DBC)
Kaufman et
al. [2007]
Static & dynamic
bipedal
Unperturbed
& Unexpected
F, 6 SOT, Three 20s trials
each.
Self-selected parallel Equitest System Equilibrium and composite scores
Lee et al.
[2007]
Static single intact Unperturbed F, EO, Six trials NR Zebris motion
system
CoM displacement, Standing duration
Mouchnino et
al. [2006]
Dynamic lateral
leg raising
Expected F, EO, Twenty 2s trials Heels 10 cm apart at an angle of
300 from sagittal
Force platform,
ELITE motion
system
Kinematics, CoM displacement

67
Table 2.5, Continued
First
author
(Year)
Type of balance
assessment
Type of
pertur
bation
Conditions Foot position Research
Instruments
Outcomes
Measured
Quai et al.
[2005]
Static & dynamic
bipedal
Unperturbed
& Expected
F, EO-EC, Three 40s trials
each
17 cm between heel centers and
14˚ between long axes of the feet
Force platform CoP excursion, weight distribution, limits
of stability, relationship between
circulatory/ somatosensory status and
balance.
Matjacic &
Burger [2003]
Dynamic bipedal Expected F, EO, Five trials
NR Balance
ReTrainer
Balance duration on prosthesis
Buckley et al.
[2002]
Static & dynamic
bipedal
Unperturbed
& Unexpected
F, EO-EC, Three trials each
for 30s static, 20s dynamic
15cm between medial malleoli Force platform CoP excursion, balance time
Nadollek et
al. [2002]
Static bipedal Unperturbed F, EO-EC, One trial each
17 cm between heel centers and
14˚ between long axes of the feet
Force platform CoP excursion, weight distribution
Viton et al.
[2000]
Dynamic bipedal
to monopedal
Expected F, EO, 450 lateral leg raise,
Twenty 3s trials each
Feet parallel 10cm apart Force platform,
ELITE motion
system
Kinematics, CoM and CoP displacement,
EMG
Blumentritt et
al. [1999]
Static bipedal Unperturbed F, EO, 5s NR. Force platform Distance from joint center to load line
Mouchnino et
al. [1998]
Dynamic single
intact/ prosthetic
Expected F, EO, Twenty 2s trials Heels 8 cm apart at an angle of 300
from sagittal
Force platform,
ELITE motion
system
CoP variables , CoM shift
Aruin et al.
[1997]
Dynamic bipedal Expected F, EO, Six trials during
shoulder movement &
catching loads
Feet 30cm apart Force platform ,
goniometer,
EMG electrodes
CoP displacement, Joint kinematic, EMG
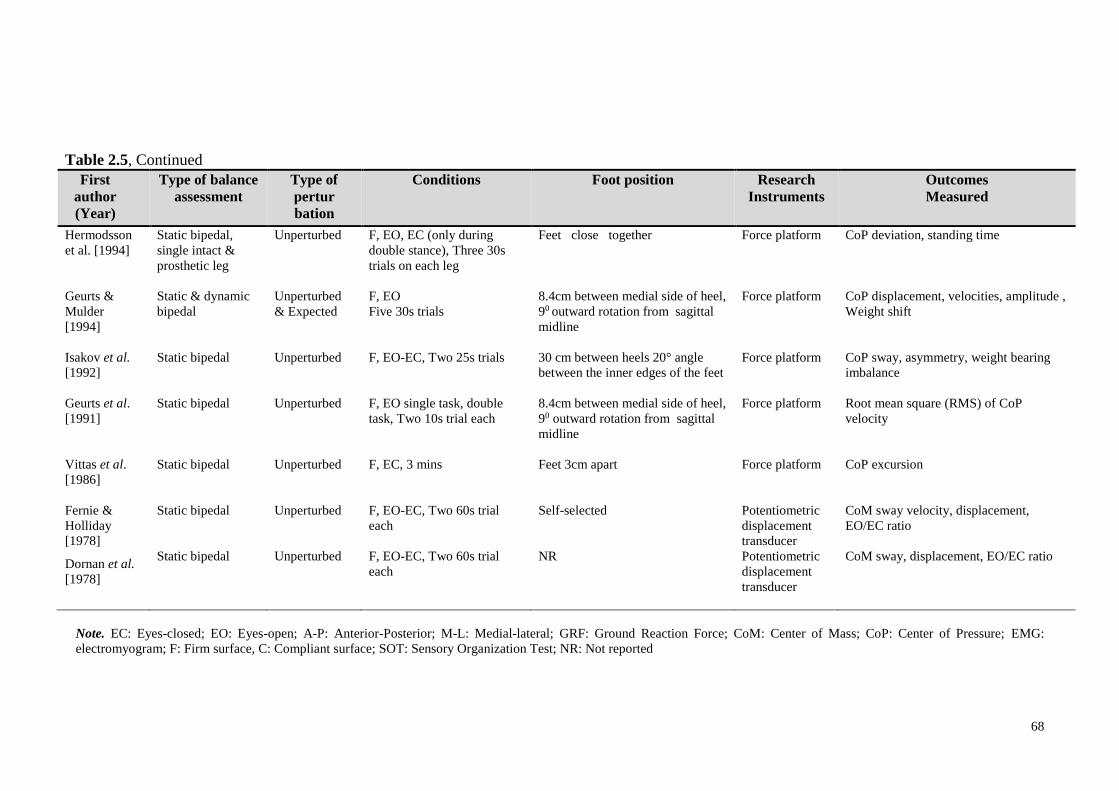
68
Table 2.5, Continued
First
author
(Year)
Type of balance
assessment
Type of
pertur
bation
Conditions Foot position Research
Instruments
Outcomes
Measured
Hermodsson
et al. [1994]
Static bipedal,
single intact &
prosthetic leg
Unperturbed F, EO, EC (only during
double stance), Three 30s
trials on each leg
Feet close together Force platform CoP deviation, standing time
Geurts &
Mulder
[1994]
Static & dynamic
bipedal
Unperturbed
& Expected
F, EO
Five 30s trials
8.4cm between medial side of heel,
90 outward rotation from sagittal
midline
Force platform CoP displacement, velocities, amplitude ,
Weight shift
Isakov et al.
[1992]
Static bipedal Unperturbed F, EO-EC, Two 25s trials 30 cm between heels 20° angle
between the inner edges of the feet
Force platform CoP sway, asymmetry, weight bearing
imbalance
Geurts et al.
[1991]
Static bipedal Unperturbed F, EO single task, double
task, Two 10s trial each
8.4cm between medial side of heel,
90 outward rotation from sagittal
midline
Force platform Root mean square (RMS) of CoP
velocity
Vittas et al.
[1986]
Static bipedal Unperturbed F, EC, 3 mins Feet 3cm apart Force platform CoP excursion
Fernie &
Holliday
[1978]
Static bipedal Unperturbed F, EO-EC, Two 60s trial
each
Self-selected Potentiometric
displacement
transducer
CoM sway velocity, displacement,
EO/EC ratio
Dornan et al.
[1978]
Static bipedal Unperturbed F, EO-EC, Two 60s trial
each
NR Potentiometric
displacement
transducer
CoM sway, displacement, EO/EC ratio
Note. EC: Eyes-closed; EO: Eyes-open; A-P: Anterior-Posterior; M-L: Medial-lateral; GRF: Ground Reaction Force; CoM: Center of Mass; CoP: Center of Pressure; EMG:
electromyogram; F: Firm surface, C: Compliant surface; SOT: Sensory Organization Test; NR: Not reported

69
Table 2.6: Assessment of methodological quality scores of reviewed papers.
First author
[Year]
Assessed criteria Total
(%) 1 2A 2B 2C 2D 2E 2F 2G 3 4 5 6 7 8
Nederhand et al. [2012] 1 0 0 0 0 1 0 0 0 1 1 1 1 0 6 (43)
Barnett et al.[2012] 0 1 0 0 0 0 0 1 0 1 1 1 1 1 7 (50)
Curtze et al. [2012] 1 1 1 0 1 0 0 1 0 1 1 1 1 1 10 (72)
Mayer et al. [2011] 0 0 0 0 1 0 0 1 0 1 1 1 1 1 7 (50)
Hlavackova et al.[2011] 0 0 0 0 0 0 1 1 0 1 1 0 1 0 5 (36)
Mohieldin et al. [2010] 0 0 1 0 0 0 0 0 0 1 1 1 1 0 5 (36)
Lenka et al. [2010] 0 0 0 0 0 0 0 1 0 1 1 1 1 1 6 (43)
Vanicek et al.[2009] 0 0 1 1 1 0 0 1 0 1 1 1 1 1 9 (64)
Hlavackova et al.[2009] 1 0 0 0 0 0 1 1 0 1 1 0 1 0 6 (43)
Rougier & Bergeau [2009] 0 0 0 0 0 0 1 1 0 1 1 1 1 0 6 (43)
Kozakova et al. [2009] 0 0 0 0 0 0 0 1 0 1 1 1 1 0 5 (36)
Kanade et al. [2008] 0 0 1 1 1 0 1 1 0 1 1 1 1 1 10 (72)
Vrieling et al.[2008a] 1 1 1 1 1 0 0 0 0 1 1 1 1 1 10 (72)
Duclos et al. [2007] 0 0 1 0 0 0 0 0 0 1 1 0 1 1 5 (36)
Yazicioglu et al. [2007] 0 0 1 1 0 0 1 0 0 1 1 0 1 1 7 (50)
van der Kooij et al. [2007] 1 0 0 0 0 1 0 0 0 1 1 1 0 0 5 (36)
Lee et al. [2007] 1 0 0 0 0 0 0 1 0 1 1 0 0 0 4 (29)
Kaufman et al. [2007] 0 0 0 0 0 0 0 1 1 1 1 1 1 0 6 (43)
Mouchnino et al. [2006] 1 1 1 0 0 0 1 1 0 1 1 0 1 0 8 (57)
Quai et al.[2005] 1 0 0 0 0 0 1 1 0 1 1 1 1 1 8 (57)
Matjacic & Burger [2003] 1 0 0 0 0 0 1 1 0 1 1 1 1 0 7 (50)
Buckley et al. [2002] 1 1 1 0 0 0 0 0 0 1 1 1 1 1 8 (57)
Nadollek et al. [2002] 1 0 0 0 0 0 1 1 0 1 1 1 1 1 8 (57)
Viton et al. [2000] 1 1 1 0 0 0 1 1 0 1 1 1 1 0 9 (64)
Blumentritt et al. [1999] 1 0 0 0 0 0 0 1 0 1 1 1 0 0 5 (36)
Mouchnino et al. [1998] 1 1 1 0 0 0 1 1 0 1 1 0 1 0 8 (57)
Aruin et al. [1997] 0 0 0 0 0 0 0 1 0 1 1 0 1 0 4 (29)
Hermodsson et al.[1994] 0 0 1 0 0 0 1 1 0 1 1 0 1 1 7 (50)
Geurts & Mulder [1994] 0 0 1 0 0 0 0 0 0 1 1 0 1 1 5 (36)
Isakov et al. [1992] 0 1 1 0 0 0 1 1 1 1 1 0 1 1 9 (64)
Geurts et al. [1991] 0 1 1 0 0 1 0 0 0 1 1 1 1 0 7 (50)
Vittas et al. [1986] 0 0 0 0 0 0 0 1 0 1 1 1 1 0 5 (36)
Fernie & Holliday [1978] 0 0 0 0 0 0 0 1 0 1 1 0 0 0 3 (21)
Dornan et al. [1978] 1 0 0 0 0 0 0 1 0 1 1 0 1 1 6 (43)
Note. 1 indicates randomization during selection of participants; 2A: control of gender; 2B: control of
age; 2C: control of weight; 2D: control of height; 2E: control of activity level; 2F: control of amputation
level; 3: adequate information on acclimation period; 4: adequate information on type of balance
assessment; 5: adequate information on outcome measures parameters, 6A: adequate information on
prosthetic foot type; 6B: adequate information on knee type; 6C: adequate information on socket type;
6D: adequate information on liner type; 7: appropriate statistical test; 8: sufficient information on
statistical results.
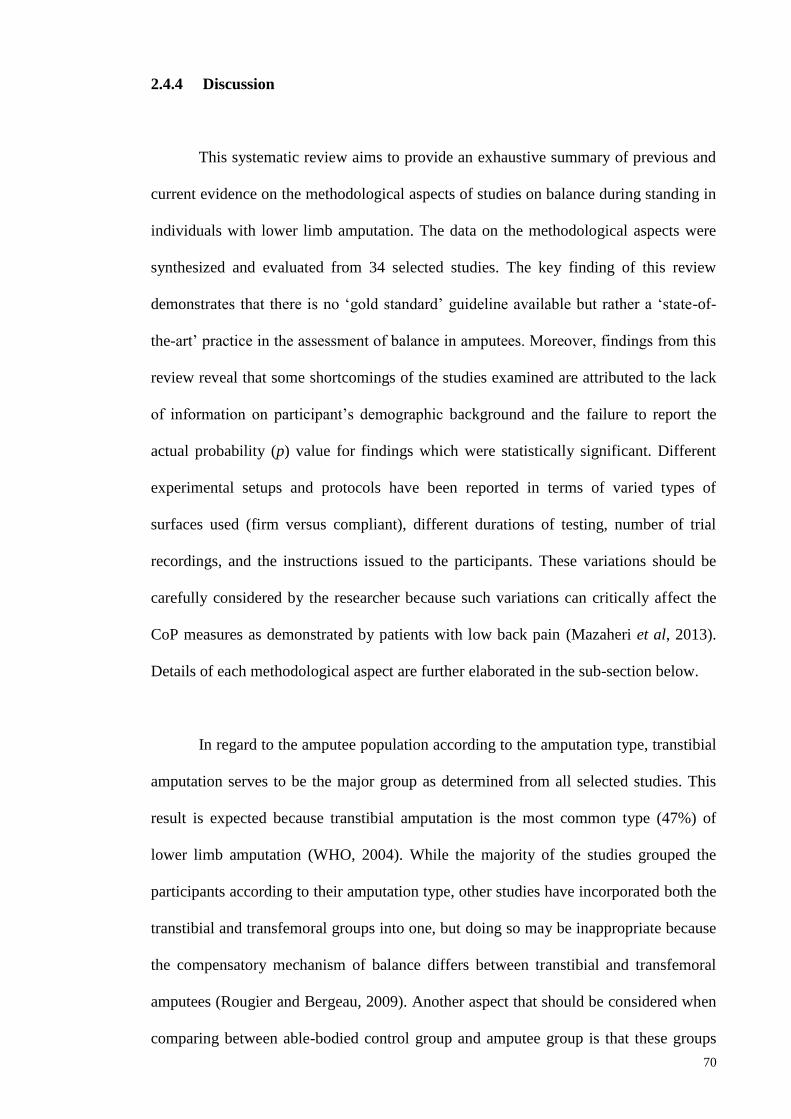
70
2.4.4 Discussion
This systematic review aims to provide an exhaustive summary of previous and
current evidence on the methodological aspects of studies on balance during standing in
individuals with lower limb amputation. The data on the methodological aspects were
synthesized and evaluated from 34 selected studies. The key finding of this review
demonstrates that there is no ‘gold standard’ guideline available but rather a ‘state-of-
the-art’ practice in the assessment of balance in amputees. Moreover, findings from this
review reveal that some shortcomings of the studies examined are attributed to the lack
of information on participant’s demographic background and the failure to report the
actual probability (p) value for findings which were statistically significant. Different
experimental setups and protocols have been reported in terms of varied types of
surfaces used (firm versus compliant), different durations of testing, number of trial
recordings, and the instructions issued to the participants. These variations should be
carefully considered by the researcher because such variations can critically affect the
CoP measures as demonstrated by patients with low back pain (Mazaheri et al, 2013).
Details of each methodological aspect are further elaborated in the sub-section below.
In regard to the amputee population according to the amputation type, transtibial
amputation serves to be the major group as determined from all selected studies. This
result is expected because transtibial amputation is the most common type (47%) of
lower limb amputation (WHO, 2004). While the majority of the studies grouped the
participants according to their amputation type, other studies have incorporated both the
transtibial and transfemoral groups into one, but doing so may be inappropriate because
the compensatory mechanism of balance differs between transtibial and transfemoral
amputees (Rougier and Bergeau, 2009). Another aspect that should be considered when
comparing between able-bodied control group and amputee group is that these groups

71
must have similar body mass because it has been shown that the body mass is an
important risk factor for falling and a predictor of balance (Hue, 2007).
Studies on the balance of amputees should also mention the activity level based
on the MFCL because this tool is considered as the best rehabilitation guidance in terms
of predicting prosthetic outcome (Miller and McCay, 2006). An acclimation period of at
least one week for below-knee amputees and three weeks for above-knee amputees is
suggested before the assessment of the functional effectiveness of the prosthesis
(English, Hubbard and McElroy, 1995). Similarly, lower limb amputees can take part in
balance studies if they have a post-operative period of at least eight weeks because this
period is needed for them to adjust to the static requirements of balance (Geurts,
Mulder, Nienhuis and Rijken, 1991). This review shows that information on
acclimation and the post-operative period of the amputees has not been reported in the
majority of the reviewed studies.
Furthermore, the review indicates that the etiology of lower limb amputation is
mostly due to vascular diseases. This result further supports the previous evidence that
amputations occur as a result of complications in the vascular system, which account for
the majority (82%) of lower limb loss (Dillingham et al., 2002). Since the balance
capacity in individuals with unilateral amputations due to vascular disease is reduced
than that of non-vascular reasons (Hermodsson et al., 1994), researchers should group
their participants into either one of the amputation groups to obtain a result that is
specific to such a population.
In this review, we noticed that evaluating balance in lower limb amputees is
challenged by the heterogeneous types of prosthetic feet used across the studies. The
stiffness characteristics of prosthetic feet have been hypothesized to affect the

72
performance in standing balance (Nederhand et al., 2012). However, only three of the
reviewed studies used the same prosthetic foot for all the participants in the assessment.
The rest of the studies had the amputees wore their usual prostheses causing variations
in types of prosthetic feet which may have influenced the balance performance. The
inconsistencies in the prosthetic components used made the assessment of its effects on
an individual’s response to perturbations difficult. However, this is expected due to the
different goals and objectives in each of the reviewed studies. Future studies which aim
to determine the effect of prosthetic ankle stiffness on the balance of amputees should
systematically manipulate the type of prosthetic foot (for example, a crossover study
with repeated testing) (Nederhand et al., 2012). Additionally, the tested prosthetic foot
should be mechanically evaluated to obtain its stiffness value, which can be used to
establish an objective measure on the relationship between prosthetic stiffness and
balance performance.
The evaluation of balance during bilateral unperturbed standing is the most
common assessment found in this review. Due to the fact that loss of balance occurs
most frequently during movement-related activities, unperturbed (static) tests have been
criticized as inefficient in representing the dynamic nature of balance (Aydog, Bal,
Aydog and Cakei, 2006). Hence, the dynamic balance assessment serves to examine the
ability to accomplish appropriate postural adjustments in responding to expected or
unexpected perturbations in the balance system (Winter et al., 1990a). Our review
further demonstrates that almost all of the studies examined have used bilateral
standing, with the maintaining balance on both limbs as the preferred mechanism.
Balance control during unilateral stance is considered as equally important to avoid fall
in response to unexpected perturbation. Moreover, it has also been used as an indicator
of fall incidence in the amputees (Vanicek et al., 2009), and this factor can be utilized to

73
determine the optimal prosthetic stiffness according to an individual’s balance
performance.
This review indicates that balance assessment with the use of a force platform is
commonly used to obtain various parameters derived from CoP measures, such as
displacement, velocity, amplitude, and area (Melzer et al., 2004). The CoP has been
suggested as the net response of the neuromuscular system at the ankle to the movement
of the CoG, which, although it provides valid outcomes, it is insufficient to explain the
control of posture in both the anterior-posterior and medio-lateral directions (Winter et
al., 1990a). Future studies should be cautious in interpreting parameters that use
minimal, maximal, or peak-to-peak readings, such as the parameter of maximal
amplitude, for instance, because this uses only one or two data points which may cause
great variance and low reliability results (Ruhe, Fejer and Walker, 2010).
Furthermore, comprehensive instruments, such as the NeuroCom Smart Equitest
system (NeuroCom International Inc., Clackamas, US), have been used in several
studies to assess the balance response during dynamic perturbations. The SOT from this
system provides information on the integration of the visual, proprioceptive, and
vestibular components that affect the balance organization (Shumway-Cook and Horak,
1986). General SOT entails measuring postural sway during six different conditions
which calculate the equilibrium score and strategy score. Equilibrium score denotes the
sway amplitude during the maintenance of balance in all SOT conditions, while the
strategy score represents the ability to use the hip/ ankle strategy movements to
maintain balance (Barnett et al., 2012). However, despite the comprehensive data that
NeuroCom Equitest provides, the size and cost of the device prohibit their application in
most of clinical rehabilitation settings (Hinman, 2000). Additionally, the BI score from
the Kinesthetic Ability Trainer (KAT) Balance System may be utilized to evaluate

74
balance in lower limb amputees. This device uses computerized compressed air bladder
which controls the degree of surface instability for dynamic balance assessment and
training (Yim-Chilis and Talbot, 2000).
Some studies have incorporated the motion analysis system to measure the joint
kinematics and center of the mass sway pattern. Although motion analysis has been
shown to provide useful information in measuring total balancing movements of the
body while standing upright in able-bodied people (Kejonen and Kauranen, 2002), the
reliability and validity of this approach in people with amputations are yet to be
reported. Findings from this review highlight the lack of assessment regarding muscle
activity and strength of both intact and amputated legs, while this may exhibit
compensatory changes in postural muscles and the overall pattern of standing in lower-
limb amputees (Aruin, Nicholas and Latash, 1997), we suggest that these factors should
be explored in future research. While a few studies have offered other alternatives in
balance assessment such as using the displacement transducer, this approach may not be
clinically practical.
Another option that we can suggest for future studies is the use of the Biodex®
Stability System (BSS) to enable clinicians to assess neuromuscular control. This
system quantifies the ability to maintain balance on a static or unstable surface on the
basis of computed stability indexes. In contrast to the force platform, this device
consists of a moveable platform which can be adjusted to provide varying degrees of
stability which allows up to 200 of platform tilt in a 3600 range of motion. Thus, the
BSS may provide more specific information on ankle joint movements due to its ability
to measure the degree of platform tilt about anterior-posterior and medial-lateral axes
under dynamic conditions (Arnold and Schmitz, 1998; Salsabili et al., 2011). Moreover,
the BSS system is less expensive and more portable which can be readily used in a

75
clinical setting (Hinman, 2000; Yim-Chiplis and Talbot, 2000). Although previous
studies have established the reliability of this system, it has not been utilized to quantify
balance in amputees (Baldwin et al., 2004; Parraca et al., 2011).
Additionally, the standardization of the position of the feet to 0.17 m between
heel centers, at an angle of 140 between the long axes of the feet, has been hypothesized
to eliminate between-subject variability or biased results (Mcllroy and Maki; 1995).
However, this requirement depends on the specific purpose of the research and the
participants’ physical condition. The most commonly used position of the arms is
alongside the body of the participant because this position helps in maintaining a natural
position during the assessment. Regarding the number and duration of trials on a single
day of assessment, most of the reviewed studies considered the possibility of fatigue in
the amputee population with balance deficit. We also suggest that an average of three to
five trials (Ruhe et al., 2010) that last from 20s to 30s (LeClair and Riach, 1996) should
be considered sufficient to obtain reliable data in balance studies. Similarly, a
standardized explicit instruction to “stand as still as possible” while looking straight
ahead should be given to the participants for consistency (Zok, Mazza and Cappozzo,
2008).
To understand the integration between the sensory inputs from the
somatosensory (proprioceptive, cutaneous and joint), visual, and vestibular systems, a
combination of sensory modifications was adopted to determine the underlying
mechanism on the balance reorganization of individuals with balanced deficits
(Guskiewicz and Perrin, 1996; Shumway-Cook and Horak, 1986). Overall, most studies
manipulate visual inputs with the participants’ eyes open, close, or with visual conflict
during balance assessment. Other studies investigated the effect of somatosensory input
by having the amputees stand on a rigid or compliant surface, a static or moving

76
platform, or a single or bilateral stance. However, none of the studies manipulated
vestibular input by requiring the participants to tilt their head while performing their
balance test.
2.4.5 Limitations of the study
Although we believe that this review presents an up-to-date overview of the
methodology to evaluate balance during standing in persons with lower limb
amputation, a number of limitations in this review must be acknowledged. While
extensive electronic databases and manual searching were conducted, the failure to
identify all relevant studies is possible. Furthermore, we only included studies that were
published in English, and doing so may have introduced publication bias (McGauran et
al., 2010). The purpose-designed checklist was adopted from previous studies that
emphasized on the confounding factors and prosthesis components, and most of the
studies included in this review are lacking these criteria, which may also have attributed
to the low final quality score observed. However, the listings of all details from the
previous studies are important in providing concise and unbiased information for future
balance assessment in amputees. The exclusion of unpublished data such as from theses
or dissertations, as well as conference proceedings may have overlooked some
important information regarding the area of standing balance in amputees.
2.4.6 Conclusion
This review identifies studies presented in scientific articles that assess the
balance of individuals with lower limb amputation. All the reviewed studies provided
general information regarding the instrumentation and outcomes of their studies.
However, the results of this systematic review indicated the non-existence of a

77
standardized methodology to access balance in amputees and the outcomes measured
are varied among different instrumentations used in each study. Nevertheless, the
methodological aspects and measurement outcomes presented in this systematic review
should assist clinicians in choosing the appropriate assessment method according to
their specific goals. Furthermore, most of the studies are lacking important information
on the balance-related factors such as the prosthesis componentry, cause of amputation,
length of residual limb and activity level. Therefore, to enhance our understanding in
this matter, future studies should control these confounding factors which can
potentially influence balance during standing in people with lower limb amputation.

78
2.5 Self-report and functional outcome assessment of balance
The general term of outcome measures are described as “quantifiable
instruments used to define functional capabilities in relation to an intervention
or other influencing variables” (Gailey et al., 2012). Specifically, the term ‘prosthetic
outcomes’ has been defined as “changes in the functional level, health, and quality of
life attributable to the prosthetic device” (Agrawal, 2013b). Often, clinicians who
involve in the clinical prescription, evaluation and rehabilitation of people with limb-
loss may need a tool that can measure the effectiveness of treatment and aid in
evaluating different prosthesis interventions.
Additionally, outcome measures can also be used to determine functional
capabilities, rehabilitation progress, comfort and satisfaction for differentiating
prosthetic intervention (Roach, 2006; Gailey et al., 2012). Ideally, objective or
subjective functional improvement experienced by the amputee should be measurable.
For an example, if a particular prosthetic foot has significantly different characteristics
than another, then it must in some capacity improve the function measured either
objectively or subjectively by the prosthetic user. According to the 6th American
Academy of Orthotists and Prosthetists state-of-the-science conference, the outcome
measures instruments can be categorised into three different groups which are self-
report, professional report and physical performance instruments (Miller & McCay,
2006). While performance-based measurement instruments have been known to provide
objective and accurate outcome measures to determine physical abilities, the self-report
measures offers minimal resources which are easy to administer (Gailey et al., 2012). In
this thesis, five different outcome measurement tools related to lower limb prosthetics
were utilised as discussed in the following sub-sections.
79
2.5.1 Medicare Functional Classification Level (MFCL) (K-Level)
The MFCL consists of five levels classification system that uses code modifiers
known as K-levels which are specified by the Health Care Financing Administration
(HCFA). The functional K-levels ranges from amputee whom are bedbound (K0) to
those engaged in high-level activities (K4) (Table 2.7). The MFCL serves as an
indicator of the capacity and potential of people with lower-limb amputation to
accomplish their activities of daily living (ADL). In relation to this, the MFCL
classification is used by the Durable Medical Equipment Regional Carrier (DMERC) to
establish the prosthesis necessity for the amputees.
2.5.2 Health status questionnaire (SF-12v2)
The Medical Outcomes Study Short-Form version 2 (SF-12v2) is a standardized,
multidimensional health status questionnaire comprised of a 12-items subset of the SF-
36 version 2 (SF-36v2) without substantial loss of information (Cheak-Zamora,
Wyrwich, & McBride, 2009). In fact, the SF-12v2 has been shown to reproduce
physical and mental health summary measures more than 90% of the variance in the
longer version of SF-36 (Ware, Kosinski & Keller, 1996). Scores can be directly
compared between persons with or without impairment due to its non-disease-specific
features. Ware and colleagues have demonstrated good internal consistency reliability
for the Physical Component Summary (PCS) and Mental Component Summary (MCS)
(Cronbach’s alpha of 0.89 and 0.86, respectively); as well as good validity (Ware,
Kosinski, Turner-Bowker & Gandek, 2002).

80
Table 2.7: Definitions for MFCL
K-Level* Mobility Level
0 Does not have the ability or potential to ambulate or transfer safely with
or without assistance, and a prosthesis does not enhance quality of life
or mobility.
1 Has the ability or potential to use prosthesis for transfers or ambulation
in level surfaces at a fixed cadence. Typical of the limited and unlimited
household ambulator.
2 Has the ability or potential for ambulation with the ability to transverse
low-level environmental barriers such as curbs, stairs, or uneven
surfaces. Typical of the limited community ambulator.
3 Has the ability or potential for ambulation with variable cadence.
Typical of the community ambulator who has the ability to transverse
most environmental barriers and may have vocational, therapeutic, or
exercise activity that demands prosthetic use beyond simple
locomotion.
4 Has the ability or potential for prosthetic ambulation that exceeds basic
ambulation skills, exhibiting high impact, stress, or energy levels.
Typical of the prosthetic demands of the child, active adult, or athlete.
*K is an arbitrary letter assigned by the HCFA. Adapted from Gailey et al. (2002).
2.5.3 Houghton Scale
When prosthetic usage is a topic of interest, a reliable and easy-to-administer
tool which can measure prosthetic use is crucial during routine clinical follow-up,
rehabilitation program evaluation, and research (Devlin et al., 2004). Consequently, The
Houghton Scale has been introduced to provide avenue in reflecting a person’s
perception of prosthetic use and wear, rather than a clinician’s viewpoint. This tool,
which has 4 questions giving a total maximum score of 12, provides a quick measure of
prosthetic use since it is easy to administer and score. It has been used in previous
studies of prosthetic use within the amputee population (Akarsu, Tekin, Safaz, Goktepe
& Yazicioglu, 2013; Leung, Rush & Devlin, 1996). In addition, Leung et al. (1996)
have demonstrated that the Houghton score could help to distinguish between those who
81
achieved rehabilitation goal (Houghton score > 9) and those who did not (Houghton
score <9).
When compared to other tools that compare prosthetic use such as Prosthesis
Evaluation Questionnaire (PEQ) and the Locomotor Capabilities Index of the Prosthetic
Profile of the Amputee (PPA), the Houghton Scale has shown acceptable internal
consistency (Cronbach’s alpha of 0.66), good test-retest reliability (ICC=0.85),
appropriate validity and was the only scale that could discriminate between people with
transtibial and transfemoral amputations (Miller et al., 2001a). Although the Houghton
Scale’s has considerably less internal consistency than the other two scales, this aspect
is believed to be unnecessary for psychometric tools. Later, Devlin et al. (2004)
highlighted that the Houghton Scale showed moderate internal consistency (Cronbach’s
alpha of > 0.7), high test-retest reliability (ICC=0.96) and appropriate responsiveness to
change in prosthetic use. Therefore, this scale is recommended for use during
routine clinical session (Devlin et al., 2004).
2.5.4 Berg Balance Score (BBS)
Balance ability was clinically assessed using BBS questionnaires to ensure
similar functional balance status between persons with below-knee amputation and
normal participants. The Berg balance score was developed to measure balance among
adults with impairment in balance function by assessing the performance of functional
tasks. It consists of 14 everyday common tasks which include sitting, standing,
reaching, leaning over, turning and looking over each shoulder, turning in a complete
circle and stepping. Generally, most items require the subject to maintain balance in a
given position for a specific time. During the test, score points will be deducted if the
82
subject fails to perform within the given time, the subject touches an external support or
when the subject's performance involves supervision and assistance from the examiner.
Each item is scored on a scale from 0 to 4, for a maximum of 56 points. A score
of 0–20 indicates a high risk, 21–40 indicates a medium risk, and 41–56 indicates a low
risk of falling. Previous study ascertained that BBS has moderate validity, strong
internal consistency (Cronbach’s alpha >0.7) as well as excellent intra-rater (ICC=0.97)
and inter-rater (ICC=0.98) reliability in geriatric population (Berg, Wood-Dauphinee &
Williams, 1995). Hence, the BBS is a reliable instrument used for the evaluation of the
effectiveness of interventions and for quantitative descriptions of function in clinical
practice and research (Berg et al., 1995).
Due to its effectiveness, studies of BBS feasibility in unilateral transtibial
amputees have been conducted. The BBS exhibited high internal consistency
(Cronbach’s alpha >0.9), good internal consistency (Cronbach’s alpha=0.83) and has no
floor or ceiling effects (Lung et al., 2006). A Rasch rating scale analysis by Wong,
Chen and Welsh (2013) indicated excellent validity and high reliability properties of the
BBS when tested in community dwelling adults with leg amputation. Therefore, with
good psychometric properties, the BBS can be considered as a valid and reliable clinical
instrument for assessing balance in people with lower-limb amputation.
2.5.5 Activities-specific Balance Confidence (ABC)
The evaluation of balance self-efficacy will be evaluated using the ABC scale
which is a psychometric measure that comprised of 16 items questioning about an
individual’s balance confidence in different situations. High test-retest reliability for the
overall scale has been reported among community dwelling elderly (ICC=0.92) and

83
lower limb amputees (ICC=0.91) (Miller, Deathe & Speechley, 2003; Powell & Myers,
1995). The scale has been showed to have excellent internal consistency (Cronbach’s
alpha of 0.95) and good validity (Miller et al., 2003).
In recent years, the ABC scale has been applied in research involving people
with lower-limb amputation. Researchers utilised the ABC score to evaluate gait
performance (Ferraro, 2011; Vrieling et al., 2007) and balance control (Curtze et al.,
2012; Vrieling et al., 2008b) in persons with unilateral lower limb amputation.
However, none have used this outcome measures to differentiate between prosthetic
interventions.
2.6 Overall conclusion
In summary, the ability to maintain postural stability is integral to safely execute
activities of daily living. However, deficits in controlling postural stability are apparent
due to the loss of proprioceptive receptors resulting from amputation. The review of
literatures from previous studies showed the inadequacy in methodological aspects
which may hinder accurate interpretations and results in study of postural stability
control among the amputees. Hence, this research will propose a more systematic and
objective approach in understanding the mechanism of balance control during quiet
standing in below-knee amputees.

84
2.7 Novel contributions of the current thesis
In the past, there are extensive literatures that have investigated postural stability
control during independent upright standing. However, the influence of the different
prosthetic components, particularly the foot, on the control of standing posture is still
uncertain. Specifically, the control of postural stability during altered visual,
somatosensory and vestibular inputs while wearing different prosthetic feet categories is
yet to be investigated.
As discussed earlier, there is still lacking of systematic analysis of confounding
factors from sensory and prosthetic foot which may affect the control of stability during
upright standing. Hence, the purpose of this study was to investigate whether the control
of postural stability will be influenced by the prosthetic foot types when standing in
different altered sensory situations. In addition, this current thesis also explored the
feasibility of a commercially available balance device to assess postural stability in
below-knee amputees and whether their unique stability profile could be distinguished
from that of an able-bodied person. Quantitative posturography was utilised as a method
to isolate the individual orientation inputs from the visual, somatosensory and vestibular
systems contributing to postural stability control. These works provide new insights into
the possibility of implementing objective assessment as an evidence-based practice to
enhance the understanding of the underlying mechanisms of postural stability control
with changes of sensory information and prosthetic foot. The need of such evidence is
paramount, considering the ambiguity that surrounds the current findings of stability
control in below-knee amputees.
In short, this current thesis examined the relative influence of each sensory and
prosthetic foot types on the postural stability of independent bilateral stance in person

85
with below-knee amputation. The sensory influence assessment coupled with prosthetic
components factors revealed additional information in understanding the standing
posture mechanism in unilateral below-knee amputees. Consequently, these results
potentially provide the means of a new approach to the improvement of the
rehabilitation programme and to prosthetic prescription for individuals with below-knee
amputation.

86
CHAPTER 3
GENERAL MATERIALS AND METHODS
The current chapter discusses the overall flow of the study, ethical review procedure,
inclusion/exclusion criteria for participation in this study, and also the demographics of
amputee and able-bodied participants. The mechanical testing procedures used to
determine prosthetic feet stiffness are elaborated in this chapter. Considerations for the
use of equipment and outcome measures are also included. Moreover, stability indexes
as well as zones and quadrants variables are described in this chapter. Following this,
the testing protocols for sensory alterations with three different prosthetic feet and
subjective assessment of balance function and confidence are further described.
Descriptive and statistical data analyses procedures are detailed in the methodology
section of the associated experiment.

87
3.1 Flowchart of the overall study.
Generally, the methodology process of this current study can be divided into six
different phases. The phases involved are: (1) systematic literature review, (2) ethical
review, (3) preliminary studies, (4) subjects recruitment, (5) main studies, (6) data
management, and finally (7) thesis writing. The flowchart of these phases is outlined in
Figure 3.1.
Figure 3.1: The flowchart of the overall methodology of this study.
PHASE 6
PHASE 1 PHASE 3 PHASE 2 PHASE 4
PHASE 7 PHASE 5
Systematic
literature
review on
instrumented
assessment of
balance in
lower-limb
amputees
Ethical review
application to
the university’s
hospital
Preliminary
studies
(i) Reliability
study
(ii) Mechanical
testing
Recruitment
process for
amputee and
able-bodied
subjects
Thesis writing
Main studies
(i) posturography
assessment
(ii) outcome
measures
Data
management
(i) collecting
(ii) analysing

88
3.2 Systematic literature review
Literature searching via the internet and manually was conducted in January
2013. This particular search was focused on articles pertaining instrumented assessment
of balance in people with lower-extremity amputation. The final articles were selected
based on the four-phases of information of a systematic literature review according to
PRISMA guidelines. Detailed information of the search strategy, included articles and
findings can be found in Section 2.4.
3.3 Ethical review
As required by the Medical Ethics Committee (MEC) of University Malaya
Medical Centre (UMMC), any research involving humans must obtain clearance from
the committee prior commencement of the study. This is to ensure the rights, safety and
well-being of human research volunteers and to ensure that the proposed study abide by
the existing laws and regulations. Therefore, this study was reviewed and granted
approval in August 2012 (MEC reference number: 938.9). The ethics approval
statement, participation information sheet, informed consent form and related
questionnaires used in this study which were approved by the committee can be found
in the Appendix C at the end of this thesis.
3.4 Inclusion and exclusion criteria
Prospective amputee participants were identified by the researcher and certified
prosthetist at the rehabilitation clinics of UMMC. For able-bodied group, participants
were recruited from local community by word of mouth. In order to participate, we have
outlined the participant’s selection criteria both for amputee and able-bodied control

89
group which can be referred to in Table 3.1. Anyone who does not meet the inclusion
criteria was not included in the study.
Table 3.1: Inclusion and exclusion criteria for amputee and control group.
Amputee Control
Inclusion criteria
age between 20-65 years
in good general health condition
able to walk without aids or assistance
satisfactory range of joint motion at both hips and knees
Berg balance score >20
unilateral lower-limb amputation below the knee
residuum in good condition (no scars/infections/pain)
non-amputated side in good condition
at least one year use of prosthesis
Exclusion criteria
attention deficits, visual problems or deafness
with neurological disorders which may affect balance
unable to understand verbal or written information given
in English or Malay language
symptoms of dizziness
unilateral above-knee or bilateral lower-limb amputee
3.5 Participants included in this study
From a total of 41 male amputees from the rehabilitation clinic, ten unilateral
below-knee amputees were found to fulfil all the inclusion and exclusion criteria.
Twelve amputees failed to fulfil the criteria which include less than one year use of
prosthesis, using wheel chair or walking stick, age over 65 years, tremor, bilateral
amputatations as well as being partial blind. The flow of amputee participants’
recruitment is presented in Figure 3.2. Following the selection of amputee participants,
a total of nine male able-bodied subjects were selected to match with the age, height and
weight of the amputee group. The demographic characteristics of all participants for this
study are summarized in Table 3.2.
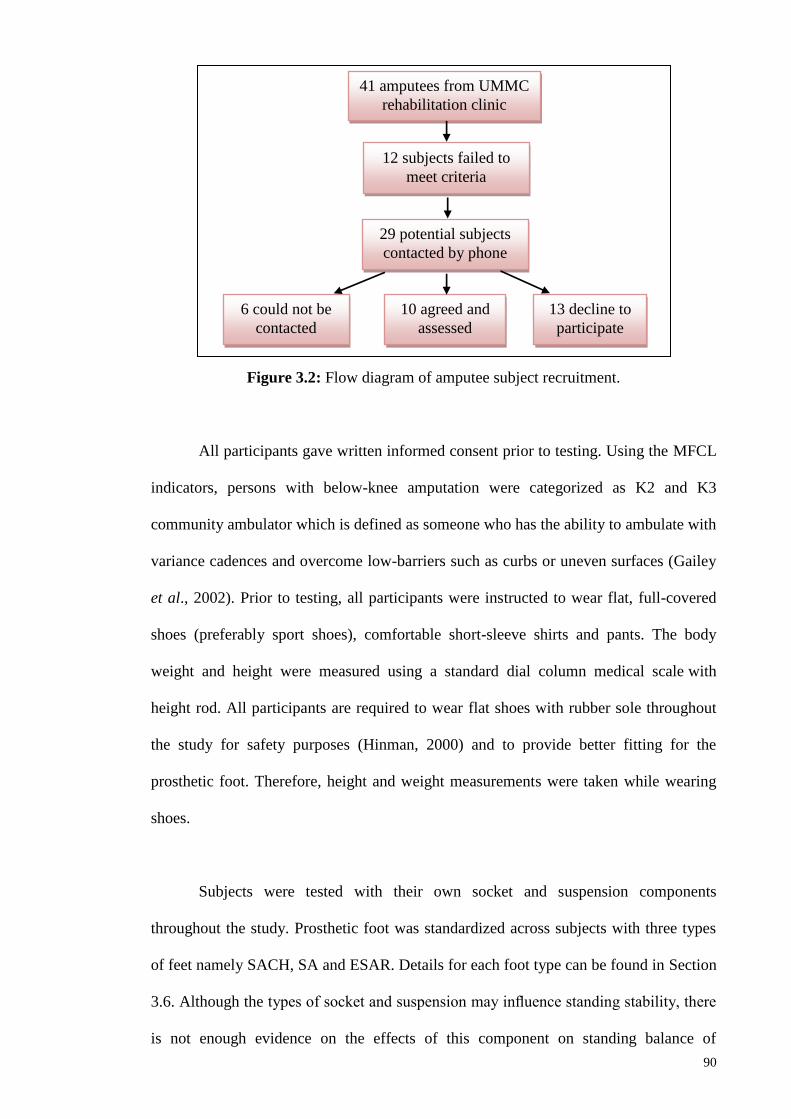
90
Figure 3.2: Flow diagram of amputee subject recruitment.
All participants gave written informed consent prior to testing. Using the MFCL
indicators, persons with below-knee amputation were categorized as K2 and K3
community ambulator which is defined as someone who has the ability to ambulate with
variance cadences and overcome low-barriers such as curbs or uneven surfaces (Gailey
et al., 2002). Prior to testing, all participants were instructed to wear flat, full-covered
shoes (preferably sport shoes), comfortable short-sleeve shirts and pants. The body
weight and height were measured using a standard dial column medical scale with
height rod. All participants are required to wear flat shoes with rubber sole throughout
the study for safety purposes (Hinman, 2000) and to provide better fitting for the
prosthetic foot. Therefore, height and weight measurements were taken while wearing
shoes.
Subjects were tested with their own socket and suspension components
throughout the study. Prosthetic foot was standardized across subjects with three types
of feet namely SACH, SA and ESAR. Details for each foot type can be found in Section
3.6. Although the types of socket and suspension may influence standing stability, there
is not enough evidence on the effects of this component on standing balance of
41 amputees from UMMC
rehabilitation clinic
29 potential subjects
contacted by phone
6 could not be
contacted
10 agreed and
assessed
13 decline to
participate
12 subjects failed to
meet criteria

91
amputees (Kamali et al., 2013). Therefore, we did not standardize the socket and
suspension type. Nevertheless, to minimize the confounding factors from socket and
suspension types, our registered research prosthetist evaluated the overall quality of the
two components such as fitting quality and free from any cracks. If the socket or
suspension was deemed not suitable, the subject was provided with a new unit. The
same prosthetist evaluated and ensured that the subjects’ existing prosthetic sockets and
components were well fit before the testing trials. The amputees’ current prosthetic
sockets and components were optimally aligned using a laser liner during bench and
static alignment. In addition, dynamic assessment of prosthesis alignment was
determined by the prosthetist as the subject ambulates along the parallel bars (Figure
3.3).
Figure 3.3: Bench (A) and dynamic (B) alignment during each testing session.
A B

92
Table 3.2: Amputee and able-bodied participant characteristics
Sub
ject
Age
(y)
Height
(m)
Mass
(kg)
Etiology Mobi
lity
gra
de†
Time
since
ampu
tation
(years)
Pros
thetic
foot
Sus
pen
sion
BBS
(max
56)
Amputees
1 59 1.71 75 Diabetic K2 6 SA PTB with
pelite
52
2 23 1.62 88 Trauma K3 2 SA PTB with
pelite
56
3 45 1.78 84 Trauma K3 25 SA PTB with
pelite
56
4 52 1.67 64 Trauma K3 5 ESAR TSB with
pin lock
56
5 42 1.72 58 Trauma K3 9 SA TSB with
pin lock
56
6 38 1.75 100 Diabetic K2 5 SA TSB with
pin lock
56
7 44 1.77 109 Diabetic K2 3 ESAR TSB with
pin lock
49
8 25 1.65 55 Tumor K3 3 ESAR TSB with
pin lock
56
9 61 1.62 69 Diabetic K2 7 SA TSB with
pin lock
51
10 59 1.66 68 Diabetic K2 6 SA TSB with
pin lock
41
Mean 44.8 1.70 77.0 7.1 52.9
SD 13.5 0.06 17.9 6.6 4.9
Able-bodied
1 59 89.0 1.68 56
2 42 75.0 1.75 56
3 22 74.0 1.63 56
4 44 81.0 1.61 56
5 57 74.0 1.61 56
6 35 70.0 1.64 56
7 50 69.0 1.63 56
8 27 57.0 1.67 56
9 61 76.0 1.7 56
Mean 44.1 1.66 73.9 56
SD 14.0 0.05 8.7
p-
value
0.91 0.68 0.15 0.08
Note. †Based on Medicare K-level (Gailey et al., 2002). SA: Single axis, ESAR: Energy storage and
release, PTB: Patellar tendon bearing socket, TSB: Total surface bearing socket, BBS: Berg Balance
Score. The p-value indicates no significant differences between the groups for age, height, weight and
BBS score.

93
3.6 Determination of prosthetic foot stiffness from the standard mechanical
testing
3.6.1 Introduction
As mentioned in Section 2.3.7, mechanical design of prosthetic foot is suggested
to influence the control of balance in persons with below-knee amputation. Moreover,
the prosthetic ankle-foot mechanism is considered as an important part of the prosthesis
(Hofstad et al., 2009). In relation to this, comparative studies on prosthetic feet have
been focused on the biomechanical outcomes such as spatial, temporal, kinetics,
kinematics, muscle activity and energy expenditure (Hafner, 2005; Hofstad et al., 2009).
In fact, the majority of previous studies used walking speed and ankle range of motion
to investigate differences between specific components of the prosthetic feet (Postema
et al., 1997; Ventura, 2010; van der Linden et al, 2004). Although these parameters are
useful indicators which can be used in prosthetic feet assessment, they were not
sufficient on their own to fully explain the important mechanical properties of the
prosthesis in influencing the amputee performance and comfort.
Therefore, several researchers have conducted structural mechanical testing to
explore the intrinsic properties of prosthetic foot (Cortes et al., 1997; van der Linden et
al., 1999). Previous studies measured fatigue and strength of prosthetic foot (Rooyen,
1997; Toh, 1993), while others used the roll-over shape to describe the mechanism of
prosthetic foot (Hansen, 2005; Sam, 2000). Earlier, researches started to investigate the
stiffness of prosthetic foot which is represented by the slope of a force-deformation
curve (Gaw, 2008; Lehman et al, 1993; Mason et al., 2011; van Jaarveld, 1990; Zeller,
2007). The prosthetic foot stiffness is usually measured at the heel and forefoot (Geil,
2001; Haberman, 2008; Rooyen, 2008; van Jaarsveld, 1990) as well as at the lateral and

94
medial borders (Gaw, 2008; Zeller, 2007). This type of testing has been done on
prosthetic foot at different loading angles that correspond to anatomical shank
movement when walking (Postema et al., 1997; van Jaarsveld et al., 1990) or during
heel to toe loading of the prosthetic ankle-foot similar to that seen during normal
walking. The loading is applied by a static or quasi-static (slow) manner using
mechanical testing apparatus (Geil, 2001; Geil, 2002; Lehman et al., 1993; Ventura,
2010; Zeller, 2007). Another type of loading is the dynamic loading (faster loading)
which is performed to combine the effects of the stiffness and damping of the prosthetic
ankle-foot system (Hansen, 2005). Geil (2001) reported that when a range of prosthetic
feet undergone mechanical testing, they are self-classified into four different linear
stiffness categories. These categories were based on the mechanical testing on eleven
energy storage and return (ESAR) prosthetic feet from six different manufacturers, and
they are shown in Table 3.3. Alternatively, studies that measures stiffness of medial and
lateral borders of prosthetic feet at various slope angles demonstrated significant
differences in stiffness between foot designs (Gaw, 2008; Zeller, 2007).
Table 3.3: Stiffness categories according to the mechanical testing on ESAR
prosthetic feet at the forefoot region, with vertical compression load of
800N. Note that the stiffness value in this study is the load-deformation
curve slope (Geil, 2001).
Averaged Stiffness Value kN/mm Stiffness Category
0.0760 Most stiff
0.0606 More stiff
0.0384 Less stiff
0.0277 Least stiff
According to the US Food and Drug Administration (FDA), prosthetic foot is
identified as an external limb prosthetic and classified as Class I medical device. Hence,
structural or performance test is not required for prosthetic foot before releasing the
product to the market. However, the American Orthotic & Prosthetic Association

95
B A
(AOPA) strongly urged the manufacturers to perform standard mechanical test to
validate certain characteristics of a prosthetic foot (AOPA, 2010). Preceding studies
adopted mechanical testing proposed by the Veteran Administration Prosthetic Centre
(VAPC), which requires the foot to be tested at the forefoot and the heel respectively
under the load of 667N. The VAPC recommended the use of 30° forefoot block for
dorsiflexion and toe extension tests, while the 15° heel block is for plantarflexion
test (Figure 3.4).
Figure 3.4: Static tests on the Lambda foot using VAPC 1973 procedure at (a) forefoot,
and (b) heel region. (Reproduced from Toh et al., 1993)
Additionally, the ISPO also recommended similar standard to those proposed by
the VAPC except for the load which is 1350N. However, the load proposed by the
VAPC may be too low that the results obtained are not reliable, while higher load
suggested by the ISPO may only represent active amputees or amputees from Western
countries which generally have higher body mass compare to Asians (Toh et al., 1993).
For this reason, a loading force between the recommended loads of 1350N and 667N
should be appropriate when performing static mechanical test (Toh et al., 1993).
In 2010, the ISPO has reached consensus to adhere to the ISO 10328:2006
procedures for structural testing of lower limb prostheses (Jensen and Sexton, 2010).
Forefoot
Heel

96
This standard specifies the procedures for principal static and cyclic strength test on
lower-limb prosthesis (ISO, 2006). This includes the use of 150 block for heel loading
and 200 block for forefoot loading to represent different instants during the stance phase
of walking. An example of utilising the ISO 10328:2006 standard includes the practice
of AOPA that requires the foot manufacturers to perform structural mechanical test in
determining the specific coding of prosthetic feet based on the certain characteristics of
the prosthetic foot.
The stiffness values from some of the previous studies are tabulated in Table
3.4. Nevertheless, results of these studies should be interpreted with caution due to the
heterogeneous methods including different maximum loading values and different
apparatus (custom made versus standard device) used during the mechanical test. Often,
researchers investigated the effects of different prosthetic feet interventions in
prosthetic-amputees interface environment. However, without knowing the specific
feature of the prosthesis, for example the stiffness, most of the studies used different
types of commercially available prosthetic feet with various mechanical characteristics,
causing the interpretation of the findings difficult. Accordingly, this study aims to
provide independent measurement of structural stiffness for three categories of
prosthetic feet which will be used later in this study.

97
Table 3.4: Summary of Linear stiffness (kN/mm) value at the heel and forefoot regions
for SACH, SA and ESAR foot from previous studies.
Author Type of
test
Heel region kN/mm Forefoot region kN/mm
SACH SA ESAR SACH SA ESAR
Van
Jaarsvald
et al.,
(1990)
VA
Standard
1973, 150
heel, 300
toe,
F=1000N
0.0541
0.0551
0.0441
0.0291
0.0341
0.0171
Rooyen
(2008)
F=600N 0.06551
0.05262
- - 0.124 1
0.1442
- -
Geil, 2001 VA
Standard
1973, 150
heel,
F=800N
- - - - - 0.02773
0.03841
0.06064,5
0.07602,5
Mason et
al., 2011
ISO 10328,
N=2240N
- - 0.17286
0.07797
0.05924
- - 0.016
0.04887
0.05594 Note. 1=Ottobock; 2=Kingsley;3=College Park; 4=Ohio Willow Wood, 5= Trulife; 6= Freedom
Innovations; 7=Ossur
3.6.2 Methodology
3.6.2.1 Prosthetic feet
The prosthetic feet used in this study were two SACH, two SA and one ESAR,
resulting in a total sample size of five. The SACH and SA feet were chosen due to their
common use in patient care (Goh et al., 1984; Noonan, 2010), while ESAR represents
modern prosthetic foot (Hafner, 2005). Each of the prosthetic foot types represents a
different mechanism of movement at the ankle joint. For ESAR category, Talux foot
low impact category 4 was chosen for body weight range from 78-88kg to match with
the majority of participants’ body weight. All manufacturers were not informed about
the mechanical testing in order to obtain regular-production feet. All feet were inspected

98
before the test to ensure no physical defects were present. The prostheses and their
characteristics can be seen in Table 3.5 and Figure 3.5 to Figure 3.7.
Table 3.5: The characteristics of prosthetic feet used in this study.
Foot Weight,
kg
Length,
cm
Manufacturer Material
SACH 0.673 25 Enjoylife, Fujian,
China
Wooden keel and high-
density rubberized
foam heel
Single axis 0.765 25 Enjoylife, Fujian,
China
Metal keel with ankle
joint and rubber heel
ESAR (Talux®)
with cover
0.740 25 Ossur, Reykjavik,
Iceland
Carbon fibre keel and
heel
Figure 3.5: Components of Solid Ankle Cushioned Heel (SACH) foot
Forefoot
region
Heel
region
Foot
plate
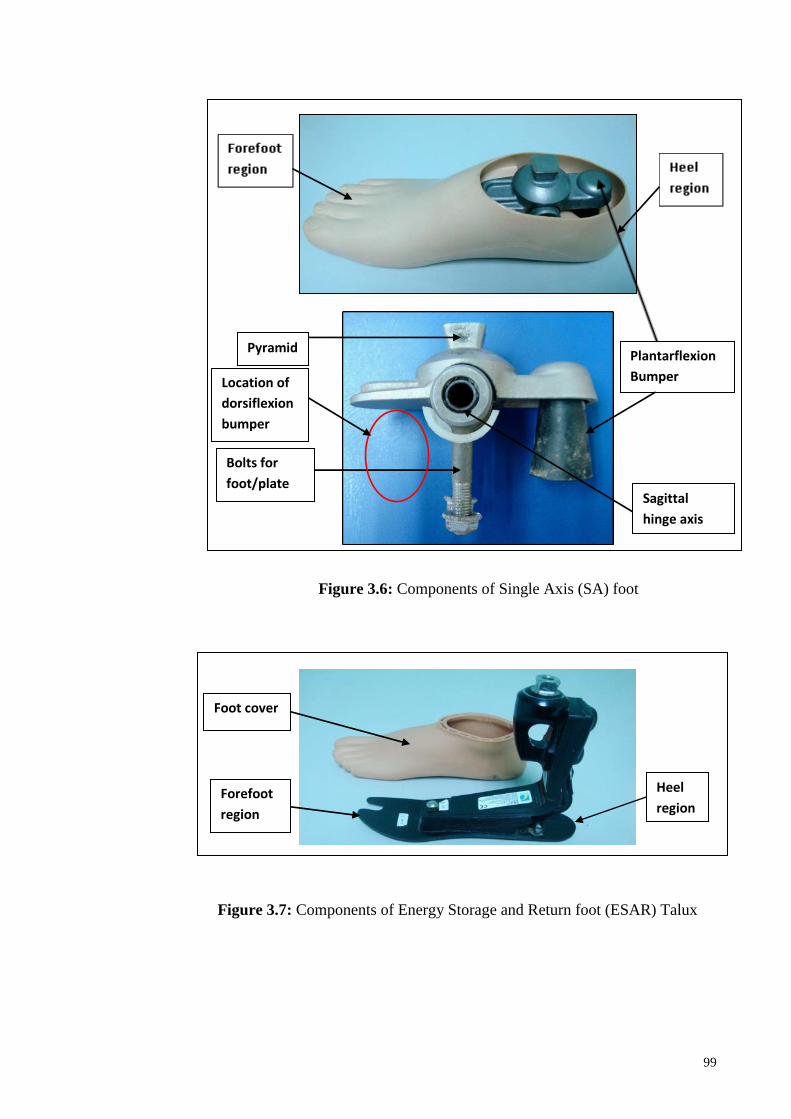
99
Figure 3.6: Components of Single Axis (SA) foot
Figure 3.7: Components of Energy Storage and Return foot (ESAR) Talux
Foot cover
Forefoot
region
Heel
region
Plantarflexion
Bumper
Sagittal
hinge axis
Bolts for
foot/plate
Pyramid
Location of
dorsiflexion
bumper

100
3.6.2.2 Mechanical structural testing
Material test was performed using an Instron 4469 universal tensile machine
(Figure 3.8) according to ISO 10328 protocols. The testing machine consist of Instron
load cells, which are the precision force transducers with strain gauges attached to
internal loading bearing structures in the machine. The load cells are stressed during a
material test by applying vertical tension or compression forces (Instron, 1996). The
crosshead was set at a constant speed of 1mm/min. Some of the specifications of the
machine are listed in Table 3.6.
Table 3.6: Selected Instron 4469 load frame specifications.
Specifications Descriptions
Position measurement accuracy ±0.01mm or 0.15% of displacement of displayed
reading, whichever is greater
Position repeatability ±0.05mm
Speed accuracy ±0.1% steady state, measured over 100mm or
30sec, whichever is greater, no load
Load weighing accuracy ±0.5% of full scale to 1/50 of load cell capacity, or
±1 count on the display, whichever is greater
Strain measurement accuracy 0.6% of reading ± 25% of calibration point ±1
count on the display, whichever is greater
Next, the test prosthetic foot was attached to a standard pylon via the ankle bolt
and pyramid adapter. Prior to testing, the prosthetic foot was aligned so that the
longitudinal axis of the foot was positioned at 70 external rotations (toe out). During the
alignment process, the foot was placed on an L-shape heel-support to compensate for
the heel height of the prosthetic foot. (Figure 3.9). A laser pointer was used to ensure
the accuracy of the alignment, such that the laser line should pass at the middle of the
pylon posteriorly and laterally (Figure 3.10).
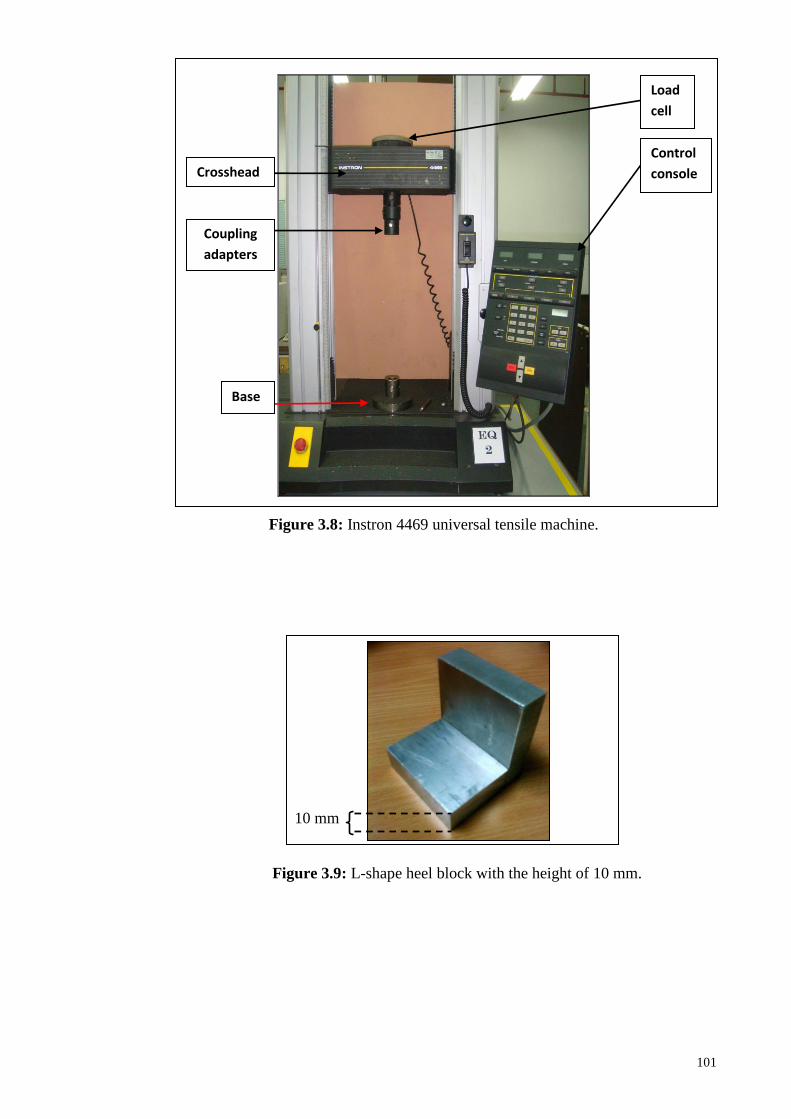
101
Figure 3.8: Instron 4469 universal tensile machine.
10 mm
Figure 3.9: L-shape heel block with the height of 10 mm.
Control
console Crosshead
Load
cell
Coupling
adapters
Base

102
Figure 3.10: Alignment using laser pointer and heel block from posterior and anterior
aspect of the foot.
Once the alignment was confirmed, the pylon was securely attached to the test
jig by a custom cylindrical adaptor to ensure a snug fit between the pylon and coupling
adapter. Two holes were drilled across the cylindrical adaptor and at the top of pylon.
The cylindrical adaptor-pylon-coupling adapter interfaces were secured with a dowel
pin that passed through the holes in the adaptors and pylon (Figure 3.11). The static
proof test was conducted by applying the test force initially to the heel and subsequently
to the forefoot of the same test sample. Measurements at the heel were taken at an angle
of 150 simulating loading during early stance phase and forefoot loading at an angle of
200 simulating loading during late stance. This was accomplished by using the foot
platforms, which are the heel and forefoot blocks (Figure 3.12).
Laser pointer
Heel
block

103
Figure 3.11: The attachment configuration of the cylindrical adaptor, pylon and
coupling adapter via a dowel pin.
Figure 3.12: The foot platforms: (a) 150 heel block and (b) 200 forefoot block
These blocks were made out of wood with a 4mm thick aluminium surface to
minimize surface deformation during the test (Carpenter, Hunter and Rheaume, 2008).
Location of
cylindrical adapter
around the top of
the pylon
Dowel pin
Coupling
adapter
(a) 150 heel block
(b) 200 forefoot block
Teflon sheets Aluminum surface

104
Teflon sheet was placed on each of the foot platforms to reduce shear forces between
the surface of the foot and the loading surface. The heel or forefoot block was placed on
the base of the testing machine. Next, the jig is set to a zero displacement position,
determined by the point where the foot platform made initial contact with the heel or
forefoot region. A stabilizing force of 50N was applied, before resetting the load to
zero. Constant loading rates of 0.1mm/sec were applied to 800N of vertical compression
(Geil, 2001; Toh et al, 1993). Load and deformation data were collected from the load
cell during all tests for further analysis. As required by the ISO, each sample was tested
twice, and in a randomized order to minimize testing bias. An example of experimental
set up is illustrated in Figure 3.13.
Figure 3.13: Experimental setup. A sample of prosthetic foot is shown aligned on an
Instron 4469 universal tensile machine. Vertical compression loading
transferred a bending load to the foot.
3.6.2.3 Calculation of stiffness at the heel and forefoot region
Stiffness of each foot was determined by finding a linear best-fit approximation
of the slope from the load-deformation curve during the static proof loading test.The
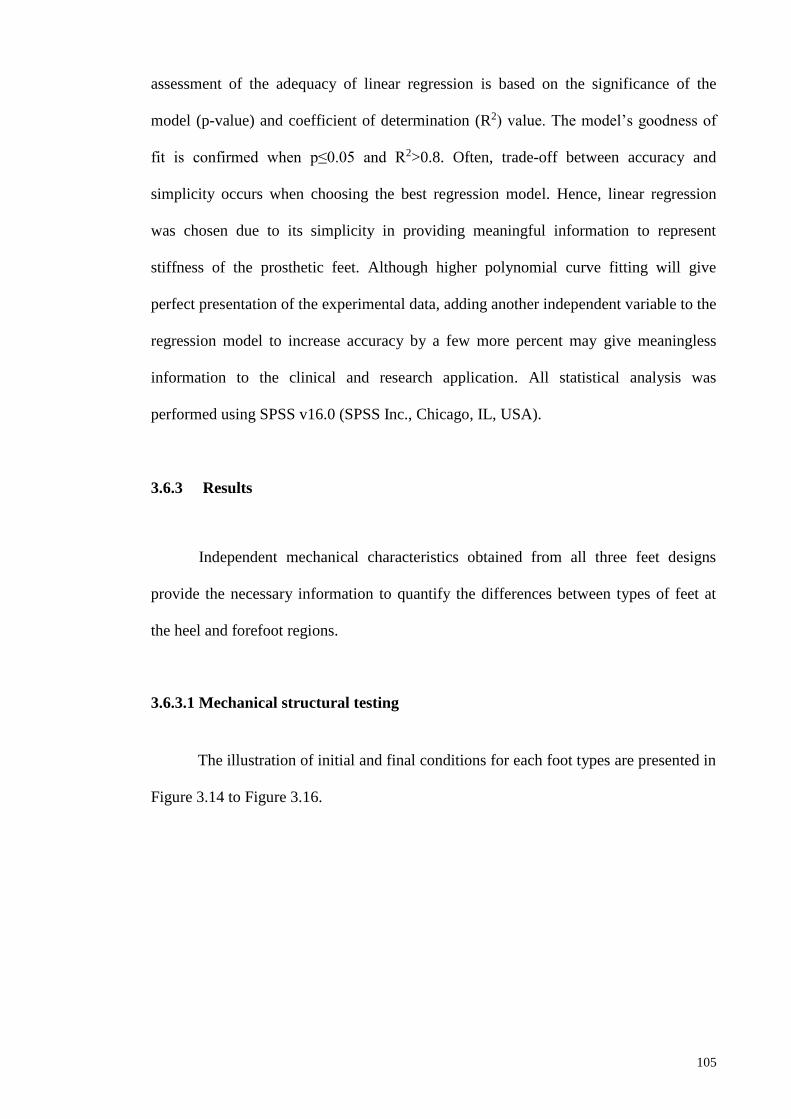
105
assessment of the adequacy of linear regression is based on the significance of the
model (p-value) and coefficient of determination (R2) value. The model’s goodness of
fit is confirmed when p≤0.05 and R2>0.8. Often, trade-off between accuracy and
simplicity occurs when choosing the best regression model. Hence, linear regression
was chosen due to its simplicity in providing meaningful information to represent
stiffness of the prosthetic feet. Although higher polynomial curve fitting will give
perfect presentation of the experimental data, adding another independent variable to the
regression model to increase accuracy by a few more percent may give meaningless
information to the clinical and research application. All statistical analysis was
performed using SPSS v16.0 (SPSS Inc., Chicago, IL, USA).
3.6.3 Results
Independent mechanical characteristics obtained from all three feet designs
provide the necessary information to quantify the differences between types of feet at
the heel and forefoot regions.
3.6.3.1 Mechanical structural testing
The illustration of initial and final conditions for each foot types are presented in
Figure 3.14 to Figure 3.16.

106
Initial loading Final loading
Heel at 150
Forefoot at 200
Figure 3.14: Initial and final conditions during loading at the heel and forefoot regions
of SACH foot.
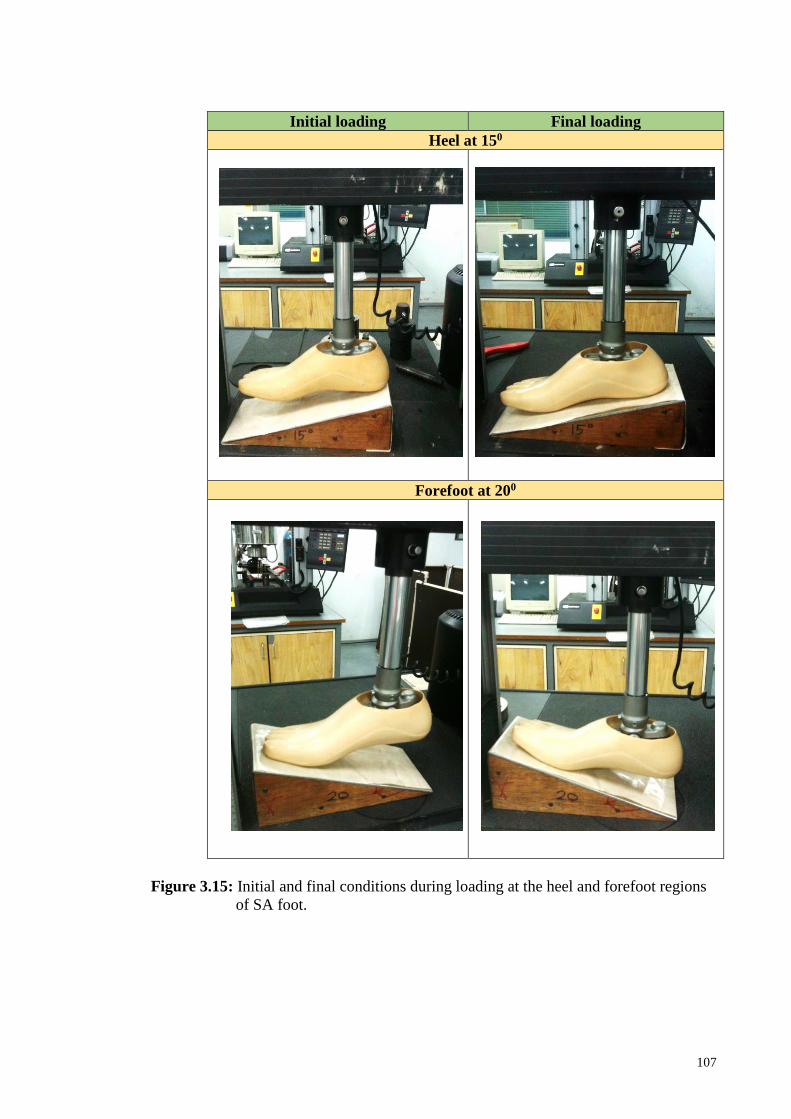
107
Initial loading Final loading
Heel at 150
Forefoot at 200
Figure 3.15: Initial and final conditions during loading at the heel and forefoot regions
of SA foot.

108
Initial loading Final loading
Heel at 150
Forefoot at 200
Figure 3.16: Initial and final conditions during loading at the heel and forefoot regions
of ESAR foot.

109
3.6.3.2 Linear stiffness value at the heel and toe regions
Force and deformation data were analysed to determine the stiffness at the heel
and forefoot regions for all prosthetic feet. Figure 3.17 shows the typical load-
deformation curve for a sample of SACH foot, in which the stiffness at the heel region
was determined from the slope of the curve. Figure 3.18 and Figure 3.19 illustrate the
load- deformation for all feet samples, while Figure 3.20 illustrates the hierarchy of
stiffness among the feet.
Figure 3.17: Determination of stiffness from the slope of load- deformation curve
for a sample of SACH foot during loading at the heel region.
y = 0.0487x - 0.0413R² = 0.9659
0
0.2
0.4
0.6
0.8
0 2 4 6 8 10 12 14
Load
, kN
Deformation, mm
Stiffness, k = 0.0487 kN/mm

110
Figure 3.18: Plot of load- deformation curve to determine the stiffness at the heel
region for five samples of prosthetic feet.
Figure 3.19: Plot of load-deformation curve to determine the stiffness at the forefoot
region for five samples of prosthetic feet.
Table 3.7 summarizes the means of these data for each sample. Loading to 800N
produced a range of deformation of 14.13 cm to 20.66 cm at the heel region, and 23.84
cm to 40.78 cm at the forefoot region. Among all feet, the ESAR Talux® foot

111
demonstrated the highest deformation both at the heel and forefoot regions. Overall,
deformation at the forefoot region was higher than the heel region in all tested feet.
Table 3.7: Maximum deformation and stiffness values at the heel and forefoot region
for all samples of prosthetic feet.
Prosthetic
foot
Max deformation, mm Stiffness (kN/mm)
Heel Forefoot Heel Forefoot
SACH 1 14.13 23.84 0.0487 0.0251
SACH 2 14.97 25.45 0.0507 0.0247
Single axis 1 12.56 29.10 0.0541 0.0243
Single axis 2 12.04 25.73 0.0593 0.0262
ESAR 20.66 40.78 0.0319 0.0179
The averaged deformation and stiffness properties of each foot types were
tabulated in Table 3.8. At the heel region, the ESAR foot exhibited the lowest stiffness
followed by SACH and SA. In specific, the heel region of ESAR foot was 56% and
78% less stiff than SACH and SA, respectively. Whereas at the forefoot region, the
ESAR showed the lowest stiffness followed by SACH and SA. The differences between
ESAR and non-ESAR feet were such that the forefoot stiffness of ESAR was 28% and
41% less stiff than SACH and SA, respectively.
Table 3.8: Averaged deformation and stiffness for each type of foot, where R2 is
coefficient of determination, K is stiffness and p-value <0.05 indicates the
significant of the model.
Foot
type
Averaged max
deformation, mm
R2 Averaged Stiffness, k
(kN/mm)
p-
value
Heel Forefoot Heel Forefoot Heel Forefoot
SACH1 14.55 24.65 0.98 0.85 0.0497 0.0249 0.000
SA2 12.30 27.42 0.98 0.94 0.0567 0.0253 0.000
ESAR3 20.66 40.78 0.98 0.97 0.0319 0.0179 0.000
% Differences,mm % Differences,kN/mm
2-1 -18.3 10.1 14.1 1.6
3-1 42.0 65.4 -55.8 -28.1
3-2 68.0 48.7 -77.7 -41.3

112
Figure 3.20: Linear stiffness of each prosthetic foot at the heel and forefoot region
obtained from static structural test in descending order.
3.6.4 Discussion
Stiffness profile is considered as one of the important criteria that need to be
considered before prescribing a prosthetic foot. Yet, prosthetist based on their
experience prescribed prosthetic foot according to patient’s activity level and body
weight. Moreover, manufacturers often provide limited property information, coupled
with variations in mechanical testing procedures of their prosthetic feet.
Therefore, this study provides independent assessment of structural stiffness to
gain better understanding of the intrinsic profile of three types of prosthetic feet.
Moreover, the mechanical test is conducted in a controlled environment which
eliminates variability between- and within-subjects (Geil, 2001). This initial study is

113
important before different prosthetic feet interventions can be clinically compared in
another study. The variances between feet types are quite apparent in the maximum
deformation data. The ESAR foot deformed 42% and 68% more than the SACH and SA
foot at the heel region, respectively. Similarly at the forefoot region, the ESAR showed
65% and 49% more deformation compared to SACH and SA, respectively. The results
of this study indicate that the SACH and SA feet which are made mainly from rubber
material displayed similar deformation data while the carbon fiber ESAR foot not only
showed the highest deformation at the heel, but also at the forefoot region.
The findings of this study demonstrated that stiffness profiles at the heel and
forefoot can also be utilized to explain the differences between non-ESAR (SACH and
SA) and ESAR foot. When comparing mechanical stiffness features of the tested feet in
this study, the findings suggested that the differences between feet are more obvious at
the heel region (14% for SACH-SA, 56% for ESAR-SACH, 78% for ESAR-SA)
compared to forefoot region (1.6% for SACH-SA, 28% for ESAR-SACH, 41% for
ESAR-SA). Overall, the ESAR foot demonstrated the lowest heel and forefoot stiffness
among the feet, followed by SACH and SA foot. This showed that the ESAR foot was
more compliant than SACH and SA foot. However, the difference was very minimal
(1.6%) between SACH and SA foot for the forefoot region. The finding that the heel
region of SA foot is stiffer than that same region of SACH foot was in agreement with
previous studies (Goh et al., 1984; Toh et al, 1993). Similarly, this study was in
agreement with previous finding (Van Jaarsvald et al., 1990) that reported the lowest
stiffness at the heel and forefoot region for ESAR compared to SACH and SA. This
may be related to the greater flexibility of the carbon fibre material which may influence
the mechanical characteristics of the ESAR foot.

114
There are few limitations in this study that should be taken into consideration.
Firstly, only three types of prosthetic feet from two different manufacturers were used
as test samples, and a total of five prosthetic feet were tested. Also, the cyclic test which
involved sinusoidal load applied at the heel and forefoot was not performed on the foot
due to its time-consuming procedures. Moreover, the standardized ISO 10328 protocols
only represent loading condition in an ideal gait at the heel and forefoot regions. This
condition may not present other loading conditions such as uneven surfaces or loading
at the medial and lateral borders of the prosthetic foot. Additionally, the influence of
different footwear to the foot stiffness is not discussed in this study. Lastly, structural
mechanical testing does not fully describe the principal function of a prosthesis foot.
Hence, it is as important to access prosthetic foot function during amputee-prosthesis
interface.
3.6.5 Conclusion
This study showed a successful use of universal tensile machine to determine
stiffness of various prosthetic feet by following the standardized mechanical test
procedures. It was found that differences between non-ESAR and ESAR prosthetic feet
used in this study can be characterized based on their stiffness profile at the heel and
forefoot regions. The ESAR foot showed the highest deformation and the lowest
stiffness at both regions when compared to SACH and SA foot. Future biomechanical
study is necessary to demonstrate the definitive functional differences of prosthetic feet
in user-prosthesis environment.

115
3.7 Balance assessment using Biodex Stability System (BSS)
3.7.1 Overview
The postural stability of amputee and healthy participants was assessed using the
Biodex® stability system (BSS) model 950-302 (Biodex Medical System, Shirley, NY,
USA) (Figure 3.21). BSS measures the overall stability index (OSI), anterior/ posterior
stability index (APSI), and medial/ lateral stability index (MLSI), which represent the
standard deviation of the angular fluctuations from the centre of the platform (zero
point) at a sampling rate of 20Hz (Arnold & Schmitz, 1998). This device consists of a
circular platform which provides up to 20° of surface tilt in a 3600 free movement about
the AP and ML directions simultaneously.
The BSS system has been known for its reliability in objective assessment of
postural stability based on the findings from previous literatures. Good reliability of the
BSS during dynamic double stance standing have been reported in active adults with
interclass correlation of coefficient (ICC) of OSI=0.94, APSI=0.95 and MLSI= 0.93
(Cachupe et al., 2001) and older adults with ICCs of OSI=0.69 (Baldwin et al., 2004)
using stability level of 2 and 8. Similarly, good reliability has been demonstrated by the
BSS system during static double stance standing among older adults with ICC OSI=0.69
(Parraca et al., 2011). Pincivero, Lephart and Henry (1995) reported the ICC during
dynamic single leg standing among university students for OSI at resistance level 2
(ICC dominant and non-dominant= 0.60) and level 8 (ICC dominant=0.95, non-
dominant=0.78). With respect to intra-tester and inter-tester reliability, Schmitz and
Arnold (1998) found the BSS as a reliable assessment device during dynamic single leg
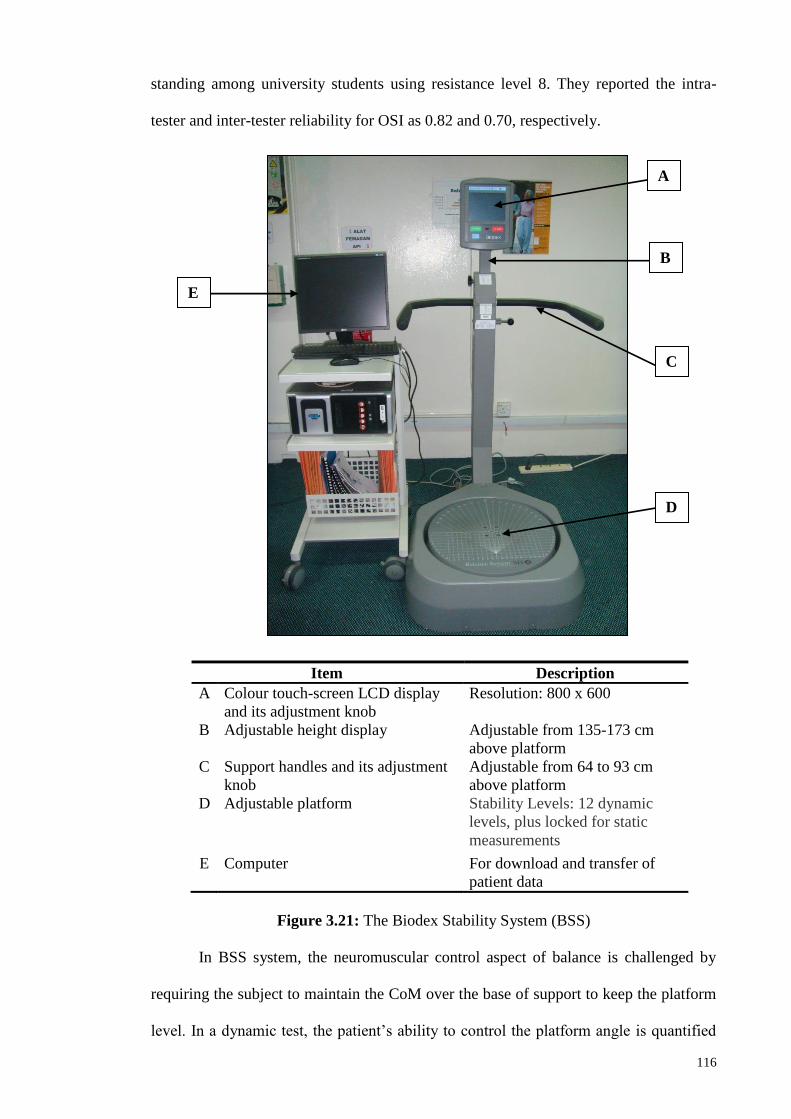
116
standing among university students using resistance level 8. They reported the intra-
tester and inter-tester reliability for OSI as 0.82 and 0.70, respectively.
Item Description
A Colour touch-screen LCD display
and its adjustment knob
Resolution: 800 x 600
B Adjustable height display Adjustable from 135-173 cm
above platform
C Support handles and its adjustment
knob
Adjustable from 64 to 93 cm
above platform
D Adjustable platform Stability Levels: 12 dynamic
levels, plus locked for static
measurements
E Computer For download and transfer of
patient data
Figure 3.21: The Biodex Stability System (BSS)
In BSS system, the neuromuscular control aspect of balance is challenged by
requiring the subject to maintain the CoM over the base of support to keep the platform
level. In a dynamic test, the patient’s ability to control the platform angle is quantified
A
B
C
D
E
117
as a variance from the level position; while static testing measures the angular excursion
of the patient's CoM. Generally, testing in static mode can be used as a baseline testing
before progressing into dynamic testing and training for patients with movement
disorder. Moreover, the display monitor of BSS provides visual biofeedback to the
subject via the moving trace of their CoM.
Platform stability, which ranged from 1 (least stable) to 12 (most stable), was
varied in terms of spring resistance levels. The stability of the platform can be adjusted
by varying the springs’ resistance force applied to the platform via series of strain
gauges embedded within the platform (Arnold & Schmitz, 1998). Previous studies
suggested the use of resistance level 2 for athletic, 4 for active person and 8 for
neuropathic and rheumatoid arthritis subjects (Aydog et al., 2006; Paterno et al., 2004;
Testerman et al., 1999; Salsabili et al., 2011). Therefore, considering that amputees
have more serious balance deficit due to their amputation, this current study has chosen
the resistance level of 10 for dynamic testing. In addition, by controlling the resistance
level of the platform, differences found for stability indexes between prosthetic feet
were likely attributed to a change in local stability and not a change in resistance level.
The top surface of the 55cm diameter circular platform was marked with 50
increment lines and coordinate grids for feet placement recordings (Figure 3.22). The
platform was integrated with computer software (Biodex, Version 3.1, Biodex Medical
Systems) that enables the device to calculate stability indexes. The stability score is
based on the deviation from the centre, thus, higher stability index means greater
amount of body movement which is associated with an unstable posture. On the other
hand, lower stability index indicates little movement which is associated with a more
stable posture.

118
Figure 3.22: The stability platform with adjustable stability level.
The BSS has been previously showed to successfully quantify postural stability
in arthritis patients and person with ankle instability (Aydog et al., 2006; Testerman &
Griend, 1999). Although these studies found differences in dynamic balance between
people with balance problem and healthy group, it is uncertain whether BSS could also
be utilised to differentiate between persons with below-knee amputation and healthy
during static balance. Hence, due to its reliability, practicality, easy to administer and
cost-effectiveness (Parraca et al., 2011; Guskiewicz & Perrin, 1996), BSS may be a
potential approach in the evaluation of postural stability in persons with below-knee
amputation for rehabilitation purposes. Furthermore, the OSI generated from the system
is considered as an efficient balance indicator of the ability to control balance
(Testerman & Griend, 1999).
3.7.2 Stability index parameters
This section highlights the variables that were analysed for the stability tests in
this study. From the degrees of platform tilt (during dynamic testing) or from CoM
excursion (during static testing) about the anterior- posterior and medial-lateral axes, the
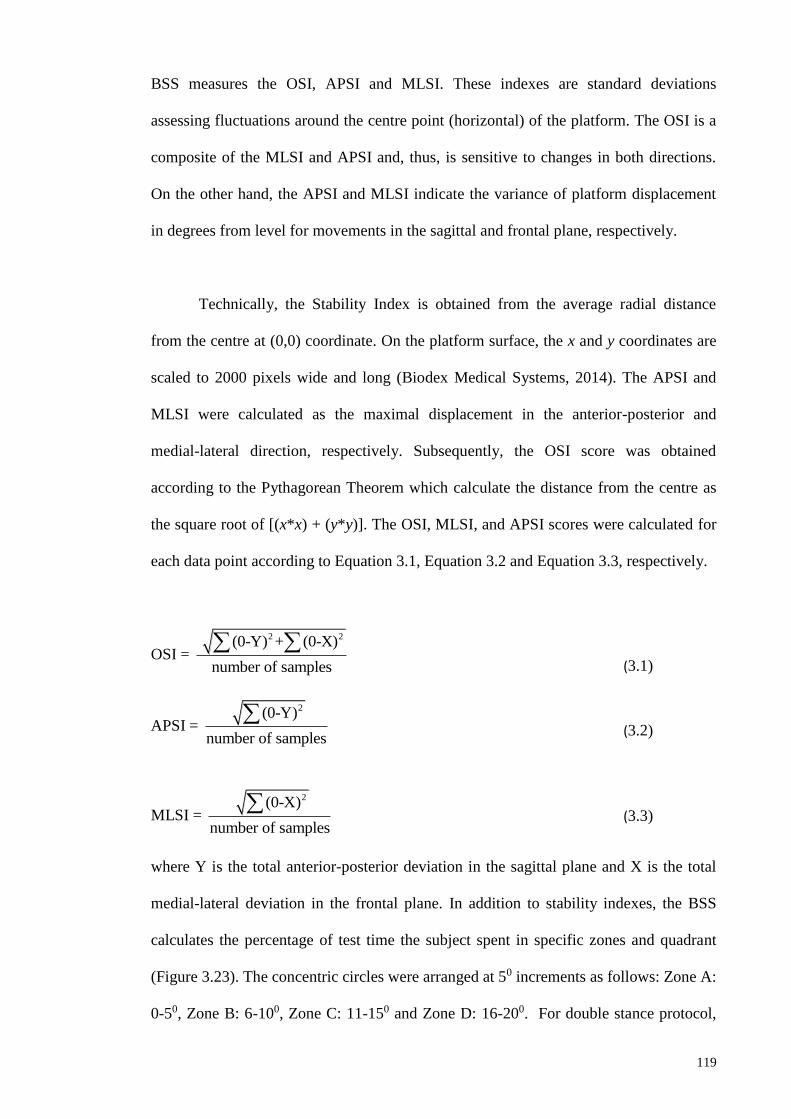
119
BSS measures the OSI, APSI and MLSI. These indexes are standard deviations
assessing fluctuations around the centre point (horizontal) of the platform. The OSI is a
composite of the MLSI and APSI and, thus, is sensitive to changes in both directions.
On the other hand, the APSI and MLSI indicate the variance of platform displacement
in degrees from level for movements in the sagittal and frontal plane, respectively.
Technically, the Stability Index is obtained from the average radial distance
from the centre at (0,0) coordinate. On the platform surface, the x and y coordinates are
scaled to 2000 pixels wide and long (Biodex Medical Systems, 2014). The APSI and
MLSI were calculated as the maximal displacement in the anterior-posterior and
medial-lateral direction, respectively. Subsequently, the OSI score was obtained
according to the Pythagorean Theorem which calculate the distance from the centre as
the square root of [(x*x) + (y*y)]. The OSI, MLSI, and APSI scores were calculated for
each data point according to Equation 3.1, Equation 3.2 and Equation 3.3, respectively.
OSI =
2 2 (0-Y) + (0-X)
number of samples
APSI =
2 (0-Y)
number of samples
MLSI =
2 (0-X)
number of samples
where Y is the total anterior-posterior deviation in the sagittal plane and X is the total
medial-lateral deviation in the frontal plane. In addition to stability indexes, the BSS
calculates the percentage of test time the subject spent in specific zones and quadrant
(Figure 3.23). The concentric circles were arranged at 50 increments as follows: Zone A:
0-50, Zone B: 6-100, Zone C: 11-150 and Zone D: 16-200. For double stance protocol,
(3.1)
(3.2)
(3.3)

120
quadrants were defined as Quadrant I: right anterior, Quadrant II: left anterior,
Quadrant III: left posterior and Quadrant IV: right posterior.
Figure 3.23: An example of a subject’s trajectory of CoM displacement within zones
and quadrants from the platform’s centre during eyes-closed condition.
3.7.3 Patient data management
The platform was integrated with Biodex® software (Version 3.1 Biodex®
Medical Systems) that enables the device to calculate stability indexes. In order to
access the software, a special user access code was entered in the System Utilities
screen. With this safety feature, data of all subjects were secured safely and can only be
retrieved by authorised personnel. The software contained Patient Data Collection
Software Utility (PDC) program allowing the exporting of all patient test results in a
single .csv file. For this purpose, a serial interface cable from the BSS display was
connected to the computer with Windows operating system. The software allowed
patient data storage up to 2 MB, which is approximately equivalent to 200 patient tests.

121
The test result can be viewed as a graphic report with display of CoM trace and stability
indexes, or in a .csv compatible program like Excel.
3.8 Self-report and functional outcome assessment of the participants.
3.8.1 Introduction
In the field of prosthetic research, outcome measures from the combination of
biomechanical studies and perceptive assessment serves as scientific evidence to assess
prosthetic intervention (Hafner, 2006). However, most of the research mainly focus on
the biomechanical aspects of prosthetic function and performance from the quantitative
outcome such as temporal and spatial parameters, kinetic, kinematic, energy
expenditure as well as muscular activity. Perceptive analyses can be defined as studies
that evaluate prosthetic devices through the use of patient assessment via descriptive
dialog, functional assessment questionnaires and numerical rating scales (Hafner, 2005).
Often, the limited use of perceptive outcome measures is linked to the unfamiliarity to
administer the appropriate assessment as well as inadequate knowledge on choosing the
assessment tools (Condie et al., 2006). Although evaluations obtained from functional
performance and patient’s perception are considered vital to achieve the goal of
scientific prosthetic research (Hafner, 2006), there is no consensus by far on the best
assessment tools for the amputee population due to the complexity of amputation
rehabilitation (Deathe et al., 2002).
This study adopted several different assessment tools to determine the current
status of prosthesis use in below-knee amputees and functional balance of both amputee
and normal groups (Table 3.9).

122
Table 3.9. Outcome measurement tools related to lower limb prosthetics used in this
study. The type of outcome measures is based on the guidelines proposed by
Miller & McCay (2006).
Outcome measures Assessment type
Medicare functional classification Level (K-Level) Self-report
Health status questionnaire (SF-12v2) Self-report
Houghton scale Self-report
Berg balance test Functional performance
Activities-specific Balance Confidence (ABC) Functional performance
The MFCL consists of five levels classification system which is used to
categorize below-knee amputees of this study into respected functional K-level. This
classification serves as an indicator of the capacity and potential of people with lower-
limb amputation to accomplish their activities of daily living (ADL). Additionally, the
Medical Outcomes Study Short-Form version 2 (SF-12v2) measures the physical and
mental health status of participants prior to testing (Ware et al., 1996). The Houghton
Scale questionnaire serves as a subjective measure of prosthetic use and function
(Devlin et al., 2004). On the other hand, the BBS has been implemented in amputee
population to determine functional balance performance (Wong et al., 2013). Finally,
the ABC scale aids in assessing fear of falling among individuals with lower-limb
amputation. The aim of this study were to first, determine the prosthesis use among the
amputee participants; secondly to determine functional balance status for both amputee
and normal groups; and finally to investigate whether balance confidence scale is
capable to discriminate differences between selected prosthetic feet.

123
3.8.2 Methodology
3.8.2.1 Participants
Ten transtibial amputees and nine matched able-bodied participants completed
two self-report (SF-12v2 and Houghton scale) and two functional performance
assessment (BBS and ABC scale) throughout the study. All participants gave written
informed consent prior to data collection. Demographic details of each participant can
be found in Section 3.5 (Table 3.2).
3.8.2.2 Self-report assessment
All amputated participants were categorized into respected K-level based on the
MFCL guidelines. Prior to testing, all participates were required to complete the SF-
12v2 health status questionnaire to confirm that their postural stability is not affected by
confounding factors from poor mental and physical conditions. The SF-12v2 measures 8
different health concepts. The Bodily Pain (BP), General Health (GH), Vitality (VT),
and Social Functioning (SF) concepts are represented with one item each. In addition,
Physical Functioning (PF), Mental Health (MH), Role Physical (RP) and Role
Emotional (RE) domains are represented with two items each. The PF, RP, BP and GH
scales yield a Physical Component Summary (PCS) measure, and the MH, RE, VT, and
SF scales reveal a Mental Component Summary (MCS) measure (Ware et al., 1996;
Cheak-Zamora et al., 2009). Actual raw score for all eight subsets were transformed
into a maximum of 100 score scores using equation as shown below (Ware et al., 2002).
Additional information necessary to apply this formula for each scale is shown in Table
3.10.

124
(3.4)
Table 3.10: Aggregated scale items and range of possible scores.
Component
Summary
SF12v Scale Items Sum Final
Item
Values
Lowest and
highest
possible
raw
scores
Possible
raw
score
range
Physical
Component
Summary
(PCS)
General Health (GH)
Items 5
2,6
4
Physical Functioning
(PF)
Items 2a + 2b 2,10 8
Role Physical (RP) Items 3a + 3b 1,5 4
Bodily Pain (BP) Items 5 1,5 4
Mental
Component
Summary
(MCS)
Vitality (VT)
Items 6b
1,5
4
Social Functioning (SF) Items 7 1,5 4
Mental Health (MH) Items 6a + 6c 2,10 8
Role Emotional (RE) Items 4a + 4b 2,10 8
The Houghton scale was completed by each amputee in order to determine their
perception of prosthetic use and function prior to the start of study. The first three items
evaluate hours of prosthesis use, how the prosthesis is used and the use of an assistive
device with prosthesis on a 4-point scale. The fourth item assesses perceived stability
when walking on three different terrains with Yes/No options. The result for each
amputee was reported as maximum possible score of 12 points, with higher score
representing better performance and comfort (Devlin et al., 2004). A score greater than
9 was defined as successful prosthetic rehabilitation (Leung et al., 1996). The
questionnaire was completed face-to-face in the laboratory.
3.8.2.3 Functional performance assessment
The BBS was administered to ensure similar balance status between amputees
and able-bodied participants. The test consisted of 14 common daily tasks, such as
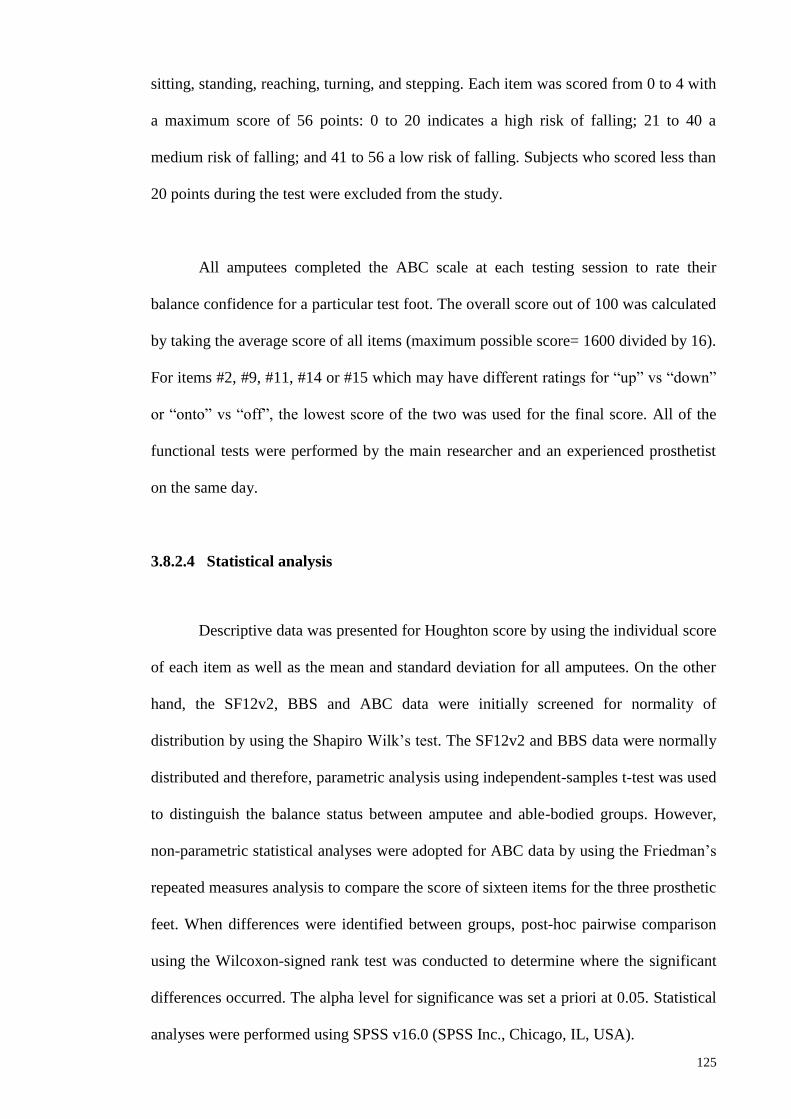
125
sitting, standing, reaching, turning, and stepping. Each item was scored from 0 to 4 with
a maximum score of 56 points: 0 to 20 indicates a high risk of falling; 21 to 40 a
medium risk of falling; and 41 to 56 a low risk of falling. Subjects who scored less than
20 points during the test were excluded from the study.
All amputees completed the ABC scale at each testing session to rate their
balance confidence for a particular test foot. The overall score out of 100 was calculated
by taking the average score of all items (maximum possible score= 1600 divided by 16).
For items #2, #9, #11, #14 or #15 which may have different ratings for “up” vs “down”
or “onto” vs “off”, the lowest score of the two was used for the final score. All of the
functional tests were performed by the main researcher and an experienced prosthetist
on the same day.
3.8.2.4 Statistical analysis
Descriptive data was presented for Houghton score by using the individual score
of each item as well as the mean and standard deviation for all amputees. On the other
hand, the SF12v2, BBS and ABC data were initially screened for normality of
distribution by using the Shapiro Wilk’s test. The SF12v2 and BBS data were normally
distributed and therefore, parametric analysis using independent-samples t-test was used
to distinguish the balance status between amputee and able-bodied groups. However,
non-parametric statistical analyses were adopted for ABC data by using the Friedman’s
repeated measures analysis to compare the score of sixteen items for the three prosthetic
feet. When differences were identified between groups, post-hoc pairwise comparison
using the Wilcoxon-signed rank test was conducted to determine where the significant
differences occurred. The alpha level for significance was set a priori at 0.05. Statistical
analyses were performed using SPSS v16.0 (SPSS Inc., Chicago, IL, USA).

126
3.8.3 Results
3.8.3.1 Self-report data
All participants demonstrated good health and mental status. The PCS data
provided by SF-12v2 gives the population mean (SD) for healthy group as 82(11)% and
for amputee group as 65(20)%. For MCS, the healthy and amputee groups obtained a
score of 93(4)% and 89(10)%, respectively. From the independent-samples t-test, the
PCS score in healthy group was significantly higher than amputee group. Conversely,
the MCS score between both groups did not differ significantly (Table 3.11).
Table 3.11: Mean (SD) of PCS and MCS score for healthy and amputee groups.
No PCS (%) MCS (%)
Amputee Healthy Amputee Healthy
1 88 71 94 100
2 71 88 94 91
3 85 92 97 97
4 82 92 94 91
5 67 79 94 91
6 35 92 63 94
7 74 61 94 88
8 74 74 91 94
9 37 92 81 91
10 40 - 88 -
Mean(SD) 65(20) 82(11) 89(10) 93(4)
p-value 0.04 0.28
An average Houghton score of 10.5 ± 0.9 was reported for all persons with
below-knee amputation prior to the study (Table 3.12).

127
Table 3.12: Individual and overall Houghton scores for all amputees (A1-10).
Item A1 A2 A3 A4 A5 A6 A7 A8 A9 A10
1. Hours of prosthesis use 2 3 3 2 3 3 3 3 3 2
2. How the prosthesis is used 3 3 3 3 3 3 3 3 3 3
3. Use of an assistive device 2 3 3 3 3 3 3 3 3 2
4. Walking on various terrains
(a) flat surface 1 1 1 1 1 1 1 1 1 1
(b) slope 0 0 1 1 0 1 0 1 0 1
(c) rough ground 1 1 0 1 1 0 0 0 1 0
Total 9 11 11 11 11 11 10 11 11 9
Mean ± SD 10.5 ± 0.85
3.8.3.2 Functional performance score
All participants were able to complete the Berg balance test successfully without
falling. Overall, the mean BBS score for the persons with below-knee amputation was
lower than the able-bodied group (52.9 and 56, respectively). From the scored items,
participants with below-knee amputation had the most difficulty during standing on one
leg, tandem standing, 3600 turning and placing alternate foot on a stool. However,
statistical analysis showed that there was no significant difference in functional balance
status between the amputee and able-bodied groups (p=0.08). The results are presented
in Table 3.13.
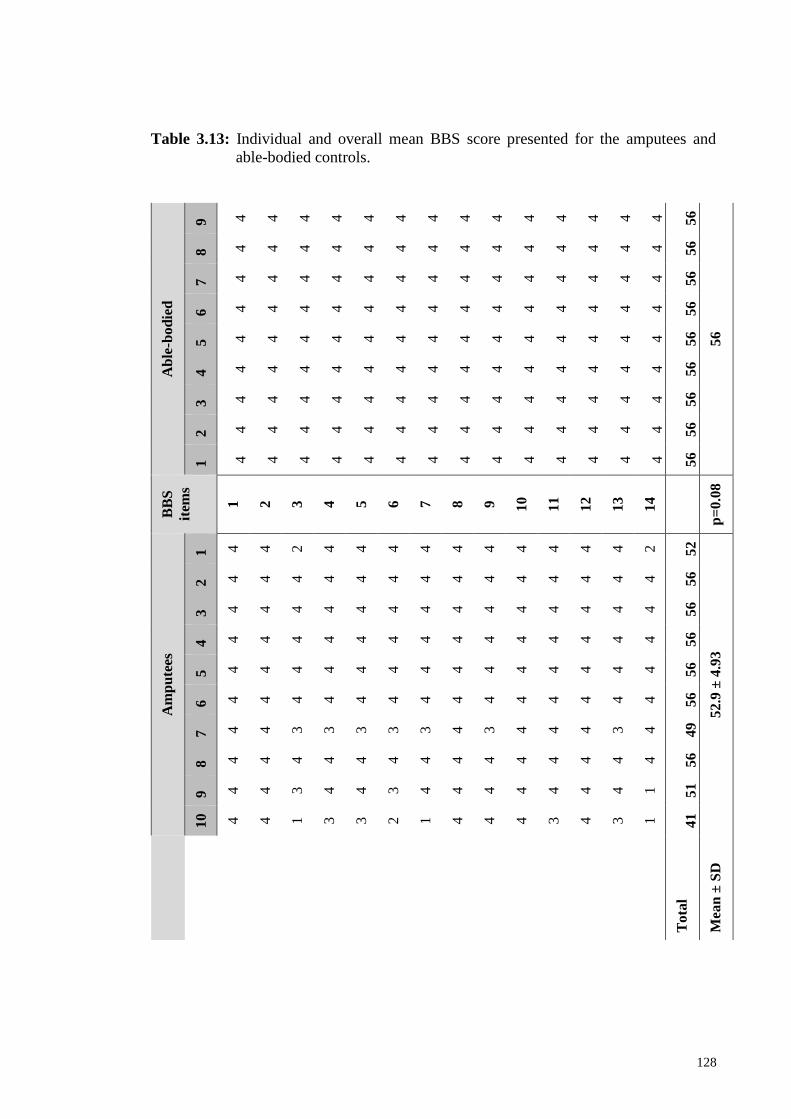
128
Table 3.13: Individual and overall mean BBS score presented for the amputees and
able-bodied controls.
Ab
le-b
od
ied
9 4
4
4
4
4
4
4
4
4
4
4
4
4
4
56
56
8 4
4
4
4
4
4
4
4
4
4
4
4
4
4
56
7 4
4
4
4
4
4
4
4
4
4
4
4
4
4
56
6 4
4
4
4
4
4
4
4
4
4
4
4
4
4
56
5 4
4
4
4
4
4
4
4
4
4
4
4
4
4
56
4 4
4
4
4
4
4
4
4
4
4
4
4
4
4
56
3 4
4
4
4
4
4
4
4
4
4
4
4
4
4
56
2 4
4
4
4
4
4
4
4
4
4
4
4
4
4
56
1 4
4
4
4
4
4
4
4
4
4
4
4
4
4
56
BB
S
item
s
1
2
3
4
5
6
7
8
9
10
11
12
13
14
p=
0.0
8
Am
pu
tees
1 4
4
2
4
4
4
4
4
4
4
4
4
4
2
52
52.9
± 4
.93
2 4
4
4
4
4
4
4
4
4
4
4
4
4
4
56
3 4
4
4
4
4
4
4
4
4
4
4
4
4
4
56
4 4
4
4
4
4
4
4
4
4
4
4
4
4
4
56
5 4
4
4
4
4
4
4
4
4
4
4
4
4
4
56
6 4
4
4
4
4
4
4
4
4
4
4
4
4
4
56
7 4
4
3
3
3
3
3
4
3
4
4
4
3
4
49
8 4
4
4
4
4
4
4
4
4
4
4
4
4
4
56
9 4
4
3
4
4
3
4
4
4
4
4
4
4
1
51
10
4
4
1
3
3
2
1
4
4
4
3
4
3
1
41
To
tal
Mea
n ±
SD
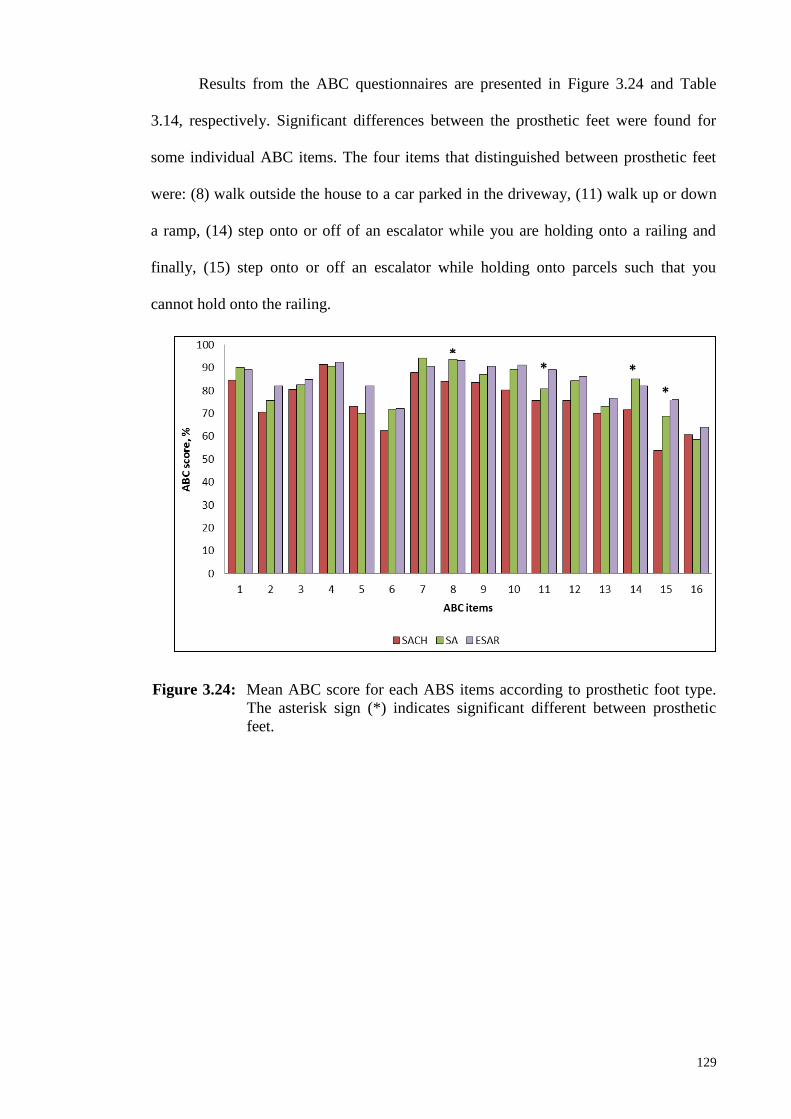
129
Results from the ABC questionnaires are presented in Figure 3.24 and Table
3.14, respectively. Significant differences between the prosthetic feet were found for
some individual ABC items. The four items that distinguished between prosthetic feet
were: (8) walk outside the house to a car parked in the driveway, (11) walk up or down
a ramp, (14) step onto or off of an escalator while you are holding onto a railing and
finally, (15) step onto or off an escalator while holding onto parcels such that you
cannot hold onto the railing.
Figure 3.24: Mean ABC score for each ABS items according to prosthetic foot type.
The asterisk sign (*) indicates significant different between prosthetic
feet.
*
* * *

130
Table 3.14: Mean ABC scores of perceived balance confidence for three prosthetic feet.
Items SACH1 SA2 ESAR3 p-value
(t-test) #
1. Walk around the house 84.5 90 89 0.62
2. Walk up or down stairs 70.5 75.5 82 0.20
3. Bend over and pick up a slipper from front
of a closet floor 80.3 82.3 84.8 0.17
4. Reach for a small can off a shelf at eye
level 91.3 90.5 92.3 0.64
5. Stand on tip toes and reach for something
above your head 73 70 82 0.13
6. Stand on a chair and reach for something 62.3 71.5 72 0.45
7. Sweep the floor 87.7 94 90.5 0.09
8. Walk outside the house to a car parked in
the driveway
84 93.5 93 0.05*
1,2 (0.02)
9. Get into or out of a car 83.5 87 90.5 0.08
10. Walk across a parking lot to the mall 80 89 91 0.10
11. Walk up or down a ramp 75.5 80.5 89 0.02*
1,3 (0.02)
12. Walk in a crowded mall where people
rapidly walk past you 75.5 84.2 86 0.08
13.Are bumped into by people as you walk
through the mall 70 73 76.5 0.75
14. Step onto or off of an escalator while you
are holding onto a railing
71.5 85 82 0.04*
1,2 (0.03)
15. Step onto or off an escalator while
holding onto parcels such that you cannot
hold onto the railing
53.7
68.8
76 0.04*
1,3 (0.01)
16. Walk outside on slippery sidewalks 60.5 58.5 64 0.38
Overall Mean
S.D
79
13.8
86.1
7.5
90.6§
7.1 Note.*Significant at p≤0.05, #Post-hoc testing using Wilcoxon Signed Rank Tests, §significant different
when compared to SACH and SA.
The post-hoc test revealed that for item 8 and 14, the ABC score for SA foot was
significantly higher than the SACH foot (p=0.02 and p=0.03, respectively). As for items
11 and 15, the ESAR foot scored significantly greater than the SACH foot (p=0.02 and

131
p=0.01, respectively). The results also showed that the SACH foot showed the lowest
score for item 15 and the highest for item 4. On the other hand, the SA foot scored the
lowest and highest for items 16 and 7, respectively. Items 16 and 8 were the lowest and
highest scores, respectively, for ESAR foot. The overall score for ESAR was
significantly higher than that of SACH (p=0.04) and SA (p=0.03) feet.
3.8.4 Discussion
This study adopted two types of perceptive analyses tools to evaluate several
aspects of prosthesis and physical functions of participants from amputee and able-
bodied groups. The SF-12v2 health status questionnaire has provided overall physical
and mental status with good reliability and validity (Ware et al., 2002). From the MCS
results, all participants in this study are in good mental status which may not be a
confounding factor that could affect the control of balance. However, the amputee group
exhibited significant lower physical PCS score than that of the healthy group, which
may be due to the loss of the lower limb. The Houghton score has been used in previous
studies to evaluate habitual prosthesis use in terms of duration, places, assistive device
use and negotiating on various surfaces (Akarsu et al., 2012; Leung et al., 1996). All
below-knee amputees in this study demonstrated intensive use of the prosthesis based
on the average Houghton Scale prior to the study. In addition, the current amputees can
be considered as active based on the score obtained (10.5 ± 0.85) which is comparable
to the score obtained from active (8 ± 0.74) and non-active (7.6 ± 0.9) below-knee
amputees from a previous study (Yazicioglu et al., 2007). Furthermore, a Houghton
score greater than 9 has been recommended as a standard score to indicate successful
rehabilitation (Houghton et al., 1992). Interestingly, lower-limb amputees who led an
active lifestyle has been shown to have higher Houghton score which is associated with
improved balance and quality of life (Yazicioglu et al., 2007).

132
When referring to the BBS score guidelines, all amputees in this study exhibited
low risk of falling. This finding is comparable to that of previous study which assessed
functional balance in active below-knee amputees with an average score of 53.7
(Yazicioglu et al., 2007). Similar to previous findings (Wong et al., 2013), participants
from the amputee group experienced more difficulties in tandem standing (standing
with one foot in front of the other), 3600 turning, placing alternate foot on a stool and
standing on one leg. The able-bodied group obtained maximum Berg balance scale.
Surprisingly, this study found that the functional balance of participants with below-
knee amputations were equally capable of maintaining balance during Berg balance
assessment as unimpaired participants. In that case, with the balance capabilities of both
groups determined, researchers of this current study were well informed of the balance
status prior to experimental sessions. Hence, any differences revealed between the two
groups following experimental study will be likely due to the balance deficiency caused
by the amputation.
Balance confidence while wearing prosthesis was identified as one of the
important issues in persons living with lower limb amputations (Legro et al., 1999).
Hence, when it comes to qualitative surveys on perceived balance confidence, the ABC
scale has been adopted due to its good reliability and validity in reporting the effects of
prostheses on their level of confidence during activities of daily living among
individuals with amputation (Miller et al., 2003). An earlier work reported an averaged
ABC score of 88.4 in lower limb amputees (Vrieling et al., 2008b). However, this study
consisted of below-knee amputation subjects wearing various types of prosthetic feet.
Overall, amputees in this study perceived their lowest confidence in more challenging
task such as walking on slippery surface and using the escalator while not holding onto
the railing. On the contrary, the highest perceived confidence level was noted for less
challenging activity such as walking outside the house to the driveway as well as for

133
activities which offer supporting avenue in case when balance is lost such as sweeping
the floor and reaching object on the shelf at eye level.
Our finding demonstated that only 25% of the ABC items (4 out of 16 items)
were shown to distinctly differentiate between prosthetic feet. Specifically, all four
items assessed perceived balance confidence during dynamic activities such as walking
outside the house, negotiating ramps and when using the escalator. From the current
results, it is also reasonable to suggest that these four items aid in distinguising between
articulated and non-articulated prosthetic foot. This is based on the higher overall ABC
score of ESAR and SA compared to that of SACH foot. Hence, this study further
supports the notion that the dissimilarity of prosthetic function between articulated and
non-articulated can be revealed when the amputees engage in more dynamic activities
(van der Linde et al., 2004). However, comparing this current findings are difficult as
there is no prior study which adopted ABC scale as an outcome measure when
comparing prosthesis interventions.
Nevertheless, the significant difference of overall ABC scores between
articulated and non-articulated foot were consistent with the mechanical properties
revealed from the mechanical testing results (Section 3.6). The ESAR foot was found to
exhibit the lowest stiffness at the heel and forefoot regions, which may improve the
comfort and performance during dynamic activities as shown in previous gait studies
(Lehman et al., 1993; MacFarlane et al., 1991; Postema et al., 1997; Snyder et al.,
1991). Moreover, the higher perceived balance score may probably be the result of
greater range of motion provided at the single-axis ankle joint of SA and from the
flexibility of the ESAR as compared with the rigid ankle and keel of the SACH foot.

134
This study was subjected to several limitations, nonetheless. In this study, a
convenient sample of amputees and able-bodied participants were recruited to complete
the self-report and functional performance assessment. Thus, the result of this study
may not be generalized to new or elderly amputees as well as amputees with other
amputation levels. In addition, selecting participants in a non-randomized fashion might
introduce bias to the study. Another limitation that should be considered was the short
accommodation time for each of the prosthetic foot prior to the testing. Although the
duration of one week accommodation was considered adequate for below-knee
amputees for functional prosthesis assessment (English et al., 1995), a longer
accommodation period may change the opinions and ratings of the feet. Future study
involving more amputees with similar amputation etiology may reveal useful outcome
measures to distinguish between prosthetic interventions.
3.8.5 Conclusion
The findings from this study demonstrate that all amputees are categorized as
active ambulators with efficient use of prosthesis. In addition, the amputees exhibited
similar functional balance status with the matched able-bodied group. Although the
overall balance confidence score was able to differentiate between prosthetic feet, only
four individual items were shown to further distinguish the feet. Nevertheless,
knowledge about self-report and functional assessment outcome measures may thus be
important for both the identification of amputees with an increased fall risk and low
balance confidence. More specifically, information from these outcomes may help to
design rehabilitative programs as well as to assist during findings interpretation from the
biomechanical study.
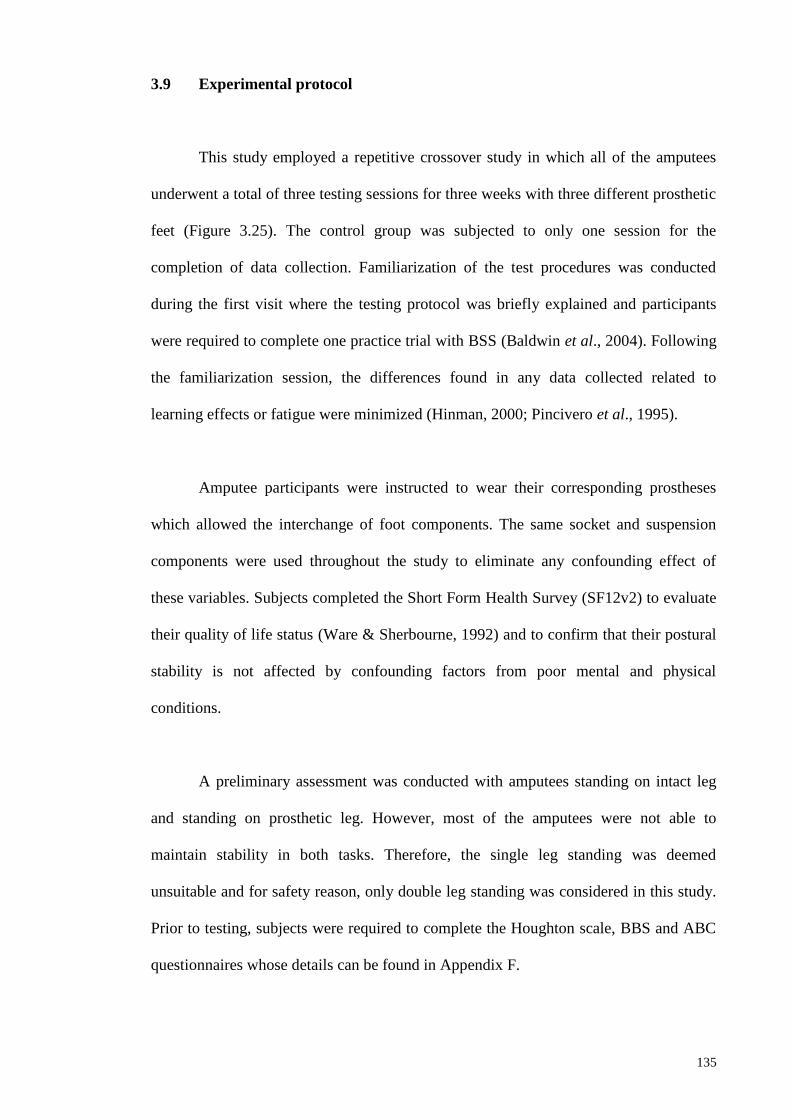
135
3.9 Experimental protocol
This study employed a repetitive crossover study in which all of the amputees
underwent a total of three testing sessions for three weeks with three different prosthetic
feet (Figure 3.25). The control group was subjected to only one session for the
completion of data collection. Familiarization of the test procedures was conducted
during the first visit where the testing protocol was briefly explained and participants
were required to complete one practice trial with BSS (Baldwin et al., 2004). Following
the familiarization session, the differences found in any data collected related to
learning effects or fatigue were minimized (Hinman, 2000; Pincivero et al., 1995).
Amputee participants were instructed to wear their corresponding prostheses
which allowed the interchange of foot components. The same socket and suspension
components were used throughout the study to eliminate any confounding effect of
these variables. Subjects completed the Short Form Health Survey (SF12v2) to evaluate
their quality of life status (Ware & Sherbourne, 1992) and to confirm that their postural
stability is not affected by confounding factors from poor mental and physical
conditions.
A preliminary assessment was conducted with amputees standing on intact leg
and standing on prosthetic leg. However, most of the amputees were not able to
maintain stability in both tasks. Therefore, the single leg standing was deemed
unsuitable and for safety reason, only double leg standing was considered in this study.
Prior to testing, subjects were required to complete the Houghton scale, BBS and ABC
questionnaires whose details can be found in Appendix F.

136
Visit 1
Acclimation period for PF1
Visit 2
Acclimation period for PF2
Visit 3
Acclimation period for PF3
Visit 4
Figure 3.25: The overall protocol for amputee participants in this study with each
prosthetic foot (PF).
Subjects were instructed to step on the BSS platform and stand with a
standardized position with each foot positioned 17 cm between the heel centres and 14˚
between the long axes of the feet to eliminate between-subject variability or biased
Prosthetic foot PF1
- SF-12v2
- Berg score
- Biodex training
Prosthetic foot PF2
Prosthetic foot PF3
END
Physical and
prosthesis
assessment
&
Protocol practice
session
-ABC (PF1)
-Biodex tasks (PF1)
7
days
7
days
7
days
Baseline
-ABC (PF2)
-Biodex tasks (PF2)
-ABC (PF3)
-Biodex tasks (PF3)

137
results during balance testing (Mcllroy & Maki, 1995). The defined heel width was
adopted according to the findings of McIlroy and Maki (1995) as the distance between
the midlines of the right and left heels. Hence, the midlines of the posterior aspects of
the calcaneus were placed accordingly on the platform grid. Similarly, using guidelines
from McIlroy and Maki (1995), the feet angle was determined between the lines joining
the centre of the heel and the great toe of each foot. Moreover, the great toe was used
due to better reliability for foot tracing compared to the more conventional use of the
space between the 2nd and 3rd metatarsals (McIlroy and Maki, 1995). To ensure this
standardized position was maintained accurately for each test across all subjects, the
positions were marked on the balance platform.
During the test, subjects were asked to maintain their arms alongside the body,
and look straight ahead at a point on the wall approximately 1.5m away at eye level to
prevent vestibular distraction and head movement. The platform was then locked into
stable position, and foot placement was recorded as per manufacturer’s guidelines
(Arnold & Schmitz, 1998). Each testing trial lasted for 20 seconds and three testing
trials were measured for reliable measures (Cachupe et al., 2001). Moreover, the
location of the CoM of an obese person is more anteriorly at the base of support which
may desensitize the foot’s mechanoreceptors and causes postural instability (Hue et al.,
2007). As such, to minimize this effect, the stability indexes must be averaged from at
least three trials (Salavati et al., 2009). The participant’s position on the BSS is
illustrated in Figure 3.26.

138
Figure 3.26: Position of participant on the BSS device.
A standardized instruction was given to all subjects to “stand as still as possible”
to ensure high consistency in their body sway during static posturography assessment
(Zok et al., 2008). Subject was allowed to a 30s rest periods (Gear, Bookhout and
Solyntjes, 2011) in a sitting position between trials and were instructed not to change
the position of their feet on the platform (Figure 3.27). The handrails on both sides of
the BSS were positioned and could only be used to prevent falling if the subjects totally
lost their balance. In addition, an assistant stood at the back of the subject for additional
safety. In the event of malposition of the feet or loss of balance, the trial was deleted
and data collection was continued until all trials were completed.
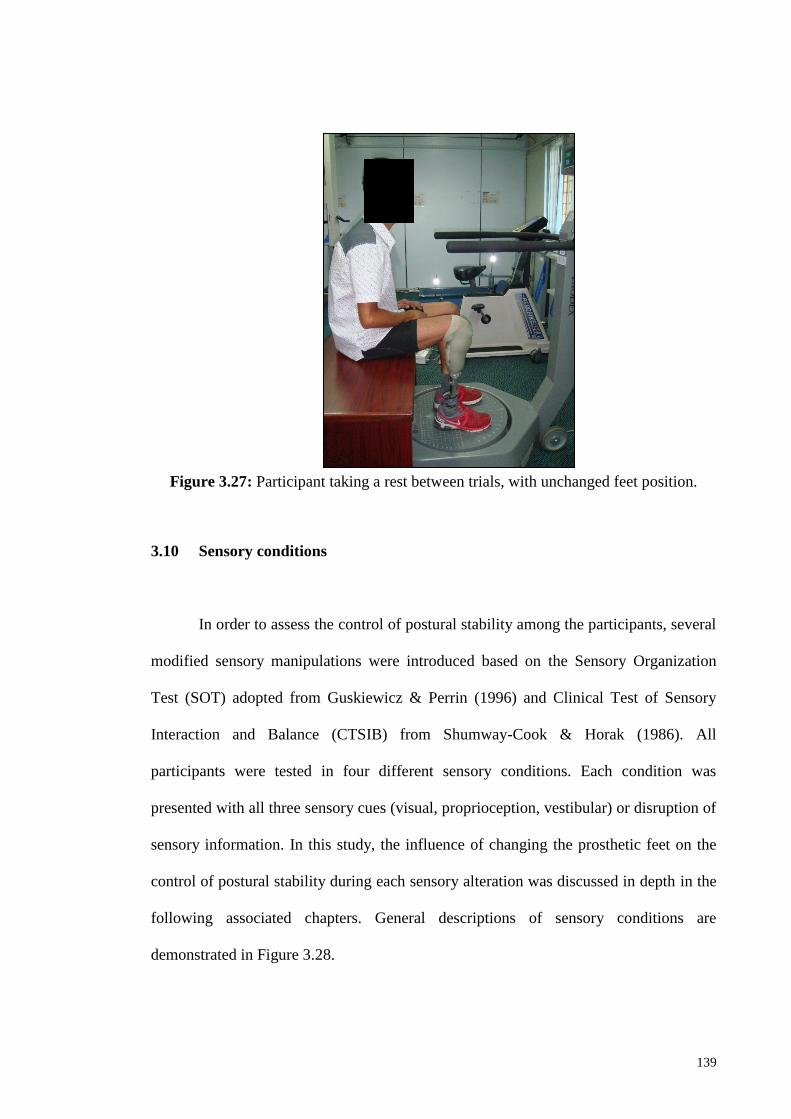
139
Figure 3.27: Participant taking a rest between trials, with unchanged feet position.
3.10 Sensory conditions
In order to assess the control of postural stability among the participants, several
modified sensory manipulations were introduced based on the Sensory Organization
Test (SOT) adopted from Guskiewicz & Perrin (1996) and Clinical Test of Sensory
Interaction and Balance (CTSIB) from Shumway-Cook & Horak (1986). All
participants were tested in four different sensory conditions. Each condition was
presented with all three sensory cues (visual, proprioception, vestibular) or disruption of
sensory information. In this study, the influence of changing the prosthetic feet on the
control of postural stability during each sensory alteration was discussed in depth in the
following associated chapters. General descriptions of sensory conditions are
demonstrated in Figure 3.28.
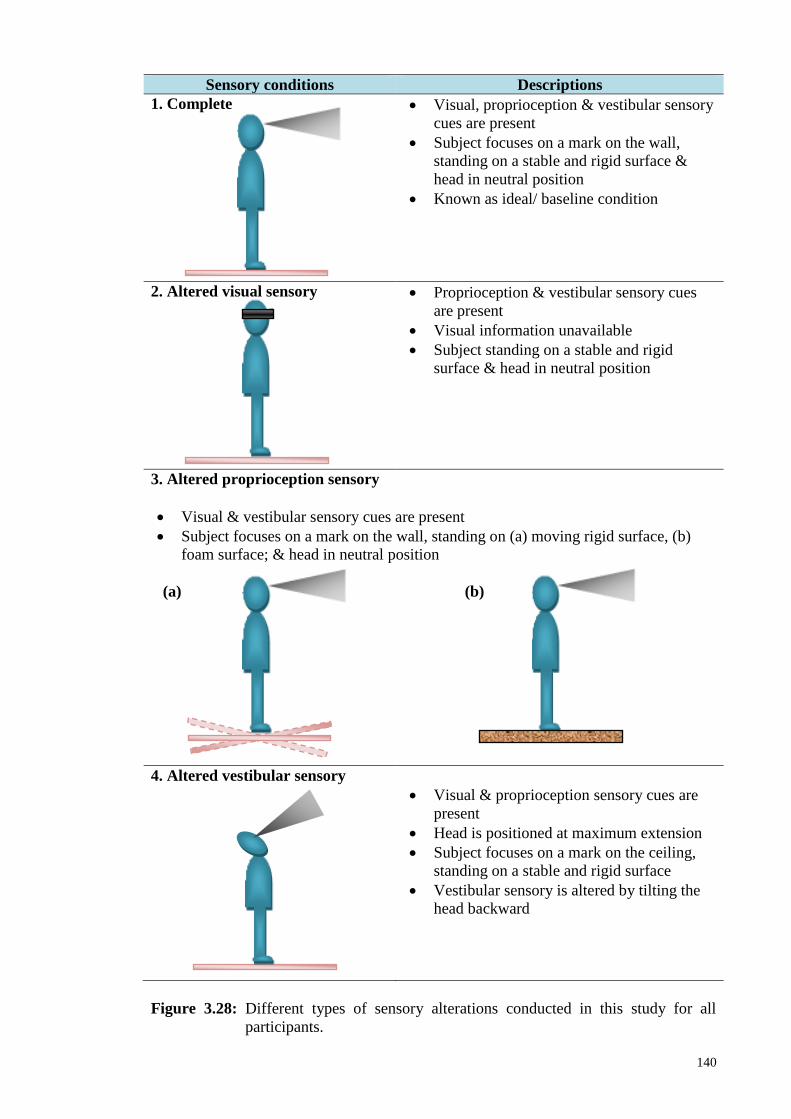
140
Sensory conditions Descriptions
1. Complete
Visual, proprioception & vestibular sensory
cues are present
Subject focuses on a mark on the wall,
standing on a stable and rigid surface &
head in neutral position
Known as ideal/ baseline condition
2. Altered visual sensory
Proprioception & vestibular sensory cues
are present
Visual information unavailable
Subject standing on a stable and rigid
surface & head in neutral position
3. Altered proprioception sensory
Visual & vestibular sensory cues are present
Subject focuses on a mark on the wall, standing on (a) moving rigid surface, (b)
foam surface; & head in neutral position
(a) (b)
4. Altered vestibular sensory
Visual & proprioception sensory cues are
present
Head is positioned at maximum extension
Subject focuses on a mark on the ceiling,
standing on a stable and rigid surface
Vestibular sensory is altered by tilting the
head backward
Figure 3.28: Different types of sensory alterations conducted in this study for all
participants.

141
3.11 Statistical analyses
All experimental data were initially screened for normality of distribution to
ensure that appropriate statistical method was chosen for all analyses. Although
numerical methods such as skewness and kurtosis coefficient can be used for checking
normality of data, a specific normality test provides more formal method to determine
whether the data is normally distributed. For this reason, the Shapiro Wilk’s normality
test was chosen because the total sample in this study was less than 50 (Razali & Wah,
2011). A non-significant result indicates normality (p-value >0.05). Hence, for normally
distributed data, a parametric statistical analysis was adopted. Conversely, a non-
parametric statistical analysis was used when the normality of the data is violated. All
statistical analyses were performed using SPSS v16.0 (SPSS Inc., Chicago, IL, USA),
with the level of significance set at p≤0.05 for all analyses. The details of the statistical
methods used in each experiment are discussed in the methods section of each
associated chapter.
142
CHAPTER 4
INTRARATER TEST-RETEST RELIABILITY OF STATIC AND
DYNAMIC STABILITY INDEXES MEASUREMENT USING THE
BIODEX® STABILITY SYSTEM DURING UNILATERAL STANCE
The degree of agreement among repeated assessment performed by the researcher must
be first established to minimize errors which affect the precision and accuracy of
experimental data. In most of the existing clinical rehabilitation research, the ability to
produce reliable measures is a prerequisite for an accurate assessment of an intervention
after a period of time. Although clinical balance assessment has been performed in
previous study, none has determined the intrarater test-retest reliability of static and
dynamic stability indexes during dominant single stance. In this study, one rater
examined twenty healthy university students in two sessions separated by seven days
intervals. Three stability indexes which are OSI, APSI, and MLSI in static and dynamic
conditions were measured during single dominant stance. Intraclass correlation
coefficient (ICC), standard error measurement (SEM) and 95% confidence interval
(95% CI) were calculated. Test-retest ICCs for OSI, APSI, and MLSI were 0.85, 0.78,
and 0.84 during static condition while 0.77, 0.77, and 0.65 during dynamic condition,
respectively. We concluded that the postural stability assessment using Biodex stability
system (BSS) demonstrates ‘good to excellent’ test-retest reliability over a one-week
time interval.
143
4.1 Introduction
Balance and postural control are vital to ensure safe locomotion activities of
human (Winter et al., 1990a). Postural control is also known as the foundation to
achieve independent standing and walking (Melzer et al., 2004). Therefore, it is
considered as an important aspect in rehabilitation process among the elderly (Baldwin
et al., 2004; Parraca et al., 2011), impaired (Salsabili et al., 2011; Testerman & Griend,
1999) and amputee (Vanicek et al., 2009; Vrieling et al., 2008a) populations. Postural
stability is defined as the ability to maintain an upright posture during quiet stance
during static condition; or the recovery of balance following external perturbation or
displacement of the support surface during dynamic condition (Mackey & Robinovitch,
2005). Poor control of postural stability is often associated with the risk of falling which
consequently leads to death, injuries and loss of mobility (Winter, Patla, Frank & Walt,
1990b).
Postural stability assessment using the force platform is commonly used to
obtain various parameters derives from the center of pressure measures such as
displacement, velocity, and area (Melzer et al., 2004). Although it provides valid
outcomes, it is not sufficient to explain the control of standing posture in both anterior-
posterior and medio-lateral direction (Winter et al., 1990a). Results from other
assessment method such as star excursion balance test (SEBT) are difficult to relate to
activity of daily living (Cachupe et al., 2001). Recently, the Biodex stability system
(BSS) (Biodex, Inc, Shirley, NY) has been presented as a method that is capable in
producing clinical data measurements with application for all range of populations
(Hinman, 2000). The BSS measures the overall stability index (OSI), anterior/ posterior
stability index (APSI) and medial/ lateral stability index (MLSI) from the variance of
platform deflection in degrees from a level position in providing explicit information on

144
movement of the ankle joint. More importantly, it has been showed as reliable tool for
objective assessment of postural stability (Baldwin et al., 2004; Cachupe et al., 2001;
Parraca et al., 2011; Schmitz & Arnold, 1998).
Although previous studies on intratester and intertester reliability were reported
to be clinically reliable for OSI, APSI, and MLSI (Baldwin et al., 2004; Cachupe et al.,
2001; Hinman, 2000; Parraca et al., 2011; Pincivero et al., 1995; Schmitz & Arnold,
1998) only two studies reported on test-retest reliability assessed on the same subjects
during static bilateral stance (Baldwin et al., 2004; Parraca et al., 2011). In addition,
previous studies reported fair to excellent test-retest reliability on the same day
assessment which may not be sufficient to inform intervention research that requires
more time intervals (Hinman, 2000; Pincivero et al., 1995; Schmitz & Arnold, 1998).
Other study which assessed different subjects during different sessions reported
excellent reliability may give false interpretation of the reliability of the BSS system
(Cachupe et al., 2001). During the evaluation of an intervention, it is critical that
researchers are confident that any changes observed are caused by the treatment itself,
not by normal variations in task performance or instrumentation error (van Uden &
Besser, 2004).
While maintaining balance on both limbs has been used as the preferred
mechanism, balance control during unilateral stance is considered as equally important
to avoid fall in response to unexpected perturbation. It has also been used as indicator of
fall incident among elderly and amputees (Mackey & Robinovitch, 2005; Vanicek et al.,
2009). Thus, the aim of this study is to determine the intrarater test-retest reliability
measures of postural stability indexes over a specific time interval during static and
dynamic unilateral stance using the BBS. This study involves healthy adult population

145
to characterize the normal week-to-week variation without the confounding effects
found in impaired balance population.
4.2 Methodology
4.2.1 Participants
A total of 20 healthy university students (8 males, 12 females; age = 21.2 ± 0.4
years; weight = 58.65 ± 13.32 kg; height = 1.61 ± 0.09 m) gave informed consent to
participate in this study. All subjects had no previous lower limb musculoskeletal
injury, neurological or vestibular impairment, or balance disorders. None of the subjects
had any experience with BSS prior to the study. This study was approved by the
Institutional Review Board in accordance with the Helsinki Declaration.
4.2.2 Instrumentation
Postural stability indexes during unilateral stance were measured using the
Biodex stability system (BSS) (Biodex, Inc, Shirley, NY) which consist of a circular
platform that tilt up to 200 in any direction (Schmitz & Arnold, 1998). The stability of
the platform was varied according to the spring resistance levels which ranged from 1
(least stable) to 12 (most stable). The OSI was calculated from the combined degrees of
tilt about the anterior-posterior (AP) and medial-lateral (ML) axes, which was suggested
as the best balance indicator (Testerman & Griend, 1999). Similarly, the APSI and
MLSI were calculated based on the average amount of platform tilt about the AP and
ML axes, respectively (Arnold & Schmitz, 1998). Further discussion on the underlying
theory of BSS can be found in Section 3.7.

146
4.2.3 Protocols
Prior to testing trials, one familiarization trial was performed for each condition
to negate potential effects of learning and fatigue (Hinman, 2000; Pincivero et al.,
1995). A brief explanation of the testing protocols was provided to all subjects. The
testing protocol consisted of a unilateral stance stability test during static and dynamic
conditions. Subjects removed their footwear before instructed to step on the BSS
platform. During the static condition, subjects stood on their dominant leg in full
extension while permitting slight knee flexion on the contralateral side. Dominant leg
was defined by asking the subjects which leg they preferred to kick a ball (Schmitz &
Arnold, 1998). Then, subjects were asked to position their foot at the centre of the
platform, arms at their sides, and look ahead at the feedback display adjusted at their
eyes level to prevent vestibular distraction and head movement. Following this, the
subjects were asked to adjust their foot position to a comfortable standing position while
maintaining the moving pointer at or near the centre point of the display. The platform
was then locked into stable position, and foot placement was recorded as manufacturer’s
guidelines (Mcllroy & Maki, 1995). The position of the foot remained constant
throughout static and dynamic test.
Each testing trial lasted for 20 seconds and five testing trials were measured for
reliable measures (Cachupe et al., 2001). During the 10 seconds rest periods between
trials, subjects were encouraged to bear their weight on the contralateral leg to minimize
fatigue on the test leg. The same protocol was applied to dynamic condition, excluding
the platform stability level. During this test, the subjects were instructed to maintain an
upright position on the unstable surface of the BSS which was set at level-eight
resistance (Parraca et al., 2011; Paterno et al., 2004; Pincivero et al., 1995; Schmitz &
Arnold, 1998). Subjects were instructed to place the contralateral leg at the back corner

147
of the BSS in any occasion when they lost their balance. Handrails could only be used
to prevent falling if the subjects totally lost their balance. In the event of this, the trial
was deleted and data collection was continued until all trials was completed. It was
assumed that all differences in the results obtained were not related to the subjects’
ability to learn and master the process. The order of testing during both conditions was
randomized.
To assess the test-retest reliability of the postural stability measurements, all
subjects were evaluated again one week later (Parraca et al., 2011; van Uden & Besser,
2004). This timeframe is generally believed to be reasonable in avoiding unwanted
clinical changes in the rater and subjects involved. Additionally, test-retest repeatability
and reproducibility guidelines of the National Institute of Standards and Technology
(Taylor & Kuyatt, 1994) were adhered to, which are as follows: using the same
measurement protocol, tester, measuring instrument, conditions, time, and location.
4.2.4 Statistical Analysis
The mean and standard deviation of stability index scores (OSI, APSI, MLSI)
were extracted from BSS software and were manually entered into statistical software.
All data was initially screened for normal distribution using the Shapiro-Wilk normality
test. Paired t-test was adopted to compare mean of the test (Week 1) and retest (Week 2)
stability index scores in each condition to confirm the absence of systematic bias
(Atkinson & Nevill, 1998).
Relative measure of test-retest reliability for all stability scores were determined
according to the intraclass correlation coefficient (ICC3,1) which is a two-way mixed
effects reliability model (Shrout & Fleiss, 1979). This calculation was based on a

148
standard repeated-measures ANOVA which also calculated the mean differences across
trials to assess systematic error (Weir, 2005). Fleiss classification of ICC was used to
describe the degree of reliability: ICC > 0.75 indicated excellent reliability, 0.4< ICC<
0.75 signified fair to good reliability, and ICC < 0.4 were considered poor reliability
(Fleiss, 1986).
Absolute reliability was determined according to the standard error of
measurement (SEM) using the following equation: 1SEM SD ICC ; where SEM
indicates the standard error of measurement (precision) (Shrout & Fleiss, 1979) and the
SD is the mean SD of Week 1 and 2 (Adsuar, Olivares, Parraca & Gusi, 2011; Weir,
2005). The 95% CI of ICC values were also calculated for all variables to demonstrate
how closely the measurements agree on different occasions (Brenton-Rule et al., 2012).
All statistical analysis was performed using SPSS v16.0 (SPSS Inc., Chicago, IL, USA),
with p≤0.05.
4.3 Results
The analysis of normality test showed that all data was normally distributed.
There was no significant difference between Week 1 and Week 2 mean stability index
scores in all condition, which indicates the absence of any systematic bias (Table 4.1).
In static condition, all stability indexes showed excellent intrarater test-retest
relative reliability as indicated by the ICC (OSI=0.85, APSI=0.78, MLSI=0.84). During
dynamic condition, however, good to excellent intrarater test-retest relative reliability
were exhibited in all stability indexes (OSI=0.77, APSI=0.77, MLSI=0.65). Absolute
reliability for stability indexes were nearly zero for static condition (SEM=0.08 to 0.1)
condition compared to dynamic condition indicated more precise score during the latter

149
condition. The analysis of 95% CI revealed narrower band in static compared to
dynamic condition.
4.4 Discussion
We found that the BSS was a reliable tool for postural assessment because
intrarater agreement were very good or excellent ranged from 78% to 85% and 65%
to 77% during static and dynamic condition, respectively. High ICC score (ICC > 0.75)
for most of the stability scores suggested that the measurement error is small relative to
the between-session variability (Walter et al., 1998). To our knowledge, although
previous studies (Paterno et al., 2004; Schmitz & Arnold, 1998) assessed intrarater
reliability during unilateral dynamic stance, comparison of result to our study is difficult
due to different stability levels, small sample size, and same day assessment in those
studies.
In this study, the measurement of balance score during static condition was
more accurate than that of dynamic condition, as reflected in the SEM values. The
analysis of 95% CI for all stability indexes indicated good measurements agreement
between sessions during static than dynamic condition. We found that the absence of
postural assessment during unilateral static stance from previous literatures limits the
possibility to associate our results with others. In our opinion, the BSS should also be
used for static condition testing as it serves as baseline assessment before progressing
into dynamic testing for populations with deteriorate musculoskeletal condition.

150
Table 4.1: Summary of the stability index score, SEM, ICC, and 95% CI during unilateral stance in static and dynamic
postural stability assessment with seven days separation period.
Static Dynamic
Stability
Index
Week 1
Mean
(SD)
Week 2
Mean
(SD)
p-
value
SEM ICC 95%
CI
Week 1
Mean
(SD)
Week 2
Mean
(SD)
p-
value
SEM
ICC
95%
CI
OSI 0.74
(0.25)
0.70
(0.25)
.338 0.10 0.85 0.61-
0.94
1.51
(0.90)
1.28
(0.51)
.129 0.34 0.77 0.42-
0.91
APSI 0.46
(0.16)
0.45
(0.17)
.643 0.08 0.78 0.45-
0.91
1.14
(0.75)
0.98
(0.45)
.206 0.29 0.77 0.43-
0.91
MLSI 0.46
(0.20)
0.40
(0.18)
.076 0.08 0.84 0.60-
0.94
0.77
(0.50)
0.66
(0.24)
.210 0.22 0.65 0.12-
0.86
Note. OSI: overall stability index, APSI: anterior/ posterior stability index, MLSI: medial/ lateral stability index, ICC: intraclass correlation coefficient,
SEM: standard error of measurement, CI: confidence interval.

151
While static balance requires maintaining the body’s center of mass within the
base of support, dynamic balance involves motion in response to effects of ground
reaction force and the ankle’s muscle forces (Pollock et al., 2000). Therefore, difference
results between static and dynamic conditions are anticipated due to greater muscular
activity around the ankle joint in maintaining postural balance on an unstable BSS
platform, and inherent variability of postural stability parameters among the studied
subjects (Schmitz & Arnold, 1998). The BSS provides more specific information on
ankle joint movements (Arnold & Schmitz, 1998; Salsabili et al., 2011) due to its ability
to measure the degree of platform tilt about AP and ML axis during dynamic conditions.
The amount of tilting of the platform indicates amount of instability associated at the
ankle joint under dynamic stress which is theoretically related to proprioception and
neuromuscular feedback (Testerman & Griend, 1995). This means that the application
of BSS is sufficient in assessing the status of postural balance in determining the
outcome after lower limb injuries or impairment of specific population.
In this study, several limitations which may hinders generalization of the results
were considered. First, all subjects adopted their own comfortable foot position during
testing which may increase the inter-subject variability as well as affecting the control
of medial-lateral stability (Mcllroy & Maki, 1995). However, because healthy subjects
were shown to adopt the same range of preferred foot position, this variation is not
clinically significant (Mcllroy & Maki, 1995). Secondly, this study recruited university
students who shares similar characteristics in terms of age, mass and living style which
may not represent other populations, such as geriatrics. Finally, although gender
differences have been found in postural sway (Guskiewicz & Perrin, 1996), the
reliability of these measures is not influenced by such factor (Mcllroy & Maki, 1995).
152
4.5 Conclusion
In summary, the stability indexes produced from BSS are reliable when scored
by a single rater between days of interval during static and dynamic unilateral stance.
The application of this approach should be used in quantifying postural balance in
assessing effectiveness of a specific clinical or research intervention for repeated
measurement design.

153
CHAPTER 5
THE EFFECTS OF PROSTHETIC FOOT TYPES AND VISUAL
ALTERATION ON POSTURAL STEADINESS IN BELOW-KNEE
AMPUTEES.
Achieving independent upright posture has known to be one of the main goals in
rehabilitation following lower limb amputation. As discussed in Section 2.3, visual
cues are one of the important sensory inputs that contribute to the control of postural
stability in individuals with lower limb amputation. The purpose of this study was to
compare postural steadiness of below knee amputees with visual alterations while
wearing three different prosthetic feet. Objective assessment of postural stability was
completed using Biodex® balance platform under different visual input conditions.
Perceived balance assessment of each foot was evaluated using Activities-specific
Balance Confidence (ABC) score. The results of this study suggested that postural
steadiness in below-knee amputees was not affected by the types of prosthetic foot
during quiet upright standing, but was significantly affected during the absence of visual
cues.

154
5.1 Background
The ability to maintain postural stability is the foundation of achieving
independent standing and walking (Melzer et al., 2004). It is a complex task that
integrates somatosensory (proprioceptive, cutaneous and joint), visual and vestibular
inputs along with motor coordination to maintain the center of mass (CoM) within the
base of support (Blackburn et al., 2000; Shumway-Cook & Woollacott, 2000;
Shumway-Cook & Horak, 1986). Any deficits in these components will result in poor
control of body posture, which is often associated with the risk of falling and has been
identified as a major health problem (Winter et al., 1990). In people with lower limb
amputations, they must compensate for the challenging task in maintaining postural
stability by increasing dependence on visual and vestibular information (Shumway-
Cook & Woollacott, 2000). Due to the important role of visual information, postural
stability assessment with eyes-closed condition is necessary to determining the
utilization of other sources of sensory information during postural control in addition to
the eyes-open condition which serves as baseline clinical assessment (Redfern et al.,
2001). In fact, previous study showed that the absence of vision input will increase the
postural sway and asymmetry of stance in below-knee amputees (Isakov et al., 1992).
In able-bodied person, the motor coordination responsible for postural stability
maintenance consists of ankle and hip strategies which produce corrective torque in
order to counter the destabilizing torque due to gravity that causes deviation of the CoM
(Horak, 2006). In the absence of perturbation, the muscle contracts eccentrically to
resist the gravitational forces. However, in order to maintain postural stability during
perturbation, concentric muscle contraction is essential. Hence, stiffer muscles
potentially increase the efficiency of postural control mechanism. Researchers theorized
155
that stiffness of the ankle muscle might play an important role in maintaining balance
and joint stability (Blackburn et al., 2000; Vrieling et al., 2008). However, loss of
muscular structures as results of below-knee amputation causes deficits in sensory input
from proprioceptive component at the feet and ankle. As a result, amputees exhibit a
higher incidence of falling than able-bodied people because of the former’s deficits in
controlling horizontal movements in medial-lateral or anterior-posterior directions
(Miller et al., 2001).
Consequently, to substitute for the loss of the ankle-foot complex, the prosthetic
foot is prescribed for the amputees. Along with advancements in technology, prosthetic
foot has gone through tremendous transformations in terms of design and materials
used. From previous postural balance assessment in the amputee subjects, researchers
suggested that reduced sway may be due to the relatively stiff ankle of the
prosthetic foot which limits the dorsiflexion or plantarflexion movement (Nederhand et
al., 2012; Buckley et al., 2002). However, the effect of such stiffness to the postural
balance remains unclear due to the variations in types of prosthetic feet tested in such
studies that may have had influenced their balance performance.
Although balance confidence and stability has shown to associate with walking
performance and social activity (Miller et al., 2001), studies on postural balance with
different foot category are scarce compared with research on other biomechanical areas
(Hafner, 2006). The primary purpose of this study is to systematically assess the
influence of three different prosthetic foot types to the overall, medial-lateral, and
anterior-posterior control of postural steadiness in person with below-knee amputation.
The secondary purpose was to compare postural steadiness during quiet standing when
visual inputs were altered.

156
5.2 Methodology
5.2.1 Participants
A convenience sample of ten male unilateral below-knee amputees gave written
consent to participate in this study. All subjects had at least one year experience in
current prosthesis and able to walk without the use of assistive device. Subjects with
visual or vestibular impairment, residuum pain, other neurological deficits or
musculoskeletal injury were excluded. This study was approved by the Institutional
Review Board in accordance with the Helsinki Declaration. Subjects are all recruited
via the University of Malaya Medical Centre that undergone the same rehabilitation
programs. In this study, each subject served as his own control. Details of participants'
demographic and prosthetic information are shown in Section 3.5 (Table 3.2).
5.2.2 Equipment and protocol
Three different foot types were tested: solid ankle cushion heel foot (Enjoylife,
Fujian, China), single-axis foot (Enjoylife, Fujian, China) and energy saving and return
foot Talux® (Ossur, Reykjavik, Iceland). Detailed discussion on the material, design
and mechanical characteristic of each foot type can be found in Section 3.6. Each test
foot was attached to the patient’s existing prosthesis and optimally aligned by the same
registered prosthetist. After completed the static and dynamic alignments, subjects
walked for 15 minutes to familiarize with the foot. Subjects were tested with their own
socket and suspension components throughout the study.
157
Familiarization of the test procedures was conducted during the first visit.
Subjects completed the Short Form Health Survey (SF12v2) and the Berg balance test
prior testing. Details on these outcome measures are outlined in Section 3.8. Subjects
who failed to maintain equilibrium during the test were excluded from the study. The
first foot type was fitted during the first visit. After one week of accommodation period,
subjects return to the laboratory for assessment. All subjects completed the Activities-
specific Balance Confidence (ABC) scale at each testing session to rate their balance
confidence of a particular test foot. The test was counterbalance across subjects to
negate order effects.
For this specific study, the postural stability indexes during quiet standing was
assessed using the Biodex Stability System (BSS) (Biodex Medical System, Shirley,
NY, USA) as discussed in Section 3.7. Participants stood with eyes-opened (EO) and
eyes-closed (EC) while wearing three different prosthetic feet. A detailed description of
the protocol can be found in Section 3.9.
5.2.3 Statistical analysis
All data were initially screen for normality of distribution by using the Shapiro
Wilk’s test. Therefore, non-parametric statistical analyses were adopted. The
Friedman’s repeated measures test were used to compare the overall ABC score and
stability indexes for the three prosthetic feet. When differences were identified between
groups, post-hoc pairwise comparison was conducted to determine where the significant
differences occurred. The Wilcoxon-signed rank test was used to compare between EO
versus EC conditions and APSI versus MLSI score for each prosthetic foot. Statistical

158
analysis was performed using SPSS v16.0 (SPSS Inc., Chicago, IL, USA), with level of
significance was set at p≤0.05 for all analysis.
5.3 Results
5.3.1 Participants’ characteristics
The mean age, weight and height for all ten participants were 44.8 ±13.5 years,
77.0 ±17.9 kg and 1.70±0.06 m, respectively. No significant differences were observed
among the amputees in terms of age, height, and body mass. The Berg balance score
indicated that all participants have a low risk of falling. According to the Medicare
Functional Classification Level (Agrawal et al., 2013a), participants engaged in K2-K3
activity level.
5.3.2 Comparison between prosthetic foot types
The average and mean values for all outcome parameters with the significant
differences observed are depicted in Table 5.1. When Friedman test were made between
prosthetic foot types (SACH vs SA vs ESAR), the stability indexes score (OSI, APSI,
MLSI) revealed non-statistically significant differences during both eyes-opened
condition (p=0.651, p=0.607, p=0.317 respectively) and eyes-closed condition
(p=0.651, p=0.630, p=0.891 respectively). The MLSI was statistically higher than APSI
for ESAR foot in both eyes-opened and eyes-closed conditions (p= 0.034 and p=0.017,
respectively).

159
5.3.3 Comparison between eyes-opened and eyes-closed
Comparative Wilcoxon-signed rank analysis between visual conditions (EO-EC)
revealed that the OSI, APSI and MLSI score were higher during eyes-closed compared
to that of eyes-opened condition for all foot types (Figure 5.1). However the differences
of stability scores between the two conditions were only statistical significant in SACH
foot and ESAR foot. Differences of stability scores for SA foot failed to reach any
significant differences during eyes-closed and eyes-opened conditions (Figure 5.2).
Table 5.1: The mean and (standard deviation) of stability indexes score and ABC score
for three types of prosthetic foot during eyes-opened and eyes-closed
conditions.
Note.¥p<0.05: significant difference in comparison to MLSI and APSI; *p<0.05: significant difference in
comparison to eyes-opened (EO) and eyes-closed (EC); ap<0.05: significant difference when compared
with ABC score between SACH and ESAR using post-hoc analysis; bp<0.05: significant difference when
compared with ABC score between SA and ESAR using post-hoc analysis.
5.3.4 Perceived-balance assessment
The analysis of ABC score demonstrated a statistically significant differences
between the SACH, SA and ESAR foot (p=0.016). Further post-hoc analyses revealed
Outcomes
parameters
Visual cues Types of prosthetic foot
SACH SA ESAR
APSI mean (sd) EO 1.08 (1.02)* 0.80 (0.68) 0.65 (0.34)¥ *
EC 1.89 (0.96) 1.33 (0.61) 1.80 (1.03)¥
MLSI mean
(sd)
EO 1.09 (0.92)* 1.58 (1.94) 1.59 (1.35)¥*
EC 2.52 (1.19) 2.30 (1.18) 2.76 (1.37)¥
OSI mean (sd) EO 1.71 (1.25)* 1.90 (1.99) 1.86 (1.34)*
EC 3.43 (1.17) 2.91 (1.06) 3.58 (1.49)
ABC score mean (sd) 79 (13.8)a 86.1 (7.5)b 90.6 (7.1) a,b

160
that the differences occurred between ESAR and SACH (p=0.043) as well as ESAR and
SA (p=0.028).
Figure 5.1: Overall (OSI), anterior-posterior (APSI) and medial-lateral (MLSI)
stability indexes score in mean (± standard error) between prosthetic
foot types during eyes-opened and eyes-closed conditions. The asterisk
sign indicates statistically significant differences (p<0.05) between
APSI and MLSI within the same visual condition.
Figure 5.2: Differences of overall (OSI), anterior-posterior (APSI) and medial-lateral
(MLSI) stability index score between eyes-closed and eyes-opened
conditions in mean (± standard error) according to prosthetic foot type.
The asterisk sign indicates statistically significant differences (p<0.05).

161
5.4 Discussion
In this study, the influence of three prosthetic foot types to the postural
steadiness in person with below-knee amputation was assessed during unperturbed
standing. Additionally, the contribution of visual information in maintaining postural
balance was evaluated. We demonstrated the possibilities of using Biodex stability
system to provide clinical static balance assessment before progression into dynamic
testing and training for populations with lower-limb amputation. Moreover, static
balance has become an essential skill in rehabilitation process for the amputee
populations to achieve independent standing and walking (Melzer et al., 2004; Vrieling
et al., 2008)
Prosthetic foot was prescribed to help amputees regulate the body’s CoM within
the base of support to achieve postural equilibrium during quiet standing, as opposed to
the plantarflexors-dorsiflexors mechanism in able-bodied person (Winter et al., 1990a).
The primary findings in our study revealed that the control of postural steadiness during
unperturbed bilateral standing was unaffected by the types of prosthetic foot used.
Nevertheless, it is important to note that the SACH foot scored the lowest OSI
indicating the least body sway when standing with the eyes-opened. This result may be
due to the rigid ankle which offers no articulation thus minimizing the excursion of the
CoM. Additionally, it further supports the notion from previous study that stiffer
prosthetic foot maybe a potential justification in enhancing the safety of postural
stability in this population by decreasing the body sway (Nederhand et al., 2012).
Similarly, our results were in accordance with previous study which proposed that the
CoM excursion may have been constrained by the stiffness of the prosthetic ankle

162
complex (Buckley et al., 2002). However, our study did not quantify the contribution
from the intact limb or musculature of the residual limb which may influence the control
of postural steadiness (Vrieling et al., 2008).
In contrast, the SA foot was considered most stable compared to other types of
feet when visual input was removed as indicated by the lowest OSI. This finding
suggested that the elimination of visual will increase utilization of other source of
sensory information input in the organization of postural control. Particularly, the
residual limb has been suggested to enhance the limited proprioceptive information
(Buckley et al., 2002) as the body weight is transmitted to the soft tissues via the socket
to control the postural responses initiated at the ankle joint (Winter et al., 1990a).
Additionally, the proprioception input from residual limb muscles may cause some
movements at the ankle joint in the SA foot to counterbalance the body’s natural
fluctuation in response to gravity during quiet standing. Our results agreed with the
suggestion of prosthetic ankle range of motion as an important characteristic in foot-
ankle component selection (Mayer et al., 2011).
In able-bodied person, the lateral stability is controlled by alternating the
activation of the hip abductors and adductors in order to transfer the body’s CoM
between the legs (Zmitrewicz et al., 2006). However, lower limb amputation leads to
insufficient control of weight-shifting to maintain posture which has caused instability
in medial-lateral direction. We found that the deviation of CoM was greater in frontal
plane as depicted by higher MLSI scores compared to APSI scores in both eyes-opened
and eyes closed conditions for all foot types. The results of our study were in agreement
with previous findings that an increase of CoM excursion in the medial-lateral direction
maybe the results of compensation strategy to the impairment in controlling balance in

163
the anterior-posterior direction (Mayer et al., 2011). However, the MLSI was
significantly higher than APSI score in ESAR foot during eyes-opened and eyes-closed.
This may be possibly due to the flexibility of the carbon fibre ESAR foot which
provides eversion and inversion causing more sway movement and instability to the
most of the subjects where single-axis foot is their habitual prosthesis. Additionally, the
fear of falling which often occurs among the amputees can also lead to additional use of
the hip strategy (Adkin et al., 2000), which is reflected by the high stability indexes in
medial-lateral direction in all prosthetic feet. Therefore, the medial-lateral instability
experienced by the amputees can be utilized as a predictor for risk of falling (Maki et
al., 2000). This finding highlights the importance of learning how to balance over the
prosthetic foot in order to control the displacement of CoM over the base of support for
the amputees. Our results suggest that it is necessary to validate the improvement of
postural stability in frontal plane following fall prevention program among the
amputees.
Vision has been suggested as the main source of information used in the
regulation of posture control under normal situation (Shumway-Cook and Horak, 1986).
The findings of this current study corroborate with previous studies on amputees that
showed greater postural instability when visual cues was occluded (Vanicek et al.,
2009). Explicitly, regardless of foot type, this study showed that the stability indexes
were higher during eyes-closed condition which indicated greater deviation of CoM.
The differences in balance indices between eyes-opened and eyes-closed conditions
were only significance for SACH and ESAR, suggesting habitual adaptation to SA foot
for most of the subjects.
164
Significant differences in the ABC scores found between prosthetic feet
suggested that the amputees perceived disparities between the passive stability offered
by the ankle mechanisms. Their perceived balance confidence was the highest in ESAR
foot, followed by SA and SACH foot. This finding may be due to improved gait
performance in lower-limb amputees such as increased tibial forward progression and
adaptability to uneven terrain when using ESAR foot as reported previously (Mayer et
al., 2011; Zmitrewicz et al., 2006).
We acknowledged that lack of previous studies comparing the influence of
prosthetic foot types on the control of postural stability limits the possibility to associate
our results with others. In addition, variations found in the length of residual limb
among the subjects may affect postural stability where shorter residual limb exhibited
larger body sway than that of medium length (Lenka and Tiberwala, 2007).
Additionally, the current results are only indicative for lower limb amputees whom are
typical community ambulator and may not be generalized to all amputees. While the
present study assessed balance control during quiet standing, future research should
investigate the response of different prosthetic feet during more challenging situations
to resemble real life situations. Results in this study were based on balance performance
from a mixture of traumatic and diabetes caused of amputation. Researchers reported
that person with amputation due to vascular adopted different balance control strategy
with those of non-vascular reason due to poor somatosensory status found in
dysvascular amputees, which caused an increase of body sway during quiet standing
(Quai, Brauer, & Nitz, 2005). Therefore, larger sample size with similar characteristics
might find a statistically significant difference in terms of postural control between
prosthetic foot designs.

165
5.5 Conclusion
The current study demonstrated that prosthetic foot types did not influence the
maintenance of postural steadiness in below-knee amputees although there was a trend
of better stability with rigid ankle foot. Nevertheless, visual cues were shown to affect
postural stability in SACH and ESAR foot. This initial finding should be considered
when prescribing the prosthetic foot to the amputees.

166
CHAPTER 6
POSTURAL STABILITY CHARACTERISTICS OF TRANSTIBIAL
AMPUTEES WEARING DIFFERENT PROSTHETIC FOOT TYPES
WHEN STANDING ON VARIOUS SUPPORT SURFACES.
For amputees to return to their daily life activities, the ability to maintain postural
balance is essential while adapting to various support surface conditions. In Section 2.3,
the vital role of somatosensory system (which consist of muscle proprioception, joint
and cutaneous afferents) in contributing to the control of postural stability has been
discussed. This study aimed to evaluate the effects of prosthetic foot types on the
postural stability among transtibial amputees when standing on different support
surfaces. Stability indexes were measured by computed posturography in an upright
stance on firm, foam, and unstable support surfaces. The mean OSI score of SACH foot
was significantly lower than that of an ESAR foot when the participants were standing
on a compliant surface. When compared to able-bodied group, MLSI score was
significantly higher for each of the prosthetic foot while OSI score was significantly
higher for ESAR foot only in foam condition. Differences between prosthetic foot types
and groups (amputees versus able-bodied) can be distinguished only when individuals
were standing on a compliant surface. Amputees exhibited an increased postural
instability in the medio-lateral direction than able-bodied individuals. Hence, the
restoration of stability in the frontal plane and the enhancement of proprioception at the
residual limb should be the basis of rehabilitation programs.

167
6.1. Introduction
Postural stability is achieved by maintaining an upright body alignment against
gravitational force and preserving the equilibrium of the center of mass (CoM) in an
individual’s base of support (Massion and Woollacott, 2004). Successful postural
control requires the contribution from a complex sensory system comprising visual,
somatosensory, and vestibular modalities as well as motor control systems (Horak et al.,
1990; Shumway-Cook and Woollacott, 2000). Healthy individuals greatly rely on
somatosensory (70%), vestibular (20%), and visual (10%) perceptions when they stand
on a firm surface under well-lit conditions (Peterka, 2002). By comparison, individuals
mainly rely on vestibular and vision stimuli when the support surface changes because
of inaccurate inputs from somatosensory components. Particularly, proprioception is
one of the specialized components in the somatosensory system that provides
information on the perceptions and awareness of joint movements and positions
(passive and active) (Lephart et al., 1992; Newton, 1982). Afferent inputs from
mechanoreceptors located at the joints and muscles surrounding the ankle possibly
influence the proprioceptive control of balance (Allum et al., 1998; Richie, 2001).
Researchers suggested that the perception of the support conditions is necessary to
retain the CoM within the support area in an erect human stance (Horak, 2006;
Mouchnino et al., 1998). As such, the ability to reorganize postural strategies depending
on different support surface is a key in maintaining balance (Horak, 2006).
Ankle and hip strategies are considered responsible for the control of horizontal
CoM movements in anterior-posterior and medio-lateral directions, respectively (Horak,
2006; Buckley et al., 2002). However, postural stability is decreased after individuals
are subjected to below-knee amputation because of several factors, such as the lack of
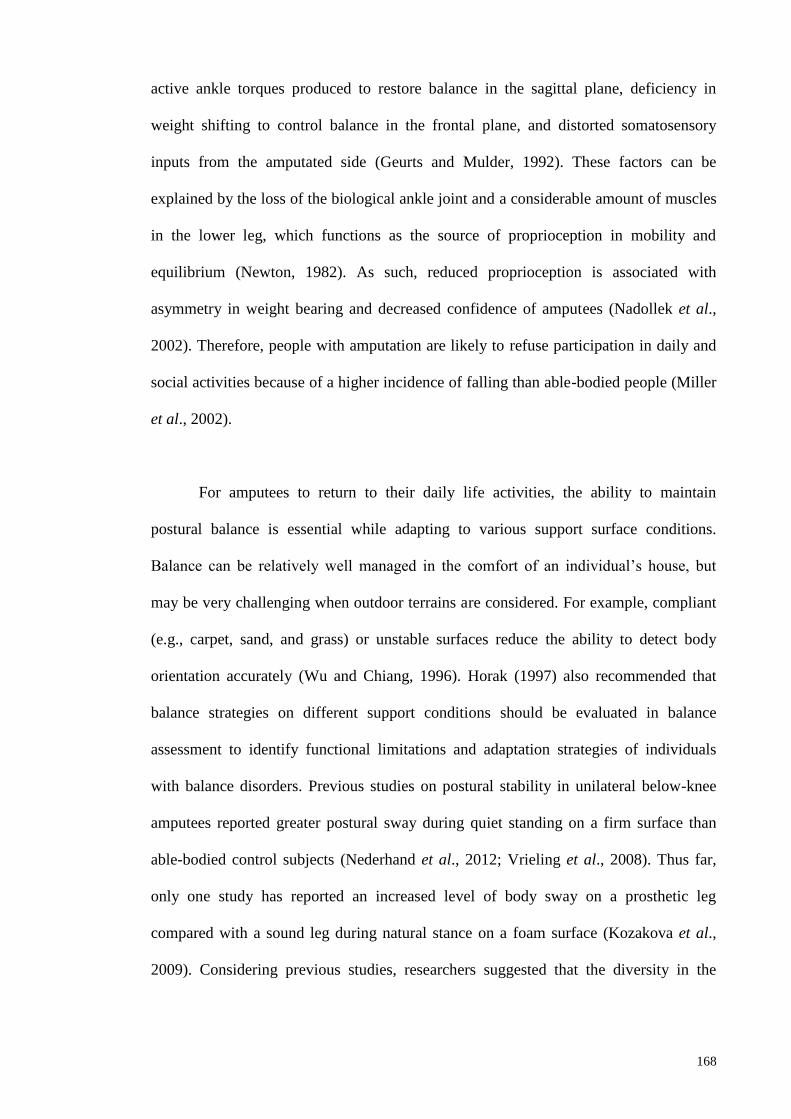
168
active ankle torques produced to restore balance in the sagittal plane, deficiency in
weight shifting to control balance in the frontal plane, and distorted somatosensory
inputs from the amputated side (Geurts and Mulder, 1992). These factors can be
explained by the loss of the biological ankle joint and a considerable amount of muscles
in the lower leg, which functions as the source of proprioception in mobility and
equilibrium (Newton, 1982). As such, reduced proprioception is associated with
asymmetry in weight bearing and decreased confidence of amputees (Nadollek et al.,
2002). Therefore, people with amputation are likely to refuse participation in daily and
social activities because of a higher incidence of falling than able-bodied people (Miller
et al., 2002).
For amputees to return to their daily life activities, the ability to maintain
postural balance is essential while adapting to various support surface conditions.
Balance can be relatively well managed in the comfort of an individual’s house, but
may be very challenging when outdoor terrains are considered. For example, compliant
(e.g., carpet, sand, and grass) or unstable surfaces reduce the ability to detect body
orientation accurately (Wu and Chiang, 1996). Horak (1997) also recommended that
balance strategies on different support conditions should be evaluated in balance
assessment to identify functional limitations and adaptation strategies of individuals
with balance disorders. Previous studies on postural stability in unilateral below-knee
amputees reported greater postural sway during quiet standing on a firm surface than
able-bodied control subjects (Nederhand et al., 2012; Vrieling et al., 2008). Thus far,
only one study has reported an increased level of body sway on a prosthetic leg
compared with a sound leg during natural stance on a foam surface (Kozakova et al.,
2009). Considering previous studies, researchers suggested that the diversity in the
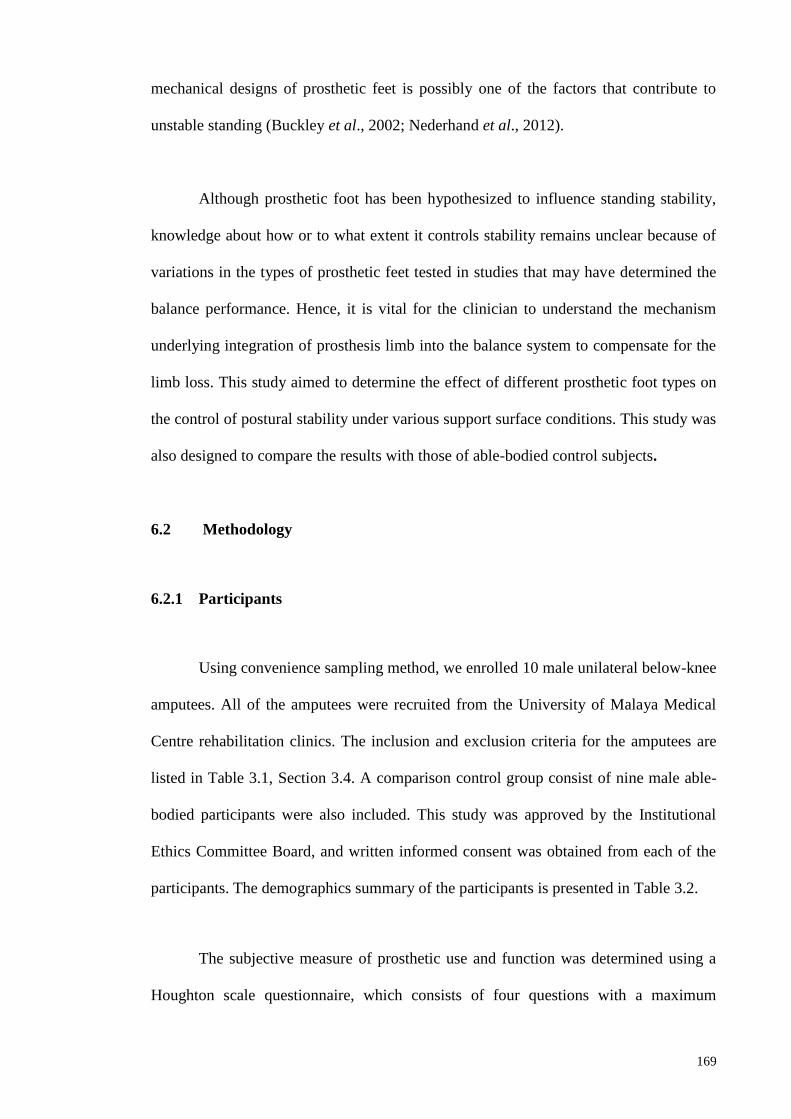
169
mechanical designs of prosthetic feet is possibly one of the factors that contribute to
unstable standing (Buckley et al., 2002; Nederhand et al., 2012).
Although prosthetic foot has been hypothesized to influence standing stability,
knowledge about how or to what extent it controls stability remains unclear because of
variations in the types of prosthetic feet tested in studies that may have determined the
balance performance. Hence, it is vital for the clinician to understand the mechanism
underlying integration of prosthesis limb into the balance system to compensate for the
limb loss. This study aimed to determine the effect of different prosthetic foot types on
the control of postural stability under various support surface conditions. This study was
also designed to compare the results with those of able-bodied control subjects.
6.2 Methodology
6.2.1 Participants
Using convenience sampling method, we enrolled 10 male unilateral below-knee
amputees. All of the amputees were recruited from the University of Malaya Medical
Centre rehabilitation clinics. The inclusion and exclusion criteria for the amputees are
listed in Table 3.1, Section 3.4. A comparison control group consist of nine male able-
bodied participants were also included. This study was approved by the Institutional
Ethics Committee Board, and written informed consent was obtained from each of the
participants. The demographics summary of the participants is presented in Table 3.2.
The subjective measure of prosthetic use and function was determined using a
Houghton scale questionnaire, which consists of four questions with a maximum

170
possible score of 12 points (Devlin et al., 2004). The Berg balance test (Wong et al.,
2013) was conducted to ensure similar balance status between amputees and able-
bodied participants. Subjects who failed to maintain equilibrium during the test were
excluded from the study. All of the subjects completed SF12v2 to evaluate the health-
related quality of life status of the participants (Ware and Sherbourne, 1992).
6.2.2 Instrumentation and procedures
The study employed a repetitive crossover study in which all of the amputees
underwent a total of three testing sessions for three weeks. The control group was
subjected to only one session for the completion of data collection. The amputees wore
their corresponding prostheses that allowed the interchange of foot components. The
same socket and suspension components were used throughout the study to eliminate
any confounding effect of these variables. The amputees’ current prosthetic sockets and
components were optimally aligned using a laser liner before the assessment by the
same registered prosthetist. The three prosthetic feet that were tested in this study
included a solid ankle cushion heel (SACH) foot, a single-axis (SA) foot, and energy-
saving and return (ESAR) foot Talux®. All of the tested feet were prescribed according
to the subject’s foot size and body weight in addition to the activity level of the Talux®
foot. All subjects wore identical covered shoes and the same shoes was used in all the
experiments.
The subjects familiarized themselves of the test procedures during their first
visit. At the end of the first session, the prosthetic foot in the subject's prosthesis was
exchanged for the first test foot. The subjects then returned to the laboratory to undergo
postural stability assessment after one week of accommodation period (English et al.,

171
1995). The second test foot was subsequently attached to the prosthesis in the following
week. The process was repeated until the subject had tested the third foot. Prosthetic
foot and surface conditions was counterbalanced across subjects to negate order effects.
In the last procedure, the test foot was replaced with the original foot. The flowchart of
the test procedure is illustrated in Figure 3.25, Section 3.9.
Postural stability test was conducted using a Biodex® stability system (BSS;
Biodex® Medical System, Shirley, NY, USA) for its known reliability in objective
assessment of postural stability (Arifin et al., 2014a). Platform stability, which ranged
from 1 (least stable) to 12 (most stable), was varied in terms of spring resistance levels.
BSS measures the overall stability index (OSI), anterior/ posterior stability index
(APSI), and medial/ lateral stability index (MLSI), which represented the standard
deviation of platform fluctuation from a horizontal position (zero point). The platform
was integrated with a computer software (Version 3.1 Biodex® Medical Systems) that
enables the device to calculate the stability indexes. A detailed desciption of BSS can be
found in Section 3.7.
Postural control was assessed under three different surface conditions: rigid;
compliant; and unstable (Figure 6.1). For the rigid condition, the participants were
asked to stand directly on a rigid and static platform. To simulate a compliant surface,
we placed low-density polyethylene foam with a circular radius of 22 cm and a
thickness of 2.5 cm on the platform as shown in Figure 6.2 (Borg and Laxaback, 2010).

172
Figure 6.1: Surface conditions used in this study: (a) rigid, (b) compliant and (c)
unstable.
Figure 6.2: Low-density polyethylene foam with a circular radius of 22 cm and a
thickness of 2.5 cm to simulate compliant surface.
R=22 cm
2.5 cm
A
C
B

173
Platform stability was then set at level 10 under an unstable condition. The
subjects were instructed to step on the BSS platform and stand in a standardized
position, in which each foot was positioned 17 cm between the heel centers and 14°
between the long axes of the feet to eliminate between-subject variability during balance
testing (Mcllroy and Maki, 1995). To ensure that this standardized position was
maintained accurately for each test with all of the subjects, we marked and recorded the
positions. During the test, the subjects were asked to keep their arms alongside the body
and look straight ahead at a point on the wall approximately 1.5 m away at eye level to
stabilize the head. All of the subjects stood on the platform for 20 s under all of the
conditions. A mean score was calculated from the results of the three tests. The standard
instruction “stand as still as possible” was given to all of the subjects to ensure
consistency during assessment (Zok et al., 2008). All subjects were allowed to rest for
30s in a sitting position between trials and instructed not to change the position of their
feet on the platform. Handrails could only be used to prevent falling if the subjects
totally lost their balance. An assistant stood at the back of the subject for additional
safety. Any trial with changes in foot position or balance loss was excluded.
6.2.3 Statistical analysis
A total of 27 data sets from nine conditions (three support surface conditions
and three prosthetic feet) for each of the stability indexes (OSI, APSI, and MLSI) were
obtained. All of these data were initially screened to determine the normality of
distribution and homogeneity of variance by using Shapiro-Wilk test. All of the data
showed normal distribution. A 3×3 (support surface × prosthetic foot) repeated-
measures analysis of variance (ANOVA) was used to examine the significance of
differences between stability indexes. After the differences between groups were

174
identified, post-hoc HSD Tukey’s test was applied to detect the specific area in which
statistical differences were observed. Independent t-test was employed to compare the
able-bodied control group with each prosthetic foot group. p ≤ 0.05 was considered
significant. The effect size was also determined to indicate the significance of the results
because of the small sample size used in this study. On the basis of Cohen’s guidelines,
we considered the effect size values > 0.14 as significantly different (Cohen, 1998).
Statistical analysis was performed using SPSS v16.0 (SPSS Inc., Chicago, IL, USA).
6.3 Results
6.3.1 Participants’ summary
No significant differences were observed between the amputees and able-bodied
group in terms of age, height, and body mass. The Berg balance score also showed no
statistical difference between the groups (Table 3.2).
6.3.2 Postural stability between prosthetic feet
The average values of OSI, APSI, and MLSI and the corresponding significant
differences are shown in Table 6.1. When comparison were made between the
prosthetic feet, our results showed that OSI was significantly higher in the ESAR foot
than in the SACH foot (p=0.04) when the subjects were standing on a foam surface
compared with a firm and unstable support surface. A large effect size of 0.38 indicated
that the differences were significant. Nevertheless, there was a noticeable trend of
stability indexes being the lowest for SACH foot and highest for ESAR foot in most of
the conditions. Postural stability of the amputees as measured from the OSI, APSI, and
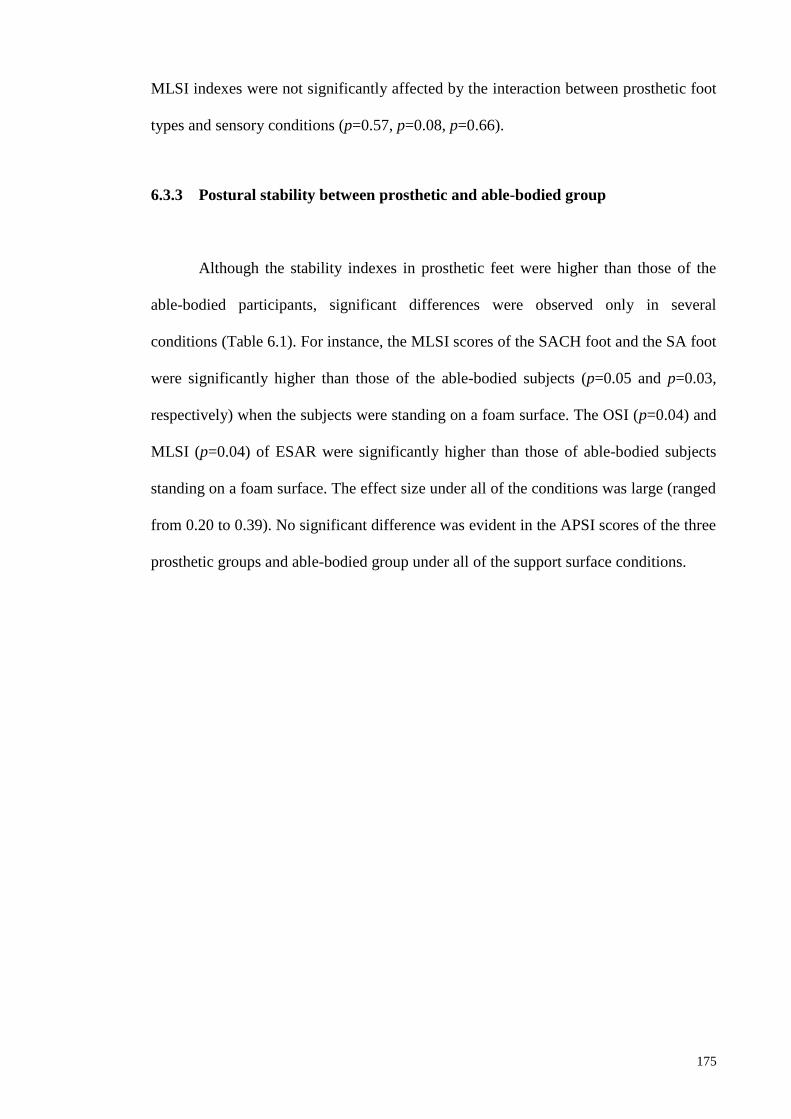
175
MLSI indexes were not significantly affected by the interaction between prosthetic foot
types and sensory conditions (p=0.57, p=0.08, p=0.66).
6.3.3 Postural stability between prosthetic and able-bodied group
Although the stability indexes in prosthetic feet were higher than those of the
able-bodied participants, significant differences were observed only in several
conditions (Table 6.1). For instance, the MLSI scores of the SACH foot and the SA foot
were significantly higher than those of the able-bodied subjects (p=0.05 and p=0.03,
respectively) when the subjects were standing on a foam surface. The OSI (p=0.04) and
MLSI (p=0.04) of ESAR were significantly higher than those of able-bodied subjects
standing on a foam surface. The effect size under all of the conditions was large (ranged
from 0.20 to 0.39). No significant difference was evident in the APSI scores of the three
prosthetic groups and able-bodied group under all of the support surface conditions.
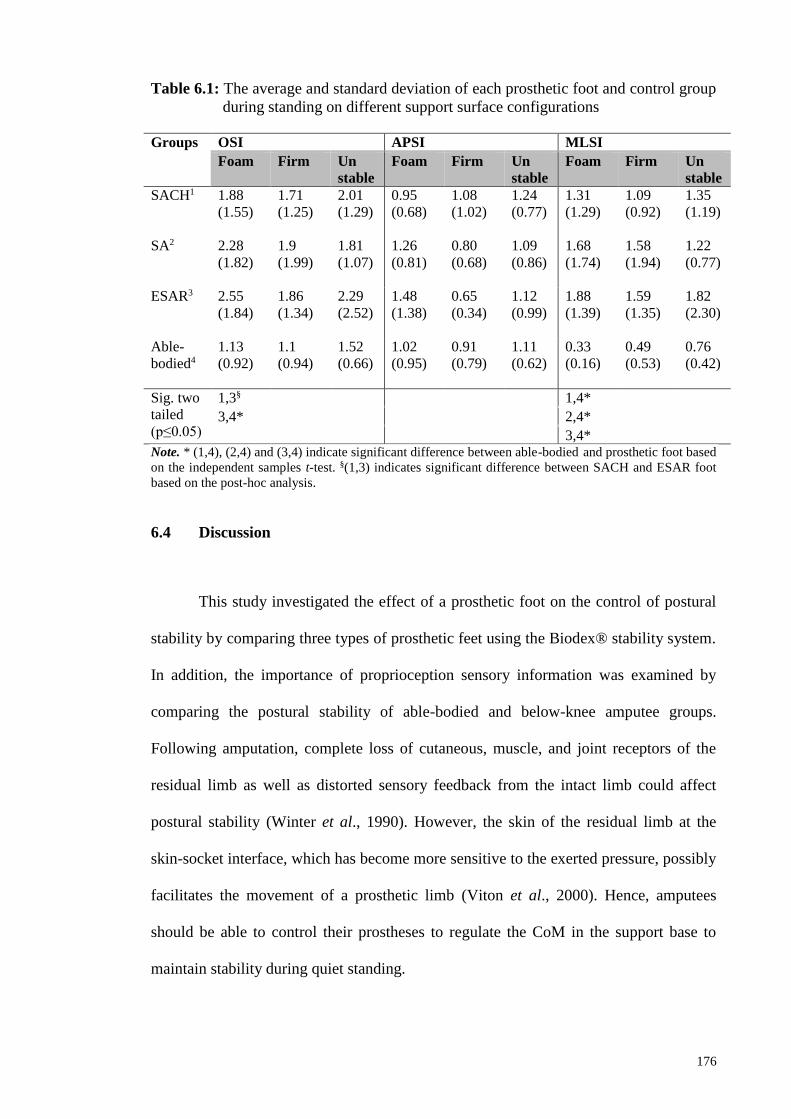
176
Table 6.1: The average and standard deviation of each prosthetic foot and control group
during standing on different support surface configurations
Groups OSI APSI MLSI
Foam Firm Un
stable
Foam Firm Un
stable
Foam Firm Un
stable
SACH1 1.88
(1.55)
1.71
(1.25)
2.01
(1.29)
0.95
(0.68)
1.08
(1.02)
1.24
(0.77)
1.31
(1.29)
1.09
(0.92)
1.35
(1.19)
SA2 2.28
(1.82)
1.9
(1.99)
1.81
(1.07)
1.26
(0.81)
0.80
(0.68)
1.09
(0.86)
1.68
(1.74)
1.58
(1.94)
1.22
(0.77)
ESAR3 2.55
(1.84)
1.86
(1.34)
2.29
(2.52)
1.48
(1.38)
0.65
(0.34)
1.12
(0.99)
1.88
(1.39)
1.59
(1.35)
1.82
(2.30)
Able-
bodied4
1.13
(0.92)
1.1
(0.94)
1.52
(0.66)
1.02
(0.95)
0.91
(0.79)
1.11
(0.62)
0.33
(0.16)
0.49
(0.53)
0.76
(0.42)
Sig. two
tailed
(p≤0.05)
1,3§ 1,4*
3,4* 2,4*
3,4* Note. * (1,4), (2,4) and (3,4) indicate significant difference between able-bodied and prosthetic foot based
on the independent samples t-test. §(1,3) indicates significant difference between SACH and ESAR foot
based on the post-hoc analysis.
6.4 Discussion
This study investigated the effect of a prosthetic foot on the control of postural
stability by comparing three types of prosthetic feet using the Biodex® stability system.
In addition, the importance of proprioception sensory information was examined by
comparing the postural stability of able-bodied and below-knee amputee groups.
Following amputation, complete loss of cutaneous, muscle, and joint receptors of the
residual limb as well as distorted sensory feedback from the intact limb could affect
postural stability (Winter et al., 1990). However, the skin of the residual limb at the
skin-socket interface, which has become more sensitive to the exerted pressure, possibly
facilitates the movement of a prosthetic limb (Viton et al., 2000). Hence, amputees
should be able to control their prostheses to regulate the CoM in the support base to
maintain stability during quiet standing.

177
Our results provided evidence that different prosthetic ankle mechanisms
provided by various designs may influence postural stability in different support surface
configurations. The stiffness of a prosthetic ankle has been proposed as the basis of
stability in the unperturbed standing of amputees (Kamali et al., 2013). In particular,
SACH, which provides no articulation at the ankle joint, likely minimizes the excursion
of CoP when individuals are standing on a compliant surface, thereby increasing the
overall stability. For the ESAR foot, such as the Talux®, the flexibility of the carbon
fiber causes the body to to exhibit larger excursion of CoP and consequently reduces the
overall stability of upright standing on a compliant surface. These findings further
supported those of a previous study, in which a stiffer prosthetic foot may be used to
enhance postural stability by decreasing body sway (Buckley et al., 2002; Nederhand et
al., 2012).
In the three foot types, the control of stability in anterior-posterior and medio-
lateral positions is unlikely affected by different mechanisms on the ankle and support
surface. No statistically significant difference was observed in the SA foot because of
the control of the plantar flexion at the rear bumper, which is similar to the pre-tibial
muscles of a normal foot (Goh et al., 1984). Nevertheless, various contributing factors,
such as restricted ankle mobility, weak hip abductor muscle strength, deficit in sensory
organization, and low balance confidence (Buckley et al., 2002; Nadollek et al., 2012)
have been linked to the altered balance conditions in amputees. To the best of our
knowledge, this study is the first to investigate the effects of prosthetic foot types on the
control of postural stability when subjects were standing on different support surface
configurations.

178
In normal subjects, postural instability during quiet standing is resisted by
muscle contraction to control ankle joint stiffness and counterbalance the destabilizing
gravitational torque in anterior-posterior and medio-lateral directions (Peterka, 2002).
For the amputees in this study, our findings suggested that postural stability requires
more control in the medio-lateral direction when standing on a compliant surface by
utilizing the hip strategy. Moreover, increasing the use of hip musculature at the
amputated limb was proposed as a strategy to receive more somatosensory inputs to
compensate for the lack of sensory input due to amputation (Isakov et al., 1992). The
ability to utilize the abductors and adductors of the hip possibly promotes an efficient
weight transfer and prevents unnecessary compensation strategies, such as lateral trunk
bending (Matjacic and Burger, 2003). High postural instabilities in medio-lateral
directions can be used as an indicator of falling and confidence of amputees; with this
information, amputees could understand their corresponding balance conditions and
rehabilitation that they need to improve balance. Although significant difference was
only observed under foam conditions, a decrease in postural stability of the amputees
were showed when they were standing on firm or unstable surfaces compared with that
of able-bodied participants.
We found that different postural stability characteristics can be determined
between prosthetic foot types as well as between amputees and able-bodied groups
when individuals are standing on a compliant surface. This was because the firm and
flat surface provides accurate orientation information of body from the intact limb and
residual limb while the compliant and tilting surface reduced the accuracy of
information (Maclellan and Patla, 2006). When standing on complaint surface, the
normal ground reaction forces exerted at the feet was altered and this increased the

179
movement of body’s CoM due to decreased effectiveness of the ankle to generate
stabilisation torque to maintain equilibrium (Desai et al., 2010; Patel et al., 2008).
Limitations in our study are acknowledged. We noted that the lack of significant
differences under firm and unstable conditions may be caused by an increase in the
dependence on other accurate sensory inputs from visual and vestibular systems.
Therefore, future studies should occlude more than two sensory modalities for the
differences between feet and groups to become apparent. Furthermore, the absence of
prosthetic foot effect may be attributed to a less challenging nature of the task during
quiet standing on firm and unstable platforms because the amputees were experienced
and skilled prosthetic users. In addition, the small number of the subjects in this study
may provide great differences between prosthetic feet and between groups, but such
differences may not be statistically significant. Results in this study represent balance
performance of transtibial amputees in general, which did not specifically distinguised
between dysvascular and non-dysvascular amputees. Although static balance has
become an essential skill in rehabilitation process for the amputee populations to
achieve independent standing and walking (Vrieling et al., 2008), further research
should include stability assessment during walking and dual tasking.
6.5 Conclusions
The results suggest that prosthetic foot design affected the overall stability of
below-knee amputees, particularly when subjects were standing on a compliant surface.
Therefore, clinicians should consider this factor when prosthetic feet are prescribed to
amputees who ambulate mostly on soft surfaces. Furthermore, amputees utilised the hip
strategy to control postural stability in medio-lateral directions in an upright stance on a

180
compliant surface. These findings can be utilised to develop intervention during
rehabilitation using different support surfaces which may lead to improvement in
postural stability and reduce risk of falls in person with lower limb amputations.

181
CHAPTER 7
THE EFFECTS OF DIFFERENT PROSTHETIC FEET AND HEAD
EXTENSION ON THE POSTURAL STABILITY IN PERSONS
WITH BELOW-KNEE AMPUTATION DURING QUIET
STANDING.
The vestibular system, which is the third component in the sensory system, plays a vital
role in the maintenance of postural stability as deliberated in Section 2.3. The purposes
of this study were to examine the effects of different prosthetic feet types and head
extension on the postural stability in persons with below-knee (BK) amputations; and to
determine whether computed posturography can be used to distinguish between
amputated and able-bodied individuals across sensory conditions. Results indicated that
all stability indexes were significantly affected by sensory conditions, but not by the
prosthetic feet types. Postural stability was reduced significantly under conditions where
visual or vestibular inputs were disrupted. Postural instability in medial-lateral direction
was greater in amputated compared to able-bodied group in most of the sensory
conditions. For overall postural stability however, significant difference between the
groups can only be found during eyes closed-head neutral condition. This study
suggests that head extension which represents vestibular system disruption increases the
difficulty to maintain postural stability in person with BK amputation. Moreover, the
BSS appeared to distinguish between amputated and able-bodied individuals mostly in
the medial-lateral direction.

182
7.1 Introduction
Postural stability in human is the ability of a person to achieve, maintain or
return to equilibrium by positioning the centre of mass (CoM) within its base of support
(Pollock, Durward, & Rowe, 2000). The regulations of a complex sensory
(somatosensory, visual, vestibular) and motor systems have been suggested to
contribute in attaining postural stability (Shumway-Cook & Woollacott, 2000). The
visual system detects changes in body orientation in upright stance by identifying head
and body displacement with respect to the environment, the somatosensory system
senses the position and velocity of all body segments, and the vestibular system detects
head orientation with respect to the vertical axis (Massion & Woollacott, 2004).
Accurate labyrinth information from otolith organs of the vestibular system is
used to resolve inter-sensory conflict condition, for example when a person stands near
a moving bus (Shumway-Cook & Woollacott, 2000). In this situation, the visual input
would suggest false impression that the body was moving, rather than the bus. However,
at the same time the somatosensory system senses that the body is stationery.
Consequently, to elucidate this sensory conflict, the central nervous system would rely
on accurate sensory information provided by the somatosensory and vestibular systems
which determine no movement of the body (Shumway-Cook & Horak, 1986). The
otolith-spinal inputs from the vestibular system is also known for its fast-acting
mechanism in stabilizing postural stability corrections by triggering the lower-leg
muscle activity as early as 60 milliseconds following perturbations (Allum and Shepard,
1999).

183
However, compromised lower limb somatosensation and circulation is linked to
poor balance and frequent falls in persons with BK amputations (Quai, Brauer, & Nitz,
2005; Miller et al., 2001b). While able-bodied person has the ability to utilize the ankle
joint and lower limb musculature to produce torque in resisting gravitational force to
sustain standing stability (Winter et al., 1998), persons with BK amputations rely on the
passive stability offered by the prosthetic foot-ankle system. Additionally, researchers
hypothesized that aside from poor muscle strength and fear of falling (Kozakova et al.,
2009), the different types of prosthetic feet might also affect postural stability during
quiet standing in persons with BK amputations (Vrieling et al., 2008; Nederhand et al.,
2012). Despite the notions that the prosthetic foot may influence standing stability, there
is lack of understanding about how different designs contribute to the control of stability
due to the heterogeneity of prosthetic foot used in previous studies. Hence, a detailed
study has yet to be conducted to identify the influence of different prosthetic feet to the
standing balance of persons with BK amputations.
Besides relying on the prosthetic foot, intact musculatures and sensory systems
provide a compensatory mechanism to maintain postural orientation after a BK
amputation (Curtze et al., 2012). Several studies reported that ankle strategy, which
involves the active ankle function of the sound limb and the passive ankle function of
the prosthetic foot, is effective in controlling postural stability (Curtze et al., 2012;
Vanicek et al., 2009). Conversely, other studies reported that the hip strategy controlled
from intact and prosthetic limb are the main approach when controlling postural
stability (Mayer et al., 2011). Researchers suggested that in able-bodied person, the
utilization of the ankle strategy requires adequate surface somatosensory whereas the
vestibular system is thought to play an essential role in organizing the hip strategy for
postural control (Horak et al., 1990).

184
Manipulation of sensory information to control the posture in persons with BK
amputations has been studied by measuring the excursion of center of pressure (CoP)
under altered or diminished sensory input. Researchers showed that eliminating visual
information (Barnett et al., 2012; Vrieling et al., 2008) or reducing proprioception input
(Kozakova et al., 2009; Buckley et al., 2002) increases CoP displacement, which is
associated with instability. Moreover, manipulating more than one sensory input will
further deteriorate standing stability in persons with BK amputations (Barnett et al.,
2012). Previous studies manipulated the vestibular system by head tilting in persons
with low back pain, elderly, and healthy able-bodied adults (Mientjes & Frank, 1999;
Hu & Woollacott, 1994; Paloski et al., 2006). However, a study manipulating the
vestibular system by head tilting in persons with BK amputations has yet to be
conducted. Therefore, it seems reasonable to determine the effects of head extension
during standing since this condition occurs when persons with BK amputations reach
for objects or surfaces that are beyond eye level.
Computed posturography such as the Biodex® Stability System (BSS) has been
used to evaluate postural stability by measuring the angular shift from the horizontal. It
has been previously shown to successfully quantify postural stability in persons with
rheumatoid arthritis and ankle instability (Aydog et al., 2006; Testerman & Griend,
1999). Although these studies found differences in dynamic balance between people
with balance problem and healthy group, it is uncertain whether BSS could also be
utilized to differentiate between persons with BK amputations and able-bodied during
static balance. Hence, due to its reliability, practicality, ease to administer and cost
effectiveness (Parraca et al., 2011; Guskiewicz & Perrin, 1996), BSS may be effective
in the evaluation of postural stability in persons with BK amputations for rehabilitation
purposes. This study aims to examine the effects of different prosthetic feet and head

185
extension during quiet standing on the postural stability in persons with BK
amputations. This study also aims to quantitatively determine whether balance between
persons with BK amputations and able-bodied individuals could be distinguished by
using BSS.
7.2 Methodology
7.2.1 Participants’ characteristics
A convenience sample of ten males with unilateral BK amputation from
rehabilitation clinics in University Malaya Medical Centre participated in this study.
The demographic characteristics of amputees for this study are summarized in Table
3.2, Section 3.5. Nine age-matched able-bodied males served as the control group. The
mean age, height, and weight for the control group were 44.1 ± 14.04 years, 1.66 ± 0.05
m, and 73.9 ± 8.7 kg, respectively. No significant differences in age, height, and body
mass were observed between participants with BK amputations and able-bodied. Using
the Medicare Functional Classification Level (MFCL) indicators, persons with BK
amputations were categorized as K2 and K3 community ambulators, who have the
ability to ambulate with variable cadence and overcome low-barriers such as curbs or
uneven surfaces (Gailey et al., 2002).
Participants with at least one year experience in their current prostheses and with
the ability to walk without the use of any assistive device were included in this study.
Other inclusions and exclusions criteria for included participants are listed in Section
3.4. Prior to testing, amputee participants were assessed using the Houghton Scale and
Berg balance score (BBS) questionnaires. All persons with BK amputations
demonstrated intensive use of the prosthesis based on the average Houghton Scale (10.5
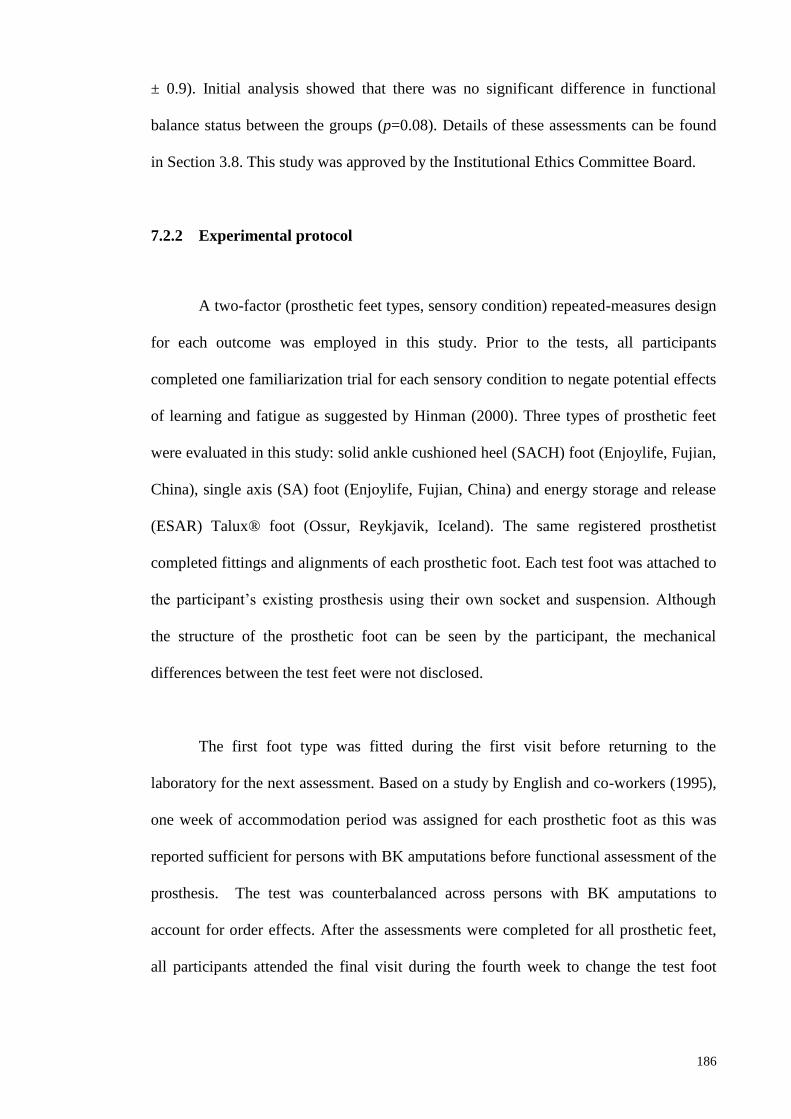
186
± 0.9). Initial analysis showed that there was no significant difference in functional
balance status between the groups (p=0.08). Details of these assessments can be found
in Section 3.8. This study was approved by the Institutional Ethics Committee Board.
7.2.2 Experimental protocol
A two-factor (prosthetic feet types, sensory condition) repeated-measures design
for each outcome was employed in this study. Prior to the tests, all participants
completed one familiarization trial for each sensory condition to negate potential effects
of learning and fatigue as suggested by Hinman (2000). Three types of prosthetic feet
were evaluated in this study: solid ankle cushioned heel (SACH) foot (Enjoylife, Fujian,
China), single axis (SA) foot (Enjoylife, Fujian, China) and energy storage and release
(ESAR) Talux® foot (Ossur, Reykjavik, Iceland). The same registered prosthetist
completed fittings and alignments of each prosthetic foot. Each test foot was attached to
the participant’s existing prosthesis using their own socket and suspension. Although
the structure of the prosthetic foot can be seen by the participant, the mechanical
differences between the test feet were not disclosed.
The first foot type was fitted during the first visit before returning to the
laboratory for the next assessment. Based on a study by English and co-workers (1995),
one week of accommodation period was assigned for each prosthetic foot as this was
reported sufficient for persons with BK amputations before functional assessment of the
prosthesis. The test was counterbalanced across persons with BK amputations to
account for order effects. After the assessments were completed for all prosthetic feet,
all participants attended the final visit during the fourth week to change the test foot

187
with their original foot. Control participants were only required to attend one single
session to complete the assessment.
The BSS (Biodex® Medical System, Shirley, NY, USA), was used because of
its reliability in objective assessment of postural stability (Aydog et al., 2006). BSS
measures the overall stability index (OSI), anterior/ posterior stability index (APSI), and
medial/ lateral stability index (MLSI), which represent the standard deviation of the
angular fluctuations from the centre of the platform (zero point) at a sampling rate of
20Hz (Arnold & Schmitz, 1998). The platform was integrated with Biodex® software
(Version 3.1 Biodex® Medical Systems) that enables the device to calculate the
stability indexes. Detailed description of operational principal of this device can be
found in Section 3.7.
All participants stood on a stable, rigid platform surface under four different
conditions: 1: Eyes open, head neutral (EO-Neut), 2: Eyes open, head extended (EO-
Ext), 3: Eyes closed, head extended (EC-Ext) and 4: Eyes closed, head neutral (EC-
Neut) (Figure 7.1).
Figure 7.1: The position of the head in (A) neutral and (B) extended positions.
A B

188
Condition 1 served as the baseline where all sensory cues (visual, proprioception
and visual) were accurate. In order to isolate the influence of vision on postural control,
condition 3 and 4 were performed in the absence of visual information (Paloski et al.,
2006). In Neutral condition, participants were asked to keep their gaze in a straight-
ahead direction to stabilize the head. In Extended condition (1 and 2), the head was
tilted backward at each participant’s maximal head extension, allowing them to look at
the ceiling (Hu & Woollacott, 1994). Head extension introduced imbalance due to
vestibular system disruption sensed by the otolith organs because of the change of head
position (Brandt, Krafczyk, & Malsbenden, 1981). The experimenter stood at the side of
each subject to monitor the head position throughout the assessments. Further
information on the positions of the feet and arms, testing durations, resting period and
standardized instruction have been discussed in Section 3.9.
7.2.3 Statistical Analysis
Means and standard deviations (SD) of the stability variables were calculated for
each condition. All stability data were initially screened using Shapiro-Wilk test and
showed normal distributions. Three 3 x 4 (prosthetic foot types by sensory conditions)
repeated-measures analysis of variance (ANOVA) was performed to determine any
main effect of foot types (SACH, SA, ESAR), sensory conditions (EO-Neut, EO-Ext,
EC-Neut, EC-Ext) or interaction between foot types and conditions on the stability
indexes (OSI, APSI, MLSI). Post-hoc analysis was performed using the HSD Tukey
when significant main effect existed. Independent t-test analysis was used to compare
the comparison control group with each prosthetic foot group. Significance was
accepted at p ≤ 0.05 for all analyses. We did not adjust the alpha level for multiple
testing to avoid the inflation of type II error (Perneger, 1998). The effect size was also
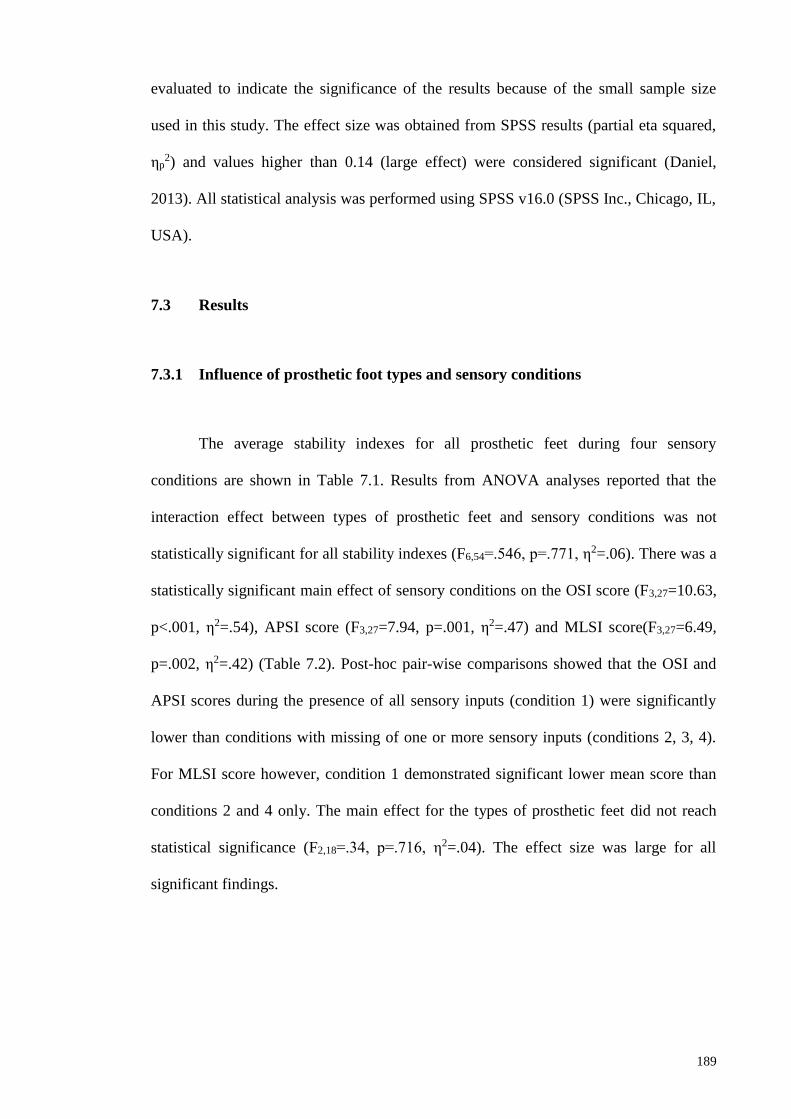
189
evaluated to indicate the significance of the results because of the small sample size
used in this study. The effect size was obtained from SPSS results (partial eta squared,
ηp2) and values higher than 0.14 (large effect) were considered significant (Daniel,
2013). All statistical analysis was performed using SPSS v16.0 (SPSS Inc., Chicago, IL,
USA).
7.3 Results
7.3.1 Influence of prosthetic foot types and sensory conditions
The average stability indexes for all prosthetic feet during four sensory
conditions are shown in Table 7.1. Results from ANOVA analyses reported that the
interaction effect between types of prosthetic feet and sensory conditions was not
statistically significant for all stability indexes (F6,54=.546, p=.771, η2=.06). There was a
statistically significant main effect of sensory conditions on the OSI score (F3,27=10.63,
p<.001, η2=.54), APSI score (F3,27=7.94, p=.001, η2=.47) and MLSI score(F3,27=6.49,
p=.002, η2=.42) (Table 7.2). Post-hoc pair-wise comparisons showed that the OSI and
APSI scores during the presence of all sensory inputs (condition 1) were significantly
lower than conditions with missing of one or more sensory inputs (conditions 2, 3, 4).
For MLSI score however, condition 1 demonstrated significant lower mean score than
conditions 2 and 4 only. The main effect for the types of prosthetic feet did not reach
statistical significance (F2,18=.34, p=.716, η2=.04). The effect size was large for all
significant findings.

190
Table 7.1: The average and standard deviation of stability indexes for each prosthetic
foot during standing in various conditions.
Stability
indexes/
Conditions
Prosthetic foot Able-bodied
SACH SA ESAR
Mean SD Mean SD Mean SD Mean SD
OSI
EO-Neut 1.71 1.25 1.90 1.98 1.86 1.34 1.10 0.94
EO-Ext 3.08 1.26 2.62 1.48 2.89 0.95 2.11 1.07
EC-Ext 2.97 1.67 2.75 1.19 3.12 0.72 2.77 1.44
EC-Neut 3.43 1.17 2.91 1.06 3.58 1.49 2.02 1.13
APSI
EO-Neut 1.08 1.02 0.80 0.68 .65 0.34 0.91 0.79
EO- Ext 1.93 0.98 1.11 0.53 1.42 0.80 1.89 1.19
EC- Ext 1.79 1.12 1.76 0.76 1.95 0.92 2.61 1.41
EC- Neut 1.89 0.96 1.33 0.61 1.80 1.03 1.84 1.13
MLSI
EO-Neut 1.09 0.92 1.58 1.94 1.59 1.35 0.49 0.53
EO- Ext 1.94 1.35 2.11 1.65 2.15 1.17 0.58 0.42
EC- Ext 2.05 1.42 1.78 1.17 1.98 0.94 0.66 0.46
EC- Neut 2.52 1.19 2.30 1.18 2.76 1.37 0.59 0.28 Note. OSI= Overall stability index; APSI= anterior/ posterior stability index; MLSI= medial/ lateral
stability index; EO-Neut= eyes open, head neutral; EO-Ext= eyes open, head extended; EC-Ext= eyes
closed, head extended, EC-Neut= eyes closed, head neutral; SACH= solid ankle cushioned heel; SA=
single axis; ESAR = energy storage and release.
Table 7.2: Analyses of Variance for stability indexes.
Source df error F η2 p-value
OSI
Prosthetic foot (A) 2 18 .34 .04 .72
Sensory conditions (B) 3 27 10.63* .54 <.001
Interaction (AxB) 6 54 .55 .06 .77
APSI
Prosthetic foot (A) 2 18 1.28 .12 .30
Sensory conditions (B) 3 27 7.94* .47 .001
Interaction (AxB) 6 54 1.46 .14 .21
MLSI
Prosthetic foot (A) 2 18 .21 .02 .81
Sensory conditions (B) 3 27 6.49* .42 .002
Interaction (AxB) 6 54 .63 .07 .71
Note. *p<.05

191
7.3.2 Comparison between control and prosthetic groups
The differences of stability indexes between each prosthetic foot and comparison
group are illustrated in Figure 7.2. The SACH and ESAR foot group demonstrated
significant higher overall stability score (OSI) than the comparison group (p=0.017 and
p=0.021, respectively) during EC-Neutral condition. Furthermore, postural instability in
medial-lateral direction (MLSI index) was significantly greater in the SACH, SA and
ESAR foot than in the comparison group during EO-Ext (p=0.01, p=0.015, p= 0.001,
respectively), EC-Neut (p<0.001, p=0.01, p<0.001, respectively) and EC-Ext (p=0.012,
p=0.015, p=0.001, respectively). In addition, only ESAR foot showed higher stability
index than comparison group in medial-lateral direction during EO-Neutral condition
(p=0.035).
Although the postural stability of the amputees decreased in OSI and APSI, no
significant difference in postural stability was observed between the three prosthetic
foot groups and the comparison group. The effect size was large, between 0.2 to 0.6, for
all significant findings. Generally, the MLSI score were greater by 50% to 80% in all
types of prosthetic foot types in all four conditions. In regards to OSI score, most of the
prosthetic feet exceeded the comparison group by 30% to 40%. Conversely, APSI score
was mostly 20% to 70% lower in most of the prosthetic group than the comparison
group.

192
Note. OSI= Overall stability index; APSI= anterior/ posterior stability index; MLSI= medial/ lateral
stability index; EO-Neut= eyes open, head neutral; EO-Ext= eyes open, head extended; EC-Ext= eyes
closed, head extended, EC-Neut= eyes closed, head neutral; SACH= solid ankle cushioned heel; SA=
single axis; ESAR = energy storage and release.
Figure 7.2: The change of OSI, APSI and MLSI expressed as percentage increase or
decrease between each prosthetic foot and normal groups. Note that the
asterisk sign (*) indicate significant difference between prosthetic foot
and control. Deficit in balance leads to greater increase in stability index
score. Positive value indicates the stability score of amputees are greater
than that of control subjects.
7.4 Discussion
The primary aim of this study was to determine the effects of wearing different
prosthetic feet and head extension on the postural stability of persons with BK
amputations during upright quiet standing. In the present study, the types of prosthetic
feet did not appear to adversely or positively affect postural stability in persons with BK
amputations during quiet standing. The non-significant foot effect may be attributed to
the good adaptation mechanism of the persons with BK amputations, which minimized
the differences between prosthetic feet. Moreover, from the Berg balance score and
Houghton score, persons with BK amputations in this study demonstrated good balance

193
status with intensive use of prosthesis which helps them to minimize body sway when
standing with all tested prosthetic feet without demonstrating instability.
Postural stability in persons with BK amputations during quiet upright standing
was challenged when one or two sensory modalities were disrupted. This can be seen
from the decreased stability reflected form the stability indexes when persons with BK
amputations stood with either the eyes closed or with the head tilted backwards or when
both sensory modalities were altered during quiet standing wearing all three prosthetic
foot types. These findings were similar to those of Mientjes et al. (1999) which reported
increased postural sway in persons with chronic low back pain when visual input was
removed and during more complex task. Moreover, the decrease of postural stability
has been suggested as a result of tilting the otolith organs exceeding its optimal working
range (Paloski et al., 2006; Vuillerme and Rougier, 2005) and the absence of visual
input which plays important role in maintenance of balance (Redfern et al., 2001).
The neck proprioceptors input provides the necessary information about head
movements relative to the trunk, hence, extending the head reduces the accuracy of
sensory inputs detected from the stretch receptor in the neck (Jackson & Epstein, 1991;
Massion and Wollacott, 2000). Additionally, this head position was chosen because it
significantly affects postural stability more than flexion or lateral tilt of the head
(Paloski et al., 2006). In addition, researchers previously demonstrated that adding head
extension task in postural stability evaluation enhances the sensitivity of posturography
in detecting abnormalities of balance in people with chronic low back pain and multiple
sclerosis (Mientjes & Frank, 1999; Jackson et al., 1995). Moreover, balance training
with head extension and closed eyes has demonstrated previously to improve the ability
to maintain postural stability (Brandt et al., 1981).

194
Previous studies reported that manipulating more than one sensory system
further deteriorates the postural stability of persons with BK amputations (Barnett et al.,
2012). In the present study, the addition of the eyes-closed task under the head
extension condition in persons with BK amputations did not result in falling or loss of
stability. These results suggested that persons with BK amputations were able to
prioritize accurate somatosensory inputs during maintenance of stability when more
than two sensory inputs were challenged. It was hypothesized that persons with BK
amputations utilized the somatosensory cues from non-affected leg, as well as haptic
cues from the contact of the residual limb with the inner wall of the socket which may
be used as a reference frame, to regain body orientation to efficiently stabilize the
posture (Massion & Woollacott, 2004b).
The secondary aim of our study was to determine whether BSS can be used to
distinguish between persons with BK amputations and able-bodied individuals.
Computerized posturography using BSS has been shown to successfully quantify
postural stability in various populations (Aydog et al,. 2006; Testerman & Griend,
1999). The current investigation showed that compared to able-bodied participants,
persons with BK amputations had significantly greater postural instability in medial-
lateral direction during head extension with both eyes open and closed for all prosthetic
feet tested. This finding further supports the previous study that demonstrated postural
stability in frontal plane can be used to discriminate healthy person from person with
impaired balance condition (Mientjes & Frank, 1999). Furthermore, the current findings
showed higher percentage of differences in MLSI score between all prosthetic feet
groups and comparison group during three (out of four) sensory conditions. The large
effect size values indicate that these differences between groups were meaningful.
Overall, incorporating head extension into computerized posturography assessment in

195
able-bodied and persons with BK amputations caused more postural sway with eyes
opened and closed, compared to when all sensory inputs were present, as previously
shown in healthy population (Paloski et al., 2006).
Although there is no evidence of statistically significant different of balance
between persons with BK amputations and able-bodied group in anterior-posterior
direction, there is a trend of lower APSI score in persons with BK amputations group
than that of able-bodied group. This may be explained by the limited body sway
associated with relatively stiff prosthetic ankle and reduced muscle capacity on the
intact limb in controlling postural stability (Buckley et al., 2002; Nederhand et al.,
2012). Other possible explanations to this finding include the unwillingness of persons
with BK amputations to initiate movement at the prosthetic ankle in the sagittal plane
due to lack of confidence and fear of falling (Miller et al., 2001; Buckley et al., 2002).
Therefore, our findings suggest that persons with BK amputations utilized the hip
strategy in controlling balance during quiet standing as opposed to the ankle strategy
used in able-bodied persons as reported previously (Mayer et al., 2011; Horak et al.,
1990).
The finding of our study suggested that the MLSI score provided by the BSS
computed posturography can be used as distinguishing feature between persons with
BK amputations and able-bodied persons. Hence, results obtained from this device
provides avenue to the assessment of balance and consequently aids in providing
tailored rehabilitation programs for persons with lower-limb amputation. Moreover,
previous study reported that normal adults and multiple sclerosis significantly improved
overall postural stability when head extension task was incorporated in their training
programs (Brandt et al., 1981; Hebert, Corboy, Manago, and Schenkman, 2011; Hu and

196
Woollacott, 1994). As such, clinicians should expose persons with BK amputations to
situations which produce body instability, such as standing with head extended, in order
to improve sensorimotor rearrangement and consequently increasing the effectiveness
of the training.
In our study, we were limited to a small sample size as well as the ease of the
task used. Thus, these limitations may have prevented us finding significant differences
between prosthetic feet (SACH vs SA vs ESAR) and between groups (BK amputations
vs comparison). The small sample size was due to the difficulty in recruiting persons
with BK amputations to make multiple visits for data collection. Moreover, the head
extension angle should be standardized to reduce variability and monitored using
sensors for accuracy.
7.5 Conclusions
Vestibular system disruptions due to head extension present a challenge to
persons with BK amputations by increasing postural instability mostly in medial-lateral
direction during upright standing. However, postural stability during quiet standing was
not affected by the types of prosthetic feet. In addition, this study demonstrates that the
BSS can be used to distinguish functional postural stability status in medial-lateral
direction between persons with BK amputations and able-bodied individuals.
Rehabilitation programs should consider including the head extension task which is
commonly encountered in activities of daily living. This is to improve the control of
medial-lateral postural stability particularly for individuals recovering from balance
control deficits.

197
CHAPTER 8
EVALUATION OF POSTURAL STEADINESS IN BELOW-KNEE
AMPUTEES WHEN WEARING DIFFERENT PROSTHETIC FEET
DURING VARIOUS SENSORY CONDITIONS USING THE
BIODEX® STABILITY SYSTEM (BSS).
In recent years, computerized posturography has become an essential tool in
quantitative assessment of postural steadiness in the clinical settings. The potential of
using a portable, user-friendly posturography device, such as the Biodex Stability
System (BSS), has been highlighted in Section 3.7. The purpose of this study was to
explore the ability of the BSS to quantify postural steadiness in below-knee amputees.
The overall (OSI), anterior-posterior (APSI) and medial-lateral (MLSI) stability indexes
as well as percentage of time spent in left and right quadrants and four concentric zones
were measured under altered sensory conditions while standing with solid ankle cushion
heel (SACH), single axis (SA) and energy storage and release (ESAR) foot. Significant
difference was found between sensory conditions in SACH and ESAR foot for all
stability indexes. The percentage of time spent in Zone A (00-50) was significantly
greater than the other three concentric zones (p<0.01). The loading time percentage on
their intact limb was significantly longer than the amputated limb in all conditions for
all three prosthetic feet. The findings highlight that the characteristics of postural
stability in amputees can be clinically assessed by utilizing the outcomes produced by
the BSS.

198
8.1 Introduction
The ability to control equilibrium in posture is the foundation of independent
standing and walking (Melzer et al., 2004). In upright static standing, the dynamics of
postural control in maintaining balance is defined as postural steadiness (Prieto et al.,
1993). Movement and sensory strategies are known as part of the subcomponents of
postural control, which also comprise biomechanical constraints, cognitive processing,
dynamic control and spatial orientation (Horak, 2006). Moreover, the control of posture
is a complex integration of somatosensory (proprioceptive, cutaneous and joint), visual
and vestibular inputs along with motor coordination to maintain the center of mass
(CoM) within the base of support (BoS) (Blackburn et al., 2000; Shumway-Cook and
Woollacott, 2000). Any deficits in these components will result in poor control of body
posture, which is often associated with the risk of falling and limited physical activities
(Winter et al., 1990).
People with lower limb amputations exhibit a higher incidence of falling than
able-bodied because of the deficits in controlling movements in medial-lateral or
anterior-posterior directions (Miller et al., 2001a). This is due to the loss of biological
ankle joint and a considerable amount of muscles in the lower leg which has caused lack
of active ankle torques produced to restore balance in sagittal plane, deficiency in
weight-shifting to control balance in frontal plane, and distorted somatosensory input
from the amputated side (Geurts and Mulder, 1992). Therefore, prosthetic foot is
prescribed to provide passive stability by reducing the amount of body sway regulated
at the relatively stiff ankle joint (Blumentritt et al., 1999; Buckley et al., 2002). During
altered-sensory conditions, researchers showed that standing with eyes-closed (Barnett
et al., 2002; Isakov et al., 1992) or standing on compliant surface (Kozakova et al.,

199
2009) contributes to the decrease of standing stability in people with lower limb
amputation.
In previous years, computed posturography such as the EquiTest system
(NeuroCom International Inc., Oregon, USA) has been utilized to quantify postural
balance in below-knee amputees (Barnett et al., 2002; Vanicek et al., 2009). However,
the applications of the system maybe limited due to its sophisticated system which
requires trained tester, large size, not portable, and expensive (Yim-Chiplis and Talbot,
2000). Alternatively, the Biodex stability system (BSS) (Biodex, Inc, Shirley, New
York, USA) has been shown capable in producing clinical data measurements on
postural stability (Hinman, 2000). BSS is a portable, economical, and reliable tool for
objective assessment of postural stability (Testerman and Griend, 1999) and has been
utilized in patients with arthritis and ankle instability (Aydog et al., 2006; Salsabili et
al., 2011). However, information is lacking on the quantification of the upright postural
steadiness of below-knee amputees using the same device. This study aims to fully
utilize the measurement outputs provided by the BSS to determine the postural
steadiness of below-knee amputees who are wearing different prosthetic foot types
under various sensory manipulations.
8.2 Methodology
8.2.1 Subjects
Ten subjects with unilateral below-knee amputation participated in this study.
Subject inclusion criteria were as follows: male unilateral below-knee amputees with at
least one year experience in their current prosthesis and able to walk without the use of

200
any assistive device. Subjects must obtained a score of >5 for Houghton scale (Devlin et
al., 2004) to indicate active use of prosthesis and >41 for Berg balance scale (BBS)
(Wong et al., 2013) to ensure that only subjects with low risk of falling were selected.
Subjects were excluded from this study if they had poor fittings of prosthesis, residuum
pain, visual or vestibular impairment (vertigo or dizziness), lower limb musculoskeletal
injury and other neurological deficits. This study was approved by the Institutional
Ethics Committee Board.
8.2.2 Procedures and equipment
All subjects completed one familiarization trial for each condition to negate the
potential effects of learning and fatigue (Hinman, 2000). Amputees underwent a total of
three consecutive testing sessions and were asked for a time commitment of 4 weeks
period. Each foot was worn for one week of functional walking to allow
accommodation for each prosthetic foot. This period has been suggested as sufficient
before clinical decision could be made regarding the effectiveness of prosthesis
components (English et al., 1995). At the end of the one week period, the subject
returned to the laboratory and postural stability was quantitatively evaluated using the
BSS. Following the entire testing procedure for each foot, the foot was removed and
replaced with the next foot, and the process was repeated until each subject had tested
all three feet. The test was counterbalance across amputees to negate order effects. After
the assessments were completed for all prosthetic feet, amputees attended the final visit
to change the test foot to their original foot.
The three types of prosthetic foot used in this study were: SACH foot (Enjoylife,
Fujian, China), SA foot (Enjoylife, Fujian, China) and ESAR Talux® foot (Ossur,

201
Reykjavik, Iceland). The SACH was a non-articulating foot with wooden keel and
rubberized cushioned heel. The SA foot allowed plantarflexion-dorsiflexion motion at
the single hinge joint. The Talux® was a Flex-Foot with J-shaped multiaxial ankle and
heel-to-toe carbon fiber footplate designs. The SACH and SA feet were chosen due to
their common use in patient care (Goh et al., 1984; Hafner, 2005) while ESAR
represents modern prosthetic foot (Noonan, 2014). The same registered prosthetist
completed the fittings and alignments of each prosthetic foot. Each test foot was
attached to the subject’s existing prosthesis using their own socket and suspension. Each
prosthetic foot was covered with sock to obscure the foot structures from the
participants. The same sock was also worn at the intact foot.
Postural stability during upright static standing was evaluated using the BSS
which measures the overall (OSI), anterior/ posterior (APSI), and medial/ lateral
(MLSI) stability indexes. These indices are standard deviations that assess the
displacement of CoM around the centre of the platform (zero point) (Arnold and
Schmitz, 1998). Higher stability index indicated greater amount of body movement
which is associated with an unstable posture, while lower stability index is associated
with more stable posture. The platform was integrated with Biodex® software (Version
3.1 Biodex® Medical Systems) which enables the calculation of the stability indexes at
a sampling rate of 20 Hz.
In addition to stability indexes, the BSS calculates the percentage of test time the
subject spent in concentric zones and left/right quadrant (Figure 8.1). During static
assessment, each concentric circle of the zone represents the angular displacement of
the CoM from the center of the foot platform (Arnold and Schmitz, 1998). The
concentric circles were arranged at 50 increments as follows: Zone A: 0-50, Zone B: 6-

202
100, Zone C: 11-150 and Zone D: 16-200. For double stance protocol, quadrants were
defined as Quadrant I: right anterior, Quadrant II: left anterior, Quadrant III: left
posterior and Quadrant IV: right posterior. In this study, we defined Quadrant I and IV
as right quadrant and Quadrant II and III as left quadrant to determine percentage of
time spent between amputated and intact leg. Previous studies using force platform
showed that the time spent on the intact side was evidently longer than that spent on the
amputated limb (Burke, Roman and Wright, 1978). In this study, the term loading time
percentage was described as the total time spent on the intact and prosthetic side
throughout the 20s assessment period during each altered sensory conditions.
Figure 8.1: Positions of the concentric zones (A, B, C, D) in relatives to right and left
quadrants.
Subjects were instructed to place their feet in a standardized position to
eliminate between-subject variability during balance testing (Mcllroy and Maki, 1995).
The position of the feet was marked and recorded for consistency throughout the test.
During the test, subjects were asked to keep their arms alongside the body and to stand
as still as possible. All subjects were tested under four altered sensory conditions: (1)
firm support surface, eyes opened, head neutral (EO), (2) firm support surface, eyes
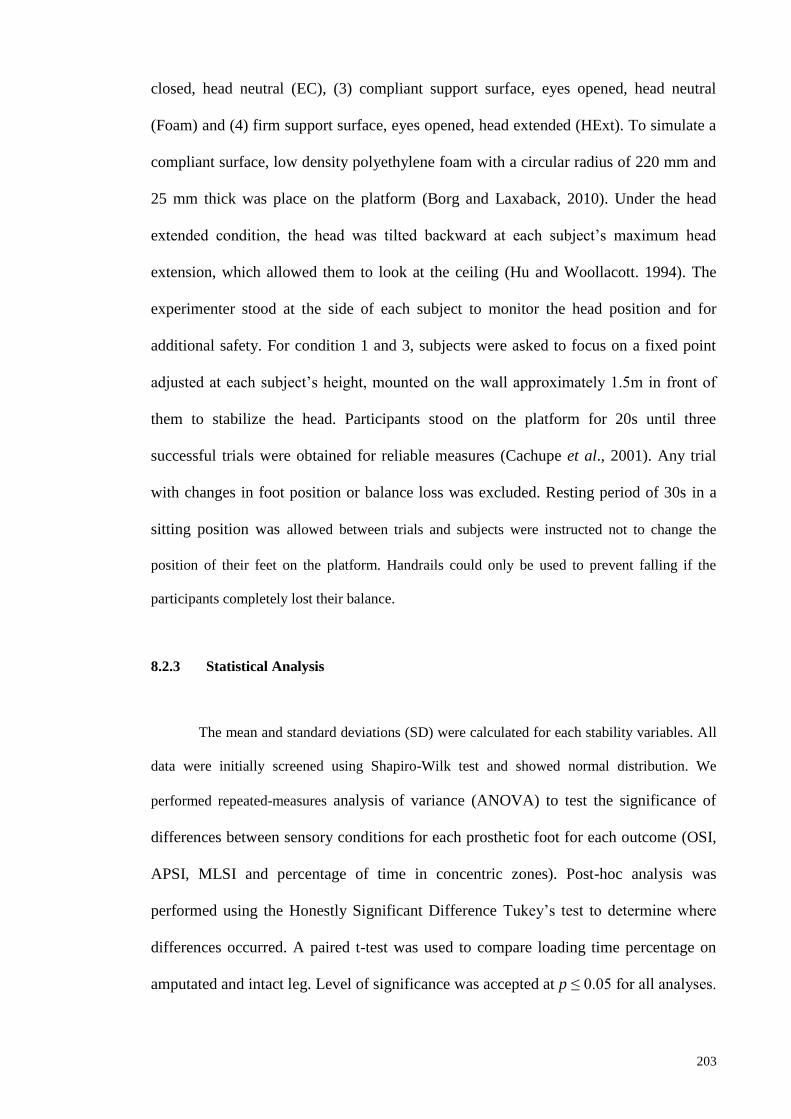
203
closed, head neutral (EC), (3) compliant support surface, eyes opened, head neutral
(Foam) and (4) firm support surface, eyes opened, head extended (HExt). To simulate a
compliant surface, low density polyethylene foam with a circular radius of 220 mm and
25 mm thick was place on the platform (Borg and Laxaback, 2010). Under the head
extended condition, the head was tilted backward at each subject’s maximum head
extension, which allowed them to look at the ceiling (Hu and Woollacott. 1994). The
experimenter stood at the side of each subject to monitor the head position and for
additional safety. For condition 1 and 3, subjects were asked to focus on a fixed point
adjusted at each subject’s height, mounted on the wall approximately 1.5m in front of
them to stabilize the head. Participants stood on the platform for 20s until three
successful trials were obtained for reliable measures (Cachupe et al., 2001). Any trial
with changes in foot position or balance loss was excluded. Resting period of 30s in a
sitting position was allowed between trials and subjects were instructed not to change the
position of their feet on the platform. Handrails could only be used to prevent falling if the
participants completely lost their balance.
8.2.3 Statistical Analysis
The mean and standard deviations (SD) were calculated for each stability variables. All
data were initially screened using Shapiro-Wilk test and showed normal distribution. We
performed repeated-measures analysis of variance (ANOVA) to test the significance of
differences between sensory conditions for each prosthetic foot for each outcome (OSI,
APSI, MLSI and percentage of time in concentric zones). Post-hoc analysis was
performed using the Honestly Significant Difference Tukey’s test to determine where
differences occurred. A paired t-test was used to compare loading time percentage on
amputated and intact leg. Level of significance was accepted at p ≤ 0.05 for all analyses.

204
The effect size was evaluated to indicate the significance of the results considering the
small sample size used in this study. The effect size (ES) was obtained from SPSS
results (partial eta squared, ηp2). According to Cohen (1998), the ES was defined as
small (0.01), medium (0.06), and large (0.14). All statistical analyses were performed
using SPSS v16.0 (SPSS Inc., Chicago, IL, USA).
8.3 Results
8.3.1 Participants’ characteristics
A total of ten male unilateral below-knee amputees with activity level of K2-K3
successfully completed the four weeks assessments. The mean (SD) for age, height and
weight of the subjects were 44.8(13.5) years, 170(6) cm, and 77.0(17.9) kg,
respectively. At the time of admission, all subjects demonstrated intensive use of the
prosthesis based on the average Houghton Scale and low risk of falling as showed by
the BBS. Demographic data and prosthesis information are provided in Table 3.2, while
detailed findings on the functional assessment can be found in Section 3.8.
8.3.2 Stability indexes during sensory modifications
Figure 8.2 shows the line plot of all measured parameters. Statistically
significant difference was found between sensory conditions in SACH foot for OSI
(p=0.002), APSI (p=0.036) and MLSI (p=0.008). Similarly for ESAR foot, sensory
conditions differed significantly in OSI (p=0.005), APSI (p=0.003) and MLSI (p=0.05).
The ES for all analyses was large (ranging from 0.63 to 0.86). The mean value for
MLSI was closer to OSI than the APSI. Overall, postural instability was the highest in

205
EC condition followed by HEXt, Foam and EO. The post-hoc analysis revealed that for
SACH and ESAR feet, all stability indexes in EC were significantly higher than EO
condition. In addition, SACH demonstrated significant higher instability for all indexes
in EC than Foam condition as well as in HExt than EO condition. Meanwhile, only OSI
and APSI in HExt condition were significantly higher than Foam condition. ESAR foot
showed significantly higher OSI and MLSI scores in EC than Foam, and significantly
higher OSI and APSI scores in HExt condition compared to EO. The differences in
stability indexes were not significant between EO vs Foam and EC vs HExt conditions
for SACH and ESAR feet. As for the SA foot, no significant difference between
conditions was observed.
8.3.3 Percentage of time in concentric zones for each sensory condition
The results of repeated-measures ANOVA revealed significant differences in the
time spent in the four concentric zones (Table 8.1). The post-hoc test showed that the
percentage of time spent in Zone A (00-50) was significantly greater than the other three
zones (p<0.01) for all prosthetic foot types during each sensory condition. In addition, a
significantly higher percentage of time was shown in Zone B (60-100) than Zone C (110-
150) and Zone D (160-200) for SACH and SA foot, but only evident under the EC
condition. Less than 1% of time was spent in Zone C and D in all tests. The effect size
for all analyses was large (ranging from 0.9 to 1).
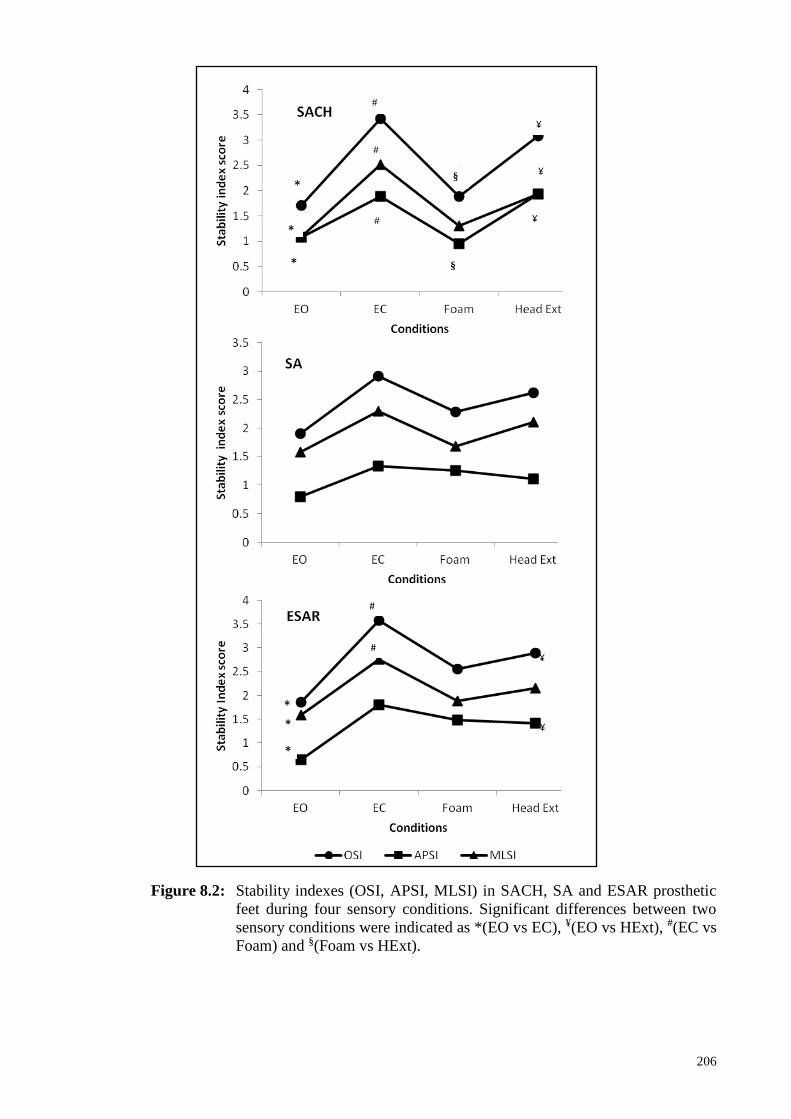
206
¥
*
*
*
¥
#
#
# ¥
Figure 8.2: Stability indexes (OSI, APSI, MLSI) in SACH, SA and ESAR prosthetic
feet during four sensory conditions. Significant differences between two
sensory conditions were indicated as *(EO vs EC), ¥(EO vs HExt), #(EC vs
Foam) and §(Foam vs HExt).
*
§
*
*
*
¥
¥
#
#
§
§

207
Table 8.1: Mean (SD) of percentage of time in concentric zones for SACH, SA and ESAR foot during different sensory conditions.
Conditions
Concentric Zones
SACH SA ESAR
Mean(SD) Mean(SD) Mean(SD)
A B C D A B C D A B C D
EO 97.8*
(5.7)
2.2
(5.7)
0# 0€ 89.1*
(29.0)
10.9
(29.0)
0# 0€ 93.9 *
(14.2)
6.1
(14.2)
0# 0 €
EC 83.8*
(17.9)
16.1§,∑
(17.6)
1# (0.3)
0€ 93.6 *
(8.3)
6.4§, ∑
(8.3)
0# 0€ 82.1*
(29.2)
17.5
(28.3)
0.4#
(1.0)
0€
Foam 89.8*
(31.2)
10.2
(31.2)
0# 0€ 89*
(31.4)
11
(31.4)
0# 0€ 86.3*
(25.6)
13.7
(25.6)
0# 0€
HeadExt 92.9*
(9.5)
5.8
(8.9)
0.5#
(1.6)
0.8€
(2.5)
89*
(18.4)
11
(18.4)
0# 0€ 91.9*
(13.0)
8.1
(13.0)
0# 0€
Note. Significant differences between two concentric zones were indicated as *(A vs B), #(A vs C), €(A vs D), §(B vs C) and ∑(B vs D).
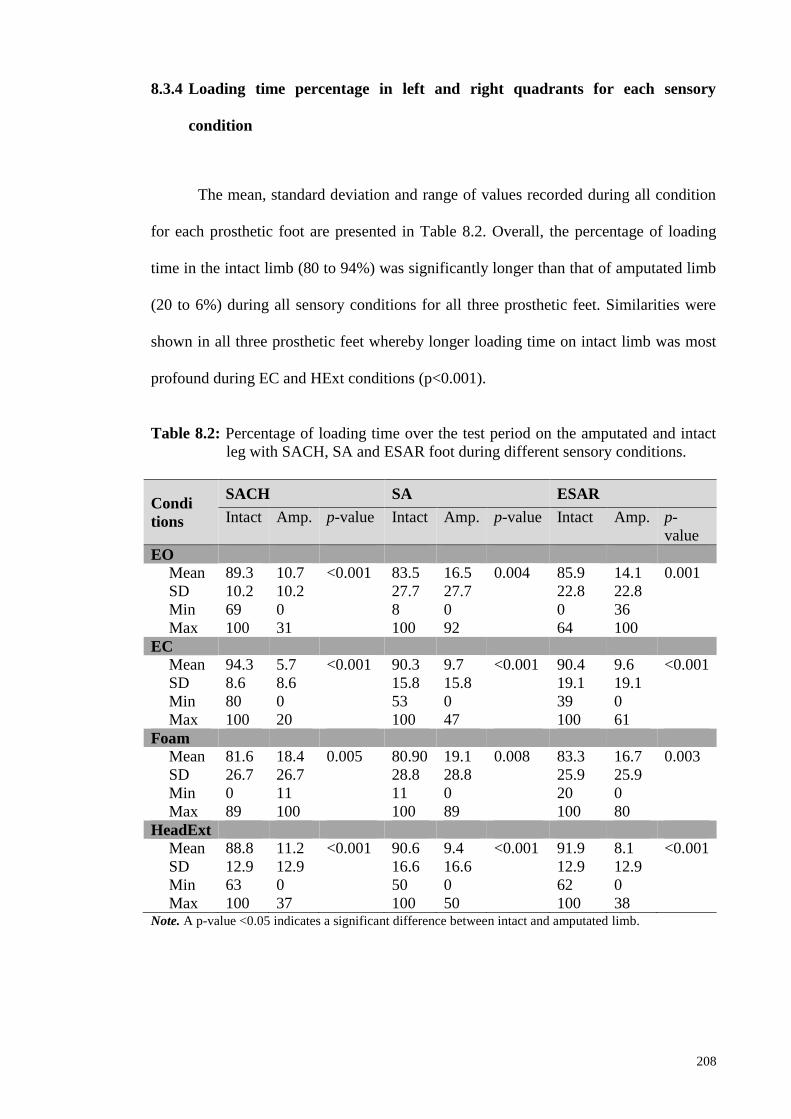
208
8.3.4 Loading time percentage in left and right quadrants for each sensory
condition
The mean, standard deviation and range of values recorded during all condition
for each prosthetic foot are presented in Table 8.2. Overall, the percentage of loading
time in the intact limb (80 to 94%) was significantly longer than that of amputated limb
(20 to 6%) during all sensory conditions for all three prosthetic feet. Similarities were
shown in all three prosthetic feet whereby longer loading time on intact limb was most
profound during EC and HExt conditions (p<0.001).
Table 8.2: Percentage of loading time over the test period on the amputated and intact
leg with SACH, SA and ESAR foot during different sensory conditions.
Condi
tions
SACH SA ESAR
Intact Amp. p-value Intact Amp. p-value Intact Amp. p-
value
EO
Mean 89.3 10.7 <0.001 83.5 16.5 0.004 85.9 14.1 0.001
SD 10.2 10.2 27.7 27.7 22.8 22.8
Min 69 0 8 0 0 36
Max 100 31 100 92 64 100
EC
Mean 94.3 5.7 <0.001 90.3 9.7 <0.001 90.4 9.6 <0.001
SD 8.6 8.6 15.8 15.8 19.1 19.1
Min 80 0 53 0 39 0
Max 100 20 100 47 100 61
Foam
Mean 81.6 18.4 0.005 80.90 19.1 0.008 83.3 16.7 0.003
SD 26.7 26.7 28.8 28.8 25.9 25.9
Min 0 11 11 0 20 0
Max 89 100 100 89 100 80
HeadExt
Mean 88.8 11.2 <0.001 90.6 9.4 <0.001 91.9 8.1 <0.001
SD 12.9 12.9 16.6 16.6 12.9 12.9
Min 63 0 50 0 62 0
Max 100 37 100 50 100 38 Note. A p-value <0.05 indicates a significant difference between intact and amputated limb.

209
8.4 Discussion
This study determined the postural steadiness of below-knee amputees by fully
utilizing the measurement outputs provided by the BSS. Although previous study has
demonstrated the use of stability indexes, time percentage on concentric zones and
quadrants in healthy subjects (Arnold and Schmitz, 1998), none has employed the same
approach in amputee populations. Amputees were assessed during quiet upright
standing to provide a baseline testing before progression into dynamic testing and
training. Moreover, quiet standing with prosthesis is considered a vital skill during the
early phase of rehabilitation to achieve independent standing posture before returning to
their daily life activities (Geurts and Mulder, 1992).
Previous studies reported that amputees had poor balance control when visual
input was absence compared to when accurate vision was present (Buckley et al., 2002;
Vanicek et al., 2002). The result of this current study was in agreement with previous
research which demonstrated significant postural instability of amputees during eyes-
closed condition, followed by standing with head-extended and standing on foam. The
finding that postural stability was similar during conditions where the eyes were opened
(EO and Foam conditions) further highlights the importance of visual cues in detecting
changes in body orientation with respect to the environment (Horak, 2006; Shumway-
Cook and Woollacott, 2000). Nevertheless, the complete loss of cutaneous, muscle, and
joint receptors of the residual limb as well as distorted sensory feedback from the intact
limb of the amputees caused inaccurate information, which affected the perceptions and
awareness of joint movements and positions (Geurts and Mulder, 1992; Horak and
Nashner, 1986; Vanicek et al., 2009). Therefore, the increase of CoM displacement
when amputees were standing on foam surface was expected. In condition where the
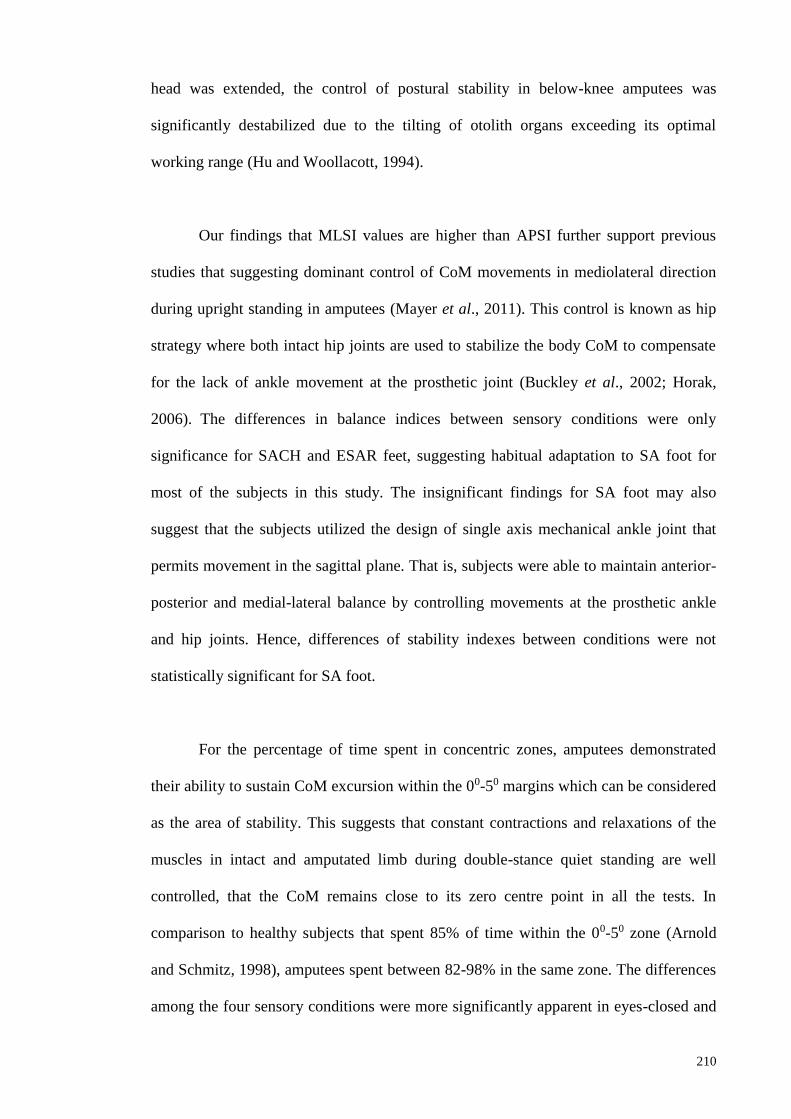
210
head was extended, the control of postural stability in below-knee amputees was
significantly destabilized due to the tilting of otolith organs exceeding its optimal
working range (Hu and Woollacott, 1994).
Our findings that MLSI values are higher than APSI further support previous
studies that suggesting dominant control of CoM movements in mediolateral direction
during upright standing in amputees (Mayer et al., 2011). This control is known as hip
strategy where both intact hip joints are used to stabilize the body CoM to compensate
for the lack of ankle movement at the prosthetic joint (Buckley et al., 2002; Horak,
2006). The differences in balance indices between sensory conditions were only
significance for SACH and ESAR feet, suggesting habitual adaptation to SA foot for
most of the subjects in this study. The insignificant findings for SA foot may also
suggest that the subjects utilized the design of single axis mechanical ankle joint that
permits movement in the sagittal plane. That is, subjects were able to maintain anterior-
posterior and medial-lateral balance by controlling movements at the prosthetic ankle
and hip joints. Hence, differences of stability indexes between conditions were not
statistically significant for SA foot.
For the percentage of time spent in concentric zones, amputees demonstrated
their ability to sustain CoM excursion within the 00-50 margins which can be considered
as the area of stability. This suggests that constant contractions and relaxations of the
muscles in intact and amputated limb during double-stance quiet standing are well
controlled, that the CoM remains close to its zero centre point in all the tests. In
comparison to healthy subjects that spent 85% of time within the 00-50 zone (Arnold
and Schmitz, 1998), amputees spent between 82-98% in the same zone. The differences
among the four sensory conditions were more significantly apparent in eyes-closed and

211
head extension conditions, suggesting the possible use of these conditions during
rehabilitation trainings.
This study demonstrated the possibilities of using the BSS to determine
percentage of loading time on the intact and amputated limb during quiet standing.
Previous study on able-bodied showed 45% and 55% of time spent on right and left
quadrant (Arnold and Schmitz, 1998). Amputees in our study showed 80 to 94% versus
20 to 6% loading time on intact and amputated limb, respectively. This is consistent
with previous study that amputees spent more time and consequently bear more weight
on non-affected side than the amputated side (Burke et al., 1978; Isakov et al., 1992;
Nadollek et al., 2002). A possible explanation for this is that the amputee’s CoM was
located closer to their intact limb than their prosthetic limb during normal standing
(Clark and Zernicke, 1981). Reduced proprioception on the amputated side, due to loss
of foot and leg muscles, was also thought to increase the dependency on the intact limb
(Isakov et al., 1992). Consequently, the asymmetrical loading between intact and
amputated leg has been associated with secondary physical conditions such as
osteoarthritis on the intact limb, osteoporosis on the amputated limb and back pain
(Gailey et al., 2008).
Moreover, an evidence of visual reliance was showed during eyes-closed
condition, where the time spent on amputated side was apparent in all prosthetic foot
types. The findings suggest that amputation leads to insufficient control of weight-
shifting to maintain an erect posture which caused more instability in medial-lateral
direction (Isakov et al., 1992). Other possible explanations include the unwillingness of
the amputees to initiate movement at the relatively stiff prosthetic ankle due to lack of
confidence, deficit in sensory organization and fear of falling (Barnett et al., 2012;
212
Horak and Nashner, 1986; Miller et al., 2001a). These results can be used during
rehabilitation to determine the direction of the sway to predict fall direction which
significantly increases the chances of a hip fracture. Future research should evaluate
postural stability of amputees using larger sample size to achieve more significant
differences during challenging condition such as dual tasking activities. In addition,
upcoming research should establish the reliability and validity of stability scores derived
from BSS in people with lower limb amputation.
8.5 Conclusion
This study showed that postural stability impairment in below-knee amputees
worsens when sensory input was obstructed despite passive stability provided by the
prosthesis. Additionally, the BSS may provide avenue for clinical assessment of
functional postural stability for the purpose of rehabilitation and prosthesis evaluation.
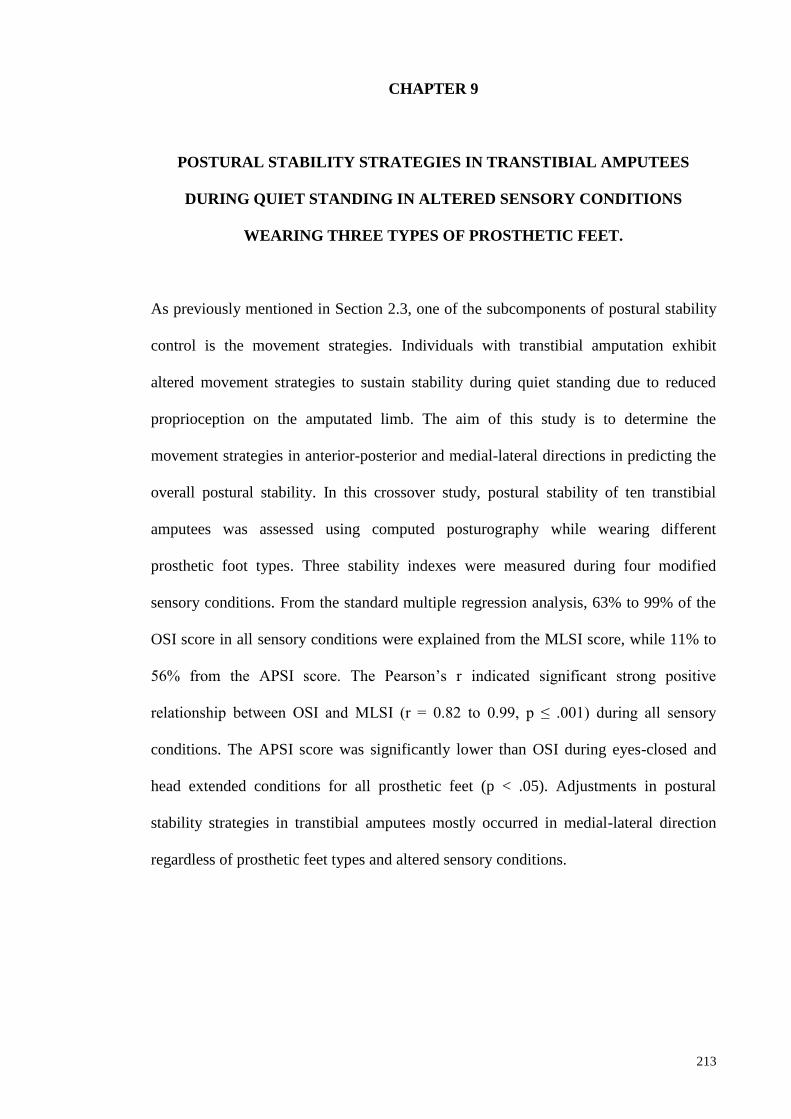
213
CHAPTER 9
POSTURAL STABILITY STRATEGIES IN TRANSTIBIAL AMPUTEES
DURING QUIET STANDING IN ALTERED SENSORY CONDITIONS
WEARING THREE TYPES OF PROSTHETIC FEET.
As previously mentioned in Section 2.3, one of the subcomponents of postural stability
control is the movement strategies. Individuals with transtibial amputation exhibit
altered movement strategies to sustain stability during quiet standing due to reduced
proprioception on the amputated limb. The aim of this study is to determine the
movement strategies in anterior-posterior and medial-lateral directions in predicting the
overall postural stability. In this crossover study, postural stability of ten transtibial
amputees was assessed using computed posturography while wearing different
prosthetic foot types. Three stability indexes were measured during four modified
sensory conditions. From the standard multiple regression analysis, 63% to 99% of the
OSI score in all sensory conditions were explained from the MLSI score, while 11% to
56% from the APSI score. The Pearson’s r indicated significant strong positive
relationship between OSI and MLSI (r = 0.82 to 0.99, p ≤ .001) during all sensory
conditions. The APSI score was significantly lower than OSI during eyes-closed and
head extended conditions for all prosthetic feet (p < .05). Adjustments in postural
stability strategies in transtibial amputees mostly occurred in medial-lateral direction
regardless of prosthetic feet types and altered sensory conditions.

214
9.1 Introduction
The maintenance of postural stability involves the integration of sensory systems
(visual, proprioceptive and vestibular), central nervous systems and musculoskeletal
systems (Winter, 1995). The available input from the sensory systems is evaluated by
the central nervous systems, and the musculoskeletal systems will execute appropriate
movement strategies to maintain postural stability (Yim-Chiplis and Talbot, 2000).
Healthy individuals have been shown to heavily rely on somatosensory (70%),
vestibular (20%) and vision (10%) when standing on firm surface in a well-lit condition
(Horak, 2006). However, the loss of biological ankle joint and a considerable amount of
muscles in the lower leg as a result of amputation causes distortion in proprioception
input which adversely reduces postural stability (Geurts and Mulder, 1992). In addition,
passive stability provided by the prosthetic foot has been suggested to reduce the
amount of body sway in lower limb amputees due to the relatively stiff ankle joint
(Buckley et al., 2002; Curtze et al., 2012). Nevertheless, people with lower-limb
amputation have been reported to exhibit higher risk of falling compared with able-
bodied due to the balance instability (Miller, Speechley and Deathe, 2001b).
In order to compensate for the proprioceptive deficits, amputees therefore
develop sensory reorganization to attain postural stability by increasing their reliance on
visual cues (Vanicek et al., 2009). Researchers showed that standing with eyes-closed
(Barnett et al., 2012; Vrieling et al., 2008) or standing on compliant surface (Kozakova
et al., 2009) contributed to a decrease in standing stability for people with lower limb
amputation. Moreover, manipulating more than one sensory input will further
deteriorate standing stability in amputees (Barnett et al., 2012). Although the vestibular

215
system has been suggested to resolve inter-sensory conflict (Shumway-Cook and Horak,
1986), the effect of vestibular disruption in amputees has yet to be conducted.
The coordination of movement strategies in maintaining postural equilibrium is
selected based on the characteristics of perturbations, task goal and previous experience
(Horak, 2006). As suggested by Winter (1995), three main movement strategies are
generally utilized to return the center of mass (CoM) to its base of support (BoS). The
ankle strategy has been known as sufficient to maintain postural stability when the
perturbation is small; the hip strategy is utilized during large and quick perturbation;
and stepping strategy is used when the BoS changes (Horak, 2006). During quiet
standing when the feet are side-by-side, able-bodied individuals commonly utilize ankle
movement strategy to control the excursion of center of mass CoM in the anterior-
posterior direction (Winter, 1995). However for amputees, consensus on which strategy
is used to maintain postural stability remains contradictory. Several studies reported that
in transtibial amputees, the ankle strategy which involves the active ankle function of
the sound limb and the passive ankle function of the prosthetic foot, is effective in
controlling postural stability in anterior-posterior direction (Curtze et al., 2012; Vanicek
et al., 2009). Conversely, other study reported that postural stability in transtibial
amputees are dominantly controlled using the hip strategy in medial-lateral direction
(Mayer et al., 2011).
For amputees to return to their daily life activities, the ability to reorganize
postural stability based on available sensory information and accomplishing appropriate
movement strategies is important in achieving independent upright posture (Geurts and
Mulder, 1992). Hence, prosthetic foot is prescribed to transtibial amputee to facilitate a
safe standing balance (Nederhand et al., 2012) which has been known as a basic and

216
vital skill that must be re-learned by amputees (Geurts and Mulder, 1992). Interestingly,
previous studies (Buckley et al., 2002; Curtze et al., 2012; Vanicek et al., 2009;
Vrieling et al., 2008) suggested that variations in prosthetic feet used may influence the
amputees’ response in maintaining postural stability. Thus, the purpose of the present
study was to quantify the movement strategies in anterior-posterior and medial-lateral
directions in predicting the overall postural stability wearing three types of prosthetic
feet when sensory inputs were altered. It is hypothesized that both movement in
anterior-posterior and medial-lateral directions are equally related to overall postural
stability during quiet standing with sensory alteration while wearing different prosthetic
feet.
9.2 Methodology
9.2.1 Participants
Subjects were approached at the rehabilitation clinics in the university’s medical
centre. Inclusion criteria were age over 20 years, male unilateral transtibial amputees
with at least one year experience in their current prostheses and the ability to walk
without the use of any assistive device. A detailed description of inclusion and
exclusion criteria can be found in Table 3.1, Section 3.4. This study was approved by
the Institutional Ethics Committee Board. All subjects were subjectively evaluated for
their perception of prosthetic use with the Houghton Scale (Devlin et al., 2004) while
the functional balance status was ascertained using the Berg balance scale (Wong et al.,
2013). More information regarding these questionnaires can be found in Section 3.8.
Participants who failed to maintain equilibrium during the test were excluded from the
study.

217
9.2.2 Prosthetic feet
Three types of prosthetic feet were used in this study for each condition: SACH
foot (Enjoylife, Fujian, China), SA foot (Enjoylife, Fujian, China) and ESAR Talux®
foot (Ossur, Reykjavik, Iceland). The SACH was a non-articulating foot with wooden
keel and rubberized cushioned heel. The SA foot allows plantarflexion-dorsiflexion
motion at the single hinge joint. The Talux® is a type of Flex-Foot with J-shaped
multiaxial ankle and heel-to-toe carbon fiber footplate designs. The amputees’ current
prosthetic sockets and components were optimally aligned using a laser liner before the
assessment by the same registered prosthetist. Each test foot was attached to the
patient’s existing prosthesis using their own socket and suspension. Subjects wore socks
to disclose the structure of the prosthetic foot.
9.2.3. Procedures
Prior to the tests, all participants completed one familiarization trial for each
condition to negate the potential effects of learning and fatigue (Hinman, 2000).
Amputees attended three consecutive sessions on separate days at one week
accommodation intervals to complete the assessment (English et al., 1995). Each
amputee tested one prosthetic foot for each session. The test was counterbalance across
amputees to negate order effects. After the assessments were completed for all
prosthetic feet, amputees attended the final visit to change the test foot with their
original foot. Balance indexes data for conditions (1) firm support surface, eyes opened,
head neutral (EO), (2) firm support surface, eyes closed, head neutral (EC) and (3)
compliant support surface, eyes opened, head neutral (Foam) were obtained from
previous published studies (Arifin et al., 2014b; Arifin et al., 2014c). In this study, the

218
same subjects were asked to perform condition (4) firm support surface, eyes opened,
head extended (HeadExt). To simulate vestibular disruption, the head was tilted
backward at each subject’s maximum head extension, which allowed them to look at the
ceiling (Hu and Woollacott, 1994). The experimenter stood at the side of each subject to
monitor the head position throughout the assessments. Illustrations of these conditions
can be referred to Section 3.10.
Postural stability of the amputees was evaluated with the BSS (Biodex®
Medical System, Shirley, NY, USA) which measures the deviation of center of mass
during static condition and degree of platform tilt in frontal and sagittal axes during
dynamic conditions (Arnold and Schmitz, 1998). Based from the amount of deviation or
tilt from the centre of the platform (zero point), the system computes the overall
stability index (OSI), anterior/ posterior stability index (APSI), and medial/ lateral
stability index (MLSI). A greater amount of body movement is associated with an
unstable posture which resulted in higher stability index. A lower index indicated little
movement and is associated with more stable posture. The platform was integrated with
Biodex® software (Version 3.1 Biodex® Medical Systems) which enables the device to
calculate the stability indexes. The software sampled the deviation from level at rate of
20Hz which the signals were converted to OSI, MLSI, and APSI scores using formula
expressed in Section 3.7 as Eq. (1), Eq. (2) and Eq. (3), respectively.
Participants were instructed to step on the BSS platform and the feet were
positioned 17cm between the heel centres and 14˚ between the long axes of the feet to
eliminate between-subject variability during balance testing (Mcllroy and Maki, 1995).
The position of the feet was marked and recorded to ensure consistency in all trials.
During the test, the participants were asked to keep their arms alongside the body.

219
Participants stood on the platform for 20s under all conditions for three successful trials.
Any trial with changes in foot position or balance loss was excluded. A standard
instruction of “stand as still as possible” was given to all participants to ensure
consistency (Zok et al., 2008). Participants were allowed to rest for 30s in a sitting
position between trials and instructed not to change the position of their feet on the
platform. Handrails could only be used to prevent falling if the participants totally lost
their balance. An assistant stood at the back of the subject for additional safety.
9.2.4 Statistical Analysis
Means and standard deviations (SD) were calculated for each stability variables.
All of the demographic and balance assessment data were initially screened using
Shapiro-Wilk test and showed normal distribution. The movement strategies in anterior-
posterior and medial-lateral directions in predicting the overall postural stability was
determined by means of the standard multiple regression analysis. This analysis was
performed to determine the relative contribution of MLSI and APSI scores to the OSI
score; as well as the statistical significance of the model and individual independent
variables.
A sample size of ten events per independent variable in the regression model
was considered adequate for the accuracy and significance of the estimated coefficients
(Peduzzi et al., 1995). The MLSI and APSI were treated as the independent (predictors)
variables, while the OSI as dependent (outcome) variable. The Beta value was used to
determine which of the independent variables contributed to the prediction of the
dependent variable. Due to the small sample size in this study, the adjusted R2 was used
to explain the variance in the OSI explained by the model. The squared semi-partial

220
correlations (sr2) explained the relationship between each predictor and the outcome
variable (Pallant, 2011).
The Pearson’s product-moment correlation (Pearson’s r) obtained from the
multiple regression analysis was used to indicate the relationships between OSI and
APSI as well as between OSI and MLSI in each condition. Classification of r was used
to describe very weak relationships when r=0.0 to 0.2, weak when r = 0.20 to 0.4,
moderate when r =0.4 to 0.7, strong when r = 0.7 to 0.9 and very strong when r =0.9 to
1.0 (Rowntree, 1991). Additionally, a one-way analysis of variance (ANOVA) was
performed to test differences between stability indexes during each sensory condition.
Post-hoc analysis was performed using the Honestly Significant Difference Tukey’s test
to determine where differences occurred. Significance was accepted at p ≤ 0.05 for all
analyses. The effect size (ES) was also evaluated to indicate the significance of the
results because of the small sample size used in this study. The ES was determined
based on partial eta squared (ηp2) and defined as small (0.01), medium (0.06), and large
(0.14) effects (Laken, 2013). All statistical analysis was performed using SPSS v16.0
(SPSS Inc., Chicago, IL, USA).
9.3 Results
9.3.1 Subjects’ characteristics
Ten male below-knee amputee subjects gave their informed consent to
participate in this study. The mean ± SD for age, height and weight of the subjects were
44.8 ± 13.5 years, 170 ± 6 cm, and 77.0 ± 17.9 kg, respectively. All subjects
demonstrated intensive use of the prosthesis based on the average Houghton Scale (10.5

221
± 0.9) and low risk of falling as showed by the Berg balance scale (52.9 ± 4.9).
Demographic data and prosthesis information are given in Table 3.2, Section 3.5.
9.3.2 Movement strategies in predicting the overall postural stability.
Figure 9.1 illustrates the scatter plot of the distribution of OSI, APSI and MLSI
for SACH, SA and ESAR foot.
(a) SACH foot
(b) SA foot
Figure 9.1: The scatter plot of the
distribution of Overall Stability Index (OSI), Anterior-Posterior Stability
Index (APSI) and Media-Lateral Stability Index (MLSI) for (a) SACH
foot, (b) SA foot and (c) ESAR foot.

222
(c) ESAR foot
Figure 9.1, continued.
The Pearson’s r indicated significant strong to very strong positive relationship
between OSI and MLSI (r = 0.82 to 0.99, p ≤ .001) during all sensory conditions for all
prosthetic feet (Table 9.1). However, significant moderate to very strong positive
relationship (r= 0.58 to 0.97, p<.05) between OSI and APSI were shown in all
conditions except during eyes closed for SACH and SA, and head extended for SA and
ESAR.
Table 9.1: Correlations (Pearson’s r) between the variables in the analysis (N=10).
Note. *p ≤ .05, indicate significant relationship between every pair of variables.
Correlations
between
SACH SA ESAR
r p-value r p-value r p-value
EO
OSI and APSI 0.846 .001* 0.828 .002* 0.735 .008*
OSI and MLSI 0.899 <.001* 0.994 <.001* 0.996 <.001*
EC
OSI and APSI 0.489 .076 0.268 .227 0.698 .012*
OSI and MLSI 0.876 <.001* 0.919 <.001* 0.922 <.001*
Foam
OSI and APSI 0.968 <.001* 0.831 .001* 0.896 <.001*
OSI and MLSI 0.988 <.001* 0.971 <.001* 0.936 <.001*
HeadExt
OSI and APSI 0.576 .041* 0.150 .340 0.323 .182
OSI and MLSI 0.821 .002* 0.954 <.001* 0.831 .001*

223
According to Beta values from the regression analysis, 61% to 99% of the OSI
score in all sensory conditions could be contributed from the MLSI score, while 11% to
56% was explained by the APSI score (Table 9.2). Specifically the MLSI contribution
was shown highest during EC condition (86%) for SACH foot as well as during
HeadExt for SA and ESAR feet (99% and 97%, respectively).
The ANOVA analysis for the stability indexes produced a significant difference
among OSI, APSI and MLSI indexes during EC (SACH: F2,27 =4.84, p=.016; SA: F2,27
=6.60, p=.005; ESAR: F2,27 =4.62, p=.019) and HeadExt (SACH: F2,27 =3.00, p=.05; SA:
F2,27 =3.40, p=.048; ESAR: F2,27 =5.58, p=.009) conditions. The post-hoc test revealed
that the APSI score was significantly smaller than OSI with all prosthetic feet during
EC and HeadExt conditions. The MLSI was significantly lower than OSI only in
HeadExt condition for SACH foot. Also, MLSI exhibited significantly higher score than
APSI in EC condition for SA foot (Table 9.3).
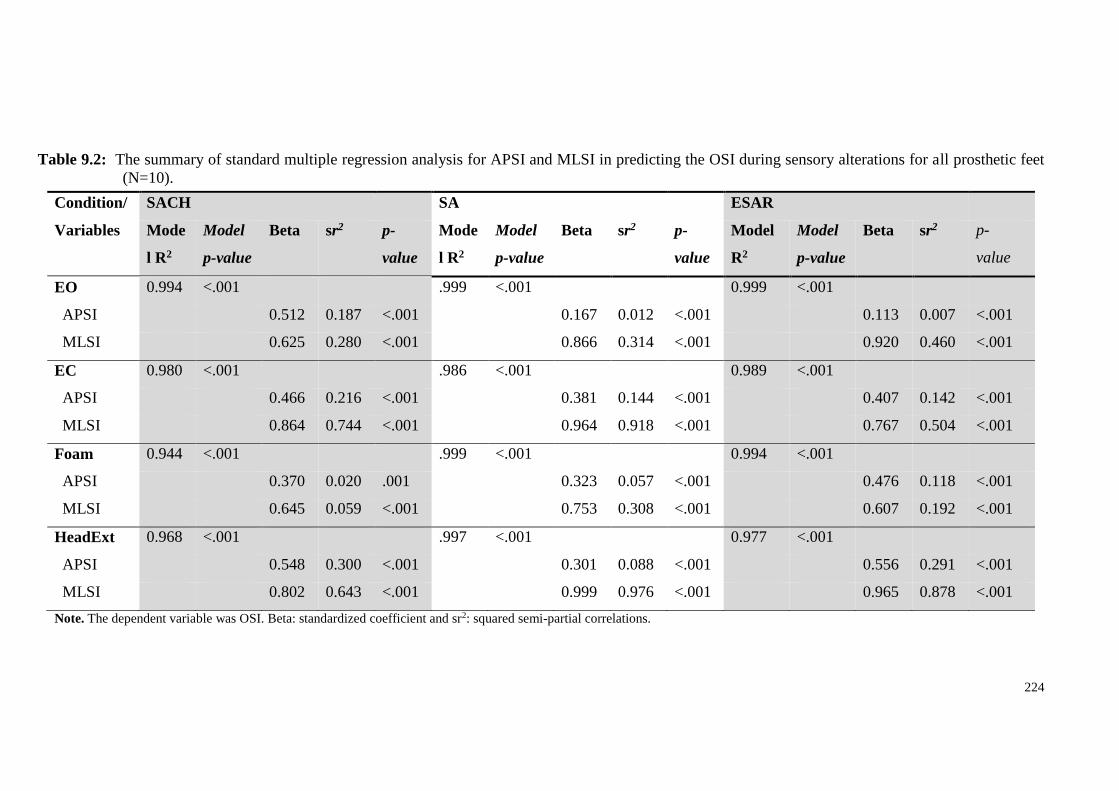
224
Table 9.2: The summary of standard multiple regression analysis for APSI and MLSI in predicting the OSI during sensory alterations for all prosthetic feet
(N=10).
Note. The dependent variable was OSI. Beta: standardized coefficient and sr2: squared semi-partial correlations.
Condition/
Variables
SACH SA ESAR
Mode
l R2
Model
p-value
Beta sr2 p-
value
Mode
l R2
Model
p-value
Beta sr2 p-
value
Model
R2
Model
p-value
Beta sr2 p-
value
EO 0.994 <.001 .999 <.001 0.999 <.001
APSI 0.512 0.187 <.001 0.167 0.012 <.001 0.113 0.007 <.001
MLSI 0.625 0.280 <.001 0.866 0.314 <.001 0.920 0.460 <.001
EC 0.980 <.001 .986 <.001 0.989 <.001
APSI 0.466 0.216 <.001 0.381 0.144 <.001 0.407 0.142 <.001
MLSI 0.864 0.744 <.001 0.964 0.918 <.001 0.767 0.504 <.001
Foam 0.944 <.001 .999 <.001 0.994 <.001
APSI 0.370 0.020 .001 0.323 0.057 <.001 0.476 0.118 <.001
MLSI 0.645 0.059 <.001 0.753 0.308 <.001 0.607 0.192 <.001
HeadExt 0.968 <.001 .997 <.001 0.977 <.001
APSI 0.548 0.300 <.001 0.301 0.088 <.001 0.556 0.291 <.001
MLSI 0.802 0.643 <.001 0.999 0.976 <.001 0.965 0.878 <.001
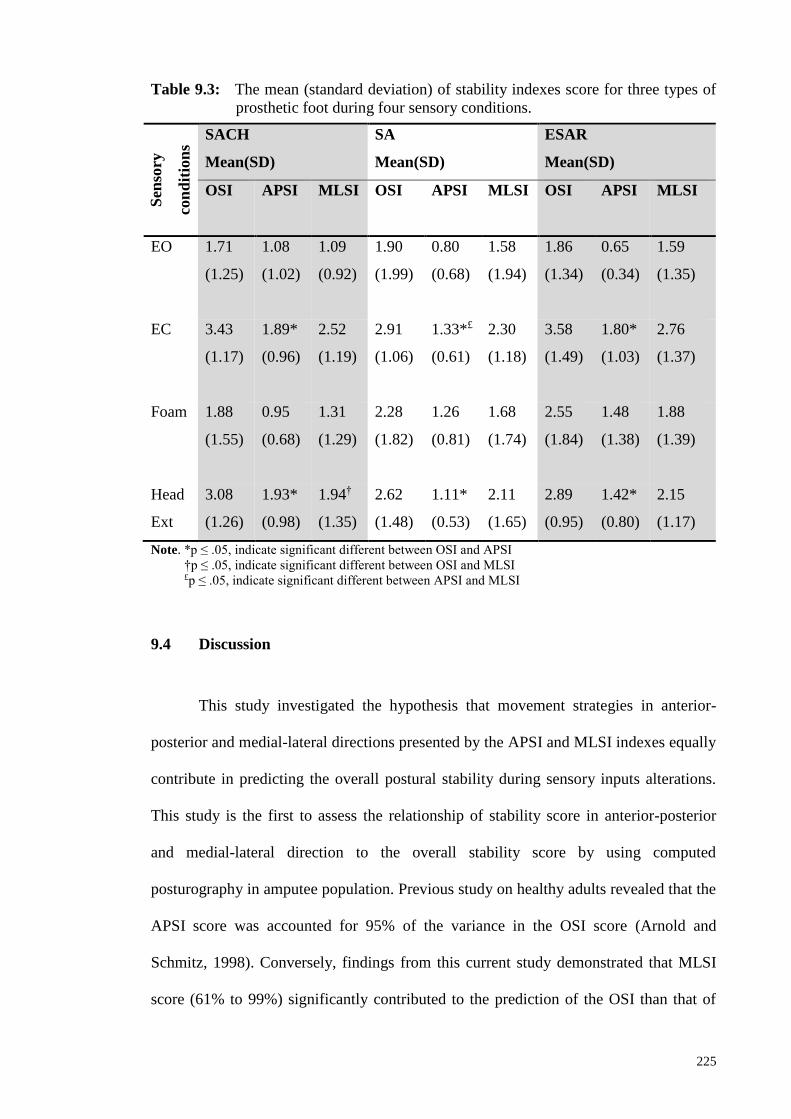
225
Table 9.3: The mean (standard deviation) of stability indexes score for three types of
prosthetic foot during four sensory conditions.
Note. *p ≤ .05, indicate significant different between OSI and APSI
†p ≤ .05, indicate significant different between OSI and MLSI
£p ≤ .05, indicate significant different between APSI and MLSI
9.4 Discussion
This study investigated the hypothesis that movement strategies in anterior-
posterior and medial-lateral directions presented by the APSI and MLSI indexes equally
contribute in predicting the overall postural stability during sensory inputs alterations.
This study is the first to assess the relationship of stability score in anterior-posterior
and medial-lateral direction to the overall stability score by using computed
posturography in amputee population. Previous study on healthy adults revealed that the
APSI score was accounted for 95% of the variance in the OSI score (Arnold and
Schmitz, 1998). Conversely, findings from this current study demonstrated that MLSI
score (61% to 99%) significantly contributed to the prediction of the OSI than that of
Sen
sory
con
dit
ion
s
SACH
Mean(SD)
SA
Mean(SD)
ESAR
Mean(SD)
OSI APSI MLSI OSI APSI MLSI OSI APSI MLSI
EO 1.71
(1.25)
1.08
(1.02)
1.09
(0.92)
1.90
(1.99)
0.80
(0.68)
1.58
(1.94)
1.86
(1.34)
0.65
(0.34)
1.59
(1.35)
EC 3.43
(1.17)
1.89*
(0.96)
2.52
(1.19)
2.91
(1.06)
1.33*£
(0.61)
2.30
(1.18)
3.58
(1.49)
1.80*
(1.03)
2.76
(1.37)
Foam 1.88
(1.55)
0.95
(0.68)
1.31
(1.29)
2.28
(1.82)
1.26
(0.81)
1.68
(1.74)
2.55
(1.84)
1.48
(1.38)
1.88
(1.39)
Head
Ext
3.08
(1.26)
1.93*
(0.98)
1.94†
(1.35)
2.62
(1.48)
1.11*
(0.53)
2.11
(1.65)
2.89
(0.95)
1.42*
(0.80)
2.15
(1.17)
226
APSI score (11% to 56%). Thus, the hypothesis was rejected. The multiple regression
analysis indicated that the MLSI was highly related with OSI score in all sensory
conditions and foot types.
The results of this study supported previous study which demonstrated that
most adjustments strategies in amputees occurred in medial-lateral direction, indicated
by the greater deviation of CoM in the frontal plane (Mayer et al., 2011). Lower limb
amputation leads to insufficient control of weight-shifting to maintain an erect posture
which caused instability in medial-lateral direction as a result of compensation strategy
to the impairment in controlling balance in the anterior-posterior direction (Aruin et al.,
1997; Hermodsson et al., 1994). Therefore, the amputees utilized the hip strategy by
activating hip muscle contraction as opposed to ankle strategy used in able-bodied
persons (Horak, 2006). In addition, increasing the use of intact hip musculature at the
amputated limb was suggested as a strategy to increase somatosensory inputs in
regulating the movement of CoM (Vrieling et al., 2008). Other possible explanations to
this finding include the unwillingness of the amputees to initiate movement at the
relatively stiff prosthetic ankle in the sagittal plane due to lack of confidence, deficit in
sensory organization and fear of falling (Barnett et al., 2012; Horak, 2006; Miller et al.,
2001b; Vanicek et al., 2009). Thus, the MLSI could potentially become the predictor
factor of postural stability in amputees during quiet standing. Although the APSI
contributes less than the MLSI, instabilities in anterior-posterior direction may be
important for specific amputee. Therefore, the MLSI and APSI scores should be
interpreted separately rather than using only the OSI for clinical diagnosis.

227
In addition to the regression analysis, the ANOVA results suggested that the
APSI was significantly lower than the OSI, suggesting small contribution to the overall
stability index score, when sensory input from visual and vestibular system was altered.
In these two conditions, the OSI and MLSI scores were almost identical such that no
significant different was showed between the scores. This study showed that the
postural stability of amputees was most affected during eyes-closed and head-extended
conditions. This finding demonstrated that amputees were heavily dependent upon
visual information to detect changes in body orientation with respect to the
environment, as reported previously (Isakov et al., 1992; Massion and Woollacott,
2004b; Vanicek et al., 2009). Moreover, the control of postural stability in transtibial
amputees was significantly destabilized when the head is extended compared to neutral
head position. Previous studies which manipulated the vestibular system by head tilting
in elderly and healthy adults reported a decreased in postural stability. This decrease has
been suggested as a result of tilting the otolith organs exceeding its optimal working
range (Mientjes and Frank, 1999; Paloski et al., 2006). Furthermore, the complete loss
of cutaneous, muscle, and joint receptors of the residual limb as well as distorted
sensory feedback from the intact limb of the amputees were often linked to the
deterioration in postural stability (Geurts and Mulder, 1992; Vanicek et al., 2009).
The findings from this study is in agreement with previous study which reported
increased CoM displacement when amputees were standing on a compliant surface
(Kozakova et al., 2009). The compliant support surface has been suggested to reduce
the accuracy of information on the perceptions and awareness of joint movements and
positions (passive and active) (MacLellan and Patla, 2006; Newton, 1982). Overall, it is
reasonable to suggest that postural stability of below-knee amputees is compromised
even when one sensory modality is altered during quiet standing. Thus, it is rational to

228
suggest that specific rehabilitation trainings should be provided to the amputees to
enhance the skills in sensory inputs reweighting and executing appropriate movement
strategies in maintaining standing stability. Moreover, our study demonstrated that the
BSS may be utilized during trainings and assessments of balance in person with lower
limb amputation due to its objective outcomes.
Limitations in our study include the small sample size due to the difficulty in
recruiting amputees to involve in a long-term study, the mixed cause of amputation and
less challenging tasks. Hence, caution should be exercised when generalizing our results
to other amputees with different levels of amputation. In addition, the use of ‘Enter”
method for the standard multiple regression analysis only assessed the stability indexes
without controlling for other variables (such as age, weight, height). However, no
significant differences were observed among the amputees in terms of demographic
data, demonstrating the appropriateness of using the standard multiple regression
analysis. All subjects were skilled and experienced amputees, hence, the results of this
study may not be generalized to amputees who are still in postoperative phase.
9.5 Conclusion
Adjustments strategies in amputees mostly occurred in medial-lateral direction
regardless of prosthetic feet types. In addition, this study showed that the postural
stability in transtibial amputees deteriorate under the manipulation of different sensory
information. Therefore, it is crucial for the amputees to be able to maintain their
postural stability by depending on reliable sensory information and selecting
appropriate movement strategies according to changes in the environment.

229
CHAPTER 10
CONCLUSIONS AND FUTURE RECOMMENDATIONS
10.1 Conclusions
The consequences of having a below-knee amputation on a person’s ability to
maintain an upright postural stability have been well-reported biomechanically
(Nederhand et al., 2012; Barnett et al., 2012; Hlavackova et al., 2011) and
psychologically (Miller et al., 2002; Miller et al., 2003) in previous literatures.
However, the current study is the first to systematically evaluate the influence of
prosthetic feet types and sensory modifications in controlling postural stability in
below-knee amputees. Specifically, to the author’s best knowledge, this is the first study
to quantify the biomechanics of postural stability adaptations in an amputee population
using the Biodex Stability System (BSS). Presently, the only published literatures on
this matter have initiated from this thesis.
The overall aim of the current thesis was to investigate the postural stability
response that occurred within unilateral below-knee amputees wearing different
prosthetic foot types during primary sensory alterations during upright standing. As
stated in Section 1.6, there are six objectives that have been recognised to achieve this
aim. Accordingly, the following conclusions are drawn for each specific objective.
I. The stability indexes produced from BSS are reliable when scored by a
single rater between seven days of interval during static and dynamic
unilateral stance.

230
The results for this study showed that the application of computerised
posturography should be used in quantifying postural balance in assessing
effectiveness of a specific clinical or research intervention for repeated
measurement design. Although this thesis only involved bilateral stance
assessment for the safety factor of the amputees, this finding serves as
evidence that the author of this thesis (who is also the rater) is capable of
producing reliable output when operating the device.
II. The maintenance of postural stability during upright standing in below-
knee amputees was not affected by the prosthetic foot types but was
reduced when the visual cues were absent.
The current study demonstrated that loss of vision, but not prosthetic foot
types, significantly impaired the maintenance of overall, anterior-posterior
and medial-lateral postural stability in below-knee amputees. Although there
was a trend of better overall stability with SACH foot during eyes-opened
and SA foot during eyes closed, the differences between feet were not
significant. However, significant differences between the prosthetic foot
types are revealed from the ABC scores, which suggested that the amputees
were able to perceive disparities between the passive stability offered by the
ankle mechanisms during the subjective assessment. The findings in this
study are important as they highlight the importance of incorporating
balance practice with altered visual information to avoid amputees’ over-
dependence on this source of information. Thus, amputees will be
encouraged to utilise other sensory information from somatosensory and
vestibular system.

231
III. The overall stability of below-knee amputees was affected by the prosthetic
foot design particularly when subjects were standing on a compliant
surface. Postural stability performance in anterior-posterior and
medial-lateral between persons with below-knee amputation and able-
bodied individuals can be distinguished only when standing on
compliant surface.
Standing on a compliant surface while wearing ESAR foot was shown to
significantly reduce the overall stability compared to SACH foot. This
illustrates that clinicians should consider the types of articulation at the ankle
joint when prescribing prosthetic foot to amputees who ambulate mostly on
soft surfaces. When postural stability outcomes were compared between
able-bodied individuals and each prosthetic foot group, it was found that the
difference between able-bodied persons and those with below-knee
amputation was apparent only in compliant surface. The results from this
study concur with the notions that standing on a compliant surface causes
greater postural sway due to the reduced accuracy of information needed to
detect body orientation. Findings depicted from this study suggest that
practice of balance whilst on surfaces made from materials of varying
densities may be beneficial to enhance their ability to safely stand on various
support surface conditions during daily life activities.
IV. Standing with head extension reduced the postural stability control in
persons with below-knee amputation. Postural stability between persons
with below-knee amputation and able-bodied individuals could be
distinguished particularly in medial-lateral direction.
232
The overall, anterior-posterior and medial-lateral stability indexes in
individuals with below-knee amputation were significantly affected by
sensory conditions, but not by the prosthetic foot types. Specifically in
below-knee amputees, overall and anterior-posterior control of postural
stability control was most challenged when either visual or vestibular
sensory was modified. From the computerised posturography assessment,
amputees were reported to have significantly reduced postural stability than
the able-bodied group mostly in medial-lateral direction. This study suggests
that head extension, which represents vestibular system disruption, increases
the difficulty to maintain postural stability in persons with below-knee
amputation. Hence, it is reasonable to suggest that rehabilitation program
should incorporate head extension task as one of the modalities to improve
the ability to maintain postural stability during reaching activities beyond
eye level.
V. The characteristics of postural stability in below-knee amputees under
various sensory manipulations can be clinically assessed by utilising the
outcomes produced by the Biodex® Stability System (BSS).
This study demonstrates that computerised posturography assessment using
the BSS device can be useful for an evidence-based clinical practice. In
particular, differences in postural stability index between sensory conditions
can be distinguished in SACH and ESAR foot. The BSS also determined that
the amputees successfully maintained their upright postural stability within
the safe area of stability during all sensory modifications and prosthetic feet
types. From the BSS outcome, below-knee amputees in this study exhibited
the lowest postural stability during eyes-closed condition followed by head-

233
extended, standing on foam and eyes-opened conditions. Moreover,
amputees were shown to have significant percentage of loading time on the
intact limb than the amputated limb especially during eyes-closed condition
and head-extended condition. Thus, the use of the intact limb may be
hypothesised as a vital adaptation for a successful postural control.
Nevertheless, the tendency to heavily rely on the intact limb may suggest for
training which can improve the function of the amputated limb for a better
overall stability control. Since standing with eyes-closed was reported to be
the most challenging task, it can be proposed that the amputees may have
relied heavily on the accurate visual information over the somatosensory or
vestibular information to maintain postural stability. Hence, it is
recognisable that rehabilitation training that can increase the amputee’s
ability to utilise the somatosensory or vestibular input may aid the
progression of maintaining postural stability.
VI. Adjustments in postural stability strategies in below-knee amputees mostly
occurred in medial-lateral direction with all prosthetic feet types during
altered sensory conditions.
Regardless of types of prosthetic foot or sensory conditions, below-knee
amputees exhibited dominant control in frontal plane in maintaining upright
standing stability. From the standard multiple regression analysis, the overall
postural stability in all sensory conditions was attributed to the stability in
medial-lateral direction than in anterior-posterior direction. Particularly,
contribution from medial-lateral stability was prominent during eyes-closed
condition for SACH foot and during head extended condition for SA and

234
ESAR foot. Due to the high instability in medial-lateral direction as reported
in these findings, it is reasonable to suggest the utilisation of MLSI index as
an indicator of falling in below-knee amputee. The results from this study
highlights the importance of specific rehabilitation trainings in providing
amputees with the skills in sensory inputs reweighting and executing
appropriate movement strategies in maintaining standing stability.
In regards to the outcome measures, the current study adds to our understanding
of how Activities-specific Balance Confidence instrument can be used to reveal the
differences in perceived balance confidence between articulated and non-articulated
prosthetic feet during dynamic activities such as walking, stairs and escalator
negotiations. Thus, it is strongly recommended to incorporate this instrument during
clinical evaluations of amputee rehabilitation as it provides quick, reliable and easy
assessment. Additionally, balance capacity of amputees should be evaluated using the
functional performance test, such as the Berg balance test, prior to the planning of
rehabilitation program. The results from outcome measures, coupled with findings from
objective assessment, provide valuable information to the clinical team in planning
rehabilitation goal and prosthetic management for the amputees.
Overall, this thesis contributes an important addition to the body of knowledge
by focusing on one of the key research areas in amputee rehabilitation: postural
stability. The current thesis provides further insight into the influence of prosthetic feet
types and sensory modification to the control of postural stability that occurs in below-
knee amputees. This includes the assessment of postural stability using computed
posturography and outcome measures instruments. The systematic approach developed
in this study helps to identify that the sensory information, but not prosthetic feet types,

235
plays a vital role in the maintenance of postural stability during upright standing. In
addition, the knowledge provided by the current thesis can enhance our understanding
of the feasibility of Biodex stability system to be employed as an objective measure of
postural stability assessment and training depending on the rehabilitation goal. As such,
the Biodex system can be useful for the prosthetist to optimally adjust the alignment by
checking the position of the CoM from the Biodex display. To conclude, findings from
the current thesis have pertinent implications in encouraging clinicians to include
evidence-based practice during decision making in rehabilitation planning and for the
justification of prosthetic prescription for below-knee amputees.
10.2 Recommendations for future research
Forthcoming research directions are recommended for greater understanding of
how below-knee amputees regulate their postural stability when wearing different
prosthetic feet in altered sensory conditions. The current study investigated postural
stability control during a static upright standing condition. Although static upright
standing has been known as a fundamental task in achieving independent living,
amputees faced with more challenging task during their daily activities. Therefore,
future study examining amputees during dynamic activities, such as walking with
different speeds, stairs and ramp negotiations, may elicit the influence of different
prosthetic feet types to the control of postural stability. Similarly, postural stability
assessment during unexpected and voluntarily-initiated perturbation or during dual-
activities should be included in the experimental protocol to enhance our understanding
on how amputees respond to these challenging situations.

236
Due to the different comorbidities between vascular-related and traumatic
below-knee amputees which may affect the homogeneity of the amputees, future
research should evaluate the amputees separately according to their cause of
amputation. This approach aids in improving the understanding of postural stability
control as a result from compromised peripheral vascular condition. As the
musculatures of intact and amputated limb play such a vital role in regulating the
movement of the body, future research would also benefit from undertaking the
electromyogram analysis to explicitly identify the activation of related muscles
contributing to the control of postural stability during upright standing in various
sensory and prosthesis conditions. The ankle joint is known to generate torque in
response to the external perturbation imposed on the CoM. It is acknowledged in this
current study that the generated ankle torque was not measured during the assessment
with different prosthetic feet and sensory conditions. Therefore, future studies should
measure the contribution from the intact and prosthetic ankle joints in generating the
necessary ankle torque to control postural stability during activities of daily living. This
would provide a valuable insight into the specific adaptation that may occur due to the
amputation.
Equally important, future research may explore the relationship between the
stability indexes and prosthetic ankle stiffness to further clarify whether foot stiffness
influences the enhancement of postural stability mechanism in below-knee amputees. In
addition, greater interest for future study is to expand the application of this research to
the above-knee amputees to understand the postural stability reorganisation with the
inclusion of artificial knee joint to the prosthesis. As evidenced by previous studies, the
one-week accommodation period for each prosthetic foot given to below-knee amputees
in this study was considered sufficient to reveal functionality differences between the
237
feet. Nevertheless, prospective research should provide longer acclimatization period
which may produce different results that may be more meaningful to reflect the longer
time use of the prosthesis.
In terms of improving rehabilitation training program, future research should
also investigate the utilisation of Biodex stability system to monitor the progress of
postural stability performance when amputee first prescribed with the most basic
prosthetic foot to a more flexible foot according to their individual functional needs.
Another important aspect that should be considered in future research is to increase the
numbers of amputee participant base from sample size calculation. Having more
participants may improve the statistical power and consequently produce more
significant findings between the prosthetic interventions. Furthermore, findings
obtained from a larger sample size may be generalised as a representative of the overall
population of below-knee amputees.
238
References
Adkin, A.L., Frank, J.S., Carpenter, M.G. & Peysar, G.W. (2000). Postural control is
scaled to level of postural threat. Gait & Posture, 12, 87–93.
Adsuar, J.C., Olivares, P.R., Parraca, J.A. & Gusi, N. (2011). Test-retest reliability of
isometric and isokinetic knee extension and flexion in patients with fibromyalgia:
evaluation of the smallest real difference. Archives of Physical Medicine and
Rehabilitation, 92(10), 1646-1651.
Agrawal, V., Gailey, R., O'Toole, C., Gaunaurd, I. & Finnieston, A. (2013a). Influence
of gait training and prosthetic foot category on external work symmetry during
unilateral transtibial amputee gait. Prosthetic Orthotic International, 37, 396 –403.
Agrawal, V. (2013b). Outcome Measures: Avenues for Optimizing Prosthetic
Performance. Retrieved May 9, 2015, from http://www.oandp.com/articles/2013-
10_02.asp
Agrawal, V., Gailey, R. S., Gaunaurd, I. A., O'Toole, C., Finnieston, A. & Tolchin, R.
(2014). Comparison of four different categories of prosthetic feet during ramp
ambulation in unilateral transtibial amputees. Prosthetic Orthotic International. Epub
ahead of print.
Akarsu, S., Tekin, L., Safaz, I., Goktepe, A. S. & Yazicioglu, K. (2013). Quality of life
and functionality after lower limb amputations: comparison between uni- vs. bilateral
amputee patients. Prosthetic Orthotic International, 37(1), 9-13.
Aleccia, J. (2010). Limb loss a grim, growing global crisis. Retrieved from
http://haitiamputees.msnbc.msn.com/_news/2010/03/19/4040341-limb-loss-a-grim-
growing-global-crisis
Ali, S., Abu Osman, N.A., Naqshbandi, M.M., Eshraghi, A., Kamyab, M., &
Gholizadeh, H. (2012). Qualitative study of prosthetic suspension systems on transtibial
amputees' satisfaction and perceived problems with their prosthetic devices. Archives of
Physical Medicine & Rehabilitation, 93(11), 1919-1923.
Allum, J.H.J., Bloem, B.R., Carpenter, M.G., Hulliger, M. & Hadders-Algra, M. (1998).
Proprioceptive control of posture: a review of new concepts. Gait & Posture, 8, 214–
242.
American Orthotic and Prosthetic Association (2010). AOPA Prosthetic Foot Project
Report. Retrieved August 20, 2014, from http://www.aopanet.org/prosthetic_foot_
project.pdf
Aoyama, H., Goto, M., Naruo, A., Hamada, K., Kikuchi, N., Kojima, Y., Takada, Y. &
Takenaka, Y. (2006). The difference between center of mass and center of pressure: A
review of human postural control. Aino Journal, 5, 25–31.

239
Arifin, N., Abu Osman, N.A., Wan Abas, W.A.B. (2014a). Intrarater test-retest
reliability of static and dynamic stability indexes measurement using the Biodex®
balance system during unilateral stance. Journal of Applied Biomechanics, 30, 300-304.
Arifin N, Abu Osman NA, Ali S, Gholizadeh H, Wan Abas WAB. (2014b). Postural
Stability Characteristics of Transtibial Amputees Wearing Different Prosthetic Foot
Types When Standing on Various Support Surfaces. Scientific World Journal, 1-6.
Arifin N, Abu Osman NA, Ali S, Gholizadeh H, Wan Abas WAB. (2014c). The effects
of prosthetic foot type and visual alteration on postural steadiness in below-knee
amputees. Biomedical Engineering OnLine, 13, 1-10.
Arnold, B., & Schmitz, K. (1998). Examination of balance measures produced by the
Biodex Stability System. Journal of Athlete Trainings, 33(4), 323-327.
Aruin, A.S., Nicholas, J.J., Latash, M.L. (1997). Anticipatory postural adjustments
during standing in below-the-knee amputees. Clinical Biomechanics, 12, 52-59.
Atkinson, G. & Nevill, A.M. (1998). Statistical methods for assessing measurement
error (reliability) in variables relevant to sports medicine. Sports Medicine, 26(4), 217–
238.
Aydog, E., Bal, A., Aydog, S.T., & Cakci, A. (2006). Evaluation of dynamic postural
balance using Biodex Stabilty System in rheumatoid arthritis patients. Clinical
Rheumatology, 25(4), 462–467.
Balasubramaniam, R. & Wing, A.M. (2002). The dynamics of standing balance.
TRENDS in Cognitive Sciences, 6(12), 531-536.
Baldwin, S.L.V., Thomas, W. & Ploutz-snyder, L.L. (2004). Reliability of dynamic
bilateral postural stability on the Biodex stability system in older adults. Medicine &
Science in Sports & Exercise, 36, S30.
Barnett, C.T., Vanicek, N. & Polma, R.C.J. (2012). Postural responses during
volitional and perturbed dynamic balance tasks in new lower limb amputees: A
longitudinal study. Gait & Posture, 37(3), 319-325.
Beil, T.L., Street, G.M. & Covey, S.J. (2002). Interface pressures during ambulation
using suction and vacuum-assisted prosthetic sockets. Journal of Rehabilitation
Research and Development, 39, 693–700.
Berg, K., Wood-Dauphinee, S., & Williams, J. I. (1995). The Balance Scale: reliability
assessment with elderly residents and patients with an acute stroke. Scandinavian
Journal of Rehabilitation Medicine, 27(1), 27-36.
Berge, J.S., Czerniecki, J.M., & Klute, G.K. (2005). Efficacy of shock-absorbing versus
rigid pylons for impact reduction in transtibial amputees based on laboratory, field, and
outcome metrics. Journal of Rehabilitation Research and Development, 42(6), 795.

240
Berke, G.M. (2007). Transtibial Prostheses. In M. M. Lusardi & C. C. Nielsen (Eds.),
Orthotics and prosthetics in rehabilitation (2nd ed.). St. Louis, Missouri: Saunders
Elsevier.
Biodex Medical Systems, Patient Data Collection Software Utility V2.X FN: 14-146
4/14, New York: Biodex® Medical System, Inc, 2014.
Biodex® Medical System, Inc. Balance System SD operation/service manual #950-300
(FN:09-074 2/09), New York: Biodex® Medical System, Inc.; 2004.
Black, F.O. (2001).What can posturography tell us about vestibular function? Annals of
the New York Academy of Sciences, 942, 446-464.
Blackburn, J.T., Prentice, W.E., Guskiewicz, K.M. & Busby, M.A. (2000). Balance and
joint stability: the relative contributions of proprioception and muscular strength.
Journal of Sport Rehabilitation, 9(4), 315-328.
Blumentritt, S., Schmalz, T., Jarasch, R. & Schneider, M. (1999). Effects of sagittal
plane prosthetic alignment on standing trans-tibial amputee knee loads. Prosthetics and
Orthotics International. 23, 231-238.
Bolger, D., Ting, L.H. & Sawers, A. (2014). Individuals with transtibial limb loss use
interlimb force asymmetries to maintain multi-directional reactive balance control.
Clinical Biomechanics, 29, 1039–1047.
Borg, F.G. & Laxaback, G. (2010). Entropy of balance - some recent results. Journal of
Neuroengineering Rehabilitation, 38, 1-11.
Bowker, J. H. & Pritham, C.H. (2004). The history of amputation surgery and
prosthetics. In In D. G. Smith, J. W. Michael & J. H. Bowker (Eds.), Atlas of
amputation and limb deficiency: Surgical, prosthetic and rehabilitation principles (3rd
ed.). Rosemont, IL: American Academy of Orthopaedic Surgeons.
Brandt, T., Krafczyk, S., & Malsbenden, I. (1981). Postural imbalance with head
extension: improvement by training as a model for ataxia therapy. Annals New York
Academy of Science, 374, 636–649.
Brenton-Rule, A., Mattock, J., Carroll, M., Dalbeth, N., Bassett, S., Menz HB & Rome
K. (2012). Reliability of the TekScan MatScan® system for the measurement of
postural stability in older people with rheumatoid arthritis. Journal of Foot and Ankle
Research, 5, 21.
Buckley, J.G., O’Driscoll, D. & Bennett, S.J. (2002). Postural sway and active balance
performance in highly active lower-limb amputees. American Journal of Physical
Medicine and Rehabilitation, 81(1), 13–20.
Burke, M.J., Roman, V. & Wright, V. (1978). Bone and joint changes in lower limb
amputees. Annals of the Rheumatic Diseases, 37, 252-254.
241
Bussmann, H.B.J, Reuvekamp, P.J, Veltink, P. H, Martens, W.L.J., & Stam, H.J.
(1998). Validity and reliability of measurements obtained with an “Activity Monitor” in
people with and without a transtibial amputation. Physical Therapy, 78(9), 989-998.
Cachupe, W.J., Shifflett, B., Kahanov, L. & Wughalter, E.H. (2001). Reliability of
Biodex Balance System Measures. Measurement in Physical Education and Exercise
Science, 5(2), 97-108.
Carpenter, M., Hunter, C., & Rheaume, D. (2008). Testing and Analysis of Low Cost
Prosthetic Feet (Bachelor Thesis). Retrieved July 13, 2013, from https://
www.wpi.edu/Pubs/E-project/Available/E-project-042408141117/unrestricted/Testing_
and_Analysis_of_Low _ Cost_Prosthetic_ Feet. pdf
Condie, E., Scott, H. and Treweek, S. (2006). Lower Limb Prosthetic Outcome
Measures: A Review of the Literature 1995 to 2005. Journal of Prosthetics and
Orthotics, 18(1S), 13-45.
Carroll, K. & Binder, K. (2006). Transtibial prosthetic design. In K. Carroll & J. E.
Edelstein (Eds.), Prosthetics and patient management: a comprehensive clinical
approach. Thorofare, NJ: Slack Inc.
Cavenett, S., Aung, E., White, S., & Streak, J. (2012). The effectiveness of total surface
bearing compared to specific surface bearing prosthetic socket design on health
outcomes of adults with a trans-tibial amputation: A systematic review. JBI Library of
Systematic Reviews, 10, S26 - S38.
Cheak-Zamora, N. C., Wyrwich, K. W., & McBride, T. D. (2009). Reliability and
validity of the SF-12v2 in the medical expenditure panel survey. Quality of Life
Research, 18(6), 727-735.
Clark, L.A. & Zernicke, R.F. (1981). Balance in lower limb child amputees. Prosthetics
Orthotics International, 5, 11-18.
Cohen, J.W. (1998). Statistical power analysis for the behavioral sciences. New Jersey,
Lawrence Erlbaum Associates.
Coleman, K.L., Boone, D.A., Smith, D.G. & Czerniecki, J.M. (2001). Effect of trans-
tibial prosthesis pylon flexibility on ground reaction forces during gait. Prosthetics and
Orthotics International, 25(3), 195–201.
Cortes, A., Viosca, E., Hoyos, J. V., Prat, J. & Sanchez-Lacuesta, J. (1997).
Optimisation of the prescription for trans-tibial (TT) amputees. Prosthetics and
Orthotics International, 21(3), 168-174.
Curtze, C., Hof, A.L., Postema, K. & Otten, B. (2012). The relative contributions of
the prosthetic and sound limb to balance control in unilateral transtibial
amputees. Gait & Posture, 36(2), 276–281.
Daniel, L. (2013). Calculating and reporting effect sizes to facilitate cumulative science:
a practical primer for t-tests and ANOVAs. Frontiers in Psychology, 4, 1-12.
242
Deathe, Barry, Miller, William C. & Speechley, Mark. (2002). The status of outcome
measurement in amputee rehabilitation in Canada. Archives of Physical Medicine and
Rehabilitation, 83(7), 912-918.
Desai, A., Goodman, V., Kapadia, N., Shay, B.L. & Szturm, T. (2010). Relationship
between dynamic balance measures and functional performance in community-dwelling
elderly people. Physical Therapy, 90( 5), 748 –760.
Devlin, M., Pauley, T., Head, K. & Garfinkel, S. (2004). Houghton Scale of prosthetic
use in people with lower-extremity amputations: reliability, validity, and responsiveness
to change. Archive of Physical Medicine and Rehabilitation, 85(5), 1339–1344.
Dillingham, T.R., Pezzin, L.E. & Shore, A.D. (2005). Reamputation, mortality, and
health care costs among persons with dysvascular lower-limb amputations. Archives of
Physical Medicine and Rehabilitation, 86, 480–486.
Dillingham, T.R., Pezzin, L.E. & MacKenzie, E.J. (2002). Limb amputation and limb
deficiency: epidemiology and recent trends in the United States. Southern Medicine
Journal, 95(8), 875-883.
DMERC Medicare Advisory. (1994). Retrieved from: http://cgsmedicare.com/jc/pubs/
adv/pdf/1994/december_1994.pdf
Dornan, J., Fernie, G.R. & Holliday, P.J. (1978). Visual input: its importance in the
control of postural sway. Archived of Physical Medicine and Rehabilitation, 59, 586-
591.
Downs, S.H. & Black, N. (1998). The feasibility of creating a checklist for the
assessment of the methodological quality both of randomized and non-randomized
studies of health care interventions. Journal of Epidemiology and Community
Health, 52, 377–384.
Duclos, C., Roll, R., Kavounoudias, A., Roll, J.P. & Forget, R. (2009). Vibration-
induced post-effects: a means to improve postural asymmetry in lower leg amputees?
Gait & Posture, 26: 595–602.
English, R.D., Hubbard, W.A. & McElroy, G.K. (1995). Establishment of consistent
gait after fitting of new components. Journal of Rehabilitation and Research
Development; 32(1), 32-35.
Eshraghi, A., Abu Osman, N.A., Gholizadeh, H., Ali, S. & Shadgan, B. (2013). 100 top-
cited scientific papers in limb prosthetics. Biomedical Engineering Online, 12(1), 1–12.
Fergason, J. (2007). Prosthetic feet. In M. M. Lusardi & C. C. Nielsen (Eds.), Orthotics
and prosthetics in rehabilitation (2nd ed.). St. Louis, Missouri: Saunders Elsevier.
Fergason, J., & Smith, D.G. (1999). Socket considerations for the patient with a
transtibial amputation. Clinical Orthopedics and Related Research, 361, 76-84.
Fernie, G.R. & Holliday, P.J. (1978). Postural sway in amputees and normal subjects.
Journal of Bone & Joint Surgery, 60, 895-898.

243
Ferraro, C. (2011). Outcome study of transtibial amputees using elevated vacuum
suspension in comparison with pin suspension. Journal of Prosthetics and Orthotics,
23(2), 78-81.
Finch, J.L., Heath, G.H., David, A.R. & Kulkarni, J. (2012). Biomechanical assessment
of two artificial big toe restorations from ancient Egypt and their significance to the
history of prosthetics. Journal of Prosthetics and Orthotics, 24(4), 181-191.
Fitzpatrick, R.C., Taylor, J.L. & McCloskey, D.I. (1992). Ankle stiffness of standing
humans in response to imperceptible perturbation: reflex and task-dependent
components. Journal of Physiology, 454, 533–547.
Fleiss, J.L. (1986). The design and analysis of clinical experiments. New York, NY:
John Wiley & Sons.
Franchignoni, F., Giordano, A., Ferriero, G., Munoz, S., Orlandini, D. & Amoresano A.
(2007). Rasch analysis of the locomotor capabilities index-5 in people with lower limb
amputation. Prosthetics and Orthotics International, 3, 394–404.
Gailey, R.S. & Clark, C.R. (2007). Physical Therapy. In M. M. Lusardi & C. C.
Nielsen (Eds.), Orthotics and prosthetics in rehabilitation (2nd ed.). St. Louis,
Missouri: Saunders Elsevier.
Gailey, R. S., Gaunaurd, I., Agrawal, V., Finnieston, A., O'Toole, C. & Tolchin, R.
(2012). Application of self-report and performance-based outcome measures to
determine functional differences between four categories of prosthetic feet. Journal of
Rehabilitation Research and Development, 49(4), 597-612.
Gailey, R.S., Roach, K.E., Applegate, E.B., Cho, B., Cunniffe, B., Licht, S., …. Nash,
M.S. (2002). The Amputee Mobility Predictor: an instrument to assess determinants of
the lower-limb amputee ability to ambulate. Archived of Physical Medicine and
Rehabilitation, 83, 613-627.
Gear, W., Bookhout, J. & Solyntjes, A. (2011). Effect of ankle taping and bracing on
dynamic balance and perception of stability. International Journal of Exercise Science,
5, S13–S14.
Gatev, P., Thomas, S., Kepple, T. & Hallett, M. (1999).Feedforward ankle strategy of
balance during quiet stance in adults. Journal of Physiology, 514.3, 915—928.
Gaw, S. (2008). Stiffness properties of multi-axis prosthetic feet in the frontal plane and
the influence of shoes. Retrieved from http://smartech.gatech.edu/handle/1853/22062.
Geil, M. D. (2001). Energy loss and stiffness properties of dynamic elastic response
prosthetic feet. Prosthetic and Orthotic Science, 13 (3), 70-73
Geil, M. D. (2002). An iterative method for viscoelastic modeling of prosthetic feet.
Journal of Biomechanics, 35, 1405-1410.

244
Geil, M.D. (2009). Assessing the state of clinically applicable research for evidence-
based practice in prosthetics and orthotics. Journal of Rehabilitation Research and
Development, 46(3), 305-314.
Geurts, A.C.H. & Mulder, T.W. (1992). Reorganisation of postural control following
lower limb amputation: theoretical considerations and implications for rehabilitation.
Physiotherapy Theory and Practice, 8, 145-157.
Geurts, A.C.H., Mulder, T.W., Nienhuis, B. & Rijken, R.A.J. (1991). Dual-task
assessment of reorganization of postural control in persons with lower-limb amputation.
Archive of Physical Medicine and Rehabilitation, 72, 1059-1064.
Geurts, A.C.H. & Mulder, T.W. (1994). Attention demands in balance recovery
following lower-limb amputation. Journal of Motor Behaviour, 26(2), 162-170.
Gitter, A., & Bosker, G. (2005). Upper and Lower Extremity Prosthetics. (4th ed.).
Philadelphia: Lippincott-Raven.
Gholizadeh, H., Abu Osman, N.A., Eshraghi, A., Ali, S., & Razak, N. A. (2014).
Transtibial prosthesis suspension systems: systematic review of literature. Clinical
Biomechanics, 29(1), 87-97.
Goh, J.C.H., Solomonidis, S.E., Spence, W.D., & Paul, J.P. (1984). Biomechanical
evaluation of SACH and uniaxial feet. Prosthetics and Orthotics International, 8, 147-
154.
Goh, J.C.H., Lee, P.V.S. & Chong, S.Y. (2004). Comparative study between patellar-
tendon-bearing and pressure cast prosthetic sockets. Journal of Rehabilitation Research
and Development, 41, 491–502.
Guskiewicz, K.M. & Perrin, D.H. (1996). Research and clinical applications of
assessing balance. Journal of Sport Rehabilitation, 5, 45-63.
Gutierrez, E.M., Helber, M.D., Dealva, D., Ashton-Miller, J.A. & Richardson, J. K.
(2001). Mild diabetic neuropathy affects ankle motor function. Clinical
Biomechanics, 16(6), 522-528.
Haberman, A. (2008). Mechanical properties of dynamic energy return prosthetic feet.
(MSc. Thesis). Queen’s University Ontario, Canada. Retrieved from
https://qspace.library.queensu.ca/bitstream/1974/1102/1/Haberman_Andrea_L_2008_04
_MSc.pdf
Hafner, B.J., Sanders, J.E., Czerniecki, J. & Fergason, J. (2002). Energy storage and
return prostheses: does patient perception correlate with biomechanical
analysis? Clinical Biomechanics, 17, 325–344.
Hafner, B.J. (2006). Overview of outcome measures for the assessment of prosthetic
foot and ankle components. Journal of Prosthetic and Orthotic, 18(1S), 105-112.

245
Hafner, B.J. (2005). Clinical Prescription and Use of Prosthetic Foot and Ankle
Mechanisms: A Review of the Literature. Journal of Prosthetics and Orthotics, 17(5),
5-11.
Hansen, A.H. (2005). Scientific Methods to Determine Functional Performance of
Prosthetic Ankle-Foot Systems. Journal of Prosthetics and Orthotics, 17(4), S23-29.
Hebert, J.R., Corboy, J.R., Manago, M.M., Schenkman, M. (2011). Effects of vestibular
rehabilitation on multiple sclerosis–related fatigue and upright postural control: a
randomized controlled trial. Physical Therapy, 91, 1166–1183.
Hendrickson, J, Patterson, K.K., Inness, E.L., McIlroy, W.E. & Mansfield, A. (2014).
Relationship between asymmetry of quiet standing balance control and walking post-
stroke. Gait & Posture, 39, 177–181.
Hermodsson, Y., Ekdahl, C., Persson, B.M. & Roxendal, G. (1994). Standing balance in
trans-tibial amputees following vascular disease or trauma: a comparative study with
healthy subjects. Prosthetic Orthotic International, 18, 150-158.
Hinman, M. (2000). Factors affecting reliability of the Biodex balance system: A
summary of four studies. Journal of Sport Rehabilitation, 9(3), 240-252.
Hlavackova, P., Franco, C., Diot, B. & Vuillerme, N. (2011). Contribution of each leg
to the control of unperturbed bipedal stance in lower limb amputees: new insights using
entropy. PLoS One, 6(5), 1-4.
Hlavackova, P., Fristios, J., Cuisinier, R., Pinsault, N., Janura, M. & Vuillerme, N.
(2009). Effects of mirror feedback on upright stance control in elderly transfemoral
amputees. Archives of Physical Medicine and Rehabilitation, 90, 1960-1963.
Hofstad, C.J., van der Linde, H., van Limbeek, J. & Postema, K. (2009). Prescription of
prosthetic ankle‐foot mechanisms after lower limb amputation. Cochrane Database
Systematic Review, 1, CD003978.
Holman, N. Young, R.J. & Jeffcoate, W.J. (2012). Variation in the recorded incidence
of amputation of the lower limb in England. Diabetologia, 55(7), 1919-1925.
Horak, F.B. & Nashner, L.M. (1986). Central programming of postural movements:
adaptation to altered support-surface configurations. Journal of Neurophysiology, 55,
1369–1381.
Horak, F.B. (1997). Clinical assessment of balance disorders. Gait & Posture, 6, 76–84.
Horak, F.B. (2006). Postural orientation and equilibrium: what do we need to know
about neural control of balance to prevent falls? Age & Ageing, 35, ii7-11.
Horak, F. B., Shupert, C. L. & Mirka, A. (1989). Components of postural dyscontrol in
the elderly: a review. Neurobiology of Aging, 10(6), 727-738.
Horak, F.B., Nasher, L.M. & Diener, H.C. (1990). Postural strategies associated with
somatosensory and vestibular loss. Experimental Brain Research, 82(1), 167-177.

246
Houghton, A. D., Taylor, P. R., Thurlow, S., Rootes, E. & McColl, I. (1992). Success
rates for rehabilitation of vascular amputees: Implications for preoperative assessment
and amputation level. British Journal of Surgery, 79(8), 753-755.
Hu, M.H. & Woollacott, M.H. (1994). Multisensory training of standing balance in
older aduls: I. Postural stability and one-leg stance balance. Journal of Gerontology,
49(2), M52-M61.
Hue, O., Simoneau, M., Marcotte, J., Berrigan, F., Dore, J., Marceau, P., ..... Teasdale,
N. (2007). Body weight is a strong predictor of postural stability. Gait & Posture, 26,
32-38.
Huxham, F.E., Goldie, P.A. & Patla, A.E. (2001). Theoretical considerations in balance
assessment. Australian Journal of Physiotherapy, 47, 89-100.
Instron Corporation (1996). Instron Series 4460 Table Top Load Frames Operator’s
Guide: Issue C. Instron Corporation, Massachusetts: Instron Corporation.
International Diabetes Federation and International Working Group of the Diabetic
Foot. (2005). Time to act. Netherlands: Karel, B, Ali, F., William, V.H. & Riley, P.
International Diabetes Federation. (2003). Diabetes Atlas Executive Summary (2nd ed.).
Brussels: International Diabetes Federation.
International Organization for Standardization. (2006). ISO 10328: Prosthetics:
Structural testing of lower-limb prostheses: requirements and test methods. Geneva,
Switzerland.
International Organization for Standardization. (1989a). ISO 8549-2: Prosthetics and
orthotics-Vocabulary, Part 2: Terms relating to external limb prostheses and wearers of
these prostheses. Geneva Switzerland.
International Organization for Standardization. (1989b). ISO 8549-1: Prosthetics and
orthotics-vocabulary, Part 1: General terms for external limb prostheses and external
orthoses. Geneva, Switzerland.
Isakov, E., Mizrahi, J., Ring, H., Susak, Z. & Hakim, N. (1992). Standing sway and
weight-bearing distribution in people with below-knee amputations. Archives of
Physical Medicine and Rehabilitation, 73, 174–178.
Jackson, R.T. & Epstein, C.M. (1991). Effect of head extension on equilibrium in
normal subjects. Annals of Otology, Rhinology and Laryngology, 100, 63-67.
Jackson, R.T., Epstein, C.M. & De I’Aune, W.R. (1995). Abnormalities in
posturography and estimations of visual vertical and horizontal in multiple sclerosis.
American Journal of Otology, 16(1), 88-93.
Jackson, R.T. & De l'Aune, W.R. (1996). Head extension and age-dependent
posturographic instability in normal subjects. Journal of Rehabilitation Research and
Development, 33(1), 1-5.
247
Jayakaran, P., Johnson, G.M. & Sullivan, S.J. (2015). Postural control in response to
altered sensory conditions in persons with dysvascular and traumatic transtibial
amputation. Archives of Physical Medicine and Rehabilitation, 96, 331-339.
Jensen, J.S. & Sexton, S. (2010). ISPO Appropriate Prosthetic and Orthotic
Technologies in Low Income Countries. Retrieved from
http://pdf.usaid.gov/pdf_docs/PNADY352.pdf.
Johannesson, A., Larsson, G.U., Ramstrand, N., Lauge-Pedersen, H., Wagner, P. &
Atroshi, I. (2010). Outcomes of a standardized surgical and rehabilitation program in
transtibial amputation for peripheral vascular disease: a prospective cohort study.
American Journal of Physical Medicine and Rehabilitation, 89(4), 293-303.
Kamali, M., Karimi, M.T., Eshraghi, A. & Omar, H. (2013). Influential factors in
stability of lower-limb amputees. American Journal of Physical Medicine and
Rehabilitation, 92, 1-9.
Kanade, R.V., Van Deursen, R.W.M., Harding, K.G. & Price, P.E. (2008). Investigation
of standing balance in patients with diabetic neuropathy at different stages of foot
complications. Clinical Biomechanics, 23, 1183-1191.
Kapp, S. & Cummings, D. (1992). Transtibial amputation: prosthetic management. In J.
H. Bowker & J.W. Michael (Eds.), Atlas of Limb Prosthetics: Surgical, Prosthetic, and
Rehabilitation Principles. (2nd ed.). Rosemont, IL, American Academy of Orthopedic
Surgeons.
Kapp, S.L. & Fergason, J.R. (2007). Transtibial amputation: prosthetic management. In
M. M. Lusardi & C. C. Nielsen (Eds.), Orthotics and prosthetics in rehabilitation (2nd
ed.). St. Louis, Missouri: Saunders Elsevier.
Kavounoudias, A., Roll, R. & Roll, J.P. (2001). Foot sole and ankle muscle inputs
contribute jointly to human erect posture regulation, Journal of Physiology, 532.3, 869–
878.
Kaufman, K.R., Levine, J.A., Brey, R.H., Iverson, B.K., McCrady, S.K., Padgett, D.J. &
Joyner, M.J. (2007). Gait and balance of transfemoral amputees using passive
mechanical and microprocessor-controlled prosthetic knees. Gait & Posture, 26, 489-
493.
Kaufman, K.R. (2004). Objective assessment of posture and gait. In: A.M. Bronstein, T.
Brandt, M.H. Woollacott, J.G. Nutt, (Eds.), Clinical disorders of balance posture and
gait. London: Arnold.
Kejonen, P. & Kauranen, K. (2002). Reliability and validity of standing balance
measurements with a motion analysis system. Physiotherapy, 88, 25-32.
Knoop, J., Steultjens, M.P.M., Van der Leeden, M., Van der Esch, M., Thorstensson,
C.A., Roorda, L.D.,.... Dekker, J. (2011). Proprioception in knee osteoarthritis: a
narrative review. Osteoarthritis and Cartilage, 19, 381–388.

248
Kolarova, B., Janura, M., Svoboda, Z. and Elfmark, M. (2013). Limits of stability in
persons with transtibial amputation with respect to prosthetic alignment alterations.
Archives of Physical Medicine and Rehabilitation, 94, 2234–2240.
Kozakova, D., Svoboda, Z., Janura, M., Elfmark, M. & Nedvědová, I. (2009).
Assessment of postural stability in patients with a transtibial amputation with various
times of prosthesis use. Acta Universitatis Palackianae Olomucensis Gymnica, 39(3),
51-59.
Lakens, D. (2013). Calculating and reporting effect sizes to facilitate cumulative
science: a practical primer for t-tests and ANOVAs. Frontier Psychology, 26, 863-900.
Lazar, M. A. (2005). How obesity causes diabetes: not a tall tale. Science, 307(5708),
373-375.
Laing, S., Lee, P. V. & Goh, J. C. (2011). Engineering a trans-tibial prosthetic socket
for the lower limb amputee. Annals of the Academy of Medicine-Singapore, 40(5), 252.
LeClair, K. & Riach, C. (1996). Postural stability measures: what to measure and for
how long. Clinical Biomechanics, 11, 176-177.
Lee, M.Y., Lin, C.F. & Soon, K.S. (2007). Balance control enhancement using sub-
sensory stimulation and visual-auditory biofeedback strategies for amputee subjects.
Prosthetics and Orthotics International, 31, 342-352.
Legro, M.W., Reiber, G., del Aguila, M., Ajax, M.J., Boone, D.A., Larsen, J.A.……
Sangeorzan. B. (1999). Issues of importance reported by persons with lower limb
amputations and prostheses. Journal of Rehabilitation Research and Development,.
36(3), 155-163.
Lehmann, J.F., Price, R., Boswell-Bessette, S., Dralle, A., Questad, K. & deLateur, B.J.
(1993). Comprehensive analysis of energy storing prosthetic feet: Flex-Foot and Seattle
Foot versus standard SACH Foot. Archives of Physical Medicine and Rehabilitation,
74, 1225-1231.
Lenka, P.K., & Tiberwala, D.N. ( 2007). Effect of stump length on postural steadiness
during quiet stance in unilateral trans-tibial amputee. Al Ameen Journal of Medical
Sciences, 3, 50–57.
Lephart, S.M., Kocher, M.S., Fu, F.H., Borsa, P.A. & Harner, C.D. (1992).
Proprioception following anterior cruciate ligament reconstruction. Journal of Sport
Rehabilitation, 1(3), 188–196.
Letchuman, G. R., Wan Nazaimoon, W. M., Wan Mohamad, W. B., Chandran, L. R.,
Tee, G. H., Jamaiyah, H., . . . Ahmad Faudzi, Y. (2010). Prevalence of diabetes in the
Malaysian National Health Morbidity Survey III 2006. Medical Journal of Malaysia,
65(3), 180-186.
Leung, E. C., Rush, P. J. & Devlin, M. (1996). Predicting prosthetic rehabilitation
outcome in lower limb amputee patients with the functional independence measure.
Archives of Physical Medicine and Rehabilitation, 77(6), 605-608.

249
Loro, A. & Franceschi, F. (1999). Prevalence and causal conditions for amputation
surgery in the third world: ten years experience at Dodoma Regional Hospital Tanzania.
Prosthetics and Orthotics International, 23, 217-224.
Loram, I.D., Maganaris, C.N. & Lakie, M. (2005). Human postural sway results from
frequent, ballistic bias impulses by soleus and gastrocnemius. Journal of Physiology,
564, 295–311.
Lung, M., Pauley, T., Campbell, J. & Devlin, M. (2006). Suitability of the Berg Balance
Scale for assessment of patients with unilateral transtibial amputation. Ontario
Association for Amputee Care (OAAC) 28th Annual Conference: Putting you best foot
forward. Ontario, Canada. Retrieved March 7, 2015, from http://www.
oaac.ca/2006present/Berg.pdf
MacFarlane, P.A., Nielsen, D.H., Shurr, D.G. & Meier, K. (1991). Perception of
walking difficulty by below-knee amputees using a conventional foot versus the Flex-
Foot. Journal of Prosthetic and Orthotic, 3(31), 114–119.
Mackenzie, E.J., Bosse, M.J., Casttillo, R.C., Smith, D.G., Webb, L.X. Kellam, J.F.,
...... & McCarthy, M.L. (2004). Functional outcomes following trauma-related lower-
extremity amputation. Journal of Bone & Joint Surgery, 86(8), 1636-1645.
Mackey, D.C. & Robinovitch, S.N. (2005). Steadiness during quiet stance does not
associate with ability to recover balance in older women. Clinical Biomechanics, 20(8),
776-783.
Maclellan, M.J. & Patla, A.E. (2006). Adaptations of walking pattern on a compliant
surface to regulate dynamic stability. Experimental Brain Research, 173, 521–530.
Mafauzy, M. (2006). Diabetes mellitus in Malaysia. Medical Journal of Malaysia,
61(4), 397-398.
Maki, B.E., Edmondstone, M.A. & McIlroy, W.E. (2000). Age-related differences in
laterally directed compensatory stepping behaviour. Journal of Gerontology, 55A,
M270–77.
Malaysia Statistics Department. (2015). Population Clock. Retrieved September 9,
2015, from https://www.statistics.gov.my
Mancini, M. & Horak, F. B. (2010). The relevance of clinical balance assessment tools
to differentiate balance deficits. European Journal of Physical and Rehabilitation
Medicine, 46(2), 239–248.
Mason, Z.D., Pearlman, J., Cooper, R.A. & Laferrier, J.Z. (2011). Comparison of
prosthetic feet prescribed to active individuals using ISO standards. Prosthetics and
Orthotics International, 35(4), 418–424.
Massion, J., Alexandrov, A., & Frolov, A. (2004a). Why and how are posture and
movement coordinated? Progress in Brain Research, 143, 13-27.

250
Massion, J. & Woollacott, M. H. (2004b). Posture and equilibrium. In: A.M. Bronstein,
T. Brandt, M.H. Woollacott, J.G. Nutt, (Eds.), Clinical disorders of balance posture and
gait. London: Arnold.
Matjacic, Z. & Burger, H. (2003). Dynamic balance training during standing in people
with trans-tibial amputation: a pilot study. Prosthetic and Orthotic International, 27,
214-220.
Mattiello, D. & Wollacott, M. (1997). Posture control in children: development in
typical populations and in children with cerebral palsy and down syndrome. In K. J.
Connolly & Forssberg, H. (Eds.) Neurophysiology and neuropsychology of motor
development. London, UK: Mac Keith Press.
Mayer, A., Tihanyi, J., Bretz, K., Csende, Z., Bretz, E. & Horvat, M. (2011). Adaptation
to altered balance conditions in unilateral amputees due to atherosclerosis: a randomized
controlled study. BMC Musculoskeletal Disease, 12, 118-124.
Mazaheri, M., Coenen, P., Parnianpour, M., Kiers, H. & van Dieën, J.H. (2013). Low
back pain and postural sway during quiet standing with and without
sensory manipulation: A systematic review. Gait & Posture, 37(1), 12-22.
McCollum, G. & Leen, T.K. (1989). Form and exploration of mechanical stability limits
in erect stance. Journal of Motor Behaviour; 21, 225-244.
McGauran, N., Wieseler, B., Kreis, J., Schuler, Y.B., Kolsch, H. & Kaiser, T. (2010).
Reporting bias in medical research - a narrative review. Trials, 11(37), 1-15.
McLlroy, W.E. & Maki, B.E. (1995). Preferred placement of the feet during quiet
stance: development of a standardized foot placement for balance testing. Clinical
Biomechanics, 12, 66-70.
Melzer, I., Benjuya, N. & Kaplanski, K. (2004). Postural stability in the elderly: a
comparison between fallers and non-fallers. Age and Ageing, 33, 602-607.
Michael, J.W. (2004). Prosthetic suspensions and components. In D. G. Smith, J. W.
Michael & J. H. Bowker (Eds.), Atlas of amputation and limb deficiency: Surgical,
prosthetic and rehabilitation principles (3rd ed.). Rosemont, IL: American Academy of
Orthopaedic Surgeons.
Mientjes, M.I.V. & Frank, J.S. (1999). Balance in chronic low back pain patients
compared to healthy people under various conditions in upright standing. Clinical
Biomechanics, 14(10), 710-716.
Miller, L.A. & McCay, J.A. (2006). Summary and conclusions from the academy’s
sixth state-of-the-science conference on lower limb prosthetic outcome measures.
Journal of Prosthetic and Orthotic, 18, 2–7.
Miller, W.C., Deathe, A.B., Speechley, M. & Koval, J. (2001a). The influence of
falling, fear of falling, and balance confidence on prosthetic mobility and social activity
among individuals with a lower extremity amputation. Archives of Physical Medicine
and Rehabilitation, 82, 1238-1244.
251
Miller, W.C., Speechley, M. & Deathe, A.B. (2001b). The prevalence of risk factors of
falling and fear of falling among lower extremity amputees. Archives of Physical
Medicine and Rehabilitation, 82, 1031-1037.
Miller, W.C., Deathe, A.B. & Speechley, M. (2003). Psychometric properties of the
Activities Specific Balance Confidence Scale among individuals with a lower-limb
amputation. Archives of Physical Medicine and Rehabilitation, 84, 656-661.
Miller, W.C., Speechley, M. & Deathe, A.B. (2002). Balance confidence among people
with lower-limb amputations, Physical Therapy, 82, 856-865.
Moher, D., Liberati, A., Tetzlaff, J. & Altman, D.G. (2009). Preferred reporting items
for systematic reviews and meta-analyses: the PRISMA statement. Annals of Internal
Medicine, 151, 264-269.
Mohieldin, A.H.A., Chidambaram, A., Sabapathivinayagam, R. & Al Busairi, W.
(2010). Quantitative assessment of postural stability and balance between persons with
lower limb amputation and normal subjects by using dynamic posturography.
Macedonian Journal of Medicine Science, 3, 138-143.
Mokdad, A.H., Ford, E.S., Bowman, B.A., Dietz, W.H., Vinicor, F., Bales, V.S. &
Marks, J. S. (2003). Prevalence of obesity, diabetes, and obesity-related health risk
factors, 2001. The Journal of American Medical Association, 289(1), 76-79.
Molina-Rueda, F., Molero-Sa´nchez, A., Alguacil-Diego, I., M., Carratala-Tejada, M.,
Cuesta-Gomez, A. and Miangolarra-Page, J., C. (in press). Weight symmetry and
latency scores for unexpected surface perturbations in subjects with traumatic and
vascular unilateral transtibial amputation. Physical Medicine and Rehabilitation.
Mouchnino, L., Mille, M.L., Cincera, M., Bardot, A., Delarque A, Pedotti A & Massion
J. (1998). Postural reorganization of weight-shifting in below-knee amputees during leg
raising. Experimental Brain and Research, 121, 205-214.
Mouchnino, L., Mille, M.L., Martin, N., Baroni, G., Cincera, M., Bardot, A., … Pedotti,
A. (2006). Behavioral outcomes following below-knee amputation in the coordination
between balance and leg movement. Gait & Posture, 24, 4-13.
Moxey, P.W., Gogalniceanu, P., Hinchliffe, R.J., Loftus, I.M., Jones, K.J., Thompson,
M.M. & Holt, P.J. (2011). Lower extremity amputations- a review of global variability
in incidence. Diabetes Care, 28, 1144–1153.
Nadollek, H., Brauer, S. & Isles R. (2002). Outcomes after trans-tibial amputation: the
relationship between quiet stance ability, strength of hip abductor muscles and gait.
Physiotherapy Research International, 7, 203–214.
Nashner, L.M., Black, F.O. & Wall, C. (1982). Adaptation to altered support and visual
conditions during stance: patients with vestibular deficits. Journal of Neuroscience, 2,
536–544.

252
National Amputee Statistical Database. (2005). The amputee statistical database for the
United Kingdom 2004/05. Edinburgh (UK): Information Services Division NHS
Scotland.
National Center for Health Statistics. (2012). Healthy People 2010: Final Review.
Hyattsville, MD: US Government Printing Office.
Nederhand, M.J., Van Asseldonk, E.H.F., Der Kooij, H.V. & Rietman, H.S. (2012).
Dynamic Balance Control (DBC) in lower leg amputee subjects: Contribution of the
regulatory activity of the prosthesis side. Clinical Biomechanics, 27(1), 40-45.
Newton, R.A. (1982). Joint receptor contributions to reflexive and kinesthetic
responses. Physical Therapy, 62, 22-29.
Nielsen, C.C. (2007). Etiology of amputation. In M.M. Lusardi & C.C. Nielsen (Eds.),
Orthotics and prosthetics in rehabilitation (2nd ed.). St. Louis, Missouri. Saunders
Elsevier.
Noonan, M (2010). Productivity Commission Submission Inquiry into Disability Care &
Support. Retrieved January 25, 2015, from http://www.limbs4life.org.au/
pdf/advocacy/limbs4life_reports/Productivity%20Commission%20Submission%20%20
Inquiry%20into%20 Disability% 20Care%20and%20Support.pdf
Orechovska, K., Svoboda, Z., Janura, M. and Kovacikova, Z. (2015a). Postural stability
in transtibial amputees assessed by laboratory and clinical tests. Gait & Posture, 42(S3),
S54–S55.
Orechovska, K., Svoboda, Z., Kovacikova, Z. and Janura, M. (2015b). Effect of stump
parameters on postural stability during stance modification in transtibial amputees. Gait
& Posture, 42(S1), S96–S97.
Palastanga, N., Field, D. and Soames, R. (2002). Anatomy and Human Movement
Structure and Function (4th ed.), Butterwoth-Heinemann, Edinburgh.
Paloski, W.H., Wood, S.J., Feiveson, A.H., Black, F.O., Hwang, E.Y. & Reschke, M.F.
(2006). Destabilization of human balance control by static and dynamic head tilts. Gait
& Posture, 23(3), 315–323.
Pallant, J., (2011). SPSS Survival Manual: A step by step guide to data analysis using
SPSS (4th ed.), Allen & Unwin: New South Wales.
Parraca, J.A., Olivares, P.R., Carbonell-Baeza, A., Aparicio, V.A., Adsuar, J.C. & Gusi,
N. (2011). Test-retest reliability of Biodex balance system on physically active old
people. Journal of Human Sport & Exercise, 6, 444-451.
Patel, M., Fransson, P.A., Lush, D. & Gomez, S.(2008). The effect of foam surface
properties on postural stability assessment while standing, Gait & Posture, 28, 649–656.

253
Peduzzi, P., Concato, J., Feinstein, A.R., Holford, T.R. (1995). Importance of events per
independent variable in proportional hazards regression analysis. II. Accuracy and
precision of regression estimates. Journal of Clinical Epidemiology, 48, 1503-1510.
Peterka, R.J. (2002). Sensorimotor Integration in Human Postural Control. Journal of
Neurophysiology, 88, 1097-1118.
Paterno, M.V., Myer, G.D., Ford, K.R. & Hewett, T.E. (2004). Neuromuscular training
improved single-limb stability in young female athletes. Journal of Orthopaedic Sports
Therapy, 34(6), 305-314.
Perneger, T.V. (1998). What's wrong with Bonferroni adjustments. BMJ, 316(7139),
1236-1238.
Perry, J., Boyd, L. A., Rao, S. S. & Mulroy, S. J. (1997). Prosthetic weight acceptance
mechanics in transtibial amputees wearing the Single Axis, Seattle Lite, and Flex Foot.
IEEE Transaction in Rehabilitation Engineering, 5(4), 283-289.
Pincivero, D.M., Lephart, S.M. & Henry, T. (1995). Learning effect and reliability of
the Biodex Balance System. Journal of Athletic Training, 30, S48.
Pintsaar, A., Brynhildsen, J. & Tropp, H. (1996). Postural corrections after standardised
perturbations of single limb stance: effect of training and orthotic devices in patients
with ankle instability. British Journal of Sports Medicine, 30, 151-155.
Pollock, A.S., Durward, B.R. & Rowe, P.J. (2000). What is balance? Clinical
Rehabilitation, 14(4), 402-406.
Postema, K., Hermens, H.J., de Vries, J., Koopman, H.F. & Eisma, W.H. (1997).
Energy storage and release of prosthetic feet. Part 1: Biomechanical analysis related to
user benefits. Prosthetics and Orthotics International, 21(1), 17–27.
Powell, L.E. & Myers, A.M. (1995). The activities-specific balance confidence (ABC)
scale. The Journals of Gerontology Series A: Biological Sciences and Medical Sciences,
50, M28-M34.
Prieto, T.E., Myklebust, J.B. & Myklebust, BM. (1993). Characterization and modeling
of postural steadiness in the elderly: A review. IEEE Transaction in Rehabilitation
Engineering, 1, 26–34.
Quai, T.M., Brauer, S.G. & Nitz, J.C. (2005). Somatosensation, circulation and stance
balance in elderly dysvascular transtibial amputees. Clinical Rehabilitation, 19(6), 668-
676.
Razali, N.M. & Wah, Y.B. (2011). Power comparisons of Shapiro-Wilk, Kolmogorov-
Smirnov, Lilliefors and Anderson-Darling tests. Journal of Statistical Modeling and
Analytics, 2(1), 21-33.
Redfern, M.S., Yardley, L. & Bronstein, A.M. (2001). Visual influences on balance.
Journal of Anxiety Disorders, 15, 81–94.

254
Resnick, H. E., Valsania, P. & Phillips, C. L. (1999). Diabetes mellitus and
nontraumatic lower extremity amputation in black and white Americans: The national
health and nutrition examination survey epidemiologic follow-up study, 1971-1992.
Archives of Internal Medicine, 159(20), 2470-2475.
Resnick, H., Valsania, P., Halter, J. & Lin, X. (2000). Relation of weight gain and
weight loss on subsequent diabetes risk in overweight adults. Journal of Epidemiology
and Community Health, 54(8), 596–602.
Richie, D.H. (2001). Functional instability of the ankle and the role of neuromuscular
control: a comprehensive review. The Journal of Foot & Ankle Surgery, 40(4), 240-251.
Roach, K.E. (2006). Measurement of Health Outcomes: Reliability, Validity and
Responsiveness. Journal of Prosthetics & Orthotics, 18 (1S), 1-5.
Rommers, G.M., Vos, L.D.W., Groothoff, J.W., Schuiling, C.H. & Eisma, W.H. (1997).
Epidemiology of lower limb amputees in the north of the Netherlands: Aetiology,
discharge, destination and prosthetic use. Prosthetics and Orthotics International, 21(2),
92-99.
Rooyen, J.V. (2008). Material fatigue in the prosthetic SACH foot: effect on mechanical
characteristics and gait. (Unpublished Degree’s thesis). La Trobe University,
Melbourne.
Rougier, P.R. & Bergeau, J. (2009). Biomechanical analysis of postural control of
persons with transtibial or transfemoral amputation. American Journal of Physical
Medicine and Rehabilitation, 88, 896-903.
Rowntree, D. (1991). Statistics without tears. London: Penguin.
Ruhe, A., Fejer, R. & Walker, B. (2010). The test–retest reliability of centre of pressure
measures in bipedal static task conditions – A systematic review of the literature. Gait
& Posture, 32, 436-445.
Sagawa, Y., Jr., Turcot, K., Armand, S., Thevenon, A., Vuillerme, N., & Watelain, E.
(2011). Biomechanics and physiological parameters during gait in lower-limb
amputees: a systematic review. Gait & Posture, 33(4), 511-526.
Salavati, M., Hadian, M.R., Mazaheri, M., Negahban, H., Ebrahimi, I.,....Parnianpour,
M. (2009).Test–retest reliability of center of pressure measures of postural stability
during quiet standing in a group with musculoskeletal disorders consisting of low back
pain, anterior cruciate ligament injury and functional ankle instability. Gait & Posture,
29, 460–464.
Salsabili, H., Bahrpeyma, F., Forogh, B. & Rajabali, S. (2011). Dynamic stability
training improves standing balance control in neuropathic patients with type 2 diabetes.
Journal of Rehabilitation Research and Development, 48, 775–786.
Sam, M., Hansen, A. H., Childress, D. S. (2000). Mechanical characterization of
prosthetic feet using a prosthetic foot loading apparatus. Proceedings of the 24th Annual
EMBS International Conference. 1968-1971.
255
Sanders, J.E., Zachariah, S.G., Baker, A.B., Greve, J.M. & Clinton, C. (2000). Effects
of changes in cadence, prosthetic componentry, and time on interface pressures and
shear stresses of three trans-tibial amputees. Clinical Biomechanics, 15(9), 684-694.
Sattan, R.W. (1992). Falls among older persons: a public health perspective. Annual
Review of Public Health, 13, 489-508.
Schmitz, K. & Arnold, B. (1998). Intertester and intratester reliability of the Biodex
Stability System. Journal of Sport Rehabilitation, 7(2), 95-101.
Schuch, C. & Pritham, C.H. (1994). International forum - International Standards
Organization terminology: Application to prosthetics and orthotics. Journal of
Prosthetics and Orthotics, 6(1), 29-33.
Seeger, M.A. (2003). Balance deficits: Examination, evaluation and intervention. In,
P.C. Montgomery & B.H. Connolly (Eds.), Clinical applications for motor control.
Thorofare, NJ: Slack Inc.
Seymour, R. (2002). Prosthetics and orthotics: lower limb and spinal. Philadelphia,
PA: Lippincott Williams & Wilkins.
Shrout, P.E. & Fleiss, J.L. ( 1979). Intraclass correlations: uses in assessing rater
reliability. Psychology Bulletin, 86(2), 420-428.
Shumway-Cook, A. & Woollacott, M.H. (2001). Motor Control Theory and Practical
Applications. (2nd ed.). Philadelphia, USA: Lippincott Williams & Wilkins.
Shumway-Cook, A. & Horak, F.B. (1986). Assessing the influence of sensory
interaction on balance: suggestion from the field. Physical Therapy, 66, 1548-1550.
Shumway-Cook, A. & Woollacott, M.H. (2007). Motor control: translating research
into clinical practice. (3rd ed.). Baltimore, MD: Lippincott Williams & Wilkins.
Shumway-Cook, A. & Woollacott, M.H. (2000). Attentional demands and postural
control: the effect of sensory context. Journal of Gerontology, 55A(1), M10-M16.
Shurr, D.G. & Michael, J. W. (2000). Introduction to prosthetics and orthotics. In
Prosthetics and Orthotics (2nd ed). Norwalk, CT: Appleton & Lange.
Smith, D.G. (2004). General principles of amputation surgery. In D. G. Smith, J. W.
Michael & J. H. Bowker (Eds.), Atlas of amputation and limb deficiency: Surgical,
prosthetic and rehabilitation principles (3rd ed.). Rosemont, IL: American Academy of
Orthopaedic Surgeons.
Snyder, R.D., Powers, C.M., Fontaine, C. & Perry, J. (1995). The effect of five
prosthetic feet on the gait and loading of the sound limb in dysvascular below-
knee amputees. Journal of Rehabilitation Research and Development. 32(4), 309–315.
Stark, G. (2005). Perspectives on how and why feet are prescribed. Journal of
Prosthetics and Orthotics, 17(4), S18-22.
256
Stergiou, N. (2004). Innovative analyses of human movement. Champaign, IL: Human
Kinetics.
Suzana, S., Kee, C. C., Jamaludin, A. R., Noor Safiza, M. N., Khor, G. L., Jamaiyah,
H., . . . Ahmad Fauzi, Y. (2012).The Third National Health and Morbidity Survey:
Prevalence of Obesity, and Abdominal Obesity Among the Malaysian Elderly
Population. Asia-Pacific Journal of Public Health, 24(2), 318 –329.
Tanaka, H., Nakashizuka, M., Uetake, T. & Itoh, T. (2000). The effects of visual
input on postural control mechanisms: an analyssis of center- of-pressure trajectories
using the auto-regressive model. Journal of Human Ergology, 29, 15-25.
Taylor, B.N. & Kuyatt, C.E. (1994). NIST Technical Note 1297: Guidelines for
Evaluating and Expressing the Uncertainty of NIST Measurement Results.
Gaithersburg, MD: National Institute of Standards and Technology.
Teasdale, N. & Simoneau, M. (2001). Attentional demands for postural control: the
effects of ageing and sensory reintegration. Gait & Posture, 14, 203–210.
Testerman, C. & Griend, R.V. (1999). Evaluation of ankle instability using the Biodex
Stability Systems. Foot & Ankle International, 20(5), 317–321.
Toh, SL., Goh, J.C., Tan, P.H. & Tay, T.E. (1993). Fatigue testing of energy storing
prosthetic feet. Prosthetics and Orthotics Inernational, 17(3), 180-188.
Tucker, M. R., Olivier, J., Pagel, A., Bleuler, H., Bouri, M., Lambercy, O. & Gassert, R.
(2015). Control strategies for active lower extremity prosthetics and orthotics: a review.
Journal of NeuroEngineering and Rehabilitation, 12(1), 1-29.
Tseng, C.L., Helmer, D., Rajan, M., Tiwari, A., Miller, D., Crystal, S., … Pogach,
L. (2007). Evaluation of regional variation in total, major, and minor amputation rates in
a national health-care system. International Journal for Quality in Health Care, 19(6),
368-376.
Vamos, E.P., Bottle, A., Edmonds, M.E., Valabhji, J., Majeed, A. & Millett, C. (2010).
Changes in the incidence of lower extremity amputations in individuals with and
without diabetes in England between 2004 and 2008. Diabetes Care, 33(12), 2592–
2597.
van der Kooij, H., van Asseldonk, E.H.F. & Nederhand, H. (2007). Detecting
asymmetries in balance control with system identification: First experimental results
from above knee amputees. Paper presented at the Proceedings of the IEEE 10th
International Conference on Rehabilitation Robotics, Noordwijk. Netherlands: IEEE.
van der Linde, H., Hofstad, C. J., Geurts, A. C., Postema, K., Geertzen, J. H. & van
Limbeek, J. (2004). A systematic literature review of the effect of different prosthetic
components on human functioning with a lower-limb prosthesis. Journal of
Rehabilitation Research and Development, 41(4), 555-570.

257
van Jaarsveld, H.W.L., Grootenboer, H.J., Vries, J.D., Koopman, H.F. J. M. (1990).
Stiffness and hysteresis properties of some prosthetic feet. Prosthetics and Orthotics
International, 14, 117-124.
Van Gils, C.C., Wheeler, L.A., Mellstrom, M., Brinton, E.A., Mason, S. & Wheeler,
C.G. (1999). Amputation prevention by vascular surgery and podiatry collaboration in
high-risk diabetic and nondiabetic patients, The Operation Desert Foot experience.
Diabetes Care, 22(5), 678–683.
van Jaarsveld, H.W.L., Grootenboer, H.J., Vries, J.D. & Koopman, H.F.J.M. (1990).
Stiffness and hysteresis properties of some prosthetic feet. Prosthetics and Orthotics
International, 14, 117-24.
van Uden, C.J.T. & Besser, M.P. (2004). Test-retest reliability of temporal and spatial
gait characteristics measured with an instrumented walkway system (GAITRite®).
BMC Musculoskletal Disorder, 5, 13
Vanicek, N., Strike, S., McNaughton, L. & Polman, R. (2009). Postural responses to
dynamic perturbations in amputee fallers versus nonfallers: a comparative study with
able-bodied subjects. Archive of Physical Medicine and Rehabilitation, 90(6), 1018-
1025.
Ventura, J.D., Klute,G.K. & Neptune. R.R. (2011). The effects of prosthetic ankle
dorsiflexion and energy return on below-knee amputee leg loading. Clinical
Biomechanics, 26, 298–303.
Viton, J.M., Mouchnino, L., Mille, M.L., Cincera, M., Delarque, A.,..... Massion, J.
(2000). Equilibrium and movement control strategies in trans-tibial amputees.
Prosthetics and Orthotics International, 24, 108-116.
Vittas, D., Larsen, T.K. & Jansen, E.C. (1986). Body sway in below-knee amputees.
Prosthetic and Orthotic International, 10, 139-141.
Vrieling, A.H., van Keeken, H.G., Schoppen, T., Otten, E., Hof, A.L., Halbertsma, J,P.
& Postema, K. (2008a). Balance control on a moving platform in unilateral lower limb
amputees. Gait & Posture, 28(2), 222-228.
Vrieling, A. H., Van Keeken, H. G., Schoppen, T., Otten, E., Halbertsma, J. P. K., Hof,
A. L. & Postema, K. (2008b). Gait initiation in lower limb amputees. Gait & Posture,
27(3), 423-430.
Vrieling, A. H., van Keeken, H. G., Schoppen, T., Otten, E., Halbertsma, J. P. K., Hof,
A. L. & Postema, K. (2007). Obstacle crossing in lower limb amputees. Gait &
Posture, 26(4), 587-594.
Vuillerme, N. & Rougier, P. (2005). Effects of head extension on undisturbed upright
stance control in humans. Gait & Posture, 21, 318–325.
Wallace, B. (2007). Balance Training. In W.D. Bandy & B. Sanders (Eds.), Therapeutic
Exercise for Physical Therapist Assistants (2nd ed.). Philadelphia, PA: Lippincott
Williams & Wilkins.
258
Walter, S.D., Eliasziw, M., & Donner, A. (1998). Sample size and optimal designs for
reliability studies. Statistics in Medicine. 17, 101—110
Wan Mohamud, W. N., Musa, K.I., Md Khir, A.S., Ismail, A.A.S., Ismail, I. S., Kadir,
K. A. & Wan Bebakar, W. M. (2011). Prevalence of overweight and obesity among
adult Malaysians: an update. Asia Pacific Journal of Clinical Nutrition, 20(1), 35-40.
Wan Nazaimoon, W. M., Md Isa, S. H., Wan Mohamad, W. B., Khir, A. S.,
Kamaruddin, N. A., Kamarul, I. M., ... & Khalid, B. A. K. (2013). Prevalence of
diabetes in Malaysia and usefulness of HbA1c as a diagnostic criterion. Diabetic
Medicine, 30(7), 825-828.
Ware, J.E. & Sherbourne, C.D. (1992.). The MOS 36-item short-form health survey
(SF-36): I. Conceptual frame work and item selection. Medical Care, 30(6), 473-483.
Ware, J., Jr., Kosinski, M. & Keller, S. D. (1996). A 12-Item Short-Form Health
Survey: construction of scales and preliminary tests of reliability and validity. Medical
Care, 34(3), 220-233.
Ware, J.E., Jr., Kosinski, M., Turner-Bowker, D.M. & Gandek, B. (2002). User’s
Manual for the SF-12v2® Health Survey With a Supplement Documenting SF-12®
Health Survey). Lincoln, RI: QualityMetric Incorporated.
Weir, J.P. (2005).Quantifying test-retest reliability using the intraclass correlation
coefficient and the SEM. Journal of Strength and Conditioning Research, 19(1), 231-
240.
Wilson, A.B. (1992). History of amputation surgery and prosthetics. In J. H. Bowker &
J.W. Michael (Eds.), Atlas of Limb Prosthetics: Surgical, Prosthetic, and Rehabilitation
Principles. (2nd ed.). Rosemont, IL: American Academy of Orthopedic Surgeons.
Winter, D.A., Patla, A.E. & Frank, J.S. (1990a). Assessment of balance control in
humans. Medical Progress Through Technology, 16, 31-51.
Winter DA, Patla AE, Frank JS & Walt SE. (1990b). Biomechanical pattern changes in
the fit and healthy elderly. Physical Therapy, 70(6), 340-347.
Winter, D.A. (1995). Human balance and posture control during standing and walking.
Gait & Posture, 3, 193-214.
Winter, D.A., Patla, A.E., Prince, F., Ishac, M. & Gielo-Perczak, K. (1998). Stiffness
control of balance in quiet standing. Journal of Neurophysiology, 80(3), 1211–1221.
Wong, C.K., Chen, C.C. & Welsh, J. (2013). Preliminary assessment of balance with
the Berg Balance Scale in adults who have a leg amputation and dwell in the
community: Rasch rating scale analysis. Physical Therapy, 93(11), 1520–1529.
World Health Organization. (2004). The Rehabilitation of People with Amputations.
Geneva.

259
World Health Organization. (2005). Guidelines for Training Personnel in Developing
Countries for Prosthetics and Orthotics Services. Geneva.
Wu, G. & Chiang, J.H. (1996). The effects of surface compliance on foot pressure in
stance, Gait & Posture, 4, 122-129.
Yanohara, R., Teranishi, T., Tomita, Y., Tanino, G., Ueno, Y. & Sonoda, S. (2014).
Recovery Process of Standing Postural Control in Hemiplegia after Stroke. Journal of
Physical Therapy Science, 26(11), 1761–1765.
Yazicioglu, K., Taskaynatan, M.A., Guzelkucuk, U. & Tugcu, I. (2007). Effect of
playing football (soccer) on balance, strength, and quality of life in unilateral below-
knee amputees. American Journal of Physical Medicine and Rehabilitation, 86, 800-
805.
Yigiter, K., Sener, G. & Bayar, K. (2002). Comparison of the effects of patellar tendon
bearing and total surface bearing sockets on prosthetic fitting and rehabilitation.
Prosthetics and Orthotics International, 26(3), 206-212.
Yim-Chiplis, P.K. & Talbot, L.A. (2000). Defining and measuring balance in adults.
Biological Research For Nursing, 1, 321-331.
Zeller, S. (2007). Stiffness properties of prosthetic feet under cross-slope conditions.
Retrieved website: https://smartech.gatech.edu/handle/1853/14751.
Ziegler-Graham, K., MacKenzie, E.J., Ephraim, P.L., Travison, T.G. & Brookmeyer, R.
(2008). Estimating the prevalence of limb loss in the United States: 2005 to 2050.
Archives of Physical Medicine and Rehabilitation, 89, 422-429.
Zmitrewicz, R.J., Neptune, R.R., Walden, J.G., Rogers, W.E. & Bosker, G.W. (2006).
The effect of foot and ankle prosthetic components on braking and propulsive impulses
during transtibial amputee gait. Archives of Physical Medicine and Rehabilitation, 87,
1334-1339.
Zok, M., Mazza, C. & Cappozzo, A. (2008). Should the instructions issued to the
subject in traditional static posturography be standardised? Medical Engineering &
Physics, 30, 913–916.

260
Appendix A: List of Peer-reviewed ISI Publications
1. Arifin, N., Abu Osman, N.A. & Wan Abas, W.A.B. (2014). Intrarater Test-
Retest Reliability of Static and Dynamic Stability Indexes Measurement Using
the Biodex Balance System During Unilateral Stance. Journal of Applied
Biomechanics, 30(2), 300-304.
2. Arifin, N., Abu Osman, N. A., Ali, S., Abas, W. A. W. 2014. The effects of
prosthetic foot type and visual alteration on postural steadiness in below-knee
amputees. Biomedical Engineering Online, 13:23, 1-10.
3. Arifin, N., Abu Osman, NA., Ali, S., Gholizadeh, H. & Wan Abas, W.A.B.
(2015). The effects of different prosthetic feet and head extension on the
postural stability of below-knee amputees during quiet standing. Adapted
Physical Activity Quarterly. (Accepted)
4. Arifin, N., Abu Osman, NA. ,Ali, S., Gholizadeh, H. & Wan Abas, W.A.B.
(2015). Evaluation of postural steadiness in below-knee amputees when wearing
different prosthetic feet during various sensory conditions using the Biodex
Stability System (BSS). Journal of Engineering in Medicine, 229(7), 491-498.
5. Arifin, N., Abu Osman, NA; Ali, S; Gholizadeh, H & Wan Abas, WAB. (2014).
Postural Stability Characteristics of Transtibial Amputees Wearing Different
Prosthetic Foot Types When Standing on Various Support Surfaces. The
Scientific World Journal, 2014, 6.

261
Under review in:
Journal of Mechanics in Medicine and Biology. Arifin, N., Abu Osman, NA. ,Ali, S.,
Gholizadeh, H. & Wan Abas, W.A.B. Postural Stability Strategies In Transtibial
Amputees During Quiet Standing In Altered Sensory Conditions Wearing Three Types
Of Prosthetic Feet. SAGE Publication.
Journal of Engineering in Medicine. Arifin, N., Abu Osman, NA. & Wan Abas, W.A.B.
Quantitative instrumental approach to the evaluation of balance during standing in
people with lower limb amputation: A systematic review. SAGE Publication.
Proceedings:
Arifin, N., Abu Osman, N.A. & Wan Abas, W.A.B. (2014). Postural Movement
Strategies During Sensory Alterations in Transtibial Amputees: a Comparative Study
with Able-Bodied Subjects, IEEE Conference on Biomedical Engineering and Sciences,
8-10 December 2014, Miri, Sarawak. Malaysia. (ISI Conference)

262
Appendix B: References obtained for systematic review.
No References
Participants characteristics
1 Mixed amputation level: Nederhand, van Asseldonk, Der Kooij and Rietman
(2012), Buckley, O’Driscoll and Bennett (2002), Vrieling et al. (2008), Duclos,
Roll, Kavounoudias, Roll and Forget (2007), Yazicioglu, Taskaynatan,
Guzelkucuk and Tugcu (2007), Mohieldin, Chidambaram,
Sabapathivinayagam and Al Busairi (2010), Geurts and Mulder (1994), Geurts
and Mulder (1991)
2 18 control groups
Age-matched: Curtze, Hof, Postema and Otten (2012), Mohieldin et al.
(2010), Vanicek et al. (2009), Vrieling et al. (2008), Duclos et al. (2007),
Yazicioglu et al. (2007), Kanade, van Deursen, Harding and Price (2008),
Vrieling et al. (2008), Mouchnino et al. (2006), Buckley et al. (2002), Viton et
al. (2000), Mouchnino et al.(1998), Hermodsson , Ekdahl , Persson and
Roxendal (1994), Geurts and Mulder (1994), Isakov et al. (1992), Geurts and
Mulder (1991)
Non-aged matched: Aruin, Nicholas and Latash (1997), Fernie and Holliday
(1978), Dornan, Fernie and Holliday (1978)
3 Amputees’ activity level: Nederhand et al. (2012), Kozakova, Svoboda,
Janura, Elfmark and Nedvědová (2009), van der Kooji, van Asseldonk and
Nederhand (2007), Kaufman et al. (2007)
Complete demographic information: Barnett, Vanicek and Polma (2012),
Curtze et al. (2012), Mayer et al. (2011), Vanicek et al. (2009), Rougier and
Bergeau (2009), Kozakova et al. (2009), Kanade et al. (2008), Vrieling et al.
(2008), Lee, Lin and Soon (2007), Quai, Brauer and Nitz (2005), Aruin et al.
(1997)
Post-amputation years: Nederhand et al. (2012), Curtze et al. (2012), Mayer
et al. (2011), Hlavackova, Franco, Diot and Vuillerme (2011), Mohieldin et al.
(2010), Vanicek et al. (2011), Hlavackova et al.(2009), Kozakova et al. (2009),
Vrieling et al. (2008), Duclos et al. (2007), Yazicioglu et al. (2007), Lee et al.
(2007), Kaufman et al. (2007), Quai et al.(2005), Matjacic and Burger (2003),
Nadollek, Brauer and Isles (2002), Blumentritt, Schmalz , Jarasch and
Schneider (1999), Aruin et al. (1997), Hermodsson et al. (1994), Geurts et
al.(1994)
Acclimation period: Kaufman et al. (2007), Isakov, Mizrahi, Ring, Susak and
Hakim (1992)
4 Vascular: Kanade et al. (2008), Isakov et al. (1992), Nadollek et al. (2002),
Mayer et al. (2011), Quai et al. (2005), Hlavackova et al. (2011)
Non-vascular: Rougier and Bergeau (2009), Buckley et al. (2002), Duclos et
al. (2007), Yazicioglu et al. (2007), Blumentritt et al. (1999), Viton et al.
(2000) , Mouchnino et al.(1998), Mouchnino et al.(2006), Matjacic and Burger
(2003), Hlavackova et al. (2009)
5 Etiology not mentioned: Lee et al. (2007), Dornan et al. (1978), Aruin et al.
(1997), Fernie and Holliday (1978)

263
Appendix B (continued)
No References
Prosthetic componentry
6 Complete information: Mayer et al. (2011), Buckley et al. (2002)
7 Same prosthetic foot: Vanicek et al. (2009), Mayer et al. (2011), Viton et al.
(2000)
Same socket type: Lenka & Tiberwala (2010), Mayer et al. (2011), Blumentritt et
al.(1999), Viton et al. (2000), Matjacic and Burger (2003), Vittas , Larsen and
Jansen (1986)
8 SACH: Curtze et al. (2012), Mayer et al. (2011), Mohieldin et al. (2010), Lenka
& Tiberwala (2010), Vrieling et al. (2008), van der Kooij et al. (2007), Viton et
al. (2000),Blumentritt et al. (1999)
ESAR: Nederhand et al. (2012), Barnett et al. (2012), Curtze et al. (2012),
Mohieldin et al. (2010), Rougier et al. (2009), van der Kooij et al. (2007),
Blumentritt et al. (1999)
Multiaxial foot: Barnett et al. (2012), Curtze et al. (2012), Mohieldin et al.
(2010), Vanicek et al. (2009), Rougier et al. (2009), Vrieling et al.(2008) Buckley
et al. (2002)
Single axis foot: Nederhand et al. (2012), van der Kooij et al.(2007)
Instrumentations and protocols
9 Static bipedal: Nederhand et al. (2012), Barnett et al. (2012), Mayer et al. (2011),
Hlavackova et al.(2011), Mohieldin et al. (2010), Lenka et al. (2010), Vanicek et
al. (2009), Hlavackova et al.(2009), Kozakova et al. (2009), Rougier et al. (2009),
Kanade et al.(2008), Duclos et al. (2007), van der Kooij et al. (2007), Kaufman et
al. (2007), Quai et al. (2005), Buckley et al. (2002), Nadollek et al. (2002),
Blumentritt et al. (1999), Hermodsson et al. (1994), Geurts et al. (1994), Isakov et
al. (1992), Geurts et al. (1991), Vittas et al. (1986), Fernie et al. (1978), Dornan et
al. (1978)
Single leg on intact: Mayer et al. (2011), Mayer et al. (2011), Yazicioglu et al.
(2007), Lee et al. (2007), Mouchnino et al. (2006), Hermodsson et al. (1994)
Single leg prosthetic: Hermodsson et al. (1994), Mouchnino et al. (2006
10 Dynamic unexpected: Nederhand et al. (2012), Barnett et al. (2012), Curtze et al.
(2012), Mohieldin et al. (2010), Vanicek et al. (2009), Vrieling et al.(2008),
Kaufman et al.(2007), Buckley et al. (2002)
Dynamic expected perturbations: Yazicioglu et al. (2007), Mouchnino et al.
(2006), Quai et al. (2005), Matjacic et al. (2003), Viton et al. (2000), Mouchnino
et al. (1998), Aruin et al. (1997), Geurts et al. (1994)
11 Force platform: Mayer et al. (2011),,Hlavackova et al.(2011), Lenka et al.
(2010), Hlavackova et al.(2009), Kozakova et al. (2009), Rougier et al.
(2009),Vrieling et al. (2008), Kanade et al. (2008), Duclos et al. (2007), Quai et
al. (2005), Buckley et al. (2002), Nadollek et al. (2002), Blumentritt et al. (1999),
Hermodsson et al. (1994), Geurts et al. (1994), Isakov et al. (1992), Geurts et al.
(1991), Vittas et al. (1986)
Computerized posturography: Barnett et al. (2012), Mohieldin et al. (2010),
Vanicek et al. (2009),Yazicioglu et al. (2007), Kaufman et al. (2007), Matjacic
and Burger (2003)
Displacement transducer: Dornan et al. (1978), Fernie & Holliday (1978)
Motion analysis system: Lee et al. (2007)

264
Appendix B (continued)
No References
Instrumentations and protocols
12 Combined assessment: Nederhand et al. (2012), Curtze et al. (2012), van der
Kooij et al. (2007), Mouchnino et al. (2006), Viton et al. (2000), Mouchnino et al.
(1998), Aruin et al. (1997)
13 Standardized: Vanicek et al. (2009), Hermodsson et al. (1994), Lenka &
Tiberwala (2010), Rougier and Bergeau (2009), Nederhand et al. (2012), Buckley
et al. (2002), Barnett et al. (2012), Duclos et al.(2007), Geurts and Mulder (1994),
Geurts and Mulder (1991), Isakov et al. (1992), Nadollek et al. (2002), Quai et
al.(2005), Hlavackova et al. (2011), Viton et al. (2000), Mouchnino et al.(1998),
Mouchnino et al.(2006), Hlavackova et al.(2009), Aruin et al. (1997), Vittas et al.
(1986), van der Kooij et al. (2007)
Self-selected: Curtze et al. (2012), Vrieling et al. (2008), Kanade et al. (2008),
Mayer et al. (2011), Fernie and Holliday (1978), Kaufman et al. (2007)
No information: Lee et al. (2007), Yazicioglu et al. (2007), Mohieldin et al.
(2010), Blumentritt et al. (1999), Matjacic and Burger (2003), Dornan et al.
(1978), Kozakova et al. (2009)
14 2 to 5 repetitions: Vanicek et al. (2009), Hermodsson et al. (1994), Rougier and
Bergeau (2009), Nederhand et al. (2012), Buckley et al. (2002), Curtze et al.
(2012), Barnett et al. (2012), Mohieldin et al. (2010), Geurts and Mulder (1994),
Geurts and Mulder (1991), Kanade et al. (2008), Isakov et al. (1992), Mayer et al.
(2011), Quai et al.(2005), Hlavackova et al. (2011), Matjacic and Burger (2003),
Hlavackova et al. (2009), Dornan et al. (1978), Fernie and Holliday (1978),
Kaufman et al. (2007), van der Kooij et al. (2007)
20-30 seconds: Vanicek et al. (2009), Hermodsson et al. (1994), Buckley et al.
(2002), Barnett et al. (2012), Mohieldin et al. (2010), Geurts and Mulder (1994),
Geurts and Mulder (1991), Kanade et al. (2008), Isakov et al. (1992), Mayer et al.
(2011), Hlavackova et al. (2011), Hlavackova et al.(2009), Kaufman et al. (2007),
Kozakova et al. (2009)
15 At side of their body: Vanicek et al. (2009), Hermodsson et al. (1994), Lenka &
Tiberwala (2010), Rougier and Bergeau (2009), Nederhand et al. (2012), Vrieling
et al. (2008), Kanade et al. (2008), Mayer et al. (2011), Hlavackova et al. (2011),
Hlavackova et al.(2009), Aruin et al. (1997) , Vittas et al. (1986)
At the hip: Buckley et al. (2002)
At the back: Geurts and Mulder (1994), Geurts and Mulder (1991), Viton et al.
(2000), Mouchnino et al.(1998), Mouchnino et al.(2006)
Across the chest: Lee et al. (2007), Yazicioglu et al. (2007)
16 Stand as still as possible: Lenka & Tiberwala (2010), Geurts and Mulder (1994),
Geurts and Mulder (1991), Isakov et al. (1992), Hlavackova et al. (2011),
Hlavackova et al.(2009), Fernie and Holliday (1978)
Stand upright: Vanicek et al. (2009), Curtze et al. (2012), Barnett et al. (2012),
Kaufman et al. (2007)
Stand stationary: Buckley et al. (2002), Mouchnino et al.(1998), Mouchnino et
al. (2006)

265
Appendix B (continued)
No References
Types of sensory manipulations
17 Compliant surface: Kozakova et al., 2009
18 Eyes open: Rougier and Bergeau (2009), Nederhand et al. (2012), Buckley et al.
(2002), Lee et al. (2007), Yazicioglu et al.(2007), Geurts and Mulder (1994),
Geurts and Mulder (1991), Mayer et al. (2011), Blumentritt et al. (1999), Viton et
al. (2000), Mouchnino et al.(1998), Mouchnino et al.(2006), Matjacic and Burger
(2003), Hlavackova et al.(2009), Aruin et al. (1997)
Close: Hlavackova et al. (2011), Duclos et al.(2007), van der Kooij et al. (2007),
Vittas et al. (1986)
Both: Vanicek et al. (2009), Hermodsson et al. (1994), Lenka & Tiberwala
(2010), Buckley et al. (2002), Barnett et al. (2012), Vrieling et al. (2008),
Mohieldin et al. (2010), Isakov et al. (1992), Nadollek et al. (2002), Quai et
al.(2005), Dornan et al. (1978), Fernie and Holliday (1978), Kaufman et al.
(2007), van der Kooij et al. (2007), Kozakova et al. (2009)
Main outcome measures
19 CoM and/ or CoP variables: Mayer et al. (2011), Hlavackova et al.(2011),
Lenka et al. (2010), Hlavackova et al.(2009), Kozakova et al.(2009), Rougier et
al. (2009), Vrieling et al. (2008), Kanade et al. (2008), Duclos et al.(2007), Quai
et al. (2005), Buckley et al. (2002), Nadollek et al.(2002), Blumentritt et al.
(1999), Hermodsson et al. (1994), Geurts et al. (1994), Isakov et al. (1992),
Geurts et al. (1991), Vittas et al. (1986), Lee et al. (2007), Nederhand et al.
(2012), Curtze et al. (2012), van der Kooij et al. (2007), Mouchnino et al. (2006),
Viton et al. (2000), Mouchnino et al. (1998), Aruin et al. (1997)
Weight distribution: Rougier and Bergeau (2009), Nederhand et al. (2012),
Geurts and Mulder (1994), Kanade et al. (2008), Isakov et al. (1992), Nadollek
et al. (2002), Mayer et al. (2011), Quai et al.(2005), Hlavackova et al. (2011),
Hlavackova et al.(2009), van der Kooij et al. (2007), Kozakova et al. (2009)
Equilibrium and composite score: Barnett et al. (2012), Mohieldin et al. (2010),
Vanicek et al. (2009), Kaufman et al. (2007)
Balance Index (BI): Yazicioglu et al. (2007)
Standing duration: Hermodsson et al. (1994), Buckley et al. (2002), Lee et al.
(2007), Matjacic and Burger (2003)

266
Appendix C: Ethical approval

267
Appendix D: Participants information sheets
Title of Study: The Influence of Prosthetic Foot Types on the Postural
Control of Below-Knee Amputees
Subject’s Identification Form
Control healthy/ Transtibial amputee
Name: _ _ _ _ _ _ _ _ _ _ _ _ _ _ Date of Birth: _ _ _ _ _ __ _
_ _ _ _ _
Age: _ _ _ _ _ _ _ _ _ _ _ _ _ _ _ _ Gender: Male / Female.
Height (m):_ _ _ _ _ _ _ _ _ _ _ _ _ Mass (kg): _ _ _ _ _ _ _ _ _
Shoes size: _ _ _ _ _ _ _ _ _ _ _ _ _ Foot size (cm): _ _ _ _ _ _ _
Amputation side/ Dominant : Left / Right Left / Right
Years of amputation :___________ years Liner
:_____________________
Cause of amputation :___________________
Suspension:_____________________
Type of foot :___________________ Socket
:_____________________
Residual length :___________________( from mid-patellar tendon to distal end)
Wearing hours/day :___________________
ADL (K-level) :___________________
Any disease :___________________
Sight/ hearing impairments : _____________________
Phantom pain/ sensations : _____________________
Recent falls or have experienced falls since amputation : _____________________

268
Sila tanda
Appendix E: Informed consent
Borang Keizinan (Consent Form)
Tajuk Kajian: The influence of prosthetic foot on the stiffness on the postural control transtibial
amputee.
Nama Penyelidik: Nooranida Arifin
1. Saya sahkan yang saya telah membaca Lampiran A: Participant Information
Statement dan memahami projek ini. Saya faham bahawa penyelidik akan menjawab sebarang
soalan yang mungkin ada.
2. Saya faham bahawa penyertaan saya adalah secara sukarela dan saya boleh menarik diri pada
bila-bila masa dan ia tidak akan menggangu apa-apa rawatan yang sedang saya terima.
3. Saya faham bahawa projek ini telah diberi kebenaran oleh Kejuruteraan Bioperubatan,
Fakulti Kejuruteraan, Universiti Malaya.
4. Saya faham bahawa maklumat daripada borang kaji-selidik yang telah lengkap akan disimpan
dengan cermat dan keselamatannya terjamin. Saya faham bahawa maklumat yang dikumpul
hanya untuk kegunaan saintifik dan nama saya tidak akan diterbitkan dalam buku dan jurnal.
5. Saya memberi kebenaran kepada Koordinator projek dan Koordinator projek Negara untuk
meIihat maklumat yang telah saya beri didalam kajian ini.
6. Saya bersetuju untuk mengambil bahagian didalam kajian ini.
Tandatangan Saksi,
_____ ______________
Nama:
Nama:
Jawatan:
Jabatan:
Tandatangan Subjek,
_____ ____________
Nama:
Nama:
No K/P:

269
Appendix F: Questionnaires
F1: Health Survey Questionnaire
Name:____________________________
Date:__________________
Health Survey (SF-12 v2 Standard, US Version 2.0)
Directions: This survey asks for your views about your health. This information will
help you keep track of how you feel and how well you are able to do your usual
activities. If you are unsure about how to answer a question, please give the best answer
you can. Circle only one answer for each question. Please ask the researcher for any
question.
1. In general, would you say your health is:
(GH01)
Excellent
Very Good
Good
Fair
Poor
1 2 3 4 5
The following questions are about activities you might do during a typical day. Does
your health now limit you in these activities? If so, how much?
Yes,
limited a
lot
Yes, limited
a little
No, not
limited at
all
2. Moderate activities, such as moving a
table, pushing a vacuum cleaner,
bowling, or playing golf (PF3b).
1 2 3
3. Climbing several flights of stairs
(PF3d).
1 2 3
During the past 4 weeks, how much of the time have you had any of the following
problems with your work or other regular daily activities as a result of your physical
health?
All of the
time
Most of
the time
Some of
the time
A little of
the time
None of
the
time
4. Accomplished less than you
would like (RP4b).
1 2 3 4 5
5. Were limited in the kind of
work or other activities
(RP4c).
1 2 3 4 5

270
During the past 4 weeks, how much of the time have you had any of the following
problems with your work or other regular daily activities as a result of any emotional
problems (such as feeling depressed or anxious)?
All of the
time
Most of
the time
Some of
the time
A little of
the time
None of
the
time
6. Accomplished less than you
would like (RE5b).
1 2 3 4 5
7. Did work or activities less
carefully than usual
(RE5c).
1 2 3 4 5
8. During the past 4 weeks, how much did pain interfere with your normal work
(including both work outside the home and housework)?
(BP02)
Not at all
A little bit Moderately Quite a bit Extremely
1 2 3 4 5
These questions are about how you feel and how things have been with you during the
past 4 weeks. For each question, please give the one answer that comes closest to the
way you have been feeling. How much of the time during the past 4 weeks...
All of the
time
Most of
the time
Some of
the time
A little of
the time
None of
the time
9. Have you felt calm and
peaceful (MH9d).
1 2 3 4 5
10. Did you have a lot of
energy (VT9e).
1 2 3 4 5
11. Have you felt
downhearted and
depressed (MH9f).
1 2 3 4 5
12. During the past 4 weeks,
how much of the time
has your physical health
or emotional problems
interfered with your
social activities (like
visiting friends,
relatives, etc.)?(SF10).
1 2 3 4 5

271
F2: Berg Balance Scale
Name:____________________________
Date:__________________
The Berg Balance Scale (BBS) has an overall range of 0–56 and comprises 14 items (or
tasks), with each item score ranging from 0–4.The Berg Balance Scale includes the
following tests:
Score
1. The ability to place the feet together independently up to 1 minute ....……
2. Standing unsupported for up to 1 minute ………
3. Standing with one foot in front of the other for up to 30 seconds ………
4. Sitting to standing ………
5. Transferring from one chair to another ………
6. Turning 360° ………
7. Stoll stepping ………
8. Sitting with the back unsupported ………
9. Standing to sitting ………
10. Standing with eyes closed for 10 seconds ………
11. Reaching forward while standing ………
12. Turning to look behind over the left and right shoulders while standing ………
13. Retrieving object from floor ………
14. Standing on 1 leg for up to 20 seconds ………

272
F3: Houghton Scale
Items Descriptions Score
1. Do you wear your
prosthesis:
0: <25% of walking hours (1-3 hours)
1: 25-50% of walking hours (4-8 hours)
2: >50% of walking hours (>8 hours)
3: All walking hours (12-16 hours)
2. Do you wear your
prosthesis to walk:
0: Just when visiting doctor/ limb-fitting
center
1: At home but not to go outside
2: Outside the home on occasion
3: Inside and outside all the time
3. When going outside
wearing your prosthesis,
do you:
0: Use a wheelchair
1: Use two crutches, two canes, or a
walker
2: Use one cane
3: Use nothing
4. When walking with your
prosthesis outside, do you
feel unstable when:
(a) Walking on a flat surface 0: Yes, 1: No
(b) Walking on slopes 0: Yes, 1: No
(c) Walking on rough ground 0: Yes, 1: No

273
F4: Activities-Specific Balance Confidence Scale
Name:_________________________ Date:__________________
For each of the following activities, please indicate your level of self-confidence by
choosing a corresponding number from the following rating scale. If you do not
currently do the activity in question, try and imagine how confident you would be if you
had to do the activity.
How confident are you that you will not lose your balance or become unsteady
when you . .
0% 10 20 30 40 50 60 70 80 90 100%
No confident Completely confident
1. . . . walk around the house? _________%
2. . . . walk up or down stairs? _________%
3. . . . bend over and pick up a slipper from front of a closet floor? _________%
4. . . . reach for a small can off a shelf at eye level? _________%
5. . . . stand on tip toes and reach for something above your head? _________%
6. . . . stand on a chair and reach for something? _________%
7. . . . sweep the floor? _________%
8. . . . walk outside the house to a car parked in the driveway? _________%
9. . . . get into or out of a car? _________%
10. . . . walk across a parking lot to the mall? _________%
11. . . . walk up or down a ramp? _________%
12. . . . walk in a crowded mall where people rapidly walk past you? _________%
13. . . . are bumped into by people as you walk through the mall? _________%
14. . . . step onto or off of an escalator while you are holding onto _________%
a railing?
15. . . . step onto or off an escalator while holding onto parcels such _________%
hold that onto the you cannot railing?
16. . . . walk outside on slippery sidewalks? _________%