The Influence of Parameters on the Crack Formation of ...
108
The University of Maine The University of Maine DigitalCommons@UMaine DigitalCommons@UMaine Electronic Theses and Dissertations Fogler Library Summer 8-22-2020 The Influence of Parameters on the Crack Formation of The Influence of Parameters on the Crack Formation of Pigmented Water Borne Barrier Coatings During Folding Pigmented Water Borne Barrier Coatings During Folding Yaping Zhu University of Maine, [email protected] Follow this and additional works at: https://digitalcommons.library.umaine.edu/etd Recommended Citation Recommended Citation Zhu, Yaping, "The Influence of Parameters on the Crack Formation of Pigmented Water Borne Barrier Coatings During Folding" (2020). Electronic Theses and Dissertations. 3319. https://digitalcommons.library.umaine.edu/etd/3319 This Open-Access Thesis is brought to you for free and open access by DigitalCommons@UMaine. It has been accepted for inclusion in Electronic Theses and Dissertations by an authorized administrator of DigitalCommons@UMaine. For more information, please contact [email protected].
Transcript of The Influence of Parameters on the Crack Formation of ...

The University of Maine The University of Maine
DigitalCommons@UMaine DigitalCommons@UMaine
Electronic Theses and Dissertations Fogler Library
Summer 8-22-2020
The Influence of Parameters on the Crack Formation of The Influence of Parameters on the Crack Formation of
Pigmented Water Borne Barrier Coatings During Folding Pigmented Water Borne Barrier Coatings During Folding
Yaping Zhu University of Maine, [email protected]
Follow this and additional works at: https://digitalcommons.library.umaine.edu/etd
Recommended Citation Recommended Citation Zhu, Yaping, "The Influence of Parameters on the Crack Formation of Pigmented Water Borne Barrier Coatings During Folding" (2020). Electronic Theses and Dissertations. 3319. https://digitalcommons.library.umaine.edu/etd/3319
This Open-Access Thesis is brought to you for free and open access by DigitalCommons@UMaine. It has been accepted for inclusion in Electronic Theses and Dissertations by an authorized administrator of DigitalCommons@UMaine. For more information, please contact [email protected].

THE INFLUENCE OF PARAMETERS ON THE CRACK FORMATION OF PIGMENTED
WATER BORNE BARRIER COATINGS DURING FOLDING
By
Yaping Zhu
BS Harbin Engineering University, China, 2012
MS Tianjin University, China, 2015
A DISSERTATION
Submitted in Partial Fulfillment of the
Requirements for the Degree of
Doctor of Philosophy
(in Chemical Engineering)
The Graduate School
The University of Maine
August 2020
Advisory Committee:
Dr. Douglas W. Bousfield, Professor of Chemical & Biomedical Engineering, Co-Advisor
Dr. William M. Gramlich, Associate Professor of Chemistry, Co-Advisor
Dr. Barbara J.W. Cole, Professor of Chemistry
Dr. David J. Neivandt, Professor of Chemical & Biomedical Engineering
Dr. Mehdi Tajvidi, Associate Professor of Renewable Nanomaterials

THE INFLUENCE OF PARAMETERS ON THE CRACK FORMATION OF PIGMENTED
WATER BORNE BARRIER COATINGS DURING FOLDING
By Yaping Zhu
Dissertation Co-Advisors: Dr. Douglas W. Bousfield & Dr. William M. Gramlich
An Abstract of the Dissertation Presented
in Partial Fulfillment of the Requirements for the
Degree of Doctor of Philosophy
(in Chemical Engineering)
August 2020
Water borne barrier coatings with pigments have great potential to replace extruded polymer coatings
because they can be recycled and are more likely to break down in the environment. When formed into a
package, these coated papers often need to be folded, which usually leads to decreased barrier performance
of the coating, but this issue is not well documented in the literature.
In this thesis, the influences of pigment type, shape, and pigment volume concentration (PVC) on the
water vapor transmission rate (WVTR) and fold resistance were characterized for barrier coating
formulations. Some experiments include the addition of flexible pigments and latex. A finite element
method-based model was developed to simulate the folding process. These simulations were compared to
experimental results to better understand the key parameters that affect crack formation in water borne
barrier coatings.
Plate shaped pigments gave the best WVTR results before folding but tended to generate large cracks
and poor water vapor barrier properties after folding. Spherical plastics pigments yielded smaller cracks
than other mineral pigments that had different shapes and higher modulus. High paper thickness, coating
thickness, pigment loadings, aspect ratios, and modulus were predicted by the model to increase the
likelihood of a crack formation. Experiments and the model indicate that using lower modulus (more
flexible) pigments improved crack resistance compared to coatings made with higher modulus kaolin. The
model predicted the key trends of the results for two pigment types at various pigment loadings. Talc and

glitter gave a less crack generation than kaolin and mica when folded, It may because of smaller modulus
of talc and glitter. Adding a flexible latex reduced the crack formation and lead to good barrier performance
even after folding. Adding pigment into latex also eliminated the blocking problem but reduced the
flexibility of the coating.

iii
ACKNOWLEDGEMENTS
I would like to thank my co-advisors, Dr. Douglas Bousfield and Dr. William Gramlich, for their
direction and support throughout my PhD career. It is a wonderful experience to work with them. My
research skills were broadened and sharpened during my work with them, I am so lucky to work under their
advisement. In addition to my advisors, I would like to thank the rest of my thesis committee: Dr. Barbara
Cole, Dr. David Neivandt, and Dr. Mehdi Tajvidi. They dedicated their time to help me complete my PhD.
Thank the Paper Surface Science Program to support my research. It was great to work and meet with
the sponsors in Paper Surface Science Program meeting each semester.
I am very appreciative of my lab mates, it was comfortable and enjoyable to work with them. Thank
Kendra Fein who helped me so much for the experiment and course homework. I would like to thank my
friends who helped me in my life, they made my life more enjoyable and colorful. It is a wonderful
experience to meet and stay together with them. I am genuinely sorry to leave and part with them after
graduation.
The person I most want to thank is my husband, Zhilong Liu, who was very supportive and encouraging
during these years so I can focus on my research and thesis. Zhilong has been a positive person in my life
and research study, he always encouraged me when there were challenges in my research, it has been
suddenly enlightened after discussing with him. It has been a valuable experience to come to Maine with
him. In addition, I want to thank my daughter Elsa. It has been a very wonderful experience since she joined
our family. She also gave me courage and send me positive energy throughout my life.

iv
TABLE OF CONTENTS
ACKNOWLEDGEMENTS ......................................................................................................................... iii
LIST OF TABLES ...................................................................................................................................... vii
LIST OF FIGURES ................................................................................................................................... viii
Chapter
1. INTRODUCTION .................................................................................................................................... 1
1.1 Motivation ........................................................................................................................................... 1
1.2 Water borne barrier coatings ............................................................................................................... 5
1.3 Cracks of barrier coatings when folded .............................................................................................. 8
1.4 Modeling ........................................................................................................................................... 11
1.5 Summary ........................................................................................................................................... 14
1.6 Thesis structure ................................................................................................................................. 15
2. THE INFLUENCE OF PIGMENT TYPE AND LOADING ON WATER VAPOR BARRIER
PROPERTIES OF PAPER COATINGS BEFORE AND AFTER FOLDING .......................................... 17
2.1 Introduction ....................................................................................................................................... 17
2.2 Materials and methods ...................................................................................................................... 19
2.2.1 Coating method .......................................................................................................................... 19
2.2.2 Water vapor transmission rate (WVTR) measurement .............................................................. 21
2.2.3 Sample folding procedure .......................................................................................................... 22
2.2.4 Coating crack characterization ................................................................................................... 23

v
2.2.5 Bending simulations ................................................................................................................... 24
2.3 Results and discussion ...................................................................................................................... 26
2.4 Conclusions ....................................................................................................................................... 37
3. PREDICTION OF CRACK FORMATION OF WATER BORNE BARRIER COATINGS DURING
FOLDING ................................................................................................................................................... 38
3.1 Introduction ....................................................................................................................................... 38
3.2 Methods ............................................................................................................................................. 40
3.2.1 Model setup ................................................................................................................................ 40
3.2.2 Modeling general coating systems ............................................................................................. 42
3.2.3 Modeling experimental systems ................................................................................................. 43
3.2.4 Bending experiments.................................................................................................................. 44
3.2.5 Comparing model and experimental results ............................................................................... 45
3.3 Results and discussion ...................................................................................................................... 46
3.3.1 Shape and aspect ratio effects .................................................................................................... 46
3.3.2 Modulus effects .......................................................................................................................... 48
3.3.3 Paper and coating thickness effects............................................................................................ 51
3.3.4 Comparison of simulation and experiment ................................................................................ 54
3.4 Conclusion ........................................................................................................................................ 56
4. THE INFLUENCE OF PIGMENT MODULUS ON CRACK RESISTANCE OF PAPER BARRIER
COATINGS ................................................................................................................................................ 57

vi
4.1 Introduction ....................................................................................................................................... 57
4.2 Materials and methods ...................................................................................................................... 61
4.2.1 Coating method .......................................................................................................................... 61
4.2.2 Water vapor transmission rate (WVTR) measurement .............................................................. 62
4.2.3 Sample folding procedure .......................................................................................................... 63
4.3 Results and discussion ...................................................................................................................... 63
4.4 Conclusion ........................................................................................................................................ 75
5. CONCLUSIONS AND FUTURE WORK ............................................................................................. 76
5.1 Conclusions ....................................................................................................................................... 76
5.2 Future work ....................................................................................................................................... 77
REFERENCES ........................................................................................................................................... 80
APPENDIX A. CUBIC AND HEXAGONAL PACKING OF RECTANGLES AND SPHERES ............ 87
APPENDIX B. GENERATED FLAT PLASTIC PIGMENTS BY GRINDING ....................................... 90
APPENDIX C. GENERATED PLATY LIGNIN ....................................................................................... 92
BIOGRAPHY OF THE AUTHOR ............................................................................................................. 95

vii
LIST OF TABLES
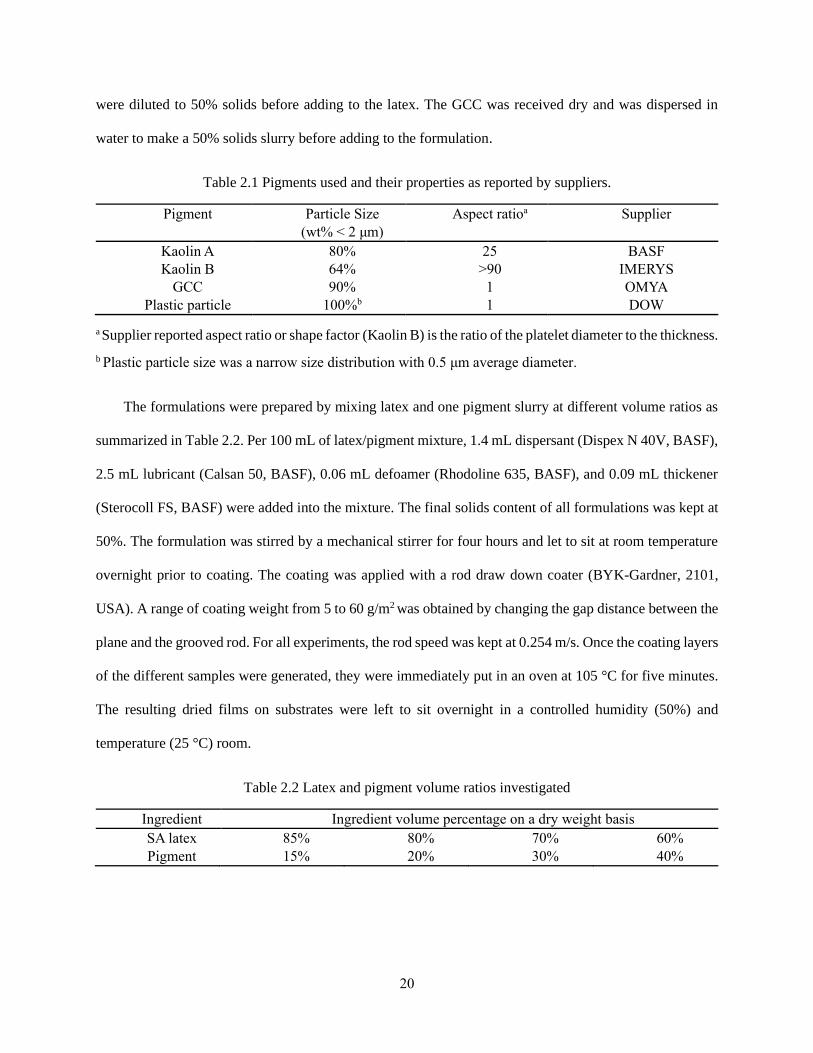
Table 2.1 Pigments used and their properties as reported by suppliers. ..................................................... 20
Table 2.2 Latex and pigment volume ratios investigated ........................................................................... 20
Table 2.3 Model input parameters .............................................................................................................. 25
Table 2.4 Crack area, number, and width in coatings with various PVCs. ................................................. 33
Table 2.5 Maximum strain and stress value of coating after bending simulation. ...................................... 36
Table 3.1 Materials properties in model ..................................................................................................... 43
Table 3.2 Model parameters to compare to experiments ............................................................................ 43
Table 4.1 Pigments used and their properties ............................................................................................. 62

viii
LIST OF FIGURES
Figure 1.1 Mechanism of barrier improvement by fillers or nanocomposites. (Andersson, 2008) .............. 4
Figure 1.2 Focused ion beam images showing the alignment of the kaolin particle filled latex barrier
layer (Bollström et al., 2013). ....................................................................................................................... 7
Figure 1.3 Cross section of different coating formulations with cracking (Oh et al., 2015) ......................... 9
Figure 1.4 Grease penetration of plain SB-based dispersion coated paperboard as function of time
(Vähä-Nissi and Savolainen, 1999). ............................................................................................................. 9
Figure 2.1 a) Schematic of orthogonal folds made in coated samples. b) WVTR results of coatings
using 15% PVC kaolin A before folding (black squares), after one line of folding (red circles), and
after six lines of folding (blue triangles). .................................................................................................... 23
Figure 2.2 Model geometry with finite element mesh. ............................................................................... 25
Figure 2.3 WVTR values of coatings with different pigments before and after folding for various
latex weights and PVCs. ............................................................................................................................. 28
Figure 2.4 Effective diffusion coefficient of latex only (black squares) coatings and coatings with
different pigments. ...................................................................................................................................... 29
Figure 2.5 a) Average of effective diffusion coefficient of coatings with different pigments with
15-25 g/m2 latex weight as a function of PVC. ........................................................................................... 30
Figure 2.6 a) Average percent WVTR increase after folding for coatings with latex weight between
15 and 25 g/m2 for each pigment and PVC investigated. ........................................................................... 31
Figure 2.7 Representative SEM images of cracks in coatings at the fold for various pigments at
PVC values of 15% and 40% at 20 g/m2 latex weight. ............................................................................... 34

ix
Figure 2.8 Enlarged results near the top left corner of the coating layer for stress (left images) and
strain (right images) for no particles (top), 40% PVC plate like particles (middle), and 40% PVC
spherical particles (bottom).. ....................................................................................................................... 36
Figure 3.1 Model setup and folding curvature calculation ......................................................................... 41
Figure 3.2 Bending experiment setup. ........................................................................................................ 45
Figure 3.3 Influence of pigment aspect ratio on the maximum value of the first principle strain (ε11)
in the coating layer at the folding line when the curvature was 0.04 mm-1 for (a) rectangular shaped
pigments (E = 1 GPa) and (b) elliptical shaped pigments (E = 1 GPa). ..................................................... 47
Figure 3.4 Maximum value of first principle strain (ε11) distribution in model coating layer at the
folding line when the bending curvature was 0.04 mm-1 for different shape pigments. ............................. 48
Figure 3.5 Influence of pigment modulus (E) and latex modulus (ELatex) on the maximum value of
first principle strain (ε11) in coating layer at folding line when bending curvature is 0.04 mm-1. ............... 49
Figure 3.6 Maximum value of first principle strain (ε11) distribution in model coating layer at the
folding line when the bending curvature is 0.04 mm-1 for different modulus pigments. ............................ 50
Figure 3.7 Contour of maximum value of first principle strain (ε11) distribution for square (a, b) and
circular shaped pigments (c, d) coating layer at the folding line when the bending curvature is 0.04
mm-1 at FA values of 15% (a, c) and 40% (b, d). ......................................................................................... 50
Figure 3.8 Influence of paper thickness and coating thickness on the maximum value of first
principle strain (ε11) for a rectangular pigment at various area fractions when the bending curvature
is 0.04 mm-1. Young’s modulus of pigment is 200 GPa with aspect ratio of 5........................................... 52
Figure 3.9 Influence of paper and coating thickness on location of neutral plane (dash-dotted lines),
and distance from neutral plane (d1, d2) to outer bend. ............................................................................... 53

x
Figure 3.10 Influence of pigment volume concentration and type on curvature at failure from
experiment and simulation. ......................................................................................................................... 56
Figure 4.1 WVTR values of coatings with kaolin A and talc before and after folding for various
latex weights and PVCs. ............................................................................................................................. 65
Figure 4.2 Effective diffusion coefficient of latex only (black squares) coatings and coatings with
kaolin A and talc.......................................................................................................................................... 66
Figure 4.3 WVTR values of coatings with mica and glitter before and after folding for various latex
weights and PVCs. ...................................................................................................................................... 68
Figure 4.4 Effective diffusion coefficient of latex only (black squares) coatings and coatings with
glitter and mica. .......................................................................................................................................... 69
Figure 4.5 WVTR values of coatings with blends of different latex before and after folding for
various SA latex weights and volume concentration of the SB or NR latex. .............................................. 71
Figure 4.6 Effective diffusion coefficient of SA latex only (black squares) coatings, SB latex only
(black asterisk) and coatings with various volume concentration of SB latex or NR latex. ....................... 71
Figure 4.7 WVTR values of coatings with kaolin dispersed in SA latex, 80% volume concentration
SA and 20% volume concentration SB mixture latex and SB latex before and after folding for
various latex weights and volume concentration of kaolin. ........................................................................ 73
Figure 4.8 Effective diffusion coefficient of SA latex only coatings (black squares), SA and SB
mixture latex only coating (black plus) and SB latex only coating (black asterisk) and coatings with
kaolin dispersed in these latexes. ................................................................................................................ 74
Figure 4.9 Average percent WVTR increase after folding for coatings. ..................................................... 74

xi
Figure A.1 Models with particles, (a.1) 2-D model with kaolin, (a.2) 3-D model with kaolin, (b.1)
2-D model with plastic pigments, (b.2) 3-D model with plastic pigments ................................................. 89
Figure A.2 Influence of pigment volume fraction and type on curvature at failure from experiment
and simulation. ............................................................................................................................................ 89
Figure B.1 Pigments shape before and after grinding ................................................................................. 90
Figure B.2 WVTR values of coatings with un-grinding and grinding plastic pigments before and
after folding for various latex weights and PVCs. ...................................................................................... 91
Figure C.1 SEM of lignin prepared by freeze dry, grease resistance test (Demer’s work) ......................... 92
Figure C.2 SEM of lignin powder,(a) after grinding lignin powder directly(b) (× 500), plate like
lignin by grinding lignin sheet(c)(d) (× 500,×1k). ...................................................................................... 93
Figure C.3 Freeze dry 5% lignin before grinding(a)×100,(b) ×1k, after grinding(c) ×100,(d)×1k. ........... 93
Figure C.4 WVTR values of coatings with lignin before and after folding for various latex weights
and PVCs. ................................................................................................................................................... 94
Figure C.5 SEM of coating with SB latex & lignin powder(a)(b), SB latex & platy lignin(c)(d). ............. 94

1
CHAPTER 1
INTRODUCTION
Water borne barrier coatings have great potential to replace extruded polyethylene (PE) coatings for
food packaging applications because they can be applied at high speeds, should be environmentally friendly
and are easily produced (Siracusa et al., 2008; Ryan et al., 2003; Arai,2000). These coatings are usually a
mixture of a latex and a pigment and can be applied at high speed with blade or roll coaters. To reduce the
cost of water borne barrier coatings, plate or disk-shaped pigments are often added to latex. These plate-
shaped particles improve the coating properties and reduce the costs (Zou et al., 2007; Bollstrom et al.,2013).
However, these particles make the coating brittle, causing poor barrier properties when flexed or folded
(Vähä-Vähä-Nissi and Savolainen, 1999). To form packaging such as bags or boxes, some parts of the paper
needs to be folded. The folding operation has the potential to compromise the barrier properties, but few
publications in the literature have reported on this issue. The goal of this work is to understand the material
parameters that lead to a flexible barrier coating. By improving the understanding of the chemical and
mechanical parameters that affect the crack resistance, materials and other processes can be designed that
minimize crack formation in these systems.
1.1 Motivation
Methods to store, transport, and distribute food and other items are important globally. Traditional
packaging systems are often not sustainable. Plastics, glass, and metals are excellent materials for food
packaging, but they are often difficult to recycle and do not decompose easily in the environment.
Glass is the traditional material for food packaging. Glass is chemically inert, impermeable to gases
and vapors and is capable to withstand high processing temperatures. Due to the good transparency, glass
can easily exhibit the appearance of food products (Robertson, 2016). However, glass is heavy and brittle,
which increases the transportation costs. While glass is widely used to make bottles for products such as

2
wine, fresh milk, juice and canned fruit, it is not widely recycled, has a high cost to recycle, has high cost
of transportation, and does not break down in the environment (Marsh, & Bugusu, 2007).
Metal cans are more widely used in canning food and drinks. Outstanding mechanical strength of metal
reduces the package thickness and weight (Marsh, & Bugusu, 2007). An aluminum can of which the
volume is 500ml weighs only 20-40g, while a glass jar with the same volume is about 200-350g. Metal is
an excellent barrier to moisture, air, oxygen, odors, light, and microorganisms resulting in a completely
sealed environment, which best fits the requirements of packaging shelf stable food. Therefore, almost all
of the canned food is packaged by in this manner. But, special coatings, such as paints and clad layers are
required on the metal surface to help prevent corrosion. Metals such as aluminum, have high environmental
costs associated with their production (Piergiovanni et al., 2016). Toxic red mud (Bauxite tailings) is a big
problem when producing aluminum barrier layers in packaging (Ruyters et al., 2011). In additional,
recycling of metals involves significant amount of energy to re-melt and reform packaging. The metal
material itself together with surface processing makes metal a difficult option for food packaging. Steel
cans last in the environment a couple of decades while aluminum cans do not degrade if littered (Cerqueira
et al. 2017).
Plastics are low cost and most used packaging material in food industry. Plastic material has good
mechanical property, such as moderate strength and low density, which makes the package flexible, light
and portable. It also has low-permeability and good resistance for vapor and most of gases (Avella et al.,
2005). However, plastic is non-degradable and difficult to recycle; the difficulty in recycling comes from
the many different types of plastics that are in the packaging system that need to be sorted to obtain a usable
material (Siracusa et al., 2008; Cinelli et al.,2016). While many systems are in place to sort and recycle
plastics, many regions of the world do not have these systems. It is estimated that between 1995 and 2015,
there is more than 6300Mton plastic waste produced globally, only around 9 % has been recycled and 12 %
incinerated. Remaining 79 % of all plastic waste has been accumulated in either nature or landfills (Geyer
et al., 2017). Most plastic package material end up in landfills or worse the ocean. A recent study indicates

3
that there are 4.8 to 12.7 million metric tons (MT) of plastic waste entering the ocean annually (Jambeck et
al., 2015). Therefore, a recyclable alternative is desired and should include good barrier properties.
Researchers are trying to replace plastic with paper because paper is easy to recycle and is
biodegradable. However, plain paper is not used to protect foods for long periods of time due to its poor
barrier properties. Currently, paper is used for dry goods that need little shelf life (Cerqueira et al., 2017).
Durable barrier coating needs to be added on the paper surface to improve paper barrier properties and
tearing strength and toughness (Marsh et al., 2007).
Barrier coatings are pervasive in packaging industries. Current materials employed as the basis of
barrier coatings are typically derived from non-renewable resources such as PE. Usually, the polymers are
molten and extruded onto a substrate at high temperature. Extrusion coating is a versatile coating technique
and has been used for the economic application of various plastics onto paper or other substrate in the past
few decades (Kuusipalo, 2000).
PE extrusion coating on paper or paper board is a primary coating used for coffee cups, juice containers,
and take-out food containers (Cheng et al. 2015). This economical coating shows excellent advantage over
other package materials. Usually the adhesion ability between paper and coating depends on extruding
temperature and the surface energy of the paper (Kuusipalo, 2000). Extrusion coatings can improve the
mechanical property and barrier properties of paper or paperboard dramatically (Cheng et al. 2015).
Moreover, it is friendlier to the environment than plastic package material (Marsh et al., 2007). All the
advantages make extrusion paper coating play an important role in food package. However, it is difficult to
recycle PE coated paperboard which remains in the landfills after the decomposition of the substrates. These
papers are difficult to recycle because the PE needs to be separated from the fibers (Cinelli et al. 2016;
Kaiser et al., 2017; Cheng et al., 2015). This separation results in some fibers being mixed with the PE,
which then has little value and is often sent to waste. In addition, PE coated paper does not degrade rapidly
in the environment. The accumulation of PE coating will cause serious effects on our environment and

4
wildlife (Siracusa et al., 2008). These drawbacks have limited the complete implementation of extrusion
coatings on paper and have failed to address all the disposal concerns of packaging (Cheng et al.,2015;
Kuusipalo, 2000; Siracusa, 2008). There is a need for packaging systems that are low cost, have good
performance, can be recycled, and if they end up in the environment, will decompose (Marsh et al. 2007;
Avella et al. 2005).
Water borne barrier coatings can address environmental disposal concerns, recycling challenges, and
production challenges associated with extrusion coated paper. These paper products can be recycled with
the paper stream and will break down in the environment if littered (Ryan et al., 2003; Arai, 2000). In
addition, these coatings can be applied at higher speeds compared to extrusion coating. These coatings are
usually consisting of cold-water insoluble polymer that reacted to permeating molecule resistance, such as
oil (Jabar Jr et al., 2010). Pigments were often added into the polymer (Andersson, 2008) to improve the
barrier performance by tortuous path of water vapor (Figure 1.1) as well as the cost effectiveness of paper-
based packaging (Rissa et al., 2002; Vähä-Vähä-Nissi and Savolainen, 1999). Adding pigments also
improves repulpability, optical properties, and cost efficiency without sacrificing the barrier properties
(Husband et al., 2009). In addition, pigments would overcome the blocking problem (Zou et al., 2007;
Johansson et al., 2002), which is the adhesion of the barrier layer to the other side of the paper when the
paper is wound up in a roll.
Figure 1.1 Mechanism of barrier improvement by fillers or nanocomposites. (Andersson, 2008)

5
To form packaging such as bags or boxes, some parts of the sample need to be folded. Folding of the
barrier coatings is expected to compromise the barrier properties, but few have reported on this issue. Jabar
Jr et al. (2010) prepared a stable aqueous barrier coating composition that had a good oil or grease resistance
before and after packaging, the formulation consisted of prolamine, cold water insoluble polymer, water,
water-soluble co-solvent and stabilizer. Vähä-Nissi and Savolainen (1999) studied the change in grease
resistance of folded water borne barrier coatings. The grease resistance of these samples decreased after
both 30° and 180° folding operations. No publications have reported on the water vapor barrier performance
of these systems after folding to our knowledge. More research is needed to understand the chemical and
mechanical parameters that affect the crack resistance of coating. The aim of this research is to generate a
better understanding of the bending event and the mechanics for pigmented barrier coatings that will help
design barrier coatings that minimize crack formation and still perform after a folding operation.
1.2 Water borne barrier coatings
Recently, water-borne polymers have been proposed to be use for paper barrier coatings. Compared
with conventional extrusion coating, water borne barrier coating is friendlier to environment and easier to
use (Ryan et al., 2003; Arai, 2000). Water borne barrier coatings are often a latex based suspension with a
plate like pigment and other additives. The latex acts as a binder, which should form a continuous film
after drying due to the latex film formation. The pigments in the latex film generate a tortuous path that
blocked the pathway for water vapor or other molecules. These coatings are different from typical
pigmented paper coatings that are formulated at low latex content: the latex content of these barrier coatings
are typically between 60 wt.% and 80 wt.% after drying (Brown et al., 1997). Currently, these coatings
have limited use in the market because of the cost advantage of extrusion coated paper and the challenge to
obtain high quality barrier properties with these systems.

6
Plate-like mineral pigments are added to improve barrier properties of coatings (Vähä-Nissi and
Savolainen, 1999). Although using mineral pigments in water borne barrier coating to improved barrier
properties has been proposed (Schuman et al., 2005), there are some challenges that need to be overcome.
How the formulation and characteristics of pigment filled barrier coatings affect barrier properties has
been well studied. Good suspension stability is essential for good coatings, since stability yields uniform
dispersion of pigments in the latex. Furthermore, pigments must possess strong compatibility with the latex
polymer (Arai, 2000; Rissa et al., 2002). Pigment parameters such as the pigment type, size, shape, aspect
ratio and pigment volume concentration (PVC) have been shown to significantly affect the barrier
properties of coatings.
The work of Vähä-Nissi and Savolainen (1999) showed that coatings with larger pigments had
improved barrier properties, and clay had better water vapor barrier properties than Ground Calcium
Carbonate (GCC) because of its higher aspect ratio that could block the pathway of water vapor or other
molecules by tortuous path. Similarly, talc pigments with high aspect ratios had a decisive role on the
WVTR of a pigmented dispersion coated paper (Rissa et al., 2002). The work of Zou et al. (2007) supported
the results of Vähä-Nissi and Savolainen (1999) as the irregular structure of GCC led to worse water vapor
resistance than coatings with clay. Additionally, they showed that if clay was calcined to decrease the aspect
ratio, the water vapor barrier properties decreased. Improving barrier properties with pigments having plate-
like shapes and high aspect ratios was further confirmed by the studies of Schuman et al (2005) on
paperboard. The delaminated kaolin clay with higher aspect ratio gave a slightly lower WVTR value than
talc; however, the clay hydrophilicity may improve water solubility in the coating counteracting some of
the effects from the platy shape (Schuman et al., 2005). Though aspect ratio of the pigments appears to
have a significant effect on the barrier properties of coatings, Sun et al. (Sun et al., 2007) demonstrated that
the pigment dispersion is critical, and that surface area of the pigment may correlate with barrier properties.
Thus, simply using platy pigments does not necessarily guarantee good barrier coatings.

7
Previous work has demonstrated that increasing PVC values above 40% and the critical pigment
volume concentration (CPVC) leads to worse barrier properties and a more porous structure (Bollström et
al., 2013). CPVC can be defined as the point at which there is just sufficient binder to provide a completely
absorbed layer on the pigment surface as well as all the interstitial spaces between the pigment particles in
a close-packed system. Bollström et al. (2013) studied the mechanisms behind the formation of water borne
barrier coatings and found that barrier properties were affected by thickness and evenness of the coating as
well as the mass ratio of latex and pigments. Barrier properties were improved with increased tortuosity,
which can be affected by the particle type, volume concentration, size, shape, and orientation (Bollström et
al., 2011). They investigated the alignment of mineral particles by focused ion beam imaging (Figure 1.2).
The results showed that pigments with higher aspect ratio give a higher alignment of particles that improved
the tortuosity (Bollström et al., 2013). Similarly, pigment orientation was studied by adding kaolin into
Polyvinyl alcohol (PVOH) and the results showed that kaolin orientation affected the oxygen barrier
properties. The orientation parallel to the basal plane is good to the barrier properties. This orientation was
influenced by drying temperature, sample thickness, and kaolin concentration. Since pigment selection,
loading, and formulation can affect barrier properties, understanding how a pigment performs affects barrier
properties is critical to addressing challenges in dispersion barrier coatings (Nyflott et al., 2016; Nyflott et
al., 2017).
Figure 1.2 Focused ion beam images showing the alignment of the kaolin particle filled latex barrier layer;
A: blade coated platy kaolin (shape factor 100) /styrene-acrylate latex (PVC 57), coating grammage 19
g/m², B: blade coated fine kaolin (shape factor 30) / styrene-acrylate latex (PVC 57), coating grammage 14
g/m². The inserted images show, schematically, the longer pathway for liquid to penetrate the highly aligned
platy kaolin coating structure, compared to the pathway through the lower shape factor kaolin structure
from (Bollström et al., 2013).

8
In addition to pigment parameters, the latex properties also affect the barrier properties. Latexes with
lower glass transition temperatures (Tg) or low modulus materials tend to have better barrier properties (Zou
et al., 2007; Bollström et al., 2013). Latex particle size may also have an effect, as Brown et al. (1993)
suggested pigments distribute better with smaller latex particles. The work of Schuman et al. (2005)
suggests that an optimal Tg or polymer mobility may exist. They crosslinked styrene–butadiene (SB) latex
polymers to different degrees and observed that increasing the cross-linking (decreased mobility) lead to
lower WVTR values and that Tg values significantly below room temperature made the water vapor
resistance worse. However, for latexes with Tg values significantly above room temperature, microcracks
formed, which created pathways for water transport and significantly a worse water vapor barrier. These
previous studies demonstrate how various components of a barrier formulation affect results, but most work
was focused on flat samples before folding.
1.3 Cracks of barrier coatings when folded
Paper or paperboard with barrier coatings would be folded when packaging. Crack is expected to be
formed and compromise the barrier properties. Figure 1.3 shows an example of cracking at the fold for a
publication grade coating. Vähä-Nissi and Savolainen (1999) studied the grease resistance of barrier coating
after folding, the result was shown in Figure 1.4. They reported that the grease resistance of paper with
barrier coating decreased after folding; this result is not a surprise because folding has the potential to
produce cracks in the barrier layer. Demer (2014) reported the effect of added lignin and an ice templated
lignin particle into a barrier coating on the grease resistance of folded and un-folded samples. The ice
templated lignin is a flat particle that may be flexible. The grease barrier properties were still excellent even
after folding for the coating that contained the template lignin. While the exact mechanism for this result
is not clear, it leads to the hypothesis that flexible barrier pigments may help prevent cracking during a
folding event. While these results were interesting, the method to produce these pigments may not be
economical because they involve the freezing and freeze drying of lignin solutions. No publications have

9
reported on the water vapor barrier performance of these systems after folding to our knowledge. The
moisture barrier properties are important for many foods that need to stay dry in storage.
Figure 1.3 Cross section of different coating formulations with cracking at the fold issue (Oh et al., 2015)
Figure 1.4 Grease penetration of plain SB-based dispersion coated paperboard as function of time (Vähä-
Nissi and Savolainen, 1999).

10
Though folding of barrier coatings has limited studies, the crack formation of publication grade paper
coatings has been widely studied by experiments and numerical simulation and gives a basis for the
expected behaviors of barrier coatings. The mechanical properties of publication grade coatings depend on
the pigment type, size and shape, the binder type, pigment packing method and concentration of latex binder,
which all affect coating structure (Najafi et al. 2018; Vidal et al., 2006). The relationship between coating
fold-crack resistance and mechanical properties of coatings were studied by several groups. Prall et al.
(2000) and Zhu (2013) have studied the relationship between mechanical properties of pigment coating and
characteristics of pigment and latex. They found that tensile strength was increasing with increasing
pigment volume concentration to a maximum at the critical pigment volume concentration, and then
decreases as little binder is in the system. The latex would be flexible if its glass transition temperature Tg
is much lower than room temperature (Tirumkudulu et al., 2005). It means that the latex is in a rubbery
state in room temperature that makes the latex flexible and not brittle. Rättö et al. (2011) analyzed coated
and creased samples by SEM cross sections. They found that smaller particles adhered better to the latex
than larger ones, and cracking was caused by poor adhesion. They also found that the cracking directions
in GCC based coating were different with the cracking directions in clay-based coating. By numerical
simulation, they concluded that the cracking of the clay-based coatings was probably due to anisotropic
mechanical properties combined with shear stresses or out-of-plane tensile stresses during creasing.
Also, small particle size latex has been shown to improve the pigment-latex adhesion by Kim et al.
(2010). They found that coating shows high resistance to cracking when the coating contained the low Tg
and small particle size latex. While the substrate he used is double- coated printed paperboard and the
coating was not a barrier coating, which was printed with a laboratory printer. Additionally, others found
that binder compositions can change crack resistance by observing that increased starch content decreased
the tensile strain to failure and increased the crack area for a starch-latex coating. These authors also found
that interfacial debonding between calcium carbonate and the latex-starch binder was the main failure
mechanism (Najafi et al. 2018).

11
Not only does the coating formulation affect crack formation, but additional influences exist from the
paper substrate (Sim et al., 2012; Kim et al., 2010), coating thickness (Barbier et al., 2005; Huang et al.,
2014) and folding method (Nagasawa et al., 2015). Sim et al. studied the effect of pulp fiber composition
and beating on folding cracking of publication grade coatings. They found that cracks were affected by
mixing ratio of pulp fibers that influence the mechanical strength of paper: increasing paper mechanical
properties resulted in an increase in crack formation during folding (Sim et al., 2012). Additionally, for
paper, the machine direction (MD) folds were poor compared to cross direction (CD) folds, shorter cracks
were seen in CD compared to MD Kim et al. (2010).
The research summarized above studied cracks of grade paper coatings when folded by experiments
or combine of experiment and simulation. The research indicated when folded, publication grade paper
coatings would have a better crack resistance if they have: lower Tg and smaller particle size latex; smaller
particles adhered better lead better crack resistance; thinner substrate and coatings. Additionally, for paper,
the machine direction (MD) folds were poor compared to cross direction (CD) folds. While there are several
parameters that were not studied by experiments, further studies are needed by numerical simulations.
1.4 Modeling
A paper coating layer can be considered as a composite structure that containing paper, latex and
different types of pigments. Various numerical models have been used to study mechanical properties of
paper coating with different paper, latex and pigments.
Barbier et al. (2005) modelled the base paper as an anisotropic elastic–plastic material accounting for
both elastic and plastic anisotropy by a finite element method (FEM) and they mentioned the coating film
thickness and the plastic behavior of binder (latex) can be a key in a model prediction and should be
considered. In another study (Barbier et al., 2004), they tried to incorporate the anisotropy of the mechanical
properties of the base paper through FEM modeling to have a better understanding of anisotropic behavior
on the folding strains. Two-dimensional modeling (MD and out of plane directions) was confined in their

12
model by stiffening the MD direction. In their model, the longitudinal strains and the normal strains in the
thickness direction reduced comparing the case where high elastic anisotropy was not considered. The
influence from anisotropy was important and depend on the paper materials.
Alam et al. (2009) has studied the relationship between coating fold-crack resistance and bending
stiffness by FEM to seek a balance between the fold-crack resistance and stiffness of coating layer without
pigments. They found high Tg binders will increase the elastic modulus of the coatings, the bending stiffness
of coated papers increases as a linear function of the coating elastic modulus, and higher stiffness usually
results in a higher risk of fold cracking. Obviously minimizing the elastic modulus of the coating could
decrease cracking. It means that latex with low Tg would be better for crack resistance.
Pigment type and shape significantly affect coating modulus. For example, platy clay pigments form
a higher modulus coating than the calcium carbonate-based pigments (Lepoutre et al., 1989). Husband et al.
investigated the influence of kaolin particle shape factor on the tensile strength of coating layers, they found
that the coating stiffness increased as the pigment shape factor increased when pigments were the same size
(Husband et al., 2006). Azadi et al. (2008) modeled the mechanical response of a coating layer containing
mineral pigments under compression. In the model, spherical pigments and latex particles with different
size distribution were randomly arranged in a packed box. They found that pigments with a narrow size
distribution yielded stiffer coating structures than pigments with a broad size distribution. Coatings with
higher modulus pigments and latexes consequently had a higher modulus. In another paper (Azadi et al.;
2008) a discrete element method modeled the stress–strain behavior of coating layers during compression
using spherical (GCC), platy (clay), and needle-like (PCC) particles with mono- and poly-disperse sizes.
Monodisperse platy pigments formed a lower modulus coating layer than monodisperse needle-like and
spherical pigments. However, for poly-disperse pigments, coatings made using platy particles had the
highest modulus. These results demonstrate that pigment shape and sizes can significantly affect coating
properties. they use same discrete element method to model the stress–strain behavior of coating layers
during the compression. Spherical, platy, and needle-like particles, representing GCC, delaminated clay,

13
and PCC pigments were added in small latex particles. For each particle shape, structures formed by both
mono-sized pigments and poly-dispersed pigments. In the case of mono-sized pigments, all pigment
particles were in same size and the same aspect ratio, for poly-dispersed pigments, the particle size
distribution was divided into eight discrete size ranges. The stress–strain curve showed that for mono-sized
pigments, platy particles formed a softer coating layer (lower modulus) than needle-like and spherical
pigments. In the case of poly-dispersed pigments, coating layers made of platy particles was the stiffest.
Latex content and connectivity can also significantly affect coating mechanical properties. Kan et al.
(1996) demonstrated by dynamical mechanical spectroscopy (DMS) that coating storage modulus depends
on the latex microstructure, concentration and type. Others found that the tensile modulus of coatings
consisting of latex and CaCO3 pigments reached a maximum at the critical pigment volume fraction and
then decreased when increased beyond this value (Alam et al., 2007). Rättö (2004) studied the influence of
porosity, the latex content, and the latex mechanical properties on the coating mechanical properties by
using a micromechanical model. A face centered cubic (FCC) packing of spherical particles was assumed
with latex bridges between the pigment. The latex bridges were cylinder with same radius and length. In
their model, the deformation could be achieved by compressing, shearing over the latex bridge and giving
bending moment over the latex bridges through particle rotation. Young’s modulus of coating was
calculated by latex modulus and shear and compressive strains after deformation. Results showed that the
mechanical properties of coating were affected by latex content, latex stiffness and porosity that depend on
interparticle distance and the diameter of the latex bridges. Coating with higher stiffness latex and low
porosity lead to an increase in modulus. This model gave insight into how interactions at the particle level
influence the macroscopic mechanical properties.
Barrier coating layers are different than the publication grade layers in that the pigment content is low
compared to the polymer content. Coating layers with low levels pigments may behave more like a filled
polymer composite, which have also been modeled in various ways (Lapčík et al., 2018; Seretis et al. 2019).
Lapčík et al. (2018) investigated the mechanical properties of composites prepared from platy shaped mica

14
and prism wollastonite in a polyethylene matrix and found that increasing fillers content increased the
Young's modulus. Both composites exhibited decreasing strain at break with increasing filler concentration
indicating a more brittle mechanical behavior in comparison to the virgin polymer matrix. The mechanical
properties of hollow glass microspheres (HGM) filled polymers were modeled and found that both tensile
strength and modulus decrease with the increase of volume fraction of HGM (Gupta et al., 2006). Adding
more HGM increased crack potential of the composite.
All of this work is focused on paper coatings use for publication grades which have a significantly
higher PVC than barrier coatings; little has been published around the mechanical properties of barrier
coatings. Work is needed to understand the parameters that lead to crack formation in barrier coatings
because cracks result in poor performance.
1.5 Summary
Few publications have studied the crack resistance of barrier coating. Most publications studied the
mechanical properties and the cracking of publication grade coatings that are at a high pigment volume
concentration. Models also have been setup by previous research to study the mechanical properties of
publication grades paper coatings. Previous research above indicated that the publication grade coating
shows high resistance to cracking when the coating contained the low Tg and small particle size latex (Kim
et al., 2010; Tirumkudulu et al., 2005). High Tg binders will increase the elastic modulus of the coatings,
that lead higher stiffness and usually results in a higher risk of fold cracking (Alam et al., 2009). The
stiffness also increased with increasing pigment volume concentration (Prall et al., 2000; Zhu, 2013).
Smaller particle size latex and smaller pigments led to better adhesion that reduce crack potential (Kim et
al., 2010). Coating stiffness increased as the pigment shape factor increased when pigments were the same
size (Husband et al., 2006). Platy clay pigments form a higher modulus coating than the calcium carbonate-
based pigments (Lepoutre et al., 1989). The crack resistance of publication grade coating was also
influenced by the paper substrate (Sim et al., 2012; Kim et al., 2010), coating thickness (Barbier et al., 2005;

15
Huang et al., 2014) and folding method (Nagasawa et al., 2015). The different parameters that were
expected to influence the crack resistance of the publication grade coating were studied well and
enlightened the barrier coatings study. There is a hypothesis that adding flexible pigments could improve
the crack resistance of coatings and the flexibility of particles is related with the shape of particles and their
composition. A systematic study of the paper, pigment and coating parameters on the barrier properties
before and after folding of water borne barrier coatings need to be done to verify the hypothesis. Simulation
work need to be setup to study the mechanism of the crack generation during folding.
1.6 Thesis structure
The objective of this thesis project is to investigate barrier property reduction of paper coating caused
by folding, to better understand the mechanisms associated with the cracking of water borne barrier coating
layers when folded and to find out the key parameters that influence the crack resistance of coatings.
In chapter 2, the influence of systematic coating parameters on barrier property before and after folding
are studied by experiments to characterize the crack generation and mechanism of water borne barrier
coating during bending. Barrier properties and crack resistance are measured by the water vapor
transmission rate (WVTR) and the increased values of WVTR after folding. Coatings are made by different
pigments with different properties (e.g. size, shape, aspect ratio, concentration and modulus). WVTR of
coatings are tested before and after folding. Cracks microstructure are investigated by scanning electron
microscope.
In chapter 3, systematic coating parameters are modeled using a finite element method to understand
the influence of the paper and coating thickness, the latex and pigments modulus, shape, shape factor and
concentration of two different pigments on the stress and strain generation of water borne barrier coating
during bending. Experiments are performed to measure the curvature required to generate cracks in a set
of barrier coatings: these results are compared with the predictions of the model.

16
Further experiments are reported in Chapter 4 to report the influence of pigment properties on barrier
properties before and after folding. Pigments with similar size, aspect ratio but different modulus were
added into coatings, WVTR of these coatings before and after folding was tested. In addition, the influence
of the addition of a flexible latex and natural rubber into the formulation is characterized. The crack
resistances of barrier coatings were tested after adding pigments and latex with lower moduli to compares
with the simulation results and verify the hypothesis that adding flexible pigments could improve the
cracking resistance of coatings.

17
CHAPTER 2
THE INFLUENCE OF PIGMENT TYPE AND LOADING ON WATER VAPOR BARRIER
PROPERTIES OF PAPER COATINGS BEFORE AND AFTER FOLDING
2.1 Introduction
Plastics, glass, and metals are excellent materials for food packaging, but they are often difficult to
recycle and do not decompose easily in the environment. Paper based packaging often can be recycled, but
it needs a barrier coating in many applications (Marsh, & Bugusu, 2007; Avella et al., 2005). To this end,
polyethylene (PE) extrusion coatings are widely used for paper and paperboard applications that require
water resistance such as food packaging (e.g. milk cartons and coffee cups). These extrusion coatings can
improve the mechanical and barrier properties of paper or paperboard dramatically. However, these papers
are difficult to recycle because the PE needs to be separated from the fibers (Cinelli et al., 2016; Kaiser et
al., 2017). This separation results in some fibers being mixed with the PE, which then has little value and
is often sent to waste. In addition, PE coated paper does not degrade rapidly in the environment. These
drawbacks have limited the complete implementation of extrusion coatings on paper and have failed to
address all the disposal concerns of packaging (Cheng et al., 2015; Kuusipalo, 2000).
Water borne barrier coatings can address environmental disposal concerns, recycling challenges, and
production challenges associated with extrusion coated paper. These paper products can be recycled with
the paper stream and will break down in the environment if littered (Siracusa et al., 2008; Arai, 2000). In
addition, these coatings can be applied at higher speeds compared to extrusion coating. These coatings are
usually a mixture of latex and a pigment applied at high speed with blade or roll coaters. The use of mineral
pigments in water borne barrier coatings is known to improve the barrier performance as well as the cost
effectiveness of paper-based packaging (Rissa et al., 2002). Adding pigments also improves re-pulpability,
optical properties, and cost efficiency without sacrificing the barrier properties (Vähä-Nissi, & Savolainen,
1999; Husband et al., 2009). In addition, pigments will reduce the potential for blocking of the product

18
(Vyörykkä et al., 2011; Holik, 2006) which is the adhesion of the barrier layer to the other side of the paper
when the paper is wound up in a roll.
How the formulation and characteristics of pigment filled barrier coatings affect barrier properties has
been well studied. Good suspension stability is essential for good coatings, since stability yields uniform
dispersion of pigments in the latex. Furthermore, pigments must possess strong compatibility with the latex
polymer (Arai, 2000; Rissa et al., 2002). Pigment parameters such as the pigment type, size, shape, aspect
ratio and pigment volume concentration (PVC) have been shown to significantly affect the barrier
properties of coatings. Coatings with larger pigments had improved barrier properties (Vähä-Nissi and
Savolainen,1999), high aspect ratios of pigments also improve the barrier properties of coating (Rissa et al.,
2002) The hydrophilicity of pigments dereased the water vapor resistance of coating (Schuman et al., 2005).
Previous work has demonstrated that increasing PVC values above 40% and the critical pigment volume
concentration (CPVC) leads to worse barrier properties and a more porous structure (Bollström et al., 2013).
In addition to pigment parameters, the latex properties also affect the barrier properties. Latexes with lower
glass transition temperatures (Tg) or low modulus materials tend to have better barrier properties (Zou et
al., 2007; Bollström et al., 2013). Latex particle size may also have an effect, as Brown et al. (1993)
suggested pigments distribute better with smaller latex particles.
To form packaging such as bags or boxes, some parts of the sample need to be folded. Folding of the
barrier coatings is expected to compromise the barrier properties, but few have reported on this issue. In
fact, to our knowledge, only Vähä-Nissi and Savolainen (1999) studied the change in grease resistance of
folded water borne barrier coatings. The grease resistance of these samples decreased after both 30° and
180° folding operations. No publications have reported on the water vapor barrier performance of these
systems after folding to our knowledge. Though folding of barrier coatings has limited studies, the crack
formation of publication grade paper coatings has been widely studied and gives a basis for the expected
behaviors of barrier coatings (Najafi et al., 2019; Najafi et al., 2019). High Tg binders and high PVC results
in a higher risk of a crack at the fold (Alam et al., 2009; Prall, 2000; Zhu,2013). Rättö et al. (2011) found

19
that small pigments adhered better to the latex than larger ones and that cracks in the coating were caused
by poor adhesion. Also, small particle size latex has been shown to improve the pigment-latex adhesion
(Kim et al., 2010). Coating thickness (Barbier, 2004; Barbier et al., 2005; Huang et al., 2014; Sim et al.,
2012) and folding method (Nagasawa et al., 2015; Wiklund et al., 1997) also affected the crack resistance
of coatings. These studies were performed on publication grade coatings, which have a significantly higher
PVC than barrier coatings. Consequently, these findings may not be directly translatable to barrier coatings
requiring study into which of these parameters significantly influence crack formation in barrier coatings.
In this work, a systematic study of the pigment concentration and pigment shape on the barrier
properties of water borne barrier coatings is reported before and after folding of the sample. Several types
of pigments with different shape and concentration were dispersed into styrene acrylic (SA) latex to make
coatings. Water vapor transmission rate (WVTR) was tested before and after folding to study effect of
pigment shape and concentration on the retention of barrier properties after folding. The diffusivity of
coatings with different pigments before folding was calculated from the WVTR to compare formulations.
Scanning electron microscopy (SEM) was used to compare the microstructure of the coating before and
after folding to connect crack formation behavior to coating formulations and WVTR results. The bending
event was modeled with finite element methods to explore the difference of stress and strain between
spherical and plate like pigments in the coating layer.
2.2 Materials and methods
2.2.1 Coating method
The substrate used was 200 g/m2 paperboard obtained from Westrock with a thickness of 0.189 mm.
The latex was a styrene acrylic (SA) copolymer with a glass transition temperature of 21°C, a particle size
of 70-80 nm (Joncryl, BASF), and a solids content of 50%. Two kaolin pigments, a ground calcium
carbonate (GCC), and a plastic particle produced by the emulsion polymerization of styrene were used and
their properties are reported in Table 2.1. The kaolins and plastic particles were received as slurries that
20
were diluted to 50% solids before adding to the latex. The GCC was received dry and was dispersed in
water to make a 50% solids slurry before adding to the formulation.
Table 2.1 Pigments used and their properties as reported by suppliers.
Pigment Particle Size
(wt% < 2 μm)
Aspect ratioa Supplier
Kaolin A 80% 25 BASF
Kaolin B 64% >90 IMERYS
GCC 90% 1 OMYA
Plastic particle 100%b 1 DOW
a Supplier reported aspect ratio or shape factor (Kaolin B) is the ratio of the platelet diameter to the thickness.
b Plastic particle size was a narrow size distribution with 0.5 μm average diameter.
The formulations were prepared by mixing latex and one pigment slurry at different volume ratios as
summarized in Table 2.2. Per 100 mL of latex/pigment mixture, 1.4 mL dispersant (Dispex N 40V, BASF),
2.5 mL lubricant (Calsan 50, BASF), 0.06 mL defoamer (Rhodoline 635, BASF), and 0.09 mL thickener
(Sterocoll FS, BASF) were added into the mixture. The final solids content of all formulations was kept at
50%. The formulation was stirred by a mechanical stirrer for four hours and let to sit at room temperature
overnight prior to coating. The coating was applied with a rod draw down coater (BYK-Gardner, 2101,
USA). A range of coating weight from 5 to 60 g/m2 was obtained by changing the gap distance between the
plane and the grooved rod. For all experiments, the rod speed was kept at 0.254 m/s. Once the coating layers
of the different samples were generated, they were immediately put in an oven at 105 °C for five minutes.
The resulting dried films on substrates were left to sit overnight in a controlled humidity (50%) and
temperature (25 °C) room.
Table 2.2 Latex and pigment volume ratios investigated
Ingredient Ingredient volume percentage on a dry weight basis
SA latex 85% 80% 70% 60%
Pigment 15% 20% 30% 40%

21
2.2.2 Water vapor transmission rate (WVTR) measurement
The moisture barrier property of the coating was measured according to ASTM E 96/E96M-10 to
determine the water vapor transmission rate (WVTR).The samples were placed in a controlled humidity
(50%) and temperature (25 °C) room for 24 hours before testing. The coated sample was prepared as a 70
mm diameter circle by using a commercial circle cutter with the blade kept sharp to minimize cracks at the
cut region. Each circle was placed over an open face jar and was mechanically sealed around the perimeter
with silicone seals. Each jar contained 25 mL of distilled water, which represents 100% relative humidity
inside. The test system was placed in a controlled humidity (50%) and temperature (25 °C) room for 24
hours. The mass difference over a measured period was determined and then divided by the open area and
time elapsed to determine the WVTR.
From the WVTR, the effective diffusion coefficient of the coating for water vapor was determined to
show the intrinsic water vapor barrier behavior of the coating (Ramarao et al., 2003; Gupta, & Chatterjee,
2003). The effective diffusion coefficient of the coating in this thesis is the effective diffusion coefficient
for water vapor. It was calculated following the method of Chatterjee et al (1997). Four major resistances
exist for water vapor transmission: the stagnant layer of air between the water surface and the bottom
surface of the paperboard, the paperboard itself, the barrier coating, and the air boundary layer on top of
the coating. By assuming that water vapor transmission in paper and coatings follows Fick’s law and steady
state conditions, the total flux of water vapor (J) can be described as:
J =(Co − Cb)
LDw
+Hp
Dp+
HcDc
+1K
(2.1)
where J (mol/m2 s) is the flux of water vapor, calculated from the WVTR, Dw (m2/s) is the diffusion
coefficient of water vapor in air at the experimental temperature and pressure, L (m) is the thickness of the
stagnant air layer between the sample and the water, Dp and Dc (m2/s) are the effective diffusion coefficient
of paper and coatings, respectively, and Hp and Hc (m) are the paper and coating thickness, respectively.

22
The term effective diffusion coefficient is used because the calculated diffusion coefficients really include
the solubility parameter combined with the diffusion coefficient. Co and Cb (mol/m3) are water vapor
concentration in the jar and the air, respectively. K (m/s) is the mass-transfer coefficient outside the jar at
the experimental temperature and pressure.
Here, L, Dw, Hp, Dp, and K are constants. For systems with a good water vapor barrier, the resistance
to mass transfer should be in the paper and barrier layers; therefore, the resistance in the gas phase in the
jar and on the other side of the jar were neglected. C0 and Cb were calculated from the vapor pressure of
water under the test conditions. The theoretical thickness of the coating (Hc) was calculated from the coat
weight and the density of the coating layer. Here, the coating layer was assumed to be uniform in thickness
and did not penetrate into the paper. Though this does not represent the actual system where coating
penetrates into the base paper, it reduces the number of assumptions required for the calculation and should
be somewhat consistent between formulations since the same base paper was used. The actual coating
thicknesses are expected to be higher than the theoretical since the packing of pigments and latex do not
form perfect films. The thickness of the paper came from caliper measurements. Dp was calculated from
running the WVTR experiment on the uncoated paperboard. With these measurements and assumptions,
the effective diffusion coefficient of the coating (Dc) was calculated from the WVTR experiments on coated
samples.
2.2.3 Sample folding procedure
To fold the samples, six orthogonal and evenly spaced folding lines were made on each coated sample
corresponding to lengths of 6 and 7 cm as shown in Figure 2.1a. One folding line was made at a time with
the coating on the outside of the fold. By folding with the coating on the outside of the fold, the crack
damage was maximized to create larger differences between WVTR values for folded and unfolded samples.
For each fold, the paper was manually folded at 180° and then 4200 Pa pressure was applied for five minutes
to create a fold. Six folding lines were used to increase the WVTR difference between folded and unfolded
samples as compared to a single fold. As an example, Figure 2.1b shows the WVTR values of different

23
coating weights before folding, after folding with one folding line, and after folding with six folding lines.
From the WVTR results, folding the sample six times gave a clear increase in the WVTR for this test. These
figures show that the base sheet is damaged to some extent in folding as the WVTR of the uncoated sheet
increases around 10%.
Figure 2.1 a) Schematic of orthogonal folds made in coated samples. Arrows indicate the lengths of fold
lines. b) WVTR results of coatings using 15% PVC kaolin A before folding (black squares), after one line
of folding (red circles), and after six lines of folding (blue triangles).
2.2.4 Coating crack characterization
To compare the coating cracks after folding, a scanning electron microscope (Hitachi, TM 3000) was
used to take SEM images of the coating surface. Coatings made with different pigments at 15% and 40%
PVC and at 25 g/m2 coat weights were folded as described above. Samples along the fold were cut from
the paper to give a 1 cm2 square and attached with carbon tape to a SEM stub. Images were taken at 60X
magnification and at 5 kV acceleration voltage. The number of cracks per image, crack width, and crack
area per sample length were obtained via graphical analysis of the SEM images by using AutoCAD and
ImageJ. In AutoCAD, 10 parallel lines with gap of 10 mm were drawn in the SEM images perpendicular
to the major crack orientation. The number of cracks intersected by each line was counted and the width of
each crack was measured. For each type of coating, the mean and standard deviation values for the number
of cracks per image and width were computed based on the data from the ten sampling lines.
b)a)
7 cm
6 cm
6 cm

24
The total crack area was measured in a sampling area (1.5 x 2.6 mm2, 461 pixel x 798 pixel, 3.9 mm2)
on SEM images using ImageJ where the sampling area contains most of the cracks. The sampling area was
converted to an 8-bit binary black-white figure and crack edges were highlighted by setting up appropriate
gray-level thresholds. Crack area was measured by counting pixels within the crack. For each type of
coating, crack area per length, total crack area per sampling graph length (2.6 mm), was reported. The crack
area was also calculated by the difference of WVTR before and after folding assuming that the change in
this value is due to more area available for diffusion that has resistance of just the paper with no coating.
After folding, the sample will have some area fraction that consists of cracks, xc, and some area that is the
original coating and paper. Assuming that the WVTR in a no-crack section is the same as the WVTR of the
coated board before folding and the WVTR of a crack section is the same as that of the paper substrate
alone, the WVTR value of the folded sample must be a sum of these two types of area expressed as
WVTR = (1 − xc)Wu + xcWp (2.2)
where Wu and Wp are the WVTR of the unfolded sample, and paper, respectively. The total area, Ac, of the
sample that represents cracks was estimated from xc and compared with the crack area measured by SEM
and ImageJ.
2.2.5 Bending simulations
To better understand the influence of pigment shape on crack formation, paper bending simulations were
conducted using a finite element code (COMSOL, multi-physics) to study the crack mechanism in paper
and coating during folding. The purpose of this part was to not simulate the bending event in detail, but to
understand in concept how the stress and strain fields develop for different pigment geometries. A 2D
planar strain model of paper with a latex layer that contains pigments was set up. The PVC was set to 15%
and 40% when assigning the number of pigments in the geometry. The models were fixed at one end and
a line distributed load was applied to the other end until the bending angle reached 5°, as shown in Figure
2.2. Model input parameters are shown in Table 2.3. These values are estimates made to help understand
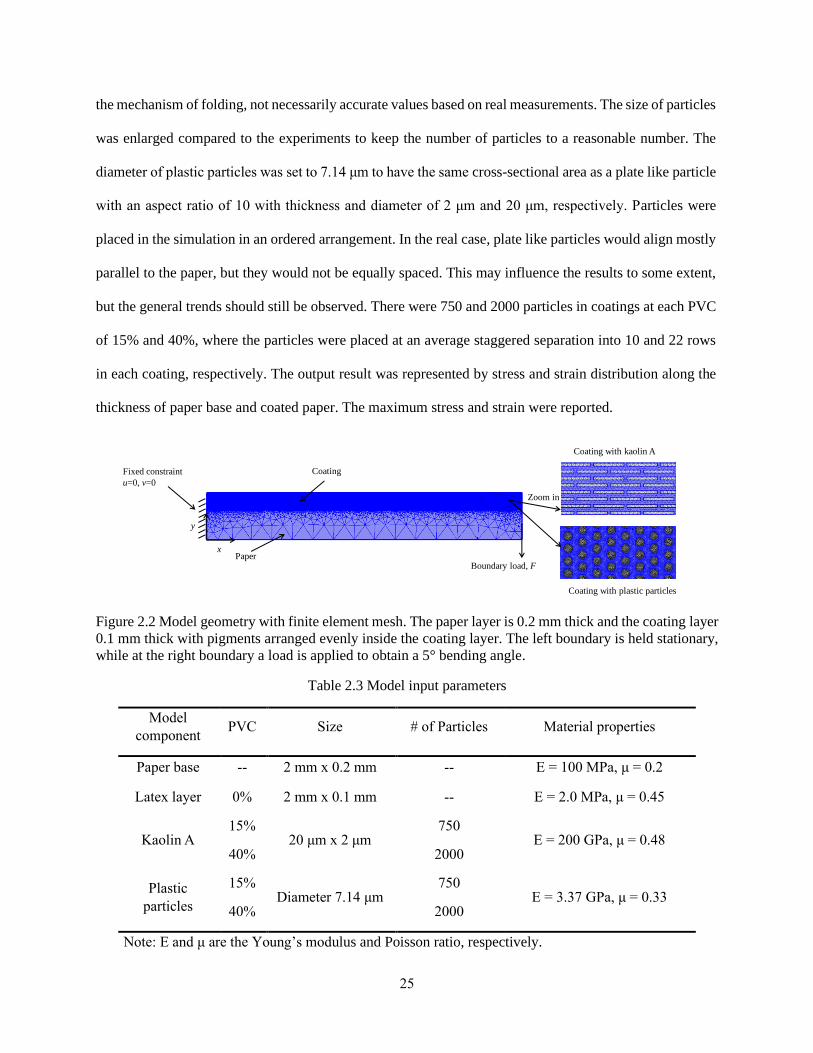
25
the mechanism of folding, not necessarily accurate values based on real measurements. The size of particles
was enlarged compared to the experiments to keep the number of particles to a reasonable number. The
diameter of plastic particles was set to 7.14 μm to have the same cross-sectional area as a plate like particle
with an aspect ratio of 10 with thickness and diameter of 2 μm and 20 μm, respectively. Particles were
placed in the simulation in an ordered arrangement. In the real case, plate like particles would align mostly
parallel to the paper, but they would not be equally spaced. This may influence the results to some extent,
but the general trends should still be observed. There were 750 and 2000 particles in coatings at each PVC
of 15% and 40%, where the particles were placed at an average staggered separation into 10 and 22 rows
in each coating, respectively. The output result was represented by stress and strain distribution along the
thickness of paper base and coated paper. The maximum stress and strain were reported.
Figure 2.2 Model geometry with finite element mesh. The paper layer is 0.2 mm thick and the coating layer
0.1 mm thick with pigments arranged evenly inside the coating layer. The left boundary is held stationary,
while at the right boundary a load is applied to obtain a 5° bending angle.
Table 2.3 Model input parameters
Model
component PVC Size # of Particles Material properties
Paper base -- 2 mm x 0.2 mm -- E = 100 MPa, μ = 0.2
Latex layer 0% 2 mm x 0.1 mm -- E = 2.0 MPa, μ = 0.45
Kaolin A 15%
20 μm x 2 μm 750
E = 200 GPa, μ = 0.48 40% 2000
Plastic
particles
15% Diameter 7.14 μm
750 E = 3.37 GPa, μ = 0.33
40% 2000
Note: E and μ are the Young’s modulus and Poisson ratio, respectively.
Fixed constraint
u=0, v=0
Boundary load, FPaper
Coating
x
y
Zoom in
Coating with plastic particles
Coating with kaolin A

26
2.3 Results and discussion
Coatings using the four pigments were made on paper board using various PVCs and coat weights
prior to making WVTR measurements. Figure 2.3 presents the WVTR results for these coatings before and
after folding, where smaller WVTR values mean increased water vapor resistance. WVTR values were
compared as a function of latex weight instead of coat weight because latex weight is a better indication of
the final cost of the barrier coating due to the relatively higher cost of latex as compared to pigments. In
Figure 2.3, the WVTR decreased due to pigment addition as compared to pure latex. However, for the
plastic particle pigments, only at lower PVC values did the WVTR improve beyond a pure latex coating.
The most significant elevation in WVTR beyond that of latex was observed at 40% PVC for these pigments
at all coating latex weights.
As expected, the WVTR of coatings decreased with increasing of latex weight (Figure 2.3). The initial
decrease is rapid as the barrier coating fills in the pores or passages for water vapor transmission. At high
coat weights, the decrease is gradual as all the large pores are now covered and only the barrier coating
thickness increases, increasing resistance to water vapor as expected in Eq. (2.1). As a result, the fit for Eq.
(2.1) best described the higher latex WVTR results for all pigments and PVCs. At low latex weight, the
platy kaolin pigments cause the WVTR to decrease significantly as compared to pure latex. The lower
aspect ratio GCC and plastic particles require higher latex weights before the WVTR values improve over
latex, suggesting that these two pigments negatively affect film formation and prevent coverage that is
equivalent to pure latex. At latex weights above 20 g/m2, the GCC and plastic particle pigments have WVTR
values similar to the kaolin pigments, which indicates that whatever coating formation issues that may exist
can be overcome with a thicker coating.
Increasing the PVC is expected to decrease the WVTR to a point as the pigments increase the tortuosity
of the coating layer. The kaolin pigments mostly follow this behavior, though at latex weights greater than
15 g/m2 all PVCs gave essentially the same WVTR values. The GCC and plastic particle pigments appear
to have an optimum at around 20%, that gives the lowest WVTR results (Figure 2.3). Increasing the PVC

27
beyond this led to higher WVTR values, especially for the plastic particle samples, as the WVTR is higher
than pure latex when the PVC is 40%. This PVC still should be below the critical pigment volume
concentration (CPVC), which leads to film forming issues, but some pores or channels must still be forming
in the coating layer at 40% PVC plastic particles. Perhaps bubbles formed in the coating due to surfactants
present in the plastic particles from the emulsion polymerization process used to make them. The WVTR
behavior of the different pigments do confirm previous literature results as the highest aspect ratio pigments
have the lowest WVTR values.
Effective diffusion coefficients for each coating were calculated for each data point using Eq. (2.1) to
provide a comparative number that describes the relative water vapor resistances of each coating while
considering coating thickness (see Figure 2.4). In theory, this coefficient should not be a function of coat
weight. As expected, all effective diffusion coefficients of coatings were much less than that of paper
(1.6x10⁻⁷ m2/s), demonstrating that coatings significantly slow water vapor diffusion. The paper has
micrometer size pores that allow for the easy transport of water vapor through the structure. When there is
sufficient coating, the pores are closed, and water vapor must diffuse through the polymer – pigment
composite. The effective diffusion coefficient of coatings was higher for lower coating weights than the
high coat weights because at low coat weights, the coating layer is not a uniform film as assumed in the
development of Eq. (2.1). At high coat weights, the value does tend to level to a constant value for all
pigments and PVCs. Even at high latex weights, the plastic particles have an effective diffusion coefficient
on the same order of magnitude as the kaolin pigments. These results indicate that at low coat weights,
defects in the barrier layer such as fine pin holes exist, which increases the WVTR.

28
Figure 2.3 WVTR values of coatings with different pigments before and after folding for various latex
weights and PVCs. In all plots of WVTR, values of latex only coatings (black squares) are given as a
reference. The various PVCs are 15% (red circles), 20% (blue up triangles), 30% (purple down triangles)
and 40% (green diamonds). Lines are from fitting the data to Eq. (2.1).

29
Figure 2.4 Effective diffusion coefficient of latex only (black squares) coatings and coatings with different
pigments at 15% PVC (red circles), 20% PVC (blue up triangles), 30% PVC (purple down triangles), and
40% PVC (green diamonds).
To compare the different formulations, an average of the effective diffusion coefficient was calculated
for coatings with different pigments at 15 - 25 g/m2 latex weight as reported in Figure 2.5a and compared
to pure latex (0% PVC). For the plastic particles, these values increase with higher pigment loading. An
effective diffusion coefficient greater than latex further confirms that coating formation issues exist for
plastic particles at these PVC loadings. For example, pinholes could be forming and allowing water vapor
transport. The other pigments do not show this increasing trend and the average effective diffusion
coefficient of kaolin A and kaolin B are significantly lower than the other pigments, as expected, due to
their high aspect ratio. Figure 2.5b gives the effective diffusion coefficient by fitting Eq. (2.1) to the entire
data set. The fit values are a little lower than the calculated average value in Figure 2.5a, which may be due
to the fit favoring the higher weight latex coating values rather than only 15 - 25 g/m2 latex weight range,
but in general confirms that the behavior observed in the 15 – 25 g/m2 latex weight range is representative
of the entire range of latex weights investigated.

30
Figure 2.5 a) Average of effective diffusion coefficient of coatings with different pigments with 15-25 g/m2
latex weight as a function of PVC. Error bars indicate one standard deviation. b) Effective diffusion
coefficients calculated from fitting all WVTR data as a function of PVC. Error bars indicate the square root
of the covariance of the fit value. Data points of 0% PVC showed result of coating with latex only when
latex weight was 15-25 g/m2.
The coated paperboard was folded and the WVTR of all coatings significantly increased as shown by
the right-hand graphs in Figure 2.3. For example, the WVTR of a coating with 15% PVC kaolin A and 20
g/m2 latex weight were about 25 and 110 g/(cm2 day) before and after folding, respectively. Figure 2.6a
summarizes the significant increase in WVTR after folding by examining the increase in WVTR relative to
the unfolded sample. For a latex weight range of 15 – 25 g/m2, all folded samples had at least twice the
WVTR values as compared to the original samples. Of the pigments, the plastic particles had the smallest
increase. An increase in WVTR upon folding was expected because of the potential for the folded region
to crack as the coating layer will see extensive tensile deformation. If this deformation is larger than the
strain at failure of the coating, the coating layer will crack. This result may not hold for other polymer types
if the properties of other polymers have a larger strain at failure.
To further compare the results before and after folding, Eq. (2.1) was used to fit the WVTR data after
folding to calculate effective diffusion coefficients. From these values, the percent effective diffusion
coefficient increase after folding was calculated and plotted in Figure 2.6b. All folded samples had at least
three times the effective diffusion coefficient values as compared to the original samples, where the plastic
particles had the smallest increase. Coatings with higher PVC values had larger relative increases in the
b)a)

31
effective diffusion coefficients after folding than coatings with lower PVCs. This result is expected as the
strain to failure of a coating layer decreases as the PVC increases towards the critical PVC. In other words,
the coatings become more brittle as shown by Prall et al. (2000) and Zhu et at. (2013) and Najafi et al.
(2018). The water vapor diffusion rate was smallest when pigments were not present as the crack resistance
was best for pure latex systems. This result reflects the fact that pure latex films can have strain to failure
of over 300%. The coatings with the lowest effective diffusion coefficient increase upon folding were
coatings with plastic particle filler, as seen in Figure 2.6b. This result may be caused by the spherical nature
of the plastic particles, sphere has a smaller area, so surface energy is released, surface energy varies
inversely with the tendency to brittle failure, so spherical pigment is less brittle. Plastic particles have small
size (0.5 μm), which could reduce the strains in the coating layer during bending, leading to less coating
failure and reduced crack formation. The results of the GCC coatings after folding demonstrate that a low
aspect ratio does not necessarily lead to improved crack resistance since these samples had the largest
increase in WVTR after folding, which is significantly different from the plastic particles. These results
that factors other than the aspect ratio, such as the modulus of the pigment, may affect crack resistance.
Figure 2.6 a) Average percent WVTR increase after folding for coatings with latex weight between 15 and
25 g/m2 for each pigment and PVC investigated. The average percent WVTR increase for latex (between
15 and 25 g/m2) shown at 0% PVC points is given as a line across all PVCs as a reference. Lines are given
to connect points to improve clarity. Error bars indicate one standard deviation. b) Percent effective
diffusion coefficient increase after folding calculated by fitting Eq. (2.1) through data. Error bars
determined from the square root of the covariance of the fit.
a) b)
32
SEM images of the folded crack regions of the different coatings were taken to characterize these
regions and are shown in Figure 2.7 for latex weight of 20 g/m2. From these images, the number of cracks
per image (Nm), average crack width per image (Dm), and crack area (Am) per image were measured,
calculated and are tabulated in Table 2.4 to quantitatively compare the images. For each pigment, more
cracks are visible for high PVC coatings (40%) than the low PVC (15%) coatings, consistent with the higher
PVC coatings being more brittle. Interestingly, the average width of the cracks at the high PVCs tend to be
smaller than at low PVCs; however, significant variability exists in these results making a clear trend
difficult to see. Note, that the reported standard deviation of crack number and width demonstrated the
degree of crack formation variability instead of confidence level of measurement. A total crack area of the
sample was calculated using the areas measured in Figure 2.7 and multiplying by the length of the folds
made in the sample. These values are reported Table 2.4. The total crack area was the smallest for the plastic
particles, which corresponds with the lowest values for the average WVTR increase percent (see Figure
2.6a) and effective diffusion coefficient upon folding (see Figure 2.6b). Kaolin B had the second lowest
crack area per length, which again mirrors its second-best retention of effective diffusion coefficient. These
results confirm that the effective diffusion coefficient after folding is related to the total crack area that
forms in the coating and that the pigment type can have a significant effect on it. Whether pigment size,
aspect ratio, material, or combination of all three parameters causes the differences in crack resistance is
not clear from the present study due to the limitations of available pigments. The calculated expected total
crack area (Ac) was also calculated from WVTR results by Eq. (2.2) and reported in Table 2.4. The results
have a large variation due to the scatter in the WVTR data. Even with the scatter in both data sets, the results
indicate a large difference between the crack area estimated from the change in WVTR and the area
measured from the SEM. This difference is on the order of 100-times greater for the WVTR calculated case.
This difference may be caused by several issues such as the SEM images do not include the area where
orthogonal folds were made, internal cracks, or even cracking within the paper. The coating layer possibly
delaminates from the paper in the region of a crack, creating a larger area for water vapor transport than
would be estimated from the top down image of the SEM.

33
Table 2.4 Crack area, number, and width in coatings with various PVCs and pigments at 20 g/m2 latex
weight.
Coatings PVC Nm Dm (μm) Am per length
(mm2/mm)
Total Am
(mm2)
Ac per
length
(mm2/mm)
Total Ac
(mm2)
Paper
only -- 1.1 ± 0.3 80 ± 50 0.0345 ± 0.0001 13.1 ± 0.1 -- --
Pure latex 0% 0.8 ± 0.6 10 ± 10 0.0058 ± 0.0001 2.2 ± 0.1 2.0 ± 1.0 800 ± 400
Kaolin A 15% 1.4 ± 0.5 60 ± 50 0.0473 ± 0.0001 18.0 ± 0.1 3.0 ± 0.4 1200 ±160
40% 5.4 ± 2.8 20 ± 30 0.0714 ± 0.0001 27.1 ± 0.1 4.6 ± 0.4 1700 ± 130
Kaolin B 15% 2.1 ± 1.1 40 ± 60 0.0330 ± 0.0001 12.5 ± 0.1 2.2 ± 0.2 800 ± 100
40% 6.7 ± 1.9 20 ± 20 0.0503 ± 0.0001 19.1 ± 0.1 4.7 ± 0.3 1800 ± 100
GCC 15% 1.4 ± 0.5 50 ± 10 0.0503 ± 0.0001 19.1 ± 0.1 4.9 ± 0.9 1900 ± 300
40% 3.0 ± 1.0 30 ± 30 0.0685 ± 0.0001 26.0 ± 0.1 6.0 ± 1.0 2300 ± 400
Plastic
particle
15% 3.0 ± 1.2 20 ± 20 0.0230 ± 0.0001 8.7 ± 0.1 2.0 ± 1.0 800 ± 500
40% 5.5 ± 1.2 9 ± 6 0.0397 ± 0.0001 15.1 ± 0.1 4.0 ± 3.0 1400 ± 1000
Note: Nm and Dm are crack number average and crack width average per image measured by AutoCAD,
Am is crack area measured by ImageJ, Ac is crack area calculated from WVTR value by Eq. (2.2).

34
Figure 2.7 Representative SEM images of cracks in coatings at the fold for various pigments at PVC values
of 15% and 40% at 20 g/m2 latex weight.
a paper only b latex
c 15% PVC kaolinA d 40% PVC kaolinA
e 15% PVC kaolinB f 40% PVC kaolinB
g 15% PVC GCC h 40% PVC GCC
i 15% PVC plastic
particles
j 40% PVC plastic
particles

35
To improve the understanding of the crack mechanism, several bending simulations were made to
explore the local strain and stress as a function of pigment shape. The images in Figure 2.8 show the
simulated stress and strain distribution of paper with pure latex coating, paper with 40% PVC kaolin A
coating, and paper with 40% PVC plastic particles coating. The maximum strain and stress occurred in the
left corner of the samples, because the left side was fixed and the bending curvature was largest in this
corner. The strain and stress were not uniform in the horizontal direction because the curvature changed
along the samples. For the pure latex coating, the maximum strain and stress occurred at top surface of
latex rather than paper base surface. For coatings with 40% PVC kaolin A and plastic particles, the
maximum stress and strain occur in the coating layer with all values increasing due to the presence of the
particles causing stress concentration between the particles. The maximum strain occurred near the top of
the coating layer, but high zones of strain occur in the vertical gap between particles and extended the entire
thickness of the coating and further in longitudinal direction. These simulations support the hypothesis that
particles cause stress concentration within the entire coating, which enhances the potential for crack
generation and propagation in the coating.
To compare pigment results, the maximum strain and stress of different coatings were found excluding
the region 0.1 mm from the left corner to avoid artifacts from the fixing of the sample at this end. These
results are shown in Table 2.5. The maximum strain of the plate pigment coating at the 40% PVC was three
times larger than that of the spheres. At 15% PVC, this increase was around a factor of two. The different
behaviors due to pigment type comes primary from how strain in the polymer develops in the vicinity of
the pigments in bending mode. These results suggest that by selecting the proper pigments (plastic particles),
polymer strain could be reduced in the coating, which should improve the coating resistance to cracking.
An interesting result comes from the stress and strain distributions of the disk-shaped pigments: a
region of high stress develops at the coating-paper interface. This result is caused by the difference between
the effective modulus of the coating, which includes pigments and latex, and the modulus of the paper. This
high stress region suggests the potential for delamination of the coating layer from the paper. This result

36
may explain why the crack area measured from the SEM images is significantly smaller than the crack area
indicated by the change in WVTR. The folding operation may delaminate a significant area between the
paper and the coating region, enabling water vapor transport, while only the crack that propagates to the
surface is seen with SEM.
Figure 2.8 Enlarged results near the top left corner of the coating layer for stress (left images) and strain
(right images) for no particles (top), 40% PVC plate like particles (middle), and 40% PVC spherical
particles (bottom). Note that the red color represents different magnitudes in various images.
Table 2.5 Maximum strain and stress value of coating after bending simulation.
Model component PVC Max strain Max stress (MPa)
Latex layer 0% 0.015 3.5
Kaolin A 15% 0.056 29.0
40% 0.091 52.0
Plastic particles 15% 0.020 5.6
40% 0.023 11.0
paper &latex paper &latex
paper, latex &kaolin A paper, latex &kaolin A
paper, latex &plastic particles paper, latex &plastic particles
37
2.4 Conclusions
To our knowledge for the first time, the influence of both particles shape and concentration was
characterized in terms of water vapor barrier property before and after folding. Increasing coat weight
enhanced barrier behavior but weakened crack resistance. Increasing the PVC improved the water vapor
barrier before folding but made the coating more prone to cracking. The plate shaped pigments improved
the barrier properties much better than blocky or spherical pigments, but these properties decreased with
folding, such that spherical particles could better retain the water vapor barrier. The increase in water vapor
transmission was due to cracks forming in the coating, where the cracks observed with plate like pigments
were larger than with the other pigments. The area for diffusion estimated from the SEM images of the
cracks was significantly lower than estimated from the change in the water vapor transmission rate. Models
of the folding event indicate that the stress concentration generated by this disk-like geometry of pigment
during folding may lead to the increase propensity of crack formation as well as delamination of the coating
from the paper.

38
CHAPTER 3
PREDICTION OF CRACK FORMATION OF WATER BORNE BARRIER COATINGS
DURING FOLDING
3.1 Introduction
Water borne barrier coatings enable paper to have properties suitable for food packaging, but they still
can be recycled with the paper stream and can break down in the environment (Siracusa et al., 2008; Ryan
et al., 2003; Brown et al., 1993).They often consist of pigments bound together by latex in a network (Arai,
2000), where mineral pigments improve the barrier properties and the cost effectiveness of paper-based
packaging (Rissa et al., 2002; Vähä-Nissi, & Savolainen, 1999; Adams, 1993).
Paper needs to be folded for packaging such as bags or boxes, which compromises the barrier
properties (Vähä-Nissi, & Savolainen, 1999). Previous experimental work (Zhu et al., 2019) showed that
adding mineral pigments increases crack formation during folding. Plate shaped pigments give the lowest
water vapor transmission rate (WVTR) before folding, but they generated large cracks and poor water vapor
barrier properties after folding. Spherical pigments yielded small cracks and improved retention of barrier
properties after folding (Zhu et al., 2019).
The previous experiments demonstrated the influence of different pigments with different aspect ratio,
aspect ratio, and pigment concentration on coating crack formation. However, the exact mechanism for
these changes is still not fully understood. Fundamental understanding is needed to tune the pigment
properties and coating composition to yield crack-resistant barrier coatings. Simulation of the physics
within the coating during bending could lead to new coating designs that minimize crack formation.
Many aspects of a paper coating formulation can affect how cracks form during folding for publication
grades of paper. High glass transition (Tg) binders and high PVC led to higher risk of a crack at the fold
(Alam et al., 2009; Prall, 2000; Zhu, 2013). Husband et al. (2002) found that the coating stiffness increased

39
as the pigment aspect ratio increased when pigments were the same size. Coatings with higher modulus
pigments and latexes consequently had a higher modulus (Azadi et al., 2008). These results demonstrate
that pigment modulus, shape and sizes can significantly affect coating properties.
Latex content and connectivity can also significantly affect coating mechanical properties. Latex with
lower modulus led a coating with lower modulus (Kan et al., 1996; Ratto, 2004; Alam et al., 2007). Alam
et al. (2007) found that the tensile modulus of coatings consisting of latex and CaCO3 pigments reached a
maximum at the critical pigment volume concentration and then decreased when increased beyond this
value. Ratto (2004) studied the influence of porosity, the latex content, and the latex mechanical properties
on the coating mechanical properties using a micromechanical model. Results showed that with a higher
modulus latex or a lower porosity the coating modulus increased. This previous work has been focused on
paper coatings use for publication grades; little has been published around the mechanical properties of
barrier coatings, which tend to have lower concentrations of pigments than publication grades. Work is
needed to understand the parameters that lead to crack formation in barrier coatings because these cracks
result in poor performance, limiting the applications of these materials.
Coating layers with low levels of pigments may behave more like a filled polymer composite. Lapcik
et al. (2018) investigated the mechanical properties of composites prepared from platy shaped mica and
prismatic wollastonite in a polyethylene matrix and found that increasing fillers content increased the
Young's modulus. Both composites exhibited decreasing strain at break with increasing filler concentration
indicating a more brittle mechanical behavior in comparison to the virgin polymer matrix. Fillers are
expected to increase the composite modulus and thus lead to easier crack formation; however, how
filler/pigment shape affect this behavior is less understood.
In this work, systematic changes to coating parameters were modeled to understand the influence of
the paper and coating thickness; the latex and pigments modulus, shape, aspect ratio; and concentration of
pigments on the crack generation of water borne barrier coating during bending. A finite element code was
40
used to simulate the folding process. Experiments were performed to record the radius of curvature that
results in visual crack formation. The experimental results were compared to the predictions of the
simulation to validate that this straightforward simulation could be used to predict paper coating behavior
and inform future barrier coating design.
3.2 Methods
3.2.1 Model setup
A finite element model was developed to understand the mechanics of 2D bending of filled coating
layers on paper using a commercial finite element code (COMSOL multiphysics 5.5). The model consisted
of a paper base and a coating layer with a dispersed pigment matrix, as shown in Figure 3.1.
The length of the model was 16 mm, with an initial deflection where the radius of curvature was 500
mm. The interfaces of paper-latex and latex-pigment were assumed idealized bonded to each other without
de-bonding and separation in the simulation. The paper and latex were modeled using arcs from annular
rings, where the inner radius of the model was 500 mm and the outer radius was 500 mm plus the paper
and latex thicknesses. Since the radius was much larger than the paper and coating thickness, the impact of
initial curvature on the strain was small but the initial bend acts as imperfection that allowed the model to
deflect undergoing axial compression. One unique aspect of the work is that many pigments were included
in the coating layer to help improve the understanding of the pigment role in the formation of cracks.
Different pigment sizes, shape and mechanical properties were included in the coating layer. The pigments
were uniformly distributed in the latex along axial and normal directions, which were setup using the array
method with gradual rotation around the center of annual latex layer in order to follow the initial bend of
the latex layer.
The model was discretized with unstructured triangle elements, where the mesh around the pigment
was refined. The minimum element size was around 3 µm and the number of elements varied with the
number of pigments in the coating layer where 86,000 was the maximum number of elements. Geometric

41
nonlinearity was considered in the simulation since the maximum deflection was around 3 times of the
model thickness, and the tensile strain was larger than 0.01, indicating that the deformation was not
relatively small compared to the size of the model.
Figure 3.1 Model setup and folding curvature calculation
The model was bent by applying a displacement boundary condition to the top of the paper shown in
Figure 3.1. To apply boundary conditions, the top and bottom ends were fixed to reference points using a
rigid connector constraint built within the commercial code. The reference points were chosen as the
geometry center of the top and bottom ends individually. The rigid connector allowed the top and bottom
end to rotate around the reference point, but still maintained them in a planar surface, which released local
stress concentration at these points when applying displacement boundary conditions. The downward
displacement was applied to the reference point at the top rigid connector while a hinge constraint was
applied to the rigid connector reference point at the bottom, where the displacement was suppressed but the
rotation was free. Both the top and bottom ends could rotate freely. The deflected shape of the model
approximated to an arc curve at the central portion of the model.
Folding line
R=50 cm
Pigment packing region
Paper
Folding line
Coating layer
Pigment packed region
Displacement
condition
Curvature points
Folding line
42
The applied displacement was determined iteratively until the curvature of the outer boundary at the
central line was 0.04 mm-1. The maximum values of the first principle strain were extracted at this condition.
High values of maximum strain indicate an increased potential to crack. Bending curvature was calculated
by the coordinate of three points along the inner side of the paper layer shown on the right side of Figure
3.1, where the middle point was on the folding line while the other two points were 0.15 mm away from
the folding line.
When the model was compared to experimental results, the bending process would stop when the
maximum strain reached the experimentally determined failure strain of the latex. Then, the coordinates of
the bent model were exported, and the curvature was calculated by the method mentioned above. A higher
curvature at failure indicated that the sample could be bent more before failure.
3.2.2 Modeling general coating systems
We first studied how a range of material parameters and pigment loading affected stress in the coating
as outlined in Table 3.1. Two pigment shapes were considered: rectangle and ellipse, where an aspect ratio
of one would yield a square and circle, respectively. The cross-sectional area of the pigment was set 40 μm2
while the length varied from 6.32 - 44.7 μm and the thickness varied from 0.89 – 6.32 μm. Since the size
of pigment was much smaller than the thickness of paper base and coating, the pigments were only placed
in the coating layer ± 0.6 mm around the central line of the model. If pigments were added in the entire
coating layer, the meshing and computational requirements would force the use of large computers and
significant computational time. The number of pigments was calculated based on the pigment area
concentration (FA), assuming uniform dispersion of pigments and regular pigment packing. The gaps
between pigments in each row and column were set to be equal.
In the model, the material properties of paper, latex and pigment were assumed to be isotropic and
linearly elastic. The two shapes of pigments were selected to represent kaolin (rectangular) and plastic
(elliptical) pigments and thus, had Poisson ratios equivalent to these materials (Bathija, 2009). To

43
investigate the influence of Young’s modulus of the pigments on the strain in the coating, various pigment
modulus values were considered in the simulation. Pigments were packed from 15% to 40% to study the
influence of pigment area concentration (FA) strain generated in the coating layer. Different pigment aspect
ratios were also used to investigate the influence of pigment aspect ratio and shape on strain generated in
the coating. The aspect ratio of rectangle pigment was varied from 1 to 50, while the aspect ratio ranged
from 1 to 10 for the ellipse pigments because when the aspect ratio was above 10, the required fine mesh
around the sharp ends along the principle axis required a large number of elements, which was beyond the
capacity of the computational device.
Table 3.1 Materials properties in model
Material Thickness (µm) Aspect ratio Modulus
(GPa)
FA Poisson’s ratio
Coating/latex 60-120 -- 0.2-200 85%-60% 0.45
Paper 60-400 -- 1 -- 0.2
Rectangular
shaped pigment
-- 1-50 0.02-200 15%-40% 0.48
Elliptical
shaped pigment
-- 1-10 0.01-100 15%-40% 0.33
3.2.3 Modeling experimental systems
To compare the model with experiments, all the parameters were set similar to experimental values as
summarized in Table 3.2.
Table 3.2 Model parameters to compare to experiments
Material Size (µm) Aspect ratio Modulus (GPa) FA Poisson’s ratio
Paper 200 - 1 - 0.2
Coating/latex 100 - 0.2 - 0.45
Kaolin 2 x 50 25 200 5%-40% 0.48
Plastic pigments 1 1 1 5%-45% 0.33
Note: The size for paper and coating/latex is thickness, for kaolin it is length by thickness, and for plastic
pigments it is radius.

44
The thicknesses for paper and coating were 200 and 100 µm, respectively. Experimental results were
generated by bending experiments (described below) to measure the curvature at coating failure, the
curvature at failure obtained from the model was compared to these measured curvatures at failure from
experiments. The model curvature at failure was simulated by the strain criteria of 0.9% in the latex, which
was the measured strain at failure of the latex used in the experiments (measured as described below).
Since free standing coatings are difficult to create and test, latex was coated on paper and then the
paper was weakened to measure the latex strain at failure on a tensile tester (Instron model 5564) following
the method used by Fein et al. (2020). To form a coating, styrene acrylic (SA) copolymer was coated on
paperboard following the coating method in previous experimental work (Zhu et al., 2019). The paperboard
was obtained from Westrock with a thickness of 190 µm and density of 200 g/m2. The thickness of latex
was 100 ± 10 µm after drying, which was targeted to minimize the effect of attached fibers to the mechanical
properties. Dry coatings were cut into rectangular strips with a knife to dimensions of 150 × 30 mm. The
samples were soaked in water for 1 hour to weaken the paperboard before testing and the samples were
tested while wet to minimize the mechanical properties of the paper affecting the tensile results for the latex.
Here the failure strain of material (latex) rather than the structure was tested, which indicated the value of
strain when the latex cracks. The test was repeated for 12 times to find an average strain at failure of 0.9%.
3.2.4 Bending experiments
Samples were coated following the coating method in previous experiment work (Zhu et al. 2019) on
200 g/m2 paperboard. The latex was a styrene acrylic (SA) copolymer with a glass transition temperature
of 21 °C, a particle size of 70-80 nm (Joncryl, BASF), and a solids content of 50%. Kaolin (Joncryl, BASF)
and plastic pigments (Dow) produced by the emulsion polymerization of styrene were used and their
properties were also reported in previous experimental work as summarized as the model parameters in
Table 3.2. The kaolin and plastic pigments were received as slurries that were diluted to 50% solids before
adding to the latex. The formulation was prepared by mixing latex and one pigment slurry at different
pigment volume concentration (15%, 20%, 30% and 40%). Per 100 mL of latex/pigment mixture, 1.4 mL

45
dispersant (Dispex N 40V, BASF), 2.5 mL lubricant (Calsan 50, BASF), 0.06 mL defoamer (Rhodoline
635, BASF), and 0.09 mL thickener (Sterocoll FS, BASF) were added into the mixture. The final solids
content of all formulations was kept at 50%. The formulation was stirred by a mechanical stirrer for four
hours and let to sit at room temperature overnight prior to coating.
The coating was applied with a rod draw down coater (BYC-Gardner, 2101, USA). Coating thickness
was kept at 100 ± 10 µm by using the same gap distance between the plane and the grooved rod for all
coatings. Dry coatings were painted black by spray paint and dried at room temperature. Dry coatings were
cut into strips (300 × 30 mm) with a knife. The samples were placed in a controlled humidity (50%) and
temperature (23 °C) room for 24 hours before testing.
A schematic of the bending experiment is shown in Figure 3.2. Samples were wrapped by hand around
cylinders with different radii that varied from 10 to 100 mm. Coatings were wrapped around the cylinder
with the largest radius and the progressively wrapped around cylinders with smaller radii until a crack
formed. The crack formation radius was the radius of cylinder where cracks were visible. Three replicates
were run for each coating. The crack curvature was calculated as the reciprocal of the crack radius.
Figure 3.2 Bending experiment setup. Rods of different sizes are used to generate different curvature
radii.
3.2.5 Comparing model and experimental results
The model is two dimensional in nature because three dimensional models would require many
pigments even for a small region, that leads to a large computational cost. Therefore, the pigment volume
concentration (PVC), an experimental parameter, was converted to a pigment area concentration (FA), the
model parameter. Toivakka et al. and others have used simple scaling rules, based on the maximum cubic

46
packing of spheres, to compare 2D and 3D situations (Toivakka et al.,1995). Here the maximum cubic
packing of rectangles and spheres was used to convert volume fractions PVC to area fractions FA.
Rectangles and rectangular block pack fulling in the space so that maximum packing is one and FA = PVC.
For spheres, when maximum cubic packed, calculated PVC and FA is
FA =3
2PVC (3.1)
The converting following another packing method was shown in Appendix A where the distance between
pigments was considered.
3.3 Results and discussion
3.3.1 Shape and aspect ratio effects
To evaluate the effect of pigment shape and aspect ratio on coating crack resistance, bending
simulations of coatings were run with rectangular and elliptical pigments to represent kaolin and plastic
pigments, respectively. The maximum first principle strain (ε11) of the model after bending occurred at the
outer edge of the coating layer and increased with aspect ratio and pigment area concentration (FA) as shown
in Figure 3.3. When the curvature was 0.04 mm-1, the maximum ε11 in a pure latex coating was 0.69%,
while the maximum ε11 increased to above 1.2% once rectangular shaped pigments (E = 1.0 GPa) were
dispersed in the coating (Figure 3.3a). When the aspect ratio of rectangular pigments was below 10, the
maximum ε11 increased with increasing aspect ratio for lower FA, with the highest strain increase (18%)
observed for FA equal to 40%. The maximum ε11 plateaued for aspect ratios that was larger than 10 and
higher FA values. The aspect ratio appeared to have a limited effect on coating failure for rectangular shaped
pigments. For elliptical shaped pigments, the maximum ε11 after bending increased with aspect ratio and
pigment area concentration (FA) as well. The strain values appeared to be more sensitive to FA. The
maximum ε11 increase (29%) as a function of increasing aspect ratio was observed for FA equal to 40%. The
maximum ε11 increased most significantly as a function of FA (42%) for aspect ratio equal to 2 (Figure 3.3b).

47
This behavior in Figure 3.3 indicates that elliptical shaped pigments are more sensitive to FA changes. For
both rectangular and elliptical shaped pigments, the model with higher aspect ratio pigments was easier to
crack when bent.
The difference of the maximum ε11 in coatings with rectangular shaped pigments and coatings with
elliptical shaped pigments was small when FA is below 40%. When the FA was increased to 40%, maximum
ε11in coating with elliptical shaped pigments is a little larger than that in coatings with rectangular shape
pigments. For example, the maximum ε11 of a coating with elliptical shaped pigments was 8% higher than
that of a coating with rectangular shaped pigments for FA equal to 40% and aspect ratio equal to 10. This
increase may be because of the sharp end of elliptical shaped pigments in the model shown in Figure 3.4,
which increases tensile strain in the latex at this point. The highest strain zone between elliptical shaped
pigments shown in Figure 3.4 (red circle highlight) was around the connecting line between the sharp end
of two adjacent elliptical shaped pigments, while the high strain zone between rectangular pigments spread
out across a larger area to reduce strain.
Figure 3.3 Influence of pigment aspect ratio on the maximum value of the first principle strain (ε11) in the
coating layer at the folding line when the curvature was 0.04 mm-1 for (a) rectangular shaped pigments (E
= 1 GPa) and (b) elliptical shaped pigments (E = 1 GPa).

48
Figure 3.4 Maximum value of first principle strain (ε11) distribution in model coating layer at the folding
line when the bending curvature was 0.04 mm-1 for different shape pigments for (a) model with 40%
rectangular shaped pigments (Aspect ratio= 10, E = 1 GPa) and (b) model with 40% elliptical shaped
pigments (Aspect ratio= 10, E = 1 GPa).
3.3.2 Modulus effects
Pigments with an aspect ratio of 1 (square shaped pigments and circular shaped pigments) were used
to model how pigment modulus affected strain in the coating. The maximum ε11 increased with pigment
modulus as shown in Figure 3.5a. When the pigment modulus was the same as the latex modulus (0.2 GPa),
no differences in ε11 were observed between coatings with and without pigments. When the square shaped
pigment modulus was 50 times that of latex, the maximum value of ε11 increased to 1.5% -1.8% values, an
increase of 160% as compared to a pure latex coating. However, the maximum ε11 increased a small amount,
6% at most when the pigment modulus was 500 - 1000 times higher than the latex. A similar trend was
observed for coatings with circular shaped pigment (Figure 3.5b). Therefore, adding pigments with a
modulus less than 50 times that of the latex modulus should decrease the propensity for a crack to form in
a coating layer as compared to typical mineral pigments. An ideal pigment material with a modulus that is
the same as the latex should provide the best crack resistance.
A similar model was examined with high modulus pigments (kaolin) and varying latex modulus as
shown in Figure 3.5c. The maximum ε11 in the latex decreased with increasing latex modulus. For a pure
latex coating, the maximum ε11 decreased from 0.69% to 0.23% as the modulus of latex increased from 0.2
GPa to 20 GPa and remained constant for modulus values greater than 20 GPa. For coatings with rectangular
ε11
(b)model with 40% ellipsoidal shaped pigments(a)model with 40% rectangular shaped pigments
ε11

49
shaped pigments, maximum ε11 decreased as the modulus of latex increased from 0.2 GPa to 200 GPa.
When the modulus of the latex was identical to that of the kaolin (200 GPa), the maximum ε11 in latex was
independent of the volume fraction of pigment, which is consistent with modulus mismatch between
pigments and latex leading to stress formation.
Figure 3.5 Influence of pigment modulus (E) and latex modulus (ELatex) on the maximum value of first
principle strain (ε11) in coating layer at folding line when bending curvature is 0.04 mm-1. (a) square shaped
pigments. (b) circular shaped pigments. Young’s modulus of latex is 0.2 GPa. (c) kaolin pigments (Young’s
modulus is 200 GPa, aspect ratio is 5).
The optimal modulus results can be explained by concentration of strain in the material with the lowest
modulus. When the pigment modulus is 0.01 GPa (1/20 of latex), the maximum strain occurs in the
pigments as shown by the strain distribution in Figure 3.6a. When the moduli of pigment and latex are equal,
the strain occurs in both of pigment and latex. As the pigment modulus increases to higher values than the
latex, all the strain occurs in the latex regions (Figure 3.6c). Consequently, a crack or failure may first occur
in pigments when the pigment modulus is less than the latex and a crack or failure first occurs in latex if
pigment modulus is higher than the latex. Therefore, large differences in modulus between latex and
pigment would decrease the overall crack resistance of the coating.
At high pigment modulus, the FA significantly affected strain within the coating especially for circular
shaped pigments in Figure 3.5b. For coatings with 15%-30% FA and above 10 GPa pigment modulus, the
maximum ε11 of the coating with circular shaped pigments ranged 1.2% - 1.5%, which was up to 20% lower
than those for coatings of square shaped pigments (1.5% - 1.7%) under the same conditions. However, the
maximum ε11 with an FA equal to 40% was nearly similar for circular and square shaped pigments (6%

50
increase in strain for circular pigments). These results indicate that at high FA, the shape affects the strain
and potential for coating failure when all other pigment parameters are the same.
Figure 3.6 Maximum value of first principle strain (ε11) distribution in model coating layer at the folding
line when the bending curvature is 0.04 mm-1 for different modulus pigments. Modulus of latex is 0.2
GPa.
Figure 3.7 Contour of maximum value of first principle strain (ε11) distribution for square (a, b) and circular
shaped pigments (c, d) coating layer at the folding line when the bending curvature is 0.04 mm-1 at FA values
of 15% (a, c) and 40% (b, d). Black line indicates contour line for ε11 at 0.9%, which is the expected value
for crack formation. The modulus of both types of pigment is 200 GPa.
The reduction of the effective tensile zone between circular shaped pigments increases the tensile strain
in the latex and can explain the FA effects on strain production. Images of the strain development in the
simulation support this hypothesis. The contour line of ε11 at 0.9% (strain at latex failure), shown as black
(a) E =0.01GPa (b) E =0.2GPa (c) E =200GPa
ε11
(a) (b)
(c) (d)
ε11
ε11
ε11
ε11
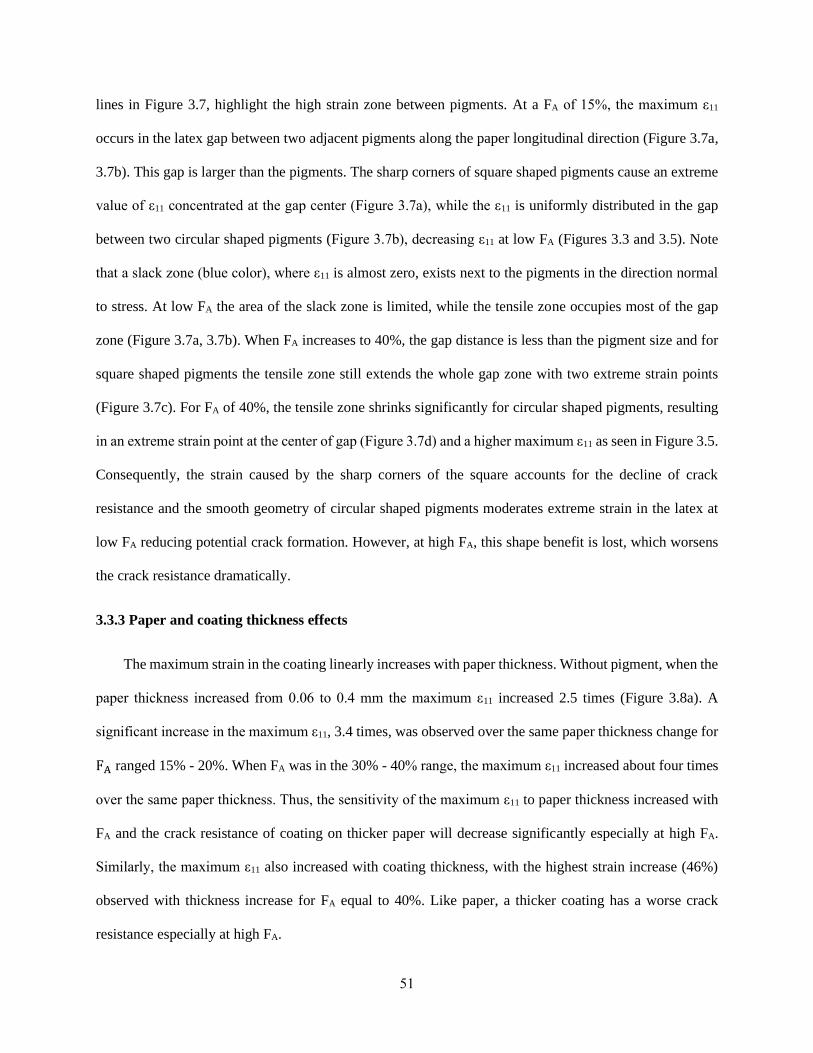
51
lines in Figure 3.7, highlight the high strain zone between pigments. At a FA of 15%, the maximum ε11
occurs in the latex gap between two adjacent pigments along the paper longitudinal direction (Figure 3.7a,
3.7b). This gap is larger than the pigments. The sharp corners of square shaped pigments cause an extreme
value of ε11 concentrated at the gap center (Figure 3.7a), while the ε11 is uniformly distributed in the gap
between two circular shaped pigments (Figure 3.7b), decreasing ε11 at low FA (Figures 3.3 and 3.5). Note
that a slack zone (blue color), where ε11 is almost zero, exists next to the pigments in the direction normal
to stress. At low FA the area of the slack zone is limited, while the tensile zone occupies most of the gap
zone (Figure 3.7a, 3.7b). When FA increases to 40%, the gap distance is less than the pigment size and for
square shaped pigments the tensile zone still extends the whole gap zone with two extreme strain points
(Figure 3.7c). For FA of 40%, the tensile zone shrinks significantly for circular shaped pigments, resulting
in an extreme strain point at the center of gap (Figure 3.7d) and a higher maximum ε11 as seen in Figure 3.5.
Consequently, the strain caused by the sharp corners of the square accounts for the decline of crack
resistance and the smooth geometry of circular shaped pigments moderates extreme strain in the latex at
low FA reducing potential crack formation. However, at high FA, this shape benefit is lost, which worsens
the crack resistance dramatically.
3.3.3 Paper and coating thickness effects
The maximum strain in the coating linearly increases with paper thickness. Without pigment, when the
paper thickness increased from 0.06 to 0.4 mm the maximum ε11 increased 2.5 times (Figure 3.8a). A
significant increase in the maximum ε11, 3.4 times, was observed over the same paper thickness change for
FA ranged 15% - 20%. When FA was in the 30% - 40% range, the maximum ε11 increased about four times
over the same paper thickness. Thus, the sensitivity of the maximum ε11 to paper thickness increased with
FA and the crack resistance of coating on thicker paper will decrease significantly especially at high FA.
Similarly, the maximum ε11 also increased with coating thickness, with the highest strain increase (46%)
observed with thickness increase for FA equal to 40%. Like paper, a thicker coating has a worse crack
resistance especially at high FA.

52
Figure 3.8 Influence of paper thickness and coating thickness on the maximum value of first principle strain
(ε11) for a rectangular pigment at various area fractions when the bending curvature is 0.04 mm-1. Young’s
modulus of pigment is 200 GPa with aspect ratio of 5.
The tensile strain (ε11) at the outer bend increases with paper or coating thickness because the distance
from the outer bend to the neutral plane increases. In this work, the sample thickness is far less than its
length, so the deformed shapes of the inner and outer bends approximates to circular arcs, especially around
folding line. If both the paper and coating layers are assumed to be homogeneous and isotropic materials,
where stress concentration is ignored, the tensile strain at the outer bend around folding line can be
approximated as:
ε ≈ kNd (3.2).
where kN is the curvature of the neutral plane (i.e. the location where tensile strain is zero) and d is the
distance between outer bend and neutral plane, shown as dash-dot lines in Figure 3.9. Since the sample
thickness is far less than the bending radius, the curvature at the neutral plane is similar to the curvature at
inner end (k), so kN ≈ k.
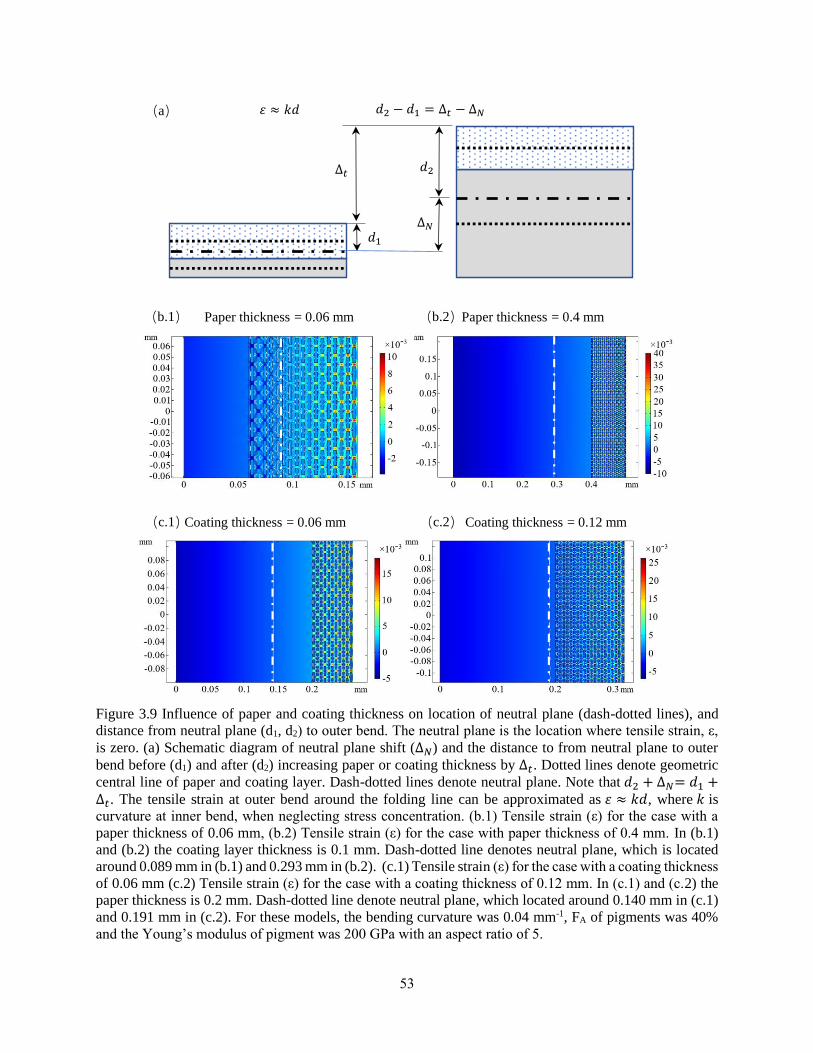
53
Figure 3.9 Influence of paper and coating thickness on location of neutral plane (dash-dotted lines), and
distance from neutral plane (d1, d2) to outer bend. The neutral plane is the location where tensile strain, ε,
is zero. (a) Schematic diagram of neutral plane shift (∆𝑁) and the distance to from neutral plane to outer
bend before (d1) and after (d2) increasing paper or coating thickness by ∆𝑡. Dotted lines denote geometric
central line of paper and coating layer. Dash-dotted lines denote neutral plane. Note that 𝑑2 + ∆𝑁= 𝑑1 +∆𝑡. The tensile strain at outer bend around the folding line can be approximated as 휀 ≈ 𝑘𝑑, where 𝑘 is
curvature at inner bend, when neglecting stress concentration. (b.1) Tensile strain (ε) for the case with a
paper thickness of 0.06 mm, (b.2) Tensile strain (ε) for the case with paper thickness of 0.4 mm. In (b.1)
and (b.2) the coating layer thickness is 0.1 mm. Dash-dotted line denotes neutral plane, which is located
around 0.089 mm in (b.1) and 0.293 mm in (b.2). (c.1) Tensile strain (ε) for the case with a coating thickness
of 0.06 mm (c.2) Tensile strain (ε) for the case with a coating thickness of 0.12 mm. In (c.1) and (c.2) the
paper thickness is 0.2 mm. Dash-dotted line denote neutral plane, which located around 0.140 mm in (c.1)
and 0.191 mm in (c.2). For these models, the bending curvature was 0.04 mm-1, FA of pigments was 40%
and the Young’s modulus of pigment was 200 GPa with an aspect ratio of 5.
(a)
Paper thickness = 0.06 mm Paper thickness = 0.4 mm(b.1) (b.2)
Coating thickness = 0.12 mmCoating thickness = 0.06 mm(c.1) (c.2)

54
Based on geometry, when the paper or coating thickness increases by ∆t, the change in distance from
the neutral plane to the outer bend is:
d2 − d1 = ∆t − ∆N (3.3)
where, d1 and d2 are the distance from the neutral plane to outer bend before and after increasing the paper
or coating thickness, respectively, and ∆N is the shift of neutral plane (Figure 3.9a). This can be substituted
into equation (3.2) to yield:
ε2 − ε1 ∝ (∆t − ∆N)
where ε2 − ε1 > 0 indicates an increase in strain. Thus, when the shift of neural plane (∆N) is less than the
paper or coating thickness increase (∆t), the tensile strain increases (i.e. ∆t − ∆N> 0). For example, when
the coatings with 40% FA of rectangular pigments had the paper thickness increase from 0.06 (Figure 3.9b.1)
to 0.4 mm (Figure 3.9b.2) the ∆t equals 0.34 mm, while the ∆Nwas 0.20 mm and less than ∆t. Consequently,
tensile strain should increase with increasing of paper thickness, which is consistent with the simulation.
Note, in this analysis stress concentration was ignored, which amplified the tensile strain increase in the
simulation. Coating thickness increases have a similar effect. For example, when the coatings with 40% FA
of rectangular pigments, had the coating thickness increase from 0.06 (Figure 3.9c.1) to 0.12 mm (Figure
3.9c.2) the ∆t equals 0.06 mm, while the ∆N was 0.05 mm and less than ∆t. Thus, the tensile strain should
increase after increasing coating thickness, which is consistent with the simulation. Again, the stress
concentration between pigments amplified the tensile strain increase in the simulation.
3.3.4 Comparison of simulation and experiment
In experiments, adding pigments to the coating decreased the curvature at failure of the coating (i.e.
visible cracks were easier to form). For a pure latex coating, cracks occurred at a bending curvature of 0.030
mm-1 as given in Figure 3.10. Once kaolin pigments were added, the curvature at failure significantly
decreased to below 0.019 mm-1 and decreased further as FA of pigments increased to 40% (i.e., FA of 40%).

55
The general trend of the curvature at failure obtained from simulation agreed with experimental results.
From the simulation without pigments, assuming a latex failure strain of 0.9%, the curvature at failure is
0.050 mm-1; which is significantly larger than the measurement from experiments (0.030 mm-1). Model
results of curvature at failure for coating with kaolin pigments decreased from 0.02 mm-1 to 0.01 mm-1 when
FA increases to 40%. The curvature at failure for coating with plastic pigments decreases from 0.03 mm-1
to 0.023 mm-1 when FA increases to 50%. Both modeled pigments demonstrated the correct trend of coating
crack resistance versus pigment volume concentration and better crack resistance for the coatings with
plastic pigment, which are consistent with the experiments. However, the model underestimates the
curvature at failure for the coating with kaolin pigments by about 25% and that for coating with plastic
pigments by about 15%. Therefore, the simulations provide a conservative estimate of the curvature at
failure for coatings with pigments.
Multiple reasons can explain the discrepancies between the experiments and the simulation. For the
coating with pigments, cracks occurred earlier in the simulation as compared to the experiment. In the
experiments, the curvature at failure was marked when the crack was visually observed; however, initial
micro-cracks, especially those inside of the coating, are unable to be observed by eye, which could possibly
lead to an overestimation of the curvature at failure from experiments. Additionally, a finite number of
cylinders was used in the experiments and the curvature at failure is calculated from the cylinder where
crack has occurred, which might also overestimate the curvature at failure. Another potential reason for the
discrepancies is the model assumed linearly elastic material and perfect adhesion between components. The
material plasticity of latex could allow higher strain with lower stress before failure, which could increase
the experimental curvature at failure. Additionally, debonding between latex and pigment could release the
stress concentration in latex and moderate local strain, which can also increase the experimental curvature
at failure. These realities likely led to the curvature at failure being lower in the simulation as compared to
the experimental results. Both the accuracy of measured curvature at failure and the consistency between
experiment and simulation can be potentially improved with advanced methods in experiments and

56
simulation. Optical magnification and nondestructive inspection are applicable in the experiment to better
observe microcracks. Including material plasticity and advanced finite element methods for simulating
debonding and crack propagation should be considering in the future to even closer predict coating behavior.
Figure 3.10 Influence of pigment volume concentration and type on curvature at failure from experiment
and simulation. In simulation the failure strain of latex was assumed to be 0.9%.
3.4 Conclusion
A model was developed to understand the mechanics of bending a pigmented barrier coating layer on
paper. Pigment addition with high aspect ratio and modulus increased the crack potential because strain
between pigments are concentrated in the latex phase. Increasing paper and coating thicknesses are
predicted to lead to an increased risk to crack since the distance from outer bend to neutral plane increased.
Strain occurs in pigments when the pigment modulus is less than or equal to the latex modulus, which
should reduce the potential for crack formation. A large difference in modulus between the latex and
pigment should decrease the crack resistance. The model predicts well the trends of the experimental results
in terms of pigment concentration and pigment shape, but it underestimates the curvature at failure by 15-
25%. This difference may be caused by fine defects that cannot be seen or by a number of other factors.
Factor 2/3 for plastic particles, factor 1 for kaolin

57
CHAPTER 4
THE INFLUENCE OF PIGMENT MODULUS ON CRACK RESISTANCE OF PAPER
BARRIER COATINGS
4.1 Introduction
Water borne barrier coatings for paper can be recycled with paper and are expected to break down in
the environment (Siracusa et al., 2008; Ryan et al.,2003; Brown et al., 1993). The coatings formulation
often contains a latex binder that bound pigments together to improve barrier properties (Arai, 2000; Rissa
et al., 2002; Vähä-Nissi, & Savolainen, 1999; Adams, 1993). Both synthetic latex such as styrene acrylic
(SA) copolymer (Zhu et al., 2019) and styrene butadiene (SB) copolymer (Bollström et al., 2013) and
natural latex or other polymers such as starch (Purington et al., 2017) binder could be used for water borne
barrier coatings. Mineral pigments in these coatings improve the barrier properties and the cost
effectiveness of paper-based packaging (Zhu et al., 2019; Bollström et al., 2013). Paper needs to be folded
for packaging such as bags or boxes, in folding operation, the coating layer was subject to tensile stresses
which is expected to compromise the barrier properties (Vähä-Nissi, & Savolainen, 1999; Zhu et al., 2019).
Previous experimental work (Zhu et al., 2019) showed that adding mineral pigments increases crack
formation during folding. The crack formation was influence by different paper, latex and pigment
parameters. Simulation work has been done to help understand how the pigment properties and coating
composition can be changed to yield crack-resistant barrier coatings and gave a determine new coating
designs that minimize crack formation (chapter 3). The simulation works previous showed that coating with
softer (lower modulus) latex and pigments could give small crack potential and the potential was smallest
when modulus of latex and pigment were same. The simulation works indicated that modulus was the most
important parameters that affected the crack formation when bending. While little is reported in the
literature that explores the influence of pigment modulus on the crack resistance of barrier coatings for
paper.

58
Though folding of barrier coatings has limited studies, the influence of latex on crack formation of
publication grade paper coatings has been widely studied and gives a basis for the expected behaviors of
barrier coatings. The effect of binder content, glass transition (Tg) and modulus on coating crack resistance
was studied by several groups. Kyudeok et al. (2015), Alam et al. (2009), Prall (2000) and Zhu (2013) found
that high glass transition (Tg) binders and increase the elastic modulus of the coatings, which results in a
higher risk of a crack at the fold. Kyudeok et al. (2015) found that starch content and glass transition
temperature (Tg) of styrene-butadiene latex (SB latex) were two most important factors affecting both fold
cracking and tensile properties of the coating layer, The adding of starch and SB latex with higher Tg
increased crack length and width as well as crack area. Najafi et al. (2018) also found that binder
compositions can change crack resistance by observing increased starch content decreasing the tensile strain
to failure and increasing the crack area for a starch-latex coating. Rättö, (2004) studied the influence of
latex content, and the latex mechanical properties on the coating mechanical properties by using a
micromechanical model. Results showed that the mechanical properties of coating were affected by latex
content and latex stiffness. Coating was stiffer when coated with higher modulus latex. The latex was softer
(lower modulus) when Tg was smaller, Schuman et al. (2004) reported that coating with SB latex was brittle
when the Tg of SB was higher, microcracks in the film with SB latex (Tg is 35oC) are clearly visible by
scanning electron microscopy (SEM) , The coating could be more flexible coated SB latex with lower Tg,
while lower Tg lead a worse barrier property and blocking problem. Adding pigments and wax to SB latex
could reduce the blocking trendy but caused other surface problems (Schuman et al., 2005).
Pigments properties were found to be the most important parameters in the previous simulation work.
There were also several groups studied the influence of pigments properties on crack resistance of coatings.
Rättö et al. (2011) found that small pigments adhered better to the latex than larger ones and that cracks in
the coating were caused by poor adhesion. Also, small particle size latex has been shown to improve the
pigment-latex adhesion (Kim et al., 2010). The previous experiment work (Zhu et al., 2019) has also shown
that different pigments types can affect the crack potential. Plate shaped pigments with higher modulus

59
gave the lowest water vapor transmission rate (WVTR) before folding but tended to generate large cracks
and poor water vapor barrier properties after folding. Spherical pigments with lower modulus yielded small
cracks and improved retention of barrier properties after folding. Husband et al. (2006) investigated the
influence of kaolin particle shape factor on the tensile strength of coating layers. They found that coating
stiffness increased as the pigments shape factor increases when pigments had same size. Azadi et al. (2008)
used a model to study the effect of pigment modulus on coating mechanical property, found that coating
was stiffer with stiffer pigment and latex.
In the previous work (Zhu et al., 2019), coating with kaolin showed a better water vapor resistance
before folding but worse water vapor resistance after folding compared to spherical plastic pigments. Talc
has been shown to give a better water vapor resistance than clay and mica (Wuu, & Rabot, 2009). Rissa et
al. (2002) reported that coating with talc that had a narrow particle size distribution and large aspect ratio
had a better barrier property. Vähä-Nissi and Savolainen (1999) reported that coating with talc yield slightly
lower water transmission rates than different kaolins. They used different grades of kaolins that have
different size distribution (e.g. 45% <2 µm, 64% <2 µm, 92% <2 µm) and two kinds of talc that has a larger
size distribution (46% <2 µm) than most of different kaolins. Their results showed that coating with talc
had better relative WVTR values; kaolins that had a narrow size distribution in their work while did not
have a decreased WVTR as expect. They did not report the aspect ratio of kaolins and talc, but aspect ratio
should contribute to the result as suggested in other work (Rättö et al., 2011). They also mentioned the
difference of surface chemistry between pigments may affect the WVTR results. Schuman et al. (2005)
reported that the more hydrophilic kaolin may interact more strongly with the water vapor, which might
contribute to an increased WVTR. But on the contrary, in their result, coating with kaolin had a lower
WVTR than coating with talc. The influence of more hydrophilic was counteracted by the more platy shape
of kaolin. Vähä-Nissi and Savolainen (1999) also test grease resistance of coating with different pigments
before and after folding, coating with more pigments had worse grease resistance after folding. But there is
no obvious difference between coating with different pigments: this result may be caused by the limited
scale range used to quantify oil penetration.

60
A paper coating layer can be considered as a composite structure that containing paper, latex and
different types of pigments. The size and modulus of the pigment influence the mechanical properties of
the composite. Leong et al. (2004) investigated the mechanical properties of polypropylene (PP) composite
filled with talc and kaolin, the tensile property was measured with a tensile machine, the results showed
that the strength and stiffness of the talc-filled PP composites was significantly higher than those of the
kaolin filled PP composites. In their works the particle size of kaolin is smaller than that of talc, fillers with
small particles have been known to increase the tensile strength (Landel, & Nielsen, 1993). While in Leong
et al. (2004)’s work, the smaller kaolin aggregated together in the PP matrix to form kaolin book (kaolin
aggregated flake by flake). The aggregation reduced the stiffness of kaolin-filled PP. The hardness of talc
they used is smaller than kaolin, that should lead lower modulus of talc-filled PP, while talc is a strong
nucleating agent, thus increasing the crystallinity of the polymer matrix. The increased crystallinity of talc-
filled PP improved the strength and stiffness to the composite. At high talc loading, the talc tends to
agglomerate causing the strength and toughness of talc-filled PP to decrease substantially. Deshmukh et al.
(2010) added mica with different size and concentration into polyvinyl chloride to study the mechanical
properties of the composite. The size of mica ranged from 44-150 μm. The results showed that the modulus
of the composite was higher with larger size mica at low pigments loading while lower with larger size
mica at high pigments loading. These results indicate that stiffness and Young’s modulus depends on extent
of dispersion as well as dispersion of agglomerates. It is observed that the tensile strength and elongation
at break decrease with increasing concentration of filler loading of each type of PVC composite. This rate
of decrease in tensile strength is higher for higher particle size as compared to smaller particle size of mica.
Mica-filled PVC composite has weak strength and stiffness with larger size mica and higher pigments
loading.
There were few works studied the binder and pigment properties on crack resistance of paper barrier
coatings. In previous work (Zhu et al.,2019), the influence of latex and pigments parameters on barrier
properties of coatings before and after folding was studied, but single variable experiments need to be
designed for further study. Simulations predict that flexible pigments will help resist cracking during

61
bending. Experiment works also need to do to help understand and confirm the previous simulation work.
In this work, two groups of pigments with similar shape and size, but with different moduli were dispersed
into SA latex to make coatings. In addition, a SB latex and a natural rubber latex was mixed with the SA
latex to explore the effect of the inclusion of a highly flexible additive. Water vapor transmission rate
(WVTR) was tested before and after folding to study the influence of pigment modulus on the retention of
barrier properties after folding.
4.2 Materials and methods
4.2.1 Coating method
The substrate used was 200 g/m2 paperboard obtained from Westrock with a thickness of 0.189 mm.
The latex consists of a styrene acrylic (SA) copolymer with a glass transition temperature of 21°C, a particle
size of 70-80 nm (Joncryl, BASF), and a solids content of 50%. In addition, a styrene butadiene (SB)
copolymer with a glass transition temperature of 0 °C (Genflo 5086 OMNOVA, Calhoun, GA, USA) with
a solids content of 50% was used and a natural rubber (NR) latex. kaolin A ((Joncryl, BASF)), kaolin
(IMERYS), talc (Specialty Minerals), and mica (Eye Candy Pigment) were used and their properties are
reported in Table 4.1. To obtain a high aspect ratio pigment that was flexible compared to the mineral
pigments, glitter (Sulyn) was used. Glitter used is made of polyethylene terephthalate (PET), that has been
metalized. The kaolins and talc were received as slurries that were diluted to 50% solids before adding to
the latex. The mica and glitter were received dry and was dispersed in water to make a 50% solids slurry
before adding to the formulation. Pigments are in different modulus that list in Table 4.1 (Chen, & Evans,
2006; Bathija, 2009; Stixrude, 2002; Pawley et al., 2002; McNeil, & Grimsditch, 1993; Chan et al., 1978).
The formulation was prepared by mixing latex and one pigment slurry at different volume ratios on a
dry basis (15%,20%,30% 40% respectively). The volume ratios were calculated by the densities of pigments
and latex. For the mix latex systems, when mixed with SA latex, SB latex and NR latex were added as
minorities that had same concentration as pigments (15%,20%,30% 40% respectively). The mixtures were
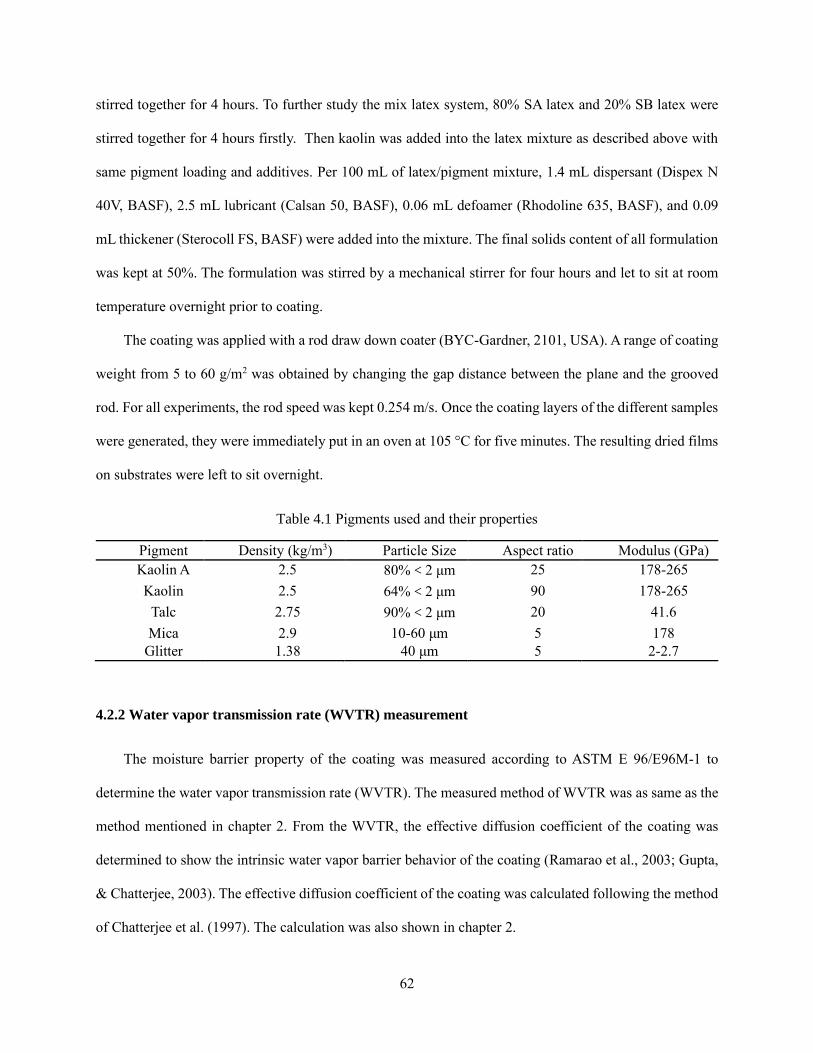
62
stirred together for 4 hours. To further study the mix latex system, 80% SA latex and 20% SB latex were
stirred together for 4 hours firstly. Then kaolin was added into the latex mixture as described above with
same pigment loading and additives. Per 100 mL of latex/pigment mixture, 1.4 mL dispersant (Dispex N
40V, BASF), 2.5 mL lubricant (Calsan 50, BASF), 0.06 mL defoamer (Rhodoline 635, BASF), and 0.09
mL thickener (Sterocoll FS, BASF) were added into the mixture. The final solids content of all formulation
was kept at 50%. The formulation was stirred by a mechanical stirrer for four hours and let to sit at room
temperature overnight prior to coating.
The coating was applied with a rod draw down coater (BYC-Gardner, 2101, USA). A range of coating
weight from 5 to 60 g/m2 was obtained by changing the gap distance between the plane and the grooved
rod. For all experiments, the rod speed was kept 0.254 m/s. Once the coating layers of the different samples
were generated, they were immediately put in an oven at 105 °C for five minutes. The resulting dried films
on substrates were left to sit overnight.
Table 4.1 Pigments used and their properties
Pigment Density (kg/m3) Particle Size Aspect ratio Modulus (GPa)
Kaolin A 2.5 80%<2 μm 25 178-265
Kaolin 2.5 64%<2 μm 90 178-265
Talc 2.75 90%<2 μm 20 41.6
Mica 2.9 10-60 μm 5 178
Glitter 1.38 40 μm 5 2-2.7
4.2.2 Water vapor transmission rate (WVTR) measurement
The moisture barrier property of the coating was measured according to ASTM E 96/E96M-1 to
determine the water vapor transmission rate (WVTR). The measured method of WVTR was as same as the
method mentioned in chapter 2. From the WVTR, the effective diffusion coefficient of the coating was
determined to show the intrinsic water vapor barrier behavior of the coating (Ramarao et al., 2003; Gupta,
& Chatterjee, 2003). The effective diffusion coefficient of the coating was calculated following the method
of Chatterjee et al. (1997). The calculation was also shown in chapter 2.

63
4.2.3 Sample folding procedure
Samples were folded follow the method used in previous work (Zhu et al., 2019). Six orthogonal and
evenly spaced folding lines were made on each coated sample corresponding to lengths of 6 and 7 cm. One
folding line was made at a time with the coating on the outside of the fold. For each fold, the paper manually
was folded at 180° and then 4200 Pa pressure was applied for five minutes to create a fold. Six folding lines
were used to increase the WVTR difference between folded and unfolded samples as compared to a single
fold.
4.3 Results and discussion
Coatings using talc were compared with coatings with kaolin pigments that was published before (Zhu
et al., 2019). Figure 4.1 presents the WVTR results on a log scale for these coatings before and after folding,
where smaller WVTR values mean increased water vapor resistance. WVTR values were compared as a
function of latex weight instead of coat weight because latex weight is a better indication of the final cost
of the barrier coating due to the relatively higher cost of latex as compared to pigments.
In Figure 4.1, the WVTR decreased with the increasing of latex weight. The initial decrease is rapid as
the barrier coating fills in the pores or passages for water vapor transmission. For coating with kaolin A the
decrease is gradual at high latex weight while for coatings with talc the decrease more rapid. At latex
weights above 30 g/m2, WVTR values of coating with these two different pigments were similar and
decreased slowly, as all the large pores are now covered and only the barrier coating thickness increases,
increasing resistance to water vapor as expected in Eq. (2.1). As a result, the fit for Eq. (2.1) best described
the higher latex WVTR results for all pigments and PVCs. which indicates that whatever coating formation
issues can be overcome with a thicker coating. The paper’s micron size pores that allow for the easy
transport of water vapor through the structure are closed when there is enough coating.
The WVTR also decreased with the increasing of pigments loading for both pigments. Increasing the
PVC is expected to decrease the WVTR to a point as the pigments increase the tortuosity of the water vapor.

64
The increase was more obvious for coating with talc, it seems less talc needed up to same barrier level to
coating with kaolin A. The difference of WVTR results before folding between talc and kaolin A was
smaller than the difference between kaolin A and GCC and plastic particles reported in previous work (Zhu
et al., 2019). It may because kaolin A and talc had similar pigment size, size distribution and aspect ratio.
The more hydrophilic kaolin A may interact more strongly with the water vapor, which might contribute to
an increased WVTR (Schuman et al., 2005).
Effective diffusion coefficients for coating with talc was calculated for each data point using Eq. (2.1)
and compared with effective diffusion coefficients of coating with kaolin A that published before to provide
a comparative number that describes the relative water vapor resistances of each coating while considering
coating thickness (see Figure 4.2). In theory, this coefficient should not be a function of coat weight. As
expected, all effective diffusion coefficients of coatings were much less than that of paper (1.6x10⁻⁷ m2/s),
demonstrating that coatings significantly slow water vapor diffusion. The paper has micrometer size pores
that allow for the easy transport of water vapor through the structure. When there is enough coating, the
pores are closed, and water vapor must diffuse through the polymer – pigment composite. The effective
diffusion coefficient of coatings was higher for lower coating weights than the high coat weights because
at low coat weights, the coating layer is not a uniform film as assumed in the development of Eq. (2.1). At
high coat weights, the value does tend to level to a constant value for all pigments and PVCs. These results
indicate that at low coat weights, defects in the barrier layer such as fine pin holes exist, which increases
the WVTR. PVCs affected more for coating with talc compared with that of kaolin A. For the talc, these
values decreased with higher pigment loading, while kaolin A did not show this decreasing trend. The
difference of the values between coating with kaolin A and talc was small at lower pigments loading (15%,
20% and 30% PVC), the values of coating with 15% kaolin A was even smaller than that of talc, while was
much larger at 40% PVC. It may because the critical pigment volume concentration (CPVC), which
determined as the point where there is just enough binder to fill in all the voids between the pigment
particles in the dry coating film (Vähä-Nissi, & Savolainen, 1999). It is assumed that there would be

65
aggregates above CPVC lead to radical increase of permeability. Asbeck (1992) pointed out that
agglomerated particles will have a lower CPVC than a well dispersed system. It is expected that CPVC of
coating with talc was higher than that of kaolin A, which lead lower diffusion for coating with talc at 40%.
The CPVC of coating with kaolin A should be around or a little lower than 40%. CPVC of coating was
influenced by latex and pigments properties (Vähä-Nissi, & Savolainen, 1999; Asbeck, 1992; Rio, & Rudin,
1996; Santamäki, 1997 ), here coating with kaolin A and talc have same latex system and these two pigments
have similar pigment size, size distribution and aspect ratio. The lower CPVC of coating with kaolin A may
be caused by the kaolin A aggregation, that was called kaolin books, the overlapping flakes resemblance
under magnification to stacks of paper. Kaolin books are bound via hydrogen bonding of the octahedral-
layer hydroxyl face of one flake to the tetrahedral-layer oxygen face of the adjacent flake (Leong et al.,
2004).
Figure 4.1 WVTR values of coatings with kaolin A and talc before and after folding for various latex
weights and PVCs. In all plots of WVTR, values of latex only coatings (black squares) are given as a
reference. The various PVCs are 15% (red circles), 20% (blue up triangles), 30% (purple down triangles)
and 40% (green diamonds). Lines are from fitting the data to Eq. (2.1).

66
Figure 4.2 Effective diffusion coefficient of latex only (black squares) coatings and coatings with kaolin A
and talc at 15% PVC (red circles), 20% PVC (blue up triangles), 30% PVC (purple down triangles), and
40% PVC (green diamonds).
The coatings were folded and the WVTR of all coatings significantly increased as shown by the right-
hand graphs in Figure 4.9. For example, the WVTR of a coating with 40% PVC talc and 20 g/m2 latex
weight were about 14 and 68 g/ (m2 day) before and after folding, respectively. Figure 4.9a summarizes the
similar significant increase in WVTR after folding coating with talc and coating with kaolin A that published
before (Zhu et al., 2019) by examining the increase in WVTR relative to the unfolded samples. Coatings
with higher PVC values had larger WVTR increases after folding than coatings with lower PVCs. This
result is expected as the strain to failure of a coating layer decreases as the PVC increases towards the
CPVC. In other words, the coatings become more brittle as shown by Prall et al. (2000), Zhu et al. (2013)
and Najafi et al. (2018). The WVTR was smallest when pigments were not present as the crack resistance
was best for pure latex systems. For a latex weight range of 15 – 25 g/m2, all folded samples had at least
twice the WVTR values as compared to the original samples, where the talc had smaller increase than kaolin
A, which may because talc was more flexible with smaller modulus. Talc is the softest known mineral and
is assigned a hardness of 1 on the Mohs Hardness scale, that of kaolin is 2-2.5 (Leong et al., 2004). The
modulus of talc and kaolin in room temperature are about 41.6 GPa (Stixrude, 2002) and 265 GPa (Chen,
& Evans, 2006) respectively.

67
This increase with folding was expected because of the potential for the folded region to crack as the
coating layer will see extensive tensile deformation. If this deformation is larger than the strain at failure of
the coating, the coating layer will crack. This result may not hold for other polymer types if the properties
of other polymers have a larger strain at failure. The smaller increase of coating with talc verified the
previous simulation work, that coating with more flexible pigments has better crack resistance.
To study the modulus effect further, coatings with mica and glitter were made on paper board. As
shown in Table 4.1, the difference of modulus between them is larger than the difference of modulus
between kaolin A and talc (McNeil, & Grimsditch, 1993; Engineering ToolBox, 2003). The coating weight
range were larger than Figure 4.1 because it was difficult to produce low coat weight ranges with the mica
and glitter due to their large size. In Figure 4.3, the WVTR decreased with increasing latex weight and
pigment addition as with kaolin and talc, but the decrease with glitter was small, the influence of PVCs was
also small for coating with glitter. Coatings with glitter did not disperse well in the latex mixture resulting
in some non-uniform distribution of particles in the coating layer. In addition, it is not clear if glitter, being
a polymer, would generate a diffusional resistance to water vapor compared to a crystalline mineral pigment.
In any case, glitter addition did not have a large effect on WVTR. For coating with mica, the influence of
PVCs and latex weight was large. The WVTR values were smaller than 5 g/ (m2 day) when latex weight
and PVC was much higher (30% PVC, 80 g/m2 latex weight) see Figure 4.3. The values did not change
much when latex weight was higher than 80 g/m2, as all the pores are covered and only the barrier coating
thickness increases, increasing resistance to water vapor as expected in Eq. (2.1).
Effective diffusion coefficients for coatings with glitter and mica was calculated for each data point
using Eq. (2.1) to provide a comparative number that describes the relative water vapor resistances of each
coating while considering coating thickness (see Figure 4.4). As same as coating with talc and kaolin A, the
coefficient should not be a function of coat weight theoretically and much smaller than that of paper (1.6x10-
7 m2/s), demonstrating that coatings significantly slow water vapor diffusion. Similar with WVTR of coating
with glitter, the effective diffusion coefficients of coating with glitter did not change obviously with

68
increasing of latex weight. For coating with mica, the values decreased with higher latex weight and tend
to level to a constant value since the sufficient coating indicating that at low coat weights, coating was not
uniform and defects in the barrier layer such as fine pin holes exist, which increases the WVTR.
For coating with glitter, the effective diffusion coefficients decreased with increasing PVCs at lower
glitter loading (15% and 20% PVCs). Effective diffusion coefficients trend to increase when PVC was 30%
and increased much at 40% PVC. CPVC may be a reason mentioned before, it is expected that coating with
glitter had a lower CPVC since the larger size and different surface chemistry (Vähä-Nissi, & Savolainen,
1999). For the mica, these values were smaller than coating with latex only and coating with glitter and
decreased with higher pigment loading. More mica made more tortuosity of the water vapor that obviously
reduced the diffusion.
Figure 4.3 WVTR values of coatings with mica and glitter before and after folding for various latex weights
and PVCs. In all plots of WVTR, values of latex only coatings (black squares) are given as a reference. The
various PVCs are 15% (red circles), 20% (blue up triangles), 30% (purple down triangles) and 40% (green
diamonds). Lines are from fitting the data to Eq. (2.1).

69
Figure 4.4 Effective diffusion coefficient of latex only (black squares) coatings and coatings with glitter
and mica at 15% PVC (red circles), 20% PVC (blue up triangles), 30% PVC (purple down triangles), and
40% PVC (green diamonds).
The WVTR of coating with mica increased much more than coatings with glitter after folding as shown
in Figure 4.3. For example, the WVTR of a coating with 40% PVC glitter and 100 g/m2 latex weight were
about 15 and 40 g/ (m2 day) before and after folding, respectively. For mica with same pigment loading and
latex weight were about 4 and 24 g/ (m2 day) before and after folding, respectively. Figure 4.9b summarizes
the increase in WVTR after folding for all of the coatings with mica and glitter. A higher latex weight range
was picked since mica and glitter have larger pigment size and the coatings with them are also made thicker
than other coatings, the range was of 50 – 100 g/m2. Coatings with higher PVC values had larger WVTR
increases after folding than coatings with lower PVCs, that was coincident with the previous simulation
work (Zhu et al. 2019). The difference of WVTR increase between coating with mica and coating with
glitter was large. The WVTR of coatings with glitter increased at most 190% after folding, while the WVTR
of folded coatings with mica increased up to 726% at 40% PVC compared with WVTR before folding.
These results further confirmed the hypothesis suggested by model simulations: flexible pigments should
lead to a decrease in damage during folding. The glitter was made of PET, the modulus was around 2.5 GPa
(Engineering ToolBox, 2003) much smaller than modulus of mica 178 GPa (McNeil, & Grimsditch, 1993).
The results indicated that the influence of modulus of pigment is significant.

70
When blending two latex types, during drying, it is expected that the latex types will form fine regions
of polymer similar in size to the initial emulsion and not a pure blend of polymers. Therefore, when a softer
(lower modulus) polymer is blended with one of high moduli, there should be a region that acts as a very
flexible pigment. The WVTR of coating with SA latex only was larger than coatings with latex mixtures
(Figure 4.5). This decrease may be caused by the low glass transition temperature (Tg) of the SB and NR
latex types in that they are more flexible in room temperature than SA latex, leading to less defects when
the samples are cut and mounted in the test. While adding SB or NR latex into SA latex didn’t decreased
the effective diffusion coefficient (Figure 4.6). WVTR of coating with SB latex only was lowest before
and after folding, but these coatings were sticky, and would lead to blocking problems during production.
For SB and NR latex types, the addition of SA latex likely would reduce blocking issues. NR latex after
drying was sticker than SB latex because NR has a lower Tg temperature. The coatings with NR were even
sticky after mixing with SA latex; this again would lead to blocking issues in an industrial situation.
The WVTR increased after folding (Figure 4.5), but the increase is small for high levels of SB or NR
latex. For example, the WVTR of a coating with 40% SB and 30 g/m2 latex weight were about 27 and 34
g/ (m2 day) before and after folding. That of NR with same volume concentration and latex weight were
about 31 and 33 g/ (m2 day) before and after folding. Figure 4.9c summarizes increase in WVTR after
folding for all of the samples by examining the increase in WVTR relative to the unfolded sample. The
WVTR increased 23% and 8% after adding 40% SB and NR into SA latex respectively, that of SA latex
only was 110%, the addition of SB and NR reduced the WVTR increase after folding by 79% and 93% at
most. Coatings became flexible after adding SB or NR latex also because SB and NR are more flexible with
lower Tg. The WVTR of coating with SB latex only increased 7%, much lower than that of SA latex. Which
was coincident with the previous simulation, the maximum strain of coating with latex only decreased
obviously with the decreasing of latex modulus. But in the experiment, the values of coating with NR only
was failed to test since the worse sticky problem. Coating was stickier when added more SB or NR,
especially for NR, the blocking problem is needed to be solved if use latex with lower Tg.

71
Figure 4.5 WVTR values of coatings with blends of different latex before and after folding for various SA
latex weights and volume concentration of the SB or NR latex. In all plots of WVTR, values of SA latex
only coatings (black squares) are given as a reference. The various volume concentration of SB latex or NR
latex are 15% (red circles), 20% (blue up triangles), 30% (purple down triangles) and 40% (green diamonds),
values of SB latex only coatings (black asterisk) are also given as a reference. WVTR of NR latex only
coatings were failed to test since the blocking problem. Lines are from fitting the data to Eq. (2.1).
Figure 4.6 Effective diffusion coefficient of SA latex only (black squares) coatings, SB latex only (black
asterisk) and coatings with various volume concentration of SB latex or NR latex at 15% PVC (red circles),
20% PVC (blue up triangles), 30% PVC (purple down triangles), and 40% PVC (green diamonds).

72
Adding pigments could relieve the blocking problem (Schuman et al., 2004). Different amount of
kaolin was added into SB latex and 80%SA and 20% SB mixture system, the results were also compared
with coating with kaolin dispersed in SA latex that was report in another paper (Zhu et al., 2019). The
addition of kaolin could solve the blocking problem, the coating with kaolin dispersed in SB latex was not
sticky after drying. The adding of kaolin decreased WVTR for all of coating with latexes as shown in Figure
4.7 because of the tortuosity of the water vapor. As same as coating with other pigments, WVTR decreased
with increasing of latex weight and PVCs. WVTR of kaolin dispersed in SB latex was lowest compared
with coating with kaolin and SA latex and kaolin and SA SB mixture latex when pigment loading and latex
weight were same. The effective diffusion coefficient of coating with kaolin and SB latex was also the
lowest.
The WVTR of all coatings increased after folding as shown in Figure 4.7, but the increase of coating
with kaolin in SB latex was lowest, for example, the WVTR of a coating with 40% kaolin in SB latex and
20 g/m2 latex weight were about 3 and 11 g/ (m2 day) before and after folding, respectively. That of kaolin
in SA latex with same volume concentration and latex weight were about 18 and 94 g/ (m2 day) before and
after folding, respectively. Figure 4.9d summarizes increase in WVTR after folding for all of the samples
by examining the increase in WVTR relative to the unfolded sample. WVTR of coating with kaolin in SA
only increase 117% at most after folding when PVC was 40%, the WVTR of coating with kaolin in SA SB
mixture latex increase a little higher (182%) after folding, while that of kaolin in SA latex increased highest
(303%) at 40% PVC. The trend was as same as coating with different latex system without pigment that
were shown in Figure 4.5 and Figure 4.9c. Latex with smaller modulus could reduce the crack when folding.
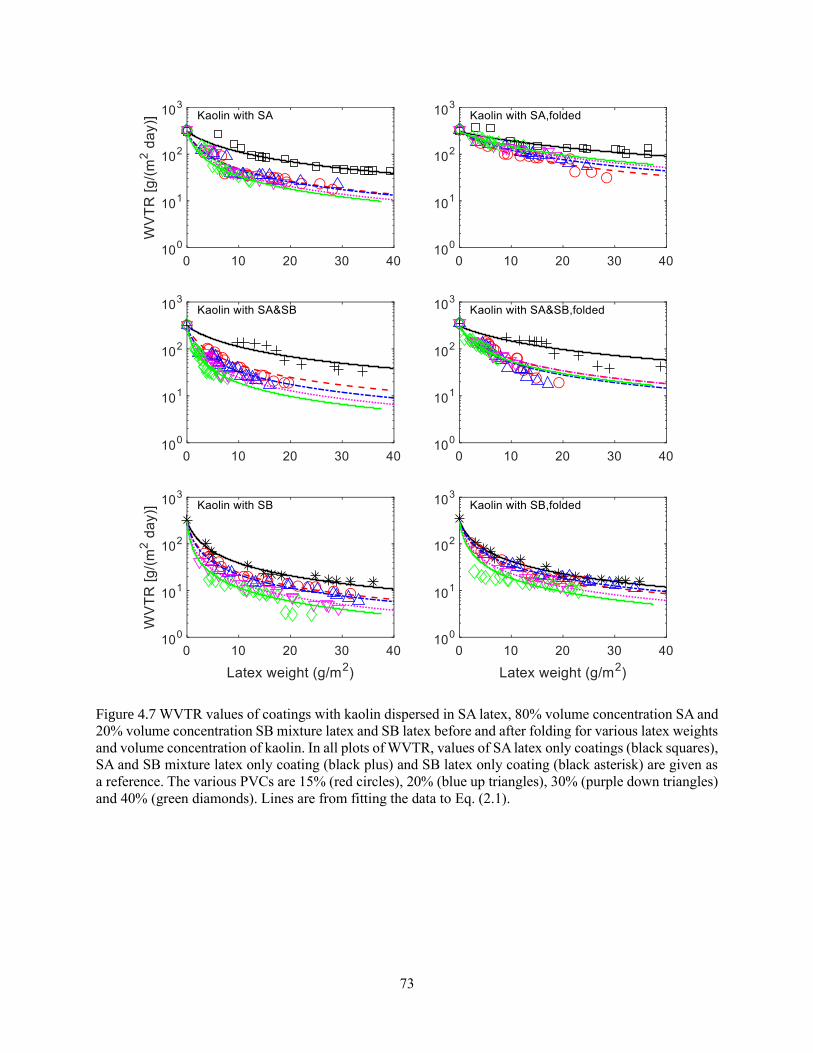
73
Figure 4.7 WVTR values of coatings with kaolin dispersed in SA latex, 80% volume concentration SA and
20% volume concentration SB mixture latex and SB latex before and after folding for various latex weights
and volume concentration of kaolin. In all plots of WVTR, values of SA latex only coatings (black squares),
SA and SB mixture latex only coating (black plus) and SB latex only coating (black asterisk) are given as
a reference. The various PVCs are 15% (red circles), 20% (blue up triangles), 30% (purple down triangles)
and 40% (green diamonds). Lines are from fitting the data to Eq. (2.1).

74
Figure 4.8 Effective diffusion coefficient of SA latex only coatings (black squares), SA and SB mixture
latex only coating (black plus) and SB latex only coating (black asterisk) and coatings with kaolin dispersed
in these latexes at 15% PVC (red circles), 20% PVC (blue up triangles), 30% PVC (purple down triangles),
and 40% PVC (green diamonds).
Figure 4.9 Average percent WVTR increase after folding for coatings with latex weight between 15 and 25
g/m2 for (a) kaolin A and talc dispersed in SA latex, (c) SB latex and NR latex mixed with SA latex and (d)
kaolin dispersed in different latex (80% SA and 20% SB) (b) glitter and mica dispersed in SA latex with
latex weight between 50 and 100 g/m2; PVC investigated. The average percent WVTR increase for SA latex
only (black line), SA and SB latex mixture (blue line) and SB latex only (purple line) between 15 and 25
g/m2 latex weight is given as a line across all PVC’s as a reference. Lines are given to connect points to
improve clarity. Data points of 0% PVC showed result of coating with latex only when latex weight was
15-25 g/m2.
(a) (b)
(c) (d)

75
4.4 Conclusion
Coating with pigments that have different modulus values, but similar size and aspect ratio were
studied. Coating with talc had better water vapor resistance than coating with kaolin A, because the kaolin
is more hydrophilic. Talc containing coatings had reduced the crack generation when folded as compared
to kaolin A because the talc had a smaller modulus. Coatings with glitter also had better crack resistance
than coatings with mica because the glitter had a lower modulus. Though, adding glitter did not significantly
improve the water vapor resistance relative to the latex. SB and NR latexes with lower modulus were more
flexible and they had a better crack resistance than SA latex. Mixing SB or NR latex with SA latex reduced
the crack damage. Adding pigment into SB latex improved the barrier property but reduced the flexibility
of SB latex coating.

76
CHAPTER 5
CONCLUSIONS AND FUTURE WORK
5.1 Conclusions
The overall goal of this research was to investigate barrier property reduction of paper coating caused
by folding and to better understand the mechanisms associated with the cracking of water borne barrier
coating layers when folded. The influence of paper, pigment and coating parameters on the barrier property
before and after folding of water borne barrier coatings were studied systematically. A finite element-based
model was developed to simulate the folding process that took into account a number of parameters
including the flexibility of the pigment. The predictions were compared to controlled bending experiments
to validate the model.
WVTR of coating with four different pigments that have different type, size, shape, aspect ratio,
modulus and pigments volume concentration (PVC) was tested before and after folding. Increasing coat
weight and PVC enhanced barrier behavior since sufficient coating and high tortuosity blocked the pores
of paper, while crack resistance was weakened with thicker coating and higher PVC, because worse folding
and higher stiffness of coating. The plate shaped pigments improved the barrier properties much better than
blocky or spherical pigments before folding, but these properties decreased with folding, such that spherical
particles with lower modulus could better retain the water vapor barrier. The increase in water vapor
transmission was due to cracks forming in the coating, where the cracks observed with plate like pigments
were larger than with the other pigments.
Systematic changes to coating parameters were modeled to understand the influence of different
parameters of coating and paper on the crack generation of water borne barrier coating during folding. A
model was developed to understand the mechanics of bending a pigmented barrier coating layer on paper.
Increasing paper and coating thicknesses are predicted to lead to an increased risk to crack since the distance

77
from outer bend to neutral plane increased. Pigment addition with high aspect ratio and modulus increased
the crack potential because strain between pigments are concentrated in the latex phase. Strain occurs in
pigments when the pigment modulus is less than or equal to the latex modulus: this strain reduces the
potential for crack formation. A large difference in modulus between the latex and pigment increased the
crack potential since strain was concentrated only to latex phase. The model predicts well the trends of the
experimental results in terms of pigment concentration and pigment shape.
Coating with talc had better water vapor resistance than coatings with kaolin that is more hydrophilic.
Talc reduced the crack generation when folded; this result likely is caused by its low modulus, allowing
strain to occur also in the pigment. Coating with glitter also had better crack resistance than coating with
mica since lower modulus of glitter but glitter could not improve water vapor resistance obviously. SB and
NR latex with lower modulus was more flexible, they had a better crack resistance than SA latex but caused
blocking problem. Mixing SA latex with SB or NR latex reduced the blocking problem. Adding pigment
into SB latex also eliminated the blocking problem but reduced the flexibility of SB latex coating.
5.2 Future work
There is a hypothesis that adding flat polymer pigments could improve crack resistance of coating
when folded. Flat polymer pigments could be generated by physical (Shin & Kim, 2012) and chemical
(Guerre et al., 2017; Letchford et al., 2007; Fossum et al., 1995) methods in the future. Spherical plastic
pigments were grinded manually at room temperature (Appendix B). The SEM results showed that spherical
plastic pigments could be made flat by grinding. WVTR of coating with plastic pigments after grinding was
shown in Appendix B.1. The difference of WVTR of coating with plastic pigments before and after grinding
(Figure B.2) was not obvious. It may because limited number of plastic pigments became flat after grinding
by hand. The efficiency to produce flat plastic pigments needs to be improved in the future. Coating with
lignin showed a good grease resistance after folding in Demers (2014)’s work. The platy lignin was made
by freezing dry, the WVTR of coating with platy lignin before and after folding was tested and shown in

78
Appendix C. The WVTR of coating with platy lignin was very high may be caused by the high pH.
In the future, the flat pigment could be accomplished by a continuous method of feeding a suspension
of latex pigments through a calender nip that may be able to flatten a large amount of flat plastic pigments.
One challenge is that aspect ratio of the flat disk may still be limited because the hollow pigments have a
finite wall thickness. Micro-cut glitter is another way to generate pigments with lower modulus. The barrier
properties could also be improved since better dispersion of micro glitter.
Chemical methods to produce flat pigments has challenges. An amphiphilic block copolymer could be
synthesized in the future, the hydrophobic core inside and hydrophilic shell outside. The shape of the
copolymer in water could be adjusted by change the length ratio of hydrophobic chain and hydrophilic
chain (Alexandridis, & Lindman, 2000). In my future, polyethylene glycol (PEG)-polyisoprene(PI),
polyethylene glycol(PEG)-polystyrene(PS) would be synthesized by sequential RAFT polymerization
(Guerre et al., 2017; Letchford et al., 2007; Fossum et al., 1995). They are all amphiphilic block copolymer.
The block copolymer would be self-assembly when put them into water. PI or PS core inside and PEG shell
outside. The shape of the copolymer in water could be adjusted by change the length ratio of hydrophobic
chain and hydrophilic chain (Alexandridis, & Lindman, 2000). Cross-linking agent would be added and
react with the copolymer (Lu et al., 2010; Hansen et al., 2004). The crosslinked hydrophobic chains would
be dispersed into water because of the hydrophilic part, and flexible because of the crosslink rubbery part.
SEM would be used to measure the particle shape.
The barrier properties of cellulose nanofibrils (CNF) film in Fein et al.’s (2020) work didn’t decrease
obviously after folding. CNF would be added into water borne barrier coating in the future, the barrier
property of coating with CNF would be test before and after folding. The reason for this result was the
layered structure that naturally formed during drying. This structure allows for strain to be concentrated
in the voids of the film, reducing or eliminating the strain in the solid material. A similar structure may be
possible for the barrier coatings of this thesis, either by incorporating a fiberous component to the coating
or by some other method.

79
The different dry method of coating would be studied in the future, the dry method (room temperature,
oven, infrared lamp and vacuum dry) and dry temperature influenced the coating properties (Mesic et al.,
2019). In previous experiment, the number and size of pinhole were affected by the drying temperature and
dry rate, that would affect the barrier properties and crack resistance of barrier coating. There were bubbles
on the surface of coating with SB latex when the temperature was high. Pinholes are expected to affect the
barrier property and crack resistance of coatings. It is important to study how to minimum pinhole when
dry in the future.
The simulation work studied the parameter effect systematically. While the model assumed linearly
elastic material and perfect adhesion between components. The material plasticity of latex could allow
higher strain with lower stress before failure, the debonding between latex and pigment could release the
stress concentration in latex and moderate local strain. The simulation may be refined in the future by
considering the experiment materials properties and the debonding between latex and pigments. 3D
modeling would be setup in the future to improve the comparability of experiment and simulation.

80
REFERENCES
Adams, J. M. (1993). Particle size and shape effects in materials science: examples from polymer and paper
systems. Clay Minerals, 28(4), 509-530.
Alam, P., Toivakka, M., Carlsson, R., Salminen, P., & Sandås, S. (2009). Balancing between fold-crack
resistance and stiffness. Journal of composite materials, 43(11), 1265-1283.
Alam, P., Xu, Q., Toivakka, M., Hämäläinen, H., & Syrjälä, S. (2007). The elastic modulus of paper coating
in tension and compression. In CD-ROM proceedings of the 2007 TAPPI Coating Conference. TAPPI Press
Atlanta, GA, USA.
Alexandridis, P., & Lindman, B. (2000). Amphiphilic block copolymers: self-assembly and applications.
Elsevier.
American Society for Testing and Materials. (2013). Standard test methods for water vapor transmission of
materials. ASTM International.
Arai, K. (2000). Recent trends in latex technology for paper coating. Japanese Journal of Paper Technology,
43(7), 23-30.
Asbeck, W. K. (1992). A critical look at CPVC performance and applications properties. Journal of Coatings
Technology, 64(806), 47-58.
Avella, M., De Vlieger, J. J., Errico, M. E., Fischer, S., Vacca, P., & Volpe, M. G. (2005). Biodegradable
starch/clay nanocomposite films for food packaging applications. Food chemistry, 93(3), 467-474.
Azadi, P., Farnood, R., & Yan, N. (2008). Discrete element modeling of the mechanical response of pigment
containing coating layers under compression. Computational materials science, 42(1), 50-56.
Azadi, P., Farnood, R., & Yan, N. (2008). Modeling the effect of pigment morphology on the dynamic
compression of coating layers using DEM. Computers & Chemical Engineering, 32(12), 3084-3089.
Barbier, C. (2004). On folding of coated papers (Doctoral dissertation, Hållfasthetslära).
Barbier, C., Larsson, P.L., & Östlund, S. (2005). Numerical investigation of folding of coated papers.
Composite Structures, 67(4), 383-394.
Bathija, A. P. (2009). Elastic properties of clays (Doctoral dissertation, Colorado School of Mines).
Bollström, R., Nyqvist, R., Preston, J., Salminen, P., & Toivakka, M. (2013). Barrier properties created by
dispersion coating. Tappi Journal, 12(4), 45-51.
Bollström, R., Saarinen, J. J., Räty, J., & Toivakka, M. (2011). Measuring solvent barrier properties of paper.
Measurement science and technology, 23(1), 015601.
Bollström, R., Tuominen, M., Määttänen, A., Peltonen, J., & Toivakka, M. (2012). Top layer coatability on
barrier coatings. Progress in organic coatings, 73(1), 26-32.

81
Brown, R. A., Budd, P. M., Price, C., & Satgurunathan, R. (1993). The permeability of poly (butyl
acrylate)/poly (vinylidene chloride-stat-acrylonitrile) core/shell emulsion polymers for use as gas barrier
coatings. European polymer journal, 29(2-3), 337-342.
Cerqueira, M. A. P. R., Pereira, R. N. C., da Silva Ramos, O. L., Teixeira, J. A. C., & Vicente, A. A. (Eds.).
(2017). Edible food packaging: Materials and processing technologies. CRC Press.
Chan, J. X., Wong, J. F., Hassan, A., Mohamad, Z., & Othman, N. (2020). Mechanical properties of
wollastonite reinforced thermoplastic composites: A review. Polymer Composites, 41(2), 395-429.
Chan, O. K., Chen, F. C., Choy, C. L., & Ward, I. M. (1978). The elastic constants of extruded polypropylene
and polyethylene terephthalate. Journal of Physics D: Applied Physics, 11(5), 617.
Chatterjee, S. G., Ramarao, B. V., & Tien, C. (1997). Water-vapour sorption equilibria of a bleached-kraft
paperboard-a study of the hysteresis region. Journal of Pulp and Paper Science, 23(8), J366-J373.
Chen, B., & Evans, J. R. (2006). Elastic moduli of clay platelets. Scripta Materialia, 54(9), 1581-1585.
Cheng, H. Y., Yang, Y. J., Li, S. C., Hong, J. Y., & Jang, G. W. (2015). Modification and extrusion coating
of polylactic acid films. Journal of Applied Polymer Science, 132(35).
Cinelli, P., Schmid, M., Bugnicourt, E., Coltelli, M. B., & Lazzeri, A. (2016). Recyclability of PET/WPI/PE
multilayer films by removal of whey protein isolate-based coatings with enzymatic detergents. Materials,
9(6), 473.
Demers, A.L. (2014). Method for the production of polymer and carbon nanofibers from lignin and other
water soluble polymers. The University of Maine.
Deshmukh, S. P., Rao, A. C., Gaval, V. R., Joseph, S., & Mahanwar, P. A. (2010). Effect of particle size and
concentration on mechanical and electrical properties of the mica filled PVC. Journal of Minerals and
Materials Characterization and Engineering, 9(09), 831.
Eksi, G., & Bousfield, D. W. (1997). Modeling of coating structure development. Tappi Journal, 80(2), 125-
135.
Engineering ToolBox, (2003). Young's Modulus - Tensile and Yield Strength for common Materials.
[online] Available at: https://www.engineeringtoolbox.com/young-modulus-d_417.html [2020, August 08].
Engineering ToolBox, (2008). Poisson's ratio. [online] Available at:
https://www.engineeringtoolbox.com/poissons-ratio-d_1224.html [2020, August 08].
Fein, K., Bousfield, D. W. & Gramlich, W. M. (2020). The influence of versatile thiol-norbornene
modifications to cellulose nanofibers on rheology and film properties. Carbohydrate Polymers, 230, 115672.
Fossum, E., Love, J.A. and Matyjaszewski, K., 1995. Synthesis and characterization of polystyrene-block-
poly (methylphenylsilylene) and polyisoprene-block-poly (methylphenylsilylene). Journal of
organometallic chemistry, 499(1-2), 253-260.
Geyer, R., Jambeck, J. R., & Law, K. L. (2017). Production, use, and fate of all plastics ever made. Science
advances, 3(7), e1700782.

82
Guerre, M., Schmidt, J., Talmon, Y., Améduri, B. and Ladmiral, V. (2017). An amphiphilic poly (vinylidene
fluoride)-b-poly (vinyl alcohol) block copolymer: synthesis and self-assembly in water. Polymer Chemistry,
8(7), 1125-1128.
Gupta, H., & Chatterjee, S. G. (2003). Parallel diffusion of moisture in paper. Part 1: Steady-state conditions.
Industrial & Engineering Chemistry Research, 42(25), 6582-6592.
Gupta, N., & Nagorny, R. (2006). Tensile properties of glass microballoon‐epoxy resin syntactic foams.
Journal of Applied Polymer Science, 102(2), 1254-1261.
Hansen, M.S., Vigild, M.E., Berg, R.H., & Ndoni, S. (2004). Nanoporous crosslinked polyisoprene from
polyisoprene—polydimethylsiloxane block copolymer. Polymer Bulletin, 51(5-6), 403-409.
Hiorns, T., & Nesbitt, T. (2003). Particle packing of blocky and platey pigments—a comparison of computer
simulations and experimental results. In Proceedings of TAPPI Advanced Coating Fundamentals
Symposium, 8-10.
Holik, H. (2006). Handbook of paper and board. John Wiley & Sons.
Huang, H., Hagman, A., & Nygårds, M. (2014). Quasi static analysis of creasing and folding for three
paperboards. Mechanics of Materials, 69(1), 11-34.
Husband, J. C., Gate, L. F., Norouzi, N., & Blair, D. (2009). The influence of kaolin shape factor on the
stiffness of coated papers. Tappi Journal, 8(6), 12-17.
Husband, J. C., Preston, J. S., Gate, L. F., Storer, A., & Creaton, P. (2006). The influence of pigment particle
shape on the in-plane tensile strength properties of kaolin-based coating layers. Tappi Journal, 5(12), 3-8.
Jabar Jr, A., Bilodeau, M. A., Neivandt, D. J., & Spender, J. (2010). U.S. Patent No. 7,737,200. Washington,
DC: U.S. Patent and Trademark Office.
Jambeck, J. R., Geyer, R., Wilcox, C., Siegler, T. R., Perryman, M., Andrady, A., ... & Law, K. L. (2015).
Plastic waste inputs from land into the ocean. Science, 347(6223), 768-771.
Johansson, C., & Järnström, L. (2002). Heat sealability and water vapor permeability of barrier dispersion
coatings. In Tappi Coating Conference and Trade Fair, 383-401.
Kaiser, K., Schmid, M., & Schlummer, M. (2017). Recycling of polymer-based multilayer packaging: a
review. Recycling, 3(1), 1.
Kan, C. S., Kim, L. H., Lee, D. I. & Van Gilder, R. L. (1996). Viscoelastic properties of paper coatings
structure/property relationship to end use performance. In Coating Conference-TAPPI, 49-60.
Kim, C.K., Lim, W.S., & Lee, Y.K. (2010). Studies on the fold-ability of coated paperboard (I): Influence
of latex on fold-ability during creasing/folding coated paperboard. Journal of Industrial and engineering
Chemistry, 16(5), 842-847.
Kuusipalo, J. (2000). PHB/V in extrusion coating of paper and paperboard: Part I: Study of functional
properties. Journal of Polymers and the Environment, 8(1), 39-47.

83
Landel, R. F., & Nielsen, L. E. (1993). Mechanical properties of polymers and composites. CRC press.
Lapčík, L., Maňas, D., Lapčíková, B., Vašina, M., Staněk, M., Čépe, K., & Rowson, N. A. (2018). Effect
of filler particle shape on plastic-elastic mechanical behavior of high density poly (ethylene)/mica and poly
(ethylene)/wollastonite composites. Composites Part B: Engineering, 141, 92-99.
Larsson, M., Engström, G., Vidal, D., & Zou, X. (2006). Compression of coating structures during
calendering. In 2006 TAPPI advanced coating fundamentals symposium.
Leong, Y. W., Abu Bakar, M. B., Ishak, Z. M., Ariffin, A., & Pukanszky, B. (2004). Comparison of the
mechanical properties and interfacial interactions between talc, kaolin, and calcium carbonate filled
polypropylene composites. Journal of Applied Polymer Science, 91(5), 3315-3326.
Lepoutre, P., & Rigdahl, M. (1989). Analysis of the effect of porosity and pigment shape on the stiffness of
coating layers. Journal of Materials Science, 24(8), 2971-2974.
Letchford, K., & Burt, H. (2007). A review of the formation and classification of amphiphilic block
copolymer nanoparticulate structures: micelles, nanospheres, nanocapsules and polymersomes. European
Journal of Pharmaceutics and Biopharmaceutics, 65(3), 259-269.
Lu, M., Zhou, J., Wang, L., Zhao, W., Lu, Y., Zhang, L., & Liu, Y. (2010). Design and preparation of cross-
linked polystyrene nanoparticles for elastomer reinforcement. Journal of Nanomaterials, 2010, 7.
Marsh, K., & Bugusu, B. (2007). Food packaging—roles, materials, and environmental issues. Journal of
food science, 72(3), R39-R55.
McNeil, L. E., & Grimsditch, M. (1993). Elastic moduli of muscovite mica. Journal of Physics: Condensed
Matter, 5(11), 1681.
Mesic, B., Cairns, M., Järnstrom, L., Le Guen, M. J., & Parr, R. (2019). Film formation and barrier
performance of latex based coating: Impact of drying temperature in a flexographic process. Progress in
Organic Coatings, 129, 43-51.
Mohs Scale of Mineral Hardness: Wikipedia article, last accessed July 2016.
Nagasawa, S., Ozawa, S., & Fukuzawa, Y. (2015). Effects of folding numbers, scoring depth and bending
velocity on bending-moment relaxation of creased paperboard. Mechanical Engineering Journal, 2(1), 14-
00346.
Najafi, S. M. H., Tajvidi, M., & Bousfield, D. W. (2018). Production and mechanical characterization of
free-standing pigmented paper coating layers with latex and starch as binder. Progress in Organic Coatings,
123, 138-145.
Najafi, S. M. H., Bousfield, D. W., & Tajvidi, M. (2019). Cracking at the fold in double layer coated paper:
the influence of latex and starch composition. TAPPI JOURNAL, 18(2), 93-99.
Najafi, S. M. H., Bousfield, D. W., & Tajvidi, M. (2019). Evaluation of the adhesion performance of latex-
starch mixtures to calcium carbonate surfaces. Nordic Pulp & Paper Research Journal, 34(3), 318-325.

84
Nyflött, Å., Meriçer, Ç., Minelli, M., Moons, E., Järnström, L., Lestelius, M., & Baschetti, M. G. (2017).
The influence of moisture content on the polymer structure of polyvinyl alcohol in dispersion barrier
coatings and its effect on the mass transport of oxygen. Journal of Coatings Technology and Research, 14(6),
1345-1355.
Nyflött Å., Moons E., Bonnerup, C., Carlsson, G., Järnström, L., & Lestelius, M. (2016). The influence of
clay orientation and crystallinity on oxygen permeation in dispersion barrier coatings. Applied Clay Science,
126, 17-24.
Oh, K., Sim, K., Jeong, Y. B., Youn, H. J., Lee, H. L., Lee, Y. M., & Yeu, S. U. (2015). Effect of coating
binder on fold cracking of coated paper. Nordic Pulp & Paper Research Journal, 30(2), 361-368.
Pawley, A. R., Clark, S. M., & Chinnery, N. J. (2002). Equation of state measurements of chlorite,
pyrophyllite and talc. American Mineralogist, 87(8-9), 1172-1182.
Piergiovanni, L., & Limbo, S. (2016). Food packaging materials. Basel, Switzerland: Springer.
Prall, K. M., Shaler, S. M. & LePoutre, P. F. (2000). Pigmented latex coatings: microstructure and
viscoelastic mechanical properties. Nordic Pulp & Paper Research Journal, 15(5), 564-571.
Purington, E., Blakeley, A. R., Bousfield, D., & Gramlich, W. M. (2017). Visualization of latex and starch
in paper coatings by tagging with fluorescent dyes. Nordic Pulp & Paper Research Journal, 32(3), 395-406.
Radhakrishnan, H., Chatterjee, S. G., & Ramarao, B. V. (2000). Steady-state moisture transport in a
bleached kraft paperboard stack. Journal of Pulp and Paper Science, 26(4), 140-144.
Ramarao, B. V., Massoquete, A., Lavrykov, S., & Ramaswamy, S. (2003). Moisture diffusion inside paper
materials in the hygroscopic range and characteristics of diffusivity parameters. Drying technology, 21(10),
2007-2056.
Rättö, P. (2004). Mechanical properties of coating layers. Journal of Pulp and Paper Science, 30 (1), 2004,
335-340.
Rio, G., & Rudin, A. (1996). Latex particle size and CPV. Progress in Organic Coatings, 28, 259-270.
Rissa, K., Vähä-Nissi, M., Lepistö, T., & Savolainen, A. (2002). Talc-filled water-based barrier coatings.
Paper and Timber, 84(7), 467-472.
Robertson, G. L. (2016). Food packaging: principles and practice. CRC press.
Ruyters, S., Mertens, J., Vassilieva, E., Dehandschutter, B., Poffijn, A., & Smolders, E. (2011). The red mud
accident in Ajka (Hungary): plant toxicity and trace metal bioavailability in red mud contaminated soil.
Environmental Science & Technology, 45, 1616-1622.
Ryan, N. M., McNally, G., & Welsh, J. (2003). The use of aqueous based barrier polymer emulsion systems
in coated carton board laminates. In Antec-Conference Proceedings, 3, 3230-3230.
Santamäki, K. (1997). Highly filled dispersions as barriers. 1st International Polymer Dispersion Coating
Conference, Tampere, Finland.
85
Seretis, G. V., Manolakos, D. E., & Provatidis, C. G. (2019). On the stainless-steel flakes reinforcement of
polymer matrix particulate composites. Composites Part B: Engineering, 162, 80-88.
Shin, H., & Kim, C. (2012). Preparation of spheroidal and elliptical particles from spherical polymer
particles by extension of polymer film. Colloid and Polymer Science, 290(13), pp.1309-1315.
Sim, K., Youn, H. J., Oh, K. D., Lee, H. L., Han, C. S., Yeu, S. U., & Lee, Y. M. (2012). Fold cracking of
coated paper: The effect of pulp fiber composition and beating. Nordic Pulp and Paper Research Journal,
27(2), 445.
Siracusa, V., Rocculi, P., Romani, S., & Dalla Rosa, M. (2008). Biodegradable polymers for food packaging:
a review. Trends in Food Science & Technology, 19(12), 634-643.
Stixrude, L. (2002). Talc under tension and compression: Spinodal instability, elasticity, and structure.
Journal of Geophysical Research: Solid Earth, 107(B12), ECV-2.
Sun, Q., Schork, F. J., & Deng, Y. (2007). Water-based polymer/clay nanocomposite suspension for
improving water and moisture barrier in coating. Composites Science and Technology, 67(9), 1823-1829.
Tirumkudulu, M.S., & Russel, W.B. (2005). Cracking in drying latex films. Langmuir, 21(11), pp.4938-
4948
Toivakka, M., & Bousfield, D. W. (2001). Modeling of coating layer mechanical properties. In TAPPI
Advanced Coating Fundamentals Symposium, 197-211.
Toivakka, M., Eklund, D., & Bousfield, D. W. (1995). Prediction of suspension viscoelasticity through
particle motion modeling. Journal of Non-Newtonian Fluid Mechanics, 56(1).
Vähä-Nissi, M., & Savolainen, A. (1999). Filled barrier dispersion coatings. In Tappi Coating Conference,
287-304.
Vidal, D., & Bertrand, F. (2006). Recent progress and challenges in the numerical modeling of coating
structure development. In Proceedings of the 2006 TAPPI Advanced Coating Fundamentals Symposium,
241.
Vidal, D., Zou, X., & Uesaka, T. (2004). Modelling coating structure development: Monte-Carlo deposition
of particles with irregular shapes. Nordic Pulp & Paper Research Journal, 19(4), 420-427.
Vidal, D., Zou, X., & Uesaka, T. (2003). Modeling coating structure development using a Monte Carlo
deposition method. Part 1: modeling methodology. Tappi Journal, 2(4), 3-8.
Vidal, D., Zou, X., & Uesaka, T. (2003). Modeling coating structure development using a Monte Carlo
deposition method. Part 2: validation of the model and case study. Tappi journal, 2(5), 16-20.
Vyörykkä, J., Zuercher, K., & Malotky, D. (2011). Aqueous polyolefin dispersion for packaging board and
papers. In Proceedings of the 11th Tappi PaperCon Conference.
Wiklund, U., Bromark, M., Larsson, M., Hedenqvist, P., & Hogmark, S. (1997). Cracking resistance of thin
hard coatings estimated by four-point bending. Surface and Coatings Technology, 91(1-2), 57-63.
Wuu, F., & Rabot, Y. (2009). High performance talc for water-based barrier coatings. TAPPI PaperCon, St.
Louis, United States May.
86
Zhu, Y., Bousfield, D., & Gramlich, W. M. (2019). The influence of pigment type and loading on water
vapor barrier properties of paper coatings before and after folding. Progress in Organic Coatings, 132, 201-
210.
Zhu, Z. (2013), Mechanical Properties of Pigment Coating Composites Containing Starch, Master Thesis.
Zou, Y., Hsieh, J. S., Mehnert, E., & Kokoszka, J. (2007). The effect of pigments and latices on the
properties of coated paper. Colloids and Surfaces A: Physicochemical and Engineering Aspects, 294(1-3),
40-45.

87
APPENDIX A
CUBIC AND HEXAGONAL PACKING OF RECTANGLES AND SPHERES
As an alternative to the maximum cubic packing of rectangles and spheres mentioned in chapter 3,
cubic and hexagonal packing of rectangles and spheres based on the pigment geometry were considered as
shown below in Figure A.1. The area and volume fractions are converted as depicted in Figure A.1.
Rectangles were packed in the 2-D model for kaolin pigments as shown in Figure A.1(a.1). The distance
between particles (∇) in length and thickness direction were equal as shown in Figure A.1(a.1). The pigment
area fraction (FA) for the kaolin pigments is the ratio of particle area to coating area given as:
FA =a ∗ c
(a + 2∇)(c + 2∇)=
αc ∗ c
(αc + 2∇)(c + 2∇) (A. 1)
where a and c are the dimensions of the kaolin shaped pigment, α is the aspect ratio (a/c) of the kaolin
shaped pigment. Here we assume the pigments followed cuboid packing in the practical experiment shown
in Figure A.1(a.2). The pigment volume fraction (PVC) was the ratio of particle volume to coating volume
as calculated by equation (A.2), larger PVC means more pigments packed.
PVC =a ∗ b ∗ c
(a + 2∇)(b + 2∇)(c + 2∇)=
αc ∗ αc ∗ c
(αc + 2∇)(αc + 2∇)(c + 2∇) (A. 2)
Here, a, b and c are the length, width and thickness of kaolin pigment, respectively; α is the aspect
ratio of the kaolin shaped pigment (c/a and c/b); ∇ is the distance between kaolin pigments in the length,
width and thickness direction. The width was assumed equal to the length of kaolin (b=a). With these
assumptions, equation (A.2) was simplified to:
FA = PVC(αc + 2∇)
αc (A. 3)

88
Equation (A.3) was normalized to thickness by dividing by c:
FA = PVC(α + 2δ)
α (A. 4)
where 𝛿 is equal to ∇ divided by c.
Approximately hexagonal circle packing was applied to 2-D model to represent the sphere plastic
pigments as shown in Figure A.1(b.1). The distance between particles in row and column direction was
assumed to be the same, both the distance in two direction are 2∇R. We assumed the hexagon shown in
Figure A.1(b.1) is regular hexagon. Calculated the FA follows
FA =πR2
2√3(R + ∇)2 (A. 5)
Here, R is radius of the particle, ∇ is half of the distance between two pigments. Assuming hexagonal
spherical packing that shown in Figure A.1(b.2), the volume fraction PVC following is given by
PVC =πR3
3√2(R + ∇)3 (A. 6)
This leads to the link between area and volume fractions for spherical pigments as
FA = PVC√6(R + ∇)
2R (A. 7)
Normalized the equation above as well, that lead to
FA = PVC√6(1 + δ)
2 (A. 8)

89
Figure A.1 Models with particles, (a.1) 2-D model with kaolin, (a.2) 3-D model with kaolin, (b.1) 2-D
model with plastic pigments, (b.2) 3-D model with plastic pigments
Using this different method to convert to FA, the comparison of experiment and simulation results
were also different, the results were shown in Figure A.2.
Figure A.2 Influence of pigment volume fraction and type on curvature at failure from experiment and
simulation.
2R
∇
(a.1) (a.2)
(b.1) (b.2)
∇∇
∇∇
2∇
2∇

90
APPENDIX B
GENERATED FLAT PLASTIC PIGMENTS BY GRINDING
Spherical plastic pigments (PP) were grinding by hand and tested the morphology by SEM (Figure
B.1). The pigments after grinding were flatter and in larger diameter. The plastic pigments (DOW) used
were as same as that used before in chapter 2, which was produced by the emulsion polymerization of
styrene. The plastic pigments slurry was diluted to 1% solids and coated on a polytetrafluoroethylene
(Teflon) sheets with thin coating thickness. The coating was peeled off and grinded by mortar and pestle
after drying in room temperature.
Figure B.1 Pigments shape before and after grinding
Plastic pigments (PP) before and after grinding were added into coatings, WVTR of theses coating was
tested and shown in Figure B.2. WVTR of coating with PP increased little after folding indicated that adding
PP did not reduce the crack resistance of coatings. While the difference of WVTR of coating with PP and
PP after grinding was small, it may because of limited number of flatter PP were generated by the grinding
method.
Average diameter is 1.04 µm Average diameter is 1.18 µm

91
Figure B.2 WVTR values of coatings with un-grinding and grinding plastic pigments before and after
folding for various latex weights and PVCs. In all plots of WVTR, values of latex only coatings (black
squares) are given as a reference.

92
APPENDIX C
GENERATED PLATY LIGNIN
In Demer’s (2014) work, platy lignin (Figure C.1) was prepared by freeze dry and added into barrier
coating which could keep good grease resistance after folding.
Figure C.1 SEM of lignin prepared by freeze dry, grease resistance test (Demer’s work)
Plate like lignin was prepared by grinding firstly. Lignin powder was dissolved into water at first,
then pour the solution into no-stick pan and let it dry in room temperature. Thin film will form after
drying. Plate like lignin particles were prepared by grinding the thin film by grinding bowl. SEM was
used to observe microstructure of original lignin powder, particles by grinding original lignin directly and
particles by grinding lignin film. The results were shown in Figure C.2. We could find that particles by
grinding lignin film is different with original lignin powder and particles after grinding the powder
directly. It seems they were platy particles. While the efficiency of this method is low because the lignin
solution was dilute and lignin film is thin.
Platy like lignin was prepared by freeze dry follow Demer’s method. Grinding lignin after freezing
dry try to get smaller lignin particles. The SEM of freeze dry particles were shown in Figure C.3. We
could find that lignin after freezing dry was platy particles and they could become smaller by grinding
freeze dry lignin.

93
Original lignin powder and freeze dry lignin after grinding was added into SB latex to make coatings.
WVTR of these coatings were tested before and after folding, the results were shown below in Figure C.4.
We could find that adding of lignin powder could not improve barrier property obviously, also they could
not weaken cracking resistance obviously. While adding of platy lignin make the barrier property much
worse.
Figure C.2 SEM of lignin powder,(a) after grinding lignin powder directly(b) (× 500), plate like lignin by
grinding lignin sheet(c)(d) (× 500,×1k).
Figure C.3 Freeze dry 5% lignin before grinding(a)×100,(b) ×1k, after grinding(c) ×100,(d)×1k.

94
Figure C.4 WVTR values of coatings with lignin before and after folding for various latex weights and
PVCs.
The surface of coating with different lignin were test by SEM, the results were shown in Figure C.5.
We could find that surface of coating with lignin powder is very fine but there were many tiny pinholes
on the surface of coating with platy lignin. The reason of pinhole was not very clear, it may because the
pH value of platy lignin. The pH value of lignin solution needs to be adjusted to 11 when make the platy
lignin, and the OH- will be left in platy lignin after freeze drying. The pH of coating formulation would
be affected when disperse the platy lignin into latex.
Figure C.5 SEM of coating with SB latex & lignin powder(a)(b), SB latex & platy lignin(c)(d).
95
BIOGRAPHY OF THE AUTHOR
Yaping Zhu was born and raised in the north of China. She graduated high school and went to Harbin
Engineering University in 2008. She majored in electrochemistry in Chemical Engineering of Harbin
Engineering University and graduated in 2012. Then she continued her master’s degree in the same field at
Tianjin University for three years. She published two papers on the core journals of China during her
master’s study. Yaping graduated from Tianjin University with a master’s degree in Chemical Engineering,
2015. Yaping started her new adventure in Chemical Engineering and Paper Surface Science Program under
the advisement of Dr. Douglas Bousfield and Dr. William Gramlich at the University of Maine as a PhD
graduate research assistant in May 2016. At Maine, she gradually sharpened her skills as a student
researcher and with the collaboration of her advisors has published in Progress in Organic Coatings in 2019
under the title “The influence of pigment type and loading on water vapor barrier properties of paper
coatings before and after folding”. Yaping is a candidate for the Doctor of Philosophy degree in Chemical
Engineering from the University of Maine in August 2020.