The Influence of Mounting Materials on Upward Flame … Project Number: The Influence of Mounting...
64
1 Project Number: <ME-ASR-1011> The Influence of Mounting Materials on Upward Flame Spread over Corrugated Cardboard A Major Qualifying Project Report Submitted to the Faculty of the WORCESTER POLYTECHNIC INSTITUTE in partial fulfillment of the requirements for the Degree of Bachelor of Science in Mechanical Engineering Submitted by: Amanda Keller Benjamin Travis Submitted To: Professor Ali S. Rangwala Michael J. Gollner (UC San Diego)
Transcript of The Influence of Mounting Materials on Upward Flame … Project Number: The Influence of Mounting...

1
Project Number: <ME-ASR-1011>
The Influence of Mounting Materials on Upward Flame
Spread over Corrugated Cardboard
A Major Qualifying Project Report
Submitted to the Faculty of the
WORCESTER POLYTECHNIC INSTITUTE
in partial fulfillment of the requirements for the
Degree of Bachelor of Science
in Mechanical Engineering
Submitted by:
Amanda Keller
Benjamin Travis
Submitted To:
Professor Ali S. Rangwala
Michael J. Gollner (UC San Diego)
2
Contents
Table of Figures ............................................................................................................................................ 3
Table of Tables ............................................................................................................................................. 4
Abstract ......................................................................................................................................................... 5
Introduction ................................................................................................................................................... 6
Background ................................................................................................................................................... 7
Current Research ....................................................................................................................................... 8
Terminology ............................................................................................................................................ 10
Methods ...................................................................................................................................................... 11
Testing Apparatus ................................................................................................................................... 11
Testing Procedure ................................................................................................................................... 14
Results ......................................................................................................................................................... 17
Mass Loss and Mass Loss Rates ............................................................................................................. 17
Thermocouple Data ................................................................................................................................. 23
Flame Height ........................................................................................................................................... 26
Pyrolysis Height ...................................................................................................................................... 27
Discussion ................................................................................................................................................... 28
Steel Backing .......................................................................................................................................... 28
Insulation ................................................................................................................................................ 28
Aluminum Honeycomb ........................................................................................................................... 28
Conclusion .................................................................................................................................................. 30
References ................................................................................................................................................... 31
Appendix A: All Data Collected ................................................................................................................. 32
Mass Loss ............................................................................................................................................... 32
Temperatures........................................................................................................................................... 33
Flame Heights ......................................................................................................................................... 41
Pryolysis Height ...................................................................................................................................... 49
Appendix B: Video Clips from Experiments .............................................................................................. 56
Steel Backing .......................................................................................................................................... 56
Insulation Backing .................................................................................................................................. 59
Aluminum Honeycomb Backing ............................................................................................................ 62

3
Table of Figures Figure 1: Warehouse fire example ............................................................................................................... 7
Figure 2: Experimental Set Up...................................................................................................................... 9
Figure 3: Plastic commodity located with the cardboard and insulation package ........................................ 9
Figure 4: Side View on Design 1 ................................................................................................................ 11
Figure 5: Front View on Design 1 .............................................................................................................. 12
Figure 6: Designed Base in Solid Works .................................................................................................... 12
Figure 7: Design 2 in Isometric View ......................................................................................................... 13
Figure 8: Picture of Stand ........................................................................................................................... 13
Figure 9: Smoke Interference ...................................................................................................................... 14
Figure 10: Thermocouples attached to the cardboard ................................................................................. 15
Figure 11: Receiver for Thermocouples ..................................................................................................... 16
Figure 12: Backings on Corrugated Cardboard .......................................................................................... 16
Figure 13: Graph for Steel Load Cell Data ................................................................................................. 17
Figure 14: Graph for Insulation Load Cell Data ......................................................................................... 19
Figure 15: Graph for Honeycomb Load Cell Data...................................................................................... 21
Figure 16: Thermocouple readings for the steel backing. ........................................................................... 23
Figure 17: Thermocouple reading for the insulation backing. .................................................................... 24
Figure 18: Thermocouple reading for the honey comb backing. ................................................................ 25
Figure 19: Best Fit lines for Flame Heights ................................................................................................ 26
Figure 20: Graphs of Pyrolysis heights ....................................................................................................... 27

4
Table of Tables
Table 1: Individual and average mass loss rates for the steel backing. ....................................................... 18
Table 2: Individual and average mass loss rates for the insulation backing. .............................................. 20
Table 3: Individual and average mass loss rates for the honey comb backing. .......................................... 22

5
Abstract The goal of this project is to investigate the influence of backing materials on the burning of
corrugated cardboard in an upright configuration. After reading and researching about warehouse fires
involving cardboard, there is an apparent need for testing on different cardboards and material infused
cardboards. The experiments consisted of four different material set ups, duplicating the ignition source
and uniform burning that occurs with each material. Temperatures of the cardboard and material backings
were gathered by mounting thermocouples into the cardboard and material backings. Mass loss data from
the cardboard was gathered from a load cell and graphed to show steady mass loss rates per unit time. The
flame height and pyrolysis height were determined from video footage and calculated through a MatLab
program.

6
Introduction The goal of this project is to investigate the influence of backing material on the burning of
corrugated cardboard in an upright configuration. Warehouse fires present tremendous hazards due to a
concentration of highly flammable materials in a confined area. In order to design adequate fire
protection, flammability properties of cardboard such as rates of flame spread and burning must be
accurately determined. Small-scale testing is often used to assess such hazards, but it was thought the
backing material holding the sample may contribute to test results. In order to study this effect, we are
testing a steel backing, insulated backing and an aluminum honeycomb backing on upward flame spread
over corrugated cardboard.

7
Background Warehouse fires cause millions of dollars of damage and injuries to civilians and responding
firefighters every year. Between the years 2003-6 an average of $124 million per year were caused due to
warehouse fires (Ahrens, 2011). Additionally, during this time it was estimated that 5 civilian deaths and
21 civilian injuries occurred each year (Ahrens, 2011). Over the past 20 years, fire prevention in
warehouses has not improved. A report from the Journal of Applied Fire Science stated that $516.3
million of damage from warehouse fires occurred from 1985-89 in the United States (Chen et al., 2007).
A steady improvement in the prevention of warehouse fires has not been seen since the early eighties.
Fire prevention has been a large research topic to stop the fires before they start and in their infant
stages. However, large amounts of warehouse fires still occur because of a lack in fire prevention
methods. A study by John Hall found that 38% of fires took place in warehouses with an automatic
sprinkler system (Ahrens, 2009). This shows that the majority of fires took place in warehouses without
proper fire prevention methods. On February 9th, 2011, in Wilmington, Massachusetts a fire in the
Contract Glass Service Building resulted in the destruction of the building. The building did not have a
proper sprinkler system due to its construction before the regulations were created (Palumbo, 2011).
Figure 1: Warehouse fire example
http://www.bostonherald.com/news/regional/view/2011_0209warehouse_catches_fire_in_wilmington/
In order to design adequate fire protection systems, it is important to know the properties of fuels
supplying the fire. A study from the Chemical Engineering Research Centre from South Bank University
in London, UK showed that 27.5% of fires in the United Kingdom involved general packaging, which
includes pallets, shrink wrap, cardboard and paper, polystyrene, and foam used in packaging (Bidgood, et
al., 1995). General packaging is typically the main fuel, or at least equally as important as the first fuel
ignited in warehouse fires.

8
Current Research
Currently research on general packaging focuses on the burning of corrugated cardboard because
of its wide use in warehouses. Research on corrugated cardboard includes studies on pyrolysis height,
flame height, and mass-loss rate.
One study looking at the effects of burning corrugated cardboard was titled Upward Flame
Spread over Corrugated Cardboard. In this study, researchers looked at the rate of upward flame spread in
the early-stages of the burn. Looking at this time in the burn would allow for a better understanding of
how to stop the fire in its infantile stages. The researchers found that the non-homogeneity of the
corrugated cardboard reduced the acceleration of the flame on the vertical surface of the cardboard
compared to traditional theories for upward flame spread. From this it was also determined that there was
a difference between the peak flame heights and the average location of the flame. (Gollner, et al.)
The experiment was set up as follows. A 530x530x510mm single-walled corrugated cardboard
box was positioned vertically with insulation positioned so only the front face was exposed. Since the
width of the cardboard was more than 300mm the width would not be a factor in the spread rate and could
be assumed to be of infinite width. The cardboard was set up on a load cell, which was used to measure
the mass loss over time. A digital camcorder and a digital SLR camera were positioned on the front and
side of the apparatus, respectively, to measure flame heights, pyrolysis heights and the flame shape. A
wetted wick was used to ignite the cardboard. The wick was positioned adjacent and under the front edge
of the cardboard. A 1MW hood was used to remove all of the fumes from the fire. (Gollner, et al.)
Additionally in this study the flame spread rate on corrugated cardboard as it is burned over time
was analyzed. In this study a non-dimensional mass transfer number, Spalding’s B-number is calculated
in order to better describe the differences between stages of combustion for a warehouse commodity, the
first of which is upward flame spread over corrugated cardboard. This scaled down experiment was used
to simulate a large rack-storage warehouse, in which cardboard boxes are stacked 20-30 feet high. The
tests showed that in the initial stages of the fire the small model was comparable to the full scale
experiments. (Gollner, et al.)
Small scale tests, using a 5x20 cm piece of corrugated cardboard were also used to assess flame
spread and burning rates. The cardboard was positioned in between three pieces of ¼ inch fiberboard
insulation which was position on the sides and backside of the cardboard inside a Cone Calorimeter. The
fiberboard insulation and cardboard were held in position by four metal screws. An ignition tray was
9
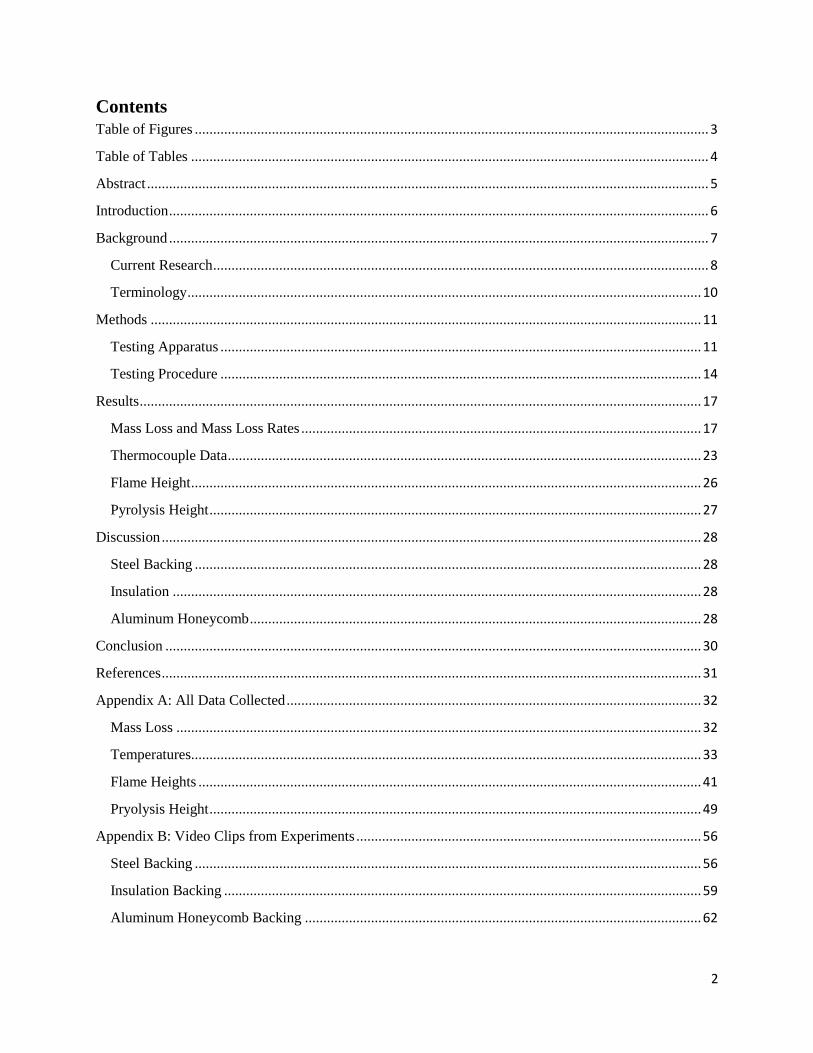
added to the base of the cardboard and contained a thin strip of fiber insulation soaked with n-Heptane.
The cardboard apparatus was positioned below an exhaust hood and on a load cell. This set up can be
seen in Figure 2. In the figure it shows a cone calorimeter, used to mount the samples; however the cone
heater was not used in the experiments. (Gollner, et al.)
Figure 2: Experimental Set Up. (Overholt et al., 2011)
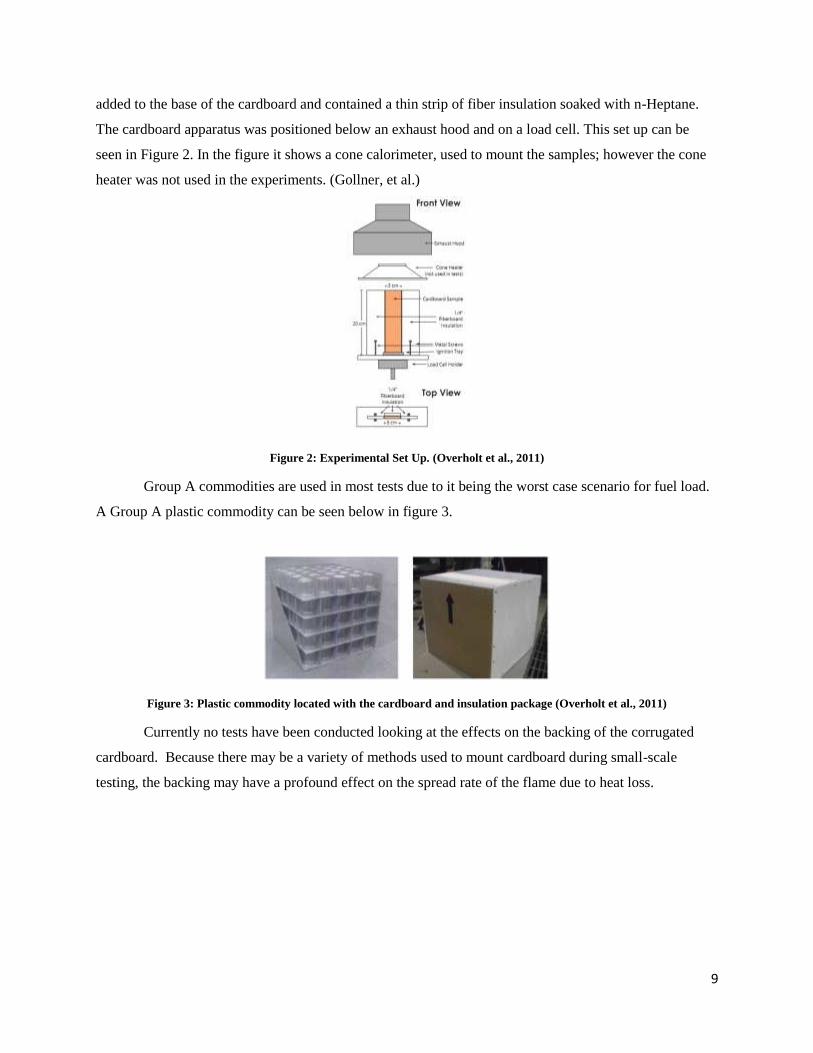
Group A commodities are used in most tests due to it being the worst case scenario for fuel load.
A Group A plastic commodity can be seen below in figure 3.
Figure 3: Plastic commodity located with the cardboard and insulation package (Overholt et al., 2011)
Currently no tests have been conducted looking at the effects on the backing of the corrugated
cardboard. Because there may be a variety of methods used to mount cardboard during small-scale
testing, the backing may have a profound effect on the spread rate of the flame due to heat loss.

10
Terminology
Flame Height – Peak height of the flame from the base of the corrugated cardboard.
Mass Loss – The function of the mass of the cardboard over time.
Mass Loss Rate – The rate of change in mass of the cardboard over time.
Pyrolysis Height – The peak height of the charred or blackened cardboard.
Load Cell – Base of the structure used to measure change in mass.
Thermocouple – A Chromel/Alumel (K-type) wire used to measure the temperature.
Terminal 1.9b – Program used to import data from the load cell and exports them to a text file.
InstaCal– Computer program used to calibrate and test the thermocouples.
TraceDAQ– A computer program used to plot the temperatures read from the thermocouples.
11
Methods
Testing Apparatus
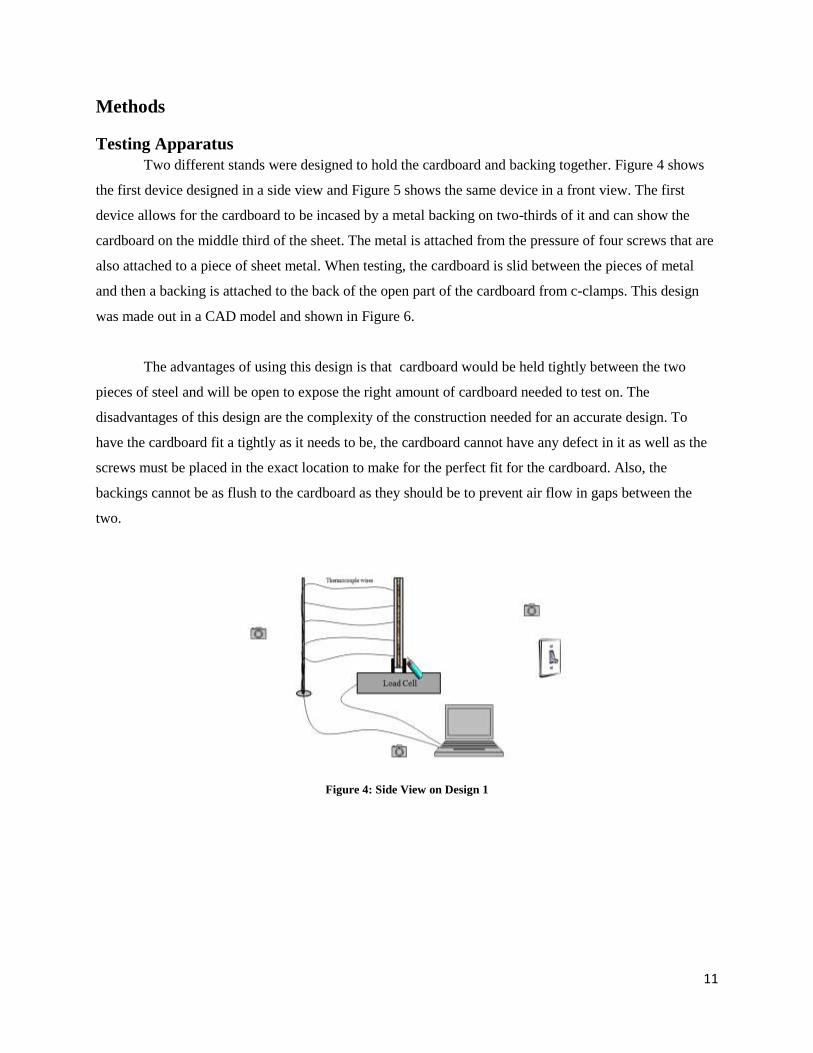
Two different stands were designed to hold the cardboard and backing together. Figure 4 shows
the first device designed in a side view and Figure 5 shows the same device in a front view. The first
device allows for the cardboard to be incased by a metal backing on two-thirds of it and can show the
cardboard on the middle third of the sheet. The metal is attached from the pressure of four screws that are
also attached to a piece of sheet metal. When testing, the cardboard is slid between the pieces of metal
and then a backing is attached to the back of the open part of the cardboard from c-clamps. This design
was made out in a CAD model and shown in Figure 6.
The advantages of using this design is that cardboard would be held tightly between the two
pieces of steel and will be open to expose the right amount of cardboard needed to test on. The
disadvantages of this design are the complexity of the construction needed for an accurate design. To
have the cardboard fit a tightly as it needs to be, the cardboard cannot have any defect in it as well as the
screws must be placed in the exact location to make for the perfect fit for the cardboard. Also, the
backings cannot be as flush to the cardboard as they should be to prevent air flow in gaps between the
two.
Figure 4: Side View on Design 1

12
Figure 5: Front View on Design 1
Figure 6: Designed Base in Solid Works
The second stand consists of a simpler design and can be manufactured with six pieces of steel.
The stand will be the same width as the pieces of cardboard being tested so the cardboard can fit perfectly
into the stand. The stand would be able to hold the cardboard and the backing together with three c-
clamps on each side of the stand. This stand preliminary design is shown in Figure 7 and Figure 8.
13
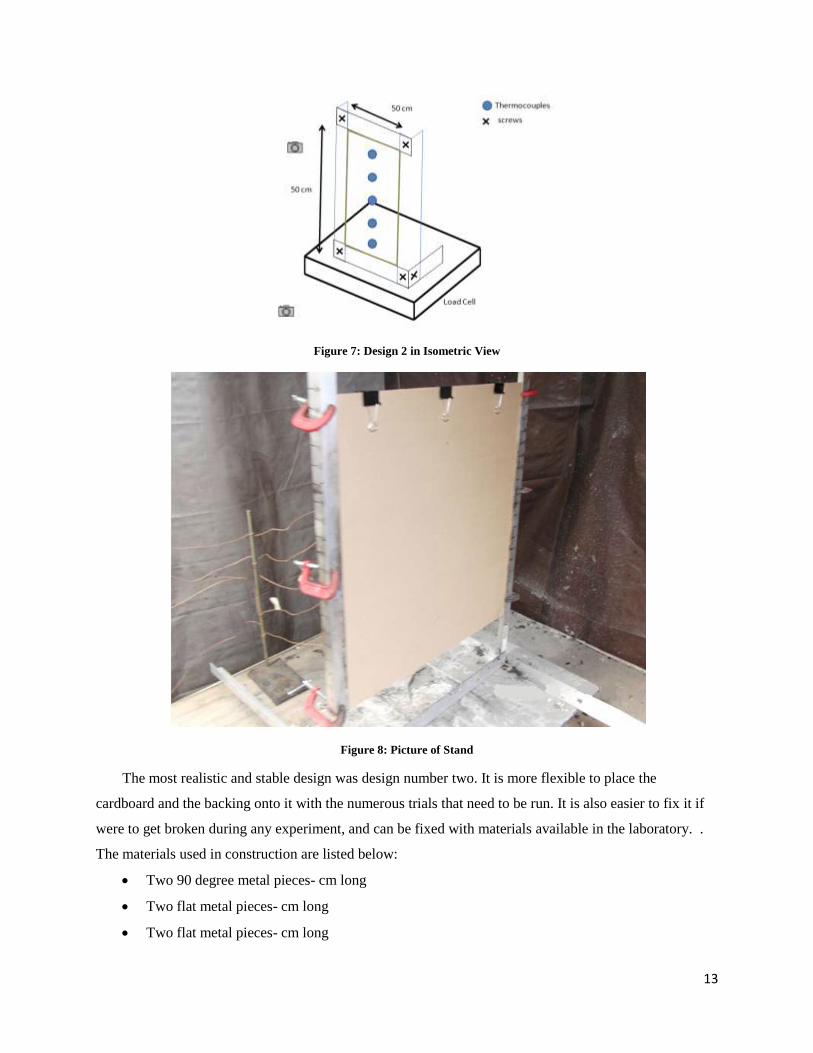
Figure 7: Design 2 in Isometric View
Figure 8: Picture of Stand
The most realistic and stable design was design number two. It is more flexible to place the
cardboard and the backing onto it with the numerous trials that need to be run. It is also easier to fix it if
were to get broken during any experiment, and can be fixed with materials available in the laboratory. .
The materials used in construction are listed below:
Two 90 degree metal pieces- cm long
Two flat metal pieces- cm long
Two flat metal pieces- cm long
14
6 screws
6 washers
6 bolts
The screws were put into the metal through holes pre-drilled by a drill press. This made for an easier fit
for the screws and then with a washer and bolt added on the other side, the vertical 90-degree metal pieces
were attached to the larger horizontal metal pieces. To put the two sides together, a 50 cm metal piece is
attached to the top of both pieces. At first, the stand was left without a piece connecting the bottom, but
after one round of testing, the stand was shown to be not stable enough to hold the cardboard and
backings for numerous tests, thus adding a stable bottom to the stand would make for a better secure
stand.
Testing Procedure
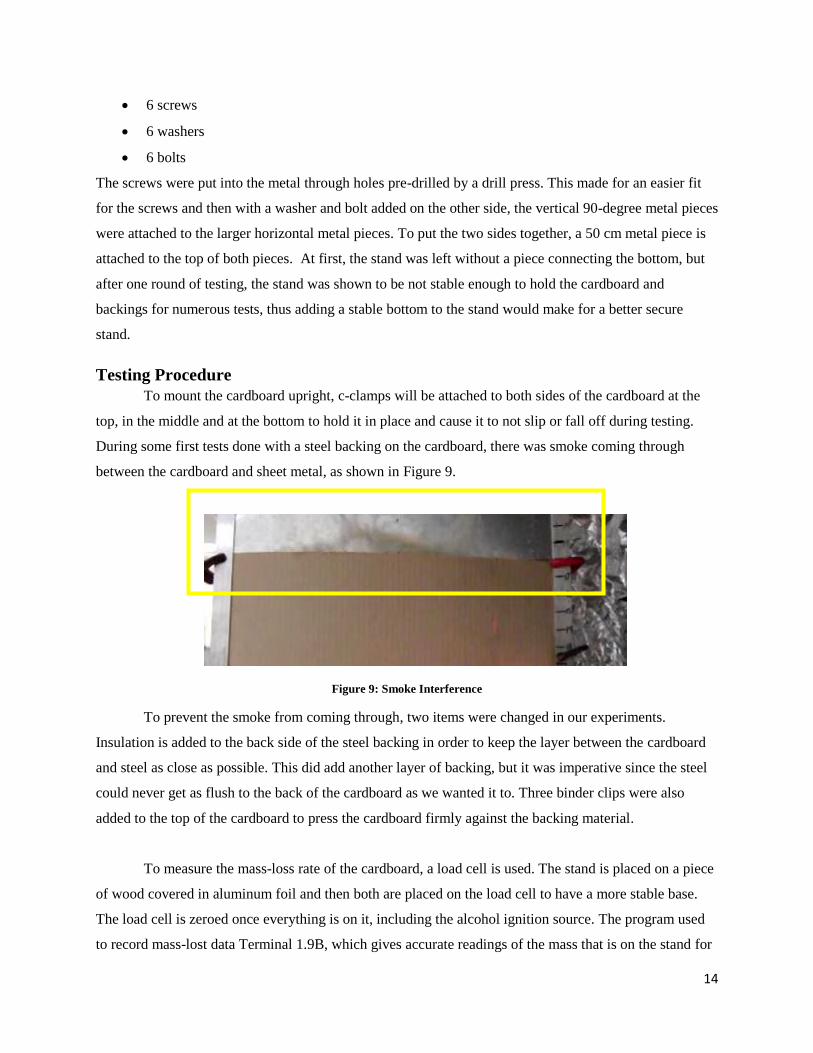
To mount the cardboard upright, c-clamps will be attached to both sides of the cardboard at the
top, in the middle and at the bottom to hold it in place and cause it to not slip or fall off during testing.
During some first tests done with a steel backing on the cardboard, there was smoke coming through
between the cardboard and sheet metal, as shown in Figure 9.
Figure 9: Smoke Interference
To prevent the smoke from coming through, two items were changed in our experiments.
Insulation is added to the back side of the steel backing in order to keep the layer between the cardboard
and steel as close as possible. This did add another layer of backing, but it was imperative since the steel
could never get as flush to the back of the cardboard as we wanted it to. Three binder clips were also
added to the top of the cardboard to press the cardboard firmly against the backing material.
To measure the mass-loss rate of the cardboard, a load cell is used. The stand is placed on a piece
of wood covered in aluminum foil and then both are placed on the load cell to have a more stable base.
The load cell is zeroed once everything is on it, including the alcohol ignition source. The program used
to record mass-lost data Terminal 1.9B, which gives accurate readings of the mass that is on the stand for

15
a certain time. This data is then put into a notepad document and then is merged into Microsoft Excel to
generate graphs.
Five thermocouples are attached to the center of the cardboard with a spacing of 8 1/3 centimeters
vertically upward. The wires were strung perpendicular to the cardboard .3 meters from the load cell and
attach to a clamp stand, as shown in Figure 10. The thermocouples will be long enough to reach the
connection box that is far enough away from the fire.
Figure 10: Thermocouples attached to the cardboard
The thermocouples are then attached on the other end to a receiver made by Measurement
Computing called the USB-1208 series, shown in Figure 11. The thermocouples on this side are attached
to different channels, yellow being on the high channel and red being on the lower channel. Each section
also needs to be grounded to the aluminum casing that is around the entirety of the receiver box. This
aluminum casing is then grounded with a wire to a grounded metal screw. This receiver is then connected
to a computer through a USB port, and is read through two programs. The first program, Instacal, is used
to confirm that all thermocouples are reading accurately and do not have an open connection. The second
program, TraceDAQ, takes the temperature readings in graphs, and then brings all the data to an excel
program that is discussed in the results.

16
Figure 11: Receiver for Thermocouples
The cardboard will be ignited the same way every time to provide an accurate test. Alcohol is the
ignition source that is placed on the cardboard. An eye dropper is used to spread the alcohol along the
bottom edge around one inch high. The cardboard is then ignited with a lighter in the middle and the
flame spreads evenly across the bottom.
Three backings are used in different experiments to test the parameters, a steel backing, insulation
and a honeycomb aluminum backing which can be seen below in Figure 12. Each test is done at least
three times, and most are done five to six times, and the data is compared in each experimental run.
k = 16 W/m K k = 0.16 W/m K k = 0.0678 W/m K
Figure 12: Backings on Corrugated Cardboard
Two cameras are set up, one looking at the front view of the cardboard and one on the side. The
side view camera is used to see the height the flame reaches as well as the outwards distance the flames
and cardboard reaches.

17
Results The results that are shown in the following sections are the best results from all experiments that
were done. In Appendix A, there are more graphs from other tests and in Appendix B there are screen
shots of different videos’ that were taken from the side and front views.
Mass Loss and Mass Loss Rates
The mass-loss rates for the three different backing materials can be seen below. The graphs were
produced in excel and showed the mass loss, in grams, as a function of time, in seconds. Each test was
plotted on excel from the beginning of the burn right until the end and some were left to burn longer than
others. The points were then fitted with a polynomial best fit line with the equation of the line and R2
value shown as well in the graph. The slope of the derivative of the best fit line is defined as the mass loss
rate and is used to compare the three different backings. The three best tests were chosen to graph based
on the similarity to the other tests.
Figure 13: Graph for Steel Load Cell Data
The three formulas are shown below with their derivation.

18
Test 1:
Test 3:
Test 5:
Figure 13 shows the average mass loss for the steel backing from the slope of the derivative.
Below are the three mass loss rates for the tests. The average mass loss rate, in grams per second,
was .
Mass Loss Rate
Test Mass Loss Rate (g/sec)
Test 1 0.0086
Test 3 0.0024
Test 5 0.0138
AVG 0.0082
Table 1: Individual and average mass loss rates for the steel backing.
19
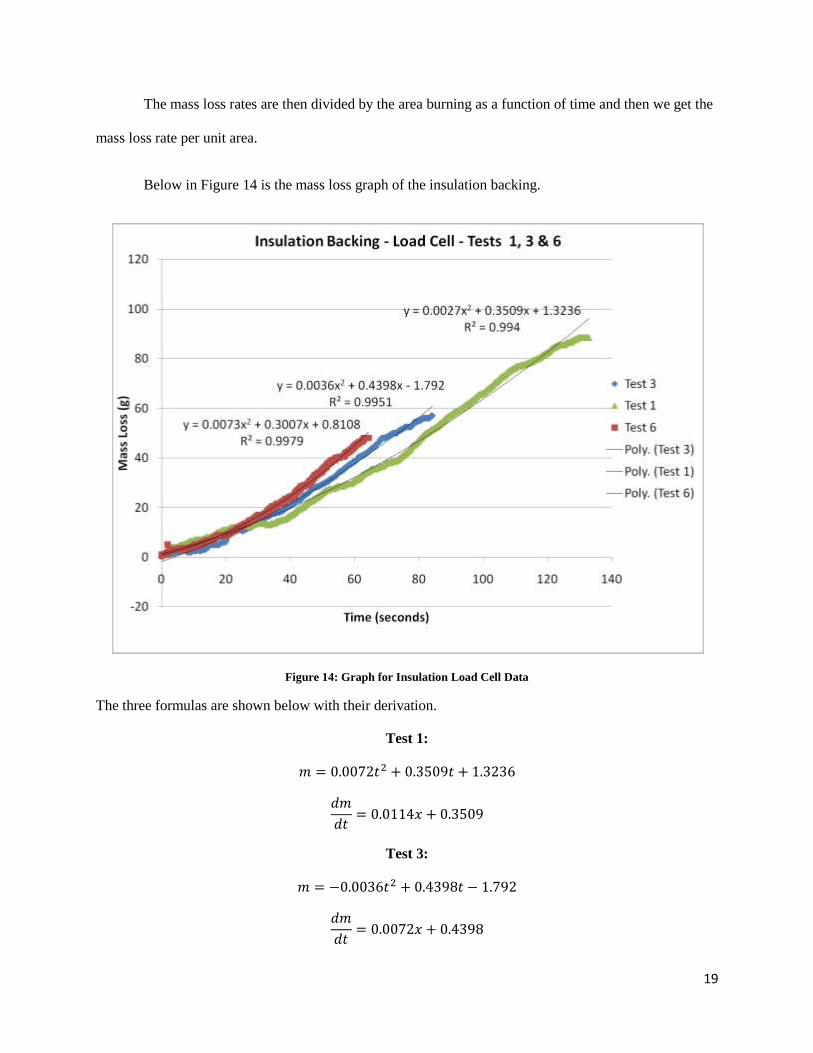
The mass loss rates are then divided by the area burning as a function of time and then we get the
mass loss rate per unit area.
Below in Figure 14 is the mass loss graph of the insulation backing.
Figure 14: Graph for Insulation Load Cell Data
The three formulas are shown below with their derivation.
Test 1:
Test 3:

20
Test 6:
The average mass loss for the steel backing from the slope of the derivative for the insulation
backing tests can be seen below. The average mass loss rate was which came out as the
second highest mass loss rate of the three backings.
Mass Loss Rate
Test Mass Loss Rate (g/sec)
Test 1 0.0072
Test 3 0.0114
Test 6 0.0146
Avg 0.011
Table 2: Individual and average mass loss rates for the insulation backing.

21
Below in Figure 15 is the graph of the mass loss and mass loss rates of the aluminum honey comb
backing.
Figure 15: Graph for Honeycomb Load Cell Data
The three formulas are shown below with their derivation.
Test 1:
Test 2:

22
Test 3:
The average mass loss for the steel backing from the slope of the derivative can be seen below.
The average mass loss rate for the honey comb backing was the highest of the three backings at
.
Mass Loss Rate
Test Mass Loss Rate (g/sec)
Test 1 0.0256
Test 2 0.002
Test 3 0.0005
AVG 0.0281
Table 3: Individual and average mass loss rates for the honey comb backing.
23
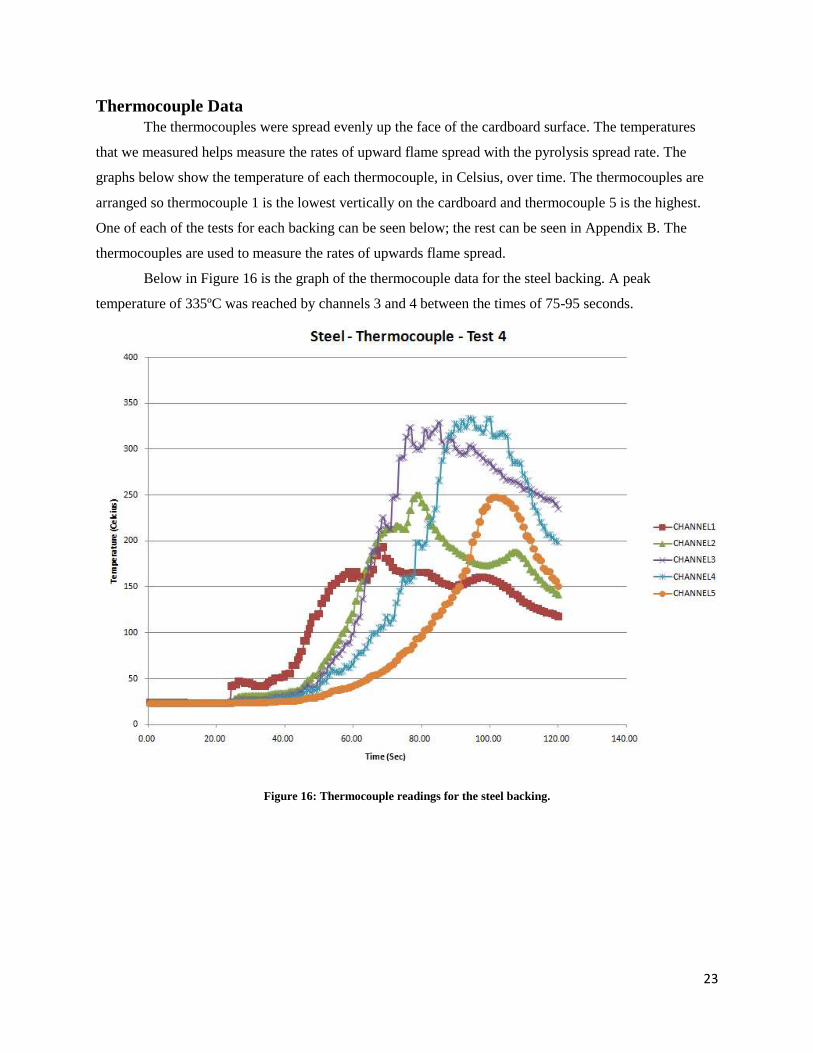
Thermocouple Data
The thermocouples were spread evenly up the face of the cardboard surface. The temperatures
that we measured helps measure the rates of upward flame spread with the pyrolysis spread rate. The
graphs below show the temperature of each thermocouple, in Celsius, over time. The thermocouples are
arranged so thermocouple 1 is the lowest vertically on the cardboard and thermocouple 5 is the highest.
One of each of the tests for each backing can be seen below; the rest can be seen in Appendix B. The
thermocouples are used to measure the rates of upwards flame spread.
Below in Figure 16 is the graph of the thermocouple data for the steel backing. A peak
temperature of 335ºC was reached by channels 3 and 4 between the times of 75-95 seconds.
Figure 16: Thermocouple readings for the steel backing.

24
The graph of the insulation backing thermocouple data can be seen below in Figure 17. The
maximum temperature reading of 440ºC was reached by channel 3 at 72 seconds. The peak temperature
was the second highest of the three backings.
Figure 17: Thermocouple reading for the insulation backing.

25
Below in Figure 18 is the graph of the thermocouple readings of the honey comb backing. The
peak temperature of 505ºC was reached at channel 1 at 65 seconds. This was the highest temperature
reached in the three backing tests.
Figure 18: Thermocouple reading for the honey comb backing.

26
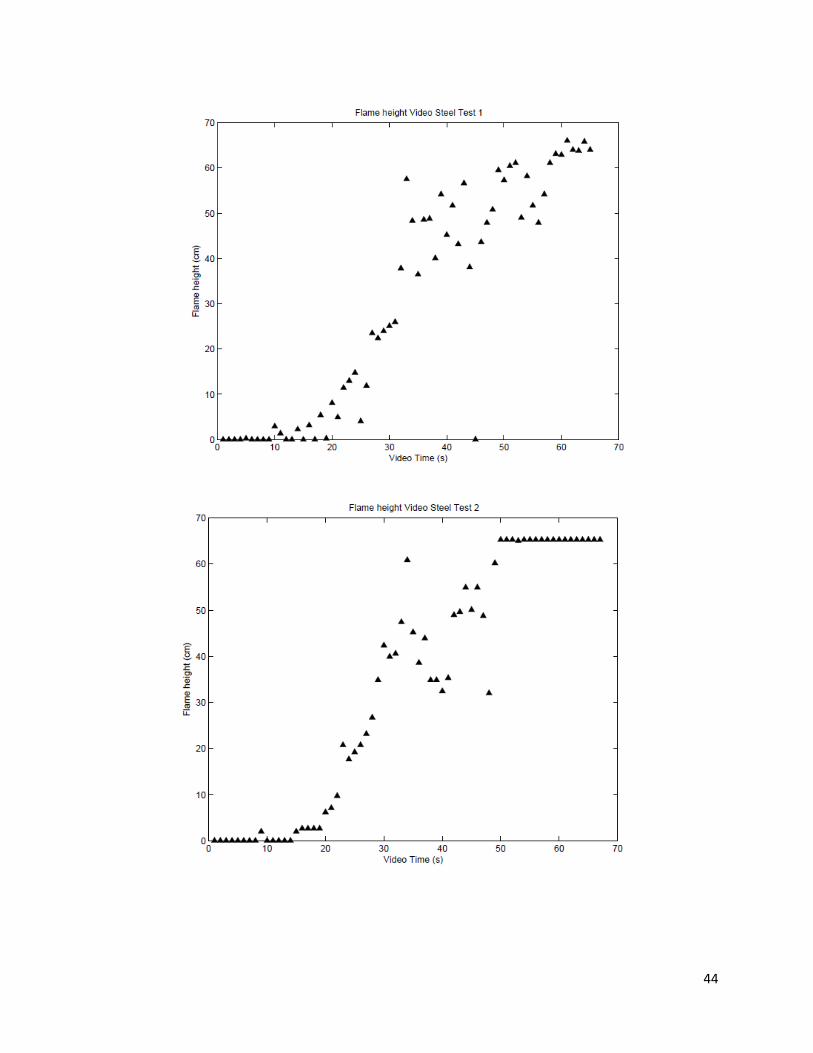
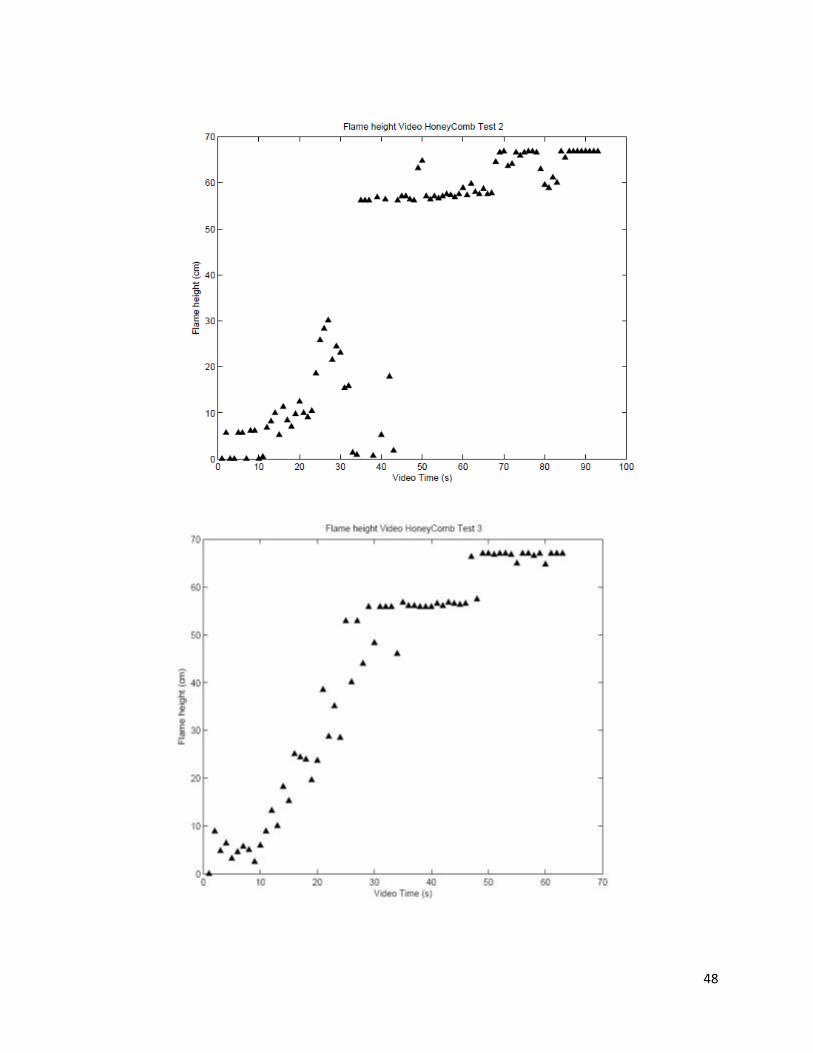
Flame Height
The graphs of the flame heights for each backing can be seen in Appendix A. The y-axis shows
the flame height, in centimeters, and the x-axis shows the time in seconds. The average peak flame height
at each second is shown as a triangle. The peak flame height measureable was 67cm, due to the height of
the camera. This value was 17cm above the height of the cardboard.
The graph below in Figure shows the upward spread region for one of each type of tests, steel in
red, insulation in blue, and aluminum honeycomb in green. The test that increased the most and had the
largest slope was the honeycomb. The height increased the most over time, then steel and last was
insulation, but they were both very close and intersected at a time around 20 seconds.
Figure 19: Best Fit lines for Flame Heights
Taking the time that the three best tests reached the height of the cardboard, (50cm) shows the
peak flame height at different times. The steel backing reached a peak flame height at 45 seconds which
was the slowest of the three tests. The peak flame height for the insulation backing was 38 seconds, the
second fastest peak flame height. The peak flame height for the aluminum honey comb was around 30
0
20
40
60
80
100
120
0 10 20 30 40 50 60 70 80
Flam
e H
eig
ht
(cm
)
Time (sec)
Flame Height - Best Fit Lines
Insulation
Steel
HoneyComb
27
seconds when it reached a plateau at 50cm before it increased to 68cm. This was the fastest of the three
tests.
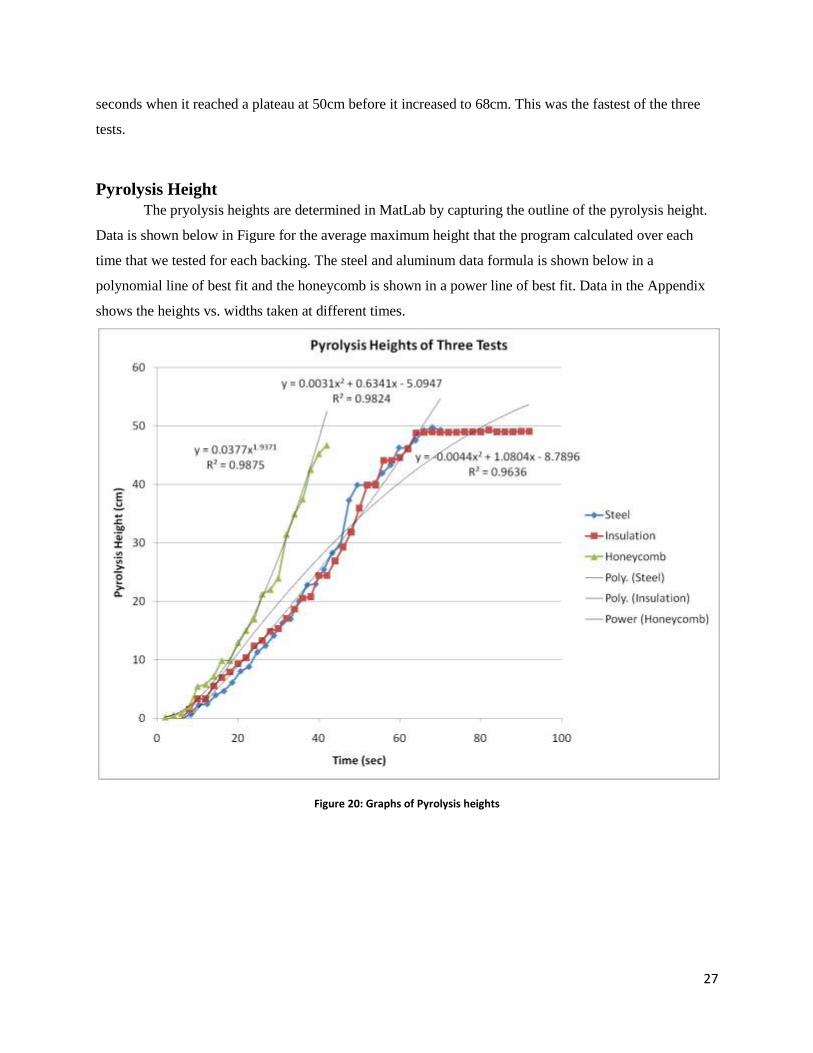
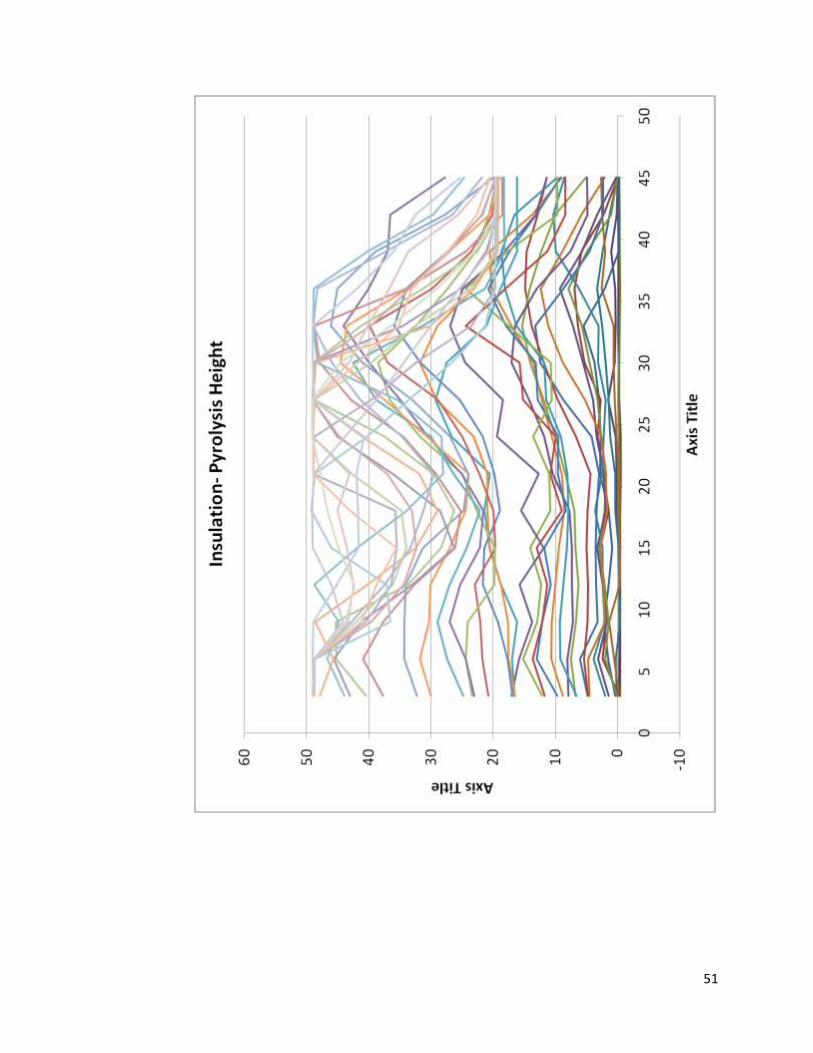
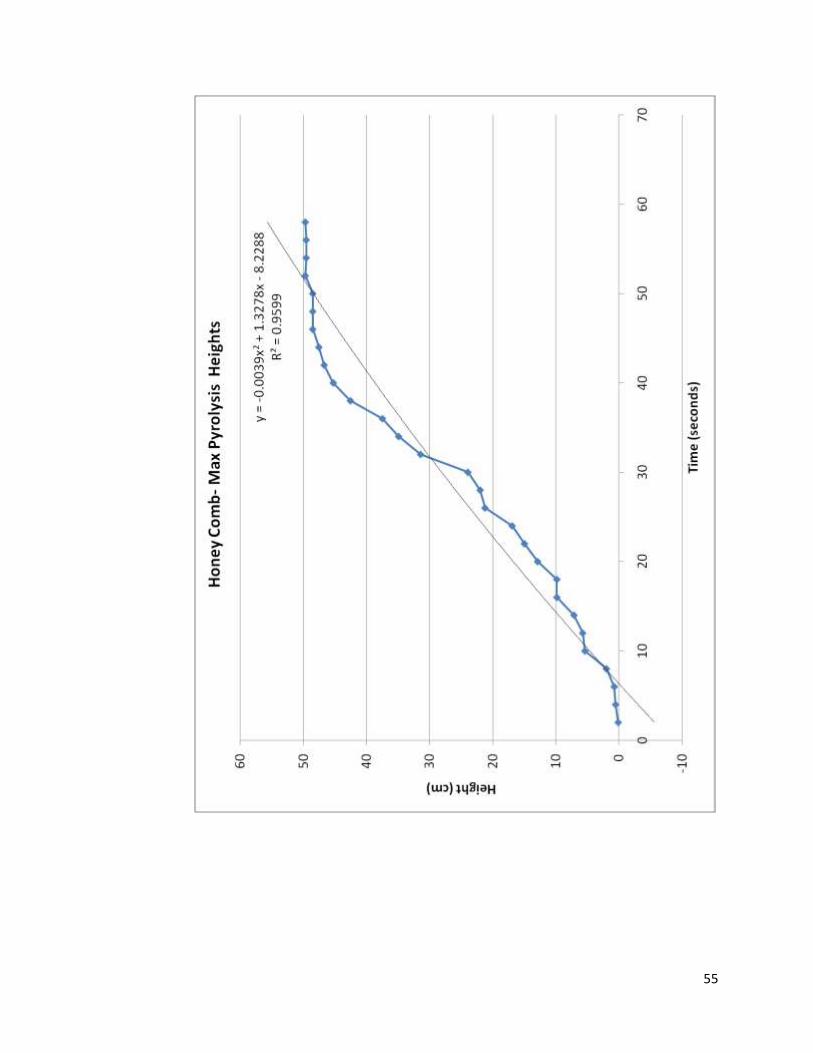
Pyrolysis Height
The pryolysis heights are determined in MatLab by capturing the outline of the pyrolysis height.
Data is shown below in Figure for the average maximum height that the program calculated over each
time that we tested for each backing. The steel and aluminum data formula is shown below in a
polynomial line of best fit and the honeycomb is shown in a power line of best fit. Data in the Appendix
shows the heights vs. widths taken at different times.
Figure 20: Graphs of Pyrolysis heights
28
Discussion The data analyzed above is summarized below relating to each backing that we tested. The tests
are also compared to previous testing done for accuracy and relation to the data that was collected.
Looking at each backing individually draws a conclusion on what backing should work the best to slow
down the flame rate and height on corrugated cardboard.
Steel Backing
The steel backing mass loss rate is the lowest of the three tests. This is due to the thermal
conductivity of the steel backing (16W/m K) and its ability to remove heat from the cardboard. Removing
heat from the cardboard causes the burn rate to decrease resulting in a much lower mass loss rate and a
comparable flame height. Originally only steel was used for the backing but warped due to changes in
temperature and allowed air flow between the cardboard and the steel. This problem was solved by
putting a sheet of insulation behind the steel backing. This resulted in data more comparable to just
insulation backing than if the steel was open to air because of the differences in thermal conductivity of
air compared to insulation.
Insulation
The insulation tests were the most accurate in all the tests. It had the second lowest mass loss rate
which was due to its thermal conductivity 0.16W/m K which is smaller than that of steel. The lower
thermal conductivity prevents more heat loss through the backing than that of steel which results in a
lower mass loss rate and comparable flame heights. Due to the accuracy of the tests and its comparable
results to the steel backing, insulation would be the best solution.
Aluminum Honeycomb
Looking at the honeycomb backing, it can be deducted from different tests that it has the highest
mass loss rate, highest flame spread and it reaches the highest temperature. This is because the
honeycomb feature creates higher air flow as well as the thermal conductivity is more similar to air
(0.0678 W/m K for the honeycomb vs. 0.024 for air) than any of the other ones. With the higher air flow
more air is able to fuel the fire and adds to the temperature and flame size/height.
In comparison to the burning of a Group A plastic commodity, such as Polystyrene it is apparent
that the mass loss rate is comparable. In the tests of the polystyrene the mass loss rates ranged between
0.015 and 0.32 g/s between 5-40 seconds. The mass loss rate for the honeycomb backing read 0.0281 g/s.
It is apparent that they are comparable, much more so than the mass loss rates of the steel and insulation
backings of 0.0082 and 0.011 g/s, respectively.
The flame heights are not similar. The tests on polystyrene produced flame heights ranging from
just above 5cm at 0 seconds to 20cm at 80 seconds. The honeycomb backing showed flame heights

29
ranging from 5cm at 10 seconds to 63 cm at 30 seconds. It is apparent from the data that the two flame
heights are not comparable. This could be due to differences in material properties and affects from the
fume hood.
These sets of data show that honeycomb backing on corrugated cardboard can be used as a
substitute for a Group Plastic A plastic commodity such as polystyrene. This is due to the extra air flow
and supply generated from the segments of the honeycomb.

30
Conclusion The reason that the aluminum honeycomb had the highest mass loss rate, temperature and flame
height was because of the air that could flow between the insulation and the cardboard. With the extra air,
there is more oxygen flow and that creates a bigger fire in less time. This backing relates more with tests
that we researched with Group A plastic commodities. With the aluminums honeycomb, the
recommendation would be to either make the holes smaller or try to shut off the airflow even more by
pressing the insulation backing onto the aluminum even more than we could with binder clips.
Our insulation tests were the most accurate all across the board and insulation was the material
used to back the steel as well. Without insulation on the steel, it warped and was not strong enough to
withhold the temperatures that the cardboard reached. Stronger steel than we had could help stop the
warping.
31
References Ahrens, Marty. “Warehouse Fires Excluding Cold Storage.” National Fire Protection Association. N.p.,
Feb. 2009. Web. 2 Apr. 2011.
Bidgood, Christopher M., and Philip F. Nolan. “Warehouse Fires in the UK Involving Solid Materials.”
Journal Loss Prevention Process Ind. 8.1 (1995): 11-16.
Chen, Cheng-Tung, et al. “Research on Fire Safety Assessment for Warehouses in Taiwan.” Journal of
Applied Fire Science 17.1 (2007-2008): 1-20.
Gollner, M.J., Overholt, K., Williams, F.A., Rangwala, A.S. and Perricone, J., Warehouse commodity
classification from fundamental principles. Part I: commodity and burning rates, Fire Safety
Journal. doi:10.1016/j.firesaf.2011.03.002
Gollner, M.J., Williams, F.A., and Rangwala, A.S. Upward flame spread over corrugated cardboard.
Combustion and Flame. DOI: 10.1016/j.combustflame.2010.12.005Hinton, James. “Warehouse
Catches Fire in Wilmington.” Boston Herald 9 Feb. 2011: n. pag. bostonherald.com. Web. 2 Apr.
2011. <http://www.bostonherald.com/news/regional/view/
2011_0209warehouse_catches_fire_in_wilmington/>.
Overholt, K., Gollner, M.J., Williams, F.A., Rangwala, A.S. and Perricone, J., Warehouse commodity
classification from fundamental principles. Part II: flame height prediction. Under Review, Fire
Safety Journal. 2010. Palumbo, Alysha. “Firefighters Battle Blaze at Glass Warehouse.” NECN 9
Feb. 2011: n. pag. NECN.com. Web. 3 Apr. 2011. <http://www.necn.com/02/09/11/Major-fire-
breaks-out-in-Wilmington-Mass/landing_newengland.html?blockID=407051&feedID=4206>.

32
Appendix A: All Data Collected
Mass Loss

33
Temperatures

34

35

36

37

38

39

40

41
Flame Heights
The first three graphs shows the data in excel of each test. The next graphs are directly from the MatLab
file that they were derived from.
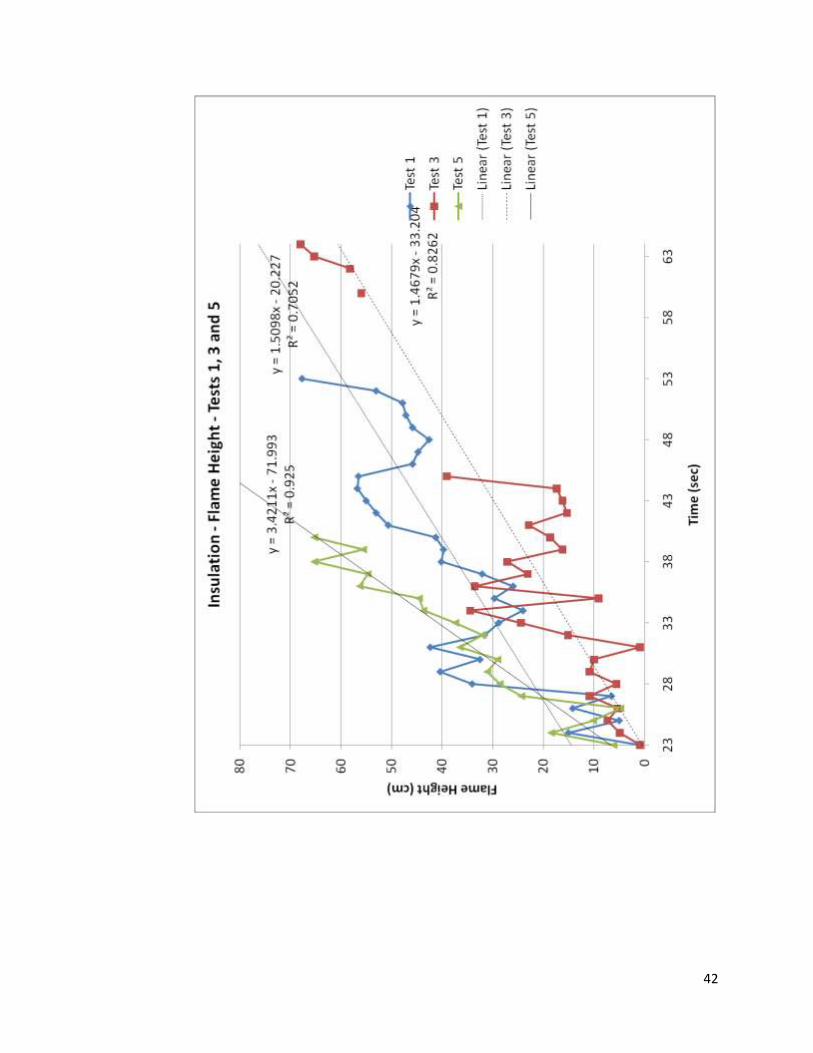
42

43
44

45

46

47
48

49
Pryolysis Height

50
51

52

53

54
55

56
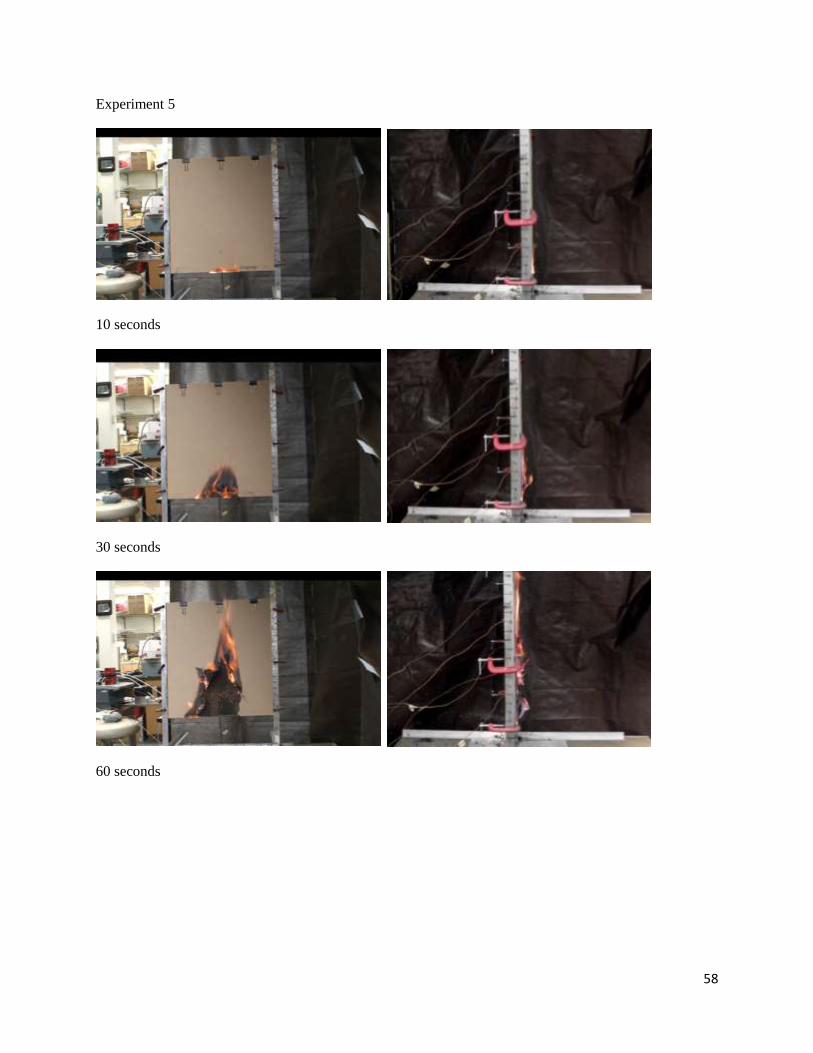
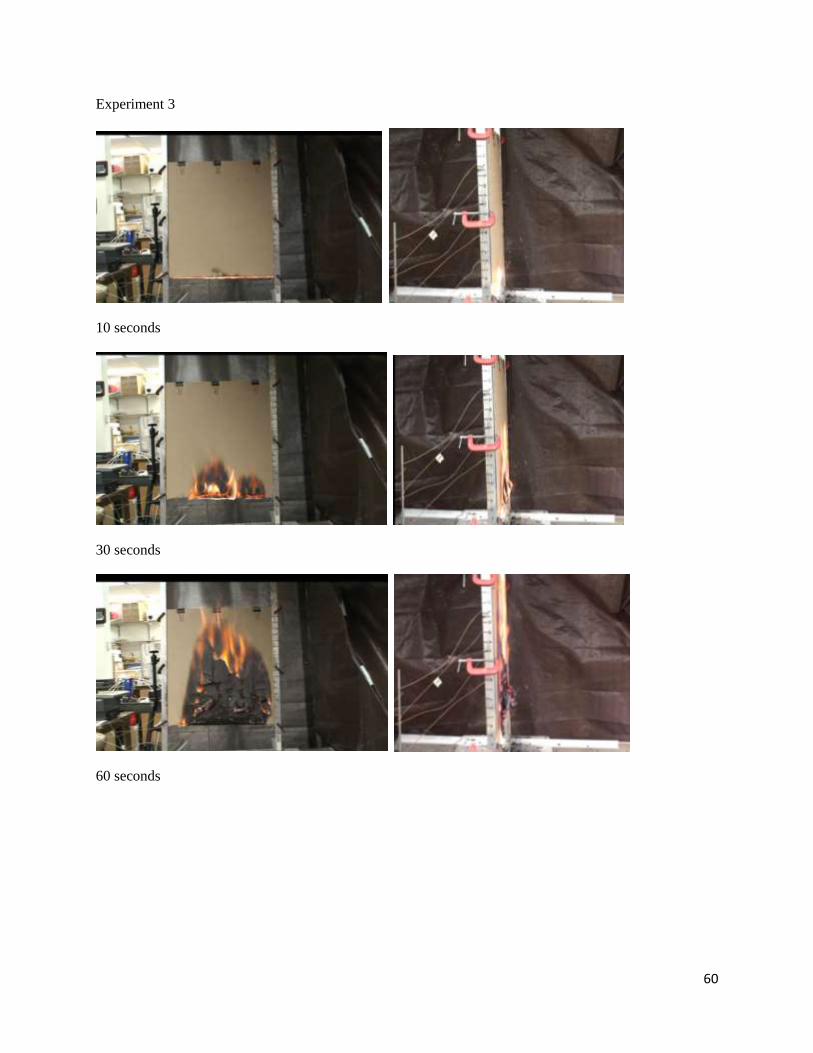
Appendix B: Video Clips from Experiments Intervals are shown after 10 seconds, 30 seconds and 60 seconds of burning. Only three videos are shown
from each backing, the experiments that we used to collect or mass loss data.
Steel Backing
Experiment 1
10 seconds
30 seconds
60 seconds

57
Experiment 2
10 seconds
30 seconds
60 seconds
58
Experiment 5
10 seconds
30 seconds
60 seconds

59
Insulation Backing
Experiment 1
10 seconds
30 seconds
60 seconds
60
Experiment 3
10 seconds
30 seconds
60 seconds

61
Experiment 6
10 seconds
30 seconds
60 seconds

62
Aluminum Honeycomb Backing
Experiment 1
10 seconds
30 seconds
60 seconds

63
Experiment 2
10 seconds
30 seconds
60 seconds

64
Experiment 3
10 seconds
30 seconds
60 seconds


![60-0033 - Q354 Flame Sensor · The flame sensor is best when about I in. [25 mm] of flame rod is immersed in the burner flame. Refer to Fig. I. A bent flame rod, bent mounting bracket,](https://static.fdocuments.us/doc/165x107/6043203917fea202120ab8b8/60-0033-q354-flame-sensor-the-flame-sensor-is-best-when-about-i-in-25-mm-of.jpg)