How is language proficiency measured: which aspects of proficiency ...

The Influence of Language Proficiency on Lexical SemanticProcessing in Native and Late Learners of English
Aaron J. Newman1, Antoine Tremblay2*, Emily S. Nichols1,Helen J. Neville3, and Michael T. Ullman2
Abstract
■ We investigated the influence of English proficiency on ERPselicited by lexical semantic violations in English sentences, inboth native English speakers and native Spanish speakers wholearned English in adulthood. All participants were administereda standardized test of English proficiency, and data were analyzedusing linear mixed effects (LME) modeling. Relative to nativelearners, late learners showed reduced amplitude and delayedonset of the N400 component associated with reading semanticviolations. As well, after the N400 late learners showed reducedanterior negative scalp potentials and increased posterior poten-tials. In both native and late learners, N400 amplitudes to seman-tically appropriate words were larger for people with lowerEnglish proficiency. N400 amplitudes to semantic violations,
however, were not influenced by proficiency. Although bothN400 onset latency and the late ERP effects differed betweenL1 and L2 learners, neither correlated with proficiency. Differentapproaches to dealing with the high degree of correlation be-tween proficiency and native/late learner group status are dis-cussed in the context of LME modeling. The results thusindicate that proficiency can modulate ERP effects in both L1and L2 learners, and for some measures (in this case, N400amplitude), L1–L2 differences may be entirely accounted for byproficiency. On the other hand, not all effects of L2 learning canbe attributed to proficiency. Rather, the differences in N400onset and the post-N400 violation effects appear to reflect fun-damental differences in L1–L2 processing. ■
INTRODUCTION
With increasing age of acquisition (AoA) of a second lan-guage (L2), evidence suggests decreasing ultimate achieve-ment and increasing variance of proficiency amongindividuals (Birdsong &Molis, 2001; Flege, Yeni-Komshian,& Liu, 1999; Johnson & Newport, 1989). The reasons forthese changes in language learning ability are not well un-derstood and likely involve a combination of maturationalchanges, differences in social and learning environments,and the cumulative effects of learning and use of an L1 overtime (Morgan-Short, Sanz, & Ullman, 2010; Weber-Fox &Neville, 1996; Johnson & Newport, 1989; Lenneberg,1967). One approach to better understanding the effectsof age on L2 abilities is the use of neuroimaging techniquessuch as ERPs and fMRI. Studies have typically comparedhighly proficient L1 speakers with L2 speakers of varying(and generally lower) proficiency. Because L1/L2 statusand proficiency are confounded, it is often unclear whetherany observed L1–L2 differences are attributable to L2s beingprocessed in qualitatively different ways from L1s or simplybecause of differences in the amount of effort required forlanguage processing. The answer to this question funda-
mentally impacts how we interpret neuroimaging studiesof L2 learners. One approach to this question is to compareL1 and L2 learners of comparable proficiency, but differingAoA. However, because most L2 learners do not achievenative levels of proficiency, such an approach is restrictedeither to a narrow sample of L2 learners, or compareshigher-than-average proficiency L2 learners with lower-than-average L1 learners. An additional concern is thatmoststudies seem to treat L1 learners as having universallymaximal proficiency, when in fact their scores on vocabu-lary and grammar tests vary (Hammill, Brown, Larsen, &Wiederholt, 1994). In this study, we addressed these issuesdirectly by measuring both brain activation using ERPsand English proficiency in both L1 and L2 learners, treatingproficiency as a continuous variable.
Several studies have previously demonstrated effects ofproficiency in L2 learners. Some areas show increasedactivation among more proficient learners. Using fMRI,Wartenburger et al. (2003) found that high-proficiency latelearners showed greater activation than lower-proficiencylate learners in temporo-parietal regions when performinga grammatical judgment task in their L2, thus suggestingthat activation in this area is sensitive to proficiency whenAoA is controlled. Newman-Norlund, Frey, Petitto, andGrafton (2006) found an effect of proficiency in the leftinferior frontal gyrus (LIFG) activation in a longitudinalstudy of artificial grammar learning, with activation during
1Dalhousie University, 2Georgetown University, 3University ofOregon*Antoine Tremblay is now at the Issak Walton Killam HealthCentre.
© 2012 Massachusetts Institute of Technology Journal of Cognitive Neuroscience 24:5, pp. 1205–1223

sentence processing increasing as mastery of the languageincreased. Conversely, Meschyan and Hernandez (2006)found greater activation of components of the articula-tory motor system when Spanish–English bilingualsread words in their less proficient L1 than in their moreproficient L2.
Not all differences in brain activation between L1 and L2learners can be attributed to proficiency, however. Forexample, when late L2 learners were compared with earlyL2 learners of comparable high proficiency, greater activa-tion was found in the LIFG—an effect of later acquisitionwhere the possible effect of proficiency was controlled for(Wartenburger et al., 2003). Similarly, Perani et al. (2003)found increased LIFG activity for a phonological fluencytask performed in L2 versus L1, in early L2 learners whowere assumed to have relatively high proficiency (althoughproficiency was not explicitly measured). These studiesprovide evidence that separable effects of proficiency andAoA may be detected using neuroimaging.
Several ERP studies have also investigated the relation-ship between proficiency and brain activation in L2 learn-ers. These studies generally report more native-likepatterns of scalp activity in more proficient L2 learners.The ERP components that have been most studied arethe following: the N400, a negativity peaking around400 msec postword onset, which is larger for semanticallyanomalous than congruent words; the P600, a positivitythat is typically larger in response to syntactic violations;and a LAN around 150–500 msec, which is also sensitiveto syntactic congruity. In studies of both lexical semanticand syntactic processing, less proficient learners showdelayed onsets and/or peaks of components, reducedamplitudes, and in some cases qualitatively different oreven absent components (Midgley, Holcomb, & Grainger,2009; Hahne, Mueller, & Clahsen, 2006; Rossi, Gugler,Friederici, & Hahne, 2006; Elston-Güttler, Paulmann, &Kotz, 2005; Moreno & Kutas, 2005; Ojima, Nakata, & Kakigi,2005; Kotz & Elston-Güttler, 2004; Phillips, Segalowitz,Brien, & Yamasaki, 2004). Similar results have been foundin studies of artificial or miniature languages where thelanguage exposure is known and controlled (Morgan-Shortet al., 2010; Mueller, Oberecker, & Friederici, 2009;Mueller,Hahne, Fujii, & Friederici, 2005; Friederici, Steinhauer, &Pfeifer, 2002).
Taken together, these data suggest that it is critical toaccount for proficiency in neuroimaging studies of L2learners. One methodological issue, though, is that “high”and “low” proficiency are often defined fairly arbitrarily,such as a median split of a proficiency measure or onself-reported amounts of usage. Such an approach makesit hard to compare one group of “high-proficiency” learnersto another. Additionally, the practice of dichotomizing con-tinuous variables such as proficiency leads to a loss of powerand reduced effect sizes as well as increasing the likelihoodof finding spurious significant effects (Cohen, 1983). Apreferable approach is to use a standardized test of profi-ciency and treat scores as falling along a continuum.
A second question that has not been well addressed inthe literature is how proficiency affects neurocognitivemeasures of language processing in L1 learners. L1 profi-ciency is rarely measured in lieu of the implicit, but erro-neous, assumption that all L1 speakers perform at ceiling.It is crucial to determine whether the variation in brainactivation associated with proficiency is similar in L1 orL2 learners or qualitatively different. If proficiency modu-lates neural activation in the same way in L1 and L2 learn-ers, then we gain insight into the associated processes,but not into the question of why L2 learners generallyhave lower proficiency. Conversely, if differences remainafter controlling for the effects of proficiency, then wecan be assured that we are looking at the effects of L1/L2learner status.Two studies have investigated the effects of L1 profi-
ciency on ERPs. Pakulak and Neville (2010) found earlier-latency anterior negativities and higher-amplitude P600components in higher- than lower-proficiency native speak-ers of English, in response to syntactic phrase structure vio-lations. Weber-Fox, Davis, and Cuadrado (2003) compared“high” and “normal” proficiency L1 English learnersʼ re-sponses to felicitous and semantically anomalous wordsduring sentence processing. Late (400–600 msec) negativeresponses to semantically congruous open class (i.e., con-tent) words were reduced over posterior electrodes butenhanced over anterior ones, in the high proficiency group.As well, responses to semantically anomalous words werereduced in high-proficiency learners, and the amplitude ofthis effect correlated with the standardized measure of pro-ficiency used (the TOAL-3; Hammill et al., 1994; also usedby Pakulak & Neville, 2010).One study of L2 speakers did treat proficiency as a con-
tinuous variable. Moreno and Kutas (2005) found that ameasure of vocabulary knowledge correlated with the tim-ing, but not the amplitude, of the N400 elicited by se-mantic violations in both L1 and L2 learners. N400 peaklatencies over a left posterior electrodewere earlier in peo-ple with higher vocabulary scores and in participantsʼdominant language (regardless of whether this was theirL1 or L2). N400 peak latency also increasedwith AoA in thisgroup, but using stepwise linear regression Moreno andKutas showed that whichever variable (proficiency orAoA) was entered first, the second explained additionalvariance. These results suggest separable effects of AoAand proficiency.The evidence thus indicates that proficiency is an
important factor affecting brain activation in L2 andeven in L1. In L2, effects of proficiency and AoA maybe separable, and so it is important to include both aspredictors. Furthermore, it is important to determinewhether proficiency affects patterns of brain activationsimilarly in L1 and L2. By taking this approach, we havethe power to determine whether any observed differ-ences between L1 and L2 learners are simply becauseof the groupsʼ falling, on average, at different pointsalong the continuum of proficiency, or if the differences
1206 Journal of Cognitive Neuroscience Volume 24, Number 5

can be attributed to differences in how L1 and L2 areprocessed.The goals of this study were to (1) characterize effects of
proficiency on brain activation during the processing of se-mantically congruous and incongruous sentences, in bothL1 and L2, treating proficiency as a continuous measure,and (2) separate the effects of proficiency on lexical se-mantic processing from those of L1 versus late L2 learnerstatus. Previous studies have taken important first stepsinto exploring the relationship between proficiency andbrain activation. In this study, we aimed to make severalfurther advances. For one, we used a standardized testof proficiency (the TOAL-3) that does not show ceilingeffects in native speakers and tested both L1 and late L2learners. As well, we used linear mixed effects (LME) mod-eling so that proficiency could be treated as a continuousvariable included alongside numerous factorial variables(e.g., condition; electrode position). This improves onprevious approaches that have either dichotomized profi-ciency to incorporate it into an ANOVA framework (at thecost of statistical power/sensitivity), or used simple linearregression (at the expense of considering numerous pre-dictive factors in a single analysis, e.g., limiting the regres-sion to a single electrode). Another issue that has nottypically been addressed is the fact that proficiency andL1/L2 learner status are typically highly collinear. Morenoand Kutas (2005) took one approach in using stepwise lin-ear regression to test whether, after one of these variableshad been entered, the addition of the other explained ad-ditional variance. We built upon this foundation by usingboth the stepwise approach, and an alternative in whichthe variance in proficiency because of group was first re-moved and then the residual variance included in theLME models alongside group, condition, and electrodefactors. In doing so we were further able to assess therobustness of any effects that were found.L2 learners in this study were native Spanish speakers
with a mean age of first exposure to English of 10 years,mean age of first arrival in an English-speaking countryof 24 years, and an average of 8 years living in an English-speaking country. Most participants reported that, al-though they had childhood exposure to English, typicallythrough school and/or television, they did not feel theyhad achieved any significant level of fluency until movingto an English-speaking country in adulthood. We mea-sured vocabulary and grammatical proficiency in both na-tive and late learners of English, using the TOAL-3. This is astandardized test battery that assesses both grammar andvocabulary skills, has norms up to age of 24, does not typ-ically show ceiling effects even among English L1 speakers,and has been used in previous ERP studies of language(Pakulak & Neville, 2010; Weber-Fox et al., 2003). Weused a paradigm involving lexical semantic violations(e.g., The Irishman sipped Toddʼs thunder at the party),which typically elicit an N400 relative to well-formed con-trol sentences. The N400 is thought to reflect aspects oflexical access and the postlexical integration of word
meanings into episodic memory (Lau, Phillips, & Poeppel,2008; Kutas & Federmeier, 2000).
We predicted that learner status (native or late) and pro-ficiency would have separable effects on ERPs. Specifically,following previous studies, we predicted that the latencyand amplitude of the N400 elicited by semantic anomalieswould be later and smaller, respectively, in late learners.However, we further predicted, on the basis of Morenoand Kutasʼ (2005) data, that the differences in latencyand possibly in amplitude would largely be accountedfor by proficiency, controlling for L1/L2 learner status.Thus, we predicted that a similar relationship betweenproficiency and N400 latency and amplitude would befound for L1 and L2 learners of English. To the extent thatthis prediction did not hold, and group differences wereobserved once proficiency had been accounted for inthe model, we would attribute such group differences aslikely stemming from an effect of late L2 acquisition inde-pendent of proficiency. An additional possibility was thatwhile proficiency might modulate one or more propertiesof the N400 in both groups, it might do so in different waysbetween groups. Such an interaction could be interpretedas evidence that, although proficiency modulates lexicalprocessing, it does so in different ways, depending onwhether the language is acquired from birth or in earlyadulthood as an L2.
METHODS
Participants
Nineteen native English speakers (mean age = 23.3 years,SD = 7.1 years, range = 18–51 years; mean years ofeducation = 14.4 years, SD = 1.7 years) and 19 nativeSpanish speakers (mean age = 34 years, SD = 6.6 years,range= 21–46 years; mean years of education= 17.9 years,SD=3.0 years) took part in this study. The L2 learners werethus older, R = 0.33, F(1, 33) = 17.5, p = .0002, and hadmore years of education, R = 0.31, F(1, 33) = 16.6, p =.0003. These differences in age and education level weretaken into account in the analyses as described below.All participants were men, right-handed, and without anyreported neurological or psychiatric pathology. NativeSpanish speakersʼ mean age of first exposure to Englishwas 9.6 years (SD = 9.6 years; from 0 to 24 years). Firstexposure was typically in school, taught by a nonnativeEnglish speaker, with 1–6 hr/week of formal instruction.The mean age at which native Spanish speakers movedto an English-speaking country where they were immersedin English was 24.2 years (SD = 6.9 years, range = 18–40 years) and the average length of time they had lived inan English-speaking country was 8.1 years (SD= 5.2 years,range = 1–19 years). All but 3 of the native English speak-ers reported some knowledge of at least one other lan-guage. Participants were paid $20 for their participation.Study procedures were reviewed by the GeorgetownUniversity Institutional Review Board.
Newman et al. 1207

Materials
The target stimuli for this experiment consisted 64 simpledeclarative English sentences. Two versions of each sen-tence were created, one that was semantically acceptable(e.g., The Irishman sipped Toddʼs whiskey at the party)and the other in which the direct object of the verb wasreplaced with a noun, matched in lexical frequency, thatdid not make contextual sense (e.g., The Irishman sippedToddʼs thunder at the party). Stimuli were counter-balanced across participants, such that each participantsaw only the control or the anomalous version of a givensentence. An additional 192 sentences were used, includ-ing 32 sentences each with violations of regular past tensemorphology, irregular past tense morphology, and syntac-tic phrase structure. The remaining sentences were gram-matically and semantically acceptable. The complete setof stimuli are available in Newman, Ullman, Pancheva,Waligura, and Neville (2007). Because the present articleis focused on the relationship between language profi-ciency and lexical semantic processing, the results of thegrammatical violations will not be discussed here.
Participants were administered a general health screen-ing and a language history questionnaire that includedself-ratings of proficiency in each language known (on a5-point Likert scale). The following subtests from the Testof Adult and Adolescent Language, third edition (Hammillet al., 1994), were also administered: Reading and Listen-ing Vocabulary, and Listening, Reading, and SpeakingGrammar.
ERP Recording and Preprocessing
Continuous EEGdata were recorded from each participantvia 64 tin electrodes sewn into a tight-fitting cap (Electro-Cap, Eaton, OH), referenced on-line to an electrode onthe right mastoid bone (later rereferenced to the averageof the left and right mastoid locations). Electrode positionswere specified by the International 10–20 system (FP1/2,FP3/4, FPz, F1/2, F3/4, F5/6, F7/8, Fz, FF1/2, FF3/4, FC1/2,FC3/4, FC5/6, FC6/7, C1/2, C3/4, C5/6, Cz, T3/4, T5/6, CP1/2,CP3/4, CT5/6, CT7/8, P1/2, P3/4, P5/6, Pz, PO3/4, POz, O1/2,TO1/2, Oz, IN3/4, INz, left/right mastoid). EOG was recordedfrom electrodes positioned on the outer canthi of each eyeas well as one electrode placed below the left eye. EEGwasamplified (SAI model GTU-96/128BA; San Diego, CA)using a 3-dB cutoff, bandpass filtered 0.01–125 Hz anddigitized at 256 Hz for recording on a desktop computer.
Trials with blinks, eye movements, or excessive noisewere identified off-line (using a maximum peak-to-peakamplitude threshold tailored to each participantʼs data)and were discarded, as were trials containing blocking (de-fined as 10 or more time points having the same value).Data were digitally notch-filtered at 60 Hz. Trials to whichparticipants responded correctly were averaged withineach condition over an epoch of 200 msec prestimulusto 1500 msec poststimulus onset.
Procedure
After giving informed consent, participants completed thequestionnaires and were administered the TOAL-3 sub-tests. The EEG cap was then applied, and impedanceswere lowered to <5 kΩ. Participants were then seated ina dimly lit, sound-attenuating booth 135 cm from a CRTmonitor; stimulus words subtended 0.5° vertically and1°–3° deg horizontally. Participants were given a responsebutton box to hold in both hands. Each sentence was ini-tiated by a button press from the participant and beganwith the outline of a box (7° × 3° visual angle) appearingon the computer monitor for a random period of 300–1100 msec. The words of the sentence were then pres-ented one at a time, with each word displayed for 300 msecand a 200-msec delay between words. The outline of thebox remained for 1500 msec after the last word of thesentence and was then replaced by a response prompt,“Good or bad?”, displayed on the screen. This remainedvisible until the participant responded (response buttonswere counterbalanced across participants and across thefour sets of stimuli), at which point a fixation cross was dis-played until a button was pressed to initiate the next trial.Participants were given short breaks after every 50 sen-tences and could initiate breaks at any other time. Orderof sentence presentation was randomized for each partic-ipant. Before the experimental stimuli being presented,participants performed a practice session consisting of16 sentences, receiving feedback on their performance.Feedback was not provided for the experimental stimuli.
Statistical Analyses
To investigate the influence of proficiency and learner sta-tus on ERP amplitude, scalp distribution, and timing, weconducted LMEmodeling as implemented by the functionlmer( ) from the lme4 library in R version 2.10 (Bates,Maechler, & Bolker, 2009). LME is a relatively recent devel-opment in computational statistics based on restrictedmaximum likelihood estimation. Its use in the analysis ofEEG data was advocated for by Bagiella, Sloan, and Heitjan(2000) and has been used by Pritchett et al. (2010),Wierda,van Rijn, Taatgen, and Martens (2010), Davidson andIndefrey (2007), and Moratti, Clementz, Gao, Ortiz, andKeil (2007).LME models are a form of general linear model that in-
clude both fixed effects parameters and random effects.LME models offer several advantages over traditional re-peated measures ANOVA that made such an approach de-sirable for the present ERP data (and formany other typicalERP data sets as well). For one, LME allows richermodelingof random effects (variables with levels that represent arandom, nonreproducible, sample of a population such asparticipants or items) including multiple, crossed, and/ornested random effects. This can increase the accuracyand generalizability of the parameter estimate. The morecomplex random effects structure in our LME models
1208 Journal of Cognitive Neuroscience Volume 24, Number 5
enabled us to better account for the correlation in the re-siduals than traditional repeated measures AN(C)OVAmodels do and thus better approximate the assumptionof uncorrelated model residuals. Furthermore, as in manyERP studies, our data were unbalanced. Although the re-sults of an AN(C)OVA performed on unbalanced data needto be interpreted with caution, LME models can appropri-ately deal with unbalanced data by weighting the contribu-tion of each group (e.g., participants in by-subject randomintercepts and/or the violation and control levels of thecondition factor in by-subject random adjustments forcondition) according to the number of observations inthe group and the variation within and between the groups(Gelman & Hill, 2007, p. 254). Finally, LMEs properly dealwith missing data and account for nonsphericity, commonin ERP data, without the need for subsequent correction(e.g., Greenhouse–Geisser or Huynh–Feldt; Baayen,Davidson, & Bates, 2008; Bagiella et al., 2000).In the analyses we conducted, predictors in the LME
models included the fixed effects proficiency (TOAL-3composite scores, centered by subtracting themean scorefrom each participantʼs score), group (native or late learn-ers),1 condition (control or violation), and electrode posi-tion. Electrodes were grouped into ROIs arranged in a 3 ×3 grid over the scalp (left/midline/right and anterior/central/posterior); data from each electrode within anROI were treated as repeated measures of that ROI. Weincluded by-subject random adjustments for the intercept,condition, and ROI in the model specification as crossedrandom effects.2 Because proficiency and group stronglycorrelatedwith one another (R=0.74), we residualized pro-ficiency with respect to group by taking the residuals of alinear model fit between proficiency and group (i.e., profi-ciency as a function of group; Tremblay & Tucker, 2011).The correlation between original and residualized profi-ciency scores was high (R = 0.72), indicating that residual-ized proficiency still captures the interindividual variabilitypresent in the raw proficiency scores.3 After residualizingthe scores, the probability density functions of the residual-ized native- and late-learner proficiency scores overlappedcompletely and were nonpredictive of group membership.Identification of the optimal mixed-effects model was
performed for each dependent measure through a seriesof iterative tests comparing progressively simpler modelswith more complex models using log-likelihood ratio test-ing (Tremblay, 2011; Tremblay & Tucker, 2011). This allowsremoval of interactions and variables that do not explainsignificant amounts of variance (Baayen et al., 2008). Theoptimal model was the one having the fewest factors andinteractions that accounted for more variance than thenext less complex model. Once the optimal model was ob-tained, outliers were removed, and the model was refitted(e.g., Tremblay & Tucker, 2011). After this refitting, the re-siduals were approximately normally distributed in allcases. The variance explained by each factor was examinedby way of (sequential) F tests for main effects and interac-tions and t tests for specific contrasts. Exact determination
of the denominator degrees of freedom (df ) for LMEmod-els is difficult at best (Bates, 2005). Thus, we calculatedboth upper- and lower-bound values. These may be some-what anticonservative and conservative, respectively, al-though when the number of data points is large (as inour data), these two values may in fact be very similar.df to compute upper-bound probability values were calcu-lated as the number of data points minus the number ofdf used up by the fixed effects. Those for lower-boundp values were calculated as the number of data pointsminus the number of df used up by the fixed effects andthe number of random effects in the model (i.e., df usedup by individual adjustments for the two levels of thecondition factor plus df used up for individual adjust-ments for the nine levels of the ROI factor). R packageLMERConvenienceFunctions was used for the back-fitting of fixed effects, the forward-fitting of random effects,and the calculation of upper- and lower-bound p values(Tremblay, 2011).
RESULTS
Standardized Measures of Language Proficiency
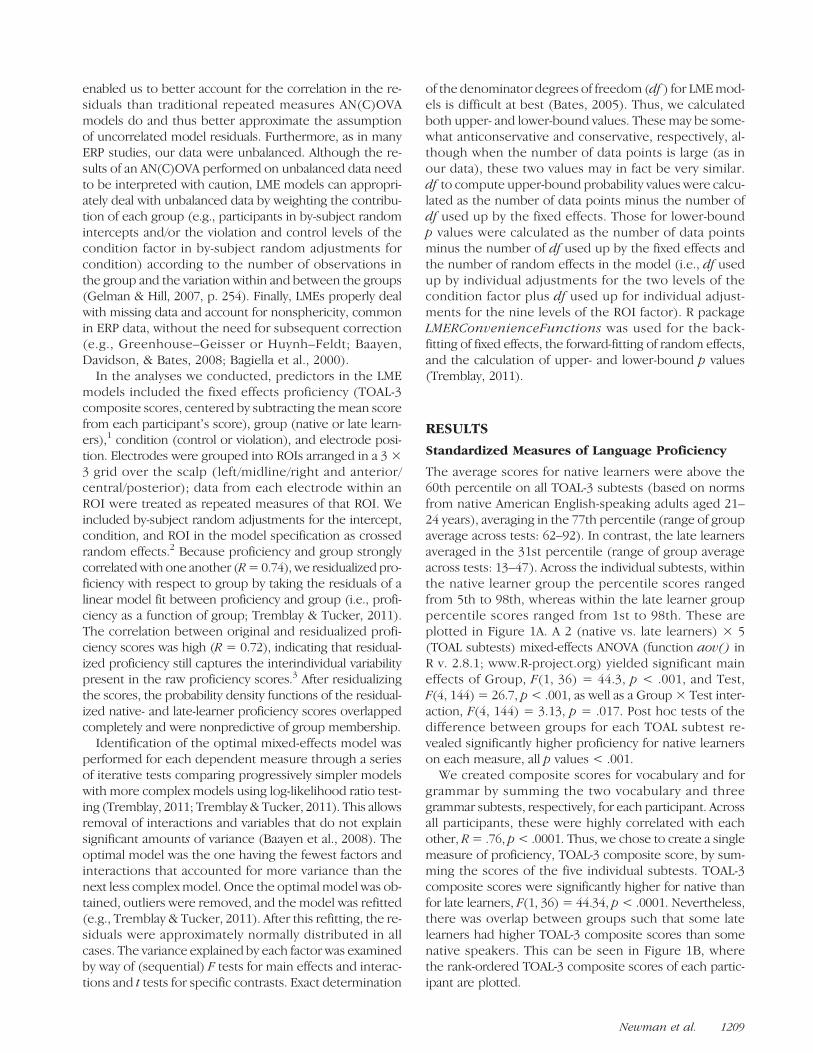
The average scores for native learners were above the60th percentile on all TOAL-3 subtests (based on normsfrom native American English-speaking adults aged 21–24 years), averaging in the 77th percentile (range of groupaverage across tests: 62–92). In contrast, the late learnersaveraged in the 31st percentile (range of group averageacross tests: 13–47). Across the individual subtests, withinthe native learner group the percentile scores rangedfrom 5th to 98th, whereas within the late learner grouppercentile scores ranged from 1st to 98th. These areplotted in Figure 1A. A 2 (native vs. late learners) × 5(TOAL subtests) mixed-effects ANOVA (function aov() inR v. 2.8.1; www.R-project.org) yielded significant maineffects of Group, F(1, 36) = 44.3, p < .001, and Test,F(4, 144) = 26.7, p< .001, as well as a Group × Test inter-action, F(4, 144) = 3.13, p = .017. Post hoc tests of thedifference between groups for each TOAL subtest re-vealed significantly higher proficiency for native learnerson each measure, all p values < .001.
We created composite scores for vocabulary and forgrammar by summing the two vocabulary and threegrammar subtests, respectively, for each participant. Acrossall participants, these were highly correlated with eachother, R= .76, p< .0001. Thus, we chose to create a singlemeasure of proficiency, TOAL-3 composite score, by sum-ming the scores of the five individual subtests. TOAL-3composite scores were significantly higher for native thanfor late learners, F(1, 36) = 44.34, p< .0001. Nevertheless,there was overlap between groups such that some latelearners had higher TOAL-3 composite scores than somenative speakers. This can be seen in Figure 1B, wherethe rank-ordered TOAL-3 composite scores of each partic-ipant are plotted.
Newman et al. 1209

Sentence Acceptability Judgments
Participants were quite accurate in discriminating correctlyformed English sentences from those containing semanticviolations. Native English speakers were 96.5% correct forcontrol sentences and 94.1% correct in detecting violations.Late learners were 89.3% correct for control sentencesand 80.1% correct for violation sentences. A mixed effects2 (native vs. late learners) × 2 (control vs. violation sen-tences) ANOVA (using aov() in R) was performed usingnumber of correct responses as the dependent variable.This yielded significant main effects of Group, F(1, 36) =19.3, p < .001, and Sentence Type, F(1, 36) = 9.4, p =.004, as well as a significant Group × Violation interaction,F(1, 36) = 6.5, p = .015. Overall, native learners were moreaccurate than late learners, and for native learners, accuracywas similar for control and violation sentences, F(1, 36) =0.3, p = .59. However, late learners correctly identified con-trol sentencesmore reliably than sentences containing seman-tic violations, F(1, 36) = 6.5, p = .015. It is important to
emphasize, however, that in spite of overall lower proficiencythe late learners were quite accurate in the sentence judg-ment task and well above chance. ERP data were only ana-lyzed for sentences that participants responded to correctly.
ERP Data
Visual inspection of the ERP waveforms across the variousconditions, seen in Figure 2, suggested that both nativeand late learners showed enhanced N400 responses to se-mantic violations relative to control sentences. However,the N400 appeared to have an earlier onset and greateramplitude for native than for late learners. Subsequentto the N400, additional violation effects were observed inboth groups from approximately 700–900 msec, consistingof a LAN and a more posterior positivity. The scalp distri-butions of these effects (seen in Figure 3) seemed to differbetween groups, however, with native learners show-ing the negativity more prominently while late learnersʼ
Figure 1. (A) TOAL-3 subtestscores for native and latelearners, expressed aspercentiles based onpublished norms. Error barsrepresent standard deviations.(B) Rank-ordered TOAL-3composite scores. Maximumpossible composite TOAL-3score was 155.
1210 Journal of Cognitive Neuroscience Volume 24, Number 5

topographies were dominated by the posterior-distributedpositivity.
N400 Amplitude
Figure 4 shows the difference waves for the native and latelearner groups. Both groups showed an enhanced negativ-
ity peaking around 450msec, as is typical of theN400 effect.The scalp distribution of this effect, as seen in Figure 3, wasmaximal over midline electrodes for both groups. Toanalyze the amplitude and scalp distribution of the N400,we performed LME modeling on mean amplitudes over a100-msec time window centered on the peak of the N400violation effect, from 400 to 500 msec. The optimal LME
Figure 2. ERP waveforms averaged across groups of electrodes, for lexical semantic violations and control words. Negative voltage is plottedupward.
Newman et al. 1211

Figure 3. Scalp voltage maps showing the difference between violation and control words, averaged over selected time windows. Scale is−3 μV (blue) to +3 μV (red). Participants were split into “high”- and “low”-proficiency subgroups based on a median split of composite TOAL-3scores within each group. Although in the statistical analyses proficiency was treated as a continuous variable rather than dichotomized, herethe dichotomization serves to highlight differences that are consistent within each learner group, across variation in proficiency.
Figure 4. ERP difference waveforms, computed as violation–control. Negative is plotted upward.
1212 Journal of Cognitive Neuroscience Volume 24, Number 5
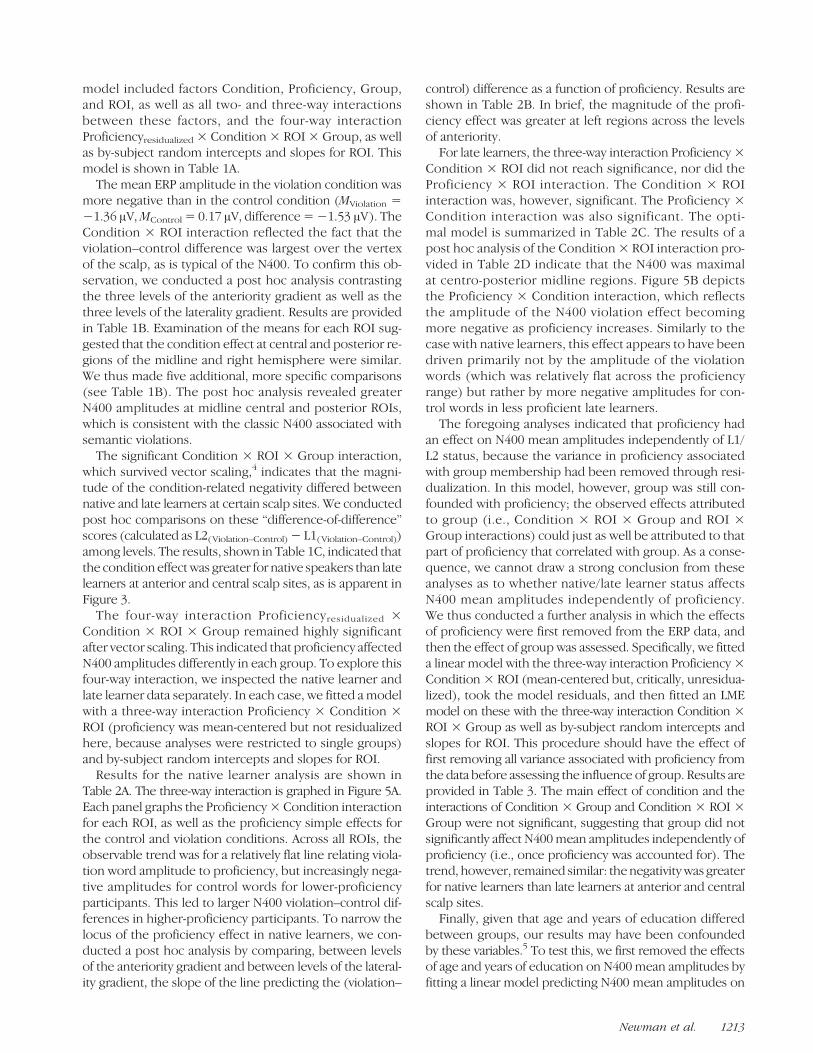
model included factors Condition, Proficiency, Group,and ROI, as well as all two- and three-way interactionsbetween these factors, and the four-way interactionProficiencyresidualized × Condition × ROI × Group, as wellas by-subject random intercepts and slopes for ROI. Thismodel is shown in Table 1A.The mean ERP amplitude in the violation condition was
more negative than in the control condition (MViolation =−1.36 μV,MControl = 0.17 μV, difference=−1.53 μV). TheCondition × ROI interaction reflected the fact that theviolation–control difference was largest over the vertexof the scalp, as is typical of the N400. To confirm this ob-servation, we conducted a post hoc analysis contrastingthe three levels of the anteriority gradient as well as thethree levels of the laterality gradient. Results are providedin Table 1B. Examination of the means for each ROI sug-gested that the condition effect at central and posterior re-gions of the midline and right hemisphere were similar.We thus made five additional, more specific comparisons(see Table 1B). The post hoc analysis revealed greaterN400 amplitudes at midline central and posterior ROIs,which is consistent with the classic N400 associated withsemantic violations.The significant Condition × ROI × Group interaction,
which survived vector scaling,4 indicates that the magni-tude of the condition-related negativity differed betweennative and late learners at certain scalp sites. We conductedpost hoc comparisons on these “difference-of-difference”scores (calculated as L2(Violation–Control)− L1(Violation–Control))among levels. The results, shown in Table 1C, indicated thatthe condition effect was greater for native speakers than latelearners at anterior and central scalp sites, as is apparent inFigure 3.The four-way interaction Proficiencyresidualized ×
Condition × ROI × Group remained highly significantafter vector scaling. This indicated that proficiency affectedN400 amplitudes differently in each group. To explore thisfour-way interaction, we inspected the native learner andlate learner data separately. In each case, we fitted amodelwith a three-way interaction Proficiency × Condition ×ROI (proficiency was mean-centered but not residualizedhere, because analyses were restricted to single groups)and by-subject random intercepts and slopes for ROI.Results for the native learner analysis are shown in
Table 2A. The three-way interaction is graphed in Figure 5A.Each panel graphs the Proficiency × Condition interactionfor each ROI, as well as the proficiency simple effects forthe control and violation conditions. Across all ROIs, theobservable trend was for a relatively flat line relating viola-tion word amplitude to proficiency, but increasingly nega-tive amplitudes for control words for lower-proficiencyparticipants. This led to larger N400 violation–control dif-ferences in higher-proficiency participants. To narrow thelocus of the proficiency effect in native learners, we con-ducted a post hoc analysis by comparing, between levelsof the anteriority gradient and between levels of the lateral-ity gradient, the slope of the line predicting the (violation–
control) difference as a function of proficiency. Results areshown in Table 2B. In brief, the magnitude of the profi-ciency effect was greater at left regions across the levelsof anteriority.
For late learners, the three-way interaction Proficiency ×Condition × ROI did not reach significance, nor did theProficiency × ROI interaction. The Condition × ROIinteraction was, however, significant. The Proficiency ×Condition interaction was also significant. The opti-mal model is summarized in Table 2C. The results of apost hoc analysis of the Condition × ROI interaction pro-vided in Table 2D indicate that the N400 was maximalat centro-posterior midline regions. Figure 5B depictsthe Proficiency × Condition interaction, which reflectsthe amplitude of the N400 violation effect becomingmore negative as proficiency increases. Similarly to thecase with native learners, this effect appears to have beendriven primarily not by the amplitude of the violationwords (which was relatively flat across the proficiencyrange) but rather by more negative amplitudes for con-trol words in less proficient late learners.
The foregoing analyses indicated that proficiency hadan effect on N400 mean amplitudes independently of L1/L2 status, because the variance in proficiency associatedwith group membership had been removed through resi-dualization. In this model, however, group was still con-founded with proficiency; the observed effects attributedto group (i.e., Condition × ROI × Group and ROI ×Group interactions) could just as well be attributed to thatpart of proficiency that correlated with group. As a conse-quence, we cannot draw a strong conclusion from theseanalyses as to whether native/ late learner status affectsN400 mean amplitudes independently of proficiency.We thus conducted a further analysis in which the effectsof proficiency were first removed from the ERP data, andthen the effect of group was assessed. Specifically, we fitteda linear model with the three-way interaction Proficiency ×Condition × ROI (mean-centered but, critically, unresidua-lized), took the model residuals, and then fitted an LMEmodel on these with the three-way interaction Condition ×ROI × Group as well as by-subject random intercepts andslopes for ROI. This procedure should have the effect offirst removing all variance associated with proficiency fromthe data before assessing the influence of group. Results areprovided in Table 3. The main effect of condition and theinteractions of Condition × Group and Condition × ROI ×Group were not significant, suggesting that group did notsignificantly affect N400mean amplitudes independently ofproficiency (i.e., once proficiency was accounted for). Thetrend, however, remained similar: thenegativitywas greaterfor native learners than late learners at anterior and centralscalp sites.
Finally, given that age and years of education differedbetween groups, our results may have been confoundedby these variables.5 To test this, we first removed the effectsof age and years of education on N400mean amplitudes byfitting a linear model predicting N400 mean amplitudes on
Newman et al. 1213

Table 1. ANOVA Table for N400 Amplitude in the 400–500 msec Time Window (Denominator Lower-bound df = 4299;Upper-bound df = 4703) and Post hoc Probability Values
Coefficient df SumSq MeanSq F p (Lower Bound) p (Upper Bound)
A. ANOVA
Proficiencyresidualized 1 0.8 0.8 0.8 .37 .37
Condition 1 32.2 32.2 32.2 <.0001 <.0001
ROI 8 244.7 30.6 31.4 <.0001 <.0001
Group 1 0.1 0.1 0.1 .80 .80
Proficiencyresidualized × Condition 1 0.9 0.9 0.9 .33 .33
Proficiencyresidualized × ROI 8 9.2 1.2 1.2 .31 .31
Condition × ROI 8 188.8 23.6 24.2 <.0001 <.0001
Proficiencyresidualized × Group 1 3.3 3.3 3.4 .07 .07
Condition × Group 1 1.3 1.3 1.4 .24 .24
ROI × Group 8 41.0 5.1 5.3 <.0001 <.0001
Proficiencyresidualized × Condition × ROI 8 9.7 1.2 1.2 .27 .27
Proficiencyresidualized × Condition × Group 1 1.7 1.7 1.8 .18 .18
Proficiencyresidualized × ROI × Group 8 12.5 1.6 1.6 .12 .12
Condition × ROI × Group 8 68.3 8.5 8.8 <.0001 <.0001
Proficiencyresidualized × Condition × ROI × Group 8 37.8 4.7 4.9 <.0001 <.0001
Comparisons between ROIs t p (Lower Bound) p (Upper Bound)
B. Post hoc, Condition × ROI
C vs. A 4.8 .003 .003
C vs. P 3.6 .03 .03
A vs. P −1.2 .99 .99
M vs. L 4.2 .01 .01
M vs. R 6.2 .0002 .0002
L vs. R 2.1 .56 .56
M/C vs. M/P 2.5 .20 .20
M/C vs. R/P 6.4 <.0001 <.0001
M/C vs. R/C 7.6 <.0001 <.0001
M/P vs. R/C 3.1 .05 .05
M/P vs. R/P 4.4 .002 .002
C. Post hoc, Condition × ROI × Group
C vs. A 1.2 .99 .99
C vs. P −5.3 <.0001 <.0001
A vs. P −3.8 .006 .006
M vs. L 0.1 .99 .99
M vs. R −1.0 .99 .99
1214 Journal of Cognitive Neuroscience Volume 24, Number 5

the basis of age and years of education. We then refittedour mixed effects model on the residuals of this. The pat-tern of main effects and interactions and their significanceremained the same as in our initial model, indicating thatthe effects were not because of differences in age or edu-cation between the groups.To summarize, violation–control N400 amplitudes were
overall larger in L1 than L2 learners. In both groups, largerN400 amplitudes were found in higher-proficiency partici-pants, and once the effects of proficiency were accountedfor, L1/L2 learner status did not predict N400 differences.However, differences in the effects of proficiency were seenbetween groups. Specifically, the effects of proficiency werepredominant over the left hemisphere in L1 learners butwidely distributed over the scalp in L2 learners.
N400 Onset Latency
In addition to the amplitude differences, examination ofthe difference waveforms shown in Figure 4 suggestedthat the onset of the N400 violation effect was earlier fornative learners. To test this, wemodeled the 20% fractionalarea latency of the N400 violation effect (difference wave-form, calculated as violation–control) in the 200–600msectime window. This was calculated as the time at which 20%of the total mean amplitude was obtained within this timewindow, which was chosen to capture the observed epochover which the violation and control waveforms differed(Hansen & Hillyard, 1980). We fitted an LME model pre-dicting fractional area latency, on the basis of fixed effectsproficiency (residualized), group, and ROI and by-subjectrandom intercepts and slopes for ROI. The optimal modelcontained only main effects of group and ROI.A main effect of group confirmed that the onset of the
N400 violation effect was earlier in natives than in latelearners, ML1 = 311 msec, ML2 = 339 msec, difference =28 msec, F(1, 2287) = 6.3, p = .03. There was also a maineffect of ROI, F(8, 2287) = 2.1, p= .01. A post hoc analysiscomparing the three levels of the anteriority and the later-ality gradients revealed that the only reliable N400 onsetdifference was between anterior and central ROIs, Manterior =324 msec, Mcentral = 340 msec, t(2287) = 2.7, p = .04, two-tailed and Bonferroniʼs corrected for six comparisons.As in the previous analyses, to assess the relative contri-
butions of group and proficiency, we fitted a linear model onmean fractional area latencies as a function of Proficiency ×
ROI (mean-centered, but not residualized) and then fittedan LME model on the residuals with ROI and group asfixed effects and by-subject random intercepts and slopesfor ROI. As Table 4A shows, there were no significant in-teractions or main effects. We performed a similar analysisto determine the potential contribution of proficiency(not residualized) to the effect, once the variance asso-ciated with group was regressed out. Results are providedin Table 4B. Similarly to group, proficiency did not inde-pendently affect N400 latencies. Although group appearsto have accounted for a greater portion of the overall vari-ability (MSSGroup = 1598.5 and MSSROI × Group = 486.1 vs.MSSProficiency = 164.1 and MSSROI × Proficiency = 355.3),these results suggest that the effect of these two vari-ables on N400 onset latencies cannot be unequivocallydissociated.
Finally, as in the N400 amplitude analysis, we checkedwhether the group effect was confounded with age andyears of education. After accounting for these potentialconfounds, the effect of group became marginally signifi-cant, F(1, 2287) = 3.2, p = .07. Thus, although the N400onset appears faster in native speakers than late learners,this trend may not be replicable.
In summary, N400 onset latencies were earlier in L1than L2 learners. However, onset latencies were not sig-nificantly affected by proficiency, suggesting that the tim-ing of N400 onset is more closely tied to L1/L2 learnerstatus.
Late Effects of Condition
Subsequent to the N400, the scalp topography of the dif-ference waves appeared to differ between groups. As seenin Figures 2 and 3, the dominant feature of the scalp mapsof native speakers was a late negativity from approximately600–900 msec, maximal over left and midline anteriorsites, whereas for late learners a late positivity beginningaround 650 msec and largest over posterior right and mid-line sites was most salient. However, the posterior positiv-ity and anterior negativity were visible, albeit diminished,in the native and late learner groups, respectively. To ex-plore these effects, we performed LMEmodeling onmeanERP amplitudes from 700 to 900 msec. The optimal modelis shown in Table 5A; the results were the same aftercontrolling for age and years of education as describedfor the previous analyses.
Table 1. (continued)
Comparisons between ROIs t p (Lower Bound) p (Upper Bound)
L vs. R −1.1 .99 .99
L/C vs. L/A −1.4 .99 .99
L/C vs. M/C 0.3 .99 .99
Post hoc probability values were Bonferroniʼs corrected for 11 comparisons in (B) and 9 comparisons in (C); t tests were two-tailed. A = Anterior;C = central; P = posterior; L = left; M = midline; R = right.
Newman et al. 1215

Table 2. ANOVA Table (A and C) and Post hocs (B and D) for N400 Amplitude in the 400–500 msec Time Window, ConductedSeparately for Each Group
A. Native Learners, ANOVA (Denominator Lower Bound df = 1945, Upper Bound df = 2349)
Coefficient df SumSq MeanSq F p (Lower Bound) p (Upper Bound)
Proficiency 1 0.1 0.1 0.1 .82 .82
Condition 1 1880.7 1880.7 933.0 <.0001 <.0001
ROI 8 226.3 28.3 14.0 <.0001 <.0001
ROI × Condition 8 174.3 21.8 10.8 <.0001 <.0001
Proficiency × Condition 1 147.9 147.9 73.4 <.0001 <.0001
Proficiency × ROI 8 47.3 5.9 2.9 .003 .003
Proficiency × Condition × ROI 8 41.9 5.2 2.6 .008 .008
B. Native Learners, Post hoc, Proficiencyresidualized × Condition × ROI × Group
Comparisons between ROIs t p (Lower Bound) p (Upper Bound)
C vs. A −2.1 .22 .22
C vs. P −0.3 .99 .99
A vs. P −2.2 .16 .16
M vs. L −1.7 .55 .55
M vs. R −1.6 .63 .63
L vs. R −3.4 .004 .004
C. Late Learners, ANOVA (Denominator Lower Bound df = 1960; Upper Bound df = 2364)
Coefficient df SumSq MeanSq F p (Lower Bound) p (Upper Bound)
Proficiency 1 886.3 886.3 505.0 <.0001 <.0001
Condition 8 322.2 40.3 22.9 <.0001 <.0001
ROI 1 0.6 0.6 0.4 .55 .55
ROI × Condition 8 79.7 10.0 5.7 <.0001 <.0001
Proficiency × Condition 1 24.5 24.5 13.9 .0002 .0002
D. Late Learners, Post hoc, Condition × ROI
Comparisons between ROIs t p (Lower Bound) p (Upper Bound)
C vs. A −2.9 .02 .02
C vs. P −1.0 .99 .99
A vs. P −3.6 .002 .002
M vs. L −2.8 .03 .03
M vs. R 3.1 .01 .01
L vs. R 0.3 .99 .99
Post hoc probability values were Bonferroniʼs corrected for six comparisons; t tests were two-tailed. A = Anterior; C = central; P = posterior; L = left;M = midline; R = right.
1216 Journal of Cognitive Neuroscience Volume 24, Number 5

Themain effects of Condition andGroupwere not signif-icant. The effect of ROI, which was reliable, was modulatedby condition type. The difference between the violationand control conditions at anterior scalp regions appearedmore negative than at central and posterior sites and theright posterior region was the most positive on the scalp.
Post hoc analyses, shown in Table 5B, compared thethree levels of anteriority and laterality gradients. The re-sults confirmed the strongest negativity at anterior sites(all p values smaller than .0001). From left to right, a sim-ilar, although shallower, gradient also seemed to be pres-ent. Although differences between L and R scalp sites were
Figure 5. (A) Proficiency ×Condition interaction for eachROI as well as the proficiencysimple effects for nativespeakers of English. The x axisis proficiency, and the y axis isamplitude (negative is plottedup). The solid black line is thetwo-way interaction, the solidgray line is the proficiencysimple effect in the controlcondition, and the broken grayline is the simple effect ofproficiency in the violationcondition. (B) The Proficiency ×Condition interaction for latelearners of English. The x–yaxes are proficiency and meanamplitude respectively. Thesolid and broken gray linesare proficiency for the controland violation conditions,respectively, and the solid blackline is the violation minuscontrol difference.
Table 3. N400 ANOVA Table on Residualized Mean Amplitudes (Denominator Lower Bound df = 4236; Upper Bound df = 4640)
Coefficient df SumSq MeanSq F p (Lower Bound) p (Upper Bound)
Condition 1 5.6 5.6 3.5 .06 .06
ROI 8 1.0 0.13 0.1 .99 .99
Group 1 1.7 1.7 1.1 .3 .3
Condition × ROI 8 9.4 1.2 0.7 .66 .66
Condition × Group 1 5.6 5.6 3.5 .06 .06
ROI × Group 8 6.0 0.8 0.5 .86 .86
Condition × ROI × Group 8 21.3 2.7 1.7 .1 .1
Newman et al. 1217

reliable, neither the differences between the L and M, northe R and M, regions approached statistical significance.
There was also a significant Condition × Group inter-action. Reflecting the overall more prevalent negativepotentials across the scalp in native learners and morewidespread positive potentials in late learners, across ROIsthe violation–control difference was more negative fornative speakers,ML1 =−0.9 μV, and more positive for latelearners, ML2 = 0.2 μV.
Finally, to assess whether group affected the late positiv-ity independently of proficiency, we repeated the procedure
used for previous measures and fitted a linear model to themean amplitudes with ROI, condition, and proficiency,then, on themodel residuals, performed an LME regressionwith the three-way interaction Proficiency × Condition ×ROI with by-subject random intercepts and slopes forROI. The only significant effect that emerged from thismodel was a Condition × Group interaction [F(1, 4651) =50.0, p < .0001] where the violation minus control differ-encewasmore negative for native speakers than late learners(ML1(Violation– Control) =−0.3 μV,ML2(Violation–Control) = 0.3 μV,difference of differences= 0.6 μV). These results are similar
Table 4. Contribution of Group (A) and Proficiency (B) Alone on N400 Onset Latencies
Coefficient df SumSq MeanSq F p (Lower Bound) p (Upper Bound)
A. Group Alone (Denominator Lower bound df = 1876; Upper Bound df = 2280)
ROI 8 3012.3 376.5 0.5 .82 .82
Group 1 1598.5 1598.5 2.3 .13 .13
ROI × Group 8 3888.8 486.1 0.7 .69 .69
B. Proficiency Alone (Denominator Lower Bound df = 1875; Upper Bound df = 2279)
ROI 8 2538.0 317.3 0.5 .88 .88
Proficiency 1 164.1 164.1 0.2 .62 .62
ROI × Proficiency 8 2842.5 355.3 0.5 .84 .84
Note that proficiency was mean-centered but not residualized. 3.6% of the data were trimmed.
Table 5. ANOVA Table (A) and Post hoc Test Results (B) for Mean Amplitude in the 700–900 msec Time Window
A. ANOVA (Denominator Lower Bound df = 4244; Upper Bound df = 4648)
Coefficient df SumSq MeanSq F p (Lower Bound) p (Upper Bound)
Condition 1 3.6 3.6 2.3 .13 .13
ROI 8 110.9 13.9 9.0 <.0001 <.0001
Group 1 0.1 0.1 0.01 .92 .92
Condition × ROI 8 432.0 54.0 34.9 <.0001 <.0001
Condition × Group 1 7.4 7.4 4.8 .029 .029
B. Post hoc Analysis of the Condition × ROI Interaction
Comparisons between ROIs t p (Lower Bound) p (Upper Bound)
A vs. C 7.9 <.0001 <.0001
A vs. P 13.8 <.0001 <.0001
C vs. P 6.9 <.0001 <.0001
L vs. M 1.4 .99 .99
L vs. R 3.5 .003 .003
M vs. R 2.0 .27 .27
Probability values in (B) were Bonferroniʼs corrected for six comparisons; t tests were two-tailed. A = Anterior; C = central; P = posterior; L = left;M = midline; R = right.
1218 Journal of Cognitive Neuroscience Volume 24, Number 5

to the ones obtained from the model where group andproficiency were confounded, although the difference issmaller when the effect of proficiency is first removed.To summarize, from 700 to 900 msec, both L1 and L2
learners showed an anterior negativity and a posterior pos-itivity. The anterior negativity was more prominent acrossthe scalp in L1 learners, whereas the posterior positivitywas more widespread in L2 learners. These late effects ofsemantic violations were not affected by proficiency how-ever. Rather, they reflect differences in the way first versuslater-learned languages are processed.
DISCUSSION
The aims of this study were to (1) examine the effects oflanguage proficiency on the ERP components elicited bylexical semantic violations during sentence processing, inboth native and late learners, and (2) to statistically sep-arate the effects of proficiency on ERPs from the effects ofnative versus late language acquisition. If proficiency wasa critical factor in determining brain activation, then sig-nificant and similar effects of proficiency would be ob-tained across both groups. On the other hand, if lateacquisition leads to a fundamentally different brain orga-nization for language, then group differences in the N400would hold even when proficiency was considered inthe analysis.
N400 Amplitude
AnN400was reliably elicited by semantic violations in bothgroups. The timing and scalp distribution of this effect innative speakers was comparable to that obtained using thesame stimuli in a previous study (Newman et al., 2007).The amplitude of the N400 violation effect was signif-icantly greater for native speakers than late learners ofEnglish at anterior and central scalp regions, replicatingprevious findings (Hahne et al., 2006; Moreno & Kutas,2005; Ojima et al., 2005; Weber-Fox & Neville, 1996). Pro-ficiency affected N400 amplitudes independently ofgroup, with the size of the N400 violation effect increas-ing as proficiency increased. Although previous studieshad shown greater N400s in more proficient and/orearlier learning L2 learners (Rossi et al., 2006; Moreno& Kutas, 2005; Ojima et al., 2005; Phillips et al., 2004), thisstudy gives us greater insight into the nature of the pro-ficiency effects. Because we treated proficiency as a mea-sure that varied continuously across both L1 and L2learners and residualized it with respect to group, wecan conclude that proficiency affects N400 amplitudesimilarly in L1 and L2 learners.The origin of these N400 differences was largely be-
cause of the amplitude of the response to semanticallycongruous words. Lower-proficiency English speakers,regardless of whether they were native or late learners,showed more negative potentials than those with higher
proficiency; the negativities elicited by incongruous wordswere of similar amplitude in both groups. Thus, the atten-uated N400 violation effects observed for late learners inthis and in other studies appear to stem from increasedcosts of semantic integration for open class words gener-ally in lower-proficiency language users, rather than fromdifferences in how violations are processed. Differentinterpretations of the N400 have been put forward (Lauet al., 2008; Kutas & Federmeier, 2000); the greater inte-gration cost in lower-proficiency speakers may be becauseof less efficient lexical access and/or poorer ability to pre-dict words in well-formed sentences.
Although both native and late learners showed a similarrelationship between proficiency and N400 amplitude,group differences were found in the scalp distribution ofthis relationship. In native speakers, the effect was largestover left scalp sites, although observable at virtually everyROI, whereas in late learners it was widely distributedacross the scalp. The N400 is known to have a distributedset of neural generators (Lau et al., 2008), and we had in-sufficient data to expect reliable source localization here.However, the evidence is consistent with differential dis-tribution of proficiency-related brain activity in nativecompared with late learners.
N400 Latency
The estimated onset of the N400 was also earlier for nativethan late learners but was not clearly related to Englishproficiency in either group—when group and residualizedproficiency were both included in the LME model, groupwas a significant predictor but proficiency was not. At thesame time, the results of the analyses in which group wasfirst regressed out and then the residuals fitted against pro-ficiency, and vice versa, suggested that the effects of thetwo variables could not be unequivocally dissociated. Fur-thermore, latency appeared to bemarginally influenced byage and years of education. Thus generally, our findingsare consistent with previous work showing increasedlatency of ERP components in L2 learners (Rossi et al.,2006; Moreno & Kutas, 2005; Ojima et al., 2005; Phillipset al., 2004). However, in this previous work, higher pro-ficiency was shown to be associated with earlier N400 peaklatency, even once group was accounted for (Moreno &Kutas, 2005). There are at least two possible explanationswhy we found only evidence for the influence of group onN400 latency in this study. Onset and not peak latency wasused, as the N400 difference waves did not have a singleclear peak in the present data (possibly because of over-lapping word-offset ERP components). N400 onset latencymay be less strongly related to proficiency than peak la-tency. Second, the bilinguals who showed effects of profi-ciency learned their L2 at a comparatively early age (meanages of 8 and 12, respectively). The late learners in ourstudy did not really learn English until immersed in it afterthe age of 18. The effects of proficiency on N400 latencymay be restricted to earlier learners.
Newman et al. 1219

Late Effects of Semantic Violations
Both groups showed an anterior negativity along with aposterior positivity in the 700–900 msec time range. How-ever, the anterior negativity was more prominent for thenative learners, whereas the posterior positivity was moreprominent in late learners. These differences in scalp dis-tribution were not influenced by English proficiency,when L1/L2 learner status was accounted for. Late anteriornegativities have been associated with workingmemory insentence processing (Vos, Gunter, Kolk, & Mulder, 2001;Münte, Schiltz, & Kutas, 1998). The present results maysuggest that native learners rely more on this on-linestorage, perhaps to recheck the preceding input, whereaslate learners are more strongly disrupted by discrepanciesbetween input and expectations.
Late positivities are often reported in response tosemantic anomalies (van de Meerendonk, Kolk, Chwilla,& Vissers, 2009; Kuperberg, Kreher, Sitnikova, Caplan, &Holcomb, 2007; Moreno & Kutas, 2005; Ojima et al.,2005; Coulson& Van Petten, 2002; Juottonen & Revonsuo,1996). Retrospectively, we note that, in our previous studyusing these same stimuli (Newman et al., 2007), a smallposterior positivity was present for semantic violations,although statistical analyses were not performed on thattime window. Kolk and colleagues (van de Meerendonket al., 2009) have suggested that the P600 may reflect ageneral purpose monitoring process that compares pre-dictions with actual input across a variety of domains, in-cluding syntax, semantics, and other sequences includingmathematics and music. They further propose that strong(unresolvable) expectancy violations elicit a P600, whereasweaker (resolvable) violations of expectancy elicit anN400. In this study, the larger positivity for late learnersmay indicate that they formed relatively strong expecta-tions of sentence continuations and are more challengedwhen input is highly inconsistent with their expectations.Late learners may have less “flexibility” in considering al-ternate senses of a word or interpretations of a sentence(e.g., a metaphorical interpretation). However, previousstudies of earlier-learning bilinguals found larger late pos-itivities elicited by semantic violations in native learners(Ojima et al., 2005) and in bilingualsʼ dominant language(Moreno & Kutas, 2005). The reasons for this discrepancymay again relate to the AoA of L2.
Two caveats are important here. One is that, althoughthere were group differences in the relative prominenceof the anterior negativity and posterior positivity, both po-tentials were observable in both groups. This may suggestdifferential reliance on the two processes indexed by thesepotentials but not qualitatively distinct processing be-tween native and late learners. Secondly, an inherent lim-itation of scalp topography data is that only one of thesetwo processes may actually differ between groups, forexample, a larger anterior negativity in native learnerswould tend to reduce the prominence of the posteriorpositivity in this group, even if the strength of the genera-
tors underlying the positivity was similar across bothgroups.
Methodological Considerations
Decorrelating Proficiency and Group Status
As expected, native speakers had significantly higher pro-ficiency than late learners. Because of the collinearity ofproficiency and group, assessing the independent influ-ence of each variable was impossible. One approach to thiswould be stepwise regression (e.g., Moreno & Kutas,2005). However, although main effects can be examinedin this way, interpretation of interactions is difficult at best,and in the present data the primary questions were cen-tered on interactions between condition, ROI, proficiency,and group. Our first approach to this problem was to usethe residual variance in proficiency that was not accountedfor by groupmembership, making the implicit assumptionthat any overall difference between groups is because ofL1/L2 learner status. This may or may not be correct, be-cause in sampling, limited groups of individuals there maybe an overall difference in proficiency unrelated to learnerstatus. Thus, we also took a second approach, in which wefirst removed the effects of proficiency from the ERP dataand then determined whether any residual variance fromthis model (i.e., not predicted by proficiency) was pre-dicted by group. This, in effect, asks whether, once profi-ciency was accounted for, L1/L2 learner status addedany predictive value. In this case, the answer was “no”—neither the main effect of group nor any interactions withthis variable were significant. Thus both analyses foundsimilar effects of proficiency on N400 amplitudes withineach group.
Measuring Language Proficiency
We chose to use a standardized test of English ability, theTOAL-3, that was developed on a normative sample ofnative English learners aged up to 24 years, and is sensitiveto a range of abilities among this group. This is in contrastto clinical tests used in some previous studies on whichmost native speakers score at ceiling. Nevertheless, it isimportant to consider that the choice of a proficiencymea-sure may affect the outcome of a study. It will also beimportant in future work to consider the question of whatthe construct of “proficiency” really is—likely a proxy forthe amount, quality, and type of language input—andwhether the factors that modulate proficiency are similaror different in L1 and L2. These variables can be difficult toaccurately assess retrospectively, although training stud-ies with artificial, miniature, and real languages provideopportunities to more precisely measure and controlthese factors. Language dominance also likely plays a role(Moreno & Kutas, 2005), as one may become more profi-cient in the language that one uses most heavily, even if it
1220 Journal of Cognitive Neuroscience Volume 24, Number 5

is not an L1. Future work will be needed to explore therelationship between dominance and proficiency.
Conclusions
Our results suggest that different indices of lexical se-mantic processing are differently affected by languageproficiency and by late versus native acquisition. The am-plitude of the N400 to semantically congruent words waslarger in lower-proficiency English speakers regardless ofnative/late learner status. This indicates that lexical seman-tic integration during sentence processing is affected byfluency, not but L2 learning specifically. Previous obser-vations of lower N400 amplitudes in L2 learners are likelyattributable to lower average proficiency.In contrast, the delayed onset of the N400 violation ef-
fect and the relative balance of anterior negativity versusposterior positivity subsequent to the N400 were notclearly attributable to differences in proficiency. This dif-ferencemay thus be attributable to slower lexical semanticprocessing in L2 learners, independent of proficiency ob-tained. Further, L1 learners may rely more on workingmemory when attempting to resolve lexical semantic vio-lations, reflected by anterior negativities after the N400,whereas L2 learnersʼ processing is more disrupted asevidenced by a more predominant late positivity. Again,these differences appear to reflect fundamental L1/L2 pro-cessing differences as they were unaffected by proficiency.
Acknowledgments
This study was supported by NIH NIDCD DC00128 to H. J. N.;NSF SBR-9905273, NIH R01 MH58189, NIH R01 HD049347,and Army DAMD-17-93-V-3018/3019/3020 and DAMD-17-99-2-9007 to M. T. U.; A. J. N. was supported by an NSERC DiscoveryGrant and the Canada Research Chairs program. We are gratefulto Diane Waligura, Matthew Moffa, Claudia Brovetto, LindaHeidenreich, Kara Morgan-Short, Kaori Ozawa, RoumayanaPancheva, Jackie Schachter, Karsten Steinhauer, Ray Vukevich,Jill Weisberg, and Harriet Wood-Bowden for their assistance withthis study.
Reprint requests should be sent to Aaron J. Newman, Departmentof Psychology, Life Sciences Centre, Dalhousie University, Halifax,NS, Canada, B3H 4R2, or via e-mail: [email protected].
Notes
1. AoA was dichotomized as “group,” rather than being treatedas a continuous variable, because this variable had a bimodaldistribution, with all native speakers having an AoA of 0. Such adistribution violates the assumption of normality.2. Theoetically speaking, every participant has violation andcontrol values that differ, more or less, from other participantsand the population means. By including a variable in both thefixed and random effects structure of a model, individual (by-subject) deviations from the fixed effects are estimated. Theinclusion of by-subject adjustments for the two levels of thecondition factor allowed us to model between-subject variabilityand obtain more accurate and generalizable estimates of thesetwo levels as well as to properly deal with any imbalance in the
data. The inclusion of ROI in the random effect structure enabledus to account for both individual variation in the scalp distributionof the effects, but also for individual spatial correlations betweenROI levels. In each analysis performed, we assessed whether theinclusion of these random effects significantly improved the fit ofthe model to the data. To do this a model without individualadjustments for the violation and control levels of the conditionfactor and a model allowing for such adjustments were fitted anda log-likelihood ratio test was performed between these twomodels (Bagiella et al., 2000; Pinheiro & Bates, 2000). These testsproved significant, justifying the inclusion of these randomeffects.3. The correlation between (objective) proficiency and self-reported proficiency is .79. The correlation between residualized(objective) proficiency and self-reported proficiency is .37.4. Because the additive nature of ANOVAs is incompatible withthe multiplicative nature of interactions, it is possible that theinteractions involving ROI are spurious. McCarthy and Wood(1985; see also Dien & Santuzzi, 2005) developed a scalingmethod that addresses this potential problem called vectorscaling. For each participant and each condition, mean ampli-tudes are scaled by the square root of the sum of the squaredmean amplitudes, i.e., Xij/√�(Xij2), where Xij is the amplitudefor subject i in condition j. If the scalp region by condition inter-action remains significant after rescaling then one may be moreconfident in the veracity of the effect, under certain conditions(Urbach & Kutas, 2002, 2006).5. Age × Years of Education: r= .49, β= 1.2 (as age increases,so does years of education), t(34) = 3.3, p= .003. Age × Group:r = .59, β= 9.9 (L2s are that much older than L1s), t(34) = 4.3,p = .0001. Years of Education × Group: r = .46, β = 3.2 (L2shave that much more years of education than L1s), t(34) = 3.1,p= .004. Age × Residualized Proficiency: r= .13, β= −0.3,t(34) = −0.8, p = .46. Years of Education × Residualized Profi-ciency: r=.1,β=0.59, t(34)=0.6,p=.55.Group×ResidualizedProficiency: r = .04, β = 1.6, t(34) = 0.2, p = .81.
REFERENCES
Baayen, R. H., Davidson, D. J., & Bates, D. M. (2008).Mixed-effects modeling with crossed random effects forsubjects and items. Journal of Memory and Language, 59,390–412.
Bagiella, E., Sloan, R. P., & Heitjan, D. F. (2000). Mixed-effectsmodels in psychophysiology. Psychophysiology, 37, 13–20.
Bates, D. M. (2005). Fitting linear mixed models in R. R News,5, 27–30.
Bates, D. M., Maechler, M., & Bolker, B. (2009). lme4: Linearmixed-effects models using S4 classes. R package version0.999375-39. The Comprehensive R Archive Network(CRAN): The Institute of Statistics and Mathematics ofthe Wirtshaftsuniversität Wien (WU).
Birdsong, D., & Molis, M. (2001). On the evidence formaturational constraints in second-language acquisition.Journal of Memory and Language, 44, 235–249.
Cohen, J. (1983). The cost of dichotomization. AppliedPsychological Measurement, 7, 249–253.
Coulson, S., & Van Petten, C. (2002). Conceptual integrationand metaphor: An event-related potential study. Memory &Cognition, 30, 958–968.
Davidson, D. J., & Indefrey, P. (2007). An inverse relationbetween event-related and time-frequency violationresponses in sentence processing. Brain Research, 1158,81–92.
Dien, J., & Santuzzi, A. M. (2005). Application of repeatedmeasures ANOVA to high-density ERP datasets: A reviewand tutorial. In Handy, T. C. (Ed.), Event-related potentials.
Newman et al. 1221

A methods handbook (pp. 57–82). Cambridge, MA:MIT Press.
Elston-Güttler, K. E., Paulmann, S., & Kotz, S. A. (2005).Whoʼs in control? Proficiency and L1 influence on L2processing. Journal of Cognitive Neuroscience, 17,1593–1610.
Flege, J., Yeni-Komshian, G. H., & Liu, S. (1999). Age constraintson second-language acquisition. Journal of Memory andLanguage, 41, 78–104.
Friederici, A. D., Steinhauer, K., & Pfeifer, E. (2002). Brainsignatures of artificial language processing: Evidencechallenging the critical period hypothesis. Proceedings ofthe National Academy of Sciences, U.S.A., 99, 529–534.
Gelman, A., & Hill, J. (2007). Data analysis using regressionand multilevel/hierarchical models. Cambridge, UK:Cambridge University Press.
Hahne, A., Mueller, J. L., & Clahsen, H. (2006). Morphologicalprocessing in a second language: Behavioral andevent-related brain potential evidence for storage anddecomposition. Journal of Cognitive Neuroscience,18, 121–134.
Hammill, D. D., Brown, V. L., Larsen, S. C., & Wiederholt, J. L.(1994). Test of Adolescent and Adult Language, third edition(TOAL-3) (3rd ed.). Austin, TX: Pro-Ed.
Hansen, J. C., & Hillyard, S. A. (1980). Endogenous brainpotentials associated with selective auditory attention.Electroencephalography and Clinical Neurophysiology,49, 277–290.
Johnson, J. S., & Newport, E. L. (1989). Critical period effectsin second language learning: The influence of maturationalstate on the acquisition of English as a second language1.Cognitive Psychology, 21, 60–99.
Juottonen, K., & Revonsuo, A. (1996). Dissimilar ageinfluences on two ERP waveforms (LPC and N400)reflecting semantic context effect. Cognitive BrainResearch, 4, 99–107.
Kotz, S. A., & Elston-Güttler, K. E. (2004). The role ofproficiency on processing categorical and associativeinformation in the L2 as revealed by reaction times andevent-related brain potentials. Journal of Neurolinguistics,17, 215–235.
Kuperberg, G. R., Kreher, D. A., Sitnikova, T., Caplan, D. N.,& Holcomb, P. J. (2007). The role of animacy and thematicrelationships in processing active English sentences:Evidence from event-related potentials. Brain andLanguage, 100, 223–237.
Kutas, M., & Federmeier, K. D. (2000). Electrophysiologyreveals semantic memory use in language comprehension.Trends in Cognitive Sciences, 4, 463–470.
Lau, E. F., Phillips, C., & Poeppel, D. (2008). A cortical networkfor semantics: (De)constructing the N400. Nature ReviewsNeuroscience, 9, 920–933.
Lenneberg, E. (1967). Biological foundations of language.New York: Wiley.
McCarthy, G., & Wood, C. C. (1985). Scalp distribution ofevent-related potentials: An ambiguity associated withanalysis of variance models. Electroencephalographyand Clinical Neurophysiology, 62, 203–208.
Meschyan, G., & Hernandez, A. E. (2006). Impact of languageproficiency and orthographic transparency on bilingualword reading: An fMRI investigation. Neuroimage, 29,1135–1140.
Midgley, K. J., Holcomb, P. J., & Grainger, J. (2009). Languageeffects in second language learners and proficient bilingualsinvestigated with event-related. Journal of Neurolinguistics,22, 281–300.
Moratti, S., Clementz, B. A., Gao, Y., Ortiz, T., & Keil, A. (2007).Neural mechanisms of evoked oscillations: Stability and
interaction with transient events. Human Brain Mapping,28, 1318–1333.
Moreno, E. M., & Kutas, M. (2005). Processing semanticanomalies in two languages: An electrophysiologicalexploration in both languages of Spanish–Englishbilinguals. Brain Research, Cognitive Brain Research,22, 205–220.
Morgan-Short, K., Sanz, C., & Ullman, M. T. (2010). Secondlanguage acquisition of gender agreement in explicit andimplicit training conditions: An event-related potential study.Language Learning, 60, 154–193.
Mueller, J. L., Hahne, A., Fujii, Y., & Friederici, A. D. (2005).Native and nonnative speakersʼ processing of a miniatureversion of Japanese as revealed by ERPs. Journal of CognitiveNeuroscience, 17, 1229–1244.
Mueller, J. L., Oberecker, R., & Friederici, A. D. (2009). Syntacticlearning by mere exposure: An ERP study in adult learners.BMC Neuroscience, 9, 1–10.
Münte, T. F., Schiltz, K., & Kutas, M. (1998). When temporalterms belie conceptual order. Nature, 395, 71–73.
Newman, A. J., Ullman, M. T., Pancheva, R., Waligura, D. L.,& Neville, H. J. (2007). An ERP study of regular and irregularEnglish past tense inflection. Neuroimage, 34, 435–445.
Newman-Norlund, R. D., Frey, S. H., Petitto, L.-A., & Grafton,S. T. (2006). Anatomical substrates of visual and auditoryminiature second-language learning. Journal of CognitiveNeuroscience, 18, 1984–1997.
Ojima, S., Nakata, H., & Kakigi, R. (2005). An ERP study ofsecond language learning after childhood: Effects ofproficiency. Journal of Cognitive Neuroscience, 17,1212–1228.
Pakulak, E., & Neville, H. J. (2010). Proficiency differencesin syntactic processing of monolingual native speakersindexed by event-related potentials. Journal of CognitiveNeuroscience, 22, 2728–2744.
Perani, D., Abutalebi, J., Paulesu, E., Brambati, S., Scifo, P.,Cappa, S. F., et al. (2003). The role of age of acquisitionand language usage in early, high-proficient bilinguals:An fMRI study during verbal fluency. Human BrainMapping, 19, 170–182.
Phillips, N. A., Segalowitz, N., Brien, I. O., & Yamasaki, N.(2004). Semantic priming in a first and second language:Evidence from reaction time variability and event-relatedbrain potentials. Journal of Neurolinguistics, 17, 237–262.
Pinheiro, J. C., & Bates, D. M. (2000). Mixed-effects modelsin S and S-PLUS. New York: Springer.
Pritchett, S., Zilberg, E., Xu, Z. M., Myles, P., Brown, I., &Burton, D. (2010). Peak and averaged bicoherence fordifferent EEG patterns during general anaesthesia.Biomedical Engineering Online, 9, 76.
Rossi, S., Gugler, M. F., Friederici, A. D., & Hahne, A. (2006).The impact of proficiency on syntactic second-languageprocessing of German and Italian: Evidence from event-related potentials. Journal of Cognitive Neuroscience,18, 2030–2048.
Tremblay, A. (2011). LMERConvenienceFunctions: A suite offunctions to back-fit fixed effects and forward-fit randomeffects, as well as other miscellaneous functions. R packageversion 1.6.3. http://cran.r-project.org/web/packages/LMER ConvenienceFunctions/index.html
Tremblay, A., & Tucker, B. V. (2011). The effects of N-gramprobabilistic measures on the recognition and productionof four-word sequences. The Mental Lexicon, 6, 302–324.
Urbach, T. P., & Kutas, M. (2002). The Intractibility ofscaling scalp distributions to infer neuroelectric sources.Psychophysiology, 39, 791–808.
Urbach, T. P., & Kutas, M. (2006). Interpreting event-relatedbrain potentials (ERP) distributions: Implications of baseline
1222 Journal of Cognitive Neuroscience Volume 24, Number 5

potentials and variability with application to amplitudenormalization by vector scaling. Biological Psychology,72, 333–343.
van de Meerendonk, N., Kolk, H. H. J., Chwilla, D. J., & Vissers,C. T. W. M. (2009). Monitoring in language perception.Language and Linguistics Compass, 3, 1211–1224.
Vos, S. H., Gunter, T. C., Kolk, H. H., & Mulder, G. (2001).Working memory constraints on syntactic processing: Anelectrophysiological investigation. Psychophysiology, 38,41–63.
Wartenburger, I., Heekeren, H. R., Abutalebi, J., Cappa, S. F.,Villringer, A., Perani, D., et al. (2003). Early setting of
grammatical processing in the bilingual brain. Neuron,37, 159–170.
Weber-Fox, C. M., Davis, L. J., & Cuadrado, E. (2003).Event-related brain potential markers of high-languageproficiency in adults. Brain and Language, 85, 231–244.
Weber-Fox, C. M., & Neville, H. J. (1996). Maturationalconstraints on functional specializations for languageprocessing: ERP and behavioral evidence in bilingualspeakers. Journal of Cognitive Neuroscience, 8, 231–256.
Wierda, S. M., van Rijn, H., Taatgen, N. A., & Martens, S. (2010).Distracting the mind improves performance: An ERP study.PloS One, 5, e15024.
Newman et al. 1223