Chapter 4 – Expert Reviews, Usability Testing, Surveys, and Continuing Assessments.

THE INFLUENCE OF EXPERT REVIEWS ON CONSUMERDEMAND FOR EXPERIENCE GOODS: A CASE STUDY OF
MOVIE CRITICS�
DavidA. Reinsteinwand ChristopherM. Snyderz
An inherent problem inmeasuring the influence of expert reviews on thedemand for experience goods is that a correlation between good reviewsandhighdemandmaybe spurious, inducedbyanunderlying correlationwith unobservable quality signals. Using the timing of the reviews bytwopopularmovie critics, Siskel andEbert, relative to openingweekendbox office revenue, we apply a difference-in-differences approach tocircumvent the problem of spurious correlation. After purging thespurious correlation, themeasured influence effect is smaller though stilldetectable. Positive reviews have a particularly large influence on thedemand for dramas and narrowly-released movies.
I. INTRODUCTION
THERE IS AN EXTENSIVE THEORETICAL LITERATURE (see, for example, Nelson[1970], Hey and McKenna [1981], Wiggins and Lane [1983], and Wolinsky[1995]) on consumer behavior in the presence of experience goods, i.e., goodsfor which the quality is uncertain prior to consumption. The relatedempirical literature has studied the impact of information about a product’squality on consumer demand from a variety of sources including advertising(Ackerberg [2003]), voluntary ormandatory product labeling (Teisl andRoe[1998], Foreman and Shea [1999], Mathios [2000], Jin and Leslie [2003]),social learning from peers (McFadden and Train [1996]), branding
rBlackwell Publishing Ltd. 2005, 9600Garsington Road, OxfordOX4 2DQ,UK, and 350Main Street,Malden,MA 02148, USA.
27
THE JOURNAL OF INDUSTRIAL ECONOMICS 0022-1821Volume LIII March 2005 No. 1
�We are grateful to Roger Ebert for his prompt and insightful replies to our questionsregarding the review process; toDarlene Chisholm,MauraDoyle, Robert Goldfarb, JonathanGruber, George Norman, Gityesh Pandya, Robert Porter, S. Abraham Ravid, W. DavidWalls, Anthony Yezer, and seminar participants at M.I.T. and the 2002 American EconomicAssociation Winter Meetings for valuable comments; and to Genevieve Brittain and NealToomey for excellent research assistance. The paper was substantially improved following thesuggestions of the editor and two anonymous referees. Some of this research was conductedwhile Snyder was on leave at the George G. Stigler Center for Study of Economy and State atthe University of Chicago, the support of which is gratefully acknowledged. We sadly reportthatGene Siskel, one of the twofilm critics onwhomwe focus of this study, died during the timewe were writing the paper.
wAuthors’ affiliations: University of California, Department of Economics, 549 EvansHall#3880, Berkeley, CA 94720, U.S.A.e-mail: [email protected]
zDepartment of Economics, George Washington University, 1922 F. Street N.W.,Washington, DC, 20052, U.S.A.e-mail: [email protected]

(Montgomery andWernerfelt [1992]), and indirect signals from firms’ price,quantity, or advertising decisions (Nelson [1974], Caves andGreene [1996]).In this paper, we contribute to the empirical literature by studying an
additional source of product information: expert reviews. It is common tosee books, concerts, movies, plays, restaurants, television shows, and otherproducts of the entertainment industry reviewed by professional critics.Many other experience goods are also critically reviewed, whether inpublications devoted to the whole range of consumer products (such asConsumer Reports) or to more narrow product classes (such as PCMagazine).We have several motives for studying the influence of expert reviews on
consumer demand. First, even if one considers expert reviews a closesubstitute for the other sources of information mentioned above, it is usefulto study them to get a comprehensive picture of the aggregate flow ofinformation that might influence consumers’ demand for experience goods.Second, these other sources of information are not likely to be perfectsubstitutes for expert reviews in any event, making expert reviews worthy ofindependent study. The distinctive feature of expert reviews is that they areissued by a private party rather than the firm itself. On the one hand, theindependence of the expert may reduce the bias in the information provided,increasing the influence on consumer demand.On the other hand, the expertmay not have the same incentive to circulate the information to consumers,reducing the influence ondemand.Of course, if the expert turns out to have asubstantial influence on demand, the firm will have an incentive to ‘capture’the expert through bribes or other means.1 Third, new econometricproblems are raised in measuring the influence of expert reviews as opposedto other sources of consumer information. As discussed in the followingparagraphs, we address the econometric problems by exploiting a quasi-natural experiment in the particular industry we study, movies.The inherent problem in measuring the influence of expert reviews on
demand is that products receiving positive reviews of course tend to be ofhigh quality, and it is difficult to determine whether the review or the qualityis responsible for high demand. In formal econometric terms, the coefficientfrom the regression of demand on reviews will be biased upward due to theomission of quality variables. In principle the bias could be removed byaccounting for quality; but quality is hard to measure for any product,especially for products whose quality is uncertain enough to merit critical
1 Themovie industry provides a recent example: theNewYork Times reported that Sonywasfined by the Connecticut attorney general for inventing critic David Manning and quoting hisfake reviews (e.g., ‘AnotherWinner!’) in the ads for at least four of itsmovies (Zielbauer [2002]).Michaely and Womack [1999] study stock analysts’ biases toward firms with which theiremployers have other business dealings. Ravid and Wald [2002] study possible movie critics’biases toward certain production companies.
28 DAVID A. REINSTEIN AND CHRISTOPHERM. SNYDER
r Blackwell Publishing Ltd. 2005.

appraisals. In Eliashberg and Shugan’s [1997] terms, the causal effect ofreviews on demand holding quality constant is the influence effect; thespurious correlation between reviews and demand induced by their mutualcorrelation with quality is the prediction effect.We propose a novel approach for distinguishing the influence and
prediction effects of reviews on demand. The particular case we study ismovies, an industry in which demand is readily measured by box officerevenue.We consider the reviews of Siskel and Ebert, twomovie critics whoarguably had the greatest potential for influence through their nationally-syndicated television show. Our approach hinges on the timing of theirreviews relative to a movie’s release. Reviews that come during a movie’sopening weekend can influence box office revenue for the remainder of theopening weekend; such reviews have both an influence and a predictioneffect. Reviews that come after a movie’s opening weekend cannot influenceopening weekend revenue; such reviews have only a prediction effect. Bytaking a difference in differencesFthe difference between a positive andnegative review for movies reviewed during their opening weekends andmovies reviewed afterFthe prediction effect canbe purged and the influenceeffect isolated. Our approach requires that the process by which the criticsselect movies to review during opening weekend and those to review after isindependent of quality signals including the positiveness of their reviews.Weprovide tests suggesting that such selection effects are not substantial.We find that a positive review has an influence on opening weekend box
office revenue even after purging the prediction effect. The results for thecombined sample of movies are only marginally statistically significant. Theresults are much stronger when broken down by subsample. We find aneconomically and statistically significant influence effect on openingweekend box office revenue for narrowly-released movies and for dramas.We find no influence effect for widely-released movies, or for genres such asaction movies or comedies. Intuitively, critics’ reviews are more importantfor ‘art’ movies than for ‘event’ movies, perhaps because, for this latter typeof movie, consumers already have sufficient quality signals from pressreports and advertising or consumers have a different view of quality thancritics.Results from additional regressions flesh out the model of consumer
demand for movies.We find that a positive review during amovie’s openingweekend does not merely steal business from later in the movie’s run but infact increases its total box office revenue. This increased revenue appears tocome at the expense of competing movies showing during that weekend,although this effect is imprecisely estimated. Taken together, these resultsare consistent with a model in which quality-sensitive consumers haveinfrequent opportunities to see movies; they see high-quality movies whenthey have the opportunity, but do not have the opportunity to see all high-quality movies. In this model, consumers use quality information to make
EXPERT REVIEWS AND CONSUMERDEMAND FOR EXPERIENCE GOODS 29
r Blackwell Publishing Ltd. 2005.

the secondary decision of which movie to see rather than the primarydecision of whether to go out to the movies.Our finding of a significant influence effect, at least for some types of
movies, is in contrast with Eliashberg and Shugan [1997], the one previousstudy of box office revenue that attempts to separate influence fromprediction effects. Using a sample of 56 long-running movies released in theearly 1990s, the authors regress weekly box office revenue on the movie’spercentage of positive reviews for each of the first eight weeks of a movie’srun. They find that the percentage of positive reviews is only marginallysignificant during the first four weeks of the movie’s run; the effect becomeslarger and more significant during the next four weeks. Based on theirmaintained assumption that the influence effect declines during a movie’srun, the authors conclude that the influence effect cannot be important andmust be dominated by the prediction effect. In fact, we also find a similarpattern of increasing correlation between reviews and box office revenueover the course of a movie’s run in our data, so cannot dispute theirconclusion about the relative importance of the prediction and influenceeffects. That we still find a positive influence effect on opening weekendrevenue may be due to our use of more powerful statistical testsFincludingover ten times the number of observations and a differentmeasure of reviews(reviews of two influential critics rather than an average of hundreds ofcritics’ reviews)Fthan Eliashberg and Shugan [1997].2
Besides our paper and Eliashberg and Shugan [1997], the rest of theliterature on the relationship between movie reviews and box office revenuedoes not attempt to purge the prediction effect.3 The studies tend to find apositive effect (Litman [1983]; Litman andKohl [1989];Wallace, Seigerman,and Holbrook [1993]; Sochay [1994]).4,5 Relating our paper to the broaderliterature on the influence of reviews on consumer demand for a variety of
2Research contemporaneous with ours by Basuroy, Chatterjee, and Ravid [2003] supportsthis view. They apply Eliashberg and Shugan’s [1997] methodology to a larger sample of 200movies. They find that negative reviews have a significantly larger negative effect on box officerevenue early in the movie’s run than later, suggestingFif one maintains Eliashberg andShugan’s [1997] assumptions about the dynamics of the influence and prediction effectsFasignificant influence effect.
3 There are several studies in communications literature (Faber and O’Guinn [1984], Wyattand Badger [1984,1987]) that ask questions of focus groups regarding the importance ofreviews relative to other ways of generating interest in a movie (advertising, word of mouth,etc.). There is much larger literature that forecasts box office revenue leaving aside critics’reviews, including Anast [1967], Austin [1984], Smith and Smith [1986], Austin and Gordon[1987], Dodds and Holbrook [1988], Prag and Casavant [1994], Sawhney and Eliashberg[1996], De Vany andWalls [1996,1997], Albert [1998], Neelamegham and Chintagunta [1999],and Moul [2004].
4An exception is Ravid [1999], which finds no significant effect.5 In many of these studies, the bias due to the prediction effect can be expected to be large
since the source for reviews is an annual movie guide with ex post ratings rather thancontemporaneous reviews.
30 DAVID A. REINSTEIN AND CHRISTOPHERM. SNYDER
r Blackwell Publishing Ltd. 2005.

products in addition to movies, much of the literature does not attempt topurge the spurious prediction effect. The papers that do so tend to focus onexpert reviews which contain objective information, ranging from summa-ries of user reliability surveys as published by Consumer Reports for usedcars (Hollenbacher and Yerger [2001]) to summaries of health planperformance indicators by various agencies (Spranca et al. [2000] and Jin[2002]). In a sense, these papers bear closer resemblance to the literature onproduct labeling cited above. Our paper differs from these in that the expertreviews we consider are more subjective, being the personal opinion of theexpert. Whether such subjective reviews are more or less influential thanmore objective ones is an empirical question: on the one hand, there may bemore new information in the subjective review than the publication ofobjective statistics that may already be commonly known; on the other,consumers may put less stock in soft information. Our paper also employs amethodology for separating the influence from the prediction effect whichdiffers from these other papers.
II. MODEL
LetRi be the box office revenue for movie i5 1,. . ., Imeasured over the timeperiod Ti, for example movie i’s opening weekend or entire run. Becausemovies are experience goods, consumers may seek signals of quality inadvance of attending, such as the positiveness of a critic’s review, denotedCi,or other signals contained in advance publicity, marketing, word of mouthfrom others who have already seen themovie, etc., denotedSi. Assume thesesignals influence consumer demand, and thus box office revenue, accordingto the following equation:
ð1Þ ln Ri ¼ aþ bDiCi þ dSi þ ei;
where a,b, and d are coefficients, presumablywithb,d � 0, andwhere ei is anerror term. The variable Di is a dummy equal to one if the review Ci waspublished before the end of the period Ti and equal to zero if Ci waspublished after. Equation (1) indicates that Ci can influence consumerdemandduring the periodTionly if it was published before the end ofTi, i.e.,only if Di5 1.We are primarily interested in estimating the coefficient b, which captures
the influence of the critic’s reviewon box office revenue. The presence ofSi inequation (1) poses an econometric problem sincemost of the components ofSi are likely to be unobservable to the econometrician. Letting b̂0 be theordinary least squares estimate of b from (1) omitting Si, it can be shown(see, e.g., Wooldridge [2002], p. 62) that
ð2Þ plimb̂0 ¼ bþ dCovðDiCi;SiÞVarðDiCiÞ
:
EXPERT REVIEWS AND CONSUMERDEMAND FOR EXPERIENCE GOODS 31
r Blackwell Publishing Ltd. 2005.

Since Ci and Si are both signals of the movie’s quality, they are likely to bepositively correlated, implying the second term in (2) is positive, in turnimplying b̂0>b. This upward bias in b̂0 is an instance of the standard omittedvariables problem.The traditional methodology (Litman [1983]; Litman and Kohl [1989];
Wallace, Seigerman, and Holbrook [1993]; Sochay [1994]; Eliashberg andShugan [1997]; Ravid [1999]; Basuroy, Chatterjee, and Ravid [2003])produces an estimate of bwhich is related to b̂0. Rather than regressing lnRi
onDiCi omitting Si (as with b̂0), though, the traditional methodology can beroughly characterized as regressing ln Ri on Ci omitting Si. That is, thetraditional methodology includes all reviews as a right-hand side variable,without regard to their timing. Let b̂00 be the resulting estimated coefficienton Ci. It can be shown that
ð3Þ plimb̂00 ¼ �Dbþ dCovðCi;SiÞVarðCiÞ
;
where �D is the average value of the dummy variable Di, or equivalently thefraction of movies reviewed before the end of revenue period Ti rather thanafter. There are two sources of bias in the traditional methodology. There willbe the upward bias due to the omitted variable problem, given by the secondterm of (3). There will be another source of bias if some movies were notreviewed until after period Ti, for then �D<1, biasing b̂00 downward. It isimpossible to tell exante if thenet effectof the twobiases ispositiveornegative.Our approach to obtain a consistent estimate of b is to run a regression
along the lines of
ð4Þ lnRi ¼ aþ bDiCi þ gCi þ ui:
This regression is similar to equation (1) exceptCi has been substituted asa proxy for the variable which is unobservable to the econometrician,Si. For(4) to be identified,DiCi cannot be perfectly colinear with either the constantorCi, which in turn requires there to be somemovies that are reviewedbeforethe end of Ti and some after.It can be shown (see, e.g., Wooldridge [2002], pp. 63–64) thatCi is a good
proxy for Si, meaning that the ordinary least squares estimate b̂ of thecoefficient b in equation (4) will be consistent, if two conditions hold. First,Ci has to be redundant in the sense that it does not contribute to theconditional expectation of lnRi once DiCi and Si are known:
ð5Þ EðlnRijDiCi;Si;CiÞ ¼ EðlnRijDiCi;SiÞ:
Redundancy ofCi is true by definition since movies reviewed after period Ti
cannot influence revenueRi during the period. Second, letting vi be the errorin the linear projection of Si on Ci,
ð6Þ Si ¼ l0 þ l1Ci þ vi
32 DAVID A. REINSTEIN AND CHRISTOPHERM. SNYDER
r Blackwell Publishing Ltd. 2005.

where E(vi)5E(Civi)5 0, then Cov(DiCi,vi)5 0. A sufficient condition forCov(DiCi,vi)5 0 is for Di to be independent of Ci and vi:
ð7Þ CovðDiCi; viÞ ¼ EðDiCi; viÞ
ð8Þ ¼ EðDiÞEðCiviÞ
ð9Þ ¼ 0
where equation (7) holds since E(vi)5 0, (8) holds using the independence ofDi fromCi and vi, and (9) holds since E(Civi)5 0. If the two conditions forCi
to be a good proxy forSi hold, it is obvious that the right-hand side variablesin equation (4) will be uncorrelated with the error ui, and so b̂ will be aconsistent estimate of b.To summarize, the preceding analysis highlights two key conditions that
must hold for equation (4) to produce a consistent estimate of the influenceeffect. First, the data must contain variation in the timing of reviews,represented byDi. That is, some movies must have been reviewed before theend of Ti and some after. As we will see in Section III, this requirement issatisfied byour data: wewill takeTi to be themovie’s openingweekend; about80 percent of the movies in our data were reviewed before the end of openingweekend and about 20 percent after. Second, Di must be independent of Ci
and vi, which is equivalent to Di being independent of Ci and Si. That is, thetiming of the critic’s review must be independent of the positiveness of thereview and of other quality signals. A violation of this requirement suggeststhe presence of a selection effect, whereby the critic selects which movies toreview when based on the quality of the movie.We will provide evidence thatour data satisfy this independence requirement in Section VI.Including the proxy Ci in the regression (4) makes our estimator of the
influence effect a difference-in-differences estimator: it is the differencebetween the effect of a positive andnegative reviewbetweenmovies reviewedbefore the end of periodTi and those reviewed after. Reviews before the endof Ti will have both the influence effect we are trying to measure plus theupward bias due to the omission of Si (labeled the prediction effect in theIntroduction). Reviews after the end ofTiwill have only the omitted variablebias/prediction effect.Differencing the twopurges the omitted variable bias/prediction effect.Our final empirical specification is slightly richer than equation (4):
ð10Þ lnRi ¼ a0 þ a1Di þ bDiCi þ gCi þ Xiyþ Zimþ ui:
This regression includes a vector ofmovie characteristics that are observableto the econometrician such as genre, producer identity, season of release,etc., denoted Xi. It includes Di directly, allowing the intercept to dependon the timing of the review. We will sometimes add further proxies
EXPERT REVIEWS AND CONSUMERDEMAND FOR EXPERIENCE GOODS 33
r Blackwell Publishing Ltd. 2005.

for movie quality, Zi, such as other critics’ reviews in certain specificationsto reduce the error vi in the linear projection of Si on quality proxies inequation (6).
III. DATA
Our study focuses on the influence of two critics, Gene Siskel and RogerEbert, on opening weekend box office revenue. Siskel and Ebert are idealcandidates for study because they were regarded as the most influentialmovie critics.6 Their influence was due in large part to their nationally-syndicated television show (first titled At the Movies, later titled Siskel &Ebert) in which they each rendered their opinion on about four movies eachweek, a ‘thumbs up’ for a positive and a ‘thumbs down’ for a negativeopinion.Records were kept on the day movies were reviewed on their television
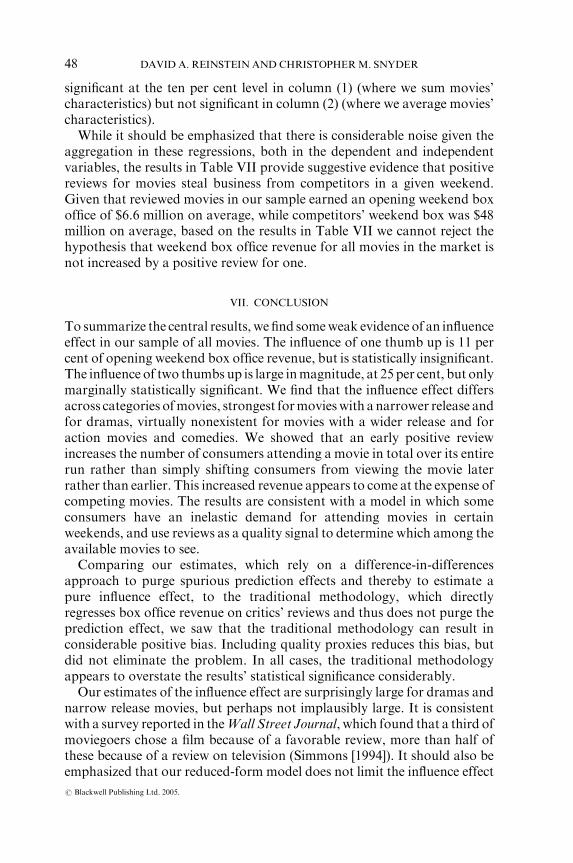
show, allowing us to apply the estimation methodology from the previoussection, which relies on the timing of the review relative to the movie’sopening weekend. Consider Figure 1. The Friday, Saturday, and Sundayduring the first week of a movie’s run constitute its opening weekend.7 Formany observations in our data set, the movie was reviewed on Saturdaymorning during the opening weekend,8 in which case we set the dummyvariable DURING equal to one. For these observations, there is somepotential for the review to influence box office for the remainder of theweekend. Even if consumers did not see Siskel and Ebert’s television showitself before making their decision, positive reviews were often quoted in themovie’s advertisements.Most othermovieswere not revieweduntil theweek or severalweeks after.
There is no potential for these reviews to influence opening weekend boxoffice revenue, though there will likely still be a positive correlation betweenthem due to the prediction effect. A small number of movies were reviewedbefore the opening weekend. We omitted them from the final data set;pooling them with the DURING5 1 movies, or indeed treating them as aseparate category, did notmaterially affect the results. In sum, our final dataset consists of two groups of movies: those reviewed during their openingweekend, indicated byDURING5 1, and those reviewed after, indicated byDURING5 0.
6They were ranked among Smith’s [1998] list of the 100most influential people in the historyof the movies, the only critics to make the list. Smith writes: ‘‘. . .[their] five-time EmmyAwardwinning program is aired on 180 of the country’s broadcasting stations . . .reachable through astaggering 95% of all television sets.’’
7 In the case of a Monday holiday, the data typically fold the Monday figures into openingweekend.
8 Siskel andEbert’s television showaired on Sundays in a fewmarkets but aired onSaturdaysin most markets including the largest ones (New York, Chicago, Los Angeles, etc.).
34 DAVID A. REINSTEIN AND CHRISTOPHERM. SNYDER
r Blackwell Publishing Ltd. 2005.

Table I lists the main variables we will employ, together with descriptivestatistics, and sources.9 Our box office revenue variables (corresponding toRi from Section II) are TOTREV and OPENREV. Our review variables(corresponding to Ci from Section II) are SISKEL UP and EBERT UP. Itwill sometimes be useful to combine Siskel’s andEbert’s reviews into a singlereview variable, ranked as follows in terms of increasing quality: no thumbsup (implying ONE UP5 0 and TWO UP5 0), exactly one thumb up(implying ONE UP5 1 and TWO UP5 0), or two thumbs up (implyingONE UP5 0 and TWO UP5 1). Our dummy for the timing of the reviewrelative to the opening weekend (corresponding to Di in Section II) isDURING. Our other controls (corresponding to Xi in Section II) includeSCREENS and FOURDAY reported in Table I, as well as dummies for yearof release, month of release, genre,10 and production company.11 Ouradditional quality proxy (corresponding toZi in Section II) isMALTIN, themovie’s rating on a 1–4 scale by Leonard Maltin, another popular filmcritic.12We also collected data on weekend box office revenue for all movies
Fri. Sat. Sun. Sat.Fri.Thur.Wed.Tues.Mon. Sun.
opening weekend second (or later) weekend
DURING = 1 review DURING = 0 review
Figure 1
Timing of Review Relative to Movie’s Release
9 The final data set has 609 movie/observations. Merging data from the three sourcesFtheBoxOffice Guru web site, the Siskel and Ebert web site, and LeonardMaltin’s book of reviews(Maltin [1999])Fresulted in 806 observations. We dropped 13 that were reviewed on a dayother than Saturday, 137 that opened on fewer than 50 screens (indicating a ‘narrow releasestrategy’ which might confound our results), eight that were reviewed more than 40 days afteropening, and 39 which were reviewed before the opening weekend.
10Movies are allowed to fall into more than one of our genres, which include adventure,animated, children’s, comedy, crime, documentary, drama, fantasy, film noir, horror, musical,mystery, romance, science fiction, thriller, war, and western.
11We grouped production companies together with subsidiaries to form nine dummies:Disney (includingBuenaVista andMiramax), Sony (including Sony,Columbia, SonyClassics,and TriStar), Fox (including Fox and Fox Searchlight), MGM/UA (including MGM/UA,MGM, Goldwyn, and United Artists), Gramercy, Orion, Universal, Warner Bros. (includingWarner Bros., New Line, and Fine Line), and Paramount. The remaining movies were mostlyproduced by small companies (independents).
12 Based on the work of Litman [1983] and later authors, who included Academy Awards asregressors in their revenue equations, we added information onAcademyAwardsFmajor awardssuch as best film, director, actor, and actress, and the other minor awardsFto our data set. Thedata was taken fromMaltin [1999]. For brevity, we do not report the regressions we ran includingAcademyAward variables because all alternative forms of the AcademyAward variables we triedwere insignificant, and their inclusion/exclusion had no effect on the other coefficients.
EXPERT REVIEWS AND CONSUMERDEMAND FOR EXPERIENCE GOODS 35
r Blackwell Publishing Ltd. 2005.

TableI
DefinitionsofVariablesandDescriptiveStatistics
Variable
Definition
Units
Mean
Standard
Deviation
Maxim
um
Minim
um
TOTREV
U.S.boxoffice
revenueformovie’sentire
run
million1999$
30.6
39.6
312.0
0.4
OPENREV
U.S.boxoffice
revenueformovie’sopeningweekend
million1999$
6.6
6.9
53.9
0.1
SISKELUP
Siskelpositivereview(‘thumbsup’)
dummy
0.32
F1
0EBERTUP
Ebertpositivereview(‘thumbsup’)
dummy
0.41
F1
0ONEUP
Thumbupbyexactly
oneofSiskelorEbert
dummy
0.31
F1
0TWO
UP
Thumbsupbyboth
SiskelandEbert
dummy
0.21
F1
0DURIN
GSiskelandEbertreviewduringopeningweekend
dummy
0.81
F1
0SCREENS
Number
ofscreensexhibitingonopeningweekend
thousands
1.49
0.64
3.70
0.05
FOURDAY
Fourdayweekend(M
ondayholiday)
dummy
0.07
F1
0MALTIN
RatingbyLeonard
Maltin,apopularfilm
critic
1–4scale
2.29
0.56
3.50
1.00
Notes:609observations.TOTREVandOPENREVdeflatedusingurbanCPIindex.O
PENREVincludes
Friday,S
aturday,andSundayrevenueforallcasesexceptmoviesopening
onfourdayweekends;thesealsoincludeMondayrevenue.TOTREV,OPENREVandSCREENSfrom
theBoxOffice
Guru
web
site
(www.boxofficeguru.com).SISKELUPand
EBERTUPfrom
SiskelandEbertweb
site(w
ww.tvplex.com/BuenaVista/SiskelandEbert).MALTIN
from
Maltin
[1999].DURIN
Gcalculatedbyauthorsusingopeningdatefrom
theBoxOffice
Guru
web
site
andreviewdate
from
theSiskelandEbertweb
site.Therestofthevariablescomputedbyauthors.Variablesin
tablecollectedatmovielevelof
observation.Wealsocollected,from
theVarietyweb
site
(www.variety.com),totalU.S.weekendboxoffice
revenueforallmoviesforeach
ofthe346weekendsin
thedata
set,
MKTREV,deflatedusingurbanCPIindex.ThemeanofMKTREVin
million1999dollars
is59.7
andthestandard
deviationis19.7
36 DAVID A. REINSTEIN AND CHRISTOPHERM. SNYDER
r Blackwell Publishing Ltd. 2005.

in the U.S. market, labeledMKTREV, which will be used in the analysis ofcompetitive effects usingmarket-level data in SectionVI. The notes to TableI provide descriptive statistics on MKTREV.Table II presents correlations among revenue measures, Siskel and Ebert
reviews, and the MALTIN quality proxy. It is tempting to conclude thatthere is an influence effect from the positive correlation between the reviewsand the revenue measures. Since both influence and prediction effects arecombined in the correlation, such a conclusion would be unwarranted.Indeed, the raw correlation between ln(OPENREV) and SISKEL UP ishigher for movies reviewed after than during the opening weekend, andsimilarly for the correlation between ln(OPENREV) and EBERT UP,impossible if the influence effect were the only effect present.From Table II it appears thatMALTIN should serve as a good proxy for
unobserved quality. The pattern of correlations between critics’ reviewsand revenue measures, namely higher with ln(TOTREV) than withln(OPENREV), indicates that the critics’ reviews are more correlated withrevenue later in a movie’s run than earlier, consistent with the findings ofEliashberg and Shugan [1997].MALTIN is evenmore highly correlatedwithbox office revenue than SISKELUP and EBERTUP, but this is due in partto Maltin’s rating scale being more refined than Siskel and Ebert’s.The correlations in theDURING row provide ambiguous evidence on the
existence of selection effects whichmight cause our difference-in-differencesestimator to be inconsistent. There is essentially no correlation between therevenue measures and DURING. On the other hand, certain of the reviewvariables are positively correlated with DURING, raising the possibility ofselection effects. Because of the importance of the selection issue for theconsistency of our estimator, we explore it in more detail in the next section.
IV. EVIDENCE ON SELECTION EFFECTS
As noted in Section II, a sufficient condition for the consistency ofour difference-in-differences estimatorof the influence effect is for the timingof reviews Di to be independent of their positiveness Ci or other quality
Table II
RawCorrelations Among SelectedVariables
ln(TOTREV) ln(OPENREV) MALTIN SISKEL UP EBERT UP
ln(OPENREV) 0.95���
MALTIN 0.35��� 0.25���
SISKEL UP 0.16��� 0.13��� 0.27���
EBERT UP 0.17��� 0.09�� 0.33��� 0.35���
DURING 0.04 0.03 0.18��� 0.04 0.08��
Note: Correlation coefficient significant at the �ten per cent level, ��five per cent level, ���one per cent level in a
two-tailed test.
EXPERT REVIEWS AND CONSUMERDEMAND FOR EXPERIENCE GOODS 37
r Blackwell Publishing Ltd. 2005.

signals Si. In this section, we provide evidence that the process by whichSiskel and Ebert selected which movies to review when was largelyindependent of quality, providing some confidence in the consistency ofour results.Our personal correspondence with Roger Ebert suggested that the
decision to a review a movie during its opening weekend, rather than after,was random inmost cases.13 Siskel andEbert’s general policywas to review amovie during its opening weekend.14 The most common reason forreviewing a movie after its opening weekend was that it simply did not fitin the previous show. In other cases, they needed to review a backlog ofmovies accumulatedduring a hiatus for attending film festivals. Studios onlyrarely prevented Siskel and Ebert from screening movies in advance ofopening weekend, contradicting Smith’s [1998] claim that studios often didthis to keep two thumbs down from ruining the movie’s opening.To provide more formal evidence on the randomness of the selection
process, we ran several specifications of a probit with DURING as thedependent variable and with revenue, the nature of Siskel and Ebert’sreviews, and other controls used in the regressions in Section V below asright-hand side variables. The results are reported inTable III. For these andall subsequent regressions throughout the paper, we report White [1980]heteroskedasticity-robust standard errors in parentheses, adjusted toaccount for the possible correlation in the errors for movies released in thesame weekend. Whether the review variables used are SISKEL UP andEBERTUP as in column (1) orONEUP andTWOUP as in column (2), thereview variables are not significant in the regression. Furthermore, there islittle explanatory power in the probit. The pseudo R2 is at most 22 percent.What explanatory power there is does not come from the revenue or Siskeland Ebert review variables: as shown in column (5), the log likelihood andpseudo R2 remain essentially unchanged if the review variables, along withother quality proxies and revenue, are omitted from the regression entirely.Rather, most of the explanatory power comes from variables relating to therelease date: FOURDAY, year dummies, and month dummies. Thecoefficients on these variables show that movies were more likely to bereviewed late when there was a large number of releases: during fourday holiday weekends, during more recent years, and during the monthsof January, May, June, August, and December. This is consistent with
13 Email correspondence on September 14 and September 17, 2000.14 The few cases in which they reviewed a movie before its opening weekend may have
involved non-random selection. They sometimes issued early reviews for films which theywanted to boost or for films that were particularly newsworthy. In other cases, the selectionprocess wasmore random, for example when they issued early reviews to avoid a backlogwhena large number of movies were set to be released. In any event, the possible non-randomselection of movies to be reviewed prior to opening supports our decision to drop those 39observations.
38 DAVID A. REINSTEIN AND CHRISTOPHERM. SNYDER
r Blackwell Publishing Ltd. 2005.

the claim above that Siskel and Ebert mainly reviewed movies afteropening when they had too many movies to review in a given week ontheir show.The one piece of evidence suggesting that the timing of Siskel and Ebert’s
reviews may not be completely independent of quality signals is thesignificance of MALTIN. High-quality moviesFas gauged by Maltin’sreviewFtended to be reviewed earlier by Siskel and Ebert. This is an oddresult given that qualityFgauged by the reviews of Siskel and EbertthemselvesFhad little effect on the timing of their reviews. We checkedwhether the inclusion of theMALTIN quality proxy might be masking thesignificance of the review variablesFSISKEL UP and EBERT UP incolumn (3) and ONE UP and TWO UP in column (4)Fby running theprevious regressions omitting MALTIN. The review variables remainedinsignificant in all cases. In any event, the combined selection effectproduced by MALTIN and variables besides those relating to release datecannot be too large. As shown in column (5), omitting all of these variables
Table III
ProbitEvidence on SelectionEffects
(1) (2) (3) (4) (5)
ln(OPENREV) 0.00 0.00 0.11 0.11 F(0.14) (0.14) (0.13) (0.13)
SISKEL UP 0.00 F 0.05 F F(0.16) (0.16)
EBERT UP 0.08 F 0.19 F F(0.15) (0.14)
ONE UP F 0.17 F 0.22 F(0.16) (0.16)
TWO UP F 0.03 F 0.21 F(0.22) (0.20)
MALTIN 0.43��� 0.44��� F F F(0.13) (0.13)
SCREENS � 0.06 � 0.06 � 0.21 � 0.22 F(0.20) (0.20) (0.20) (0.20)
FOURDAY � 0.94��� � 0.94��� � 0.99��� � 1.00��� � 0.98���
(0.28) (0.28) (0.27) (0.27) (0.27)Constant 0.30 0.24 � 0.37 � 0.48 1.23���
(1.81) (1.81) (1.78) (1.79) (0.39)Year dummies 31.57��� 31.32��� 31.74��� 31.57��� 28.90���
Month dummies 31.03��� 30.69��� 33.29��� 33.13��� 26.57���
Genre dummies 17.11 17.54 18.60 18.85 FProducer dummies 9.04 9.47 9.05 9.58 FLog likelihood � 227 � 226 � 231 � 231 � 233Pseudo R2 0.21 0.22 0.20 0.20 0.15
Notes: Dependent variable is DURING, the dummy variable indicating a movie that is reviewed by Siskel and
Ebert during its opening weekend. Regressions involve 573 observations. The sole movie in the documentary
genre, the solemovie in the filmnoir genre, and the 34movies opening inDecember had to be dropped since their
associated categories were perfect predictors of the dependent variable. White [1980] heteroskedasticity-robust
standard errors, adjusted to account for possible correlation in the errors for movies opening in the same
weekend, reported in parentheses below coefficient estimates. Entries for dummy variables are w2 statistics fortest of joint significance. Significantly different from zero in a two-tailed test at the �ten per cent level, ��five per
cent level, ���one per cent level.
EXPERT REVIEWS AND CONSUMERDEMAND FOR EXPERIENCE GOODS 39
r Blackwell Publishing Ltd. 2005.

only reduces the probit’s pseudoR2 by 30 percent, or about six percent of thetotal variance of DURING.
V. MEASURING INFLUENCE AND PREDICTION EFFECTS
The difference-in-differences methodology for estimating the influenceeffect, embodied in equation (10), called for regressing ln Ri onDi,DiCi, Ci,other controls Xi, and additional quality proxies Zi. Translating thesevariables into their empirical counterparts defined in Section III, we willregress ln(OPENREV) on DURING, the interaction of DURING with ourreview variablesONEUP and TWOUP, the review variablesONEUP andTWO UP entered directly, other controls including SCREENS, FOUR-DAY, and dummies for year, month, genre, and production company, andthe additional quality proxy MALTIN.The basic regression is given in column (1) of Table IV. The variables of
main interest are DURING � ONE UP and DURING � TWO UP. Giventhat ONE UP is included as a separate regressor, the coefficient onDURING � ONE UP provides a difference-in-differences estimate of theinfluence effect of one thumb up as a per cent of opening weekend box officerevenue. That is, DURING � ONE UP is the marginal effect of having thereview come during opening weekend rather than after on the marginaleffect of one thumb up relative to two thumbs down. Similarly,DURING � TWO UP is the influence effect of two thumbs up as a percent of opening weekend box office revenue. As the table shows, theinfluence effect of one thumb up is 11 per cent of openingweekend box officerevenue, though statistically insignificant. The influence effect of twothumbs up is 25 per cent, marginally significant at the ten per cent level.As equation (2) and the surrounding text suggests, the coefficients on
ONE UP and TWO UP can be used to determine the direction andsignificance of the prediction effect, the spurious correlation betweenreviews and revenue caused by their mutual covariance with unobservablequality. Column (1) of Table IV shows that the prediction effect is positive,from four to seven per cent, but statistically insignificant.The results for the ancillary variables are all in line with expectations.
The coefficient on DURING is small and insignificant, showing that theregression’s intercept does not vary with the timing of reviews.The coefficient on the additional quality proxy MALTIN is positive andhighly significant. The coefficient on SCREENS is large and highlysignificant. The coefficient on FOURDAY is positive and marginallysignificant. The table does not report details on the fixed effects for year,month, genre and producer, reporting only the F-statistic from a joint testof each set’s significance. Looking more carefully at the month fixed effects,the seasonal pattern of box office revenue emerges as expected:movies in thespring and fall tend to earn less than summer and winter, with revenues in
40 DAVID A. REINSTEIN AND CHRISTOPHERM. SNYDER
r Blackwell Publishing Ltd. 2005.

June and July significantly higher than the rest of the months. Otherwork, including Radas and Shugan [1998] and Krider and Weinberg [1998]also finds similar strong seasonal patterns.15 Among genres, animated,children’s, documentaries, and film noir earned less than average,while crime, fantasy, romance, and thrillers earned more. Movies fromthe large studios tended to earn significantly more than from independentstudios.In the remaining columns of Table IV,we repeat the basic specification for
various subsamples of movies. Columns (2) and (3) break our sample intowidely and narrowly-releasedmovies, where widely-releasedmovies openedon more than the sample median number of screens and narrowly-releasedmovies on the sample median or fewer. The results show no influence effect
Table IV
OpeningWeekendBoxOfficeRevenueRegressions,Basic Specification, for
Various Subsamples
Subsample:
Breakdown by SCREENS Breakdown by Genre
Allmovies (1)
WideRelease (2)
NarrowRelease (3)
Drama(4)
Action(5)
Comedy(6)
DURING � 0.10 � 0.10 � 0.05 � 0.28 � 0.08 � 0.06(0.07) (0.09) (0.11) (0.18) (0.14) (0.10)
DURING � ONE UP 0.11 � 0.06 0.13 0.51�� 0.07 � 0.01(0.12) (0.15) (0.18) (0.24) (0.22) (0.14)
DURING � TWO UP 0.25� � 0.04 0.37� 0.65� 0.08 � 0.37(0.15) (0.20) (0.21) (0.34) (0.24) (0.30)
ONE UP 0.07 0.26�� 0.02 � 0.27 0.22 0.23�
(0.10) (0.13) (0.15) (0.22) (0.21) (0.12)TWO UP 0.04 0.35� � 0.15 � 0.42 0.14 0.72��
(0.14) (0.19) (0.20) (0.32) (0.21) (0.28)MALTIN 0.27��� 0.24��� 0.33��� 0.25��� 0.32��� 0.28���
(0.04) (0.05) (0.06) (0.08) (0.07) (0.06)SCREENS 1.22��� 1.15��� 1.44��� 1.17��� 1.04��� 1.13���
(0.05) (0.10) (0.10) (0.08) (0.10) (0.07)FOURDAY 0.12� 0.08 0.18�� 0.24 0.15 0.15
(0.06) (0.08) (0.12) (0.15) (0.14) (0.11)Constant 12.22��� 12.66��� 11.79��� 12.28��� 12.17��� 12.60���
(0.18) (0.29) (0.25) (0.38) (0.36) (0.29)Year dummies 3.27��� 1.60 1.08 1.32 1.21 0.96Month dummies 3.93��� 3.33��� 1.12��� 3.00��� 3.17��� 3.03���
Genre dummies 5.36��� 3.36��� 3.06��� F F FProducer dummies 4.41��� 2.57��� 2.81��� 3.21��� 2.08�� 2.15��
R2 0.78 0.69 0.70 0.79 0.82 0.75Observations 609 304 305 198 148 267
Notes: Ordinary least squares regressions. White [1980] heteroskedasticity-robust standard errors, adjusted to
account for possible corelation in the errors for movies opening in the same weekend, reported in parentheses
below coefficient estimates. Entries for sets of dummy variables are F statistics for test of joint significance.
Significantly different from zero in a two-tailed test at the �ten per cent level,��five per cent level, ���one per cent
level.
15We abstract from the competitive/strategic aspects of the timing of a movie’s release. SeeDe Vany and Walls [1997] and Chisholm [2003] for work along these lines.
EXPERT REVIEWS AND CONSUMERDEMAND FOR EXPERIENCE GOODS 41
r Blackwell Publishing Ltd. 2005.

for widely-released movies but a positive influence effect for narrowly-released ones. The influence effect of two thumbs up for narrowly-releasedmovies was 37 per cent, statistically significant at the ten per cent level.Columns (4), (5), and (6) break our sample into the main genres: dramas,comedies, and action movies. There appears to be no influence effect foractionmovies and comedies, but a large and statistically significant influenceeffect for dramas: 51 per cent for one thumb up and 65 percent for twothumbs up. Taken together, these results for subsamples of movies areconsistent with the intuition that critics’ reviews influence ‘art’ movies butnot ‘event’movies. Itmay be that consumers of the ‘event’movies (e.g., largebudget action movies and comedies) already have good signals of qualityfrom advertising and press reports, or that they are insensitive to thequalities judged by the critics. At the other extreme, say for an art housedrama, Siskel and Ebert’s positive review may largely determine its successor failure.The coefficients on ONE UP and TWO UP, which as noted above are
related to the prediction effect, have an interesting pattern across the resultsin columns (2) through (6) for various subsamples of movies. While theinfluence effect as measured by the interaction terms DURING � ONE UPand DURING � TWO UP is insignificantly different from zero for largermovies, action movies, and comedies, the prediction effect as measured bythe coefficients on ONE UP and TWO UP is positive, statisticallysignificantly so in many cases. The opposite is true for small movies anddramas. For them, the influence effect is significantly positive, but theprediction effect is zero or negative (the negative coefficients on ONE UPand TWO UP for dramas are large but statistically insignificant). Theseresults suggest that for widely-released movies, action movies, andcomedies, Siskel and Ebert’s criteria for quality were similar to the averagemoviegoer’s, though the average moviegoer was insensitive to reviews. Fornarrowly-releasedmovies and dramas, Siskel and Ebert’s criteria for qualitymay have only matched that of a smaller segment of the population (‘highbrow’ consumers), and these ‘high brow’ consumers were more sensitive tocritics’ reviews than the average moviegoers.The remainder of the section describes alternative specifications run to test
the robustness of our baseline model and to provide more nuanced tests ofour underlying demand model. We restrict attention to the subsample ofdramas since this exhibits the strongest influence effect. In columns (1) and(2) of Table V, we investigate the importance of including additional qualityproxies besides the review variables. In principle, our difference-in-differences estimator does not require additional quality proxies besidesthe review variablesONEUP and TWOUP for consistency, though addingthem (referred to as Zi in Section II) should improve the estimator’sprecision and should reduce any remaining bias in our estimator due toomitted quality signals. Column (2) of Table V removes the quality proxy
42 DAVID A. REINSTEIN AND CHRISTOPHERM. SNYDER
r Blackwell Publishing Ltd. 2005.

MALTIN from the basic regression in the previous column. RemovingMALTIN, which had a large, positive and statistically significant coefficientin column (1), from the regression in column (2) does not materially affectthe coefficients of interest, i.e., those on DURING � ONE UP andDURING � TWO UP. The measured influence effect remains above 50per cent for both one and two thumbs up and remains statisticallysignificant. The additional quality proxy MALTIN takes over some of thefunction of the review variables ONE UP and TWO UP as quality proxies,causing the coefficients on the review variables to fall fairly uniformly.The possible endogeneity of SCREENS is a concern. Producers may have
opened movies they expected, for reasons unobservable to the econome-trician, to earnmore revenueonmore screens, implying thatSCREENSmaybe positively correlated with the error in the revenue equation. The truecoefficient on SCREENS may be one, i.e., revenue is proportional to thenumber of screens, but the estimated coefficient may be biased upward, inturn biasing the rest of the coefficients in the regression. To check whetherour results of central interest were being driven by the possible endogeneityof SCREENS, we re-ran the regression in column (1) constraining the
TableV
BoxOfficeRevenueRegressions for Subsample ofDramas
Dependent Variable: ln(OPENREV)(1)
ln(OPENREV)(2)
ln(OPENREV� SCREENS)
(3)ln(TOTREV)
(4)
DURING � 0.28 � 0.21 � 0.24 � 0.47(0.18) (0.18) (0.18) (0.27)
DURING � ONE UP 0.51�� 0.51�� 0.32 0.70��
(0.24) (0.25) (0.24) (0.34)DURING � TWO UP 0.65� 0.56� 0.58 0.85
(0.34) (0.33) (0.42) (0.55)ONE UP � 0.27 � 0.21 � 0.11 � 0.31��
(0.22) (0.23) (0.22) (0.31)TWO UP � 0.42 � 0.21 � 0.33 � 0.40
(0.32) (0.30) (0.39) (0.53)MALTIN 0.25��� F 0.30��� 0.52���
(0.08) (0.10) (0.11)SCREENS 1.17��� 1.17��� F 1.23���
(0.08) (0.08) (0.10)FOURDAY 0.24 0.24 0.20 0.13
(0.15) (0.16) (0.16) (0.21)Constant 12.28��� 12.69��� 6.66��� 13.00���
(0.38) (0.32) (0.40) (0.54)Year dummies 1.32 1.56 0.48 1.88�
Month dummies 3.00��� 2.59��� 2.62��� 2.41���
Producer dummies 3.21��� 3.52��� 2.09�� 3.27���
R2 0.79 0.78 0.34 0.72
Notes: Ordinary least squares regressions for subsample of dramas, including 198 observations. White [1980]
heteroskedasticity-robust standard errors, adjusted to account for possible correlation in the errors for movies
opening in the same weekend, reported in parentheses below coefficient estimates. Entries for sets of dummy
variables are F statistics for test of joint significance. Significantly different from zero in a two-tailed test at the�ten per cent level, ��five per cent level, ���one per cent level.
EXPERT REVIEWS AND CONSUMERDEMAND FOR EXPERIENCE GOODS 43
r Blackwell Publishing Ltd. 2005.

coefficient on SCREENS to be one. We did this by using revenue per screenas the dependent variable rather than the revenue level and omittingSCREENS from the right-hand side. We have again restricted attention tothe subsample of dramas. The results, presented in column (3) of Table V,are similar in magnitude to those in column (1). The standard errors arelarger, so the estimated influence effects, though large at 32 per cent for onethumb up and 58 per cent for two thumbs up, are statistically insignificant.The next regression in Table V fleshes out the model of consumer demand
for movies. For simplicity, the model in Section II involved a staticconsumption decision. In practice, the consumer’s decision is morecomplicated. It involves at least two component decisions: (a) the dynamicdecision of whether to see a movie now or later in its run along with (b) thedecision whether or not to substitute toward a different movie in a givenweekend. The question (a) of whether a positive early review increases thedemand for a particular movie or simply moves up the date at which a fixednumber of consumers view it is addressed by regression (4) in Table V. (Wewill turn to the question (b) of whether positive reviews draw consumersaway from competingmovies in SectionVI.) The regression is similar to thatin column (1) except the dependent variable involves TOTREV, the totalrevenue over the movie’s entire run, rather than opening weekend box officerevenue OPENREV. Note that the coefficients on DURING � ONE UPand DURING � TWO UP still measure differences-in-differences. WithTOTREV as the left-hand side variable, these coefficients are capturing theeffect of earlier publication of a positive review on total revenue. On the onehand, if the influence effect expands total demand over the movie’s entirerun, publishing a positive review earlier will increase total revenue because itallows the influence effect to operate for a longer period of timeFthe firstfew weeks as well as subsequent weeks. The coefficients on DUR-ING � ONE UP and DURING � TWO UP should then be positive. Onthe other hand, if the influence effect merely shifts demand from later in themovie’s run to earlier, the coefficients on DURING � ONE UP andDURING � TWO UP should be zero. The results in column (4) of Table Vagain restrict attention to the subsample of dramas. The results areconsiderably noisier than those involving opening weekend box office, butare qualitatively similar. We find positive influence effects for one and twothumbs up, though the result is statistically significant only for one thumbup. This result implies that a positive early review does not simply shift agiven demand for amovie earlier in its run but increases themovie’s demandfor its entire run. The point estimate of the influence effect, from 70 to 85 percent, seems implausibly high as a percentage of a movie’s box office revenueover its entire run. The size of this estimate could be due to a number offactors. First, the results in column (4) are noisier than the previous results,so we have less confidence in the point estimates. Second, the influence onopening weekend box office may indirectly increase revenue later in a
44 DAVID A. REINSTEIN AND CHRISTOPHERM. SNYDER
r Blackwell Publishing Ltd. 2005.

movie’s run through word-of-mouth effects. Third, the residual selectioneffects detected in Section IV may account for some of its size.We conclude the section by comparing the results from our difference-in-
differences estimator to the traditional methodology that regresses boxoffice revenue on critics’ reviews directly without differencing. As noted inSection II, the traditional estimator, labelled b̂00, involves two opposingsources of bias, so it is impossible to tell a priori whether the resultingmeasure of the influence effect is positively or negatively biased. The resultsfrom applying the traditional methodology to our data set are presented inTable VI. Comparing column (1) of Table VI to column (1) of Table IV, wesee that, if one does not include quality proxies, the traditional methodologyoverestimates the influence effect: 22 per cent compared to 11 per cent forone thumbup, and 37per cent compared to 25per cent for two thumbsup. Inaddition, the levels of statistical significance are considerably overstated bythe traditional methodology. The influence effect of one thumb up isstatistically insignificant with our difference-in-differences estimator but issignificant at the one per cent level with the traditional methodology; theinfluence effect of two thumbs up is significant at only the ten per cent levelwith the difference-in-differences estimator but is significant at the one percent level with the traditional methodology. Column (2) of Table VI shows
TableVI
RegressionUsing theTraditionalMethodology
Subsample: All Movies DURING5 1
(1) (2) (3) (4)
ONE UP 0.22��� 0.15��� 0.25��� 0.18���
(0.05) (0.05) (0.05) (0.05)TWO UP 0.37��� 0.25��� 0.40��� 0.28���
(0.06) (0.06) (0.06) (0.07)MALTIN F 0.26��� F 0.27���
(0.04) (0.05)SCREENS 1.22��� 1.22��� 1.17��� 1.17���
(0.05) (0.05) (0.05) (0.05)FOURDAY 0.07 0.13�� 0.07�� 0.12
(0.06) (0.06) (0.08) (0.08)Constant 12.65��� 12.14��� 12.68��� 12.13���
(0.16) (0.17) (0.21) (0.23)Year dummies 3.85��� 3.68��� 2.72��� 2.74���
Month dummies 3.75��� 4.08��� 3.73��� 3.90���
Genre dummies 5.38��� 5.17��� 4.00��� 4.35���
Producer dummies 5.47��� 4.38��� 4.10��� 3.31���
R2 0.76 0.78 0.76 0.77Observations 609 609 492 492
Notes: Ordinary least squares regressions reflecting traditional methodology, which does not attempt to purge
spurious prediction effect. White [1980] heteroskedasticity-robust standard errors, adjusted to account for
possible correlation in the errors for movies opening in the same weekend, reported in parentheses below
coefficient estimates. Entries for sets of dummy variables are F statistics for test of joint significance.
Significantly different from zero in a two-tailed test at the �ten per cent level, ��five per cent level, ���one
per cent level.
EXPERT REVIEWS AND CONSUMERDEMAND FOR EXPERIENCE GOODS 45
r Blackwell Publishing Ltd. 2005.

that including quality proxies such asMALTIN reduces the bias associatedwith the traditional methodology considerably. The estimates of theinfluence effect are fairly close between column (2) of Table VI and column(1) of Table IV. While the point estimates are similar, the traditionalmethodology continues to overstate the significance levels associated withthe point estimates.In columns (3) and (4) of Table VI, we eliminate the downward bias in the
traditional methodology stemming from averaging the effect of moviesreviewed during opening weekend (and thus having the possibility of aninfluence effect) with those reviewed after (with no possibility of an influenceeffect). The regressions only include movies reviewed during openingweekend, yielding the estimator labelled b̂0 in Section II. Estimates of theinfluence effect increase are higher in columns (3) and (4) than in (1) and (2)as expected. The influence effects in the regression omitting quality proxies(column (3)) remain higher with the traditional methodology than with thedifference-in-differences estimator. Including quality proxies brings theestimates from the traditional methodology closer to the difference-in-differences estimates, but they are still higher. In all cases, the traditionalmethodology appears to overstate the statistical significance of the influenceeffect.In sum, Table VI shows that using the traditional methodology without
quality proxies results in a substantial overestimate of the influence effect.Including quality proxies makes the traditional methodology less proble-matic, but still can give incorrect inferences, for example leading one toconclude that one thumb up has a significant influence effect.
VI. EFFECT OF REVIEWS ON COMPETINGMOVIES
The results from column (4) of Table V are consistent with a model in whichquality-sensitive consumers have infrequent opportunities to see movies;they see high-quality movies when they have the opportunity, but do nothave the opportunity to see all high-quality movies. If this model is correct,we should see a business-stealing effect, namely a positive review for onemovie during a given weekend should have a negative influence on thatmovie’s competitors.This hypothesis is explored in the regressions in Table VII. Our data do
not have disaggregated information on these competing movies, but we dohave aggregate information on box office revenue for all movies eachweekend, and by subtraction can determine the sum of competitors’ boxoffice revenue. The dependent variable in the table is the natural log ofnational weekend box office for all movies but the ones in our data setopening on that weekend. Unlike the regressions from previous tables, theunit of observation in Table VII is a weekend rather than amovie. The right-hand side variables are the reviews and other characteristics of the movies in
46 DAVID A. REINSTEIN AND CHRISTOPHERM. SNYDER
r Blackwell Publishing Ltd. 2005.

our data set for the given weekend. Our data set often has several moviesopening on the same weekend; it was unclear how best to aggregate thesemovies’ characteristics to form right-hand side variables, so as shown wetried several specifications, including adding up the characteristics andtaking the mean.16
Note that the lack of disaggregated information on competing moviesprevents us from restricting attention to dramas as we did in Table VI.Withdisaggregated data, we could examine the effect of a positive review for adrama on competing dramas’ revenue. We do not know the genre ofcompeting movies, however; so in Table VII we examine the effect of apositive review for a movie in our complete sample (all genres) on allcompeting movies (all genres).One thumb up did not have a significant effect on a movie’s competitors.
Two thumbs up had a negative influence on competitors, statistically
TableVII
Competitors’WeekendBoxOfficeRevenueRegressions
f5Sum (1) f5Mean (2)
f (DURING) 0.01 � 0.03(0.03) (0.05)
f (DURING � ONE UP) 0.03 0.09(0.04) (0.07)
f (DURING � TWO UP) � 0.08� � 0.04(0.05) (0.08)
f (ONE UP) � 0.03 � 0.08(0.04) (0.06)
f (TWO UP) 0.07 0.09(0.05) (0.07)
f (MALTIN ) � 0.01 � 0.06(0.01) (0.04)
f (SCREENS) � 0.04��� � 0.04(0.01) (0.03)
FOURDAY 0.31��� 0.27���
(0.05) (0.06)Constant 17.36��� 17.55���
(0.06) (0.13)Year dummies 45.30��� 46.96���
Month dummies 33.61��� 27.02���
R2 0.67 0.54
Notes:Ordinary least squares regressionswith dependent variable ln(MKTREV–SOPENREV), i.e., the natural
log of weekend box office for all movies except those in our data set opening on that weekend. Unit of
observation is aweekend; regressions involve 346 observations. Variables indicatedby foperator are sums (resp.
means) of the indicated variable over all movies in our data set opening during the weekend for regression (1)
(resp. (2)). White [1980] heteroskedasticity-robust standard errors reported in parentheses below coefficient
estimates. Entries for sets of dummy variables are F statistics for test of joint significance. Significantly different
from zero in a two-tailed test at the �ten per cent level, ��five per cent level, ���one per cent level.
16We also restricted the sample to weekends in which only one movie in our data set wasopening, so that no aggregation in the right-hand side variables was needed. The results fromthis regression, not presented here, were similar to column (1) of Table VII.
EXPERT REVIEWS AND CONSUMERDEMAND FOR EXPERIENCE GOODS 47
r Blackwell Publishing Ltd. 2005.
significant at the ten per cent level in column (1) (where we sum movies’characteristics) but not significant in column (2) (where we average movies’characteristics).While it should be emphasized that there is considerable noise given the
aggregation in these regressions, both in the dependent and independentvariables, the results in Table VII provide suggestive evidence that positivereviews for movies steal business from competitors in a given weekend.Given that reviewed movies in our sample earned an opening weekend boxoffice of $6.6 million on average, while competitors’ weekend box was $48million on average, based on the results in Table VII we cannot reject thehypothesis that weekend box office revenue for all movies in the market isnot increased by a positive review for one.
VII. CONCLUSION
To summarize the central results, we find someweak evidence of an influenceeffect in our sample of all movies. The influence of one thumb up is 11 percent of opening weekend box office revenue, but is statistically insignificant.The influence of two thumbs up is large inmagnitude, at 25 per cent, but onlymarginally statistically significant. We find that the influence effect differsacross categories ofmovies, strongest formovieswith a narrower release andfor dramas, virtually nonexistent for movies with a wider release and foraction movies and comedies. We showed that an early positive reviewincreases the number of consumers attending a movie in total over its entirerun rather than simply shifting consumers from viewing the movie laterrather than earlier. This increased revenue appears to come at the expense ofcompeting movies. The results are consistent with a model in which someconsumers have an inelastic demand for attending movies in certainweekends, and use reviews as a quality signal to determine which among theavailable movies to see.Comparing our estimates, which rely on a difference-in-differences
approach to purge spurious prediction effects and thereby to estimate apure influence effect, to the traditional methodology, which directlyregresses box office revenue on critics’ reviews and thus does not purge theprediction effect, we saw that the traditional methodology can result inconsiderable positive bias. Including quality proxies reduces this bias, butdid not eliminate the problem. In all cases, the traditional methodologyappears to overstate the results’ statistical significance considerably.Our estimates of the influence effect are surprisingly large for dramas and
narrow release movies, but perhaps not implausibly large. It is consistentwith a survey reported in theWall Street Journal, which found that a third ofmoviegoers chose a film because of a favorable review, more than half ofthese because of a review on television (Simmons [1994]). It should also beemphasized that our reduced-form model does not limit the influence effect
48 DAVID A. REINSTEIN AND CHRISTOPHERM. SNYDER
r Blackwell Publishing Ltd. 2005.

to the direct influence of a critic on consumers but also includes indirecteffects. For example, after a positive review, amovie distributormay chooseto redouble its marketing efforts, highlighting the positive review in itsadvertisements. A positive review may influence one consumer to view themovie, who then influences others to view themovie throughwordofmouth.The sum of the direct and indirect influence effects, embodied in ourestimate, may plausibly be quite high.Another explanation of our large estimate of the influence effect is that
there are selection effects violating our maintained assumptions that thereviews’ timing is independent of quality signals. The evidence presented inSection IV suggests that selection biasesmay be present but are probably notlarge. The evidence is only suggestive since the tests in Table III cannot ruleout selection based on variables outside of our data set.Our results suggest that expert reviews can be an important mechanism
for transmitting information about goods of uncertain quality. Our resultsalso highlight the possibility that the power to influence consumer demandmay be concentrated in a few critics. Reviews can themselves be consideredgoods of uncertain quality, and it may be natural for critics who haveestablished high-quality reputations to exert the most influence. This raisesinteresting questions of how reputationsmaybebuilt,maintained, andFforvenal purposesFharvested.
REFERENCES
Ackerberg, D. A., 2003, ‘Advertising, Learning, and Consumer Choice in ExperienceGoodMarkets: A Structural Empirical Examination,’ International Economic Review,44, pp. 1,007–1,040.
Albert, S., 1998, ‘Movie Stars and the Distribution of Financially Successful Films in theMotion Picture Industry,’ Journal of Cultural Economics, 22, pp. 249–270.
Anast, P., 1967, ‘Differential Movie Appeals as Correlates of Attendance,’ JournalismQuarterly, 44, pp. 86–90.
Austin, B. A., 1984, ‘Portrait of an Art Film Audience,’ Journal of Communications, 34,pp. 74–87.
Austin, B. A. and Gordon, T. F., 1987, ‘Movie Genres: Toward a ConceptualizedModeland Standardized Definition,’ in Austin, B. A. (ed.), Current Research in Film:Audiences, Economics and the Law, vol. 3 (Ablex Publishing, Norwood, New Jersey).
Basuroy, S.; Chatterjee, S. and Ravid, S. A., 2003, ‘How Critical Are Critical Reviews?TheBoxOfficeEffects ofFilmCritics, Star-Power, andBudgets,’ Journal ofMarketing,67, pp. 103–117.
Caves, R. E. and Greene, D. P., 1996, ‘Brands’ Quality Levels, Prices, and AdvertisingOutlays: Empirical Evidence on Signals and Information Costs,’ International Journalof Industrial Organization, 14, pp. 29–52.
Chisholm, D. C., 2003, ‘The War of Attrition and Optimal Timing of Motion-PictureReleases’, Suffolk University working paper.
DeVany,A. andWalls,W.D., 1996, ‘Bose-EinsteinDynamics andAdaptiveContractingin the Motion Picture Industry,’ Economic Journal, 106, pp. 1,493–1,514.
De Vany, A. and Walls, W. D., 1997, ‘The Market for Motion Pictures: Rank, Revenueand Survival,’ Economic Inquiry, 35, pp. 783–797.
EXPERT REVIEWS AND CONSUMERDEMAND FOR EXPERIENCE GOODS 49
r Blackwell Publishing Ltd. 2005.

Dodds, J. C. and Holbrook, M. B., 1988, ‘What’s an Oscar Worth? An EmpiricalEstimation of the Effect of Nominations and Awards on Movie Distribution andRevenues,’ in Austin, B. A. (ed.), Current Research in Film: Audiences, Economics andthe Law, vol. 4 (Ablex Publishing, Norwood, New Jersey).
Eliashberg, J. and Shugan, S.M., 1997, ‘Film Critics: Influencers or Predictors?,’ Journalof Marketing, 61, pp. 68–78.
Faber, R. and O’Guinn, T., 1984, ‘Effect of Media Advertising and Other Sources onMovie Selection,’ Journalism Quarterly, 61, pp. 371–377.
Foreman, S.E. andShea,D.G., 1999, ‘Publication of Information andMarketResponse:The Case of Airline On-time Performance Reports,’Review of Industrial Organization,14, pp. 147–162.
Hey, J. D. and McKenna, C. J., 1981, ‘Consumer Search with Uncertain ProductQuality,’ Journal of Political Economy, 89, pp. 54–66.
Hollenbacher, A. and Yerger, D. B., 2001, ‘Third Party Evaluations and Resale Prices inthe U.S. Used Vehicle Market,’ Applied Economics Letters, 8, pp. 415–418.
Jin, G. Z., 2002, ‘DidQuality InformationMatter? Evidence fromMedicare, 1993–1998’,University of Maryland mimeo.
Jin, G. Z. and Leslie, P., 2003, ‘The Effects of Information on Product Quality: Evidencefrom Restaurant Hygiene Cards,’ Quarterly Journal of Economics, 118, pp. 409–451.
Krider, R. E. andWeinberg, C. B., 1998, ‘Competitive Dynamics and the Introduction ofNewProducts: TheMotion Picture TimingGame,’ Journal ofMarketing Research, 35,pp. 1–15.
Litman, B. R., 1983, ‘Predicting Success of Theatrical Movies: An Empirical Study,’Journal of Popular Culture, 16, pp. 159–175.
Litman, B. R. and Kohl, L. S., 1989, ‘Predicting Financial Success of Motion Pictures:The ‘80s Experience,’ Journal of Media Economics, 2, pp. 35–50.
Maltin, L., 1999, Movie and Video Guide: 2000 Edition (Signet, New York).Mathios, A. D., 2000, ‘The Impact of Mandatory Disclosure Laws on Product Choices:
An Analysis of the Salad Dressing Market,’ Journal of Law and Economics, 43, pp.651–677.
McFadden, D. L. and Train, K. E., 2000, ‘Consumers’ Evaluation of New Products:Learning from Self and Others,’ Journal of Political Economy, 104, pp. 683–703.
Michaely, R. and Womack, K. L., 1999, ‘Conflict of Interest and the Credibilityof Underwriter Analyst Recommendations,’ Review of Financial Studies, 12, pp.653–686.
Montgomery, C. A. andWernerfelt, B., 1992, ‘Risk Reduction andUmbrella Branding,’Journal of Business, 65, pp. 31–50.
Moul, C. C., 2004, ‘Handling Saturation in Demand: Estimates from Theatrical-RunMotion Pictures,’ Washington University working paper.
Neelamegham, R. and Chintagunta, P., 1999, ‘A Bayesian Model to Forecast NewProduct Performance in Domestic and InternationalMarkets,’Marketing Science, 18,pp. 115–136.
Nelson, P., 1970, ‘Information and Consumer Behavior,’ Journal of Political Economy,78, pp. 311–329.
Nelson, P., 1974, ‘Advertising As Information,’ Journal of Political Economy, 81, pp.729–754.
Prag, J. and Casavant, J., 1994, ‘An Empirical Study of the Determinants of Revenuesand Marketing Expenditures in the Motion Picture Industry,’ Journal of CulturalEconomics, 18, pp. 217–235.
Radas, S. and Shugan, S. M., 1998, ‘Seasonal Marketing and Timing Introductions,’Journal of Marketing Research, 35, pp. 296–315.
50 DAVID A. REINSTEIN AND CHRISTOPHERM. SNYDER
r Blackwell Publishing Ltd. 2005.

Ravid, S. A., 1999, ‘Information, Blockbusters, and Stars: A Study of the Film Industry,’Journal of Business, 72, pp. 463–492.
Ravid, S. A. and Wald, J. K., 2002, ‘Movie Critics as Analysts: A Story of IndustryCapture’, Rutgers Business School working paper.
Sawhney, M. S. and Eliashberg, J., 1996, ‘A Parsimonious Model for Forecasting GrossBox Office Revenues of Motion Pictures,’ Marketing Science, 15, pp. 113–131.
Simmons, J., 1994, ‘A ‘‘Thumbs Up’’ Pulls in the Audience,’Wall Street Journal, March25, p. B1.
Smith, S., 1998, The Film 100: A Ranking of the Most Influential People in the History ofthe Movies, (Citadel Press, New York).
Smith, S. P. and Smith, V. K., 1986, ‘Successful Movies: A Preliminary EmpiricalAnalysis,’ Applied Economics, 18, pp. 501–507.
Sochay, S., 1994, ‘Predicting the Performance of Motion Pictures,’ Journal of MediaEconomics, 7, pp. 1–20.
Spranca, M. E.; Kanouse, D. E.; Short, P. F.; Farley, D. O. and Hays, R. D., 2000, ‘DoConsumer Reports of Health Plan Quality Affect Health Plan Selection?,’ HealthServices Research, 35, pp. 933–947.
Teisl, M. F. and Roe, B., 1998, ‘The Economics of Labeling: An Overview of Issues forHealth and Environmental Disclosure,’ Agricultural and Resource Economics Review,27, pp. 140–150.
Wallace, W. T.; Seigerman, A. and Holbrook, M. B., 1993, ‘The Role of Actors andActresses in the Success of Films: How Much is a Star Worth?,’ Journal of CulturalEconomics, 17, pp. 1–27.
White, H., 1980, ‘A Heteroskedasticity-Consistent Covariance Matrix Estimator and aDirect Test for Heteroskedasticity,’ Econometrica, 48, pp. 817–830.
Wiggins, S. N. and Lane, W. J., 1983, ‘Quality Uncertanty, Search, and Advertising,’American Economic Review, 73, pp. 881–894.
Wolinsky, A., 1995, ‘Competition in Markets for Credence Goods,’ Journal ofInstitutional and Theoretical Economics, 151, pp. 117–131.
Wooldridge, J., 2002, Econometric Analysis of Cross Section and Panel Data (MIT Press,Cambridge, Mass.).
Wyatt, R. O. and Badger, D. P., 1984, ‘HowReviews Affect Interest in and Evaluation ofFilms,’ Journalism Quarterly, 61, pp. 874–878.
Wyatt, R.O. andBadger, D. P., 1987, ‘To Toast, Pan orWaffle: HowFilmReviwsAffectReader Interest andCredibility Perception,’Newspaper Research Journal, 8, pp. 19–30.
Zielbauer, P., 2002, ‘Metro Briefing Connecticut: Hartford: Falsified Movie Reviews,’New York Times, March 13, p. B8.
EXPERT REVIEWS AND CONSUMERDEMAND FOR EXPERIENCE GOODS 51
r Blackwell Publishing Ltd. 2005.