THE INFLUENCE OF E- MARKETING ON THE PERFORMANCE OF TOUR …
79
THE INFLUENCE OF E- MARKETING ON THE PERFORMANCE OF TOUR FIRMS IN KENYA BY HAYBE AYAN ABDI A RESEARCH PROJECT SUBMITTED IN PARTIAL FULFILMENT OF THE REQUIREMENTS FOR THE AWARD OF DEGREE OF MASTER OF SCIENCE IN MARKETING, SCHOOL OF BUSINESS, UNIVERSITY OF NAIROBI NOVEMBER 2015
Transcript of THE INFLUENCE OF E- MARKETING ON THE PERFORMANCE OF TOUR …

THE INFLUENCE OF E- MARKETING ON THE PERFORMANCE OF TOUR
FIRMS IN KENYA
BY
HAYBE AYAN ABDI
A RESEARCH PROJECT SUBMITTED IN PARTIAL FULFILMENT OF THE
REQUIREMENTS FOR THE AWARD OF DEGREE OF MASTER OF SCIENCE
IN MARKETING, SCHOOL OF BUSINESS, UNIVERSITY OF NAIROBI
NOVEMBER 2015

ii
DECLARATION
I declare that this research study for the award of degree of Master of Science in
marketing in the University of Nairobi has not been presented for a degree in any other
University or an examination body.
Signature______________________________ Date________________________
Haybe Ayan Abdi
D65/71389/2014
This project has been submitted with my approval as the university of Nairobi supervisor
Signature______________________________ Date_________________________
Prof J.M. Munyoki
Associate Professor,
Department of Business Administration
University of Nairobi

iii
DEDICATION
This research project is dedicated to my mother Munisa Ahmed Mohamed, and to my
fellow University of Nairobi students who may find it to be of help to them in their
studies.

iv
ACKNOWLEDGEMENT
First and foremost I thank the Almighty God, for granting me the strength, health and
courage to complete this arduous task.
A special thank you to my supervisor Prof Munyoki for his guidance, insight and
encouragement in the writing and compilation of this study. Your invaluable support and
patience throughout this journey has been unreal and is appreciated from the bottom of
my heart.
To my classmates and friends without whose interest and co-operation I could not have
produced this study. I wish to thank them for supporting this initiative and affording me
their time and sharing their experiences.
Finally I thank my family for instilling in me unquestionable values and morals, thank
you for your love, guidance and for always believing in me throughout the year.

v
ABSTRACT
Electronic marketing has become central to efficient operation of most industrialized
nations in the past few years. Individuals use the Internet for several reasons including
social interaction, obtaining information, and purchasing goods and services. Currently,
seventy-eight percent of Internet users utilize the Internet to get information on products
or services, and over fifty-four percent purchased products or services online. Given the
high competition with the tour firms in Kenya, they offer comprehensive range of
complementary services to support the adventurous holidaymakers that ensure they have
a safe, enjoyable, and memorable experience. This study sought to establish the influence
of e- marketing on the performance of the tour firms in Kenya. The study adopted a
descriptive cross sectional design. The target population of this study consisted of consist
of all the 116 firms operating in Nairobi. As sample size of 63 tour firms was taken using
systematic sampling technique. Primary data was collected using questionnaires with
both close-ended and open-ended questions. Respondents for this study were the
marketing managers in the various Tour firms or their equivalents. Descriptive statistics
were used to analyze the data collected from all the Respondents. The data collected was
analyzed and presented in the form of, tables using frequencies, percentages, mean scores
and standard deviation. The study found out that half of the tour firms in Nairobi have
adopted e-marketing by offering e-product and that the level of consumer satisfaction in
tour firms in Nairobi is good and thus e-product has been adopted in and few challenges
were faced in adopting e-product in the tour firms. In addition the study established that
e-product has great influence on profitability the organization. Moreover the study
established that majority of the organizations consider customer satisfaction with on-line
service delivery. The study also found out that E-marketing strategy has led to; increased
profitability, increased market share, and expansion into new markets. The study
concludes that tour firms conduct research before setting a fair price to consumers before
placing it on-line and that e-pricing has a moderate effect on sales and that timely
delivery of the product increases customer loyalty to a great extent. In addition, e-
promotion has great influence on profitability the tour firms as well as e-processing. The
study recommended that tour firms in Nairobi ought to review their e-marketing
strategies and bridge the existing gaps to gain a higher market share in the tourism
industry in Kenya. The study also recommended that tour firms in Nairobi could adopt a
hybrid of e-marketing activities in order to remain profitable and competitive. The study
also recommends that tour firms in Nairobi could adopt a hybrid of e-marketing activities
in order to remain profitable and competitive. Further, the management of tour firms in
Nairobi should offer continuous training to the firm employees on e-marketing to equip
them with skills that will help them in their mandates. This will assist the firms‟ human
resource to work more efficiently and increase their productivity thus increase the firms‟
competitiveness.

vi
TABLE OF CONTENTS
DECLARATION............................................................................................................... ii
DEDICATION.................................................................................................................. iii
ACKNOWLEDGEMENT ............................................................................................... iv
ABSTRACT ....................................................................................................................... v
LIST OF TABLES ........................................................................................................... ix
LIST OF FIGURES .......................................................................................................... x
CHAPTER ONE: INTRODUCTION ............................................................................. 1
1.1 Background of the Study .......................................................................................... 1
1.1.1 E-Marketing ....................................................................................................... 2
1.1.2 Organizational performance ............................................................................... 4
1.1.3 Tourism Industry in Kenya ................................................................................ 5
1.1.4 Tour firms in Kenya ........................................................................................... 6
1.2 Research Problem ..................................................................................................... 8
1.3 Research Objective ................................................................................................... 9
1.4 Value of the Study .................................................................................................... 9
CHAPTER TWO: LITERATURE REVIEW ............................................................. 11
2.1 Introduction ............................................................................................................. 11
2.2 Theoretical Foundations of the Study ..................................................................... 11
2.2.1 Hierarchy of Effects Model ............................................................................. 11
2.3 E-Marketing strategies ............................................................................................ 12
2.3.1 E-Product ......................................................................................................... 13
2.3.2 E-Pricing .......................................................................................................... 14
2.3.3 E-Place ............................................................................................................. 15
2.3.4 E-promotion ..................................................................................................... 16
2.3.5 E-Process.......................................................................................................... 17
2.3.6 E-people ........................................................................................................... 18
2.4 Organizational performance ................................................................................... 19

vii
2.5 Electronic Marketing Strategies and Organizational Performance ......................... 20
2.6 Summary of Literature Review ............................................................................... 22
CHAPTER THREE: RESEARCH METHODOLOGY ............................................. 23
3.1Introduction .............................................................................................................. 23
3.2 Research Design...................................................................................................... 23
3.3 Target Population .................................................................................................... 24
3.4 Sampling Design ..................................................................................................... 24
3.5 Data Collection ....................................................................................................... 24
3.6 Data Analysis .......................................................................................................... 25
3.6.1 Analytical Model ............................................................................................. 25
3.6.2 Test of Significance ......................................................................................... 26
CHAPTER FOUR: DATA ANALYSIS RESULTS AND INTERPRETATION ..... 27
4.1 Introduction ............................................................................................................. 27
4.2 Response Rate ......................................................................................................... 27
4.3 General Information ................................................................................................ 28
4.3.1 Gender of respondents ..................................................................................... 28
4.3.2 Age of respondents .......................................................................................... 29
4.3.3 Educational Background of respondents ......................................................... 30
4.3.4 Working Duration ............................................................................................ 30
4.4 E-Marketing strategies ............................................................................................ 31
4.4.1 E-product Service............................................................................................. 31
4.4.2 Consumer Satisfaction ..................................................................................... 32
4.4.3 Influence of E-product on Organization Profitability ...................................... 33
4.4.4 Stating of Products Price on E-marketing ........................................................ 34
4.4.5 Realization of Profitability Increase ................................................................ 34
4.4.6 Carrying out Research before setting On-line Price ........................................ 35
4.4.7 Extent that E- pricing Increases Sales Volume ................................................ 35
4.4.8 Extent that Timely Product Delivery Increases Customer Loyalty ................. 36
4.4.9 Influence of E-promotion on Organization Profitability ................................. 37
4.4.10 Effect of E-marketing on Service Delivery ................................................... 38

viii
4.4.11 Extent to which E-processing Influences Firm‟s performance ...................... 39
4.4.12 Consideration of Customer Satisfaction with On-line Service Delivery ....... 39
4.4.13 Means of Communicating with Consumers ................................................... 40
4.5 Organization Performance ...................................................................................... 41
4.5.1 Influence of E-marketing strategies on Organization Performance ................. 41
4.6 Inferential Statistics ................................................................................................ 43
4.6.1 Regression Analysis ......................................................................................... 43
4.6.2 Model Summary............................................................................................... 44
4.6.3 ANOVA Results .............................................................................................. 44
4.6.4 Coefficient of Correlation ................................................................................ 45
4.7 Summary and interpretation of findings ................................................................. 47
CHAPTER FIVE: SUMMARY, CONCLUSION AND RECOMMENDATIONS .. 50
5.1 Introduction ............................................................................................................. 50
5.2 Summary of findings............................................................................................... 50
5.3 Conclusions ............................................................................................................. 51
5.4 Recommendations of the Study .............................................................................. 52
5.5 Suggestions for further studies ................................................................................ 53
REFERENCES………………………………………………………………………..55
Appendices ....................................................................................................................... 59
Appendix I: Questionnaire ................................................................................................ 59
Appendix II: List of Tour Operators in Nairobi................................................................ 64

ix
LIST OF TABLES
Table 4.1: Age of respondents .......................................................................................... 29
Table 4.2: Consumer Satisfaction ..................................................................................... 32
Table 4.3: Realization of Profitability Increase ................................................................ 34
Table 4.4: Carrying out Research before setting On-line Price ........................................ 35
Table 4.5: Extent to which E-processing Influences Firm‟s performance........................ 39
Table 4.6: Consideration of Customer Satisfaction with On-line Service Delivery ......... 40
Table 4.7: Influence of E-marketing strategies on Organization Performance ................ 42
Table 4.8: Model Summary .............................................................................................. 44
Table 4.9: ANOVA Results .............................................................................................. 45
Table 4.10: Coefficient of Correlation .............................................................................. 46

x
LIST OF FIGURES
Figure 4.1: Gender of respondents .................................................................................... 28
Figure 4.2: Working Experience ....................................................................................... 31
Figure 4.3: E-product Service ........................................................................................... 32
Figure 4.4: Influence of E-product on Organization Profitability .................................... 33
Figure 4.5: Extent that E- pricing Increases Sales Volume .............................................. 36
Figure 4.6: Extent that Timely Product Delivery Increases Customer Loyalty ................ 37
Figure 4.7: Influence of E-promotion on Organization Profitability ................................ 38
Figure 4.9: Means of Communicating with Consumers ................................................... 40

1
CHAPTER ONE
INTRODUCTION
1.1 Background of the Study
The fast-paced growth in technology has allowed the development of the internet which
has been geared towards creation of convenience for its users. The use of Internet has
gained popularity in organizations globally; this has led to the creation of a new concept
in marketing as “e-marketing" under relationship marketing. This has a philosophy to
provide customers‟ needs as individual, creating value for customers and the
development of communications network between the companies and individuals
(Procter et al, 2013).
There are a number of indicators by which company performance may be judged. The
balanced scorecard offers both qualitative and quantitative measures that acknowledge
the expectations of different stakeholders and related an assessment of performance in
choice of strategy. In this way, performance is linked both to short term outputs and
process management (Johnson et al. 2006). An organization measurement system
strongly affects the behaviour of managers and employees. Traditional financial
accounting measures can give misleading signals for the continuous improvement and
innovation required by today‟s competitive environment demands (Kaplan and Norton,
1992).
This study will be guided by hierarchy of effects model which suggests that here are six
steps from viewing a product advertisement (advert) to product purchase. The job of the
advertiser is to encourage the customer to go through the six steps and purchase the
2
product. This model is known as a "hierarchy" because the number of consumers moving
from one stage to the next reduces, as you move through the model. There may be a lot of
consumers that see the product advert but not everyone will make a purchase. It takes a
lot of work to take a consumer from awareness to the final stage of purchase, so
businesses need to ensure that they try their utmost to get customers from conviction to
complete the final stage of purchase (Belch and Belch, 2003).
In spite of increased competition from other destinations, Kenya is still one of the
foremost tourist destinations in Africa. Tourism in Kenya is mainly based on natural
attractions, which include wildlife in its natural habitats as well as idyllic beaches.
Approximately 10% of the country has been set aside for conservation of wildlife and
biodiversity. Game viewing is a very popular pursuit. A Safari is such a popular product
that has enabled the country to continue recording remarkable growth in the volume of
visitors (KAWT, 2012).
The Kenya Association of Tour Operators (KATO) is a leading tourism trade association,
representing the interests of over 300 of the most experienced tour operators in Kenya. It
was founded in 1978 as a non-political member's organization with the following
objectives: to promote Kenya as a prime destination in all trade markets worldwide; to
ensure that a high standard of service is offered by the Kenya Travel Industry; to uphold
the business ethics of the travel profession (Kenya Association of Tour Operators, 2014)
1.1.1 E-Marketing
E marketing refers to the application of marketing principles and techniques via
electronic media and more specifically the Internet (Ball and Duval, 2001). As the

3
Internet‟s technologies have advanced, businesses have adopted it as a sales and
marketing medium. E-marketing is used by businesses to reduce transaction costs
associated with conducting business, such as providing information about products and
services. In addition, companies can use the worldwide web to offer a wider variety of
products to a larger audience at lower prices compared to products found in a physical
setting (Couclelis, 2004). E-marketing affects the traditional marketing, increasing
efficiency and effectiveness in traditional marketing functions and also transforming the
traditional marketing strategies. This transformation results in new business models that
add value and/or increase company profitability (Strauss et al, 2008).
Kotler and Pfoertsch (2007) describe E marketing as a company‟s efforts to inform
buyers, communicate, promote and sell its products and services over the Internet. If a
company does its e-mail campaign right, not only will it build customer relationships but
also reap additional profits. It includes both direct response marketing and indirect
marketing elements and uses a range of technologies to help connect businesses to their
customers. By such a definition, E-marketing encompasses all the activities a business
conducts via the worldwide web with the aim of attracting new business, retaining current
business and developing its brand identity. Ball and Duval (2001) stated that the Internet
and other technologies have been catalysts in propelling the world forward into new ways
of doing business and in the process empowering the customer.
Mckintyrye (2012) noted that the use of e-marketing by organizations has allowed
cheaper marketing of its products, a greater customer base and a more personal
interaction in the marketing. This has enabled a better research of the customer needs and
has allowed the provision for these needs easier at a reduced cost. The evolution of

4
internet marketing has led to better supply chain systems allowing the delivery of online
goods to the customer allowing convenience to the customer while guaranteeing a sale
for the firm. This system has allowed accountability to be more effective as compared to
the traditional selling.
Tiessen and Wright (2011) confirm that internet marketing has allowed firms the access
of new market niches as well increase opportunities beyond geographical boundaries
curbing international entry barriers. Early adopters of internet marketing have gained a
competitive advantage and established customer loyalty programs that have enabled them
retain and gain new clients (Sparkes and Thomas, 2011)
1.1.2 Organizational performance
Organizational performance comprises the actual output or results of an organization as
measured against its intended outputs. It involves the ability of an organization to fulfill
its mission through sound management, strong governance and a persistent rededication
to achieving results. Effective nonprofits are mission-driven, adaptable, customer-
focused, entrepreneurial, outcomes oriented and sustainable. Creating flexible, high-
performing, learning organizations is the secret to gaining competitive advantage in a
world that won‟t stand still (Pickton & Broderick, 2001).
Organizational performance encompasses accumulated results of all the organization‟s
work processes and activities. Performance measures can be financial or non-financial.
Both measures are used for competitive firms in the dynamic business environment.
Financial measures of organizational performance include; return on assets, return on
sales, return on equity, return on investment, return on capital employed and sales

5
growth. Non-financial organizational performance measures include; web-performance
track variations in traffic page views, advertising impressions served and unique users.
The foundation of long-term performance is lifetime customer value; the revenue
customers generate over their lives, less the cost of acquiring, converting, and retaining
them. Web marketing strategy using the 4w's will result in an increase in efficiency
within established marketing functions (Goldsmith & Lafferty, 2002). The technology of
e-marketing transforms many marketing strategies resulting in new business models that
add customer value or increase company profitability. Focusing on web performance
many e-commerce companies collect data related to cost and usage of their websites, few
of them understand, in detail, how well such information measures their sites‟
performance or how this performance compares with that of competing sites (Adam,
Mulye, Deans & Palihawadana, 2002).
1.1.3 Tourism Industry in Kenya
Tourism sector currently accounts for about 10% of Kenya‟s Gross Domestic Product
(GDP), making it the third largest contributor to the GDP after agriculture and
manufacturing. It is also Kenya‟s leading foreign exchange earner generating about Ksh.
65.4 billion in 2007 up from 21.7 in 2002. The tourism sector is also a major source of
employment. During the period between 2003 and 2007, the sector‟s contribution to
employment generation grew at rate of 3 per cent annually, while earnings per employee
rose by 18 per cent (GoK, 2012).
Tourism products in Kenya have been broken down into seven, namely: Beach; Wildlife;
Cultural; Sports; Scenic; Adventure; and Specialized tourism, which includes educational

6
tourism, slum tourism, etc. Tourism‟s social, economic and environmental impacts are
immense and complex, not least because tourism concentrates on vulnerable natural and
cultural sites (GoK, 2012).
Kenya is ranked the fifth leading international tourist destination in Africa, receiving
1.575 million international tourist arrivals in 2008 (KNBS 2010). Wildlife-based tourism
currently accounts for about 70% of tourism earnings, 25% of gross domestic product and
more than 10% of total formal sector employment in the country (KNBS 2010).
Conservation policies, related collaborative schemes, and tourism programmes play a
crucial role in developing intervention measures to protect these nationally and
internationally significant resources (Bulte et al. 2008). A widespread protected area
system is in place with over 10% of its land area currently gazetted as national parks,
national reserves or forest reserves: the system to date is comprised of 23 national parks,
28 national reserves, 4 marine national parks, 5 marine national reserves and 4 national
sanctuaries Kenya Wildlife Service (KWS) 2010). These critical biodiversity areas are
the backbone of a flourishing tourism sector; one out of two international visitors to
Kenya is anticipated to have at least one wildlife appreciative/viewing opportunity during
their stay (Odunga and Maingi, 2011).
1.1.4 Tour Firms in Kenya
The Kenya Association of Tour Operators (KATO) is a leading tourism trade association,
representing the interests of over 300 of the most experienced tour operators in Kenya. It
was founded in 1978 as a non-political member's organization with the following
objectives: to promote Kenya as a prime destination in all trade markets worldwide; to

7
ensure that a high standard of service is offered by the Kenya Travel Industry; to uphold
the business ethics of the travel profession (Kenya Association of Tour Operators, 2014)
The Kenya Association of Tour Operators (KATO) is Kenya's foremost tourism trade
association, representing the interests of over 250 of the leading and most experienced
professional tour operators in Kenya. The members offer a wide range of services that
can be broadly divided into the following: Air safaris, Incentive travel group safaris,
Custom safaris for individual travelers, Camping safaris (luxury & budget), Indian Ocean
& Coast holidays, Cultural & Community Safaris, Golf Safaris, Agro Safaris, Special
interest safaris (e.g. mountaineering, deep sea fishing, horse riding)
(http://www.katokenya.org/). Tour operators in Kenya are supposed to ensure that Kenya
is a sustainable tourist destination.
All members of the Kenya Association of Tour Operators are bound by the rigid rules of
their own code of conduct. Intending safari visitors to Kenya are advised to arrange their
holidays through one of our members whose addresses and telephone numbers are
contained in the directory. This code of conduct is designed to ensure that all members of
the Kenya Association of Tour Operators trade honestly which is the only ethical method
of trading. The code covers trading in its widest sense between members of KATO, and
overseas agents and principals and between members of KATO and their clients.
Members of the association are required to signify their agreement to observe strictly the
Ethics and Standards incorporated in the code of conduct and to abide by judgments
reached by the ethics and standards sub-committee and the executive committee in any
case in which the conditions of the code of conduct are considered to have been breached.

8
1.2 Research Problem
According to Holmes (2012), electronic marketing has become central to efficient
operation of most industrialized nations in the past few years. He further asserts that the
tourism industry cannot function efficiently without appropriate implementation of
electronic marketing, due to the changing internal and external threats and opportunities
facing the tourism industry. Computer technologies have drastically changed society and
business in recent years (Baer and Brown, 2007). Individuals use the Internet for several
reasons including social interaction, obtaining information, and purchasing goods and
services. Currently, seventy-eight percent of Internet users utilize the Internet to get
information on products or services, and over fifty-four percent purchased products or
services online (Day et al, 2005). As the Internet‟s technologies have advanced,
businesses have also adopted it as a sales and marketing medium. One of the benefits that
accrue to businesses that adopt e-marketing is reduction of transaction costs associated
with conducting business, such as providing information about products and services. In
addition, other companies use worldwide web to offer a wider variety of products to a
larger audience at lower prices compared to products found in a physical setting
(Couclelis, 2004).
Given the high competition with the tour firms in Kenya, they offer comprehensive range
of complementary services to support the adventurous holidaymakers that ensure they
have a safe, enjoyable, and memorable experience. These services will include: where to
get accommodation, both personal and effects to carry; pre- and post-holiday briefing
packs including video of Kenya culture and game animals; a directory of advice and
information services covering destination site and adventure activity (Sindiga, 1996).

9
A study carried out by Kiprotich (2012) on the relationship of e-commerce practices and
performance of microfinance institutions in Kenya, found that e-commerce is the most
effective and efficient marketing strategy of modern firms regardless its challenges of
adoption in the organization. Also a study by Ondati (2011) on the influence of
technology on the performance of manufacturing in Kenya found that technology is the
only strategy companies can use to enter global markets and outsmart their competitors.
Nyaanga (2007) studied ecommerce adoption and business process management in
commercial banks in Kenya. Wataku (2007) studied on the extent to which the adoption
of ecommerce has facilitated business clearing and forwarding firms in Nairobi. Kiyeng
(2003) made a survey of the impact and challenges of business ecommerce in Kenya, and
focused on e-sokoni. It is also not known of any other research that has been carried out
on e-marketing and the performance of the tour firms in Kenya. Hence there exists a gap
that the proposed research sought to bridge which was guided by the following research
question: How does e-marketing influence the performance of the tour firms in Kenya?
1.3 Research Objective
The study sought to establish the influence of e- marketing on the performance of the tour
firms in Kenya.
1.4 Value of the Study
The study findings are expected to be of great importance to various academic scholars
and researchers. The documented report of this study will be readily available in the
library and it will equip the learners with more knowledge and skills on effects of e-
marketing. The study will thus be useful as a basis for future empirical and conceptual

10
research, which would be helpful in refining and validating findings especially when a
significant number of experiences is collected and studied.
The study will further be useful to the tour firms especially to decision makers involved
in implementation of electronic services delivery strategies for their tour firms. Necessary
improvements identified could be undertaken to enhance e-marketing usage in Kenya.
The findings of the study will provide policy makers with the challenges that
organizations encounter in the process of adopting e-marketing hence enabling favorable
conditions to comply with; and this will encourage growth and economical development.
Additionally, the government, particularly ministries of trade, health and also science and
technology will be provided with reliable information that will enhance the strategies to
adopt in order to effectively improve the welfare of the public.

11
CHAPTER TWO
LITERATURE REVIEW
2.1 Introduction
This chapter covers the theoretical framework and the empirical related literature. The
conceptual framework and studies on green marketing approaches and marketing
strategies have been covered.
2.2 Theoretical Foundations of the Study
The research study was guided by hierarchy of effects model
2.2.1 Hierarchy of Effects Model
The Hierarchy of Effects Model was created in 1961 by Lavidge and Gary. This
marketing communication model, suggests that there are six steps from viewing a product
advertisement (advert) to product purchase. The job of the advertiser is to encourage the
customer to go through the six steps and purchase the product which include; awareness,
knowledge, liking, preference and purchase. Customers see many adverts each day but
will only remember the brand of a tiny fraction of products. Knowledge of the customer
begins when the product is advertised using various communication channels which
include; the internet, retail advisors and product packaging. In today's digital world this
step has become more important as consumers expect to gather product knowledge at the
click of a button. Consumers will quickly move to competitor brands if they do not get
the information they want. The advertiser's job is to ensure product information is easily
available (Belch and Belch, 2003).

12
Liking of the product involves customer willingness to buy a product after information
search in the market concerning the product on offer. Preference involves consumers
being loyal to a particular brand compared to competitor brands. At this stage advertisers
will want the consumer to disconnect from rival products and focus on their particular
product. Advertisers will want to highlight their brand's benefits and unique selling points
so that the consumer can differentiate it from competitor brands. Conviction to a product
is a stage of creating the customer's desire to purchase the product in the market.
Advertisers may encourage conviction by allowing consumers to test or sample the
product (Buzzell, 2004). Purchase involves is the final stage that consumers experience in
the buying process. The advertiser may want the customer to purchase their product by
emphasizing on the benefits of the product to the consumer (Belch and Belch, 2003). This
stage needs to be simple and easy, otherwise the customer will get fed up and walk away
without a purchase. For example a variety of payment options encourages purchase
whilst a complicated and slow website discourages purchases. Companies should identify
new ways of increasing purchase habits among consumers. Modern technologies like
online purchase and mobile phone technologies should drive competitive companies thus
minimizing costs of operation (Alexander and Schouten, 2002).
2.3 E-Marketing strategies
E-marketing is traditional marketing using information technology but with increased
efficiency in established marketing functions (Strauss et al, 2008). E-marketing is a
company‟s efforts to inform buyers, communicate, promote and sell its products and
services over the Internet (Kotler and Keller 2000). E-marketing reaches far beyond the
web. Many e-marketing technologies exist including software and hardware used in

13
customer relationship management and supply chain management. The use of the Internet
by businesses and consumers has grown very rapidly. Virtually all firms in the USA now
have some type of Internet presence, which means that in order to do business with them,
their customers and suppliers must also have access to the Internet (Stanton and Stone,
1994). The Internet provides individuals with convenient and continuous access to
information and if information is power individuals and organizations have more power
than ever before. For instance they compare product features and prices using online
search engines, and read product reviews from other consumers at websites (Strauss et al,
2008).
Traditionally the marketing mix is coordinated so that efficient product, price, promotion
and place strategies are developed for products purchased over the counter.
The internet is changing the way organizations sell products and services. Consumers
now use the Internet to research and purchase products and services online.
Organizations now need online strategies to attract and retain such customers. The e-
marketing mix considers the elements of presenting the marketing mix online. E-
marketing encompasses: e-product, e-price, e-place and e-promotion, e-processes, e-
people and e-physical evidence.
2.3.1 E-Product
To capitalize on e-marketing opportunities, marketers must make five general product
decisions that comprise its bundle of benefits to meet customer needs: attribute, branding,
support services, labeling and packaging (Strauss et al, 2008). Stanton et al (1994) state
that a product is a set of attributes assembled in an identifiable form; each product is

14
identified by a commonly understood descriptive (or generic) name. However, consumers
are not really buying a set of attributes, but rather the benefits that satisfy their needs.
Seemingly minor product changes can be the key to success (or failure) in international
markets. Since consumers want satisfaction in the form of the benefits they expect to
receive from the products or services, to design effective marketing programs,
organizations need to know what kinds of products and services they are offering
consumers. The idea of „product‟ as potential customer satisfaction or benefits is very
important. Burke (2004) argues that the basic point about any product is that it is a bundle
of attributes. These attributes have to be brought out with the result that greater emphasis
is given to creating subjective differences between competitive products through service
and promotional efforts.
Smith (2003) explains that the product has always remained the key component of
marketing mix. Demand can be influenced by making the firm‟s e-product appropriate,
attractive and easily available to target consumers. Kabiru (2004) argues that based on
perception rather than reality, value is a trade-off between price that is the customer‟s
investment and benefits that is what the customer gets. Customers will only buy a product
if they determine that it‟s perceived value exceed the price they have to pay for it.
2.3.2 E-Pricing
Price is the amount of money and/or other items with utility needed to acquire a product
or service. As an allocator of resources, price determines what will be produced and who
will get the goods and services provided (Stanton, et al, 1994). Price affects a firm‟s
competitive position and its market share hence has a considerable bearing on a
company‟s revenues and net profits. Kabiru (2004) argues that price is a perception of

15
value, which is never constant. The challenge therefore is to always position the e-
product with the value going up i.e. firms can either lower price, or increase benefits
more than increasing price. Strauss et al posit that the Internet puts upward pressure on
prices due to added expensive software such as online customer service, where customers
expect firms to return e-mail promptly, provide thorough help on frequently asked
questions functions online, and give telephone and other contact information.
Traditionally, pricing was about finding and including costs, discovering how much
consumers are willing to pay, taking into account competition pricing then setting price.
The Internet has made pricing very competitive. Many costs i.e. store costs, staff cost
have disappeared for complete online stores, placing price pressures on traditional
retailers. The Internet gives consumers the power to shop around for the best deal at a
click of a button. Websites such as www.kelkoo.com compare products from different
websites informing consumers of where the best deal is. Such easy access to information
helps to maintain prices within the online world. E-pricing can also easily reward loyal
customers. Technology allows repeat visitors to be tracked, easily allowing loyalty
incentives to be targeted towards them. Payment is also easy. Currently, in e-banking,
payments made over the Internet are almost exclusively conducted through existing
payment instruments and networks (Ongubo, 2003). PayPal, Pesapal, M-pesa or online
credit cards use allows for easy payments. However, the downside to this is Internet
fraud, which is growing rapidly around the world.
2.3.3 E-Place
Distributors‟ role within a marketing mix is getting the product to its target market
(Stanton et al, 1994). The most important activity in getting a product to market is

16
arranging for its sale from producer to final customer. Other common activities are
promoting the product, storing it and assuming some of the financial risk during the
distribution process. A distributing channel consists of the interdependent set of people
and firms involved in the transfer of title to a product as the product moves from the
producer to the ultimate consumer or business user. A channel of distribution always
includes both the producer and the final customer of the product in its present form as
well as any middlemen such as retailers and wholesalers. The channel for a product
extends only to the last person or organization that buys it without making any significant
change in its form. Stanton et al (1994), observe that a company wants a distribution
channel that not only meets customers‟ needs but also provides an edge on competition.
Strauss et al (1994) state that the Internet has changed the way electronic data
interchange is used to establish structural relationships between suppliers and buyers,
online intermediaries including wholesalers, retailers, brokers and agents.
2.3.4 E-promotion
The Internet enhances promotional coordination among intermediaries. Promoting
products and services online is concerned with a number of issues. Firms e-mail ads and
other materials to each other, and all firms may view current promotions on a website at
any time. Having a recognizable domain name is the first stage towards e-promotion.
Organizations such as newegg.com have successfully positioned the brand in the online
world as an online bank. It is through promotional activities that a firm communicates
directly with potential customers. Stanton et al (1994), observes that promotion is the
element in an organization‟s marketing mix that serves to inform, persuade and remind
the market of a product and the organization selling it, in the hope of influencing the

17
recipients‟ feelings, beliefs or behavior. The five forms of promotion include personal
selling, advertising, sales promotion, public relations and publicity.
Kotler (1997) explains that companies can run the same advertising and promotion
campaigns used in the home market or change them for each local market i.e.
communication adaptation. Ronoh (2002) argues that modern marketing calls for more
than developing a good product, pricing it attractively and making it accessible. He
observes that companies must also communicate with present and potential stakeholder
and the general public. Ferrell and Pride (1996) observe that promotion mixes are
methods of communicating with target markets about the values contained in an offering.
Promotion is used for a variety of purposes and its symbolization aspects make direct
contribution to increasing the value of an offering.
2.3.5 E-Process
Process is another element of the 7Ps of services marketing mix. Process is referred to the
procedures, mechanisms and flow of activities by which the service is delivered i.e. the
service delivery and operating systems. According to Normann, (2001) services are
performances or actions done for or with the customers, they typically involve a sequence
of steps and activities. The combination of these steps constitutes a service process which
is evaluated by the customers. Furthermore, in a service situation customers are likely to
have to queue before they can be served and the service delivery itself is likely to take a
certain length of waiting time. It helps if marketers ensure that customers understand the
process of acquiring a service and the acceptable delivery times. Creating and managing
effective service processes are essential tasks for service firms.

18
2.3.6 E-people
People are the most important element of any service or experience. Services tend to be
produced and consumed at the same moment, and aspects of the customer experience are
altered to meet the individual needs of the person consuming it. In Booms and Bitner‟s
7Ps services marketing framework, people are all directly or indirectly involved in the
service encounter, namely the firm's contact employees, personnel and other customers.
Due to the inseparability of production and consumption for services, which involves the
simultaneous production, and consumption of services, service firms depend heavily on
the ability of contact employees to deliver the service. Contact employees contribute to
service quality by creating a favorable image for the firm, and by providing better service
than the competitions (Korkman, 2006). Service providers are involved in real time
production of the service. They are the “service”. Much of what makes a service special
derives from the fact that it is a lived-through event.
Service firms must find ways in which they can effectively manage the contact
employees to ensure that their attitudes and behaviors are conducive to the delivery of
service quality. This is especially important in services because employees tend to be
variable in their performance, which can lead to variable quality i.e. heterogeneity in the
performance of services. The quality of a service can vary from service providers and
customers among many other factors (Normann, 2001). This lack of homogeneity in
services creates difficulties for the service firms. As delivery of services occurs during
interaction between contact employees and customers, attitudes and behaviors of the
service providers can significantly affect customers' perceptions of the service. This is

19
important, because customers' perceptions of service quality and its value can influence
customer satisfaction, and in turn, purchase intentions.
2.4 Organizational performance
A key concern of this study is related with the conceptualization and measurement of
performance. Overall the literature suggests that it is required a multidimensional scale.
One approach that is increasingly relied upon is the aggregation of various performance
measures into a single measure of performance (Fillis, Johannson & Wagner, 2004). Firm
performance is measured through sales volume, profitability and market share for the
current period and perceived satisfaction with these measures when considering the
previous year performance (Flavián & Guinalíu, 2006).
E-Performance involves identification of current market position in the web is an
essential issue. Although many e-commerce companies collect cost and usage data about
their Web sites, few of them understand in any detail how well such information
measures their sites´ performance or how success in attracting, converting and retaining
customers compares with that of competing sites. However, since year 2000 investors
have been insisting, if not on profits, at least on objective measures of a site‟s success in
attracting, converting and retaining customers (Fillis, Johannson & Wagner, 2004).
Most measures of e-performance track variations in traffic-page views, advertising
impressions served, unique users, and so on. But the foundation of long-term
performance is lifetime customer value: the revenue customers generate over their lives,
less the cost of acquiring, converting, and retaining them. A recent McKinsey study
(Kemmler et al., 2001) shows that while the performance of Internet retailers is

20
improving, most media and content sites are going down. Thus, e-retailer sites are
creating significantly more value than content sites.
2.5 Electronic Marketing Strategies and Organizational Performance
Electronic marketing strategies are the world‟s least expensive and most efficient
marketing tool and help companies of all sizes to perform well. It helps them to
disseminate sales and marketing messages, create one-to-one relationships, educate
prospects, and support existing customers on a worldwide scale”. Application of
electronic marketing strategies, companies can have many benefits based on those
features that the environment of Internet provides; following are the typical benefits for
doing e-marketing to both companies and customers (Darby, Jones & Madani, 2003).
It is said that doing e-marketing is less expensive than doing traditional marketing.
Because the new companies who want to do business over the Internet don‟t need to
spend money to open new stores for selling products. In addition, both new and existing
companies can reduce some costs for their firms such as the cost of printing the
brochures, leaflets, or catalogue for introducing new products to the market (Darby, Jones
& Madani, 2003). Moreover, most of services and communication are done over the
Internet, so companies can decrease the number of staff in some departments, as the
result they can lower the overhead costs. If companies can sell products directly to
customers, they don‟t need the middle men and can save money for that. Some
companies can also cut the cost of warehouse and inventory, because they just need to
make an order from the suppliers when there are customers who order the products from
their websites (Jutla, Bodorik & Dhaliwal, 2002). The age of information technology
enables people to access the websites if they have Internet connection, no matter where

21
they live in the world. This feature becomes an advantage for companies who do business
online and do e-marketing as such (Jutla, Bodorik & Dhaliwal, 2002). Through that the
audience can know the information about companies, their products, making the purchase
or creating the contact with one another, and so on. Companies can launch a marketing
campaign over the Internet, people from everywhere can see it if they access to the
website (Jutla, Bodorik & Dhaliwal, 2002).
E-marketing has the advantage that it has auto responders, email, and frequently asked
question (FAQ). It helps to save time for both customers who look for the answers in
some common questions and time of the staff of companies. Companies‟ staff instead can
use the time intended for answering the same questions for doing other things, so they
can work more efficiently (Jutla, Bodorik & Dhaliwal, 2002). Companies have an
unlimited space on the Internet to store information about their companies as well as the
products and other necessary information, such as reports, video, and advertising banner,
news, financial information and so on. The monthly money to host a website is cheap and
companies can store as much information as they want (Jutla, Bodorik & Dhaliwal,
2002).
Marketing on the Internet can create more interactivity between companies and
customers. People can give feedback about products and services by posting comment on
the sites. They can ask questions and get the answers quickly or immediately from
companies‟ staffs or from other visitors. Through a website people can focus on the
specific information they want to see, rather than the general information from the
television which advertises about companies and products. Companies can also conduct
surveys on their websites to know more about their customers as well as the prospects

22
(Jutla, Bodorik & Dhaliwal, 2002). Updating information in traditional marketing can be
costly. However, in e-marketing information can be updated frequently as much as
companies want without any cost.
2.6 Summary of Literature Review
The revolution in computer science, the Internet, information technology (IT), media and
communications has changed the ways of conducting business today. In the last two
decades, growing numbers of companies and enterprises have been using the Internet and
other electronic communications to conduct marketing efforts and activities, giving the
chance for E-marketing. It is one aspect of organizational function and a set of processes
for creating, communicating and delivering value to customers and for managing
customer relationships in ways that benefit the organization and its stakeholders.
Technological changes, continuous reduction in hardware, improvement in data storage
capabilities and advances in software have made computing more accessible, easier to
use and more exciting. Organizations have started to look towards technology to drive
down costs, improve performance and revolutionize traditional systems of production.
Global competition, pressures of customization and restructured market places led to
companies turning to Internet to help them differentiate, be more flexible and create
niches (April and Cradock, 2000).

23
CHAPTER THREE
RESEARCH METHODOLOGY
3.1Introduction
This chapter outlines the research design, target population, sample size and sampling
method, data collection. It further discusses how the data was processed and tools that
was used in data analysis and presentation.
3.2 Research Design
The research design to be adopted is descriptive cross sectional survey design. According
to Cooper and Schindler (2000), a descriptive research design is concerned with finding
out the; who, what, where, when and how much. Furthermore, a research design is
structured, has investigative questions and part of formal studies. The design is
appropriate because the main interest is to explore the viable relationship and describe
how the factors support matters under investigation.
A cross sectional study looks at data collected across a whole population to provide a
snapshot of that population at a single point in time. This kind of study was used as it
enabled the researcher to have an insight of the influence of e- marketing on the
performance of the Tour Firms in Kenya. Descriptive design method provides
quantitative data from cross section of the chosen population. This design provided
further insight into research problem by describing the variables of interest.

24
3.3 Target Population
The population of the study consisted of all the tour firms operating in Nairobi.
According to the Kenya Association of Tour Operators (2014) there are 116 tour firms
operating in Nairobi. The selection of the tour operators was necessitated by the fact that
all the organizations have their headquarters in Nairobi and thus it was easy to collect
adequate data by the researcher.
3.4 Sampling Design
The study adopted systematic sampling. It is a method of selecting sample members from
a larger population according to a random starting point and a fixed, periodic interval.
Typically, every "nth" member is selected from the total population for inclusion in the
sample population. The advantage of systematic sample is that it is really fast and easy to
convenient when already a list of the units in the population is there. The researcher
obtained the list of the population and then took a sample in which every 4th event was
picked for the research and this resulted in 63 tour firms being selected for the study.
3.5 Data Collection
Primary Data was utilized in this study. It was collected by use of a questionnaire which
will be semi structured. The semi structured questions were intended to capture data on
the extent to which certain methods of marketing are considered effective. The
questionnaires were administered through drop and pick later technique. The respondents
for this study were the marketing managers in the various Tour firms or their equivalents.

25
Secondary data was collected from the marketing materials obtained from the firms and
from their websites.
3.6 Data Analysis
The study generated both qualitative data through open-ended questions and quantitative
data through close-ended questions. Quantitative data was coded and entered into
Statistical Packages for Social Scientists and be analyzed using descriptive statistics.
Qualitative data was analyzed based on the content matter of the responses. Responses
with common themes or patterns will be grouped together into coherent categories.
Descriptive statistics involved the use of absolute and relative (percentages) frequencies,
measures of central tendency and dispersion (mean and standard deviation respectively).
Quantitative data was presented in tables and graphs while the explanation to the same
will be presented in prose. Multiple linear regression analysis was used to examine the
magnitude of influence of the independent variable on the respective dependent variables.
3.6.1 Analytical Model
The regression function that included the dependent variable and independent variables
was written as;
Y= β₀+β₁X₁ +β₂X₂ +β₃X₃ +β₄X₄ +β5X5+ β6X6+ ε
Where; Y= performance as dependent variable
β0 - Constant/Y intercept
X₁= E-product

26
X₂ =E-pricing
X₃=E-place
X₄= E-promotion
X5 – E-process
X6 – E-people
ε=Error term
The independent variables X1, X2, X3, X4, X5, X6 represented the E-Marketing strategies
used for this study.
3.6.2 Test of Significance
F-test was used to test the joint significance of all coefficients and t-test for the test
significance of individual coefficients. The significance of the regression model was
determined at 95% confidence interval and 5% level of significance.

27
CHAPTER FOUR
DATA ANALYSIS, RESULTS AND INTERPRETATION
4.1 Introduction
This chapter presents analysis of the data on the influence of e- marketing on the
performance of the tour firms in Kenya. This chapter presents the findings of the study
and discussion of the findings. The findings are intended to answering the study‟s
research question. Data collected was collated and reports produced in form of tables and
figures and qualitative analysis.
4.2 Response Rate
The study targeted 63 respondents from 63 tour firms operating in Nairobi. However, 50
respondents completely filled and returned the questionnaires contributing to 79.4%. This
complied with Mugenda and Mugenda (2003) who suggested that for generalization a
response rate of 50% is adequate for analysis and reporting, 60% is good and a response
rate of 70% and over is excellent.
This response rate can be attributed to the data collection procedure, where the researcher
engaged research assistants to administer questionnaires and wait for respondents to fill
in. The research assistants kept reminding the respondents to fill in the questionnaires
through frequent phone call and picked the questionnaires once fully filled. The 20.6%
questionnaires that were not returned were due to reasons such as, the respondents not
being available to fill them in at that time and with persistent follow-ups there was no

28
positive response from them. The response rate demonstrates a willingness of the
respondents‟ to participate in the survey that the study sought.
4.3 General Information
The study found it crucial to ascertain broad information regarding the respondents. The
analysis relied on this information of the respondents so as to classify the different results
according to their knowledge and responses.
4.3.1 Gender of respondents
The study sought to ascertain the information on the respondents involved in the study
with regards to the gender. Results findings are as shown in Figure 4.1
Figure 4.1: Gender of respondents
The study established that majority (61%) of the respondents were female while 39%
were male. This implies that majority of staffs at tour firms operating in Nairobi are
females

29
4.3.2 Age of respondents
The study sought to ascertain the information on the respondents involved in the study
with regards to their age. Results findings are as shown in Table 4.1
Table 4.1: Age of respondents
Frequency Percent
Below 18 1 2
18-25 4 8
26-35 8 16
36-45 21 42
46-55 10 20
55 and above 6 12
Total 50 100
From the findings shown in Table 4.1 most (42%) of the respondents‟ were within the
age bracket of 36-45 years, 20% were aged between 46-55 years, 16% were between 26-
35 years, 12% were within 55 and above years, 8% aged between 18-25 years while (2%)
were aged below 18 years. This implies that most of the respondents were energetic and
therefore could give reliable information.

30
4.3.3 Educational Background of respondents
Information on respondents „education background was cross-figured to facilitate in
analysis of respondents level of education as indicated in Figure 4.2
Figure 4.2: Educational Background
The findings revealed that majority (47%) of the respondents had Bachelor Degree, 18%
had Master Degree, 16% had Diploma, 12% had Secondary School, while 7% had PH.D.
This indicates that majority of staffs at tour firms operating in Nairobi were well trained
thus higher chances of giving reliable information.
4.3.4 Working Experience
The study sought to ascertain the information on the respondents involved in the study
with regards to the period they have served in their current station. Results findings are as
shown in Figure 4.3

31
Figure 4.3: Working Experience
The findings revealed that majority (43%) of the respondents had worked in current
station for 6-10 years, 37% indicated above 10 years, while 20% indicated 0-5 years.
4.4 E-Marketing strategies
E-marketing is a company‟s efforts to inform buyers, communicate, promote and sell its
products and services over the Internet. Many e-marketing technologies exist including
software and hardware used in customer relationship management and supply chain
management. The study sought to examine how various e-marketing strategies influence
performance.
4.4.1 E-product Service
The study asked the respondents to indicate whether their respective organization offer e-
products in the businesses.

32
Figure 4.4: E-product Service
From the findings, 54.2% pointed out that they offer e-product while 11 (45.8%) were not
offering e- product. This is an indication that more than half of the tour firms in Nairobi
have adopted e-marketing by offering e-product.
4.4.2 Consumer Satisfaction
The study further sought to find out the level of satisfaction of the customers with e-
products. Finding of the study are as depicted in Table 4.2.
Table 4.2: Consumer Satisfaction
Consumer Satisfaction Frequency Percent
Poor 2 4
Fair 12 24
Average 10 20
Good 15 30
Excellent 10 20
Total 50 100

33
From the findings, most of the respondents, fifteen (30%) described it as good, twelve
(24%) as fair, ten (20%) as average and ten (20%) as excellent while two (4%) as poor.
From these findings, the level of consumer satisfaction in tour firms in Nairobi is good
and thus e-product has been adopted in and few challenges were faced in adopting e-
product in the tour firms.
4.4.3 Influence of E-product on Organization Profitability
Figure 4.5 shows the study finding on the Influence of e-product on profitability the
organization.
Figure 4.5: Influence of E-product on Organization Profitability
The study also sought to find out the Influence of e-product on profitability the
organization. From the findings, most of the respondents, (25%) rated it as having
influence to a great extent and to a moderate extent, with f (20.8%) rating to a low extent,
(16.7%) to a very low extent while (12.5%) rated to a very great extent. This indicates
that e-product has great influence on profitability the organization
34
4.4.4 Stating of Products Price on E-marketing
The study asked the respondents to indicate whether they stated the price of the products
when practicing e-marketing. From the findings it shows there is equal proportions
twenty five (50%) who state the price of the products when e-marketing.
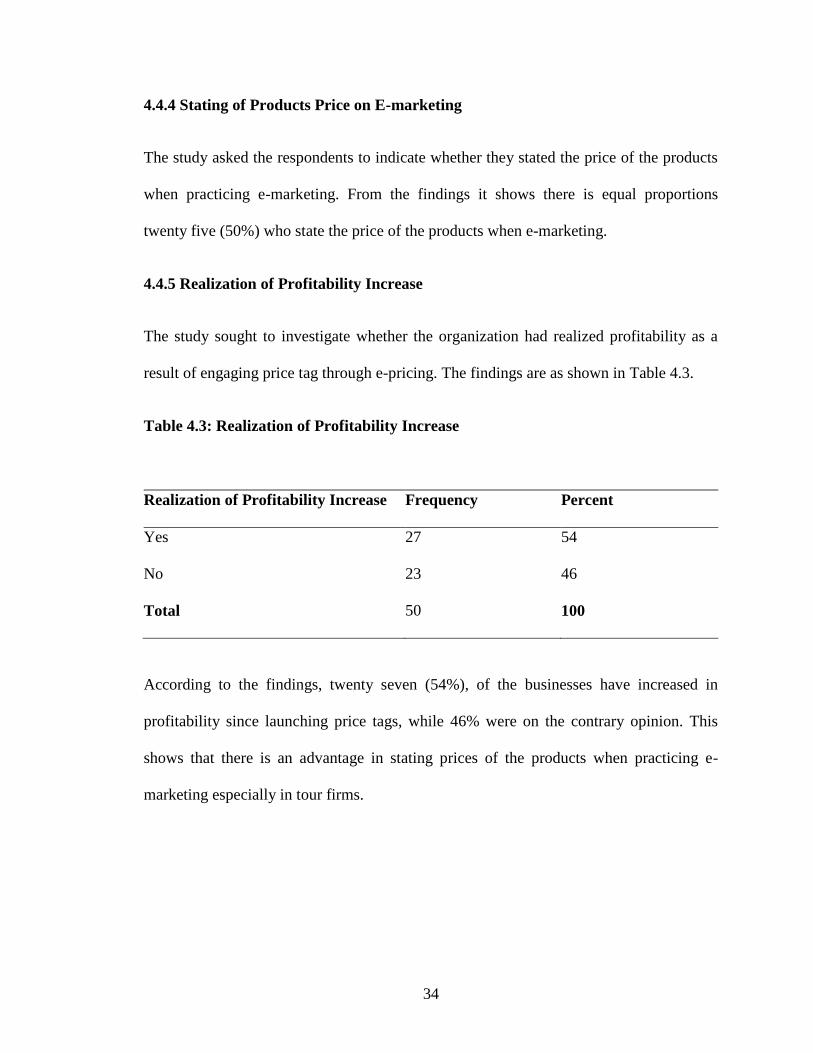
4.4.5 Realization of Profitability Increase
The study sought to investigate whether the organization had realized profitability as a
result of engaging price tag through e-pricing. The findings are as shown in Table 4.3.
Table 4.3: Realization of Profitability Increase
Realization of Profitability Increase Frequency Percent
Yes 27 54
No 23 46
Total 50 100
According to the findings, twenty seven (54%), of the businesses have increased in
profitability since launching price tags, while 46% were on the contrary opinion. This
shows that there is an advantage in stating prices of the products when practicing e-
marketing especially in tour firms.

35
4.4.6 Carrying out Research before setting On-line Price
Table 4.4 shows the study findings on whether sampled organization conduct research
before setting online price.
Table 4.4: Carrying out Research before setting On-line Price
From the study, majority (58%) of the organizations conduct research before setting a fair
price to consumers before placing it on-line. Since they consider fair prices to consumers,
profitability has increased since launching of on-line prices.
4.4.7 Extent that E- pricing Increases Sales Volume
Figure 4.6 shows the extent to which e- pricing increases sales volume is sought in the
study.
Carrying out Research before setting On-line Price Frequency Percent
Yes 29 58
No 21 42
Total 50 100

36
Figure 4.6: Extent that E- pricing Increases Sales Volume
According to the findings, most of the respondents, (41.7%) indicated that e-pricing
increases sales volume to a great extent while (25%) felt that e-pricing increases sales to
a low extent. Those who felt that e-pricing has a moderate effect on sales are (20.8%),
followed by (8.3%) to a very low extent while (4.2%) felt that e-pricing increases sales to
a very great extent. This indicates that e-pricing has a moderate effect on sales.
4.4.8 Extent that Timely Product Delivery Increases Customer Loyalty
The researcher further investigated the extent to which timely delivery of the products to
customers increased customer loyalty. Finding of the study are as shown in Figure 4.7.
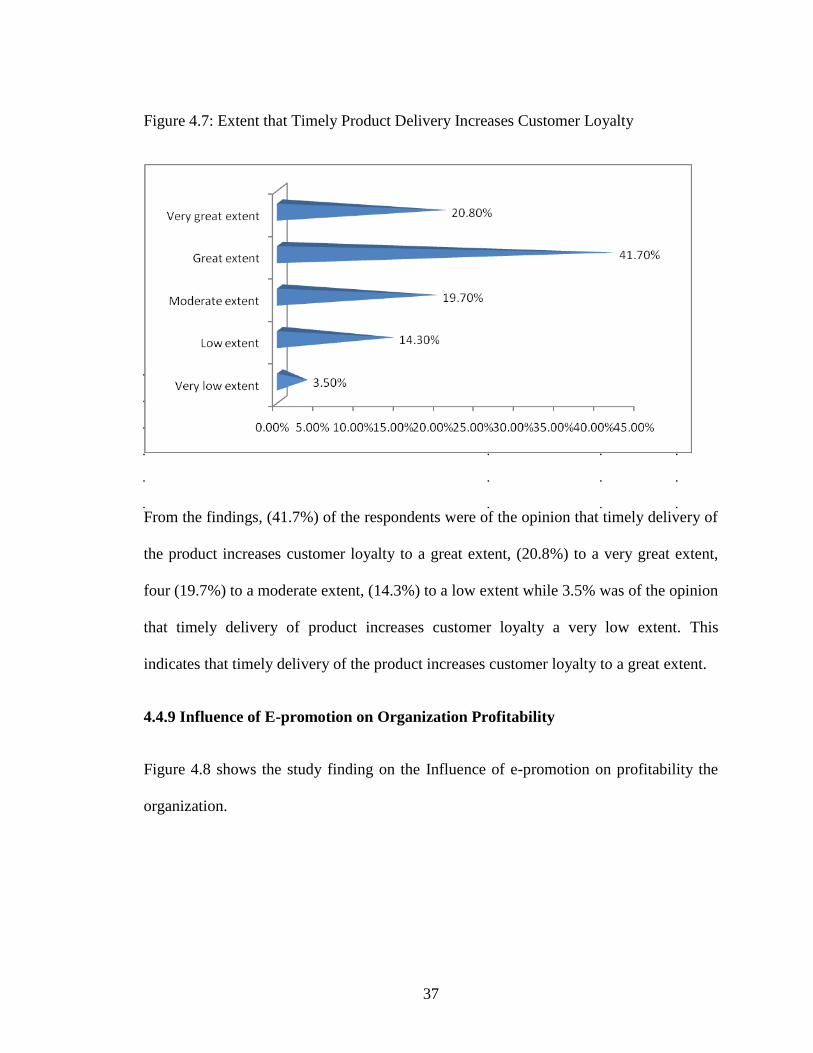
37
Figure 4.7: Extent that Timely Product Delivery Increases Customer Loyalty
From the findings, (41.7%) of the respondents were of the opinion that timely delivery of
the product increases customer loyalty to a great extent, (20.8%) to a very great extent,
four (19.7%) to a moderate extent, (14.3%) to a low extent while 3.5% was of the opinion
that timely delivery of product increases customer loyalty a very low extent. This
indicates that timely delivery of the product increases customer loyalty to a great extent.
4.4.9 Influence of E-promotion on Organization Profitability
Figure 4.8 shows the study finding on the Influence of e-promotion on profitability the
organization.

38
Figure 4.8: Influence of E-promotion on Organization Profitability
The study also sought to find out the Influence of e-promotion on profitability the
organization. From the findings, most of the respondents, (39%) rated it as having
influence to a great extent and (26%) to a moderate extent, with (19%) rating to a very
great extent, (10%) to a low extent while (12.5%) rated to a very low extent. This
indicates that e-promotion has great influence on profitability the organization
4.4.10 Effect of E-marketing on Service Delivery
The study sought to find out whether adoption of E-marketing eases service delivery and
operating systems within the organizations. Majority of the respondents, 63% agreed that
adoption of E-marketing did ease service delivery and operating systems within the
organization while 37% disagreed. This indicates that organizations have adopted E-
marketing to ease service delivery.

39
4.4.11 Extent to which E-processing Influences Firm’s performance
The study sought to find out the extent to which e-processing influences the firm‟s
performance
Table 4.5: Extent to which E-processing Influences Firm‟s performance
Frequency Percent
Very low extent 4 8
Low extent 4 8
Moderate extent 8 16
Great extent 28 56
Very great extent 6 12
Total 50 100
Majority of the respondents (twenty eight) indicated that e- processing influences firm‟s
performance to a great extent while eight felt it influences adoption of performance to a
moderate extent. This indicates that e-processing has a great influence on the firm‟s
performance.
4.4.12 Consideration of Customer Satisfaction with On-line Service Delivery
The study also sought to find out on how the firms consider customer satisfaction with
on-line service delivery. Findings are as shown in Table 4.6.

40
Table 4.6: Consideration of Customer Satisfaction with On-line Service Delivery
Consideration of Customer Satisfaction with On-line Frequency Percent
Yes 14 58
No 10 42
Total 24 100
From the findings, 58% of the respondents agreed that firms consider customer
satisfaction with on-line service delivery while 42% disagreed. This indicates that
majority of the organizations consider customer satisfaction with on-line service delivery.
4.4.13 Means of Communicating with Consumers
The study also sought to find out on how organizations reach their consumers. The
response of the study findings are as depicted in Figure 4.9.
Figure 4.9: Means of Communicating with Consumers

41
From the findings in Figure 4.9 83% of the organization use telephone, 54.2% uses SMS,
41.7% uses Emails, and 20.8% uses online banners on new websites while 12.5% use
online banners on other sites. This shows that telephone is the most used medium of
communication by the organizations to reach customers.
4.5 Organization Performance
Organizational performance comprises the actual output or results of an organization as
measured against its intended outputs. It involves the ability of an organization to fulfill
its mission through sound management, strong governance and a persistent rededication
to achieving results.
4.5.1 Influence of E-marketing strategies on Organization Performance
The study sought to determine the extent to which E-marketing strategies influence the
Organization Performance. The respondents were asked to indicate the extent to which
they agreed with statements in relation to this. The responses were placed on the five
Likert scale where 1= No Extent, 2= Little Extent, 3= Moderate Extent, 4= Great Extent
and 5 is Very Great Extent. The results are as presented in Table 4.7.

42
Table 4.7: Influence of E-marketing strategies on Organization Performance
Mean Standard deviation
Increased market share 4.12 0.7643
Increased profitability 4.31 0.2643
Reduced costs of production 3.71 0.9836
Increased customer satisfaction 3.81 0.2937
Introduction of new products 3.93 0.4621
Improved employee performance 3.47 0.7421
Expansion into new markets 4.01 0.2364
ICT integration in customer service delivery 3.76 0.3412
Increased return on investments 3.87 0.2641
Increased Job Satisfaction 3.36 0.4213
From the findings in Table 4.8, respondents indicated to a very great extent that E-
marketing strategies has led to; increased profitability (mean= 4.3124), increased market
share (mean= 4.1231), and expansion into new markets (mean= 4.0123). In addition
respondents indicated to a great extent that E-marketing strategies has led to; Introduction
of new products (mean= 3.9361), Increased return on investments (mean= 3.8778),
increased customer satisfaction (mean= 3.8142), ICT integration in customer service
delivery (mean= 3.7621), Reduced costs of production (mean= 3.7124), Improved
employee performance (mean= 3.4712), and Increased Job Satisfaction (mean= 3.3641).
This implies that E-marketing strategies has led to; increased profitability, increased
market share, and expansion into new markets

43
4.6 Inferential Statistics
The study further applied general Linear Model to determine the predictive power of the
influence of e-marketing on the performance of the tour firms in Kenya. This included
regression analysis, the Model, Analysis of Variance and coefficient of determination.
4.6.1 Regression Analysis
In addition, the researcher conducted a multiple regression analysis so as to test
relationship among variables (independent) on the influence of e-marketing on the
performance of the tour firms in Kenya. The researcher applied the statistical package for
social sciences (SPSS V 21.0) to code, enter and compute the measurements of the
multiple regressions for the study.
Coefficient of determination explains the extent to which changes in the dependent
variable can be explained by the change in the independent variables or the percentage of
variation in the dependent variable (performance of the tour firms) that is explained by all
the three independent variables: (E-product, E-pricing, E-place, E-promotion, E-process,
and E-people).

44
4.6.2 Model Summary
Model summary‟ table, provides information about the regression line‟s ability to account
for the total variation in the dependent variable
Table 4.8: Model Summary
Model R R Square Adjusted R Square Std. Error of the Estimate
1 0.89314 a 0.7976 0.77 0.759411
a. Predictors: E-product, E-pricing, E-place, E-promotion, E-process, E-people
Source: Author (2015)
The six independent variables that were studied, explain only 79.76% on the influence of
e-marketing on the performance of the tour firms in Kenya as represented by the R2. This
therefore means that other factors not studied in this research contribute 20.24% of the
performance of the tour firms in Kenya. Therefore, further research should be conducted
to investigate the other factors (19.3%) that affect performance of the tour firms in
Kenya.
4.6.3 ANOVA Results
Analysis of variance (ANOVA) is a collection of statistical models used to analyze the
differences among group means and their associated procedures (such as "variation"
among and between groups)

45
Table 4.9: ANOVA Results
Model
Sum of Squares Df Mean Square F Sig.
1 Regression 46.7412 6 7.7902 7.69 0.00
Residual 92.876 44 2.110818
Total 139.6172 50
Source: Author (2015)
The significance value is 0.00 which is less than 0.05 thus the model is statistically
significant in predicting how E-product, E-pricing, E-place, E-promotion, E-process, and
E-people affect performance of the tour firms in Kenya. The F critical at 5% level of
significance was 2.25. Since F calculated is greater than the F critical (value = 3.69), this
shows that the overall model was significant.
4.6.4 Coefficient of Correlation
Multiple regression analysis was conducted as to determine the relationship between the
performance of the tour firms and the six variables.

46
Table 4.10: Coefficient of Correlation
Model Unstandardized Coefficients Standardized Coefficients
B Std. Error Beta t Sig.
1 (Constant) 3.77 0.451 8.359202 1.24E-10
E-product 0.782 0.121 0.146 6.46281 7.04E-08
E-pricing 0.463 0.079 0.126 5.860759 5.40E-07
E-place 0.473 0.073 0.045 6.479452 6.65E-08
E-promotion 0.532 0.073 0.142 7.287671 4.34E-09
E-process 0.343 0.073 0.045 4.69863 2.59E-05
E-people 0.246 0.073 0.142 3.369863 1.57E-03
As per the SPSS generated table above, regression equation
Y = β0 + β1x1 + β2x2 + β3x3+ β4x4+β5x5+ β6x6+ ε
Where Y is the performance of the tour firms
B0 is a constant
β1 to β4 are the coefficient of the independent variables
x1 to x4 are the independent variables where
ε is the error term.

47
(Y = β0 + β1X1 + β2X2 + β3X3 + β4X4 + β5X5+ β6X6 + ε) becomes:
(Y= 3.77+ 0.146X1+ 0.126X2+ 0.045X3+ 0.142X4+ 0.045X5 +0.142 X6 + ε)
According to the regression equation established, taking all factors into account (E-
product, E-pricing, E-place, E-promotion, E-process, and E-people) constant at zero,
performance of the tour firms will be 3.77. The data findings analyzed also shows that
taking all other independent variables at zero, a unit increase in E-product will lead to a
0.146 increase in performance of the tour firms; a unit increase in E-pricing will lead to a
0.126 increase in performance of the tour firms, a unit increase in E-place will lead to a
0.045 increase in performance of the tour firms, a unit increase in E-promotion will lead
to a 0.142 increase in performance of the tour firms, a unit increase in E-process will lead
to a 0.045 increase in performance of the tour firms, while a unit increase in E-people
will lead to a 0.142 increase in performance of the tour firms.
This infers that E-product contribute most to the performance of the tour firms followed
by E-promotion. At 5% level of significance and 95% level of confidence, E-product, E-
pricing, E-place, E-promotion, E-process, and E-people were all significant in
performance of the tour firms.
4.7 Interpretation of Findings
The data findings analyzed also shows that taking all other independent variables at zero,
a unit increase in E-product will lead to a 0.146 increase in performance of the tour firms.
Similar to the findings; Burke (2004) argues that the basic point about any product is that
it is a bundle of attributes. These attributes have to be brought out with the result that

48
greater emphasis is given to creating subjective differences between competitive products
through service and promotional efforts. Smith (2003) explains that the product has
always remained the key component of marketing mix. Demand can be influenced by
making the firm‟s e-product appropriate, attractive and easily available to target
consumers. Kabiru (2004) argues that based on perception rather than reality, value is a
trade-off between price that is the customer‟s investment and benefits that is what the
customer gets. Customers will only buy a product if they determine that it‟s perceived
value exceed the price they have to pay for it.
Also the findings indicated that a unit increase in E-pricing will lead to a 0.126 increase
in performance of the tour firms. In line with these findings, Kabiru (2004) argues that
price affects a firm‟s competitive position and its market share hence has a considerable
bearing on a company‟s revenues and net profits. He further argues that price is a
perception of value, which is never constant. The challenge therefore is to always
position the e-product with the value going up i.e. firms can either lower price, or
increase benefits more than increasing price
It was established that a unit increase in E-place will lead to a 0.045 increase in
performance of the tour firms. In collaboration with these findings, Stanton et al (1994),
observe that a company wants a distribution channel that not only meets customers‟
needs but also provides an edge on competition. Strauss et al (1994) state that the Internet
has changed the way electronic data interchange is used to establish structural
relationships between suppliers and buyers, online intermediaries including wholesalers,
retailers, brokers and agents.

49
The study also revealed that a unit increase in E-promotion will lead to a 0.142 increase
in performance of the tour firms. Similarly, Ronoh (2002) argues that modern marketing
calls for more than developing a good product, pricing it attractively and making it
accessible. He observes that companies must also communicate with present and
potential stakeholder and the general public. Ferrell and Pride (1996) observe that
promotion mixes are methods of communicating with target markets about the values
contained in an offering. Promotion is used for a variety of purposes and its
symbolization aspects make direct contribution to increasing the value of an offering.
In addition, the study indicated that a unit increase in E-process will lead to a 0.045
increase in performance of the tour firms. Similarly, According to Normann, (2001)
services are performances or actions done for or with the customers, they typically
involve a sequence of steps and activities. The combination of these steps constitutes a
service process which is evaluated by the customers. Furthermore, in a service situation
customers are likely to have to queue before they can be served and the service delivery
itself is likely to take a certain length of waiting time. It helps if marketers ensure that
customers understand the process of acquiring a service and the acceptable delivery
times. Creating and managing effective service processes are essential tasks for service
firms.

50
CHAPTER FIVE
SUMMARY, CONCLUSION AND RECOMMENDATION
5.1 Introduction
This chapter presents the summary of the data findings on the influence of e- marketing
on the performance of the tour firms in Kenya, the conclusions and recommendations
drawn there to. The chapter is therefore structured into summary of findings, conclusions,
recommendations and suggestions for further research.
5.2 Summary of findings
From the study, it was summarized that more than half of the tour firms in Nairobi have
adopted e-marketing by offering e-product and that the level of consumer satisfaction in
tour firms in Nairobi is good and thus e-product has been adopted in and few challenges
were faced in adopting e-product in the tour firms.
In addition the study established that e-product has great influence on profitability the
organization and that there is equal proportions who state the price of the products when
e-marketing. This shows that there is an advantage in stating prices of the products when
practicing e- marketing especially in tour firms.
From the study, it was summarized that organizations conduct research before setting a
fair price to consumers before placing it on-line. Also, the study established that e-pricing
has a moderate effect on sales and that timely delivery of the product increases customer
loyalty to a great extent. It was also deduced that that e-promotion has great influence on
profitability the organization as well as e-processing.

51
Moreover the study established that majority of the organizations consider customer
satisfaction with on-line service delivery and that firms considered customer satisfaction
with on-line service delivery. The study also found out that organizations communicated
with their consumers through telephone, SMS, emails, and online banners; with the
telephone being the most used communication medium by the organizations to reach
customers.
The study found out that E-marketing strategy has led to; increased profitability,
increased market share, and expansion into new markets. The data findings analyzed also
shows that taking all other independent variables at zero, a unit increase in E-product will
lead to a 0.146 increase in performance of the tour firms; a unit increase in E-pricing will
lead to a 0.126 increase in performance of the tour firms, a unit increase in E-place will
lead to a 0.045 increase in performance of the tour firms, a unit increase in E-promotion
will lead to a 0.142 increase in performance of the tour firms, a unit increase in E-process
will lead to a 0.045 increase in performance of the tour firms, while a unit increase in E-
people will lead to a 0.142 increase in performance of the tour firms.
5.3 Conclusion
Based on the findings, the study concludes that that more than half of the tour firms in
Nairobi have adopted e-marketing by offering e-product and that the level of consumer
satisfaction in tour firms in Nairobi is good and thus e-product has been adopted in and
few challenges were faced in adopting e-product in the tour firms. In addition the study
concludes that e-product has great influence on profitability the tour firms and that there

52
is an advantage in stating prices of the products when practicing e- marketing especially
in tour firms.
Also the study concludes that tour firms conduct research before setting a fair price to
consumers before placing it on-line and that e-pricing has a moderate effect on sales and
that timely delivery of the product increases customer loyalty to a great extent. The study
also concludes that e-promotion has great influence on profitability the tour firms as well
as e-processing.
Moreover the study concludes that tour firms consider customer satisfaction with on-line
service delivery and that firms considered customer satisfaction with on-line service
delivery. The study also concludes that tour firms communicated with their consumers
through telephone, SMS, emails, and online banners; with the telephone being the most
used communication medium by the organizations to reach customers. The study also
concludes that E-marketing strategies have led to; increased profitability, increased
market share, and expansion into new markets.
5.4 Recommendations of the Study
This study found that more than half of the tour firms in Nairobi have adopted e-
marketing by offering e-product and that the level of consumer satisfaction. However,
there are some challenges faced in adopting the strategies. The study recommends that
tour firms in Nairobi ought to review their e-marketing strategies and bridge the existing
gaps to gain a higher market share in the tourism industry in Kenya.
The study also recommends that tour firms in Nairobi could adopt a hybrid of e-
marketing activities in order to remain profitable and competitive.

53
The study also recommends that the management of tour firms in Nairobi should offer
continuous training to the firm employees on e-marketing to equip them with skills that
will help them in their mandates. This will assist the firms‟ human resource to work more
efficiently and increase their productivity thus increase the firms‟ competitiveness.
5.5 Suggestions for further studies
The study suggests that further research be done on the factors hindering adoption of e-
marketing within tour firms in order to give both negative and positive results that can be
reliable. The study also suggested further research done on effects of adoption of e-
marketing in tour firms on the financial performance in order to depict reliable
information that illustrates the real situation in the tour firms in Kenya.

54
REFERENCES
Adam, S., Mulye, R., Deans, K. & Palihawadana, D. (2002). E-marketing in perspective:
A three country comparison of business use of the Internet. Marketing
Intelligence & Planning, 20 (4): 243 - 251.
Alexander, J.H., Schouten, J.W., Koenig, H.F. (2002). "Building Brand Community",
Journal of Marketing, Vol. 66 No.January, pp.38-54
Baer, A.G. & Brown C., (2007). Adoption of E-Marketing by Direct-Market Farms in the
Northeastern United States
Ball, T., and Y. Duval. (2001). Internet Direct Marketing Success of Farm Businesses in
the U.S.: A Web-based Survey. USDA, Agricultural Marketing Service.
Belch, G., and Belch, M.A. (2003). Measuring the Effectiveness of Promotional
Programs, Advertising and Promotion – An Integrated Marketing Communication
Perspective, Tata McGraw Hill, New Delhi, 6th Edition.
Burke, G. I., & Jarrat, D. G. (2004). The Influence of Information and Advice on
Competitive Strategy Definition in Small and Medium Enterprises. Qualitative
Market Research: An International Journal, 7(2), 126-138.
Buzzell, R.D, (2004). The PIMS Program of Strategy Research: A Retrospective
Appraisal, Journal of Business Research, 57 (May), 478-83.
Chaffey, D. and Smith, P. R (2013) E-marketing excellence; the heart of e-business.

55
Chaston, I. & Mangles, T. (2003). Relationship marketing in online business-to-business
markets: A pilot investigation of small UK manufacturing firms. European
Journal of Marketing, 37 (5/6): 753 – 773
Couclelis, H. (2004). Pizza over the Internet: E-commerce, the Fragmentation of Activity
and the Tyranny of the Region. Entrepreneurship & Regional Development
1(16):41-54.
Darby, R., Jones, J. & AL Madani, G. (2003). E-commerce marketing: fad or fiction?
Management competency in mastering emerging technology. An international
case analysis in the UAE. Logistics Information Management, 16 (2): 106 - 113.
Day, J.C., Janus, A, and Davis, J. (2005). Computer and Internet Use in the United
States: 2003. U.S. Census Bureau and U.S. Department of Commerce, Economics
and Statistics Administration.
Fillis, I., Johannson, U. & Wagner, B. (2004). Factors impacting on e-business adoption
and development in the smaller firm. International Journal of Entrepreneurial
Behaviour 10 (3): 178 – 191
Flavián, C. & Guinalíu, M. (2006). Consumer trust, perceived security and privacy
policy: Three basic elements of loyalty to a web site. Industrial Management &
amp, 106 (5): 601 – 620
Goldsmith, R. & Lafferty, B. (2002). Consumer response to Web sites and their influence
on advertising effectiveness. Internet Research, 12 (4): 318 – 328

56
Goodhue, D. L., and Thompson, R. L. (2001)"Task-Technology Fit and Individual
Performance," MIS Quarterly (19:2), 1995, pp. 213-236.
Holmes, G. (2012), Cultures and Organizations: Software of the Mind, McGraw-Hill,
New York, NY.
Jutla, D., Bodorik, P. & Dhaliwal, J. (2002). Supporting the e-business readiness of small
and medium-sized enterprises: approaches and metrics. Internet Research, 12 (2):
139 – 164
Jutla, D., Bodorik, P. & Dhaliwal, J. (2002). Supporting the e-business readiness of small
and medium-sized enterprises: approaches and metrics. Internet Research, 12 (2):
139 – 164
Kotler, P. & Pfoertsch, W. (2007). Being known or being one of many: the need for
brand management for business-to-business (B2B) companies Journal of Business
& Industrial Marketing 22, 357 - 362.
Manjau S.(2009) “Accessing your account from abroad and Internet banking.” Kenya
Club Annual Banks survey for Kenyans abroad.
Naikuni, J.K.(2001). Promotional mix elements within the multinational pharmaceutical
companies in Kenya. Unpublished MBA report, Nairobi.
Ongubo, J. N. (2003). Determinants of brand loyalty for prescription brand medicine by
doctors in Nairobi. Unpublished MBA report, University of Nairobi.

57
Pickton, D., & Broderick, A. (2001). Integrated Marketing Communications. Financial
Times Prentice Hall. http://books.google.com (13.01.2010).
Pickton, D., & Broderick, A. (2001). Integrated Marketing Communications. Financial
Times Prentice Hall. http://books.google.com (13.01.2010).
Rogers, Everett M. (1962). Diffusion of Innovations. The Free Press. New York.
Sindiga, I. (1996) Domestic Tourism in Kenya. Annals of Tourism Research Vol. (23) pg
19 – 31
Smith, K. T. (2003). The Marketing Mix of Integrated Marketing Communication: A
Move from the 4P's to the 4C's. Retrieved from
www.scs.unr.edu/~khalilah/eMarketing.pdf
Sparkes, A. and Thomas, B. (2001) the use of the Internet as a critical success factor for
the marketing of Welsh-Agri food SMEs in the twenty first century, British Food
Journal
Stanton, W. J; Etzel, M.J; Walker, B. J. (1994). Fundamentals of marketing. McGraw-
Hill Inc. Singapore.
Strauss, J. Frost, R. & Stone, M. (2008), E-Marketing, NJ, USA, Prentice Hall.
Tiessen, J.H., Wright, R.W. and Turner, I. (2011), A Model of E-Commerce Use by
Internationalizing SMEs‟, Journal of International Management

58
Turban, T., Tan, M., Buk, W.K. (1997-1998), "A contingency model of Internet adoption
in Singapore", International Journal of Electronic Commerce, Vol. 2 No.2, pp.95-
118.
Vinayak, R. (2001). Strategic marketing of pharmaceutical products manufactured in
Kenya. Unpublished MBA report, Nairobi.

59
APPENDICES
APPENDIX I: QUESTIONNAIRE
Section A: General information
1. Kindly indicate your Gender
Male [ ] Female [ ]
2. What is your Age Category?
Below 18 [ ] 18-25 [ ] 26-35 [ ] 36-45 [ ] 46-55 [ ]
55 and above [ ]
3. What Educational background do you have?
Primary school [ ] Secondary School [ ] Diploma []
Bachelor Degree [ ] Master Degree [ ] PH.D [ ]
4. For how long have you served in the current station?
0-5 years [ ]
6-10 years [ ]
Above 10 years [ ]

60
Section B: E-Marketing strategies
5. Does your organization offer e-product?
Yes [ ] No [ ]
If yes, how satisfactory is the product to consumers?
Excellent [ ] Fair [ ]
Good [ ] Poor [ ]
Average [ ]
If no, is there a reason why the organization doesn‟t?
………………………………………………………………………………………
….
6. What is the strategy adopted by your organization in designing e-product?
………………………………………………………………………………………
………………………………………………………………………………………
……
7. To what extent does e-product influence profitability of your
organization?
Very low extent [ ] Great extent [ ]
Low extent [ ] Very great extent [ ]
Moderate extent [ ]

61
8. Does your organization state the price of the products when practicing e-
marketing?
Yes [ ] No [ ]
If yes, is there increase in profitability since launching of online price tag?
Yes [ ] No [ ]
If no, is there a reason why the organization doesn‟t?
………………………………………………………………………………………
….
9. Does your organization conduct research to set a fair price to consumers
before placing it on-line?
Yes [ ] No [ ]
10. To what extent does e- pricing increases sales volume?
Very low extent [ ] Great extent [ ]
Low extent [ ] Very great extent [ ]
Moderate extent [ ]
11. To what extent does timely delivery of the products to customers increase
customer loyalty?
Very low extent [ ] Great extent [ ]
Low extent [ ] Very great extent [ ]

62
Moderate extent [ ]
12. To what extent does e-promotion influence profitability of your
organization?
Very low extent [ ] Great extent [ ]
Low extent [ ] Very great extent [ ]
Moderate extent [ ]
13. Does adoption of E-marketing ease service delivery and operating
systems within your organization?
Yes [ ] No [ ]
14. To what extent does e-processing influence the firm‟s performance
Very low extent [ ] Great extent [ ]
Low extent [ ] Very great extent [ ]
Moderate extent [ ]
Does your firm consider customer satisfaction with on-line service delivery?
Yes [ ] No [ ]
If no, is there a reason why the organization doesn‟t?
………………………………………………………………………………………..
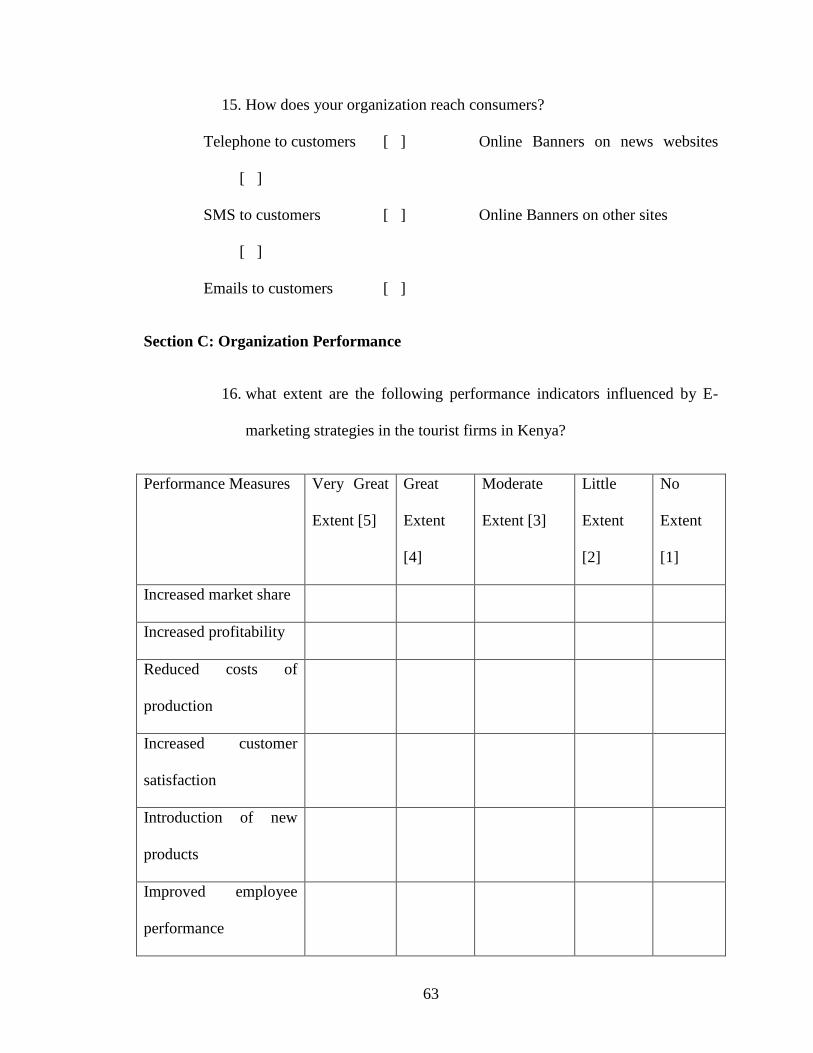
63
15. How does your organization reach consumers?
Telephone to customers [ ] Online Banners on news websites
[ ]
SMS to customers [ ] Online Banners on other sites
[ ]
Emails to customers [ ]
Section C: Organization Performance
16. what extent are the following performance indicators influenced by E-
marketing strategies in the tourist firms in Kenya?
Performance Measures Very Great
Extent [5]
Great
Extent
[4]
Moderate
Extent [3]
Little
Extent
[2]
No
Extent
[1]
Increased market share
Increased profitability
Reduced costs of
production
Increased customer
satisfaction
Introduction of new
products
Improved employee
performance

64
Expansion into new
markets
ICT integration in
customer service
delivery
Increased return on
investments
Increased Job
Satisfaction
APPENDIX II: LIST OF TOUR OPERATORS IN NAIROBI
1. Abercrombie & Kent
2. Africa Expeditions Ltd
3. African Eco-Safaris
4. African Horizons Travel & Safaris Ltd
5. African Quest Safaris Ltd
6. African Servalcat Safaris & Tours
7. Allamanda Safaris
8. Amazing Tours & Travel Ltd
9. Animal World Safaris Ltd
10. Apollo Tours & Travel Ltd
11. Archers Tours & Travel Ltd
12. Asili Adventure Safaris

65
13. Balloon Safaris Ltd
14. Basecamp Travel Ltd
15. Bellafric Expeditions Ltd.
16. Big Five Tours & Safaris Ltd
17. Boma Travel Services Ltd
18. Buena Vista Tours & Safaris
19. Bunson Travel Services Ltd
20. Bush & Beyond Ltd
21. Bushtroop Tours & Safaris
22. Call of Africa Ltd Safaris
23. Charleston Travel Ltd
24. Cheetah Tours Ltd
25. Cheli & Peacock Ltd
26. Chronicle Tours &
27. Coast Adventure Safaris
28. Concorde Car Hire & Safaris Ltd
29. Cotts Travel & Tours Ltd
30. Dallago Tours & Safaris
31. Destination (K) Ltd 45
32. Destination Connect Co. Ltd
33. Discover Kenya Safaris Ltd
34. Dotcom Safaris
35. Dream Kenya Safaris

66
36. East Africa Safari Ventures Ltd
37. East African Wildlife Safaris
38. Eastern and Southern Safaris
39. Eco Adventures Limited
40. El Molo Tours & Travel
41. Elite Travel Services Ltd
42. Elsa Ltd (Elsamere Conservation & Field Study Centre
43. Exclusive African Treasures
44. Expedition Africa Safaris
45. Exotic Golf Safaris Ltd
46. Eyes on Africa Adventure Safaris Ltd
47. Finch Travels Ltd
48. First Choice Tours & Travel Ltd
49. Flight & Safaris International Ltd
50. Game Viewers Adventures Limited
51. Gametrackers (K) Ltd
52. Gamewatchers Safaris Ltd
53. Go Africa Safaris and Travel
54. Helinas Safaris Ltd
55. HTT Holidays & Incentives Ltd
56. Ibis Tours and Travel Ltd
57. Impact Adventure Travel
58. Incentive Travel Ltd

67
59. Jade Sea Journeys Ltd
60. Jambo Travel House Limited
61. Jungle Beach Safaris Ltd
62. Kairi Tours & Safaris
63. Kenia Tours & Safaris
64. Kentan Safaris Ltd.
65. Ketty Tours Travel & Safaris Ltd
66. Kisima Tours & Safaris
67. Kobo Safaris Ltd
68. Leading Expeditions Safaris
69. Let's Go Travel
70. Liberty Africa Safaris
71. Maniago Safaris Ltd
72. Marble Travel
73. Masimba Hills Safaris
74. Menengai Holidays Ltd
75. Moige Tours & Travels
76. Muthaiga Travel Ltd
77. Naked Wilderness Africa
78. Napenda Africa Safaris
79. Nature Expeditions Africa
80. Ontdek Kenya Ltd
81. Ostrich Holidays Adventures

68
82. Out of Africa Collection Ltd
83. Pacific Blue Travel and Tours Ltd
84. PAWS Africa Safaris Ltd
85. Phoenix Safaris (K) Ltd
86. Pinnacle (K) Travel & Safaris Ltd
87. Private Safaris (EA) Ltd
88. Ramogi Tours & Travel Ltd
89. Raydoll Tours & Travel
90. Rhino Safaris Ltd
91. Safari Trails Limited
92. Safaris In Style
93. Scenic Treasures Ltd
94. Shades of Africa Tours & Safaris
95. Silverbird Adventure Tours & Travel
96. Somak Travel Ltd
97. Southern Cross Safaris Limited
98. Southern Sky Safaris
99. Speedbird Travel & Safaris
100. Suntrek Tours & Travel Ltd
101. Tekko Tours & Travel
102. Tour Africa Safaris
103. Trails of Africa Tours & Safaris
104. Travel 'n Style

69
105. Travel Connections Ltd
106. Tripple Tours & Travel Ltd
107. Twiga Car Hire & Tours Ltd
108. Uniglobe Northline Travel Ltd
109. Venture Africa Safaris & Travel
110. Vintage Africa Ltd
111. Wildlife Sun Safaris
112. Wild Trek Safaris Ltd
113. Woni Safaris Ltd
114. Xcellent Wildlife Paradise - Holidays and Safaris
115. Zaruma Safaris Ltd
116. Zoar Tours and Safaris